conceptual framework for the development of long-term
TRANSCRIPT

Long-term Coastal Ecosystem Monitoring Program atCape Cod National Seashore
Conceptual Framework for the
Development of Long-term
Monitoring Protocols at
Cape Cod National Seashore
USGS Patuxent Wildlife Research CenterCooperative National Park Studies Unit
University of Rhode IslandNarragansett, RI 02882

Conceptual Framework for the Development ofLong-term Monitoring Protocols at Cape Cod
National Seashore
CHARLES T. ROMANUSGS Patuxent Wildlife Research Center
Cooperative Park Studies UnitUniversity of Rhode Island
Narragansett, RI 02882401-874-6886
NELS E. BARRETTGraduate School of Oceanography
University of Rhode Islandc/o Cape Cod National Seashore
99 Marconi Site Rd.Wellfleet, MA 02667
508-487-3262, ext. [email protected]
April 1999

Cape Cod Monitoring Program page ii

Cape Cod Monitoring Program page iii
SUMMARY
Cape Cod National Seashore serves as the National Park Service prototype monitoring park forthe Atlantic and Gulf Coast biogeographic region. The USGS-Biological Resources Division, incooperation with the National Park Service, is charged with designing and testing monitoringprotocols for implementation at Cape Cod National Seashore. It is expected that many of theprotocols will have direct application at other Seashore parks within the biogeographic region.
This document presents a conceptual framework for the development of monitoring protocols forthe Long-term Coastal Ecosystem Monitoring Program at Cape Cod National Seashore. TheProgram is ecosystem-based and issue-oriented. The ecosystem perspective recognizes theenvironmental processes and human activities that operate at various temporal and spatial scales.The issues-oriented emphasis acknowledges natural and human-induced threats to ecosystemsand responses to those threats.
For each major Seashore ecosystem type (Estuaries and Salt Marshes; BarrierIslands/Spits/Dunes; Ponds and Freshwater Wetlands; Coastal Uplands), conceptual models weredeveloped to explain complex relationships among Agents of Change (natural processes orhuman activities), Stresses (problems emerging from or related to the agents of change), andEcosystem Responses (detectable changes in structure, function or process). For each ecosystemthe models, presented as matrix tables, demonstrate that natural processes or human activitiescan be the source of stresses that result in ecosystem changes, some of which may be considereddeleterious. Selection of the specific agents of change, stresses and ecosystem responses to beincluded in the monitoring program was based on a review of the conceptual models and ondiscussions from technical workshops.
Part One of this report presents a conceptual framework as an objective basis for selectingmonitoring components of the Long-term Coastal Ecosystem Monitoring Program. Part Twoprovides summaries of the monitoring protocols that are being developed, including: a statementof the problem, a series of monitoring questions, the general monitoring approach, and astatement of management applications.

Cape Cod Monitoring Program page iv

Cape Cod Monitoring Program page v
TABLE OF CONTENTS
SUMMARY .................................................................................................................................. iiiLIST OF FIGURES AND TABLES .......................................................................................... viACKNOWLEDGEMENTS ....................................................................................................vii
INTRODUCTION ........................................................................................................................ 1
PART ONEOVERALL GOAL AND APPROACH OF THE PROGRAM ................................................ 2
Detecting and Understanding Change ................................................................................ 2Ecosystem-based and Issue-oriented Monitoring .............................................................. 3Monitoring Program Limitations ....................................................................................... 3
THE CONCEPTUAL FRAMEWORK FOR DEVELOPING PROTOCOLS ...................... 4The Design Matrix as a Working Model ............................................................................ 4Models as Tools for Selection of Monitoring Components ............................................. 14Selecting Components to Monitor ... ................................................................................ 15
INTEGRATING PROTOCOL DEVELOPMENT AND PROGRAMIMPLEMENTATION .......................................................................................................... 20
LITERATURE CITED .............................................................................................................. 22
PART TWOSUMMARIES OF MONITORING PROTOCOLS ............................................................... 25
ESTUARIES AND SALT MARSHESEstuarine Nutrient Enrichment ......................................................................................... 26Estuarine Nekton ... ........................................................................................................... 29Waterbirds ........................................................................................................................ 31Sediment and Benthic Fauna Contaminants ..................................................................... 33
BARRIER ISLANDS, SPITS, AND DUNESShoreline Change ............................................................................................................. 35
PONDS AND FRESHWATER WETLANDSWater Quality and Limnological Monitoring .................................................................. 37Surface Water Levels and Stream Baseflow .................................................................... 39Freshwater Fish ................................................................................................................. 40Aquatic Invertebrates ........................................................................................................ 43Amphibians ...................................................................................................................... 45
COASTAL UPLANDSLandbirds .......................................................................................................................... 47White-tailed Deer ............................................................................................................. 49Red Foxes and Coyotes .................................................................................................... 51
PARKWIDE/MULTIPLE ECOSYSTEMSMeteorology and Atmospheric Wet Deposition .............................................................. 53Vegetation ........................................................................................................................ 55Groundwater Hydrology and Quality ............................................................................... 57
Cape Cod Monitoring Program page vi
LIST OF FIGURES AND TABLES
FIGURES1. Conceptual flow model for estuaries and salt marshes ........................................................... 132. Interactions among individual monitoring protocols ............................................................. 193. Relationships between protocol development and program implementation ......................... 21
TABLES1. Agents-of-change ...................................................................................................................... 62. Stresses and relevancy to Park management issues ................................................................. 73. Ecosystem responses ................................................................................................................ 84a. Design matrix for estuaries and salt marshes ........................................................................... 94b. Design matrix for barrier islands, spits and dunes ................................................................. 104c. Design matrix for ponds and freshwater wetlands ................................................................. 114d. Design matrix for coastal uplands .......................................................................................... 125. Technical workshops, date convened or proposed, attendees or invitees .............................. 166. Protocols of the monitoring program ..................................................................................... 17

Cape Cod Monitoring Program page vii
ACKNOWLEDGEMENTS
Thanks are extended to the Superintendent of Cape Cod National Seashore and the Seashorenatural resource management staff for their complete involvement during the preparation of thisreport. Robert Cook, Charles Farris, Krista Lee, John Portnoy, and Mike Reynolds all reviewedthis report and participated in technical workshops that provided a foundation for many of theideas presented herein. Special acknowledgement goes to Alan Bennett, the Seashore Inventoryand Monitoring Coordinator, for sharing his insights regarding the development of acomprehensive long-term monitoring program. Thanks also go to the many scientists andenvironmental professionals for their participation in our technical workshops; Laurel Bennett(NPS), P.A. Buckley (USGS), Thomas Cambareri (Cape Cod Commission), Elizabeth Colburn(Mass. Audubon), Courtney Conway (Syracuse), Sam Droege (USGS), Michael Erwin (USGS),Howard Ginsberg (USGS), Evan Gwilliam (URI), Eleanor Kinney (URI), Dennis Leblanc(USGS), Larry Martin (NPS), Scott Melvin (MA DEP), Barbara Nowicki (URI), AllanO'Connell (USGS), William Patterson (UMass), Kenneth Rahn (URI), Gerry Sheehan (MADEP), Robert Sobzack (Cape Cod Commission), H. Brian Underwood (USGS), Alan Vanarsdale(US EPA), Cathy Weathers (Inst. for Ecosystem Studies), Peter Weiskel (USGS). Finally, weacknowledge the external peer reviews provided by Dr. Robert Zampella (NJ PinelandsCommission) and an anonymous reviewer.
Preparation of this report was supported by the USGS-Biological Resources Division, withspecial thanks to Dr. Norita Chaney (USGS, Reston).

Cape Cod Monitoring Program page viii

Cape Cod Monitoring Program page 1
INTRODUCTION
The National Park Service (NPS) has selected Cape Cod National Seashore as a prototypemonitoring park for the Atlantic and Gulf Coast biogeographic region. Coastal ecosystems areinherently dynamic. Placed in a geophysical setting shaped by the land and the sea, Cape CodNational Seashore, like other coastal ecosystems, is a highly variable environment subject todiverse natural processes. Also, like other NPS units, Fish and Wildlife refuges, andfederal/state/local/private natural areas within the coastal zone, Cape Cod is experiencing intensepressure from increased urbanization and recreation. About one-half of the total population ofthe contiguous United States resides in the coastal zone. The coastal zone is an area representingonly 11% of the nation's entire land area, and projected to increase another 15% by the year 2010(Culliton et al. 1990). With over 5 million visitors annually, coupled with neighboringdevelopment activities, the natural resources of Cape Cod National Seashore are continuallythreatened. In addition, Cape Cod ecosystems have experienced over three centuries ofintervention by an industrially-equipped human society. Human activities dramatically alter thequality or integrity of coastal ecosystems, and perhaps, the resilience of ecosystems tocatastrophic events (e.g., hurricanes, oil spill) and chronic events (e.g., nutrient inputs, sea levelrise) (Holling 1973, Denslow 1985).
These circumstances provide a compelling justification for establishing a long-term monitoringprogram at Cape Cod National Seashore and other park units within the coastal zone. A long-term monitoring program is proposed which is based on our best understanding of processes andcomponent interactions governing the coastal ecosystem, and focused on addressingmanagement issues that confront coastal parks. An ecosystem-based, issues-oriented, long-termmonitoring program is proposed to detect ecosystem changes, to examine contributing factorsand consequences of ecosystem changes, and to inform park management of the salient issuesthat such ecosystem changes represent. Monitoring is a fundamental tool for park units that havemoved beyond passive protection and are engaged in adaptive natural resource management(Christensen et al. 1996, Holling 1978, Lancia et al. 1996). Ultimately, monitoring provides ascientific basis for management decisions leading to effective protection and restoration ofcoastal ecosystems.
The USGS-Biological Resources Division (USGS-BRD), in collaboration with the National ParkService, is responsible for the design and testing of monitoring protocols that will constitute theLong-term Coastal Ecosystem Monitoring Program (LTEM) at Cape Cod National Seashore.The National Park Service will implement the program, with technical assistance provided by theUSGS-BRD and others, including universities, government agencies, and conservation-orientedorganizations.
Part One of this document is intended to accomplish the following;• Briefly define the overall goal and approach of the Long-term Coastal EcosystemMonitoring Program, and• Present a conceptual framework that serves as an objective basis for selecting protocolsand protocol attributes to be developed.
Part Two extends the conceptual framework to include

Cape Cod Monitoring Program page 2
• Summaries of monitoring protocols that are currently proposed for the program.
As the monitoring program develops and the need to develop addition protocols occurs, sectionsof this document will be updated.
PART ONE
OVERALL GOAL, APPROACH, AND LIMITATIONS OF THEMONITORING PROGRAM
DETECTING, PREDICTING, AND UNDERSTANDING CHANGE
The overall goal of the Long-term Coastal Ecosystem Monitoring Program (LTEM) at Cape CodNational Seashore is:
• to detect changes in particular attributes of the coastal ecosystem and determine if thosechanges are within the bounds of natural or historic variability;
• to predict how those changes relate to natural processes and human-influences; and,• to understand how such changes, ultimately, affect the condition of the coastal
ecosystem.
It is important to the note that the term change is applied broadly to express trends (valuedifferences) in several measures including: the rates of change (e.g., annual, decadal, or centurialtime scales), the extent of change (e.g., site-specific versus regional/global spatial scales), andthe intensity of change (e.g., magnitude of the effect).
Generally, the aim of the LTEM program at Cape Cod National Seashore is: (1) to validatemodel assumptions and predictions that explain how (and why) changes occur; (2) to forecastpotentially adverse changes that provide "early warning" capabilities; (3) to inform whether andwhen management intervention is necessary; and (4) to evaluate the effectiveness ofmanagement, i.e., how well an ecosystem is being sustained in accordance with currentmanagement practices and regulatory compliance (National Research Council 1990, Spellerberg1991).
Most importantly, the information generated from the monitoring program is intended to assistthe park manager in clarifying and addressing issues as part of the decision-making process. Dothe observed changes represent current problems or forecast emerging problems that mightadversely affect the ecological integrity of the coastal ecosystem? Do the problems requireimmediate action? Can the problems be remedied by management actions? Understanding thedynamic nature of coastal ecosystems and the consequences of human activity is essential formanagement decision-making aimed to maintain, enhance, or restore the ecological integrity ofthe coastal ecosystem and to avoid, minimize, or mitigate ecological threats to the coastalecosystem.

Cape Cod Monitoring Program page 3
ECOSYSTEM-BASED AND ISSUE-ORIENTED MONITORING
The approach of the LTEM Program at Cape Cod National Seashore is an ecosystem-basedapproach to monitoring coupled with an issues-oriented emphasis. The ecosystem conceptrecognizes that inevitable changes to the ecosystem result from interactions between biota andthe environment operating at many different spatial and temporal scales (Holling 1992, Woodleyet al. 1993). Although no one scale is appropriate for monitoring all ecosystem processes orcomponents, characteristic spatial and temporal scales commonly form natural, ecologicalhierarchies (Urban et al. 1987, King 1993) governed or constrained by the physical dimensionsof the landscape (Rowe 1988). While these natural subdivisions are primarily derived fromlandscape criteria and other environmental dissimilarities (Avers et al.1994, Rowe and Shead1981), they constitute an ecological setting or context that governs human land use practices andother activities (McDonnell and Pickett 1993). As such, the ecosystem-based approach usesnatural, hierarchical dimensions of the coastal landscape as a suitable template for monitoringchanges in ecological phenomena associated with both natural and human causes. Cape CodNational Seashore constitutes a landscape mosaic represented by several distinctivegeomorphologic types: estuaries/salt marshes, ponds/freshwater wetlands, barrierislands/spits/dunes, and coastal uplands of predominantly heathlands and pine or oak forests.
The issues orientation focuses on the relevance of the monitoring results to meet the goals ofmanagement directed at sustaining the quality or the integrity of the coastal ecosystem andeliminating threats from natural or human causes. Problems are anticipated when particularmeasures of change exceed acceptable bounds that are often defined by historic or natural limitsor standards set by policy guidelines. The role of monitoring is crucial in detecting meaningfullevels of change from which critical threshold values or policy standards are determined.
The emphasis on issues explores our knowledge of cause-and-effect relations by incorporatingtwo complementary strategies, threat-specific monitoring and effects-oriented monitoring. Apresupposition of causality usually supports threat-specific monitoring. Whereas for effects-based monitoring, the focus is on tracking trends that are indicative of ecosystem integrity, suchas acceptable values of biological diversity or primary productivity. The issue-orientedemphasis combines both threat-specific and effects-oriented monitoring in order to achieve asufficient level of predictability to better guide management action. As stated at a nationalworkshop entitled, "Ecological Resource Monitoring: Change and Trend Detection", sponsoredjointly by the Ecological Society of America, the American Statistical Association and the USEnvironmental Protection Agency, simultaneous monitoring of trends in both ecosystem effectsand ecosystem stresses can improve the interpretation of monitoring results (Dixon et al. 1997,Olsen et al. 1997).
MONITORING PROGRAM LIMITATIONS
Limitations of monitoring exist because of the inherent complexity of coastal ecosystems.Insufficient scientific information and challenges in distinguishing natural variability from therange of human impacts make it difficult to clarify monitoring issues and develop specificmonitoring objectives. Further limitations of monitoring exist because institutional resources
Cape Cod Monitoring Program page 4
devoted to monitoring practices are often constrained by time, finances, and personnel. TheLTEM Program simply cannot address all resource management interests. Rather, the intent ofthe Program is to monitor a select set of ecosystem processes and components that reflect thestatus of the coastal ecosystem and are relevant to management issues. This information willcollectively provide a foundation for building a more flexible monitoring program. Asmonitoring proceeds, as data sets are interpreted, as our understanding of ecological processes isenhanced, and as trends are detected, future issues will emerge. Adjustments can be made to theProgram to address changing needs. For example, objectives specific to monitoring protocolsmay need refinement, and the frequency or intensity of monitoring may require modification.Furthermore, as the monitoring program develops, additional management strategies may bewarranted. Occasionally, some management decisions, often those with narrowly-definedobjectives, will require specific information that may necessitate the initiation of researchprojects with funding independent of the monitoring program. However, it is expected thatinformation gathered from the monitoring program will be interpreted in conjunction with resultsfrom the independent studies in order to develop appropriate management scenarios for theparticular issues.
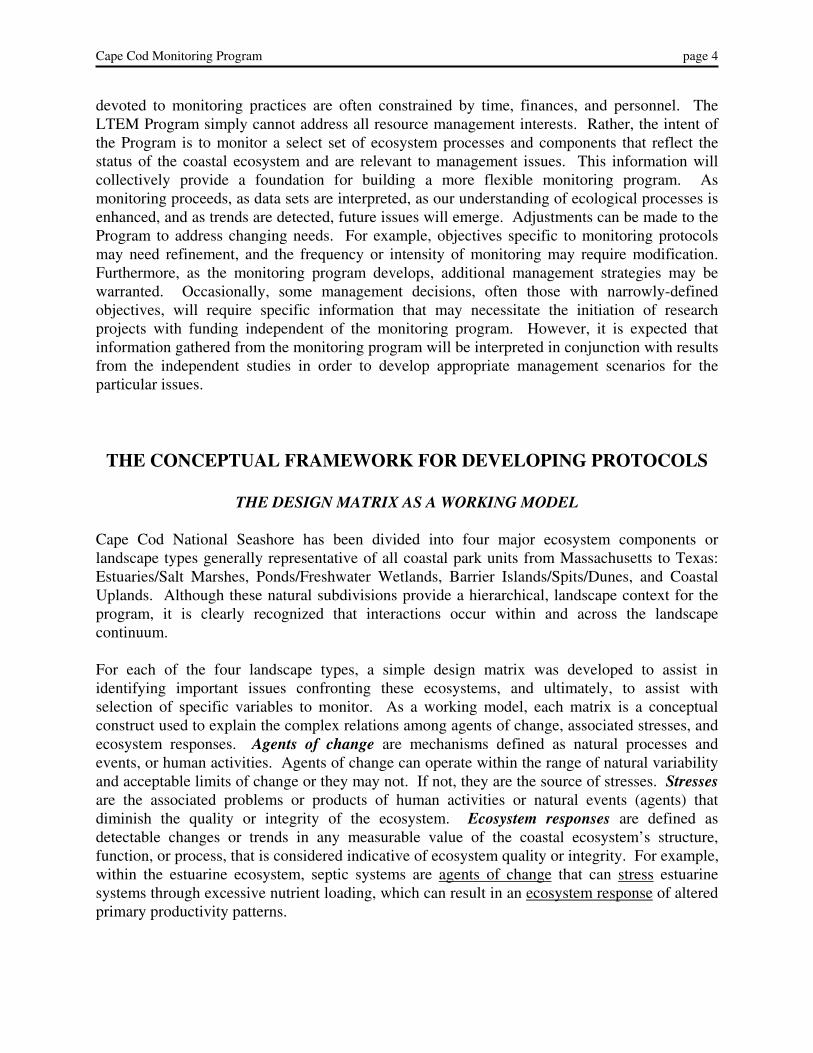
THE CONCEPTUAL FRAMEWORK FOR DEVELOPING PROTOCOLS
THE DESIGN MATRIX AS A WORKING MODEL
Cape Cod National Seashore has been divided into four major ecosystem components orlandscape types generally representative of all coastal park units from Massachusetts to Texas:Estuaries/Salt Marshes, Ponds/Freshwater Wetlands, Barrier Islands/Spits/Dunes, and CoastalUplands. Although these natural subdivisions provide a hierarchical, landscape context for theprogram, it is clearly recognized that interactions occur within and across the landscapecontinuum.
For each of the four landscape types, a simple design matrix was developed to assist inidentifying important issues confronting these ecosystems, and ultimately, to assist withselection of specific variables to monitor. As a working model, each matrix is a conceptualconstruct used to explain the complex relations among agents of change, associated stresses, andecosystem responses. Agents of change are mechanisms defined as natural processes andevents, or human activities. Agents of change can operate within the range of natural variabilityand acceptable limits of change or they may not. If not, they are the source of stresses. Stressesare the associated problems or products of human activities or natural events (agents) thatdiminish the quality or integrity of the ecosystem. Ecosystem responses are defined asdetectable changes or trends in any measurable value of the coastal ecosystem’s structure,function, or process, that is considered indicative of ecosystem quality or integrity. For example,within the estuarine ecosystem, septic systems are agents of change that can stress estuarinesystems through excessive nutrient loading, which can result in an ecosystem response of alteredprimary productivity patterns.

Cape Cod Monitoring Program page 5
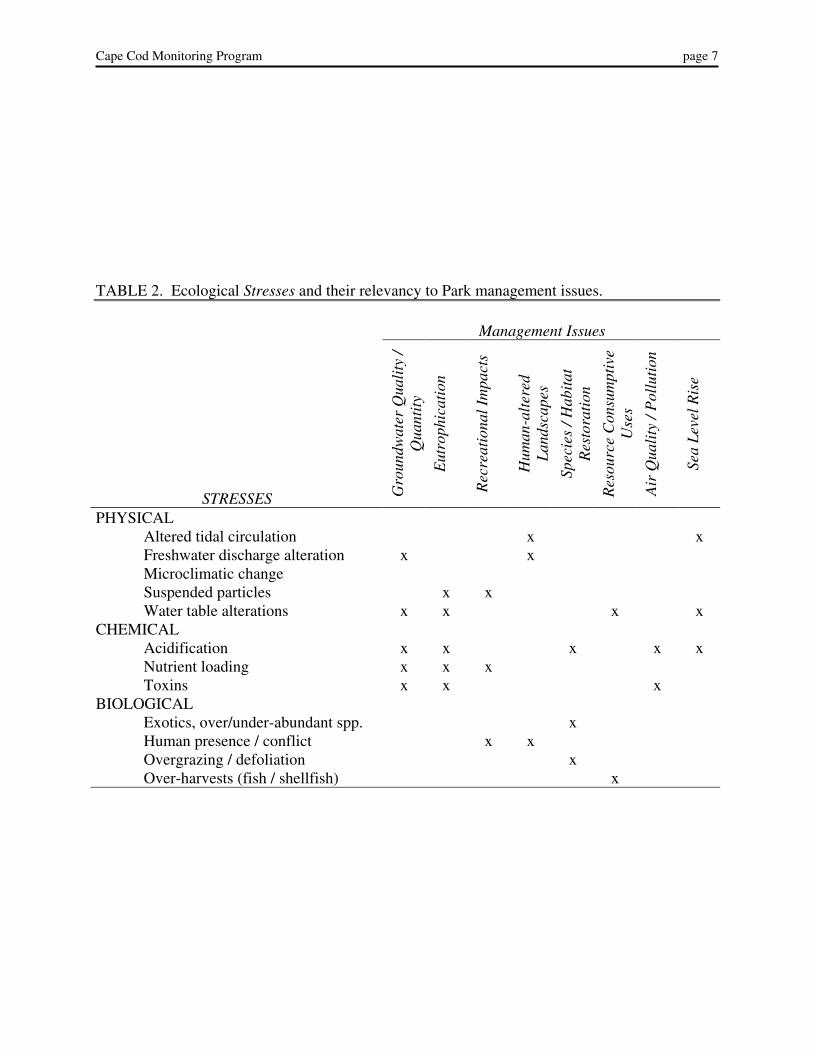
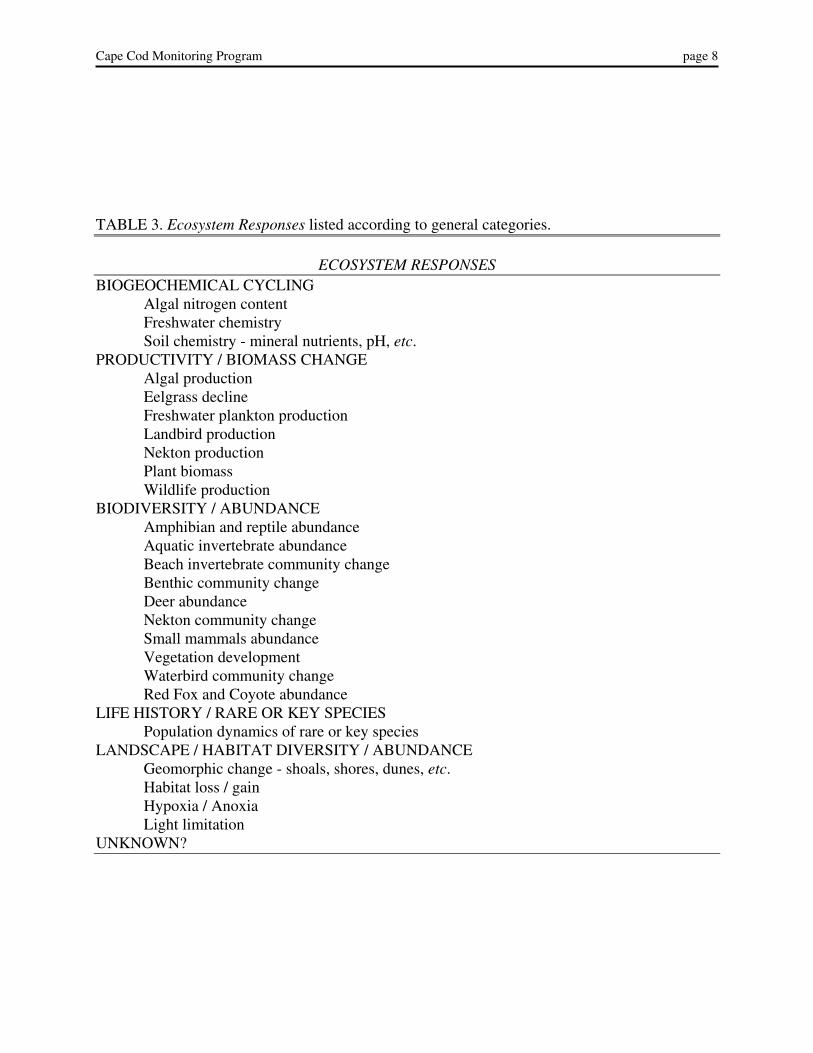
To derive a preliminary list of agents of change appropriate to the coastal ecosystem, broadcategories were considered: Land Use, Natural Disturbances including Physical and BioticForces, Pollution, Recreational Use, Resource Extraction and Exploitation, and Unknown Agentsof Change (Table 1). How each agent might contribute to a problem was considered and a list ofpotential stresses was compiled (Table 2). To account for relevance to management concerns,each stress was matched to general management issues identified in the Cape Cod NationalSeashore natural resources management plan (National Park Service 1992). These managementissues include: impacts of adjacent development on groundwater quality and quantity,accelerated rates of freshwater and coastal marine eutrophication, impacts of recreation onnatural resources, effects of landscape changes since European settlement, protection andrestoration of Federal and/or State-listed rare species and communities, consumptive uses ofresources, air pollution, and sea level rise. Note that any one issue may be attributed to severalstresses and that any single stress may relate to several issues. To derive a preliminary list ofecosystem responses, several broad categories of ecological phenomena were considered,Biogeochemical Cycling, Productivity and Biomass, Biological Diversity/Abundance, LifeHistory of Rare or Key Species, Landscape & Habitat Diversity, and Unknown responses (Table3).
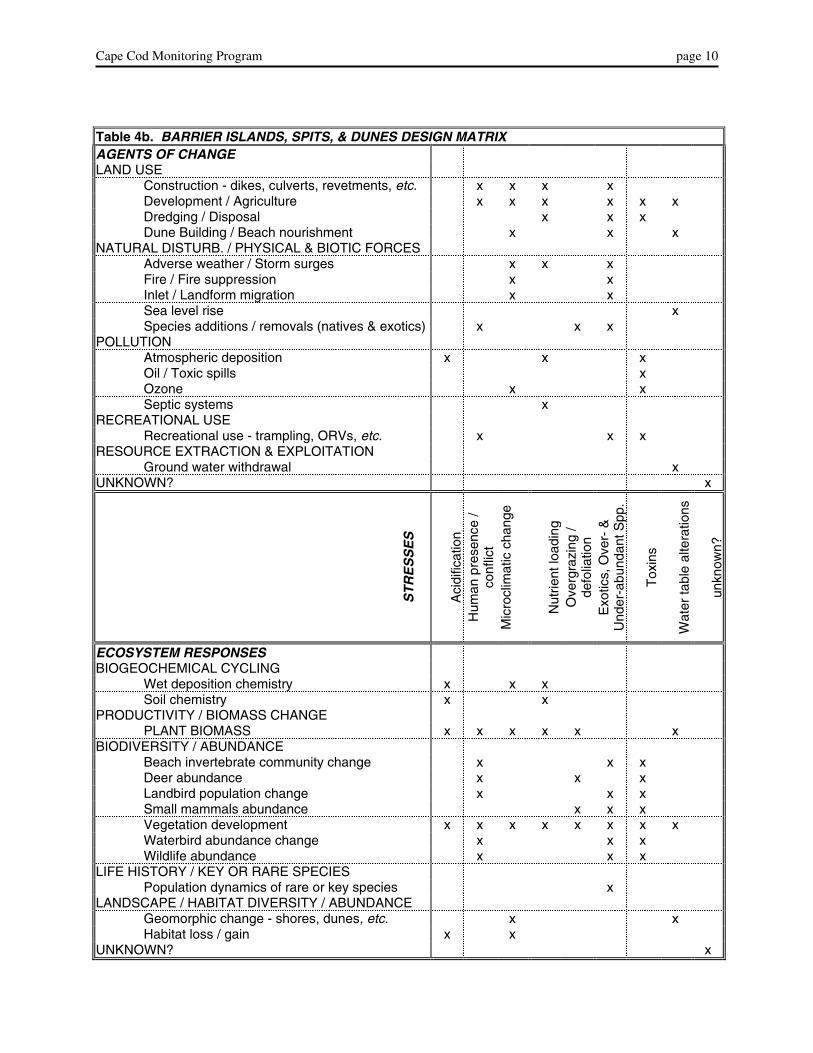
The final step in the development of the design matrix involved coupling the agents of change,stresses, and ecosystem responses for each of the four ecosystem types. Matrix tables arepresented separately for each individual ecosystem type as synoptic representations ofinteractions to consider for monitoring (Tables 4a-d). These are working models that highlightwhich particular issues are relevant to which coastal landscape type and how agents of change,stresses, and ecosystem responses relate. The design matrices are not intended to represent acomprehensive account of the entire coastal ecosystem, nor merely a list of mechanisms andoutcomes as features of ecosystem change. Instead, they present a conceptual framework to helpselect and develop monitoring protocols. Components of the monitoring program are organizedaccording to an ecosystem basis that emphasizes the relationships among various agents ofchange, associated stresses, and ecosystem responses that define salient issues. While thesesimplified, conceptual models may understate the comprehensive nature of the coastalecosystem; they serve to demonstrate the complexity of coastal ecosystem relations, many ofwhich are unknown. However, it is clearly illustrated that multiple agents of change can lead tomultiple stresses, resulting in multiple ecosystem responses.
As working models, the matrix tables clearly demonstrate the relational scheme of naturalprocesses or human activities being the source of stresses that result in detectable changes to theecosystem, some of which may be considered deleterious. For example, by followingintersections in Table 4a, the Estuarine and Salt Marsh design matrix shows that leachate fromseptic systems may contribute to the problems of nutrient loading which results in a variety ofecosystem responses, such as changes in porewater chemistry, algal production, eelgrass decline,etc. Relationships among agents of change, stresses and ecosystem responses can also bepresented graphically (Fig. 1). The relations as illustrated in the design matrix reveal whichagents of change are likely to be implicated in any particular problem and which ecologicalresponses are likely to ensue from such problems.

Cape Cod Monitoring Program page 6
TABLE 1. Agents of Change listed according to broad categories.
AGENTS OF CHANGELAND USE
Construction - dams, dikes, culverts, revetments, etc.Development / Agriculture / AquacultureDredging / DisposalDune building / Beach nourishmentMosquito control
NATURAL DISTURBANCES / PHYSICAL & BIOTIC FORCESAdverse weather / Storm surgesFire / Fire suppressionGrazing / BrowsingGround water influxInlet / Landform migrationSea level riseSpecies additions / Species removals (natives & exotics)UV-B (Solar radiation)
POLLUTIONAtmospheric depositionFertilizers / PesticidesOil / Toxic spillsOzoneSeptic systems
RECREATIONAL USERecreational use - boating, ORVs, trampling, biking, etc.
RESOURCE EXTRACTION & EXPLOITATIONGround water withdrawalFishing / Shellfishing
UNKNOWN?
Cape Cod Monitoring Program page 7
TABLE 2. Ecological Stresses and their relevancy to Park management issues.
Management Issues
STRESSES Gro
undw
ater
Qua
lity
/Q
uant
ity
Eut
roph
icat
ion
Rec
reat
iona
l Im
pact
s
Hum
an-a
lter
edL
ands
cape
s
Spec
ies
/ Hab
itat
Res
tora
tion
Res
ourc
e C
onsu
mpt
ive
Use
s
Air
Qua
lity
/ P
ollu
tion
Sea
Lev
el R
ise
PHYSICALAltered tidal circulation x xFreshwater discharge alteration x xMicroclimatic changeSuspended particles x xWater table alterations x x x x
CHEMICALAcidification x x x x xNutrient loading x x xToxins x x x
BIOLOGICALExotics, over/under-abundant spp. xHuman presence / conflict x xOvergrazing / defoliation xOver-harvests (fish / shellfish) x
Cape Cod Monitoring Program page 8
TABLE 3. Ecosystem Responses listed according to general categories.
ECOSYSTEM RESPONSESBIOGEOCHEMICAL CYCLING
Algal nitrogen contentFreshwater chemistrySoil chemistry - mineral nutrients, pH, etc.
PRODUCTIVITY / BIOMASS CHANGEAlgal productionEelgrass declineFreshwater plankton productionLandbird productionNekton productionPlant biomassWildlife production
BIODIVERSITY / ABUNDANCEAmphibian and reptile abundanceAquatic invertebrate abundanceBeach invertebrate community changeBenthic community changeDeer abundanceNekton community changeSmall mammals abundanceVegetation developmentWaterbird community changeRed Fox and Coyote abundance
LIFE HISTORY / RARE OR KEY SPECIESPopulation dynamics of rare or key species
LANDSCAPE / HABITAT DIVERSITY / ABUNDANCEGeomorphic change - shoals, shores, dunes, etc.Habitat loss / gainHypoxia / AnoxiaLight limitation
UNKNOWN?

Cape Cod Monitoring Program page 9
Table 4a. ESTUARIES & SALT MARSHES DESIGN MATRIXAGENTS OF CHANGELAND USE
Construction - dikes, culverts, revetments, etc. x x x x xDevelopment / Agriculture x x x x xDredging / Disposal x x x x xMosquito control x x x
NATURAL DISTURB. / PHYSICAL & BIOTIC FORCESAdverse weather / Storm surges x x xGround water influx xInlet / Landform migration xSea level rise xSpecies additions/removals (natives & exotics) x x
POLLUTIONAtmospheric deposition x xOil / Toxic spills xSeptic systems x
RECREATIONAL USERecreational use - boating, ORVs, etc. x x x x x
RESOURCE EXTRACTION & EXPLOITATIONFishing / (Shellfishing) x x xGround water withdrawal
UNKNOWN? x
ST
RE
SS
ES
Alte
red
tidal
circ
ulat
ion
Hum
an p
rese
nce
/co
nflic
t
Exo
tics,
Ove
r- &
Und
er-a
bund
ant S
pp.
Nut
rient
load
ing
Ove
r-ha
rves
ts(f
ish/
shel
lfish
)
Sus
pend
ed p
artic
les
Tox
ins
Unk
now
n?
ECOSYSTEM RESPONSESBIOGEOCHEMICAL CYCLING
Porewater chemistry x x xWet deposition chemistry x
PRODUCTIVITY / BIOMASS CHANGEAlgae production x xEelgrass decline x x x xNekton production x
BIODIVERITY / COMMUNITY COMPOSITIONBenthic community change x x x x xNekton community change x x x x x x xVegetation development x x x xWaterbird community change x x x x
LIFE HISTORY / KEY OR RARE SPECIESPopulation dynamics of rare or key spp. x
LANDSCAPE / HABITAT DIVERSITY / ABUNDANCEGeomorphic change - shoals, shores, etc. xHabitat loss / gain xHypoxia / Anoxia x xLight limitation x
UNKNOWN? x
Cape Cod Monitoring Program page 10
Table 4b. BARRIER ISLANDS, SPITS, & DUNES DESIGN MATRIXAGENTS OF CHANGELAND USE
Construction - dikes, culverts, revetments, etc. x x x xDevelopment / Agriculture x x x x x xDredging / Disposal x x xDune Building / Beach nourishment x x x
NATURAL DISTURB. / PHYSICAL & BIOTIC FORCESAdverse weather / Storm surges x x xFire / Fire suppression x xInlet / Landform migration x xSea level rise xSpecies additions / removals (natives & exotics) x x x
POLLUTIONAtmospheric deposition x x xOil / Toxic spills xOzone x xSeptic systems x
RECREATIONAL USERecreational use - trampling, ORVs, etc. x x x
RESOURCE EXTRACTION & EXPLOITATIONGround water withdrawal x
UNKNOWN? x
ST
RE
SS
ES
Aci
dific
atio
nH
uman
pre
senc
e /
conf
lict
Mic
rocl
imat
ic c
hang
e
Nut
rient
load
ing
Ove
rgra
zing
/de
folia
tion
Exo
tics,
Ove
r- &
Und
er-a
bund
ant S
pp.
Tox
ins
Wat
er ta
ble
alte
ratio
ns
unkn
own?
ECOSYSTEM RESPONSESBIOGEOCHEMICAL CYCLING
Wet deposition chemistry x x xSoil chemistry x x
PRODUCTIVITY / BIOMASS CHANGEPLANT BIOMASS x x x x x x
BIODIVERSITY / ABUNDANCEBeach invertebrate community change x x xDeer abundance x x xLandbird population change x x xSmall mammals abundance x x xVegetation development x x x x x x x xWaterbird abundance change x x xWildlife abundance x x x
LIFE HISTORY / KEY OR RARE SPECIESPopulation dynamics of rare or key species x
LANDSCAPE / HABITAT DIVERSITY / ABUNDANCEGeomorphic change - shores, dunes, etc. x xHabitat loss / gain x x
UNKNOWN? x

Cape Cod Monitoring Program page 11
Table 4c. PONDS & FRESHWATER WETLANDS DESIGN MATRIXAGENTS OF CHANGELAND USE
Construction - dams, culverts, etc. x x x x x x xDevelopment / Agriculture x x x x x x x xDredging / Disposal x x x x xMosquito control x x x
NATURAL DISTURB. / PHYSICAL & BIOTIC FORCESAdverse weather / Storm surges x x x x x xGrazing / Browsing x xGround water influx x x xSpecies additions / removals (natives & exotics) x x xUV-B (Solar radiation) x x
POLLUTIONAtmospheric deposition x x xFertilizers / Pesticides x xOil / Toxic spills xSeptic systems x
RECREATIONAL USERecreational use - boating, ORVs, etc. x x x x
RESOURCE EXTRACTION & EXPLOITATIONFishing x x xGround water withdrawal
UNKNOWN? x
ST
RE
SS
ES
Aci
dific
atio
n
Hum
an p
rese
nce
/co
nflic
tM
icro
clim
atic
cha
nge
Nut
rient
load
ing
Ove
rgra
zing
Ove
r-ha
rves
ts(f
ish/
shel
lfish
)E
xotic
s, O
ver-
&U
nder
-abu
ndan
t Spp
.S
tage
/ di
scha
rge
alte
ratio
nS
uspe
nded
par
ticle
s
Tox
ins
Wat
er ta
ble
alte
ratio
ns
Unk
now
n?
ECOSYSTEM RESPONSESBIOGEOCHEMICAL CYCLING
Freshwater chemistry x x xPRODUCTIVITY / BIOMASS CHANGE
Macrophyte production x x x x x x xFreshwater plankton production x x x x x x x
BIODIVERSITY / ABUNDANCEAmphibian & reptile abundance x x x x x x xAquatic Invertebrate abundance x x x x x x xFish community change x x x x x x xVegetation development x x x x x x x x x
LIFE HISTORY / KEY OR RARE SPECIESPopulation dynamics of rare or key species x
LANDSCAPE / HABITAT DIVERSITY / ABUNDANCEGeomorphic change - shorelines, etc. x xHabitat loss / gain x x x xHypoxia / Anoxia x x x
UNKNOWN? x

Cape Cod Monitoring Program page 12
Table 4d. COASTAL UPLANDS DESIGN MATRIXAGENTS OF CHANGELAND USE
Construction - clearing, etc. x x x xDevelopment / Agriculture x x x x x xDredging / Disposal x x x
NATURAL DISTURB. / PHYSICAL & BIOTIC FORCESAdverse weather / Storm surges x x xFire / Fire suppression x x x xGrazing / Browsing x xSpecies additions/removals (natives & exotics) x x x
POLLUTIONAtmospheric deposition x xFertilizers / Pesticides x xOil / Toxic spills x xOzone x x x
RECREATIONAL USERecreational use - ORVs, trampling, etc. x x
RESOURCE EXTRACTION & EXPLOITATIONUNKNOWN? x
ST
RE
SS
ES
Aci
dific
atio
nH
uman
pre
senc
e /
conf
lict
Mic
rocl
imat
ic c
han g
e
Nut
rient
load
ing
Ove
rgra
zing
Exo
tics,
Ove
r- &
Und
er-a
bund
ant
Tox
ins
Wat
er ta
ble
Unk
now
n?
ECOSYSTEM RESPONSESBIOGEOCHEMICAL CYCLING
Soil chemistry - mineral nutrients, pH, etc. x x xPRODUCTIVITY/ BIOMASS CHANGE
Plant biomass x x x x x x xLandbird production x x x x
BIODIVERSITY / ABUNDANCEAmphibian & reptile abundance x x xDeer abundance x x xInvertebrate abundance x x x xRed Fox and Coyote abundance x xLandbird population change x x x xSmall mammals abundance x xVegetation development x x x x x x x xWildlife production x x
LIFE HISTORY / KEY OR RARE SPECIESPopulation dynamics of rare or key spp. x
LANDSCAPE / HABITAT DIVERSITY / ABUNDANCEGeomorphic change xLight variation xHabitat loss / gain x x
UNKNOWN? x

Cape Cod Monitoring Program page 13
AG
EN
TS
OF
C
HA
NG
E
ST
RE
SS
ES
E
CO
SY
ST
EM
RE
SP
ON
SE
S
Nutrient Loading
Light Limitiation
Atmospheric Deposition
Development & Fertilizer
Hypoxia / Anoxia
Septic Systems
Waterbird Change
Eelgrass Decline
Benthos Change
Algal Production
Nekton Change
ESTUARIES & SALT MARSHES
Figure 1. Conceptual model depicting the relations among agents of change, stresses, andecosystem responses.

Cape Cod Monitoring Program page 14
MODELS AS TOOLS FOR THE SELECTION OF MONITORING COMPONENTS
Selecting suites of agents, stresses or responses that could be developed into monitoringcomponents was achieved, in part, by utilizing Tables 4a-d as explanatory design matrices(Holling 1978, NRC 1990). By examining the various relational pathways connecting agents-to-stresses-to-responses, the general trends imply that issues are rarely simple, and instead arelikely to be quite complex. Some issues are inferred from stresses that originate from multipleagents of change or stresses that generate multiple ecosystem responses. Other issues involve asingle agent of change or a single ecosystem response that is associated with multiple stresses.
The analysis that follows is not intended to be the only process used to identify the specificagents of change, stresses or ecosystem responses that are included in the monitoring program.However, the design matrices do provide some objective guidance to the selection process. Thematrix analysis is useful at identifying suites of agents, stresses or responses that deserve carefulconsideration in the selection process. However, some issues may deserve priority considerationbecause of other factors (e.g., important regulatory issue, management need, previous experienceclearly demonstrates the importance of the issue, literature demonstrates strong cause and effectrelationships, etc.).
ESTUARIES AND SALT MARSHES (Table 4a)
Land use activities (e.g., dikes/culverts, revetments, development, dredging/disposal) andrecreational use (e.g., boating) are noted as agents of change that are the source of multiplestresses in estuarine and salt marsh environments. Numerous agents contribute to alter tidalcirculation, the stress of which can elicit numerous ecosystem responses. Stresses produced byexotics, over- or under-abundant spp., and nutrient loading also appear to be influenced by manydifferent agents. Stresses produced by altered tidal circulation and nutrient loading are alsoimplicated by multiple ecosystem responses. In terms of ecosystem responses, changes inbiodiversity (e.g., nekton, benthos, vegetation, and waterbirds) and changes in productivity (e.g.,eelgrass decline, and algal production) respond to multiple stresses.
BARRIER ISLANDS, SPITS, AND DUNES (Table 4b)
Once again, land use activities clearly represent the agents of change that lead to multiplestresses. Stresses derived from exotics, over- or under-abundant spp. are brought about bymultiple agents of change and contribute to numerous ecosystem responses. Other importantissues relate to toxins and direct human pressure or conflict that contribute to multiple ecosystemresponses. All of the ecosystem responses under the general category of biodiversity/abundance(e.g., beach invertebrate communities, deer, landbirds, vegetation, etc.) are impacted by multiplestresses. As an ecosystem response, geomorphic change, is strongly linked to a number ofphysical stresses.

Cape Cod Monitoring Program page 15
PONDS AND FRESHWATER WETLANDS (Table 4c)
Land use activities and adverse weather events are agents of change that cause a number ofstresses within the pond and freshwater wetland ecosystem. Exotics, over- or under-abundantspp., as well as nutrient loading are stresses that originate from several different agents ofchange. Acidification, nutrient loading, microclimate, exotics, over- or under-abundant spp.,surface water stage/discharge alteration, and toxins are all well documented stresses that lead tomultiple ecosystem responses. Numerous ecosystem changes that respond to multiple stressesinclude macrophyte and algal production, the biodiversity or abundance of aquatic organisms,and the development of the vegetation.
COASTAL UPLANDS (Table 4d)
Land use activities, adverse weather events, and fire/fire suppression are agents of change thatlead to multiple stresses. Stresses asociated with exotics, over- or under-abundant spp arebrought about by multiple agents of change and contribute to numerous ecosystem responses.Other issues relate to human presence/conflict, microclimate, and toxins as stresses that lead tomultiple ecosystem responses. Complex issues concern vegetation change and other ecosystemresponses related to changes in productivity and biomass as well as biodiversity and abundance.
SELECTING COMPONENTS TO MONITOR
Using a design matrix as a working model provides an objective framework to beginconstructing the LTEM at Cape Cod National Seashore. These conceptual models, coupled withtechnical workshops (Table 5), helped identify specific monitoring questions and helped selectwhich suites of specific agents-of-change, stresses, and ecosystem responses to include in a long-term monitoring program. Technical workshops were convened and attended by agency andacademic scientists and NPS natural resource management professionals.
Workshop discussions include: debating critical issues, defining the problem statement,identifying monitoring objectives, selecting quantifiable monitoring variables, setting or advisingcritical limits and thresholds, framing testable hypotheses and quantifiable trends, identifyingfield methods and experimental designs, and reporting procedures. While the use of a designmatrix provides some objective guidance on the range of choices to consider; the technicalworkshops provided details regarding which monitoring questions, variables, and methods topursue. The design matrix is an excellent foundation to help guide workshop discussions. Takenote that the matrix tables presented in Table 4 were completed as a result of the workshops.Presented at the workshop was a general form of the matrix coupled with a request to identifylikely agents-of-change, associated stresses, and ecosystem responses or indicators.
Table 6 lists the monitoring protocols that are presently operational and those that are underdevelopment or being developed by the USGS-BRD/NPS cooperative prototype program. Theprotocols are arranged separately according to ecosystem type or under a general park-

Cape Cod Monitoring Program page 16
Table 5. Technical workshops, date convened or proposed, attendees or invitees
Monitoring Workshop Topic Date Participants*Estuarine nutrient loading November 1997 URI, USGS-BRD, NPS-CACO,
Estuarine nekton November 1997 URI, USGS-BRD, NPS-CACO
Aquatic Invertebrates &Amphibians
November 1997and spring 1999
USGS-BRD, NPS-CACO, Mass. Audubon
Groundwater & Surface water December 1997 URI, USGS-BRD, NPS-CACO, NPS-WRD,USGS-WRD, CCC
Shorebirds, Waterbirds,Landbirds
December 1997and Jan 1999
URI, USGS-BRD, NPS-CACO, MA-DEP
Mammals December 1997 URI, USGS-BRD, NPS-CACO
Vegetation December 1997 URI, USGS-BRD, NPS-CACO, UMASS
Meteorology November 1998 URI, USGS-BRD, NPS-CACO, MA-DEP,MIT
Land use Spring 1999 URI, USGS-BRD, NPS-CACO, CCC
Visitor conflicts Spring 1999 URI, USGS-BRD, NPS-CACO, NPS-BOSO,CCC
Data management Spring 1999 URI, USGS-BRD, NPS-CACO
Modeling needs / applications Fall 1999 URI, USGS-BRD, NPS-CACO*key to participants:URI, University of Rhode Island; USGS-BRD, United States Geological Survey-BiologicalServices Division; USGS-WRD, USGS-Water Resources Division; NPS-CACO, National ParkService-Cape Cod National Seashore; NPS-BOSO, NPS-Boston Region; NPS-WRD, NPS-WaterResources Division; CCC, Cape Cod Commission; MA-DEP, Massachusetts Dept. ofEnvironmental Protection; MIT, Massachusetts Institute of Technology, UMASS, University ofMassachusetts.

Cape Cod Monitoring Program page 17
Table 6. Protocols of the Long-term Coastal Ecosystem Monitoring Program at Cape CodNational Seashore. Protocols are listed by ecosystem type and identified aspresently operational by the park, under development by the USGS-BRD or NPS(as of FY98), or planned for subsequent fiscal years by the USGS-BRD.
ECOSYSTEM TYPE SHORT TITLE
Estuaries and Salt MarshesUnder Development Nutrient EnrichmentUnder Development Nekton (Fishes and Decapod Crustaceans)Under Development WaterbirdsUnder Development Sediment & Benthic Fauna Contaminants Baseline
Barrier Islands/Spits/DunesUnder Development Geomorphic Shoreline ChangeUnder Development WaterbirdsUnder Development Sediment & Benthic Fauna Contaminants Baseline
Ponds and Freshwater WetlandsOperational1 Pond Water QualityUnder Development Pond and Wetland Surface Water LevelsUnder Development Stream Discharge GaugingPlanned Aquatic InvertebratesPlanned AmphibiansPlanned1 Freshwater Fish
Coastal UplandsPlanned White-tailed DeerPlanned1 Red Foxes and CoyotesUnder Development Landbirds
Parkwide/Multiple EcosystemsOperational1 Cover Type MappingOperational & Planned1 Meteorological and AtmosphericUnder Development Permanent Vegetation PlotsUnder Development Groundwater Levels and Groundwater QualityPlanned Sea LevelPlanned Land Use Activity and Visitor Use1 Operational and planned monitoring protocols that have been, or will be, developed by theNPS. All other protocols are being developed by the USGS-BRD in association withcooperators.

Cape Cod Monitoring Program page 18
wide/multiple ecosystem category. Often the protocols do not neatly fit within a specifiedlandscape type category, pointing to the interactions and relationships among ecosystems. Forinstance, Landbirds, Deer and Red Fox and Coyote monitoring are all included within theCoastal Uplands ecosystem because most of the monitoring will probably be within thesehabitats; however, monitoring will occur in the other ecosystem units as well.
Figure 2 is intended to demonstrate linkages among the individual monitoring protocols thatcompose the initial program. For instance, interpretation of the ponds and wetlands waterquality data sets will be dependent on the meteorological, atmospheric deposition, and land usedata sets. Monitoring freshwater stream discharge represents a necessary component todocumenting sources of nutrient enrichment in estuaries. Several other examples of thenecessary linkages are presented in Fig. 2.
The discussion that follows briefly identifies the protocols to be developed. Part Two of thisdocument provides the details of the protocols. The design matrices were instrumental ininsuring that the LTEM Program endeavors to monitor agents of change and stresses (i.e.,understand how the cause of an ecosystem response is changing), and monitor ecosystemresponses (i.e., understand if and how the ecosystem is changing).
For Estuaries and Salt Marshes, workshop discussions and the analysis of issues (Table 4a)highlighted nutrient loading, with multiple agents of change and multiple ecosystem responses,as a key focal point for the monitoring program. The threat of catastrophic and chronic oil spillsin the coastal environment strongly justifies the need for establishing sediment and benthic faunacontaminant baseline levels and monitoring within estuarine and salt marsh habitats. Coastalstorm events (hurricanes and nor’easters) are considered as major factors controlling geomorphicshoreline change.
Within the Barrier Islands, Spits, and Dunes complex, where the habitats are governed stronglyby physical shoreline processes, protocols for geomorphic shoreline change monitoring areunder development. As noted above, contaminants monitoring and storm surge monitoring arealso essential here. For Ponds and Freshwater Wetlands, pond water quality monitoring (anoperational program at Cape Cod National Seashore) is considered paramount to addressingcomplex issues related to acidification, nutrient loading, exotics, over- and under-abundantspecies, and land use. In addition, workshop discussions strongly recommended the need tomonitor pond and wetland water levels and freshwater stream discharge as fundamental variablesneeded to interpret the response of these freshwater environments to natural and human-inducedstresses. Monitoring of aquatic biota (as planned) will address multiple stresses.
The influence of exotics, as well as problems related to over- and under-abundant species are themost persistent issues confronting Coastal Uplands, and thus, vegetation monitoring is essentialand under development (see park-wide/multiple ecosystems). Workshop discussions alsoidentified white-tailed deer monitoring as important at Cape Cod and other coastal parks.
Cover type monitoring and permanent vegetation plot monitoring, included under theParkwide/Multiple Ecosystem category, are in response to multiple stresses identified throughou

Cap
e C
od M
onito
ring
Pro
gram
page
19
Fig.
2.
Som
e in
tera
ctio
ns a
mon
g th
e va
riou
s m
onito
ring
pro
toco
ls.
BA
RR
IER
ISL
AN
DS
Shor
elin
e C
hang
eV
eget
atio
nW
ater
bird
sC
onta
min
ants
PO
ND
S &
WE
TL
AN
DS
Wat
er Q
ualit
ySu
rfac
e W
ater
Lev
elSt
ream
Dis
char
geV
eget
atio
nF
auna
UP
LA
ND
SV
eget
atio
nD
eer
Can
ids
Lan
dbir
ds
Met
eoro
logi
c
Atm
osph
eric
Gro
undw
ater
Sea
Lev
el
Lan
d U
se/V
isit
or/
Cov
er T
ype
EST
UA
RIE
SN
utri
ent
Enr
ichm
ent
Veg
etat
ion
Fau
naC
onta
min
ants
Cape Cod Monitoring Program page 20
all of the ecosystem types (Tables 4a-d). Land use is an important agent of change linked to themost stresses in all the ecosystem types; thus, a planned monitoring protocol for assessing landuse activity and visitor use. Meteorological/Atmospheric deposition and Groundwatermonitoring are fundamental variables needed to interpret the response of all habitats to naturaland human-induced stresses.
The protocols listed in Table 6 are suggested as the initial core of the Long-term CoastalEcosystem Monitoring Program at Cape Cod National Seashore. These protocols should providean excellent foundation from which the monitoring program can evolve over the next severaldecades. The intent of the monitoring program is to be well balanced, focusing on humanconstraints to the coastal ecosystem, but also accounting for natural processes and associatedecosystem responses, to better understand natural variability and functions of ecosystems. Theprotocols encompass sufficient breadth to provide guidance for natural resource management,while not being too cumbersome to execute effectively. In addition, the program is flexible,inviting the development of new protocols: as issues emerge, as the interpretation of monitoringdata identifies agents or responses that are now unknown, as predictive modeling efforts requireadditional information, or as new monitoring techniques are developed. The monitoringprogram will not be static, but dynamic and building upon the fundamental program.
INTEGRATING PROTOCOL DEVELOPMENT AND PROGRAMIMPLEMENTATION
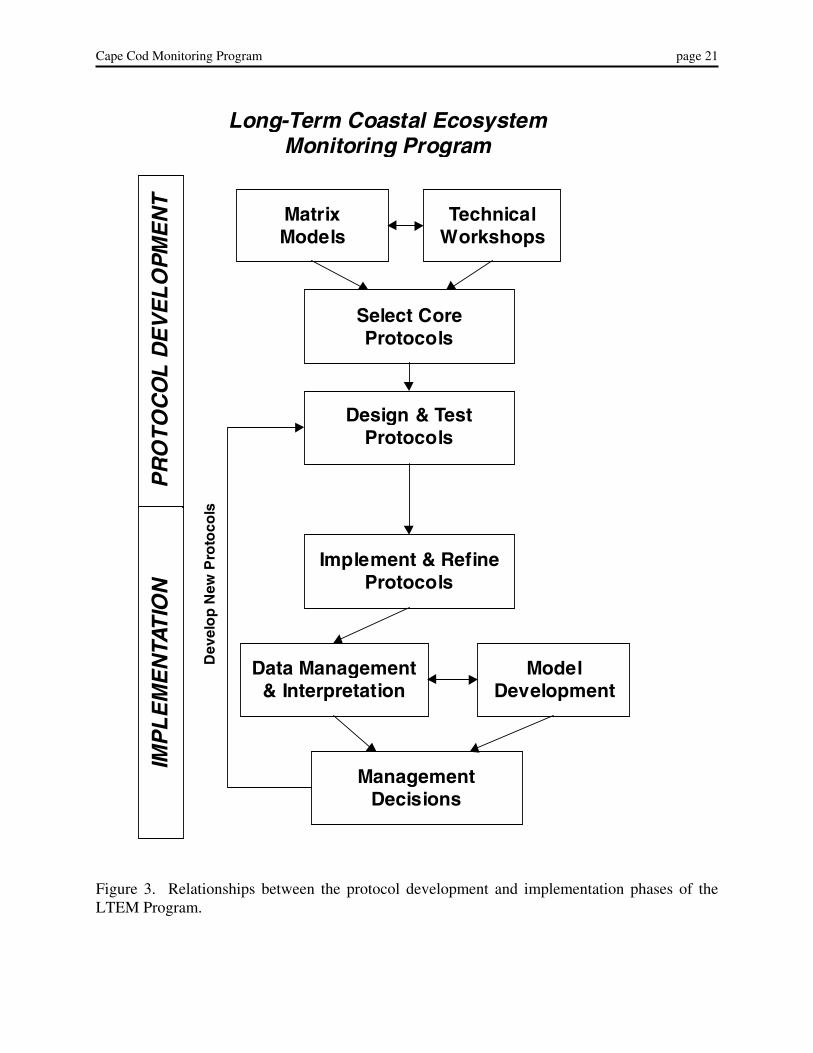
The Long-term Coastal Ecosystem Monitoring Program includes two phases: a ProtocolDevelopment phase, being led by the USGS-BRD with extensive input and cooperation from theNPS, and a Program Implementation phase, conducted by the NPS with continuing technicalinput from the USGS-BRD. Figure 3 identifies the major aspects and relationships between bothphases of the Program. As noted, the design matrix models (Table 4a-d) and technicalworkshops formed the basis for selection of components or variables to be included in themonitoring program. The process of designing and field testing the protocols is presentlyunderway. Upon completion and training, the NPS will implement the protocols, manage andinterpret the data, and apply the monitoring findings to natural resource management decisions.It is also noted in Figure 3, that as the Program evolves, it may be determined that new protocolsare needed. Finally, the results from monitoring, complemented by comprehensive research dataspecific to Cape Cod National Seashore, will form the basis for development of conceptual andnumerical models aimed at predicting the response of ecosystems, or components therein, tonatural and human-induced processes.
Cape Cod Monitoring Program page 21
PR
OT
OC
OL
DE
VE
LO
PM
EN
T IM
PL
EM
EN
TAT
ION
Data Management & Interpretation
Implement & Refine Protocols
Management Decisions
Design & Test Protocols
Select Core Protocols
Technical Workshops
Matrix Models
Model Development
Long-Term Coastal Ecosystem Monitoring Program
Dev
elo
p N
ew P
roto
cols
Figure 3. Relationships between the protocol development and implementation phases of theLTEM Program.

Cape Cod Monitoring Program page 22
LITERATURE CITED
Avers, P. E., D. T. Cleland, W. H. McNab, M. E. Jensen, R. G. Bailey, T. King, C. B. Goudey,and W. E. Russell. 1994. National Hierarchical Framework of Ecological Units.Washington DC: USDA Forest Service 15p.
Christensen, N. L. (Chair), A. M. Bartuska, J. H. Brown, S. Carpenter, C. D'Antonio, R. Francis,J. F. Franklin, J. A. MacMahon, R. F. Noss, D. J. Parsons, C. H. Peterson, M. G. Turner,R. G. Woodmansee. 1996. The report of the Ecological Society of America committeeon the scientific basis for ecosystem management. Ecological Applications 6:665-691.
Culliton, T. J., M. A. Warren, T. R. Goodspeed, D. G. Remer, C. M. Blackwell, and J. J.McDonough, III. 1990. Fifty Years of Population Change along the Nation's Coasts,1960-2010. NOAA, Strategic Assessment Branch. Rockville, MD. 41p.
Denslow, J. S. 1985. Disturbance-mediated coexistence of species. Pages 307-323 in S. T. A.Pickett and P.S. White (Eds.), The Ecology of Natural Disturbance and Patch Dynamics.Academic Press, NY.
Dixon, P. M., A. R. Olsen, B. M. Kahn. 1997. Measuring trends in Ecological Resources.Ecological Applications 8:225-227.
Holling, C. S. 1973. Resilience and stability of ecological systems. Annual Review of Ecologyand Systematics 4: 1-23.
Holling, C. S., (Ed.). 1978. Adaptive environmental assessment and management. J. Wiley andSons, Chichester.
Holling, C. S. 1992. Cross-scale morphology, geometry, and dynamics of ecosystems.Ecological Monographs 62:447-489.
King, A. 1993. Considerations of scale and hierarchy. Pages 190-39 in Woodley, S., J. Kay,and G. Francis (Eds.). 1993. Ecological Integrity and the Management of Ecosystems.St. Lucie Press. 220 pp.
Lancia, R. A., C. E. Braun, M. W. Collopy, R. D. Dueser, J. G. Kie, C. J. Martinka, J. D.Nichols, T. D. Nudds, W. R. Porath, and N. G. Tilghman. 1996. ARM! For the future:adaptive resource management in the wildlife profession. Wildlife Society Bulletin 24:436-442.
McDonnell, M. J. and S. T. A. Picket (Eds.). 1993. Humans as Components of Ecosystems.Springer-Verlag, New York. 364 pp.
NPS (National Park Service). 1992. Resource Management Plan Cape Cod National Seashore.Cape Cod National Seashore, Wellfleet, MA.

Cape Cod Monitoring Program page 23
NRC (National Research Council). 1990. Managing Troubled Waters: the Role of MarineEnvironmental Monitoring. Committee on a Systems Assignment of the MarineEnvironment Monitoring, Marine Board, Commission on Engineering and TechnicalSystems, National Research Council, National Academy Press, Washington DC. 125 pp.
Olsen, T., B.P. Hayden. A.M. Ellison, G.W. Oehlert, S.R. Esterby, and B.M. Kahn. 1997.Ecological resource monitoring change and trend detection workshop. Bulletin of theEcological Society of America 78: 11-13.
Rowe, J. S. 1988. Landscape Ecology: the study of terrain ecosystems. Pages 35-42 In M.Moss (Ed.). Landscape Ecology and Management. Proc. 1st Symposium CanadianSociety for Landscape Ecology and Management, University of Guelph, May 1987.Polyscience Publ. Inc., Montreal. 240 pp.
Rowe, J. S. and J. W. Sheard. 1981. Ecological land classification: a survey approach.Environmental Management 5:451-464.
Spellerberg, I. 1991. Monitoring Ecological Change. Cambridge University Press, Cambridge.334p.
Urban, D. L., R. V. O’Neil, and H. H. Shugart, Jr. 1987. Landscape ecology. Bioscience37:119-127.
USEPA (United States Environmental Protection Agency). 1989. Environmental Monitoringand Assessment Program: Overview. Office of Research and Development, U. S.Environmental Protection Agency, Washington DC.
Woodley, S., J. Kay, and G. Francis (Eds.). 1993. Ecological Integrity and the Management ofEcosystems. St. Lucie Press. 220 p.

Cape Cod Monitoring Program page 24
Cape Cod Monitoring Program page 25
PART TWO
SUMMARIES OF MONITORING PROTOCOLS
The following section summarizes the monitoring protocols that are proposed for inclusion inthe Program. The summaries are arranged according to ecosystem type or under a generalparkwide category (see Table 6). Each summary includes a problem statement, a series ofmonitoring questions, general monitoring approach to be developed, and a statement ofmanagement applications that may result upon implementation of the protocol. These are briefsummaries. Additional detail for each protocol is obtained from peer-reviewed protocoldevelopment and testing proposals.

Cape Cod Monitoring Program page 26
ESTUARIES AND SALT MARSHES
Protocol: ESTUARINE NUTRIENT ENRICHMENT
Problem Statement/Justification• Barnstable County, MA, is one of the leading counties in the northeastern US expected to
increase in population at an alarming rate from 1988-2010 (Culliton et al. 1990)…• Increasing residential development adjacent to park boundaries creates potential for excess
nitrogen loading to estuaries and coastal waters (Valiela et al. 1990, 1992). Sources of landuse derived nitrogen include, on-site septic systems, fertilizer applications, and runoff.
• In the northeastern U.S. atmospheric deposition has also been identified as a dominant sourceof nitrogen to estuaries and associated watersheds (Jawowski et al. 1997).
• Nitrogen-loading leads to eutrophication, particularly in shallow estuarine embayments (e.g.,Nauset Marsh, Pleasant Bay, Wellfleet Harbor-Herring River).
• Eutrophication leads to shifts in the dominant primary producers (e.g., macroalgae mayreplace eelgrass), which can lead to declines in dissolved oxygen, altered benthic communitystructure, altered fish and decapods communities, and higher trophic responses (e.g.,shorebirds, waterbirds). See D’Avanzo and Kremer 1994, Short and Burdick 1996, Valiela etal. 1997, Kinney and Roman 1998.
Monitoring Questions and Approach
Monitor Nutrient InputsIs nitrogen loading to estuaries changing in response to land use derived and atmosphericsources?• Monitor housing density, conversion of summer to year-round residences, and water use in
estuarine drainage basins.• Quantify and monitor nitrogen loading via groundwater to estuaries within developed and
undeveloped drainage basins.• Develop predictive relationships between groundwater nitrate concentration and nitrate
loading, thus minimizing long-term monitoring effort.• Quantify and monitor atmospheric nitrogen loading onto estuarine drainage basins.
Monitor Estuarine ResponsesWhat is the response of the estuarine ecosystem to changing magnitudes of nutrient loading?• Monitor biomass of the major primary producers (eelgrass, epiphytes, macroalgae,
phytoplantkon). Focus on enclosed basins within larger estuarine ecosystems because oftheir increased susceptibility to eutrophication.
• Develop relationships between macroalgal tissue nitrogen content and nitrogen loading, thusminimizing long-term monitoring effort.
• Monitor dissolved oxygen and light levels as water quality parameters. These represent goodintegrative measures.
• Quantify fish and decapod crustacean (nekton) utilization of estuarine habitats (see separateprotocol summary).

Cape Cod Monitoring Program page 27
• Quantify waterbird utilization of estuarine habitats (see separate protocol summary)
Determine Thresholds of Ecosystem ChangeWhat magnitude of nitrogen loading causes shifts in dominant primary producers?What are the key factors mediating the effects of nitrogen loading (e.g., basin flushing time)?• Conduct controlled nitrogen loading experiments in the field environment to evaluate the
response of eelgrass, epiphytes and macroalgae to different levels of nitrogen loading.• Based on these experiments, establish thresholds of nitrogen loading critical to changing
plant community structure. Knowledge of thresholds will enable managers to anticipatelevels of nitrogen that may lead to eutrophication.
• Employ the gradient approach to the monitoring program, sampling in developed versusundeveloped shoreline habitats and well-flushed versus poorly flushed basins, in order todevelop predictive relationships between nitrogen loading and estuarine responses.
Management Applications• Tracking changes in nutrient enrichment as part of a LTEM program will enable the
protection or restoration of estuarine habitat and function of the estuarine ecosystem.• Work cooperatively with local governments to establish land use practices that reduce
nitrogen loading.• Assist with design and placement of park on-site septic systems.• Establish habitat restoration programs if deemed appropriate (e.g., eelgrass restoration).
References Cited
Culliton, T. J., M. A. Warren, T. R. Goodspeed, D. G. Remer, C. M. Blackwell and J. J.McDonough III. 1990. 50 years of population change along the Nation's coasts, 1960-2010. NOAA, Strategic Assessment Branch, National Ocean Service. Rockville, MD.41p.
D’Avanzo, C. and J. N. Kremer. 1994. Diel oxygen dynamics and anoxic events in an eutrophicestuary of Waquoit Bay, Massachusetts. Estuaries 17: 131-139.
Jaworski, N .A., R. W. Howarth and L. J. Hetling. 1997. Atmospheric deposition of nitrogenoxides onto the landscape contributes of coastal eutrophication in the northeast UnitedStates. Environmental Science & Technology 31: 1995-2004.
Kinney, E. H. and C. T. Roman. 1998. The response of primary producers to nutrientenrichment in a shallow estuary. Marine Ecology Progress Series 163: 89-98.
Short, F. T. and D. M. Burdick. 1996. Quantifying eelgrass habitat loss in relation to housingdevelopment and nitrogen loading in Waquoit Bay, Massachusetts. Estuaries 19: 730-739.

Cape Cod Monitoring Program page 28
Valiela, I., G. Collins, J. Kremer, K. Lajtha, M. Geist, B. Seely, J. Brawley, and C. H. Sham.1997. Nitrogen loading from coastal watersheds to receiving estuaries: new method andapplication. Ecological Applications 7: 358-380.
Valiela, I., J. Costa, K. Forman, J. M. Teal, B. Howes and D. Aubrey. 1990. Transport ofgroundwater-borne nutrients from watersheds and their effects on coastal waters.Biogeochemistry 10: 177-197.
Valiela, I., K. Forman, M. LaMontagne, D. Hersh, J. Costa, P. Peckol, B. DeMeo-Anderson, C.D’Avanzo, M. Bafione, C. Sham, J. Brawley and K. Lajtha. 1992. Couplings ofwatersheds and coastal waters: sources and consequences of nutrient enrichment inWaquoit Bay, Massachusetts. Estuaries 15: 443-457.

Cape Cod Monitoring Program page 29
ESTUARIES AND SALT MARSHES
Protocol: ESTUARINE NEKTON (Fish and Decapod Crustaceans)
Problem Statement/Justification• Nearly two-thirds of all commercially important fishery species depend on estuaries for at
least part of their life cycle (McHugh 1966).• Estuarine habitats at Cape Cod provide valuable habitat for commercial and recreational
species (e.g., winter flounder, striped bass, herrings, American lobster, hard clam, Americanoyster, others) and species of trophic significance (e.g., mummichog, silversides, sand lance,grass shrimp, others) (Able et al. 1988, Heck et al. 1989, Ayvazian et al. 1992).
• Shallow estuarine habitats, including salt marshes, eelgrass beds, macroalgal beds, andothers, are constantly changing in response to storms and geomorphic processes and habitatloss from development and tidal restrictions.
• Eutrophication leads to shifts in dominant habitat types (e.g., macroalgae may replaceeelgrass), which can lead to declines in dissolved oxygen, altered fish and decapodcommunity structure, and ultimate impacts on higher trophic levels.
Monitoring Questions and Approach
Quantitative Sampling MethodsWhat are the most appropriate gear types to use when quantitatively sampling nekton in shallowestuarine habitats?• Determine the effectiveness of utilizing a 1m2 throw trap (after Rozas and Minello 1997) for
nekton sampling.• Compare with results from beach seines.
Spatial and Temporal VariabilityWhat estuarine habitats should be sampled in the nekton monitoring?• At 3 sites (Nauset Marsh, Herring River, Hatches Harbor), and satellite sites in Rhode Island,
numerous habitats will be sampled with the throw traps, including; eelgrass beds, salt marshpools, intertidal and subtidal creeks, flats adjacent to fringing marsh, and Phragmitesshoreline.
• Comparisons of nekton species composition and density will by determined by multivariateordination techniques.
What is an appropriate frequency of sampling?• Nekton will be sampled bi-weekly at Hatches Harbor for a 1-yr period and the data analyzed
by ordination techniques.• Previous studies suggest that spatial variability in nekton sampling often exceeds temporal
variability and that sampling less frequently with numerous replicates is an efficientapproach (Peterson and Rabeni 1995).
Salt Marsh Nekton EcologyAre nekton abundance and distribution patterns in salt marshes related to preferential selection of
Cape Cod Monitoring Program page 30
specific microhabitat types by individual species?Where does the common mummichog, an abundant salt marsh fish, overwinter in New Englandsalt marshes?Do salt marshes receiving reduced tidal flow continue to support nekton communities, but withdifferent species composition and abundance than references marshes?What is the response of nekton communities to restoration of tidal exchange?
Management Applications• Seasonal species composition and abundance data are essential to assessing the effects of
chronic pollution (e.g., nutrient loading) and human-induced and natural catastrophic events(e.g., oil spills, hurricanes).
• Nekton sampling is essential to documenting the ecological success of salt marsh restorationefforts.
References Cited
Able, K. W., K. L. Heck, M. P. Fahay, and C. T. Roman. 1988. Use of salt-marsh peat reefs bysmall juvenile lobsters on Cape Cod, Massachusetts. Estuaries 11: 83-86.
Ayvazian, S. G., L. A. Deegan, and J. T. Finn. 1992. Comparison of habitat use by estuarinefish assemblages in the Acadian and Virginian zoogeographic provinces. Estuaries 15:368-383.
Heck, K. L., K. W. Able, M. P. Fahay, and C. T. Roman. 1989. Fishes and decapod crustaceansof Cape Cod eelgrass meadows: species composition, seasonal abundance patterns andcomparison with unvegetated substrates. Estuaries 12: 59-65.
McHugh, J. L. 1966. Management of estuarine fisheries. Trans. Am. Fish. Soc. Suppl. 95: 133-154.
Peterson, J. T., and C. F. Rabeni. 1995. Optimizing sampling effort for sampling warm waterstream fish communities. North Am. J. Fish. Management 15: 528-541.
Rozas, L. P., and T. J. Minello. 1997. Estimating densities of small fishes and decapodcrustaceans in shallow estuarine habitats: a review of sampling design with focus on gearselection. Estuaries 20: 199-213.
Cape Cod Monitoring Program page 31
ESTUARIES AND SALT MARSHES
Protocol: WATERBIRDS
Problem Statement/Justification• Estuarine wetlands are used seasonally by a wide assemblage of birds including obligate
species that breed and forage only in salt and brackish habitats, and facultative species,which breed or forage in other habitats as well.
• Breeding bird communities of salt marshes are affected by changes in salinity, depth andfrequency of flooding, heterogeneity of the plant community, competition between birdspecies, and history of human use. Human-induced reductions in water level (tidalrestriction) and salinity have adversely effected bird diversity and abundance.
• Human activities adversely affect avian populations in other ways including altering foragingpatterns; distribution and habitat use; and increasing energy expenditures. Sea level riseand storm events affect the spatial distribution of estuarine habitats and are likely to alterwaterbird populations.
Monitoring Questions and ApproachEstuarine Habitats and Environmental ChangeWhat are the fundamental site-specific factors controlling waterbird populations and habitat use?• Monitor landward migration of barrier beaches, overwash events, estuarine water quality,
and changes in the extent and spatial distribution if estuarine habitats (separate protocols).• Monitor changes in hydrology and habitat associated with sea level rise and restoration of
tidal flows.• Monitor direct and indirect human disturbance in estuaries such as recreational boating and
shellfishing.
Waterbird ResponsesIs waterbird foraging activity shifting in response to human disturbance or changes in the extent,quality, and distribution of estuarine marsh habitats?Does waterbird species frequency of occurrence or relative density significantly change aftertidal flow is restored to restricted marshes?How does waterbird foraging change with restored hydrology?• Monitor spatial and temporal patterns in frequency of occurrence, species richness, relative
density, and habitat use of waterbird assemblages in estuarine and brackish salt marshes.• Monitor changes in breeding season bird communities before and after restoration or other
management actions.
Management Applications• Basic seasonal abundance data on migratory waterbird populations is fundamental to
assessing the effects of chronic pollution and catastrophic natural and anthropogenic eventssuch as hurricanes and oil spills.
• Waterbird monitoring data will be useful in predicting and evaluating the success of adaptive
Cape Cod Monitoring Program page 32
management actions such as salt marsh habitat restorations.• Waterbird monitoring will facilitate conservation efforts for rare or declining species such as
American bitterns and black ducks and enhance public support for habitat restoration andprotection.
References Cited
Beatty, L. L., Nowicki, B. L. A. A. Keller, R. A. Wahle, C. L. LaBash, P. V. August. 1994. Aplan for inventory and monitoring of estuarine resources at Cape Cod National Seashore.Tech Rpt. NPS/NAROSS/NRTR-94/21.
Brown, J.M. 1994. Species composition, migration chronology, and habitat use of waterbirds atCape Cod National Seashore. M.S. Thesis, Univ. Rhode Is. 152 p.
Erwin, M. R. 1996. Dependence of waterbirds and shorebirds on shallow-water habitats in themid-Atlantic Coastal Region: An ecological profile and management recommendations.Estuaries 19:213-219
Grande, J. W., IV. 1972. Winter ecology of maritime black ducks in Massachusetts: withspecial reference to Nauset Marsh, Orleans and Eastham. PhD thesis, Univ. Mass.,Amherst. 93 p.
Lewis, C. and D. G. Casagrande. 1997. Using avian communities to evaluate salt marshrestoration. Pp. 204-236 in D. Casagrande (ed.), Restoration of an urban salt marsh: Aninterdisciplinary approach. Yale School of Forestry and Environmental Studies Bulletin100.

Cape Cod Monitoring Program page 33
ESTUARIES AND SALT MARSHES
Protocol: SEDIMENT AND BENTHIC FAUNA CONTAMINANTS
Problem Statement/Justification• Benthic estuarine habitats are sinks for the accumulation of anthropogenic pollutants
including petroleum hydrocarbons (Trowbridge et al. 1996). Sources of hydrocarbons inSeashore estuaries include chronic inputs from road runoff, transport, recreational andcommercial boating; and catastrophic events such as oil tanker spills.
• Because of their relative immobility and slow metabolic rates, benthic fauna such as musselsbioaccumulate petroleum hydrocarbons that accumulate in sediments (Glegg and Rowland1996).
• Benthic fauna include commercially and ecologically important members that serve as foodfor higher trophic consumers or other commercial species. An important long-term effect onmussels and other benthic fauna is that caused by passing on concentrated contamination tosensitive consumer species, ultimately affecting the predator’s growth and survival.
Monitoring Questions and Approach
What are baseline levels of refined and unrefined petroleum hydrocarbons in estuarinesediments?• Collect surficial sediments and analyze for total hydrocarbons [THC] and individual
polynuclear aromatic hydrocarbons [PAHs].Do concentrations and compositional patterns of petroleum hydrocarbons in sediments amongsites within Seashore estuaries reveal any clear differences and spatial patterns in relation topossible non-point sources.• Sample estuarine sediments at random multiple stations and measure abiotic environmental
variables (such as sediment grain size and total organic carbon, salinity and pH) to use ininterpreting accumulation patterns of contaminants.
Are there any significant correlations between patterns of sediment contamination, sedimenttoxicity, and chemical/physiological/biological conditions of resident benthic fauna (i.e. arepatterns of petroleum accumulation in sediments linked to significant biological affects?)• Collect and analyze an indigenous benthic organism (Mytilis edulis) for hydrocarbon tissue
burdens, cytochrome P450 (Anderson et al. 1996), and Shell Condition Index (wet weight ofanimal tissues/shell volume) as an indication of physiological condition. Hydrocarbonsampling of sediment alone may not indicate hydrocarbon contamination when tissuesamples do (Short and Round 1993).
Management Applications• Hydrocarbon “fingerprints” from sediment and bivalve tissue analysis will help determine
the source and age of petroleum hydrocarbons in estuaries.• Continued monitoring of the estuaries will allow collection of a baseline data set that could
be used to identify future chronic inputs of hydrocarbon contaminants as well as acute
Cape Cod Monitoring Program page 34
impacts that could take place in a short period, such as an oil spill.
References Cited
Anderson, J. W., T. V. K. Bothner, and R.H. Tukey. 1996. Using a biomarker (P450 RGS) TestMethod on Environmental Samples, Pp. 277-286 in G.K. Ostrander (Ed.) Techniques inAquatic Toxicology, Lewis Publishers, Bocha Raton, Fl. 233 p.
Glegg, G. A. and S. J. Rowland 1996. The Braer Oil Spill-hydrocarbon concentrations inintertidal organisms. Marine Pollution Bulletin 32:486-492.
Short, J. and P. Rounds. 1993. Determination of petroleum-derived hydrocarbons in sedimentsfollowing the Exxon Valdez oil spill. Pp. 57-59 in Exxon Valdez Oil spill Symposium,EVOS Restoration Office, Anchorage, AK.
Trowbridge, C., T. T. Baker, and J. D. Johnson. 1996. Effects of hydrocarbons on bivalves.Fish/shellfish Study 13, Exxon Valdez Oil Spill State/Federal Natural Resource DamageAssessment Final Rpt. Alaska Dept. of Fish and Game, Anchorage, AK 187 p.

Cape Cod Monitoring Program page 35
BARRIER ISLANDS/SPITS/DUNES
Protocol: SHORELINE CHANGE
Problem Statement/Justification• Relative rise in sea level results in a net landward migration of the shoreline and alters the
physical aspects of shoreline habitats. In response to global warming and increased carbondioxide emissions, it is predicted that sea level will rise at an accelerated rate over the nextcentury (Titus and Barth 1984).
• A landward migration of the shoreline is a natural process in response to storms and sea-levelrise, but it can cause an eventual loss of resources, including static biological resources (e.g.,coastal bluffs) and cultural resources (e.g., buildings, roads). The structure of mobile coastalhabitats (e.g., barrier islands, spits) may change, but the resource is generally not lost.
• Storm events and post-storm swells effect the transfer of sediment at the shoreline interface(Zeigler et al. 1959, Giese and Aubrey 1987).
• Human activities, such as shoreline armor or inlet stabilization, dune rehabilitation (Zak andEvangel 1963) or beach nourishment, and recreational use (Steiner and Leatherman 1979)may directly or indirectly affect shoreline change by interfering with natural process.
Monitoring Questions and Approach
Define spatial and temporal variability of shoreline changeSurvey shoreline profiles along historic permanent transects (Marinden 1889) across coastallandforms to:• complete a 110 year record and benchmark sites for future monitoring updates, and• quantify the magnitude of single events, seasonal cycles, and interannual variability.• Conduct repeated, planimetric surveys of the Mean High Water line using a Global
Positioning System (GPS) in order to analyze seasonal and annual trends in shoreline shifts.Results are to be compared with historic shoreline data sets (Allen and LaBash 1997).
• Utilize Remote Video Monitors (Holman et al. 1993) for intensive examination of nearshorewave characteristics associated with shoreline configuration and nearshore bathymetry.
• Interpret orthogonal aerial photographs and historic aerial photographs as a means to mapshoreline features beyond the ocean/beach contact that are not easily mapped by GPS, suchas the summits of escarpments and margins of salt marshes.
Determine Thresholds of Shoreline ChangeWhat are the shoreline areas of critical concern to park managers?• Guidelines will be developed to determine how site-specific trends in shoreline change may
pose any threat to critical areas.• Knowledge of coastline dynamics will enable managers to anticipate areas where shoreline
retreat or advance becomes at issue.
Cape Cod Monitoring Program page 36
Management Applications• With the implementation of a long-term Seashore monitoring program, it is expected that
coastal processes affecting shoreline change will proceed naturally.• Encourage practices that avoid known risks associated with dynamic shorelines (e.g., restrict
constructing facilities at the retreating edge of land)• Reduce the imminent threat of shoreline change by manipulating the resource (e.g., moving
facilities away from the retreating edge of land; transplanting endangered plants).• Work cooperatively with local agencies and landowners to discourage activities that
constrain natural shoreline processes (e.g., revetments, beach nourishment).
References Cited
Allen, J. R. and C. L. LaBash, 1997. Measuring shoreline change on Fire Island. Maritimes39:13-16.
Giese , G. S. and D. G. Aubrey, 1987. Bluff erosion on outer Cape Cod. Proceedings CoastalSediments '87, ASCE Vol. II: 1871-1876.
Holman, R. A., A. H. Sallenger, T. C. Lippman, and J. W. Haines, 1993. The application ofvideo image processing to the study of nearshore processes. Oceanography 6:78-85.
Marindin, H. L., 1889. Encroachment of the sea upon the coast of Cape Cod, cross-sections ofthe shores between Chatham and Highland Lighthouses, Annual Rpt., U.S.C.&G.S.Appendix 12:403-407; Appendix 13:409-457.
Steiner, A. J. and Leatherman, S. P. 1979. An Annotated Bibliography of the Effects of Off-Road Vehicle and Pedestrian Traffic on Coastal Ecosystems. UM-NPSCRU ReportNumber 45.
Titus, J. G., and M. C. Barth. 1984. An overview of the causes and effects of sea level rise. Pp.1-56 in Greenhouse effect and sea level rise, M.C. Barth and J.G. Titus, editors. VanNostrand Reinhold Co., NY.
Zak, J. M., and Evangel, B.. 1963. Dune Stabilization at Provincetown, Massachusetts. Shoreand Beach 31:19-24.
Cape Cod Monitoring Program page 37
PONDS AND FRESHWATER WETLANDS
Protocol: WATER QUALITY AND LIMNOLOGICAL MONITORING
Problem Statement/Justification• The 20 kettle ponds within Cape Cod National Seashore are outstanding natural and
recreational resources (Martin et al. 1993).• Heavy recreational use and conversion of seasonal residences into year-round residences can
contribute to pond eutrophication from septic effluent, fertilizer applications, and erodedsoils. Of primary concern, is phosphorus loading from sources outside the watershed andinternal loading of phosphorus during hypolimnetic oxygen depletions.
• In the Northeastern United States, acid rain can alter pond water quality through acidificationor disturbance to sedimentary sulfur, iron, and phosphorous chemistry (Caraco et al. 1989).
• Pond liming, to enhance recreational fisheries, as a historical practice and as currentlyproposed at several outer Cape ponds, adversely impacts the oligotrophic status of thesenatural acidic ponds (Soukup 1977).
Monitoring Questions and Approach
Limnological MonitoringWhat are the seasonal variations and annual changes in the water quality/trophic status of theponds?• Monitor variables that are linked to seasonal aspects of nutrient loading such as water
column characteristics and water quality, e.g., Temperature, conductivity, dissolved oxygen(DO), light intensity [Secchi depth and illumination meter], and total nitrogen (TN), totalphosphorus (TP), total sulfide (TS), ferrous iron (Fe+2) and major ions (H, Na, Ca, Mg, Fe,SiO2, SO4, NO3, PO4, NH4, HCO3, and Cl.)
What changes are evident in limnological processes that relate to water quality?• Monitor limnological processes that respond to nutrient loading, e.g., Chlorophyll
florescence and light penetration to index productivity, hypolimnetic anoxia followingthermal stratification (vertical profiles of temperature, conductivity, DO, and reduced ironand sulfides.
Management Applications• Long-term limnological information is essential for detecting natural trends and the effects of
anthropogenic impacts upon water quality.• Limnological monitoring data is necessary to guide and evaluate management actions
directed at reducing nutrient inputs.
References Cited
Caraco, N. F., J. J. Cole, and G. E. Likens. 1989. Evidence of a sulfate-controlled release fromsediments of aquatic systems. Nature 341:316-381.

Cape Cod Monitoring Program page 38
Martin, L., J. Portnoy, and Charles Roman. 1993. Water Quality Monitoring and ResearchPlans for Kettle Ponds, Cape Cod National Seashore. Technical ReportNPS/NRWRD/NRTR-93/15. 56 pp.
Soukup, M. A. 1977. Limnology and management of freshwater ponds of Cape Cod NationalSeashore. Technical Report, NPS, Boston. 73 p.

Cape Cod Monitoring Program page 39
PONDS AND FRESHWATER WETLANDS
Protocol: SURFACE WATER LEVELS AND STREAM BASEFLOW
Problem Statement/Justification• Surface water level in kettle ponds and wetlands is a major factor controlling ecological
processes (e.g., vegetation species composition and structure, amphibian life history,waterbird utilization, etc.).
• Surface water levels fluctuate on seasonal and annual or inter-annual time scales in responseto seasonal and extreme meteorological events (e.g., storms, drought), land use factors (e.g.,land clearing, vegetation change), groundwater withdrawal, and other factors.
• Understanding empirical relationships between surface water levels and groundwater isessential to the development of hydrologic models aimed at predicting impacts ofgroundwater withdrawal or runoff alterations.
• Freshwater baseflow in Seashore river valley estuarine systems (e.g., Herring River, PametRiver) is essential for development of a natural freshwater to seawater estuarine gradient, andassociated maintenance of diverse estuarine habitats.
• With groundwater withdrawal, interbasin transfers, and vegetation and land use changes,stream baseflow will change.
Monitoring Questions and Approach
Surface Water LevelsWhat are seasonal and inter-annual fluctuations in pond and freshwater wetland surface waterlevels and what factors contribute to those fluctuations?• Establish permanent water level recording devices at all 20 kettle ponds of the Seashore and
a representative number of seasonally-flooded wetlands (e.g., Red Maple swamps, CedarSwamp, shrub-dominated wetlands).
Stream DischargeWhat are the trends in stream discharge?• At the Seashore’s major river systems (Herring River and Pamet River) stage-discharge
relationships will be established.
Management Applications• Knowledge of long-term fluctuations in surface water levels or stream discharge is necessary
to understanding if the ecology of an aquatic system is changing in response to naturalfactors (e.g., drought, excess rainfall) or human-induced factors (e.g., groundwaterwithdrawal).
• The network of surface water level monitoring stations, coupled with groundwater levelmonitoring wells, and stream discharge estimates are essential to support groundwatermodels aimed at predicting impacts of groundwater withdrawals, interbasin transfers,seawater intrusion, and contaminant loading.
• Information on stream discharge is essential to the Seashore’s efforts of predicting andmodeling salinity distributions in estuaries being restored.
Cape Cod Monitoring Program page 40
PONDS AND FRESHWATER WETLANDS
Protocol: FRESHWATER FISH
Problem Statement/Justification• Freshwater fish communities in both lakes and streams are affected by a complex host of
changes in physical aspects of the habitat, environmental factors, and biotic factors (He andKitchell 1990; Hearn 1987; McQueen et al. 1989; Poff and Allan 1995; Power, M. E. 1992;Putman et al. 1995;Tonn and Magnuson 1982; Rahel 1984;Weaver et al. 1997; Welker et al.1994).
• The sustainability of freshwater fisheries may also be adversely affected by human activitiesthat result in hydrologic alterations, acidification, nutrient loading from adjacentdevelopment, exotic fish introductions, and harvest pressures of recreational fishing (Manny1984; Soranno et al. 1996; Wichert 1995).
• Freshwater fish, being key predators and consumers in the aquatic food web (Carpenter et al.1987) are excellent indicators of change in the freshwater ecosystem.
• Freshwater fish provide recreation for both anglers and non-anglers.• A comprehensive and current freshwater fish inventory is lacking for many regional parks.
Monitoring Questions and Approach
Freshwater Habitats and Environmental ChangeWhat are the historical circumstances and site specific factors influencing fish abundance anddistribution?• Compile records pertaining to fish surveys, stocking, chemical treatment, and changes in
land use.• Characterize waterbody attributes relating to morphometry, adjacent landscape use,
environmental parameters (physical and chemical: includes pond water quality monitoring -separate protocol), trophic structure, food availability, and human impacts.
Freshwater Fish ResponsesWhat are the geographic and seasonal differences in the composition of the fish community?• Determine the composition of the fish community at all sites in all major habitats across
different seasons.How do changes in fish species composition affect the trophic structure of specific waterbodies?• Quantify the distribution and abundance of fish predators, planktivorous fish, migratory or
seasonally abundant fish, zooplankton species.How are fish communities responding to anthropogenic changes?• Analyze the inventory of fish and their food base in relation to abiotic, biotic, landscape,
historical, and anthropogenic factors (including the introduction of exotics and fishingpressure).
• Construct a simplified, conceptual model of determinants of freshwater distribution in aselected suite of freshwater ponds.

Cape Cod Monitoring Program page 41
Management Applications• Fundamental information of freshwater fish ecology is essential to assessing the effects of
change due to natural or anthropogenic events.• A rudimentary model of freshwater fish dynamics in relation to changes in habitat and
trophic structure will guide management efforts to preserve, enhance, and restore freshwaterecosystems.
References Cited
Carpenter, S. R., J. F. Kitchell, J. R. Hodgson, P. A. Cochran, J. J. Elser, M. M. Elser, D. M.Lodge, D. Kretchmer, X. He, and C. N. von Ende. 1987. Regulation of lake primaryproductivity by food web structure. Ecology 68:1863-1876.
He, X. and J. F. Kitchell. 1990. Direct and indirect effects of predation on a fish community: awhole lake experiment. Transactions of the American Fisheries Society 119:825-835.
Hearn, W. E. 1987. Interspecific competition and habitat segregation among stream dwellingtrout and salmon: a review. Fisheries 12:24-31.
Manny, B. A. 1984. Potential impacts of water diversions on fisheries resources in the GreatLakes. Fisheries 9:19-23.
McQueen, D. J., M. R. S. Joannes, J. R. Post, T. J. Stewart, and D. R. S. Lean. 1989. Bottom-upand top-down impacts on freshwater pelagic structure. Ecological Monographs59:289:309.
Poff, N. L. and J. D. Allan. 1995. Functional organization of stream fish assemblages in relationto hydrological variability. Ecology 76:606-627.
Power, M. E. 1992. Habitat heterogeneity and the functional significance of fish in river foodwebs. Ecology 73:1675-1688.
Putman, J. H., C. L. Pierce, and D. M. Day. 1995. Relationships between environmentalvariables and size-specific growth rates of Illinois stream fishes. Transactions of theAmerican Fisheries Society 124:252-261.
Rahel, F. J. 1984. Factors structuring fish assemblages along a bog lake successional gradient.Ecology 65:1276-1289.
Soranno, P. A., S. L. Hubler, S. R. Carpenter, and R. C. Lathrop. 1996. Phosphorus loads tosurface waters: a simple model to account for spatial pattern land use. EcologicalApplications 6:865-878.
Tonn, W. M. and J. J. Magnuson. 1982. Patterns in the species composition and richness of fishassemblages in northern Wisconsin Lakes. Ecology 63:1149-1166.

Cape Cod Monitoring Program page 42
Weaver, M. J., J. J. Magnuson, and M. K. Clayton. 1997. Distribution of littoral fishes instructurally complex macrophytes. Canadian Journal of Fisheries and Aquatic Sciences54:2277-2289.
Welker, M. T., C. L. Pierce, and D. H. Wahl. 1994. Growth and survival of larval fishes: rolesof competition and zooplankton abundance. Transactions of the American FisheriesSociety 123:703-717.
Wichart, G. A. 1995. Effects of improved sewage effluent management and urbanization of fishassociations of Toronto streams. North American Journal of Fisheries Management15:440-456.

Cape Cod Monitoring Program page 43
PONDS AND FRESHWATER WETLANDS
Protocol: AQUATIC INVERTEBRATES
Problem Statement/Justification• Aquatic invertebrates are dependent upon specific aquatic habitats, largely associated with
the littoral zone of kettle ponds and vernal pool habitats. Hydrology and water chemistry arethe chief factors affecting the distribution and abundance of aquatic invertebrates (Bailey1996). The importance of these habitats is evidenced by the presence of rare species(Carpenter 1988).
• The importance of several small water bodies in close proximity that vary slightly in waterchemistry and hydrology is suspected to enhance the regional biological diversity.
• Increasing human demand for groundwater supplies will have a direct impact upon thesurface water levels and essential habitat for aquatic invertebrates.
• Other human activities linked to diminishing water quality related to acidification or nutrientenrichment will adversely affect the community composition, abundance, and diversity ofaquatic invertebrates.
• Aquatic invertebrates, being sensitive to slight changes in hydrologic conditions and waterquality, serve as important indicators of ecosystem integrity.
Monitoring Questions and Approach
Aquatic Habitat Variability and ChangeWhat are the principal hydrological, habitat, and water quality gradients influencing thecomposition, abundance and diversity of aquatic invertebrates?• Characterize the natural variability in surface water hydrology of selected kettle ponds and
vernal pools (separate protocol) and aquatic flora (separate protocol) and water qualityparameters (separate protocol).
• Model changes in hydrology, vegetation dynamics, and biogeochemical processes.• Aquatic Invertebrate ResponsesTo what extent is the invertebrate fauna dependent upon hydrologic and habitat factors?• Determine the community and guild composition, abundance, and diversity of aquatic
invertebrates for specific sites and habitats.How are aquatic invertebrates responding to anthropogenic change?• Analyze the inventory of aquatic invertebrates to drawdown events and water quality
changes associated with various levels of eutrophication.
Management Applications• Information pertaining to the fundamental ecology of aquatic invertebrates is essential to
assessing the effects of change due to natural variation or anthropogenic events.• A rudimentary model of aquatic invertebrate distribution will guide management towards
critical habitat preservation.

Cape Cod Monitoring Program page 44
• Using indicator species, evaluate the effects of human-related impacts to freshwater aquatichabitats.
References Cited
Bailey, R. 1996. Comparing predicted and actual benthic communities in test ecosystems. Pp.55-68 in R. Bailey, R. H. Norris, T. B. Reynoldson (Eds.), Study design and data analysisin benthic macroinvertebrate assessments of freshwater ecosystems using a reference siteapproach. Technical information workshop, North American Benthological Society, 44thAnnual Meeting, Kalispell, MT.
Carpenter, V. 1988. Dragonflies and Damselflies of Cape Cod. Cape Cod Museum of NaturalHistory, Brewster, MA.
Cape Cod Monitoring Program page 45
PONDS AND FRESHWATER WETLANDS
Protocol: AMPHIBIANS
Problem Statement/Justification• Ten species of amphibians have been recorded on outer Cape Cod and additional species
may occur. Two species, the eastern spadefoot toad and four-toed salamander are state-listedas threatened and of special concern respectively. The eastern spadefoot toad is an obligateof pitch pine barrens/coastal oak woodland interspersed with vernal pools. Four-toedsalamanders are an obligate of red maple/cedar swamps and vernal pools.
• Species composition and/or species richness of amphibian communities change overgradients in precipitation, soil moisture, vegetation type, and vegetation structure.Amphibians have narrow physiological limits due to their moist permeable skin andsusceptibility of eggs to desiccation.
• At Cape Cod, amphibians are among the top predators in vernal pools and kettle ponds andcomprise a high proportion of the vertebrate biomass. Species such as the spottedsalamander and wood frog breed exclusively in vernal pools and are sensitive to low pH anddegradation in water quality.
Monitoring Questions and Approach
Monitor amphibians and habitat variablesDo changes to wetland hydrography or hydroperiod induced by groundwater withdrawal, sealevel rise, or climatic change alter amphibian community composition or species abundance?Are long-term changes in climate variables such as temperature, precipitation, UV-B radiation,surface water acidification, and atmospheric deposition of mercury affecting life historyparameters of amphibians such as breeding phenology, rates of growth and development, orreproductive success?Are trophic interactions within freshwater wetlands changing as a result of expanding bullfrogpopulations, alterations in invertebrate predator communities, or the availability of invertebrateprey? How do such trophic changes they affect the amphibian community?Are amphibian population structure and numbers in the Seashore affected by factors such ashighway mortality, predation from skunks, changes in forest vegetation structure associated withhigh densities of deer or establishment of invasive plant species?• Monitor surface water chemistry, hydroperiod, plant species composition and community
structure.• Monitor atmospheric variables and inputs including precipitation, solar radiation, and
precipitation chemistry. (separate protocol)• Monitor aquatic invertebrate prey communities.• Monitor changes in amphibian species richness and relative abundance.• Construct habitat models for selected species that encompasses spawning sites, tadpole
habitat, metamorphic sites, juvenile and adult feeding habitat, movement corridors, andhibernation sites.
Cape Cod Monitoring Program page 46
Management Applications
• Through a long-term monitoring amphibian database, support land management decisionsconcerning land developments (new bike trail, parking lot, camp sites, exotic species),evaluation of the effects of development on property on land abutting the park, planning andimplementation of habitat restoration within the Seashore, and understanding of impacts ofenvironmental change such as climatic variation.
• Promote public understanding and support of measures to protect surface wetlands byregulating rates of groundwater withdrawal.
• Facilitate efforts with other natural resource conservation agencies and organizations toidentify linkages between amphibian populations within the National Seashore andpopulations inhabiting property outside park boundaries and to evaluate existing andpotential pressures on amphibian habitat within and outside park boundaries. Use thisinformation to make management recommendations.
• Use amphibian population parameters as an important linkage with other LTEM monitoringcomponents at the Seashore such as meteorology and hydrology to assist in interpretingcause and effect of ecosystem change.
References Cited
Blaustein, A. R., D.B Wake, and W. P. Sousa. 1994. Amphibian declines: judging stability,persistence, and susceptibility of populations to local and global extinctions.Conservation Biology 8:60-71.
Drost, C. A. and G. M. Fellers. 1 996. Collapse of a regional frog fauna in the Yosemite area ofthe California’s Seirra Nevada. Conservation Biology 10;414-425.
Jones, L. K. 1992. Cape Cod National Seashore Reptile and Amphibian Survey. Unpubl. Rpt.92-04, Cape Cod National Seashore, Wellfleet, MA 4 pp.
Phillips, K. 1994. Tracking the vanishing frogs. St. Martin’s Press, New York. 231 pp.
Portnoy, J. W. 1987. Vernal ponds of Cape Cod National Seashore. Unpubl. Rpt., Cape CodNational Seashore, Wellfleet, MA .

Cape Cod Monitoring Program page 47
COASTAL UPLANDS
Protocol: LANDBIRDS
Problem Statement/Justification• Cape Cod National Seashore is an important breeding and migration stopover site for
neotropical migrant landbirds and supports many state listed rare species• Landbirds, because of their high body temperature, rapid metabolism, and high ecological
position on most food webs, may be excellent indicators of the effects of environmentalchange in terrestrial and aquatic ecosystems. Furthermore, their abundance and diversity invirtually all habitats, diurnal nature, discrete reproductive seasonally, and intermediatelongevity facilitate the monitoring of their population and demographic parameters
• Recent analyses of data from other regional monitoring programs such as the Breeding BirdSurvey, suggest that populations of many landbirds, including forest, scrubland-andgrassland-inhabiting species, appear to be in serious decline.
Monitoring Questions and Approach
Monitor avian productivity and survivalSWhat is the temporal variation (e.g., long-term trends) in productivity indices and adult survival-rate estimates of landbirds within the Seashore and how are these trends affected by thecomposition and volume of vegetation types and park management practices?Does the density or spatial distribution of houses and roads within and adjacent to the Seashoreaffect the composition and productivity of landbirds?How are changes in landscape heterogeneity affecting individual (target) species of forestinterior and edge or early successional landbirds?Do landscape-level productivity indices for a given species in the Seashore change after theimplementation of habitat restoration?• Monitor annual indices of adult population size and post-fledging productivity from data on
the numbers and proportions of young and adult birds captured.• Monitor annual adult survivorship, adult population size, and recruitment into the adult
population from mark-recapture data on adult birds.
Management Applications• Facilitate the planning of management actions and conservation strategies to reverse
population declines; and to aid in evaluating the effectiveness of the management andconservation actions implemented.
• Landbird population performance will be a useful measurement in evaluating the success ofland management actions such as prescribed fire in mimicking natural landscape patterns andpatch dynamics.
Aid in evaluating effects of specific human-related actions and natural events on landbirds suchas aerial communication towers and hurricanes.

Cape Cod Monitoring Program page 48
References Cited
CACO. 1992. Resources Management Plan Cape Cod National Seashore. Unpubl. Rpt., CapeCod National Seashore, Wellfleet, MA 196 pp.
DeSante, D. F. (in press) Management implications of patterns of productivity and survivorship from MAPS Program. Pp. x-x, in R. Bonney (Ed.), Proceedings of
the 1995 Partners in Flight International Workshop, Cape May, NJ.
DeSante, D. F. 1992. Monitoring avian productivity and survivorship: a sharp, rather than blunttool for monitoring and assessing land bird populations. Pp. 511-521 in McCullogh, D.C. and R. H. Barrett, (Eds.) Wildlife 2001:Populations Elsvier Applied Sciences, LondonUK.
NPS. 1992. National Park Service Neotropical Migratory Bird Conservation Program Plan andStrategy. April 1992. National Park Service, Washington, D.C., 20 pp.
Peach, B. G., S. T. Buckland, and S. R. Baillie. 1996. The use of constant effort mist-netting tomeasure between year differences in the abundance and productivity of commonpasserines. Bird Study 43:142-156.
Peterjohn, B. G., J. R. Sauer, and C. S. Robbins. 1995. Population trends from the N. AmericanBreeding Bird Survey, New York: Oxford Press.
Petit, L. J., D. R. Petit, and T.E. Martin. 1995. Landscape-level management of migratory birds:looking past the trees to see the forest. Wildlife Society Bulletin 23:420-429.
Pyle, P., D. R. O’Grady, and D. F. DeSante. 1997. The 1996 annual report of the MAPSprogram in Region 1 and Region 6 of the USDA Forest Service. Unpubl. Rpt., TheInstitute for Bird Populations, Pt. Reyes Station, CA.
Temple. S. A. and J. A. Weins. 1989. Bird populations and environmental changes: can birdsbe bio-markers? American Birds 43:260-270.

Cape Cod Monitoring Program page 49
COASTAL UPLANDS
Protocol: WHITE-TAILED DEER
Problem Statement/Justification• White-tailed deer are the dominant herbivore in forested ecosystems of Cape Cod National
Seashore and are an important regulator of ecosystem processes.• In high densities, deer may change the tree species composition of forests, species diversity
and abundance of herbaceous understories, and affect other species of birds and mammals.• In suburban landscapes, deer pose special management problems because they present safety
hazards to motorists, consume ornamental shrubs, and are perceived as agents in Lymedisease transmission.
Monitoring Questions and Approach
Monitor deer abundance coinciding with natural and human influencesAre white-tailed deer numbers increasing or are distribution patterns changing on the Seashore?• Monitor deer abundance (population index) and distribution.Is hunter effort and deer harvest rate changing and how are those changes affecting abundanceand composition of the herd?• Monitor harvest rate, sex, age, weight, antler-beam diameter of yearling males, and female
reproductive rates.
Monitor Ecosystem Responses to deer activityWhat are the effects and impending ecological changes from increasing deer densities?Are plant species being eliminated as a result of browsing by deer?How will changes in landscape and vegetation influence deer population dynamics?Are deer adversely effecting forest-nesting birds?• Monitor plant community structure and composition, browse availability, mast availability,
plant succession, and prevalence of exotic plant species.• Monitor landbird community composition, abundance, and reproductive rates.• Monitor deer/auto collisions rates, property damage and landowner complaints.
Management Applications• Gain support of hunters and non-hunters for deer population regulation by hunting or other
means.• Define management alternatives for regulating deer numbers and provide background
information for management planning.
References Cited
Porter, W. F., D. L. Garner and W.F. Seybold. 1994. Ecology and monitoring of white-tailed

Cape Cod Monitoring Program page 50
deer on Cape Cod National Seashore. Tech. Rpt. NPS/NAROSS/RTR-94/17.
Porter, W.F. 1991. White-tailed deer in eastern ecosystems: Implications for management andresearch in National Parks. Nat Resources Rpt. NPS/NRSUNY/NRR-91/05.
Shafer-Nolan, A. L. 1997. The science and politics of deer overabundance at Cuyahoga ValleyNational Recreation Area, Ohio. Wildlife Society Bulletin 25:457-461.
Walker, D. M. and W. S. Alverson. 1997. The white-tailed deer: a keystone herbivore. WildlifeSociety Bulletin 25:217-226

Cape Cod Monitoring Program page 51
COASTAL UPLANDS
Protocol: RED FOX AND COYOTE
Problem Statement/Justification• Red fox often become locally abundant in fragmented heterogeneous landscapes such as
Cape Cod.• Predation by red fox can be a major limiting factor on the productivity of ground nesting
birds such as the federally protected piping plover and least tern.• Coyotes influence red fox density and distribution when the two species are sympatric and
coyotes can affect neonatal survival rates of white-tailed deer fawns.• In human dominated landscapes, canids often prey on pets and are perceived as vectors of
disease transmission.
Monitoring Questions and ApproachDo landscape features, such as human settlements, influence fox and coyote abundance orpatterns of distribution?• Monitor vegetation composition and structure; forage availability (mast); small mammal and
invertebrate prey base (separate protocols).• Monitor abundance of free-ranging domestic dogs and cats.Is fox-coyote spatial avoidance operating and how is it effecting fox distribution and habitat use?• Monitor distribution and abundance (index) of red fox, coyote, and other medium-sized
mammal populations.Is red fox population abundance positively correlated with tern and plover nest predation rates?• Monitor causes of reproductive failure among ground nesting birds.• Monitor incidence of rabies and human/candid interactions.
Management Applications• Support identification of management alternatives for managing predators to enhance
survival and productivity of threatened species.• Facilitate public education concerning the role of canids in the Cape Cod ecosystem.• Support land management actions, such as the use of prescribed fire, that perpetuate
grassland and heathland habitats of value to canid prey species.
References Cited
Gese, E. M.. T. E. Stotts, and S. Grothe. 1996. Interactions between coyotes and red foxes inYellowstone National Park, Wyoming. J. Mammalogy 77:377-382.
Jones, K.L. 1997. Piping plover habitat selection, home range, and reproductive success atCape Cod National Seashore. Tech Rpt. NPS/NESO-RNR/NRTR/97-03. National ParkService, Boston, MA 96pp.
Cape Cod Monitoring Program page 52
Melvin, S. M., L. H. MacIvor, and C. R. Griffin. 1992. Predator enclosures: a technique toreduce predation at piping plover nests. Wildlife Society Bulletin 20:143-147.
Travaini, A., R. Laffitte, and M. Dilibes. 1996. Determining the relative abundance of Europeanred foxes by scent station methodology. Wildlife Society Bulletin 24:500-504
Reynolds, J. C. and S. C. Tapper. 1995. The ecology of the red fox in relation to small game inrural southern England. Wildlife Biology 2:105-117.
Sargent. A. B and S. H Allen. 1988. Observed interactions between coyotes and red foxes. J.Mammalogy 70:631-633.
Cape Cod Monitoring Program page 53
PARK-WIDE COASTAL ECOSYSTEM
Protocol: METEOROLOGY AND ATMOSPHERIC WET DEPOSITION
Problem Statement/Justification• The Ecology of Cape Cod, characterized by its terrain, soils, vegetation, and fauna are
governed, in part, by the prevailing, maritime climate (Winkler s.n.; Godfrey 1977; Strahler,1966).
• Human-induced global climate change is predicted to affect local weather patterns which willlikely influence the structure and function of ecosystem components near the coast:
• Storm surges of sufficient magnitude will alter the configuration of the shoreline and beachprofile (Zeigler et al. 1959, Giese and Aubrey 1987); enhance the retreat of escarpments anddune mobility; alter estuarine circulation, sedimentation, and inlet migration in estuaries(Zamermba and Leatherman 1984).
• Extended periods of drought or excess precipitation will influence seasonal water balanceaffecting wetlands, waterbodies, and groundwater supplies (Leblanc et al. 1986).
• Drought coupled with fire suppression generates increasing fuel loads and escalates firemanagement issues (Patterson et al. 1984).
• Wet deposition (precipitation, salt spray, fog) contribute to and eutrophication of waterbodies, inland wetlands estuaries (Jaworski et al. 1997), as well as enrich impoverished soilsof upland sites (Kimball et. al. 1988,van der Valk 1974)
Monitoring Questions and ApproachesMonitor standard meteorological parameters at "sentinel" fixed weather stationsWhat are the predominant trends in the weather pattern?• Measure wind speed/direction, air temperature, precipitation amount and duration, relative
humidity, total solar radiation, net radiation, and photosynthetically active radiation.What is the contribution and quality of atmospheric water chemistry inputs (precipitation andaerosols including salt spray and fog)?• Measure the wet deposition of H+, K+, Na+, Ca2+, Mg2+, NO3
-, Cl-, SO42-, PO4
3, Hg2+.What are the predominant trends in air quality?• Measure inputs of SO2, O3, CO, NO2, NO, NOx, PM-10, TSP, VOC.
Management Applications• A long term meteorological monitoring program is essential to evaluate how meteorological
agents of change influence the function of the coastal ecosystem.• A "sentinel" fixed weather station enables the park to participate in a national monitoring
network.
References Cited
Giese , G. S. and D. G. Aubrey, 1987. Bluff erosion on outer Cape Cod. Proceedings: Coastal

Cape Cod Monitoring Program page 54
Sediments '87,ASCE Vol. II: 1871-1876.
Godfrey, P.J. 1977. Climate, plant response, and development of dunes on barrier beaches alongthe U.S. East Coast. International Journal of Biometeorology 21: 203-215.
Jaworski, N. A., R. W. Howarth, and L. J. Helting. 1997. Atmospheric deposition of nitrousoxides onto the landscape contributes to coastal eutrophication in the northeastern UnitedStates. Environmental Science and Technology 31:1995-2004.
Strahler, A. N. 1966. A Geologist's View of Cape Cod. Natural History Press, Garden City, NY.115 pp.
Kimball, K. D., R. Jagels, G. A. Gordon, K. C. Weathers, and J. Carlisle. 1988. Differencesbetween New England coastal fog and mountain cloud water chemistry. Water, Air, andSoil Pollution 39:383-393.
LeBlanc, D. R.; Guswa, J. H.; Frimpter, M. H., and Londquist, C. J. 1985. Groundwaterresources of Cape Cod, Massachusetts. Boston, MA: U.S. Geological Survey;Hydrologic Investigations Atlas HA-692. 4 sheets.
Patterson, W. A.,III; Saunders, K. E., and Horton, L. J. 1984. Fire regimes of Cape CodNational Seashore. Denver, CO: U.S. Department of Interior, National Park
van der Valk, A. G. 1974. Mineral cycling in coastal foredune plant communities in CapeHatteras National Seashore. Ecology 55:1349-1358.
Winkler, M. G. s.n. Final Report. Geologic, Chronologic, Biologic and Chemical Evolution ofthe Ponds within the Cape Cod National Seashore: Historic and Prehistoric Trends inPond Acidity in the Cape Cod National Seashore as Interpreted from Diatom AssemblageChanges. National Park Service. Project No. CA1600-6-0004. 41 pp. + Tables &Figures.
Zeigler, J. M., C. R. Hayes, S. D. Tuttle. 1959. Beach changes during storms on Outer CapeCod, Massachusetts. Journal of Geology 3: 318-336.

Cape Cod Monitoring Program page 55
PARK-WIDE COASTAL ECOSYSTEM
Protocol: VEGETATION
Problem Statement/Justification• The vegetation of coastal landscapes is constantly changing in response to both natural and
human-induced factors, including storms, fire, ORV/pedestrian trampling, grazing,development, atmospheric inputs, and others (Godfrey et al. 1979, Ehrenfeld 1990).
• At Cape Cod, over three centuries of agrarian land use history (clearing, plowing, grazing)has interrupted vegetation development and altered vegetation structure and composition.
• Patterns of human development have necessitated fire suppression (Patterson et al. 1984,Dunwiddie and Adams 1995).
• Introduced pests, such as Brown Tailed Moth and Gypsy Moth are often responsible forextensive defoliation (Chokkalingam 1995).
• Non-native (Purple Loosestrife) and invasive species (Common Reed) often displace nativespecies.
• Alterations to surface water level or flow regime, modifies the habitat and vegetation in bothsalt marshes (Roman et al. 1995) and freshwater wetlands (Bachand and Patterson 1993).
• Regional trends toward a more homogeneous vegetation (Foster et al. 1998) may beaccompanied by a decline in biological diversity affecting ecosystem function (Chapin et al.1998).
• Rare and endangered species.
Monitoring Questions and ApproachMonitor Vegetation Change and Processes/Factors Contributing to ChangeHow do the structure and composition of vegetation change in response to natural processes(e.g., storms, salt spray, windthrow), site-specific human-related factors (e.g., fire suppression,altered water table level) or regional factors (e.g., acid deposition)?• Quantify characteristics of the landscape/habitat/environment (e.g., topography, soil
resources, and microclimate) that pertain to different sites.• Quantify coarse scale disturbance regime and site history (e.g., fire, clearing, grazing,
flooding, etc.) in terms of size, severity, frequency, and dispersion on the landscape.• Quantify vegetation structure, dominant physiognomy, floristic composition, and cover
across gradients of landscape representing a range in habitats and site history.
Management Applications• A network of permanent plots is essential to track and explain long-term changes in the
vegetation and the influence of humans.• Support land management decisions concerning the maintenance of natural and cultural
landscapes.• Foster an understanding of vegetation dynamics and support conservation plans for
underrepresented community types or rare species.
Cape Cod Monitoring Program page 56
References Cited
Bachand, R. R., and W. A. Patterson III. 1993. Identifying upland-to-wetland transitions in theCape Cod National Seashore: a multivariate approach to long-term monitoring. Pp. 283-295 in Proceedings of the 7th Conference on Research and Resource Management inParks and Public Lands: Partners in Stewardship, W. E. Brown and S. D. Veirs, (Eds.).The George Wright Society, Hancock, Michigan.
Chapin III, F. S., O. E. Sala, I. C. Burke, J. P. Grime, D. U. Hooper, W. K. Laurenoth, A.Lombard, H. A. Mooney, A. R. Mosier, S. Naeem, S. W. Pacala, J. Roy, W. L. Steffen,and D, Tilman. 1998. Ecosystem consequences of changing biodiversity: experimentalevidence and a research agenda for the future. Bioscience 48:45-53.
Chokkalingam, U. 1995. Recent disturbance-mediated vegetation change at Cape Cod NationalSeashore, Massachusetts. Technical Report NPS/NESO-RNR/NRTR/96-09. NationalPark Service, New England System Support Office, Boston, MA.
Dunwiddie, P.W., and M. B. Adams. 1995. Fire suppression and landscape change on outer CapeCod, 1600-1994. Technical Report NPS/NESO-RNR/NRTR/96-08. . National ParkService, New England System Support Office, Boston, MA.
Ehrenfeld, J. G. 1990. Dynamics and processes of barrier island vegetation. Reviews in AquaticSciences 2: 437-480.
Foster, D. F., G. Motzkin, and B. Slater. 1998. Land use history as long-term broad-scaledisturbance: regional forest dynamics in central New England. Ecosystems 1:96-119.
Godfrey, P. J., S. P. Leatherman, R. Zaremba. 1979. A geobotanical approach to classificationof barrier island systems. Pages 99-126 in Barrier Islands from the Gulf of St. Lawrenceto the Gulf of Mexico (S. P. Leatherman, ed.). Academic Press, NY, NY.
Patterson, W. A., III, K. E. Saunders, and L. J. Horton. 1984. Fire regimes of Cape CodNational Seashore. USDI, NPS Office of Scientific Studies, Report OSS 83-1.
Roman, C. T., R. W. Garvine, and J. W. Portnoy. 1995. Hydrologic modeling as a predictivebasis for ecological restoration of salt marshes. Environmental Management 19: 559-566.

Cape Cod Monitoring Program page 57
PARK-WIDE COASTAL ECOSYSTEM
Protocol: BASELINE GROUNDWATER HYDROLOGY AND QUALITY
Problem Statement/Justification• High soil permeability and the unconfined nature of the outer Cape Cod aquifer dictate that
the elevation and slope of the groundwater table is crucial to understanding present landscapepatterns.
• An understanding of water table levels is required for predicting the effects of natural andhuman-induced hydrological changes (e.g., sea level rise, drought conditions, municipalgroundwater withdrawal) and the fate of contaminants (e.g., landfill leachate) (Weiskel andHowes 1992, Martin 1993, Urish et al. 1993).
• Groundwater-delivered nutrients are a major source of nutrients loading to Cape Codestuaries and kettle ponds (Giblin and Gaines 1990, Portnoy et al., in press).
• Freshwater baseflow in Seashore river valley estuarine systems (e.g., Herring River, PametRiver) is from groundwater discharge.
• Sources of groundwater contamination (excess nutrients, metals, organics) within theSeashore include, landfills, wastewater treatment facilities, development, and spills (Persky1986).
Monitoring Questions and Approaches
Monitor Groundwater LevelsWhat are the seasonal and inter-annual fluctuations in groundwater levels throughout theSeashore?Is the existing network of index wells (maintained by the Cape Cod Commission) appropriate, atspatial and temporal scales, for park-wide monitoring of groundwater elevation and appropriateto support development of hydrologic groundwater models?Does the groundwater level monitoring network effectively evaluate sites of ecologicalsensitivity to hydrologic change (e.g., freshwater wetlands, ponds, estuaries), sites withartificially increased recharge due to interbasin transfers (e.g., Provincetown Center, ColesNeck), outlying park sites (e.g., Griffin Island), and sites of known or anticipated sources ofcontamination (e.g., downgradient of landfills, park boundaries where development is proposed).• Review data associated with existing network of monitoring wells within the Seashore and
vicinity, and data from wells associated with research, modeling and monitoring programsconducted over the years by the NPS, USGS, Cape Cod Commission and others. Based onthis quantitative review, recommend a network of wells and sampling protocol.
Monitor Groundwater QualityWhat is the magnitude of point source and concentrated non-point source contaminant sourceson groundwater quality?What are temporal and spatial trends in contaminant source plumes?What are threshold levels of particular water quality constituents, upon which managementactions should be implemented?
Cape Cod Monitoring Program page 58
• Review existing and historic groundwater quality data sets• Identify sites for groundwater quality monitoring (e.g., landfills, wastewater facilities,
residential development, baseline reference locations).• Determine appropriate frequency of sampling (e.g., monthly, seasonal, annual).• What water quality constituents should be monitored (e.g., nutrients, conductivity, VOCs,
etc.)?
Management Applications• The network of groundwater level monitoring wells is essential to support groundwater
models aimed at predicting impacts of groundwater withdrawals, interbasin transfers,seawater intrusion, stream baseflow, and contaminant loading.
• Understanding changes in vegetation, water level fluctuations in ponds and wetlands andstream discharge are all directly linked to groundwater levels and hydrology.
• Work cooperatively with local governments to establish land use practices that reducegroundwater contamination.
References Cited
Giblin, A. E., and A.G. Gaines. Nitrogen inputs to a marine embayment: the importance ofgroundwater. Biogeochemistry 10: 309-328.
Martin, L. 1993. Investigation of effects of groundwater withdrawals from the Pamet andChequesett aquifers, Cape Cod National Seashore. Technical Report, NPS WaterResources Division, Ft. Collins, CO. NPS/NRWRD/NRTR-93/15.
Persky, J.H. 1986. The relation of groundwater quality to housing density, Cape Cod,Massachusetts. Water Resources Investigations Report 86-4093, USGS, Boston, MA.
Portnoy, J. W., B. L. Nowicki, C. T. Roman, and D. W. Urish. IN PRESS. The discharge ofnitrate-contaminated groundwater from developed shoreline to marsh-fringed estuary.Water Resources Research.
Urish, D. W., M J. O’Reilly, R. M. Wright, and R. K. Frohlich. 1993. Assessment of groundand surface water impacts: Provincetown landfill and septic disposal site, Provincetown,Massachusetts. Technical Report, NPS Coastal Research Center, Univ. RI.NPS/NARURI/NRTR-93/01. 243 pp.
Weiskel, P. K. and B. L. Howes. 1992. Differential transport of sewage-derived nitrogen andphosphorous through a coastal watershed. Environmental Science & Technology 26:352-360.

Cape Cod Monitoring Program page 59
Protocol Summary Statements to be developed in conjunction with upcoming workshops• Land Use• Visitor Use• Data Management• Ecosystem Modeling