conceptual parameters necessary for modeling wettability
TRANSCRIPT

Scholars' Mine Scholars' Mine
Masters Theses Student Theses and Dissertations
Fall 2016
Conceptual parameters necessary for modeling wettability Conceptual parameters necessary for modeling wettability
alteration in an enhanced smart brine-chalk system alteration in an enhanced smart brine-chalk system
Ahmed Abdulkareem Hussein Albahrani
Follow this and additional works at: https://scholarsmine.mst.edu/masters_theses
Part of the Petroleum Engineering Commons
Department: Department:
Recommended Citation Recommended Citation Albahrani, Ahmed Abdulkareem Hussein, "Conceptual parameters necessary for modeling wettability alteration in an enhanced smart brine-chalk system" (2016). Masters Theses. 7589. https://scholarsmine.mst.edu/masters_theses/7589
This thesis is brought to you by Scholars' Mine, a service of the Missouri S&T Library and Learning Resources. This work is protected by U. S. Copyright Law. Unauthorized use including reproduction for redistribution requires the permission of the copyright holder. For more information, please contact [email protected].

CONCEPTUAL PARAMETERS NECESSARY
FOR MODELING WETTABILITY ALTERATION IN
AN ENHANCED SMART BRINE-CHALK SYSTEM
BY
AHMED ABDULKAREEM HUSSEIN ALBAHRANI
A THESIS
Presented to the Faculty of the Graduate School of the
MISSOURI UNIVERSITY OF SCIENCE AND TECHNOLOGY
In Partial Fulfillment of the Requirements for the Degree
MASTER OF SCIENCE IN PETROLEUM ENGINEERING
2016
Approved by
Dr.Ralph Flori, Advisor
Dr.Shari Dunn Norman
Dr. Mingzhen Wei

© 2016
Ahmed Abdulkareem Hussein Albahrani
All Rights Reserved

iii
ABSTRACT
Achieving higher recovery of oil from proven carbonate reserves around the world
is not an easy task. One promising new method, especially for carbonate reservoirs, is the
use of “Smart Water” technology, which is an injection water with carefully determined,
optimal ionic composition and salinity. Recent experiments have shown good recovery
results, but the mechanism of wettability alteration by this fluid are still not well
understood. The goal of this study is to review the high and optimal salinity and ionic
composition literature plus perform dimensional analysis of key variables in order to shed
light on the physical and chemical factors of improved recovery in carbonates. This work
will discuss physical and thermal principles and relationships of flow and heat distributions
in the presence of the rock-fluid reaction. A series of logical connection among plenty of
physical and chemical principles using Buckingham Pi theorem in the dimensionless
analysis has proposed to model and find a general formula that can best fit to describe the
nature of the resulting changes accompanied with heat and flow transport through a porous
medium in the presence of an abundance of sulfate concentrations. The primary purpose
of this work is to show the factors that can control the wettability alteration using the chalk-
sulfate system using the proposed general formula and predict the likely phenomenon such
as undesirable mineral deposition, diagnosing the diffusion reduction, and fingering
possibility. This work will show the numerical estimation of the contact angles of
wettability alteration for two crude oils, oil A and B using smart brine contains four times
sulfate concentration at different temperatures 70 C°, 90 C°, 100 C°, and 120 C° reinforced
by Buckingham Pi theorem and series of proven empirical correlations used to derive the
general formula of wettability alteration mechanism in carbonates.

iv
ACKNOWLEDGMENTS
Firstly, I would like to express my sincere gratitude to my advisor Dr. Ralph Flori
for the continuous support of my Msc. Study and related research, for his patience,
motivation, and immense knowledge. His guidance helped me in all the time of
investigation and writing of this thesis.
Besides my advisor, I would like to thank the rest of my thesis committee: Dr. Shari
Dunn Norman, Dr. Mingzhen Wei, for their insightful comments and encouragement, but
also for the hard question which incented me to widen my research from various
perspectives.
Last but not the least, I would like to thank my wife for her patience and my family:
my parents and to my brothers and sisters for supporting me spiritually throughout writing
this thesis.

v
TABLE OF CONTENTS
Page
ABSTRACT . . . . . . . . . . . . . . . . . . . . . . . . . . . . . . . . . . . . . . . . . . . . . . . . . . . . . . . . . . . . iii
ACKNOWLEDGMENTS . . . . . . . . . . . . . . . . . . . . . . . . . . . . . . . . . . . . . . . . . . . . . . . . . . . . . . iv
LIST OF ILLUSTRATIONS . . . . . . . . . . . . . . . . . . . . . . . . . . . . . . . . . . . . . . . . . . . . . . vii
LIST OF TABLES . . . . . . . . . . . . . . . . . . . . . . . . . . . . . . . . . . . . . . . . . . . . . . . . . . . . . . . . x
SECTION
1. INTRODUCTION . . . . . . . . . . . . . . . . . . . . . . . . . . . . . . . . . . . . . . . . . . . . . . 1
1.1 HISTORY OF CONTROLLED SALINITY WATERFLOODING. . . . 1
1.2 WETTABILITY ALTERATION INTERPRETATION. . . . . . . . . . . . . . . . 6
1.3 WETTABILITY DETERMINATION . . . . . . . . . . . . . . . . . . . . . . . . . . . . .13
1.4 OBJECTIVE OF THIS WORK . . . . . . . . . . . . . . . . . . . . . . . . . . . . . . .15
2. EXAMPLE PROJECT: EKOFISK OIL FIELD . . . . . . . . . . . . . . . .. . . . . . . 17
2.1 WATER INJECTION PILOT PROJECTS OF EKOFISK FIELD . . . . 18
2.2 SUBSIDENCE PROBLEM IN EKOFISK FIELD . . . . . . . . . . . . . . . . . 20
3. QUANTITIVE AND QUALITIVE DESCRIPTION OF
WETTABILITY ALTERATION IN CARBONATES . . . . . . . . . . . . . . . . . . 22
3.1. SPONTANEOUCE IMBIBITION . . . . . . . . . . . . . . . . . . . . . . . . . . . . . .24
3.2. CHROMATOGRAPHY TEST . . . . . . . . . . . . . . . . . . . . . . . . . . . . . . . . 25
3.3. CHROMATOGRAPHY MECHANISM . . . . . . . . . . . . . . . . . . . . . . . . . 26
3.4. AREA BETWEEN CURVES OF CHROMATOGRAPHY TEST . . . . .27
3.5. THE BRINES AND CRUDE OILS USED IN MODELING . . . . . . . . . .33
3.6. COREFLOODING APPARATUS AND PROCEDURE . . . . . . . . . . . . .36
4. PREFACE ABOUT HEAT AND THERMAL SYSTEMS . . . . . . . . . . . . . . 38

vi
4.1 THE HEAT . . . . . . . . . . . . . . . . . . . . . . . . . . . . . . . . . . . . . . . . . . . . . . . .39
4.2 THE SYSTEM AND THE SURROUNDINGS . . . . . . . . . . . . . . . . . . . . 40
4.3 THE TYPES OF THERMODYNAMIC SYSTEMS . . . . . . . . . . . . . . . . 41
4.4 HEAT CAPACITY AND SPECIFIC HEAT . . . . . . . . . . . . . . . . . . . . . . 41
4.5 HEAT CONSERVATION IN SYSTEM . . . . . . . . . . . . . . . . . . . . . . . . . 42
5. THE EXPERIMENTAL RELATIONSHIPS RELATED TO THE
POROUS MEDIUM AND THE FLOW PROPERTIES . . . . . . . . . . . . . . . . 43
5.1 SPECIFIC SURFACE AREA DEFINITION . . . . . . . . . . . . . . . . . . . . . .43
5.2 THE TORTUOSITY . . . . . . . . . . . . . . . . . . . . . . . . . . . . . . . . . . . . . . . . .43
5.3 KOZENY-CARMAN EQUATION . . . . . . . . . . . . . . . . . . . . . . . . . . . . . 44
5.4 STOKES-EINSTEIN EQUATION . . . . . . . . . . . . . . . . . . . . . . . . . . . . . .44
5.5 HALL COMPRESSIBILITY EQUATION . . . . . . . . . . . . . . . . . . . . . . . 46
5.6 OIL WET AREA AND ACID NUMBER . . . . . . . . . . . . . . . . . . . . . . . . 46
6. BUCKINGHAM PI THEOREM IN DIMENSIONLESS ANALYSIS . . . . .48
6.1 FIRST ATTEMPT OF MODELLING WETTABILITY
ALTERATION IN CARBONATES . . . . . . . . . . . . . . . . . . . . . . . . . . . . .48
6.2 THE GENERAL WETTABILITY ALTERATION FORMULA
APPROACH . . . . . . . . . . . . . . . . . . . . . . . . . . . . . . . . . . . . . . . . . . . . . . . 53
7. THE CONCLUSION AND RECOMMENDATIONS . . . . . . . . . . . . . . . . . 62
BIBLIOGRAPHY . . . . . . . . . . . . . . . . . . . . . . . . . . . . . . . . . . . . . . . . . . . . . . . . . . . . . . . . . . . .87
VITA . . . . . . . . . . . . . . . . . . . . . . . . . . . . . . . . . . . . . . . . . . . . . . . . . . . . . . . . . . . . . . . . . . . . . . 91
vii
LIST OF ILLUSTRATIONS
Figure Page
1.1 EOR methods by lithology . . . . . . . . . . . . . . . . . . . . . . . . . . . . . . . . . . . . . . . . . . . . . 1
1.2 Proposed chemical mechanism for wettability alteration of chalk . . . . . . . . . . . . . . . .10
1.3 Typical behavior of Interfacial tension versus Temperature . . . . . . . . . . . . . . . . . . . 11
1.4 Typical behavior of Interfacial tension vs. Brine concentration . . . . . . . . . . . . . . . . 12
1.5 Typical behavior of Interfacial tension vs. API degree at various temperatures . . . . 13
1.6 Interfacial forces at an interface between two immiscible fluids and a solid . . . . . .14
1.7 Wettability differentiation in Rock . . . . . . . . . . . . . . . . . . . . . . . . . . . . . . . . . . . . . .15
2.1 Geographical map of Ekofisk oil field location in the North Sea . . . . . . . . . . . . . . .17
2.2 Distribution of oil producers and water injectors of Ekofisk field . . . . . . . . . . . . . .19
3.1 The typical response of drainage and imbibition processes in carbonate . . . . . . . . 24
3.2 The chromatography wettability analysis at 90 cº of different synthetic
brines with SCN- . . . . . . . . . . . . . . . . . . . . . . . . . . . . . . . . . . . . . . . . . . . . . . . . . . . .27
3.3 Digitized C/CO SCN. SWONaCl-4So4 (SWK#5) curve and Excel curve . . . . . . . . .28
3.4 The digized C/CO So4. (SWK#5) and Excel curve . . . . . . . . . . . . . . . . . . . . . . . . .29
3.5 The intersection points between SCN- and So4-2 curves . . . . . . . . . . . . . . . . . . . . . .30
3.6 The digitzed C/CO So4. Clean reference core and the Excel curve . . . . . . . . . . . . 31
3.7 The intersection points between clean core and SCN- curves . . . . . . . . . . . . . . . . . 32
3.8 The typical core flooding apparatus . . . . . . . . . . . . . . . . . . . . . . . . . . . . . . . . . . . . . 37
4.1 Oil Recovery vs. Time on spontaneous imbibition . . . . . . . . . . . . . . . . . . . . . . . . . 39
5.1 The acid numbers differences with oil recovery . . . . . . . . . . . . . . . . . . . . . . . . . . . .47
7.1 Contact Angle vs. System heat energy, Oil B, 70 C°. . . . . . . . . . . . . . . . . . . . . . . . 62

viii
7.2 Contact Angle vs. Ed . . . . . . . . . . . . . . . . . . . . . . . . . . . . . . . . . . . . . . . . . . . . . . . . 63
7.3 θow vs. Dratio oil B, 70 C° . . . . . . . . . . . . . . . . . . . . . . . . . . . . . . . . . . . . . . . . . . . . .64
7.4 Dratio vs. µratio, oil B, 70 C° . . . . . . . . . . . . . . . . . . . . . . . . . . . . . . . . . . . . . . . . . . . . 65
7.5 Brine density vs. Avg. Temperature oil B, 70 C°. . . . . . . . . . . . . . . . . . . . . . . . . . .66
7.6 Brine density vs. Ed, oil B, 70 C°. . . . . . . . . . . . . . . . . . . . . . . . . . . . . . . . . . . . . . . 66
7.7 Oil viscosity vs. Ed, oil B, 70 C°. . . . . . . . . . . . . . . . . . . . . . . . . . . . . . . . . . . . . . . .67
7.8 Viscosity ratio vs. Avg. Temperature, oil B, 70 C°. . . . . . . . . . . . . . . . . . . . . . . . . .68
7.9 Interfacial tension vs. Oil recovery oil B, 70 C° . . . . . . . . . . . . . . . . . . . . . . . . . . . 68
7.10 Contact Angle vs. The system heat, oil B, 90 C° . . . . . . . . . . . . . . . . . . . . . . . . . . .69
7.11 Contact Angle vs. Ed, oil B, 90 C° . . . . . . . . . . . . . . . . . . . . . . . . . . . . . . . . . . . . . .70
7.12 Brine density vs. Avg. Temp., oil B, 90 C°. . . . . . . . . . . . . . . . . . . . . . . . . . . . . . . 70
7.13 Brine density vs. Disp. Eff., oil B, 90 C° . . . . . . . . . . . . . . . . . . . . . . . . . . . . . . . . 71
7.14 Viscosity ratio vs. D ratio. Oil B, 90 C° . . . . . . . . . . . . . . . . . . . . . . . . . . . . . . . . . 72
7.15 Contact Angle vs. D ratio, oil B, 90 C°. . . . . . . . . . . . . . . . . . . . . . . . . . . . . . . . . . 73
7.16 Dratio vs. Avg. Temp. Oil B, 90 C° . . . . . . . . . . . . . . . . . . . . . . . . . . . . . . . . . . . . 73
7.17 Oil Recovery vs. Interfacial tension dyne/cm at 90 C°. . . . . . . . . . . . . . . . . . . . . . 74
7.18 Contact Angle vs. Q system, oil A, 100 C°. . . . . . . . . . . . . . . . . . . . . . . . . . . . . . . 75
7.19 Contact Angle vs. Ed, oil A, 100 C° . . . . . . . . . . . . . . . . . . . . . . . . . . . . . . . . . . . . 75
7.20 Brine density vs. Avg. Temp., Oil A, 100 C° . . . . . . . . . . . . . . . . . . . . . . . . . . . . .76
7.21 Viscosity ratio vs. Avg. Temp., oil A, 100 C° . . . . . . . . . . . . . . . . . . . . . . . . . . . . 77
7.22 D ratio vs. Avg. Temp., Oil A, 100 C° . . . . . . . . . . . . . . . . . . . . . . . . . . . . . . . . . .77
7.23 Contact Angle vs. D ratio, oil A, 100 C° . . . . . . . . . . . . . . . . . . . . . . . . . . . . . . . . 78
7.24 D ratio vs. Viscosity ratio, oil A, 100 C° . . . . . . . . . . . . . . . . . . . . . . . . . . . . . . . . 79
7.25 Oil recovery vs. Interfacial tension oil A, 100 C° . . . . . . . . . . . . . . . . . . . . . . . . . .80

ix
7.26 Contact Angle vs. Qsys, oil A, 120 C°. . . . . . . . . . . . . . . . . . . . . . . . . . . . . . . . . . .81
7.27 Contact Angle vs. Ed oil A, 120 C°. . . . . . . . . . . . . . . . . . . . . . . . . . . . . . . . . . . . .81
7.28 Brine density vs. Ed oil A, 120 C° . . . . . . . . . . . . . . . . . . . . . . . . . . . . . . . . . . . . . 82
7.29 Dratio vs. Viscosity ratio, oil A, 120 C° . . . . . . . . . . . . . . . . . . . . . . . . . . . . . . . . . 83
7.30 Viscosity ratio vs. Avg. Temp., oil A, 120 C°. . . . . . . . . . . . . . . . . . . . . . . . . . . . . 84

x
LIST OF TABLES
Table Page
2.1 The overall characteristic information of Ekofisk field . . . . . . . . . . . . . . . . . . . . . . 18
3.1 Experimental and Calculated values on chromatography test . . . . . . . . . . . . . . . . . . 33
3.2 Petrophysical and initial conditions of Ekofisk chalk . . . . . . . . . . . . . . . . . . . . . . . .33
3.3 The typical brines used on chalk . . . . . . . . . . . . . . . . . . . . . . . . . . . . . . . . . . . . . . . .35
3.4 Typical crude oils used with chalk . . . . . . . . . . . . . . . . . . . . . . . . . . . . . . . . . . . . . . 36
4.1 The standard specific heats used in calculations . . . . . . . . . . . . . . . . . . . . . . . . . . . .42
6.1 The major physical quantities and its dimensions . . . . . . . . . . . . . . . . . . . . . . . . . . .48
6.2 The first model calculations by Buckingham Pi theorem . . . . . . . . . . . . . . . . . . . . . 52
6.3 Part 1 calculations of Oil B, AN= 0.5 at T= 70 C°. . . . . . . . . . . . . . . . . . . . . . . . . . . 56
6.4 Part 2 calculations of Oil B, AN = 0.5 at T= 70 C° . . . . . . . . . . . . . . . . . . . . . . . . . . 56
6.5 Part 3 calculations of Oil B, AN = 0.5 at T= 70 C° . . . . . . . . . . . . . . . . . . . . . . . . . . 56
6.6 Part 1 calculations of Oil B, AN=0.5 at T= 90 C° . . . . . . . . . . . . . . . . . . . . . . . . . . . 57
6.7 Part 2 calculations of Oil B, AN=0.5 at T= 90 C° . . . . . . . . . . . . . . . . . . . . . . . . . . . 57
6.8 Part 3 calculations of Oil B, AN=0.5 at T= 90 C ° . . . . . . . . . . . . . . . . . . . . . . . . . .58
6.9 Part 1 calculations of Oil A, AN=2 at T=100 C°. . . . . . . . . . . . . . . . . . . . . . . . . . . 59
6.10 Part 2 calculations of Oil A, AN=2 at T=100 C°. . . . . . . . . . . . . . . . . . . . . . . . . . . 59
6.11 Part 3 calculations of Oil A, AN=2 at T=100 C°. . . . . . . . . . . . . . . . . . . . . . . . . . . 60
6.12 Part 1 calculations of Oil A, AN=2 at T=120 C°. . . . . . . . . . . . . . . . . . . . . . . . . . . .60
6.13 Part 2 calculations of Oil A, AN=2 at T=120 C°. . . . . . . . . . . . . . . . . . . . . . . . . . . .60
6.14 Part 3 calculations of Oil A, AN=2 at T=120 C°. . . . . . . . . . . . . . . . . . . . . . . . . . . 61

1. INTRODUCTION
1.1 HISTORY OF CONTROLLED SALINITY WATERFLOODING
The latest studies showed that the carbonate reservoirs around the world have more
than 50% of proven oil reserves. (Sheng, 2013), has stated that about 60% of remaining oil
and 40 % of gas reserves are still existing in carbonate reservoirs globally. In last decades,
the carbonate reservoirs have known of its 10% of primary recovery as well as its
inadequate response to secondary recovery using water injection (Xie et al., 2004).
The reason why carbonate reservoirs consider not efficient is due to oil or
mixed wet, various properties of rock, low permeability, and natural
fractures (Cuiec, 1984). Figure 1.1 below, shows 1,507 Global EOR projects, and gas
injection is the most conventional EOR Method from 18% of proper EOR Methods used
in carbonate (Alvarado and Manrique, 2010).
Figure 1.1. EOR methods by lithology (Alvarado and Manrique, 2010)
2
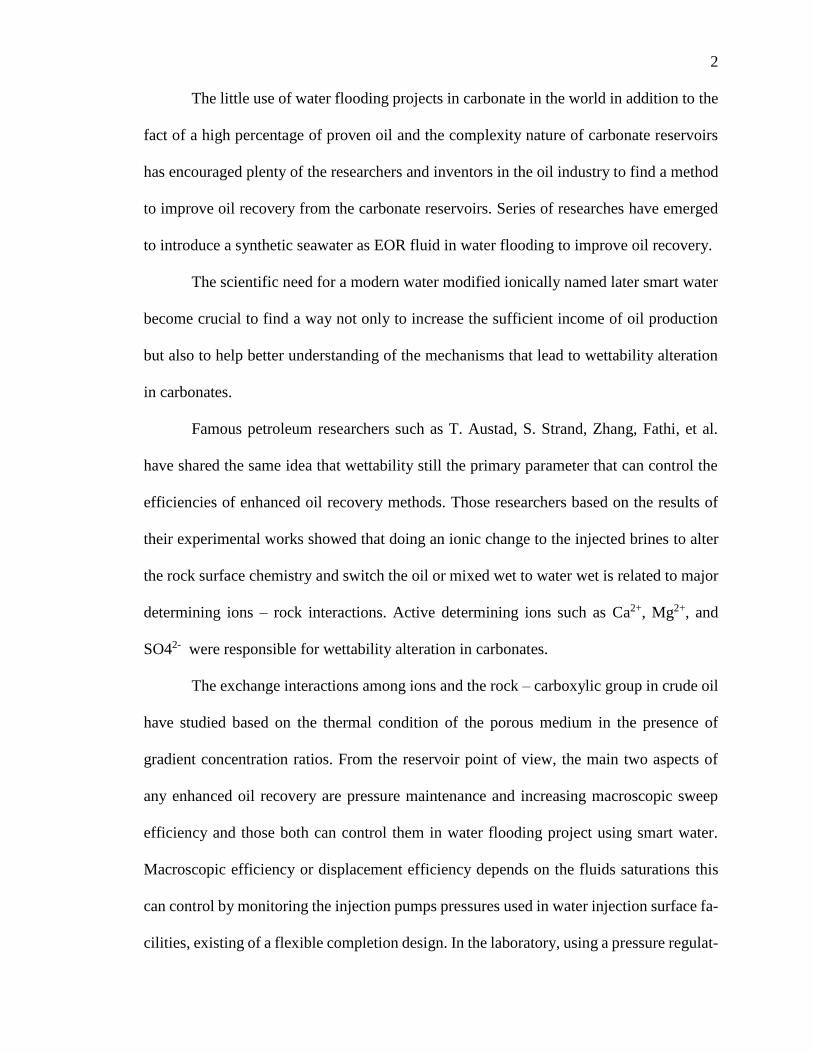
The little use of water flooding projects in carbonate in the world in addition to the
fact of a high percentage of proven oil and the complexity nature of carbonate reservoirs
has encouraged plenty of the researchers and inventors in the oil industry to find a method
to improve oil recovery from the carbonate reservoirs. Series of researches have emerged
to introduce a synthetic seawater as EOR fluid in water flooding to improve oil recovery.
The scientific need for a modern water modified ionically named later smart water
become crucial to find a way not only to increase the sufficient income of oil production
but also to help better understanding of the mechanisms that lead to wettability alteration
in carbonates.
Famous petroleum researchers such as T. Austad, S. Strand, Zhang, Fathi, et al.
have shared the same idea that wettability still the primary parameter that can control the
efficiencies of enhanced oil recovery methods. Those researchers based on the results of
their experimental works showed that doing an ionic change to the injected brines to alter
the rock surface chemistry and switch the oil or mixed wet to water wet is related to major
determining ions – rock interactions. Active determining ions such as Ca2+, Mg2+, and
SO42- were responsible for wettability alteration in carbonates.
The exchange interactions among ions and the rock – carboxylic group in crude oil
have studied based on the thermal condition of the porous medium in the presence of
gradient concentration ratios. From the reservoir point of view, the main two aspects of
any enhanced oil recovery are pressure maintenance and increasing macroscopic sweep
efficiency and those both can control them in water flooding project using smart water.
Macroscopic efficiency or displacement efficiency depends on the fluids saturations this
can control by monitoring the injection pumps pressures used in water injection surface fa-
cilities, existing of a flexible completion design. In the laboratory, using a pressure regulat-

3
or in the outlet stream of the core holder chamber which can prevent the within fluids inside
the core samples used to evaporate can keep the confining pressure within the pore spaces
of the core in constant.
Water flooding using smart brines in which both relative permeability and capillary
pressure can test considered as an inexpensive method compared with the other EOR
methods; it can accomplish oil recovery in the range of 30% to 40%.The secret key is to
adjust the brine concentration through increasing the effective determining ion
concentration to magnitudes that compatible with acidity degree of the aged oil within the
core samples. (Fathi et al., 2010), have declared that the salinity and ionic composition of
injected brines have the influences on wettability alteration and the improvement of oil
recovery.
Before Fathi et al., Bernard (1967) was one of the first to show that the salinity of
flood water could affect oil recovery. Al Mumen (1990) investigated the effect of injected
brine salinity on oil recovery using Berea Sandstone core samples; he showed an increase
in oil recovery with enhancing the salinity of the injected water in the absence of clay.
Jadhunandan ( 1990 ), investigated the effect of the ionic composition of injected brine on
oil recovery using Berea core samples and low salinity brine; he observed improved in oil
recovery and attributed that improvement to changes in rock wettability.
Although most of the research on the emerging of low salinity flooding method has
focused on Sandstone reservoirs, laboratory core flooding tests, and single-well trails
revealed that low salinity flooding can also be applied to carbonate reservoirs (Bagci et al
, 2001, Alotaibi et al, 2009,Vledder et al, 2010, Yousef et al, 2010, 2011, 2012, 2014,
Strand et al, 2006, Al-Harrasi et al, 2012, Al attar et al, 2013, Kwak et al, 2014 ). That was
supported by unexpected observed oil recovery from Ekofisk field, a fractured chalk rese-

4
rvoir, upon injection of flooding of North seawater (Sylte et al., 1988). (Zekri et al., 2011),
studied the effect of low salinity on wettability and oil recovery of carbonate and sandstone
formations and concluded that low salinity could apply to carbonate rocks.
The authors above also added that the performance of low salinity depends on the
carbonate type, chalky or microcrystalline limestone. Several investigations were carried
out using chalk and limestone rock samples to understand the recovery mechanisms leading
to the incremental oil recovery due to injection of low salinity water.
As a result of these investigation it was proposed that the wettability of the chalk
rock was changing to a more water-wet condition, and this change in wettability alteration
is due to the presence of potential determining ions ( PDI) and their relative concentrations
in the injected water( Austad et al., 2005, RezaeiDoust et al., 2009). Austad et al., 2005,
suggested SO42-, Ca2+, and Mg2+ as potential determining ions for chalk. Furthermore,
these ions (SO42-, Ca2+, and Mg2+) are proposed to be responsible for surface wettability
alteration, and it is not clear if that is the case with other carbonate rocks or only chalk due
to the lack of systematic investigation on surface analysis level( Evgeny, 2014 ).
(Austad et al., 2005), proposed a wettability alteration mechanism according to
which sulfate ions will adsorb onto the chalk surface and lower the net positive charge to
facilitate some desorption of negatively charged polar components (carboxylic material).
They further stated that the adsorption of sulfate ions onto the chalk surface is
enhanced when the temperature increased from 100 C° to 120 C°. They also indicated that
the concentration ratio [SO42- ]/[ Ca2+] in the injected water to be a major factor. It realized
from the depletion of the SO42- ions in the effluent from flooding chalk cores with seawater
that has a ratio of [SO42- ]~2[ Ca2+].They attributed the depletion of SO42- partly to the
adsorption of SO42- ions on the chalk surface (Austad et al., 2005).Imbibition tests condu-

5
cted on modified carbonate rocks with stearic acid saturated initially with formation brine
accompany with an imbibition process with fluids containing Mg2+ or SO42-, at the same
concentration as the injected seawater, showed that the highest oil recovery obtained when
Mg2+ is present in the imbibing fluids, which ruled out the above suggested
mechanism(Karoussi and Hamouda,2008).
Further core flooding tests performed using combination of different injection
rates, temperature, crude oil types, core plugs and compositions of the injected brine,
revealed that the incremental oil recovery with the aid of sulfate ions cannot be explained
just by the rock wettability alteration, and injection of brine rich in sulfate ions may lead
to additional oil recovery even under completely water-wet conditions. Not only this, but
crude oil composition type was found to play a dominant role in the effect of brine
composition on the incremental recovery in addition to the injection rate (Zahid, 2012).
Core flooding experiments in carbonates based on advanced ion management
principle has achieved the best quality regarding oil recovery compared with carbonates
with formation water; advanced ion management purpose is to improve oil recovery by
adding or removing ions to the injected brines.
One of the biggest challenges that might face the core flooding project in carbonates
is the reverse reactions between brine and Anhydrite or Gypsum (Taber and Martin, 1983).
Although that challenge, that belief gradually decayed when an attractive amount of oil has
recovered from a fractured chalk reservoir of Ekofisc field in north sea (Sylte et al., 1988;
Hallenbeck et al., 1991).
The published important papers related to spontaneous imbibition and laboratory
measurements has conducted at the University of Stavanger by Austad and his co - workers.
The main aim of those researchers is to find a way to improve the imbibition processes ac-

6
company with adding different sulfate concentrations to seawater within chalk cores in
addition to using different crude oil have aged at different ages to establish an oil - wet
case.
Although the majority of core flooding test have carried out on chalk, a logical
proof has been reached using spontaneous imbibition experiments on limestone and
fractured limestone.Not only chalk was the raw sample of spontaneous imbibition
experiments but also limestone had used as well. Ligthelm (2009), has estimated the oil
recovery in about 17% of OOIP of complete recovery using core samples of limestone
from the middle east. However, Hogenson et al. (2005) observed that even using sulfate in
different concentrations as well as adjusted crude oils has no impact on oil recovery for an
unfractured limestone.
The topic of using different brines in various salinity has also encouraged plenty of
the researchers to examine the improvement of oil recovery in carbonates using low salinity
brines. (Yousef et al. 2010) has observed a real improvement in oil recovery on carbonate
cores from the middle east around 18-19% OOIP.
In conclusion, water flooding using modified injection brines can give accredited
additional oil recovery from carbonate reservoirs regardless the type of carbonate rock by
adjusting the ionic composition of brines within valid ranges of salinity. The proven
experimental results, as well as the great effort in series of investigation works, encourage
the researchers increasingly to seek deeply about the unknown and unproven aspects that
need interpretation about wettability mechanisms in carbonates.
1.2 WETTABILITY ALTERATION INTERPRETATION
Carbonate rocks such as chalk, limestone, dolomite have positive charge wet
surfaces to oil. The reason why carbonate rocks have considered as oil wet rocks is the
basic structure of the carbonates which positively charged. On the other hand, oil has found
7
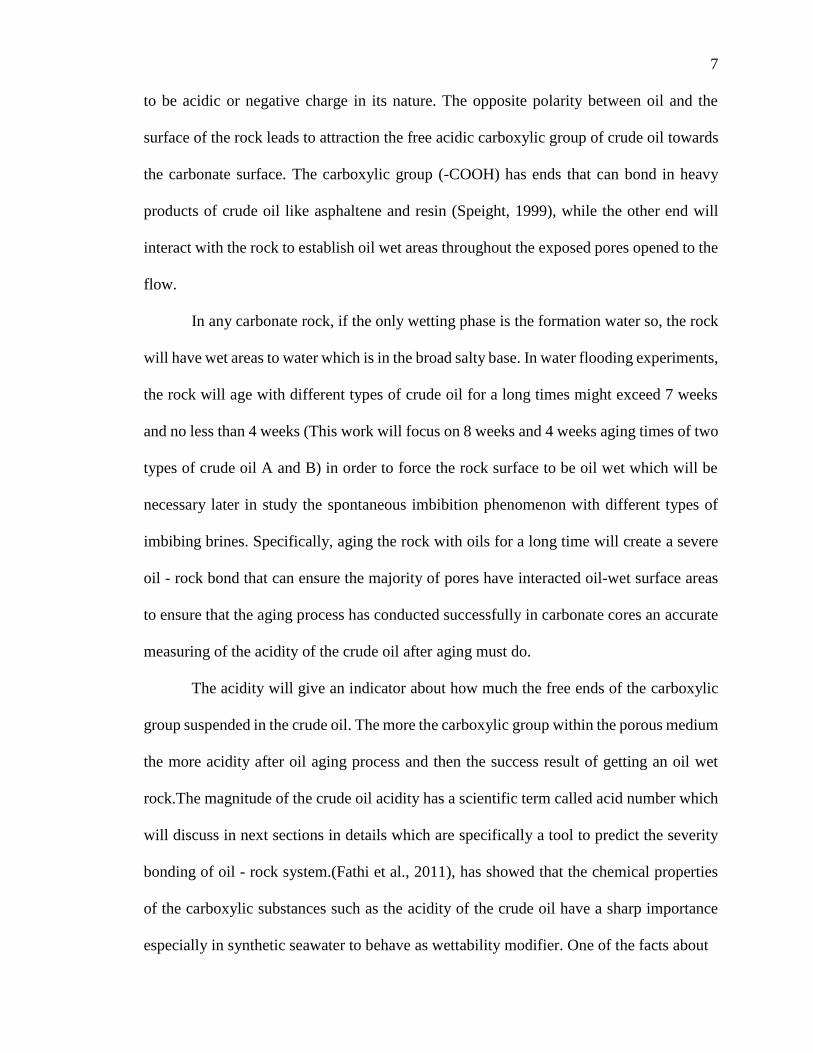
to be acidic or negative charge in its nature. The opposite polarity between oil and the
surface of the rock leads to attraction the free acidic carboxylic group of crude oil towards
the carbonate surface. The carboxylic group (-COOH) has ends that can bond in heavy
products of crude oil like asphaltene and resin (Speight, 1999), while the other end will
interact with the rock to establish oil wet areas throughout the exposed pores opened to the
flow.
In any carbonate rock, if the only wetting phase is the formation water so, the rock
will have wet areas to water which is in the broad salty base. In water flooding experiments,
the rock will age with different types of crude oil for a long times might exceed 7 weeks
and no less than 4 weeks (This work will focus on 8 weeks and 4 weeks aging times of two
types of crude oil A and B) in order to force the rock surface to be oil wet which will be
necessary later in study the spontaneous imbibition phenomenon with different types of
imbibing brines. Specifically, aging the rock with oils for a long time will create a severe
oil - rock bond that can ensure the majority of pores have interacted oil-wet surface areas
to ensure that the aging process has conducted successfully in carbonate cores an accurate
measuring of the acidity of the crude oil after aging must do.
The acidity will give an indicator about how much the free ends of the carboxylic
group suspended in the crude oil. The more the carboxylic group within the porous medium
the more acidity after oil aging process and then the success result of getting an oil wet
rock.The magnitude of the crude oil acidity has a scientific term called acid number which
will discuss in next sections in details which are specifically a tool to predict the severity
bonding of oil - rock system.(Fathi et al., 2011), has showed that the chemical properties
of the carboxylic substances such as the acidity of the crude oil have a sharp importance
especially in synthetic seawater to behave as wettability modifier. One of the facts about

8
carbonate rocks are its tendency to be water wet at high ranges of temperatures compared
to small ranges of temperatures (Rao, 1996). Aging the cores with oils for long times will
be enough to establish a coated film of the heavier fractions of crude oil regarding
carboxylic group around the pore spaces of the core.
The difficulty of oil wet rock to give a smooth flow and ease recovery depends on
how much the acidity and how long the aging has done for the core. The importance of
temperature on the wet pores surfaces areas chemically is to reduce the acidity or the acid
number by decarboxylation operation as well as reduce the intermolecular forces for the
heavier series in the crude oil to ensure better sweep efficiency. The distinct process of
decarboxylation can observe on calcite (Shimoyama and Johns,1972).
The noticeable effect of brine composition used in carbonate on wettability was
great with sulfate.Sulfate is the dominant active ion that can control the initial wettability
of the rock.The influence of sulfate affected by the concentration of Ca2+ in the formation
water especially with the combination of high temperature; those two factors will limit the
number of aqueous sulfates to lowerest value and will lead to more precipitation of
anhydrite CaSO4(s).The anhydrite reaction is the exothermic reaction in which any rising
of temperature will shift it to endothermic; the shifting to endothermic means reduce the
presence of sulfate in the aqueous solution and then affect the sweep
efficiency.(Shariatpanahi et al., 2011), have mentioned that sulfate as the most active ion
will be the top active ion of preventing adsorption of carboxylic material onto the rock
surface, which will increase the water wetness within the core.
(Zhang et al.,2007), has explained the mechanism of wettability alteration in
carbonate. Figure 1.2, shows the proposed chemical mechanisms for wettability
modification on chalk surface especially in a double layer in which the different ions will
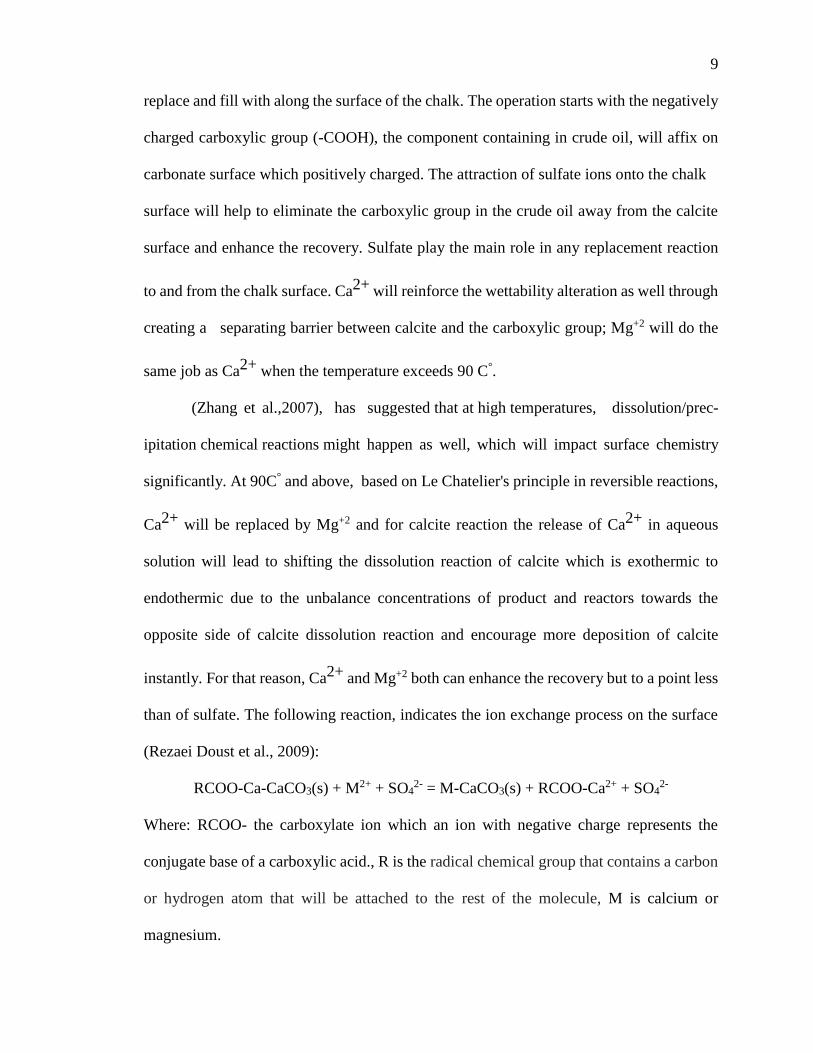
9
replace and fill with along the surface of the chalk. The operation starts with the negatively
charged carboxylic group (-COOH), the component containing in crude oil, will affix on
carbonate surface which positively charged. The attraction of sulfate ions onto the chalk
surface will help to eliminate the carboxylic group in the crude oil away from the calcite
surface and enhance the recovery. Sulfate play the main role in any replacement reaction
to and from the chalk surface. Ca2+ will reinforce the wettability alteration as well through
creating a separating barrier between calcite and the carboxylic group; Mg+2 will do the
same job as Ca2+ when the temperature exceeds 90 C°.
(Zhang et al.,2007), has suggested that at high temperatures, dissolution/prec-
ipitation chemical reactions might happen as well, which will impact surface chemistry
significantly. At 90C° and above, based on Le Chatelier's principle in reversible reactions,
Ca2+ will be replaced by Mg+2 and for calcite reaction the release of Ca2+ in aqueous
solution will lead to shifting the dissolution reaction of calcite which is exothermic to
endothermic due to the unbalance concentrations of product and reactors towards the
opposite side of calcite dissolution reaction and encourage more deposition of calcite
instantly. For that reason, Ca2+ and Mg+2 both can enhance the recovery but to a point less
than of sulfate. The following reaction, indicates the ion exchange process on the surface
(Rezaei Doust et al., 2009):
RCOO-Ca-CaCO3(s) + M2+ + SO42- = M-CaCO3(s) + RCOO-Ca2+ + SO4
2-
Where: RCOO- the carboxylate ion which an ion with negative charge represents the
conjugate base of a carboxylic acid., R is the radical chemical group that contains a carbon
or hydrogen atom that will be attached to the rest of the molecule, M is calcium or
magnesium.

10
Figure 1.2. Proposed chemical mechanism for wettability alteration of chalk (Zhang
et al., 2007)
When the carboxylic group release from the carbonate; the carbonate surface
becomes water-wet. Rezaei Doust et al. (2009), summarized that the composition of
injected brine has to contain sulfate in addition to either calcium or magnesium or both for
carbonate wettability alteration, and high temperature (> 90℃) is necessary.
In carbonate reservoirs, the carboxylic material that found in the heavier parts of crude
oil adsorbs on the surface of the rock and turns it into oil-wet over time.The mechanism of
wettability alteration during chemically tuned waterflooding seems to be adsorption of ca
tions in the water and desorption of negatively charged carboxylic group on the rock
surface, which alters the rock toward water-wetness (Standnes and Austad, 2000). Yu et
al. (2007), has shown that the contact angles varied from mixed-wet to water-wet as the
temperature increased from 20℃ to 130℃ by using of seawater with four times of sulfate.
The magnitude of how much carboxylic group will adsorb onto the chalk surface
depends on the extent of the intermolecular forces between this group and the injected brine
as well as this group with the surface of the chalk. These intermolecular forces represented
by interfacial tension which is the measure of the interacted forces between the immiscible

11
liquids at the interface; the interfacial tension affected by temperature directly. The rising
of temperature within the core will lead to decrease the interfacial tension ( This work will
focus on showing the impact of interfacial tension lowering on determining the contact
angles of wettability alteration on chalk ).
Figure 1.3 below, shows a typical behavior of interfacial tension versus
temperature. Increasing temperature leads to an apparent reduction in interfacial tension
values.
Figure 1.3. Typical behavior of Interfacial tension versus Temperature
The interfacial tension also has found to be affected by the amount of the impurities
added to the injected brine. Since this work will show the adjusting of the injected brine by
adding double values of concentration of sulfate, so a significant reduction in interfacial
tensions will observe. Figure 1.4, shows the typical attitude of interfacial tension versus
the concentration of injected brine.
y = -0.5459x + 82.508R² = 1
0
10
20
30
40
50
60
70
80
0 20 40 60 80 100 120 140
Inte
rfac
ial t
ensi
on
dyn
e/cm
Temperature C
Interfacial tension Vs. Temperature

12
Figure 1.4. Typical behavior of Interfacial tension vs. Brine concentration
Frankly, it is easy to observe that after the system switches to water wet, the value
of interfacial tension will be the same approximately in around value of 17 dyne/cm, and
this is logic since the system reached its equilibrium average temperature at the end of the
imbibition period. As it has know that the quality of any crude oil will be detected based
on its API extensive that the lower values of it mean an excellent indicator of the amount
parts of dissolved gas in the crude oil as well as an index to the quantity of the heavier
suspended compounds in crude oil.
The decreasing of the dense phase with increasing temperature leads to reduce the
interfacial tension or, in other words, the crude oil with high quality (High API) has straight
reduction tendency of interfacial tension with increasing temperature. Figure 1.5, shows
the typical behavior of interfacial tension vs. API degree of crude oil at different ranges of
temperatures.
y = -3E+06x3 + 876566x2 - 76383x + 2229.6R² = 0.9994
0
10
20
30
40
50
60
70
80
90
0.05 0.06 0.07 0.08 0.09 0.1
Inte
rfac
ial t
ensi
on
dyn
e /
cm
Concentration mol/lit
Interfacial tension Vs. Concentration

13
Figure 1.5. Typical behavior of Interfacial tension vs. API degree at various
temperatures ) Baker, O. and Swerdloff, W. 1956(
From the graph above, it is easy to notice that the values of interfacial tensions will
decrease with increasing the temperatures from 60 F° up to 130 F° in addition to the
increasing of API degree of the crude oil used. The crude oil with API 50° has interfacial
tensions values of 27 dyne/cm, 25 dyne/cm, 23 dyne/cm at 60F°, 100F°, and
130F°respectively which mean the same crude oil can have different values of low
interfacial tensions during the rising of its temperature.
1.3 WETTABILITY DETERMINATION
The relationship between interfacial tension and the contact angle in any carbonate
rock is intimate relationship in way each parameter will detect the other, and this will be
applicable according to the following equation:
cos 𝜃𝑜𝑤 =(𝜎𝑜𝑠−𝜎𝑤𝑠)
𝜎𝑜𝑤 (1)

14
Where: 𝜃𝑜𝑤 is the contact angle dimensionless, 𝜎𝑜𝑠 is the interfacial tension between crude
oil and the solid surface in unit of dyne/cm , 𝜎𝑤𝑠 is the interfacial between brine and the
solid surface in unit of dyne/cm , 𝜎𝑜𝑤 is the interfacial tension between two immiscible
liquids ( crude oil and brine ) in unit of dyne/cm .
The basis that on it equ.1 based is the principle of forces equilibrium throughout
the interface of two immiscible liquids ( crude oil and brine) and the resultant force of the
liquids forces along the surface of the solid. Figure 1.6, shows the interfacial forces
distribution around and along a droplet of water surrounded by oil:
Figure 1.6. Interfacial forces at an interface between two immiscible fluids and a solid
(Ayers, 2001)
According to on the estimated contact angles, the wettability can detect. The following
ranges are the typical for finding the wettability in carbonates:
Water wet: 0° < θ < 70°
Intermediate or mixed wet: 70°< θ < 110°
Oil wet: 110°< θ < 180°
Neutral wet: θ = 90°

15
In Figure 1.7 on the left side, if θ = 0°, we have strong water wet and 100% grains
coated with water completely, and the oil will be free to move and produce ,but if we have
θ = 180° Figure 1.7 on the right side, we have strong oil wet and 100% grains coated with
oil entirely and water will be free to move and produce .
At (θ = 0°), the reservoir will produce oil in the smoothly way and ultimate
economic rates of production but in the case (θ = 180°), the reservoir will not produce more
oil except water, and this is not okay for petroleum engineering considerations.
Figure 1.7. Wettability differentiation in Rock (Ayers, 2001)
1.4 OBJECTIVE OF THIS WORK
The fact of that the light compounds series of crude oil will penetrate deeply into
the rock surface on consequence the free existing heavier compounds coated and restricted
the flow path leads to high interfacial tension between oil and solid (𝜎𝑜𝑠) whereas; the hea-

16
vier compounds such as the carboxylic group like asphalt, wax, and risen will create a thick
viscous film coated the interior wet areas surfaces of the pore spaces. Establishing a general
formula of wettability alteration to show a logic connection among main parameters that
control the wettability alteration mechanism is the aim of this work. The main reasons that
encourage to introduce a proven numerical formula to describe and find the key parameters
related to wettability alteration in carbonates is the fact that there is a possibility to get
enormous production of heavier compounds represented accurately in an abundant amount
of viscous carboxylic materials and the fact of high-temperature relationship with
interfacial forces, viscosities, and dissolution/precipitation reactions on chalk. To easy
production of the heavier crude oil compounds through switching the wettability alteration
and monitoring the change of contact angles with other physical and chemical principles
related to the porous medium properties and the fluid flow constrictors required using
adjusted synthetic brines with systematic thermal condition in order to improve the
displacement efficiency by reducing the oil remaining saturation along the direction of the
flow of the imbibing brine , reducing the interfacial tension between oil and brine , and
achieve best mobility of oil .

17
2. EXAMPLE PROJECT: EKOFISK OIL FIELD
Ekofisk oil field is one of the biggest oil fields in the North Sea and was the first
oil discovery after 200 exploration wells have drilled. Figure 2.1, shows a geographical
map of Ekofisk field in the North Sea; it is located in the block 2/4 of the Norwegian
section about of 320 km away from the southwestern part of Stavanger. This field has been
discovered in 1969 by Phillips Petroleum Company and started to its first production in
1971 from four subsea wells.This field is offshore, and the platform type used with it is the
kind of jackup.
The Oil production in Ekofisk has planned to continue until at least 2050.The main
Ekofisk reservoirs consist of Cod, Ekofisk, West Ekofisk, Tor, Albuskjell, Eldfisk, Edda
and Embla oil fields.The Ekofisk terminal is a large complex of platforms and structures
that have built; those platforms have connected to a massive connection manifold or a
transportation hub that can connect with other adjacent fields such as Valhall, Hod, Gyda,
Ula, Statfjord, Heimdal, Tommeliten and Gullfaks.The whole unification section consists
of 29 offshore platforms in which the oil produced transferred through the Norpipe oil
flowline to the Teesside Refinery in England while the naturally produced gas has moved
using the Norpipe gas pipeline to Emden in Germany.
Figure 2.1. Geographical map of Ekofisk oil field location in the North Sea (Gautier,
D.L.,2013)

18
The whole descriptive information related to Ekofisk field shown in Table 2.1 below,
Which contains the overall characteristic information of Ekofisk field:
Table 2.1. The overall characteristic information of Ekofisk field
2.1 WATER INJECTION PILOT PROJECTS OF EKOFISK FIELD
As it has mentioned before, the oil productivity from Ekofisk has started in June
1971, and the production reached its maximum value of 350,000 bbl/day from the total
productivity of 30 oil producers and eight gas injectors. Figure 2.2, shows the overall
distribution of 143 oil producers and 40 water injectors of Ekofisk field in 2013.
A list of laboratory tests results revealed that the water flooding using water
imbibition on low permeability chalk samples were preferable in Tor formation. The first
water flooding project in chalk reservoir of Tor formation of Ekofisk field started in 1981,

19
and the obtained results were highly desirable later in 1983. The massive project of water
injection performed in 1987 using 30 water injection platforms and with entire water
injection capacity of 375,000 bbl/day.
Figure 2.2. Distribution of oil producers and water injectors of Ekofisk field
(Glendasmith, 2013)
Much successful water injection project has conducted in lower Ekofisk in the
period extended between 1985 - 1987. On the other hand, for upper Ekofisk formation, the
water flooding results showed negative attitude firstly but, after six months of sidetracked
coring from the wells and replay the test, the results were different and positive which can
support the idea of the possibility of doing the water flooding successfully in upper Ekofisk

20
formation. The first production data history of Ekofisk showed that the field has produced
about 17%-18% of OOIP. But, nowadays, the recovery has jumped to 50% of OOIP and
for 40 years because of applying the improved oil recovery methods frequently especially
water flooding.
2.2 SUBSIDENCE PROBLEM IN EKOFISK FIELD
The biggest problem that obstacle the productivity in Ekofisk field was the seabed
subsidences. It has noticed that a severe decline in the overall complex of the platforms
where the platforms’ tanks were immersed partly in seawater. The geologists showed that
the Excessive production of both oil and gas from the field had led to minimizing the
confining pressure within the porous media and create an axial compaction. For that
reasons finding a way that can achieve pressure maintenance for the entire reservoir as
well as enhance the productivity is the best solution in reservoir point of view. The positive
results obtained from the first water injection pilot projects, the abundant of seawater that
compatible with the formation easily, the cheapness of water injection project compared
with other EOR methods, and many reservoirs and design considerations has encouraged
to use water injection to maintain the pressure and achieve the peak production rates.
In 1987, Phillips company held an agreement with its partners to use a new water injection
to improve oil recovery and maintain the reservoir pressures. To the late of 1990’s Phillips
company has injected the biggest appropriate amount of water of 900,000 bbl/day into the
reservoir. Nowadays, that rate has reduced to 500,000 bbl/day. In addition to the use of
water injection in highest rate, Phillips was enabled to fix the damages of all the immersed
platforms by lifting the legs of jack-up platforms up to 6 meters, installed new extension
structures, and reinforced the platforms’ tanks with double protective metal layers so as to
it can be ready for hight rate water injection.

21
The following equation will show the importance of existing pore pressure
maintenance during water injection to keep the fractures open as possible and achieving
high conductivity and then high permeability in maner will meet the criteria of getting
improved oil production:
σe = σ − α(Pp) (2.1)
Where: σe Effective stress, σ External stress, α Engineering factor (0-1), Pp Pore pressure
The success of water injection project especially in chalk formation has canceled
the wrong belief about the applicability of water imbibition to improve the oil recovery.
This Stig S. Kvendesh said.“ water injection had a reasonable effect.” and he stated that “
it maximize pressure gradually in the reservoir and today we are controlling subsidence
with water injection.” But his comment just was pessimistic when he declared that” Some
thought at the time it wasn’t possible to produce from a chalk reservoir at all” about the
possibility of getting oil recovery from chalk reservoir, the Phillips’ spokesman in Norway
shared the wrong belief when he said “ When it comes to water injection it was normal in
sandstone. But it hadn’t been done with chalk.” All those opinions have changed after
getting the positive results from the previous pilot projects and became confident
especially after many modifications have done to the Terminal of Ekofisk as well as
achieving best production rates. The searching of any Experimental pieces of evidence by
experiments and simulators will eliminate the wrong beliefs about the applicability of
using water injection in chalk reservoir of Ekofisk field. This work will be a tool to
distinguish the facts that can judge the wettability alteration during water imbibition
phenomenon and give a logical interpretation of the main key parameters leading to
improve oil recovery in carbonates.

22
3. QUANTITIVE AND QUALITIVE DESCRIPTION OF WETTABILITY
ALTERATION IN CARBONATES
The best way to describe the wettability is to study the physical phenomenon
accompany with the direction of increasing in wetting phase. The concentration of sulfate
will diffuse along the positively charged sites on the rock surface and the concentration
gradient of the active determining ion throughout the path of flow depends upon the pore
spaces geometry of the porous medium, the packing complexity of the rock grains, the
type of the porosity of the core, the kind of the permeability, the interfacial forces within
the system, the thermal condition of the porous medium, the imbibing brine density, the
ambient temperature, the properties of the crude oil, the type of the carbonate rock used,
and the final flow impedance generated while imbibition process. This work will focus on
the wettability alteration mechanism from the quantitive point of view. As previously
mentioned, the wettability of the rock can detect using the contact angles. The contact
angles determination will discuss in next sections with taking in the consideration all the
reasonable physical and the chemical factors accompany with the capillary tendency of the
modified wetting brine.
For a gradual comprehensive understanding of the methodology of wettability
alteration distinguishing, it will be better to illustrate the initial steps of the logic procedures
of determining the contact angles task to start with the introduction to the main conceptual
phenomenon that is permanent to occur in any carbonate- smart brine interaction.
The thorough understanding of diffusivity, mobility of the wetting phase, the
viscosity ratio between the two immiscible liquids, and crude oil acidity- sulfate
concentration relationship will facilitate the difficulties of understanding the wettability
alteration mechanism.

23
The wettability alteration in carbonates is not an easy task. The motivation of
finding a way to detect the contact angles of wettability alteration increased when
no coordinated numerical study has carried out that consider all the possible water-rock
interactions simultaneously before this work.
This work successfully reached its purposes when the suggested general formula of
wettability alteration estimation (which will derive in next sections) has accurately
calculated the gradual adjustments and then the corresponding contact angles of the rock-
smart brine interactions. The chalk cores aged with oil for a long time to force the core to
accept oil as the new wetting phase; the first model created shows a value of contact angles
around 89°-90°which means changing from strong oil wet to neutral wet. The following
reaction will explain that tendency:
𝑅 − 𝐶𝑂𝑂 − 𝐻 ↔𝑅𝐶𝑂𝑂− +𝐻+
Where: RCOOH: is the carboxylic acid.
RCOO - : is the carboxylate ion which will be free after the increasing of sulfate affinity
onto the chalk surface. H+ is the proton and the cause of the acidity of the solute.
At high temperature, the reversal reaction above will release more carboxylic
groups as free compounds to produce and more protons ( H+ ) will leave the system which
will cause a reduction of PH of the solute. The increasing of temperature means more
alkalinity of the system, and for this reason, the system will be at a precise moment in
neutral PH and as a consequence the contact angles is approximately 90°. (Hirasaki and
Zhang, 2004), have mentioned that the carbonate rock surface still in its positive charged
even in an existing of neutral PH brine. The following equations will show the inverse
relationship between acidic scale or power of the hydrogen PH and basic level or the power
of hydroxide POH:

24
POH=14 − PH (3.1)
PH = − log[H+] (3.2)
POH = − log[OH−] (3.3)
[H]+ ∗ [OH−]=10−14 (3.4)
When [H+] which is the concentration of hydrogen decrease, the concentration of
hydroxide [OH-] will increase causes an increase in POH and then reduction of PH, and for
this reason, the solute will be neutral.
3.1 SPONTANEOUCE IMBIBITION
Spontaneous imbibition is the process of increasing of saturation of wetting phase
in the rock with decreasing the nonwetting phase saturation. It is self-process that doesn’t
require any pressure difference across the core; it causes due to the differential change of
the adhesion forces generated at the interface of two immiscible liquids within the porous
medium as well as due to the increasing of the interfacial capillary property in addition to
the decreasing of the interfacial tension between the two immiscible phases. Figure 3.1,
shows the ideal behavior of the drainage and imbibition processes in oil wet carbonate
rock:
Figure 3.1. The typical response of drainage and imbibition processes in carbonate

25
Where :
Si is the irreducible wetting phase(water) saturation, Sm: 1 - Residual nonwetting phase
(oil) saturation, Pd: the displacement pressure, which is the pressure necessary to force the
non-wetting liquid to enter the large pores of the rock, Pc is the capillary pressure, and Swt
is the water saturation.
At wetting phase (water) saturation equal 1, the non-wetting phase (oil) require a
Pd pressure to force oil to accumulate gradually in the large pore spaces of the carbonate
core. The accumulation of oil as non-wetting phase inside the core will mimic the oil
migration to the source rock.This process called drainage in which the non-wetting phase
will increase and then its mobility will increase while the wetting phase will decrease to its
irreducible saturation (Si). The leaving of nonwetting phase from the pore spaces by the
displacement of wetting phase called imbibition in which the wetting phase will increase
and then its mobility will improve but on the other hand, the nonwetting phase will decrease
to its lowerest saturation (Sm) and this process simulate the water flooding or water drive
mechanism from the injector to the reservoir.
3.2 CHROMATOGRAPHY TEST
The chromatography is an intelligence way to distinguish between two mixtures or
solvents. The meaning of this terminology is the color writing which is the easiest manner
that the chemists or biologists can use to test the liquids mixing degrees. The primary role
of the chromatography will appear after using two immiscible liquids one is nonactive with
the surface that needed to know its nature or its surface chemistry and the other liquid is
the joker liquid that the chromatography test has done to examine its effect, i.e., the liquid

26
the target that is necessary to know its influence on wettability alteration for example.One
of the important properties of the secondary fluid in the chromatography test are:
Should be a nonactive compound, easy to observe it depending on color especially in the
effluent, has not any effect on the diffusivity of the primary fluid needed to test its
effectiveness, and has consistent results representations on curves in addition to explicit
offset separating with the essential curve of the main fluid in case of estimating the area of
wetting.
3.3 CHROMATOGRAPHY MECHANISM
The fact is that in general, the majority of brines used in wettability alteration tests
look as homogenous substances. But in reality, it consisted of many ions and cations; the
precise way to distinguish them is to use chromatography test.
The chromatography had invented by the Russian botanist scientist M.S. Tswett in
1903. In summary, with chromatography, it will be easy to separate the substances as
organic and inorganic materials so that it can be easily analyzed and studied. By analyzing
the compounds, it will be clear to figure out what makes up that compound. The
chromatography mechanism depends on the differential trip of the solutes of the mobile
phase through the static phase. Depending on the affinity degree of the solutes with the
mobile phase and the time that will spend that solutes in the mobile phase, it can quickly
to detect the solutes that prefer the static phase to flow through.
At the time that the solutes will flow through the static phase, it will be gradual and
separated in a way that can easily to distinguish them and to study them. In another word
the mobile phase will carry all the compounds that have the possibility to pass through the
static phase. The affinity of those solutes is different from compound to the other; some of
those compounds will adsorb onto the surface that contains the static phase while the other
27
compound still moving with the mobile phase. The relative distance of those compound
along the static phase is very useful to distinguish how those adsorbed materials will
behave onto the rock surface and will give an indicator about the relative diffusion of the
modified solutes of the smart brine used.
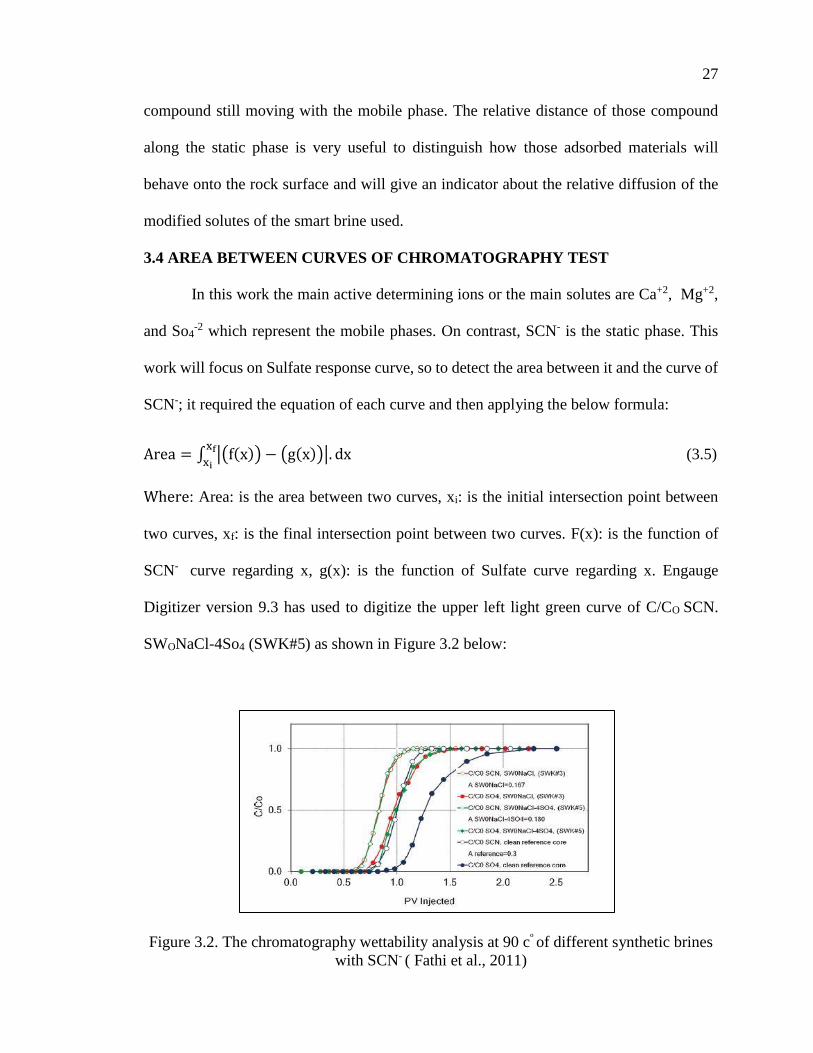
3.4 AREA BETWEEN CURVES OF CHROMATOGRAPHY TEST
In this work the main active determining ions or the main solutes are Ca+2, Mg+2,
and So4-2 which represent the mobile phases. On contrast, SCN- is the static phase. This
work will focus on Sulfate response curve, so to detect the area between it and the curve of
SCN-; it required the equation of each curve and then applying the below formula:
Area = ∫ |(f(x)) − (g(x))|. dxxf
xi (3.5)
Where: Area: is the area between two curves, xi: is the initial intersection point between
two curves, xf: is the final intersection point between two curves. F(x): is the function of
SCN- curve regarding x, g(x): is the function of Sulfate curve regarding x. Engauge
Digitizer version 9.3 has used to digitize the upper left light green curve of C/CO SCN.
SWONaCl-4So4 (SWK#5) as shown in Figure 3.2 below:
Figure 3.2. The chromatography wettability analysis at 90 cº of different synthetic brines
with SCN- ( Fathi et al., 2011)

28
Figure 3.3, shows both the digitized C/CO SCN. SWONaCl-4So4 (SWK#5) curve and its
corresponding curve which has drawn in Excel:
Figure 3.3. Digitized C/CO SCN. SWONaCl-4So4 (SWK#5) curve and Excel curve.
y = -0.5597x2 + 1.9049x - 0.547R² = 0.8151
-0.6
-0.4
-0.2
0
0.2
0.4
0.6
0.8
1
1.2
0 0.5 1 1.5 2 2.5
C/C
O
PV injected
Concentration ratio vs.Pv injected at 90 cº

29
F(x) is corresponding to F(PV)= C/CO and the SCN- equation is:
F(PV)= C/CO = -0.5597 PV2+1.9049 PV-0.547 (3.6)
In the same procedure, Figure 3.4 shows the digitized C/CO So4. SWONaCl
4So4 (SWK#5) bold green curve and the Excel curve:
Figure 3.4. The digitized C/CO So4. (SWK#5) and Excel curve
y = -2.5253x6 + 17.694x5 - 46.882x4 + 57.415x3 - 31.557x2 + 6.9218x - 0.4035R² = 0.9866
-0.2
0
0.2
0.4
0.6
0.8
1
1.2
0 0.5 1 1.5 2 2.5
Pv
inje
cted
C/CO
Concentration ratio vs.Pv injected at 90 cº
30
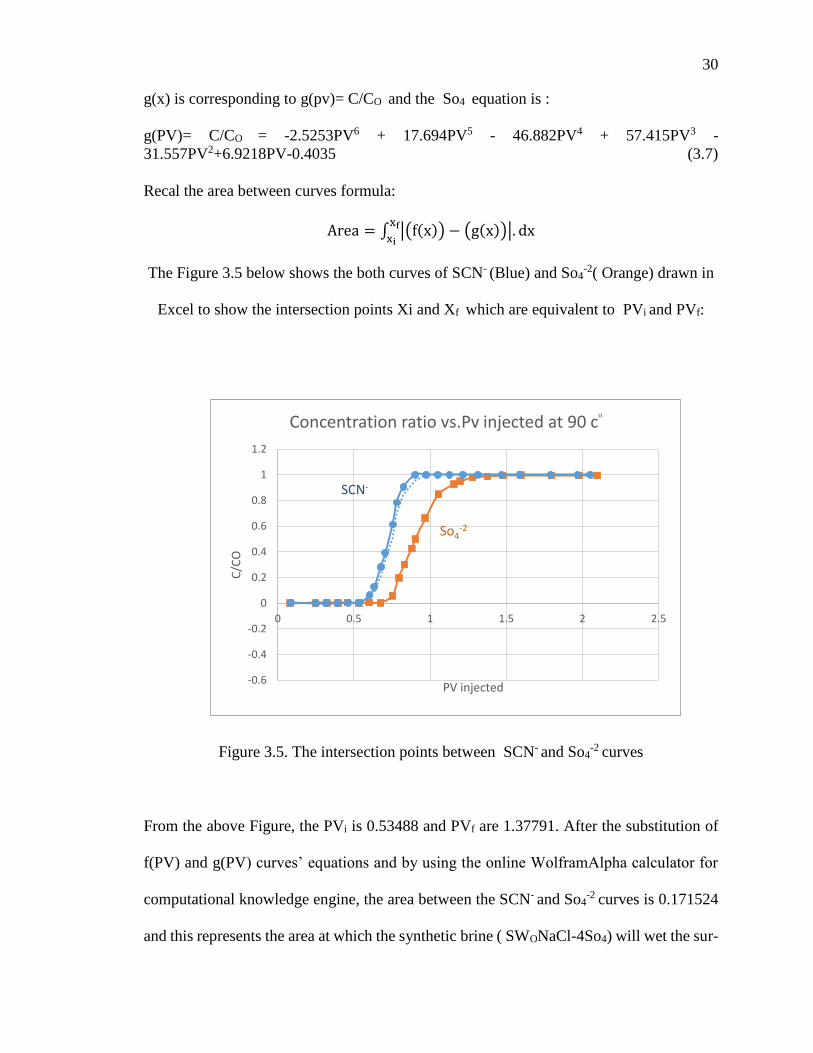
g(x) is corresponding to g(pv)= C/CO and the So4 equation is :
g(PV)= C/CO = -2.5253PV6 + 17.694PV5 - 46.882PV4 + 57.415PV3 -
31.557PV2+6.9218PV-0.4035 (3.7)
Recal the area between curves formula:
Area = ∫ |(f(x)) − (g(x))|. dxxf
xi
The Figure 3.5 below shows the both curves of SCN- (Blue) and So4-2( Orange) drawn in
Excel to show the intersection points Xi and Xf which are equivalent to PVi and PVf:
Figure 3.5. The intersection points between SCN- and So4-2 curves
From the above Figure, the PVi is 0.53488 and PVf are 1.37791. After the substitution of
f(PV) and g(PV) curves’ equations and by using the online WolframAlpha calculator for
computational knowledge engine, the area between the SCN- and So4-2 curves is 0.171524
and this represents the area at which the synthetic brine ( SWONaCl-4So4) will wet the sur-
-0.6
-0.4
-0.2
0
0.2
0.4
0.6
0.8
1
1.2
0 0.5 1 1.5 2 2.5
C/C
O
PV injected
Concentration ratio vs.Pv injected at 90 cº
So4-2
SCN-

31
face of chalk, and it refers as Awet. Figure 3.6, shows both curves of digitized C/CO
So4.clean reference core and the Excel curve:
Figure 3.6. The digitized C/CO So4.clean reference core and the Excel curve
Figure 3.7, shows the intersection points between C/CO So4.clean reference core curve and
C/CO SCN. SWONaCl-4So4 (SWK#5) curve:
From the figure below, the PVi is 0.53205 and PVf are 1.96795.F(PV), and g(PV) are as
following:
y = -0.7052x6 + 6.3096x5 - 21.487x4 + 34.373x3 - 25.668x2 + 8.2869x -0.8878 , R² = 0.9859
-0.2
0
0.2
0.4
0.6
0.8
1
1.2
0 0.5 1 1.5 2 2.5
C/C
O
Pv injected
Concentration ratio vs. Pv injected at 90 cº

32
Figure 3.7. The intersection points between clean core and SCN- curves
F(PV)= C/CO = -0.5597 PV2+1.9049 PV-0.547 (3.8)
G(PV)= C/CO = -0.7052PV6 + 6.3096PV5 - 21.487PV4 + 34.373PV3 - 25.668PV2 +
8.2869PV - 0.8878 (3.9)
Recal the area between curve formula :
Area = ∫ |(f(x)) − (g(x))|. dxxf
xi
By using the online WolframAlpha calculator, the area between the SCN- and
So4.clean reference core curves is 0.278524, and this is Aref.
From the value of area of wet (Awet) and the area of reference (Aref), wettability
index (WI) can quickly calculate as following:
WI =Awet
Aref (3.10)
The value of WI is 0.6158320288 which is very close to WI = 0.60 that has estimated
experimentally by Fathi et al. WI = 0.6 > 0.5 means the smart water has succeeded to alter
the wettability of the chalk from oil wet to nearly strong water wet and meant the sulfate

33
has diffused onto the chalk surface due to its affinity and then increased the water wet sites
on chalk surface.Table 3.1, show the comparisons between the experimental and calculated
parameters of chromatography test on chalk with four times sulfate:
Table 3.1. Experimental and Calculated values on chromatography test
3.5 THE BRINES AND CRUDE OILS USED IN MODELING
To formulate the relationship between the adjusted brine and the wettability
alteration requires knowing the flow and fluids properties. Since the porous medium will
be the theater of all the events, this work will use the specific parameters available of the
outcrop chalk of Ekofisk field and a series of typical values of specific heat and other
constants that no longer change regardless the type of brine used. Table 3.2 below contains
the major petrophysical properties available of the chalk used:
Table 3.2. Petrophysical and initial conditions of Ekofisk chalk

34
The fact of rock-brine-oil interactions has observed experimentally. The proposed
determining ions which are Ca+2, Mg+2 and So4-2 will interact with the surface of the chalk
depending on its affinity which entirely depends on the relative diffusivities and will
interact with the carboxylic material as well. The temperature effect has studied in ranges
of 70 cº, 90 cº, 100 cº, and 120 cº.
The crude oils used were classified to type A crude oil and class B crude oil; the
brines used differently as well which are industrial formation water (VB) which is similar
to Valhall field formation water, synthetic seawater (SW) used as the base displacing brine,
modified brines which have made from synthetic seawater by adjusting the composition
and the salinity which are: SW0NaCl, SW depleted in NaCl, SW0NaCl- 4So4-2, and
SW0NaCl-4 Ca+2.
All the interactions among the suggested brine and the crude oils used in this work
have happened in and around ionic layer called the double layer in which two beds of
opposite charges ( anions, cations ) will exist and interact on the surface of the chalk.The
magnitudes of the interfacial forces accompany to the series of the brines - crude oils
interactions will lead to unity value of the confining pressure which is the pressure
generated by the ionic reactions between two layers of the opposite charges through the
unit area of the rock surface.
The disjoining forces created, will be perpendicular to the unit area of the reaction
surface. In other words, the confining pressure accurately can define as the pressure
difference between the overall wetting phase pressure and the interfacial pressure of the
same phase along the surface of the membrane of the interface. Table 3.3, shows the
specific brines used in the imbibition and chromatography tests:
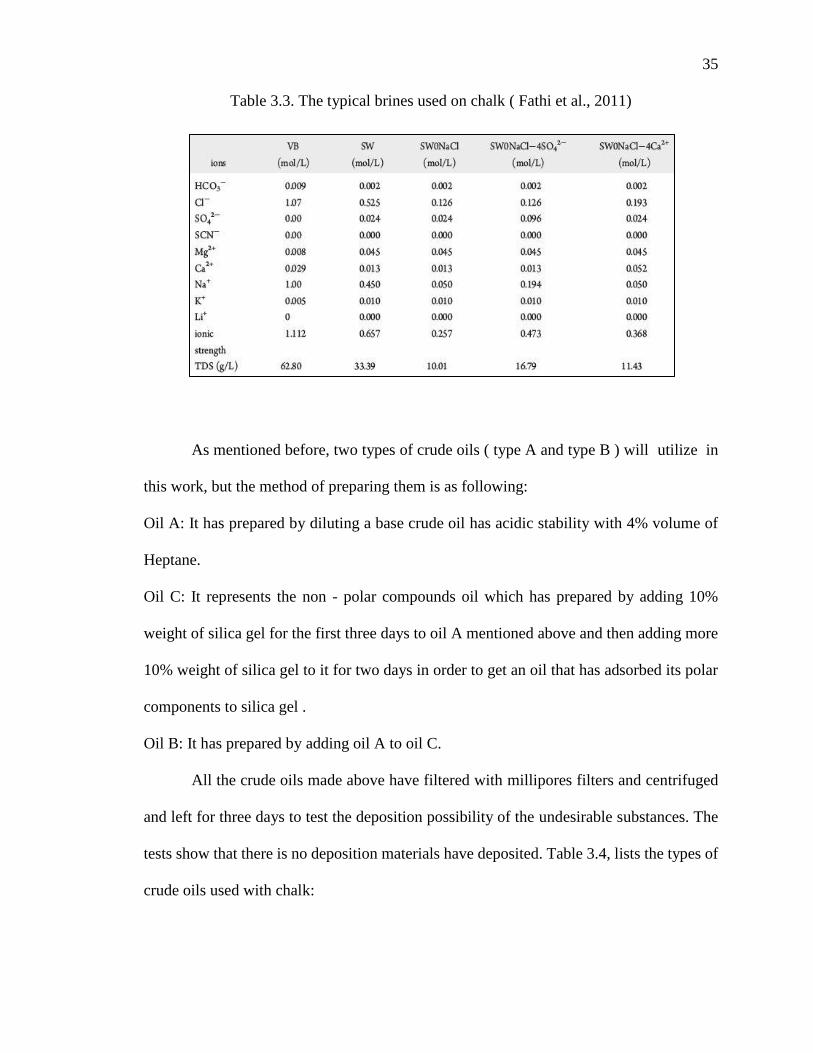
35
Table 3.3. The typical brines used on chalk ( Fathi et al., 2011)
As mentioned before, two types of crude oils ( type A and type B ) will utilize in
this work, but the method of preparing them is as following:
Oil A: It has prepared by diluting a base crude oil has acidic stability with 4% volume of
Heptane.
Oil C: It represents the non - polar compounds oil which has prepared by adding 10%
weight of silica gel for the first three days to oil A mentioned above and then adding more
10% weight of silica gel to it for two days in order to get an oil that has adsorbed its polar
components to silica gel .
Oil B: It has prepared by adding oil A to oil C.
All the crude oils made above have filtered with millipores filters and centrifuged
and left for three days to test the deposition possibility of the undesirable substances. The
tests show that there is no deposition materials have deposited. Table 3.4, lists the types of
crude oils used with chalk:

36
Table 3.4. Typical crude oils used with chalk ( Fathi et al., 2011)
3.6 COREFLOODING APPARATUS AND PROCEDURE
Figure 3.8 below, shows the measuring device used to do the core flooding tests
using chalk core samples. The temperature of the measurements kept constant using an
oven. Dead crude oils A and B as well as the brines all have held inside floating pistons
cells in which the pistons will move by driven hydraulic fluid which is water in a stabilized
pressure rate. Pumps #1 and #2 are positive piston displacement pumps have connected to
deliver brines to the core used. The device has many bypasses and converters that can give
a flexibility design to divert the direction of the fluids used. Each core plug used has put
inside a core holder in a horizontal orientation in a way that enables the lines made the
pressure supplier to get a constant confining pressure inside the core.
The outlet and the inlet of the core have both attached with a pressure gauge to
measure the pressure difference across the core used in addition to using back pressure
regulator to prevent the liquids inside the core to evaporate as well as to keep the
productivity of the core at fixed rate. Regarding the chalk core samples used, it has cleaned
using solvents and then dried so as to series of routine measurements can do to measure
the permeability and the porosity.

37
The core used will saturate with the base brine and then centrifuged to prepare it to
initial water saturation calculations. Crude oils A and B, both has saturated inside the core
used through long aging times eight weeks for oil A and four weeks for oil B at temperature
70 cº, 90 cº for oil B and 100 cº, 120 cº for oil A.The oil aging is to get chalk core samples
in oil wet wettability to be ready for imbibition process. During the oil aging times, the oils
permeabilities will study and monitor at initial water saturation. The device has many
transducers necessary to prevent any differences in pressures while switching from brine
to another during the water flooding. In addition to the transducers, the device has many
control valves and transformers that can keep the water flooding go in the smoothly way.
All those controllers have connected to each other within pneumatic suppliers.
Figure 3.8. The typical core flooding apparatus

38
4. PREFACE ABOUT HEAT AND THERMAL SYSTEMS
Previously, it has mentioned the importance of temperature on the expediting of the
chemical responses of active solutes of the artificial seawaters on wettability alteration.
The thermal changes that happen within the porous medium and its effect on the values of
interfacial forces also its effect on the viscosities and the densities of the flowing fluids will
discuss conceptually through an introduction to the major concepts that can occur inside
the porous medium.
The effect of temperature on oil recovery in regardless the type of crude oil used
showed a unique response of sulfate when it was spiking to four times concentration
compared with the other types of brines used. Figure 4.1, illustrates the relationship of oil
recovery versus time during the imbibition process using different brines and crude oils at
70 c°, 90 c°, 100 c°, and 120 c°. It is easy to recognize the explicit offset between 4So4-2
brine curve and the other brines curves. The explicit offset of 4So4-2 brine curve which is
giving a unique oil recovery is due to the decrease in the impedance forces represented in
the interfacial forces between the crude oil- rock surface, the crude oil – brine used as well
as due to the decrease of the flowing crude oil – brine viscosities and densities.
All those estimations of oil recovery responses have calculated depending on final
core temperature in a situation that might be ambiguous to the researcher about the
mechanism in which the heat exchanging between the rock and with what it has contained
from implied liquids.
This work will focus on the gradual understanding of temperature changes as well
as the immediate changes occurred in the quantities of the entered/departed materials based
on the thermal point of view. In addition to making a logical connection to those changes
with the properties of the porous medium that can effect on the flow as a consequence a

39
possibility to have a precise analysis of the flow work path of crude oil – brine inside the
system. For the figure mentioned below, the top left is for 70 c°; top right is for 90 c°,
bottom left is for 100 c°, and finally the bottom right is for 120 c°.
Figure 4.1. Oil Recovery vs. Time on spontaneous imbibition
4.1 THE HEAT
The heat is a form of energy that caused by work or transfer of matter. The energy
transfer happens from the hotter body (source) to the colder body (destination).In most
energy transfer situation, the substance might change to another phase depends on the
relationship between the system and its surroundings as well as depends on how the heat
transfer. The heat transfers in one or a combination known methodology which is
conduction that happens between the solids, convection that occurs within the liquid
especially that it has a mixture solutes, radiation that happens to remote materials, and the
combination of those. Heat is not a state function which means it depends on the path at

40
which the system will reach to its current situation. In this study, the core has isolated by
Teflon except for the cross-sectional inlet and outlet sides of the core; this means the heat
will transfer and will lose to and from the core in the same direction of the fluids flow.
Any rheological property such as the consistency of the flowing fluid especially if
the fluid is heavy crude oil will deform with heat, so it is not in its continuous state. The
deformation and the release of the heavy carboxylic group in the crude oil depend on the
interfacial bonds among the molecules of the crude oil. The thermal cracking of any liquid
means breaking the bonds between the molecules and since the carboxylic group nature is
a multi - branch compound that can attract onto the surface of the chalk by the head while
the another end is a series of the free branches, so the importance of existing of active ions
in the presence of heat will facilitate the breaking of that attraction physically by heat and
chemically by anions. The unit of heat is J which means Joule, and heat can acquire or lose
from and into bodies and depend on the sign of the heat. It will be easy to know if it is
negative that the heat has departed from the system to the surrounding but if it is positive
means the heat has acquired from the surrounding to the system.
4.2 THE SYSTEM AND THE SURROUNDINGS
The system is the part of the space that within it many physical and chemical
changes occur or it is the part of the material that in the case study.In this work, the system
term refers to the all the instantaneous masses of the fluids within the porous medium that
in touch directly with the temperature changes.The porous medium that includes the system
in this work will be the control volume in thermodynamic point of view.Whereas, the
surroundings refer to the atmosphere or the part that surrounds the system where the energy
or work will transfer and exerted.In this work, the surroundings are the ambient laboratory
temperature and pressure which are 25 Cº and 14.7 psi.

41
4.3 THE TYPES OF THERMODYNAMIC SYSTEMS
After knowing the meaning of system and the surroundings, it is necessary to
understand the thermodynamic systems which are first, open system in which the system
will allow exchanging the material and the energy between the system and its surroundings.
This type is the kind that exists in this work where the masses will transfer outside the
system in the presence of fluids flow and heat energies changes. Secondly, closed system
which is the system that allows only to energy to exchanging between the system and its
surroundings as heat or work. Finally, the isolated system in which the system will not
allow to exchanging the energy nor the material from or to the surroundings.
This work will study the changes in some extensive properties which are the
properties that depend on the quantity of the material such as mass, volume, specific heat.
In all those extensive properties, the overall summation is equivalent to the sum of the
individual values of it. In addition to the extensive properties, this work will study the
intensive properties which are the interfacial tension, temperature, density, and pressure
that don’t depend on the quantity of the material which means that it have its individual
value.
The fact that Fathi et al. have reached in an imbibition and chromatography tests is
the stability of recovery at the measuring specified temperature. In more specific meaning,
they examined the core flooding results at the final temperature of the imbibition, for this
reason, it is possible to consider the system has acted under an isothermal and an isobaric
process in which the final temperature and confining pressure have kept constants.
4.4 HEAT CAPACITY AND SPECIFIC HEAT
This work will use the specific heat as an extensive valuable property that can det-
ect the acquired and lost heat energy within the porous medium and then study the applic-

42
ability to get a stable heat system. Heat capacity defines as the heat energy required in Joule
to raise the temperature of a mass of material to one-degree Celsius. The unit of heat
capacity is J / Cº. The specific heat is the heat capacity needed to one gram of the material
or the heat energy required to raise the temperature of one gram of the material one degree
Celsius. The unit of specific heat is J / Cº.gm. Table 4.1, shows the typical values of specific
heat used in this work’s calculations:
Table 4.1. The standard specific heats used in calculations
4.5 HEAT CONSERVATION IN SYSTEM
This work furthermore the experimental work have studied the impact of final
equilibrium temperature at the end of the imbibition process at which the mechanical and
thermal stability of the system have reached a point that describes the maximum effort of
water flooding using smart brine can do to improve oil recovery. It is crucial to know when
does the system will be at consistent behavior regardless the rate of production of oil from
the core reached. The interfacial forces reduction stability and the maximum affinity of the
active determining ions under final average temperature and fixed confining pressure lead
to consider the system as at its moderate heat. When the system reached to its moderate
heat, means there is no way to add or remove heat between system /the surroundings.

43
5. THE EXPERIMENTAL RELATIONSHIPS RELATED TO THE POROUS
MEDIUM AND THE FLOW PROPERTIES
The logical relationship between the physical and chemical concepts accompany to
fluids flow requires an in-depth understanding of the way that both can work together.This
work will focus on the primary variables of the porous medium based on scientifically
proven principles to build a solid foundation of a formula that can describe and contains
the key parameters of wettability alteration in carbonates.
5.1 SPECIFIC SURFACE AREA DEFINITION
The specific surface area defines as the total exposed surface areas to the wetting
phase of the porous medium per the mass unit of the particles that contain the wetting sites;
it has unit m2/g.The increasing of the number of the interior surface areas of any granular
system leads to increase the possibility of getting more wettability sites. This factor has
used in Kozeny–Carman equation ( will discuss later); it is a vital element from which it
will be easy to know at least how much the anticipated adsorption between the wetting
phase and the sites of the rock surface will interact.The increase of specific surface area
especially in a high-level granularity core means the increase of the pace of wettability
alteration and then increasing the oil productivity from the core.
5.2 THE TORTUOSITY
One of the vital parameters of the porous medium is the tortuosity which shows the
way that the grains of the porous medium have geometrically packed. The tortuosity of any
porous medium means that medium has many interconnected twisted paths of the flow, so
it is necessary to include toruosity in porosity- permeability calculation and that what
Kozeny-Carman have done. The tortuosity will show how much the porous medium will
enhance the diffusion of the wetting phase in the presence of non-wetting phase.

44
The concentration gradient of the active solutes flowing in the pore spaces depends
on the degree of the tortuosity of the porous medium, the more tortuosity means, the more
complexity of the solutes to reach deeply to the specific surface wet areas.This work has
implied the effect of tortuosity as a crucial factor that will detect the degree of diffusivity
between oil and brine in the presence of active determining ions.
5.3 KOZENY-CARMAN EQUATION
One of the great relationships that can relate porosity with the permeability of the
porous medium under dynamic conditions of the flow is a Kozeny-Carman equation in
which the only laminar flow has accepted to be the dominant flow regime. This work is
compatible with Darcy law in accordance to the homogeneity and unity of the core used
regarding unique permeability and porosity in addition to the flow has considered laminar.
In other words, Kozeny-Carman concept is valid since it comes with the majority
assumptions of Darcy law, below is Kozeny-Carman equation:
K =Ø3
ß∗T2∗S2 (5.1)
Where: K is the permeability in md, Ø is the porosity, ß is the shape factor between 1.7 –
3, T is the tortuosity, and finally S is the specific surface area m2/g.
In this work, the Kozney- Carman parameters are: K is 2 md, Ø is 0.45, S is 2 m2/g, ß is 3,
T calculated is 0.06161878772.
5.4 STOKES-EINSTEIN EQUATION
The principle of this equation is to describe the diffusion of the suspended solutes
in the liquid-solid interface reaction at a uniform temperature based on the relative
diffusivity between two polar solutes that have different affinity onto the solid in the
presence of relative dynamic viscosities ratio between them at the absolute individual
temperature of each solute as the following:

45
DO
Db=
Tb
To∗
µb
µo (5.2)
Where: Do is the diffusivity of oil, Db is the diffusivity of brine, Tb is the absolute temperate
of brine, To is the absolute temperature of the oil, µb is the dynamic viscosity of brine, µo
is the dynamic viscosity of the oil.
DO
Db refers to the diffusivity ratio Dratio in this work as well as
µb
µo refers to dynamic
viscosity ratio µratio.
Because of the diffused oil and brine have viscosities and densities at a uniform
temperature which is the average equilibrium temperature of the system, it is important to
derive the Dratio the formula to match the ambient temperature Tavg as the following:
Tavg =Ti+Tf
2 (5.3)
Tavg = Tf
2(1 +
Ti
Tf) (5.4)
Dratio = Ti
Tf∗
µb
µo (5.5)
Ti
Tf=
Dratio
(µb µo⁄ ) (5.6)
Tavg =
Tf 2
(Dratio
(µb µo⁄ )+ 1) (5.7)
(Dratio
(µb µo⁄ )) =
2Tavg
Tf− 1 = x (5.8)
Dratio=x∗(
μbμo
)
(5.9)
log Dratio=log(µb µo⁄ )+log x (5.10)
log10 Dratio= −y (5.11)
Dratio= 10−y (5.12)
In general, the calculated viscosities will decrease with increasing temperature, but the
decreasing rate of brine viscosity less than the declining rate of oil viscosity in a manner

46
keeps the viscosity ratio increase. Beside the viscosity ratio increasing, the Dratio Will
continue to decrease which lead to lower the contact angles. The shrinking of contact angles
means the wettability alteration at the Tavg has improved from oil wet to water wet. The
increasing of viscosity ratio means the water viscosity is still greater than oil viscosity
which is so perfect to achieve active macroscopic sweep efficiency with best oil recovery
and no fingering problem possibility.
5.5 HALL COMPRESSIBILITY EQUATION
The carbonate reservoir in Ekofisk field has known with its high compaction that
led to subsidence problem especially in chalk. One of the reasons that need to study during
water flooding is the formation compressibility; the injection of 900,000 bbl/day of
seawater into the reservoir in order to maintain the reservoir pressure and achieving good
oil production rates requires implying the compressibility of the injected brine that will
keep the disjoining pressure in constant to prevent compaction from occurring. (Hall, 1953)
has proposed the following equation of compressibility:
Cf= (1.782
∅0.438⁄ )∗10−6 (5.13)
Where: Cf is the formation compressibility (Psi-1), Ø is the porosity.
5.6 OIL WET AREA AND ACID NUMBER
The oil wet area can quickly detect by subtracting Awet that has calculated from 1
as following:
Aoil wet=1−Awet (5.14)
The importance of Aoil will discuss in next section but it is in specific will play the
main role to detect the factor of detecting the quality of wettability (H). The factor H will
increase as the product Aoil wet and Ed and then this Will lead to interpreting the effectiveness
of the candidate wet sites at the end of the imbibition test to the concentration effect of the

47
active solute used in the spontaneous imbibition process. While the acid number (AN) is
the measurement of the acidity that can be detected by the quantity of milligrams of KOH
necessary to equivalent the amounts of acids in one gram of crude oil used. The acid
number plays a primary role in wettability alteration experiments where its value always
necessary to detect how much carboxylic group that exist in the crude oil used. Figure 5.1,
shows the relationship of different acids number values on oil recovery with time:
Figure 5.1. The acid numbers differences with oil recovery (Standnes and Austad, 2000(
It can conclude from the above figure that when the acid number increase, the time
required of finishing the complete imbibition will be longer for the same oil recovery target.
In other words, the lower the acidity of crude oils used the best rate of oil recovery can
obtain and the shortest time of imbibition will take.

48
6. BUCKINGHAM PI THEOREM IN DIMENSIONLESS ANALYSIS
The main purpose of Buckingham Pi theorem is to find a formula with less
independent variables to use it in modeling by reducing the number of the experimental
measurements. Using sets of dimensionless groups that created according to the logic
physical connection of proven concepts in addition to using sets of repeated parameters
derived basically to its major units can finally lead to establishing a formula. The number
of dimensionless group equations depends on how many candidate variables have selected
to match the physical behavior of the model that needs to generate its governing equation.
Table 6.1, shows the physical parameters and its units based on MLT (Mass, Length, Time)
system:
Table 6.1. The major physical quantities and its dimensions
6.1 FIRST ATTEMPT OF MODELLING WETTABILITY ALTERATION IN
CARBONATES
The first attempt was to find the first formula that can relate the determining ion (the
sulfate) concentration ( C ) based on the heat transferred gradient (Q/L) that will change

49
along the path of the flow of the injected pore volume of brine ( PV) in the presence of the
interfacial forces (σ) and the acidity (AN). The following is the procedure that used to
derive the model formula using Buckingham Pi theorem:
C = f (Q
L ∙ AN ∙ PV ∙ σ) (6.1)
0 = f (Q
L∙ AN ∙ C ∙ PV ∙ σ) (6.2)
M = 5 , N = 3 , ( Q
L∙ AN ∙ σ) (6.3)
π1=M0∙L0∙T0= (Q
L)
a1
∙ ANb1 ∙ σc1 ∙ C (6.4)
M0 ∙ L0 ∙ T0 = (M. L. T−2)a1 . (M0. L0. T0)b1 . (T−2. M)c1.L3 (6.5)
M0 ∙ L0 ∙ T0 = Ma1+c1 . La1−3. T−2a1−2c1 (6.6)
0 = a1 + c1 , 0 = a1 − 3, 0 = −2a1− 2c1 (6.7)
≫ a1 = 3 , c1 = −3 , π1 =(
Q
L)
3.AN.C
σ3 (6.8)
π2 = M0 ∙ L0 ∙ T0 = (Q
L)
a2
. ANb2 . σc2 . PV (6.9)
M0 ∙ L0 ∙ T0 = (M. L. T−2)a2 . (M0 ∙ L0 ∙ T0)b2 . (M. T−2)c2 . L3 (6.10)
M0 ∙ L0 ∙ T0 = Ma2+c2 . La2+3. T−2a2 −2c2 (6.11)
0 = a2 + c2 , 0 = a2 + 3, 0 = −2a2 − 2c2 (6.12)
≫ a2 = −3 , c2 = 3 , π2 = AN.σ3.PV
(Q
L)
3 (6.13)
f(π1 , π2) = 0 → π1 = fπ2 (6.14)
C = (σ .L
Q)
6
. PV (6.15)
Equ.6.15 refers to the formula that has gotten from the first attempt model, below the
second attempt:
C = f (Q
L ∙ AN ∙ PV ∙ σ) (6.16)
0 = f (Q
L∙ AN ∙ C ∙ PV ∙ σ) (6.17)
M = 5, N = 3, (Q
L , PV, σ ) (6.18)
π1 = M0 ∙ L0 ∙ T0 = (M. L. T−2)a1 . (L3 )b1 . (M. T−2)c1 . quantity . C (6.19)

50
The quantity means the number of moles used which it has assumed to one mole for
simplification purposes:
π1 = M0 ∙ L0 ∙ T0 = (M. L. T−2)a1 . (L3 )b1 . (M. T−2)c1 . L−3 (6.20)
π1 = M0 ∙ L0 ∙ T0 = Ma1+c1 . La1+b1−3 . Ta1−c1 (6.21)
a1 + c1 = 0 , ≫ a1 = −c1 , 0 = a1 + b1 − 3 , 0 = −2a1 − 2c1 (6.22)
For 𝑎1 , 𝑐1 : +ve 𝑎1 means -ve 𝑐1 : 1 ≥ 𝑎1 ≥ 0 , [0 , 1]
0 ≥ 𝑐1 ≥ −1 , [0 , −1]
Let’s assume a1 = 0.5 , c1 = -0.5 so, b1 = 0.83 (6.23)
Therefore, π1 = (Q
L)
0.5
. (PV)0.83.(σ)−0.5. C (6.24)
π2 = M0 ∙ L0 ∙ T0 = (Q
L)
a2
. (PV)b2 . (σ)c2 . AN (6.25)
M0 ∙ L0 ∙ T0 = (M. L. T−2)a2 . (L3 )b2 . (M. T−2)c2 (6.26)
The acid number AN has assumed to be 1 = 𝑀0 ∙ 𝐿0 ∙ 𝑇0 for simplification purposes :
M0 ∙ L0 ∙ T0 = Ma2+c2 . La2+3b2 . T−2a2−2c2 (6.27)
Using the same assumptions of a1=0.5 , c1 = -0.5 , therefore, b = - 1/6 (6.28)
π2 = (Q
L)
0.5
. (PV)−1/6. (σ)−0.5. AN (6.29)
f(π1, π2) = 0 → π1 = f(π2) (6.30)
(Q
L)
0.5
. PV0.83. σ−0.5. C = (Q
L)
0.5
. PV−1/6. σ−0.5. AN (6.31)
Multiply by (1
(QL)
0.5
. PV0.83 . σ−0.5
) in both sides and solve for C:
C = PV−0.83−1/6. AN (6.32)
Equ.6.32, refers to the final formula of the second attempt model which logically and
dimensionally better that the Equ. 6.15; the conclusions are:
For high AN crude oil, it is necessary to minimize the injected pore volume of brine but

51
make it with a high concentration of Sulfate. On the other hand, for low AN crude oil; it is
necessary to take the opportunity to use a high rate of injected pore volume with low
salinity or low concentration of sulfate to get the better-improved amount of oil from the
core.Moreover, by combining Equ. 6.15 and Equ. 6.32 yield:
C = (σ
QL⁄)
3
. √AN2
(6.33)
From specific heat formula: 𝑄 = 𝐶𝑃. 𝑀. ∆𝑇 (6.34)
Then: C = (σ
CP.M.∆T
L
)
3
. √AN2
, the quantities CP, M, and L considered constants, then:
C = constant. (σ3
∆T3) . √AN2
(6.35)
The conclusion that has written about the formula above is : if the magnitude of
heat transferred is tiny, this means a film of sulfate ions will be created onto the rock surface
in which the interfacial tension between injected brine and the rock is still in high and not
breaking in a way that can ensure the more oil to produce regardless the type of crude oil
used.
More modification has added to the formula above to spread its logical cycle of use; the
first modification is to imply the following equation known before:
cos θow = (σos−σws
σow) (6.36)
A new assumption has proposed that the value of the numerator (σos – σws ) is
approximately constant so that the contact angle will be affected by the interfacial forces
between the injected brine and crude oil used in the experiment. By solving the equation
above for 𝜎𝑜𝑤 and cubic the both sides yield:
C = Constant . (σos − σws)3 .√AN
2
(cos θow)3.(∆T)3 (6.37)
K = Constant . (σos − σws)3 (6.38)
C = K.√AN
2
(cos θow .∆T)3 (6.39)

52
The equ. 6.39 has used to model the wettability alteration on chalk using sulfate as
active determining ion but the contact angles estimated were unified and about 89° - 90°
which means that the surface of rock has improved from oil wet to neutral.Table 6.2, Excel
sheet shows the calculations made using the equ. 6.39:
Table 6.2. The first model calculations by Buckingham Pi theorem
The pink columns have created after digitizing the oil recovery vs. time of
imbibition process at 70 C°, the rest columns have created as following:
Bulk volume Vb: Vb =π.D2.L
4=
7π.(3.8)2
4= 79.38 cc (6.40)
Pore volume Pv: Pv = ∅. Vb = 0.45 ∗ 79.38 = 35.721 cc (6.41)
Origin oil in place Voil init. : Voil init. = Soi ∗ Vp = 0.91 ∗ 35.721 = 32.506 cc (6.42)
Oil produced volume Voil: Voil = Rf ∗ Voil init. (6.43)
Oil remaining volume Vor: Vor=Voil init. − Voil (6.44)
Initial water volume Vwi: Vwi = Swi ∗ Vp = 0.09 ∗ 35.721 = 3.2149 cc (6.45)

53
Brine injected volume Vwinj. : Vwinj. = Vp − Vor − Vwi (6.46)
Injected water saturation Swinj. : Swinj. =Vwinj.
Vp (6.47
Oil remaining saturation Sor: Sor =Vor
Vp (6.48)
Initial water mass Mwi: Mwi = 1.025 ∗ Vwi (6.49)
Remaining oil mass Mor: Mor = 0.789 ∗ Vor (6.50)
Injected water mass Mwinj. : Mwinj = 1.025 ∗ Vwinj (6.51)
Mass of system Msystem: Msystem = Mwi + Mor + Mwinj (6.52)
System specific heat Cp: 𝐶𝑝 = ((2.13∗𝑀𝑜𝑟)+3.3414(𝑀𝑤𝑖𝑛𝑗+𝑀𝑤𝑖)
𝑀𝑠𝑦𝑠𝑡𝑒𝑚) , from calorimetry priciple
Rock type constant K: K = (L
Cp.Msystem)
3
. (σos − σws)3. 10−21 (6.53)
Cosθow: cos θow =K0.33. √AN
2
C0.33.∆T (6.54)
Contact angle θow: θow = DEGREES(ACOS(cos θOW)) = cos−1(cos θow) (6.55)
It can see from the Excell sheet mentioned above that the contact angles 89° refer
to the neutral wet condition. For that reason, it is mandatory to do some modifications to
the created equation to get water wet condition.
6.2 THE GENERAL WETTABILITY ALTERATION FORMULA APPROACH
The limitations of the first model derivation lead to get neutral wettability instead
of getting water wet of the estimation of instantaneous contact angles. Regardless, those
limitations, the equation can use as the basis for formulating a general equation of
wettability alteration mechanism.
The fist model has neglected the following factors: The formation compressibility,
oil wet area, Crude oil – brine viscosity ratio changes, diffusivity ratio of crude oil – brine
system, the porous medium geometrical factor, and properties such as tortuosity,
permeability, porosity, flow impedance, constrictivity of capillary tubes of the porous me-

54
dium, active ion molecular weight, brine density, heat conservation and average
temperature and finally the macroscopic sweep efficiency changes per unit length.
Implying all factors above lead to get the water wet conditions for brine – oil B
system at 70 C°, 90 C° with AN 0.5 and for brine – oil A system at 100 C°, 120 C° with AN
2 successfully.Starting of digitizing the oil recovery vs. time response of spontaneous
imbibition of the specified temperatures above then complete the saturation-volume-mass
calculation of the flowing components within the porous medium.
It is important to know what is the meaning of constrictivity which is the ratio of
the diffused solute diameter to the pore space diameter. It is one of the important
considerations of diffusion transportation in the entire path of the porous medium. It is also
important to know the term flow impedance which means the porous medium resistance to
flow due to the capillary geometry of the porous medium.Below the steps of calculation of
flow impedance of the chalk used:
Using Hagen-Poisulle’s equation to determine the capillary tube pore size:
K = 12.7 ∗ 106 ∗ r2 (6.56)
K is the permeability in Darcy, r: is the capillary tube pore size in Cm.
0.002 = 12.7 ∗ 106 ∗ r2
r = 0.000031622 cm
PV = π ∗ r2 ∗ L
35.721 = 7πr2
r = 1.624335349 cm
The No. of capillary tubes =1.624335349
0.000031622 = 51367.25537 tube (6.57)
Flow impedance(FI) = No. of capillary tubes ∗ Constrictivity (6.58)

55
Since it is hard for this work to estimate the diffused solute diameter because this problem
needs a microscopic analysis for that reason, it is easy to deduce the magnitude of flow
impedance based on the known parameters of the general formula of wettability alteration.
The idea is for any chalk if the flow impedance is high means the concentration of
the active solute will face difficulty to reach the farthest portions of the chalk surface or in
other words, it will affect the degree of solute diffusion onto the rock surface and then will
change the wettability index.The following is the general formula of wettability alteration
in chalk:
θow = cos−1 [C∗FI∗Cp∗Msys∗∆T∗(σos−σws)∗AN
10−7∗H∗ρB∗Pv∗Dratio] (6.59)
The wettability detector factor H =Ed∗Aoil
L∗Tr∗µw∗Cf2 (6.60)
Tr is the tortuosity, μw is the solute molecular weight, Cf is the formation compressibility,
Aoil is the oil wet area, Ed is the displacement efficiency, L is the core length.
Qsys = Cp ∗ Msys ∗ ∆T = Qinjected = Qor + Qwi + Qproduced (6.61)
Qinjected , Qor , Qwi , Qproduced are the heat energy of injected brine, remaining oil, initial
water, oil produced respectively. Cp is the specific heat at constant pressure, Qsys is the
conservative heat energy of the system, Msys is the overall mass of the system, ∆T is the
average temperature.
Ed =(Soi−Sor)
Soi (6.62)
ρb = −4 ∗ 10−6T2 − 4 ∗ 10−5T + 0.9997 (6.63)
μb = −0.412 ln T + 2.1982 (6.64)
μo = 7.077e−0.022T (6.65)
Where 𝜌𝑏 is the brine density in gm/cc , T is the average temperature in C° , 𝜇𝑏 is the brine
viscosity in cp, 𝜇𝑜 is the oil viscosity in cp.

56
Table 6.3, Table 6.4 , and Table 6.5 below show all the calculations using the
general formula for oil B , AN = 0.5 at 70 C°, oil viscosity 2.6 cp:
Table 6.3. Part 1 calculations of Oil B, AN=0.5 at T= 70 C°
Table 6.4. Part 2 calculations of Oil B, AN = 0.5 at T= 70 C°
Table 6.5. Part 3 calculations of Oil B, AN = 0.5 at T = 70 C°

57
The general formula has succeeded to obtain contact angles below 70° at values
about 58° which means a water-wet condition at interfacial tension about 23.4 dyne/cm.In
other words, all the modifications proposed have worked well together to get a smooth
wettability alteration on chalk.
In the same procedure, Table 6.6, Table 6.7, Table 6.8 show the overall calculations
of oil B with AN = 0.5 at T= 90 C°:
Table 6.6. Part 1 calculations of Oil B, AN=0.5 at T=90 C°
Table 6.7. Part 2 calculations of Oil B, AN=0.5 at T= 90 C°

58
Table 6.8. Part 3 calculations of Oil B, AN=0.5, at T = 90 C°
From the Tables 6.6, 6.7, and 6.8 above of Oil B, AN=0.5, at T= 90 C°, best
improvements have happened to the contact angles and the interfacial tensions. When the
temperature has raised from 70 C° to 90 C°, the interfacial tensions have decreased and the
contact angles as well. The reason behind that is rising the temperature leads to lower the
viscosities of the flowing liquids in a way that enable the diffusivity of brine to be the do-
minant onto the rock surface than the diffusivity of oil. In addition to the decreasing of
interfacial tension and increasing of the brine-wet areas. All those factors lead to get contact
angle of 55° at 90 C° lower than that one at 70 C°as well as lower interfacial tension about
21 dyne/cm. The same procedure will follow at T= 100 C°and T=120 C° of oil A, AN=2,
oil viscosity 3.38 cp except for the high viscosity of this oil required double the sulfate
concentration and double the lowering of flow impedance to gain more oil produced from
the core.Below, Table 6.9, Table 6.10, and Table 6.11 of the total calculations that have
done of Oil A, AN=2, 3.38 cp, 100 C°:

59
Table 6.9. Part 1 calculations of Oil A, AN=2 at T=100 C°
Table 6.10. Part 2 calculations of Oil A, AN=2, T=100 C°
It can see from the Table 6.9, Table 6.10 above and Table 6.11 below, that the
contact angles continue to decrease when the temperature raised to 100 C° to the value of
57°which means the core has switched to water wet in addition to the decreasing of
interfacial tension to the value of 22.7 dyne/cm. The success results indicate that the
general formula is still valid to exam- ine the wettability alteration of chalk.

60
Table 6.11. Part 3 calculations of Oil A, AN=2, T=100 C°
Table 6.12, Table 6.13, and Table 6.14 below summarize the overall calculations
that have done of oil A, AN=2, T=120 C°:
Table 6.12. Part 1 calculations of Oil A, AN=2, T=120 C°
Table 6.13. Part 2 calculations of Oil A, AN=2, T=120 C°
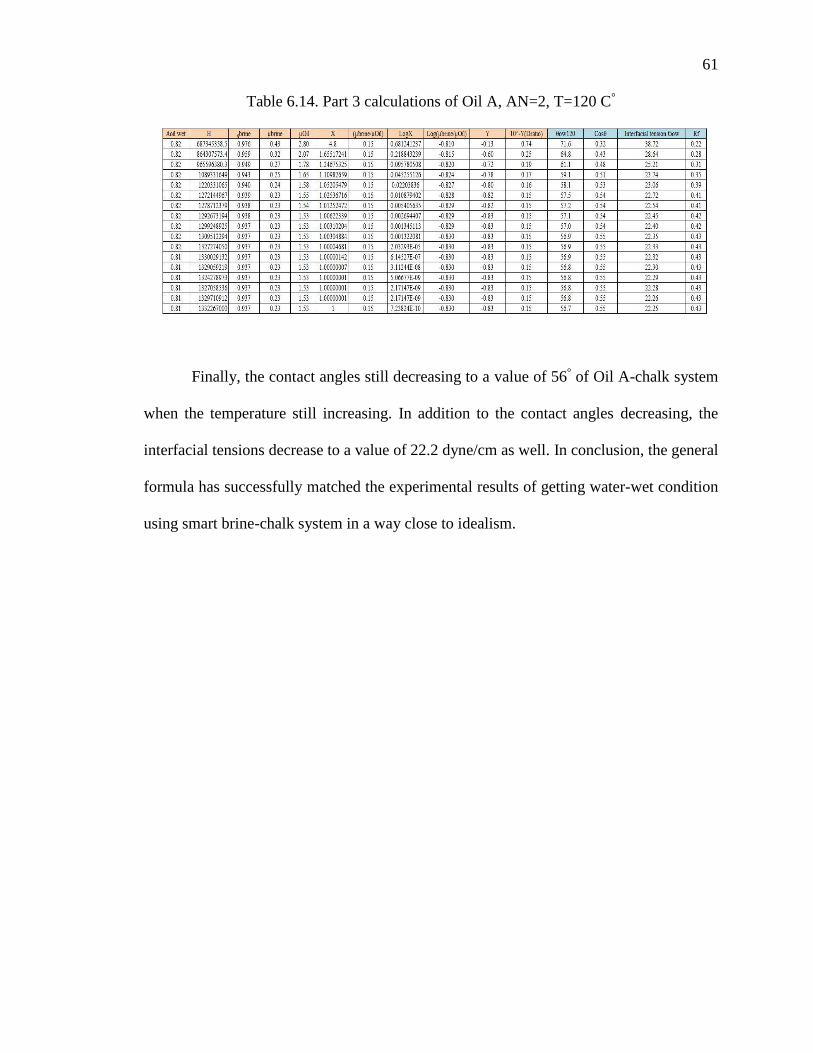
61
Table 6.14. Part 3 calculations of Oil A, AN=2, T=120 C°
Finally, the contact angles still decreasing to a value of 56° of Oil A-chalk system
when the temperature still increasing. In addition to the contact angles decreasing, the
interfacial tensions decrease to a value of 22.2 dyne/cm as well. In conclusion, the general
formula has successfully matched the experimental results of getting water-wet condition
using smart brine-chalk system in a way close to idealism.
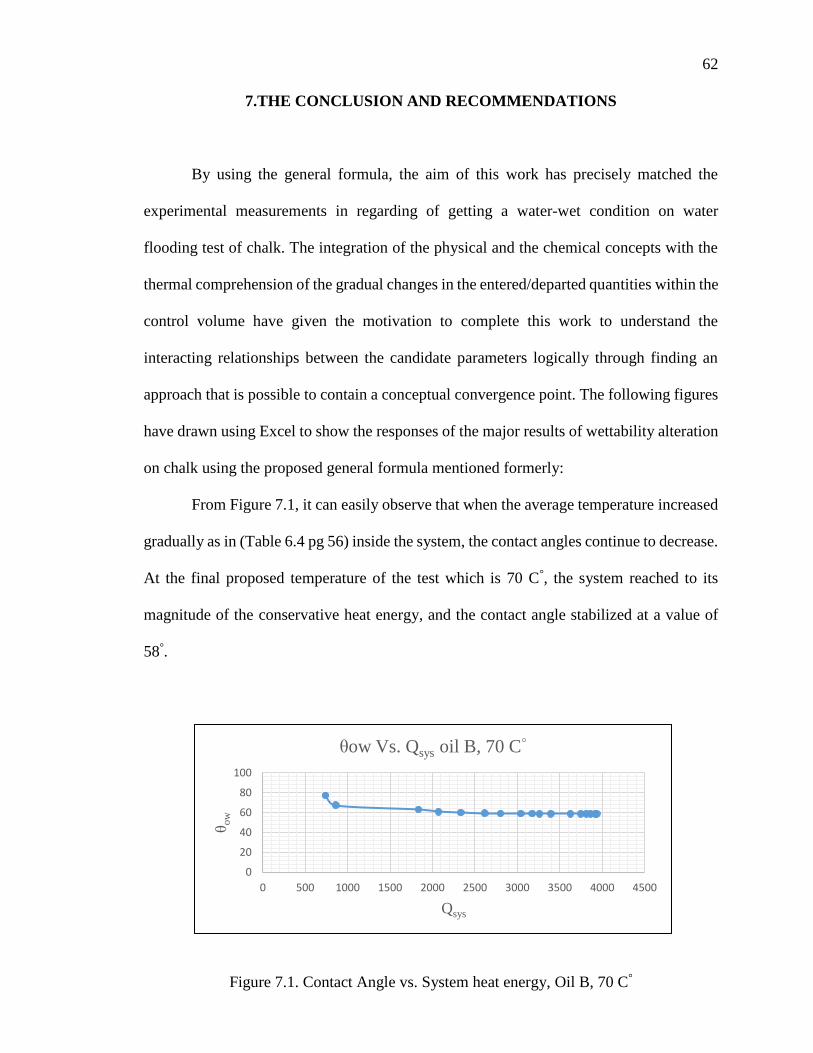
62
7.THE CONCLUSION AND RECOMMENDATIONS
By using the general formula, the aim of this work has precisely matched the
experimental measurements in regarding of getting a water-wet condition on water
flooding test of chalk. The integration of the physical and the chemical concepts with the
thermal comprehension of the gradual changes in the entered/departed quantities within the
control volume have given the motivation to complete this work to understand the
interacting relationships between the candidate parameters logically through finding an
approach that is possible to contain a conceptual convergence point. The following figures
have drawn using Excel to show the responses of the major results of wettability alteration
on chalk using the proposed general formula mentioned formerly:
From Figure 7.1, it can easily observe that when the average temperature increased
gradually as in (Table 6.4 pg 56) inside the system, the contact angles continue to decrease.
At the final proposed temperature of the test which is 70 C°, the system reached to its
magnitude of the conservative heat energy, and the contact angle stabilized at a value of
58°.
Figure 7.1. Contact Angle vs. System heat energy, Oil B, 70 C°
0
20
40
60
80
100
0 500 1000 1500 2000 2500 3000 3500 4000 4500
θow
Qsys
θow Vs. Qsys oil B, 70 C°

63
From Figure 7.2 below, the increase of displacement sweep efficiency due to the
reduction of remaining oil saturation during the imbibition time of the test leads to decrease
the contact angle. When the system reached to its highest oil recovery in which the
remaining oil saturation will be at the lowerest value, the contact angle reached to the
combined value of 58°at the end of the imbibition time regardless the rate of oil produced.
Figure 7.2. Contact Angle vs. Ed
Both Figures 7.1 and 7.2 show the same response which means the continuous heat
flow of energy is in the same path of the decreasing of the oil remaining saturation or in
another word; it is on the same route with macroscopic displacement tendency.
0
10
20
30
40
50
60
70
80
90
0 0.1 0.2 0.3 0.4 0.5 0.6
θow
Ed
θow Vs. Ed oil B, 70 C°

64
The diffusivity ratio Dratio refers to the diffusion of oil to the diffusion of brine. In
Figure 7.3 below, when the diffusion ratio decreases the contact angle decrease as well.
The fact behind that behavior is when the diffusivity ratio reduction means the
dissemination of oil onto the rock surface is less than the diffusion of brine. In another
word, the higher the diffusion of brine compared to the oil diffusion the larger reduction of
contact angle and then the bigger chance to get water wet faster. With temperature
increasing of the system, the oil and brine viscosities will decrease gradually but, the rate
of reduction of oil viscosity is higher than the rate of reduction of brine viscosity. (Table
6.5 Pg. 56), shows the brine viscosity to oil viscosity ratio. This ratio will continue to
increase as the temperature will increase which means that the denominator (oil viscosity)
will reduce faster the numerator (brine viscosity).
Figure 7.3. θow vs. Dratio oil B, 70 C°
0
10
20
30
40
50
60
70
80
90
0 0.1 0.2 0.3 0.4 0.5 0.6 0.7 0.8
θow
Dratio
θow Vs.Dratio oil B , 70 C°

65
Figure 7.4, shows the increase of viscosity ratio will lead to minimizing the
possibility of the affinity of the diffused fluids towards the rock surface. Increasing
viscosity ratio will result in lower the D ratio which means will lower the diffusion of oil
compared to the diffusion of brine. The presence of low viscosity oil and low diffusion
ratio of oil will enhance the sweep efficiency of brine to displace more oil and to increase
the water wet area sites on the chalk surface chemically.
Figure 7.4. Dratio vs. µratio, oil B, 70 C°
Figure 7.5 below, shows the precise behavior of brine density reduction with
increasing the average system temperature. The brine density will be constant at the
equilibrium temperature 70 C°.
0
0.1
0.2
0.3
0.4
0.5
0.6
0.7
0.8
0.23 0.24 0.25 0.26 0.27 0.28 0.29 0.3
Dra
tio
Viscosity ratio
10^-Y(Dratio) Vs. Viscosity ratio oil B, 70 C°

66
Figure 7.5. Brine density vs. Avg. Temperature oil B, 70 C°
In Figure 7.6 below, the increase in temperature will lead to reducing the brine
density and then enhance the displacement efficiency. The best improve of displacement
efficiency happens at the equilibrium temperature of the system specifically at Ed from 0.3
up to 0.5 at which the brine reached to its lower value of 0.977 gm/cc.
Figure 7.6. Brine density vs. Ed, oil B, 70 C°
0.976
0.978
0.98
0.982
0.984
0.986
0.988
0.99
35 40 45 50 55 60 65 70 75
Bri
ne
den
sity
gm
/cc
Average temperature C°
Brine density Vs. Average temperatuer , oil B ,70 C°
0.976
0.978
0.98
0.982
0.984
0.986
0.988
0.99
0 0.1 0.2 0.3 0.4 0.5 0.6
Bri
ne
den
sity
gm
/cc
Ed
Brine density Vs. Ed oil B, 70 C°

67
From Figure 7.7 below, the best displacement efficiency happens from the range
0.3 up to 0.5 when the oil viscosity has reduced from 2.5 cp to its applicable lowerest value
of 1.5cp.
Figure 7.7. Oil viscosity vs. Ed, oil B, 70 C°
From the Figure 7.8 below, it is easy to know that when the temperature will
increase the viscosity ratio will increase as well; the physical meaning of this behavior that
the decreasing rate in oil viscosity is faster the declining rate of brine viscosity at the same
ambient temperature because of the differences between the brine consistency properties
and that one of oil.
0
0.5
1
1.5
2
2.5
3
0 0.1 0.2 0.3 0.4 0.5 0.6
Oil
visc
osi
ty c
p
Displacement efficiency
Oil viscosity Vs. Ed oil B, 70 C°

68
Figure 7.8. Viscosity ratio vs. Avg. Temperature, oil B, 70 C°
In Figure 7.9 below, the system has reached its peak oil recovery at the final
ambient temperature and regardless the increasing of oil rate, the interfacial tension of the
system still at fixed value of 23 dyne/cm and doesn’t improve since it is a function of the
temperature which has reached to its final value of 70 C°.
Figure 7.9. Interfacial tension vs. Oil recovery oil B, 70 C°
0
0.05
0.1
0.15
0.2
0.25
0.3
0.35
35 40 45 50 55 60 65 70 75
Vis
cosi
ty r
atio
Avg. Temperature c°
Vicosity ratio Vs. Avg. Temp, oil B , 70 C°
0
0.1
0.2
0.3
0.4
0.5
0.6
13 18 23 28 33 38 43 48 53 58
Oil
reco
vey
frac
tio
n
Interfacial tension dyne/cm

69
Oil B at 90 C°, oil A at 100 C°and 120 C° show the same behavior as in oil B,70
C°as in the following figures:
From Figure 7.10 below, it can easily observe that when the average temperature
increased gradually as in (Table 6.7 pg 57) inside the system, the contact angles continue
to decrease. At the final proposed temperature of the test which is 90 C°, the system reached
to its magnitude of the conservative heat energy, and the contact angle stabilized at a value
of 55°.
Figure 7.10. Contact Angle vs. The system heat, oil B, 90 C°
From Figure 7.11 below, the increase of displacement sweep efficiency due to the
reduction of remaining oil saturation during the imbibition time of the test leads to decrease
the contact angle. When the system reached to its highest oil recovery in which the
remaining oil saturation will be at the lowerest value, the contact angle reached to the
combined value of 55°at the end of the imbibition time regardless the rate of oil produced.
0
20
40
60
80
100
0 1000 2000 3000 4000 5000 6000
Conta
ct a
ngle
°
Qsys
Contact angle Vs. Qsys oil B, 90 C°

70
Figure 7.11. Contact Angle vs. Ed, oil B, 90 C°.
Figure 7.12 below, shows the precise behavior of brine density reduction with
increasing the average system temperature. The brine density will be constant at the
equilibrium temperature 90 C°.
Figure 7.12. Brine density vs. Avg. Temp. , oil B, 90 C°
0
20
40
60
80
100
0 0.1 0.2 0.3 0.4 0.5 0.6 0.7C
on
tact
an
ale
°
Ed
Contacat angle Vs. Ed oil B , 90 C°
0.96
0.965
0.97
0.975
0.98
0.985
0.99
40 50 60 70 80 90 100
Bri
ne
den
sity
gm
/cc
Avg. Temp. C
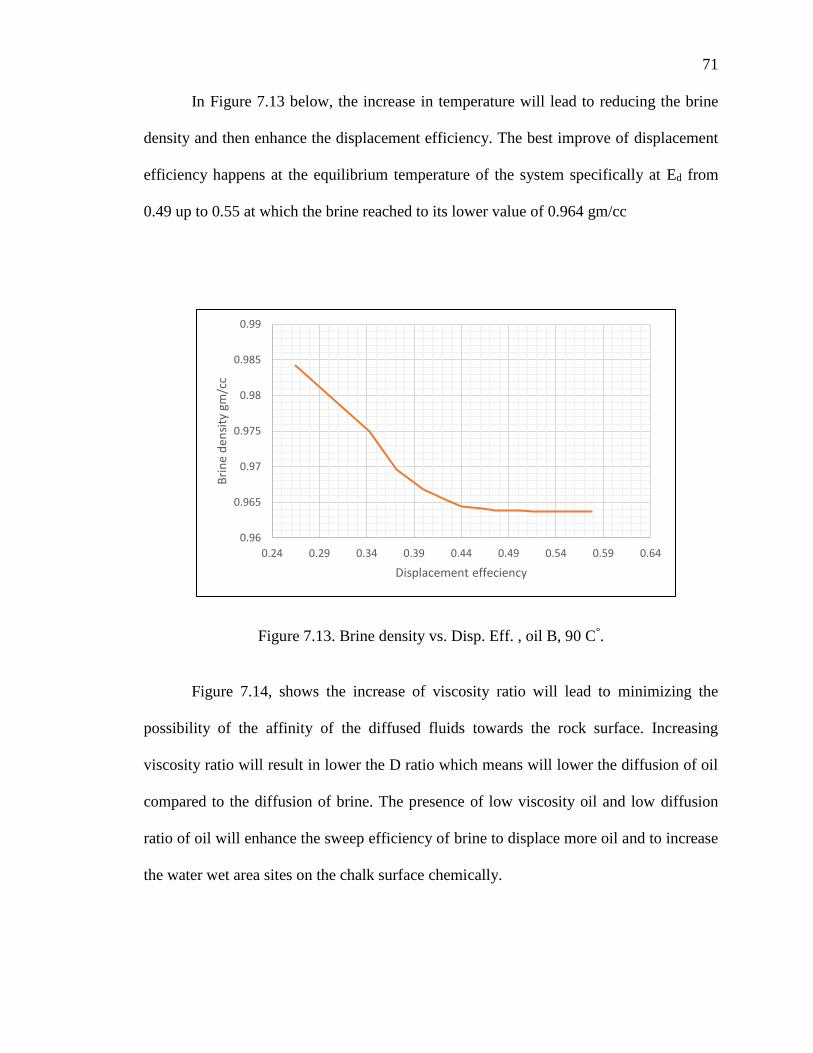
71
In Figure 7.13 below, the increase in temperature will lead to reducing the brine
density and then enhance the displacement efficiency. The best improve of displacement
efficiency happens at the equilibrium temperature of the system specifically at Ed from
0.49 up to 0.55 at which the brine reached to its lower value of 0.964 gm/cc
Figure 7.13. Brine density vs. Disp. Eff. , oil B, 90 C°.
Figure 7.14, shows the increase of viscosity ratio will lead to minimizing the
possibility of the affinity of the diffused fluids towards the rock surface. Increasing
viscosity ratio will result in lower the D ratio which means will lower the diffusion of oil
compared to the diffusion of brine. The presence of low viscosity oil and low diffusion
ratio of oil will enhance the sweep efficiency of brine to displace more oil and to increase
the water wet area sites on the chalk surface chemically.
0.96
0.965
0.97
0.975
0.98
0.985
0.99
0.24 0.29 0.34 0.39 0.44 0.49 0.54 0.59 0.64
Bri
ne
den
sity
gm
/cc
Displacement effeciency

72
Figure 7.14. Viscosity ratio vs. D ratio. Oil B, 90 C°
Figure 7.15 below, when the diffusion ratio decreases the contact angle decrease as
well. The fact behind that behavior is when the diffusivity ratio reduction means the
dissemination of oil onto the rock surface is less than the diffusion of brine. In another
word, the higher the diffusion of brine compared to the oil diffusion the larger reduction of
contact angle and then the bigger chance to get water wet faster. With temperature
increasing of the system, the oil and brine viscosities will decrease gradually but, the rate
of reduction of oil viscosity is higher than the rate of reduction of brine viscosity. (Table
6.8 Pg. 58), shows the brine viscosity to oil viscosity ratio. This ratio will continue to
increase as the temperature will increase which means that the denominator (oil viscosity)
will reduce faster the numerator (brine viscosity).
0
0.2
0.4
0.6
0.8
1
1.2
0.25 0.27 0.29 0.31 0.33 0.35 0.37
Vis
cosi
ty r
atio
D ratio

73
Figure 7.15. Contact Angle vs. D ratio, oil B, 90 C°
From Figure 7.16 below, it can see easily that when the average temperature sill
increasing the Dratio decrease which means the diffusion of oil less than the diffusion of
brine for this reason piston like displacement for oil by brine lead to enhanced the oil
recovery at 90 C⁰.
Figure 7.16. Dratio vs. Avg. Temp. Oil B, 90 C°
0
10
20
30
40
50
60
70
80
90
0 0.2 0.4 0.6 0.8 1 1.2
Co
nta
ct a
ngl
e
D ratio
0
0.2
0.4
0.6
0.8
1
1.2
35 45 55 65 75 85 95
Dra
tio
Avg. Temp C

74
In Figure 7.17 below, the system has reached its peak oil recovery at the final
ambient temperature and regardless the increasing of oil rate, the interfacial tension of the
system still at fixed value of 21 dyne/cm and doesn’t improve since it is a function of the
temperature which has reached to its final value of 90 C°.
Figure 7.17. Oil Recovery vs. Interfacial tension dyne/cm at 90 C°
From Figure 7.18 below, it can easily observe that when the average temperature
increased gradually as in (Table 6.10 pg 59) inside the system, the contact angles continue
to decrease. At the final proposed temperature of the test which is 100 C°, the system
reached to its magnitude of the conservative heat energy, and the contact angle stabilized
at a value of 57°.
0
0.1
0.2
0.3
0.4
0.5
0.6
0.7
0 20 40 60 80 100
Oil
reco
vey
frac
tio
n
Interfacial tension dyne/cm

75
Figure 7.18. Contact Angle vs. Q system, oil A, 100 C°
From Figure 7.19 below, the increase of displacement sweep efficiency due to the
reduction of remaining oil saturation during the imbibition time of the test leads to decrease
the contact angle. When the system reached to its highest oil recovery in which the
remaining oil saturation will be at the lowerest value, the contact angle reached to the
combined value of 57°at the end of the imbibition time regardless the rate of oil produced.
Figure 7.19. Contact Angle vs. Ed, oil A, 100 C°
0
10
20
30
40
50
60
70
80
90
0 500 1000 1500 2000 2500 3000 3500
Co
nta
ct a
nlg
e
Qsystem
0
10
20
30
40
50
60
70
80
90
0.15 0.17 0.19 0.21 0.23 0.25 0.27 0.29 0.31 0.33
Co
nta
ct a
ngl
e
Ed

76
Figure 7.20 below, shows the precise behavior of brine density reduction with
increasing the average system temperature. The brine density will be constant at the
equilibrium temperature 100 C°.
Figure 7.20. Brine density vs. Avg. Temp. , Oil A, 100 C°
In Figure 7.21 below, when the average temperature exceeds 90 C°, the viscosity
ratio has decreased, and the reason is that beyond 90 C° the Ca+2 affinity will increase
compared to the affinity of sulfate and the recovery still improved but in less degree
compared to Oil B at 70 C° and 90 C°.
0.95
0.955
0.96
0.965
0.97
0.975
0.98
0.985
35 45 55 65 75 85 95 105
Bri
ne
den
sity
gm
/cc
Avg. Temp. C

77
Figure 7.21. Viscosity ratio vs. Avg. Temp. , oil A, 100 C°
In Figure 7.22 below, the diffusivity ratio will be affected by the new active Ca+2
affinity onto the chalk surface. The presence of Ca+2 besides sulfate will obstacle the sulfate
effectiveness to be the preferable solute of wetting.
Figure 7.22. D ratio vs. Avg. Temp. , Oil A, 100 C°
0.1525
0.153
0.1535
0.154
0.1545
0.155
0.1555
0.156
35 45 55 65 75 85 95 105
Vis
cosi
ty r
atio
Avg.Temp C
0
0.1
0.2
0.3
0.4
0.5
0.6
0.7
35 45 55 65 75 85 95 105
D r
atio
Avg. Temp C

78
Figure 7.23 below, when the diffusion ratio decreases the contact angle decrease as
well. The fact behind that behavior is when the diffusivity ratio reduction means the
dissemination of oil onto the rock surface is less than the diffusion of brine. In another
word, the higher the diffusion of brine compared to the oil diffusion the larger reduction of
contact angle and then the bigger chance to get water wet faster. With temperature
increasing of the system, the oil and brine viscosities will decrease gradually but, the rate
of reduction of oil viscosity is higher than the rate of reduction of brine viscosity. (Table
6.11 Pg. 60), shows the brine viscosity to oil viscosity ratio. This ratio will continue to
increase as the temperature will increase which means that the denominator (oil viscosity)
will reduce faster the numerator (brine viscosity).
Figure 7.23. Contact Angle vs. D ratio, oil A, 100 C°
0
10
20
30
40
50
60
70
80
90
0 0.1 0.2 0.3 0.4 0.5 0.6 0.7
Co
nta
ct a
ngl
e
D ratio

79
Figure 7.24 below, shows that the possibility of oil fingering is great since the oil
A has a viscosity (3.38 cp) higher than in oil B (2.6 cp) in addition to the high temperature
above 90 C° will encourage Ca+2 to diffuse more and obstacle the sulfate diffusion for this
reason oil will diffuse more onto the rock surface and will lead to increase the D ratio. The
another reason is the possibility of Anhydrite mineral deposition which is as mentioned
before an exothermic reaction. The increasing of temperature will reverse the Anhydrite
reaction to endothermic which means less aqueous sulfate inside the porous medium in
addition to the affinity of Ca+2 that has improved after raising the core temperature above
90 C°.
Figure 7.24. D ratio vs. Viscosity ratio, oil A, 100 C°
0
0.1
0.2
0.3
0.4
0.5
0.6
0.7
0.1525 0.153 0.1535 0.154 0.1545 0.155 0.1555 0.156
D r
atio
Viscosity ratio

80
In Figure 7.25 below, the system has reached its peak oil recovery at the final
ambient temperature and regardless the increasing of oil rate, the interfacial tension of the
system still at fixed value of 22 dyne/cm and doesn’t improve since it is a function of the
temperature which has reached to its final value of 100 C°.
Figure 7.25. Oil recovery vs. Interfacial tension oil A, 100 C°
From Figure 7.26 below, it can easily observe that when the average temperature
increased gradually as in (Table 6.13 pg 60) inside the system, the contact angles continue
to decrease. At the final proposed temperature of the test which is 120 C°, the system
reached to its magnitude of the conservative heat energy, and the contact angle stabilized
at a value of 56⁰.
0
0.05
0.1
0.15
0.2
0.25
0.3
0.35
0 20 40 60 80 100 120 140 160 180
Oil
reco
very
fra
ctio
n
Interfacial tension dyne/cm

81
Figure 7.26. Contact Angle vs. Qsys, oil A, 120 C°
From Figure 7.27 below, the increase of displacement sweep efficiency due to the
reduction of remaining oil saturation during the imbibition time of the test leads to decrease
the contact angle. When the system reached to its highest oil recovery in which the
remaining oil saturation will be at the lowerest value, the contact angle reached to the
combined value of 56°at the end of the imbibition time regardless the rate of oil produced.
Figure 7.27. Contact Angle vs. Ed oil A, 120 C°
0
10
20
30
40
50
60
70
80
0 1000 2000 3000 4000 5000 6000
Co
nta
ct a
ngl
e
Q sys
0
10
20
30
40
50
60
70
80
0 0.1 0.2 0.3 0.4 0.5
Co
nta
ct a
ngl
e
Ed

82
In Figure 7.28 below, the increase in temperature will lead to reducing the brine
density and then enhance the displacement efficiency. The best improve of displacement
efficiency happens at the equilibrium temperature of the system specifically at Ed from
0.41 up to 0.45 at which the brine reached to its lower value of 0.937 gm/cc
Figure 7.28. Brine density vs. Ed oil A, 120 C°
Figure 7.29 below, shows that the possibility of oil fingering is great since the oil
A has a viscosity (3.38 cp) higher than in oil B (2.6 cp) in addition to the high temperature
above 90 C° will encourage Ca+2 to diffuse more and obstacle the sulfate diffusion for this
reason oil will diffuse more onto the rock surface and will lead to increase the D ratio. The
another reason is the possibility of Anhydrite mineral deposition which is as mentioned
before an exothermic reaction. The increasing of temperature will reverse the Anhydrite
reaction to endothermic which means less aqueous sulfate inside the porous medium in
addition to the affinity of Ca+2 that has improved after raising the core temperature above
90 C°.
0.935
0.94
0.945
0.95
0.955
0.96
0.965
0.97
0.975
0.98
0.2 0.25 0.3 0.35 0.4 0.45
Bri
ne
den
sity
gm
/cc
Ed

83
Figure 7.29. Dratio vs. Viscosity ratio, oil A, 120 C°
Figure 7.30 below, shows the clear behavior of crude oil A. As the temperature still
rising the viscosity ratio will decrease but since above 90 C⁰ the affinity of sulfate will be
lower due to the fact of existing new determining ion will be activated. Based on Le
Chatelier principle in reversal reactions the increasing of average temperature gradually
inside the porous medium will reinforce the chalk thermal cracking reaction mention below
to stay in an Endothermic forward reaction which means more Ca+2 will present in the
solution. On the other hand, the existing of Anhydrite as undesirable mineral which is
Exothermic reaction will lead to reduce the amount of aqueous sulfate in the solution which
means the reaction will be reversed to backward direction when the temperature still
increasing in a way that lead to deposit Anhydrite in front of the path of flow. The existing
of deposition means lowering the possibility of sulfate to diffuse and enhance the oil
recovery.
0
0.1
0.2
0.3
0.4
0.5
0.6
0.7
0.8
0.147 0.148 0.149 0.15 0.151 0.152 0.153 0.154 0.155 0.156
D r
atio
Viscosity ratio

84
CaCo3 ↔ Ca+2 + Co3−2
is Endothermic reaction
CaSo4 ↔ Ca+2 + So4−2
is Exothermic reaction
Figure 7.30. Viscosity ratio vs. Avg. Temp. , oil A, 120 C°
In conclusion, the general formula proposed has calculated the contact angles from
neutral wet to water wet in the presence of sulfate with two types of crude oil, oil A, and B
and has concluded that:
1. There is a chemical, and physical connection of the candidate relationships used with
the stability of the reactions – thermal conditions happening inside the porous medium.
2. The general formula created by Buckingham pi theorem and by trial and error attempts
to control the handle of dominant conceptual parameters has succeeded to give an idea
about the way of wettability alteration mechanism going on.
0.147
0.148
0.149
0.15
0.151
0.152
0.153
0.154
0.155
0.156
0 20 40 60 80 100 120 140
Vis
cosi
ty r
atio
Avg. Temp. C°

85
3. Sulfate is the best determining ion in the ranges of 70 C°, 90 C°due to the smooth
interpretations obtained from figures to describe the wettability alteration by using the
general formula.
4. The general formula is valid for ranges 100 C°and 120 C°and has successfully
diagnosed the offset in sulfate affinity behavior and shows the affinity of Ca+2 when
the temperature exceeds 90 C°.
5. The proposed concepts such as the D ratio and Viscosity ratio are another diagnosing
tool about the reverse attitude of the wetting and non-wetting regarding diffusivity
differences.
6. The figures obtained using the general formula can easily use to detect the presence of
fingering especially in oil type A.
7. The general formula approved the reality of the importance of temperature as the main
crucial factor of wettability alteration mechanism in carbonate.
8. The general formula has introduced the physical properties and the thermal reactions
of the exposed surfaces of the porous medium to the wetting phase used in an easy and
logical way starting with a macroscopic understanding of the quantities that accompany
with the gradual growth of the flow and heat distributions.
9. This work has given a different explanation to the mineral deposition probability
through the figures created by the general formula.

86
The recommendations after this work are:
1. Start to examine the general formula validity to the other determining ions such as Ca+2,
Mg+2.
2. Imply the economic factor in the case of using this formula practically.
3. Examine the results of the general formula with a different range of temperatures.
4. Using the general formula with different carbonate rocks such as limestone and
dolomite.
5. Modify the general formula by adding another factor that will not contradict with Darcy
assumptions in flow through the porous medium and the salinity ranges of carbonates.

87
BIBLIOGRAPHY
Al – Attar, H. H., Mahmoud, M. Y., Zekri, A. Y., Almehaideb, R. A. and Ghannam,
M.T. (2013). Low Salinity Flooding in a Selected Carbonate Reservoir: Experimental
Approach. SPE 164788 paper presented at the EAGE Annual Conference &
Exhibition, 10-13 June, London, UK.
Al – Harrasi, A. S., Al-Maamari, R. S., & Masalmeh, A. (2012). Laboratory Investigation
of Low Salinity Waterflooding for Carbonate Reservoirs. "SPE 161468" paper
presented at the Abu Dhabi International Petroleum Conference and Exhibition, 11-
14 November, Abu Dhabi, UAE.
Al – Mumen, A. A. (1990). The Effect of Injected Water Salinity on Oil Recovery, MSc.
Thesis, KFUPM, May 1990.
Alotaibi, M.B. & Naser- El-Din, H. A., 2009. Chemistry of Injection Water and its Impact
on Oil Recovery in Carbonate and Clastic Formations. SPE 121565, (Presented at the
2009 SPE International Symposium on Oilfield Chemistry Held in the Woodlands,
Texas, USA, 20-22 April 2009).
Austad, T., S. Strand, E. J. Hognesen, and P. Zhang (2005). Seawater as IOR fluid in
fractured chalk. Paper SPE 93000, presented at the 2005 SPE International
Symposium on Oilfield Chemistry, Houston, TX, USA, February 2-4.
Alvarado, V. and E. Manrique (2010). "Enhanced oil recovery: an updated review." Energi
es 3(9): 1529-1575.
Bagci, S., Kok, M. V., and Turksoy, U. 2001. Effect of Brine Composition on Oil
Recovery by Waterflooding. Petroleum Science and Technology 19 (3-4): 359-372.
Cuiec, L. (1984). Rock/crude-oil interactions and wettability: An attempt to understand
their interrelation. SPE Annual Technical Conference and Exhibition, Society of Petroleum Engineers.
Evgeny, Maevskiy. (2014) Mechanism of Primary and Secondary Oil Flooding for
Recovery from Chalk by Low Salinity Water. MSc. Thesis, University of Stavanger,
2014.
Fathi, S. J., et al. (2010). "“Smart Water” as a Wettability Modifier in Chalk: The Effect o
f Salinity and Ionic Composition." Energy & Fuels 24(4): 2514-2519.
Fathi, S. J., et al. (2011). "Water-based enhanced oil recovery (EOR) by "smart water":
Optimal ionic composition for EOR in carbonates." Energy and Fuels 25(11): 5173-
5179.

88
Fathi, S. J., et al. (2011). "Effect of water extractable carboxylic acids in crude oil
on wettability in carbonates." Energy & Fuels 25(6): 2587-2592.
Hallenbeck, L.D., Sylte, J.E., Ebbs, D.J. and Thomas, L.K.: "Implementation of the Ekofisk
Field Waterflood,"SPE Formulation Evaluation, 6, 284-290(1991).
Hognesen, E.J., Strand, S. and Austad, T.: "Waterflooding of Preferential Oil-Wet
Carbonate: Oil Recovery Related to Reservoir Temperature and Brine Composition,"
SPE 94166, presented at SPE EAGE Annual Conference, Madrid, Spain, 13-16 June
2005.
Jadhunandan, P., 1990. Effect of Brine Composition, Crude Oil and Aging Conditions on
Wettability and Oil Recovery. Ph.D. Dissertation. U. of Wyoming.
Karoussi, O. and Hamouda A. A., 2008."Imbibition of Sulfate and Magnesium Ions into
Carbonate Rocks at Elevated Temperatures and Their Influence on Wettability
Alteration and Oil Recovery." Energy and Fuels 22(3), pp.2129-2130.
Kwak, H.T., Yousef, A. A., & Al-Saleh, S. (2014). New Insights on the Role of Multivalent
Ions in Water-Carbonate Rock Interactions. "SPE 169112" paper presented at the
SPE Improved Oil Recovery Symposium, 12-16 April, Tulsa, Oklahoma, USA.
Ligthelm, D.L., Gronsveld, J., Hofman, J.P., Brussee, N.J., Marcelis, F.and Van der Linde,
H. A.: "Novel Waterflooding Strategy by Manipulation of Injection Brine
Composition," SPE 119835, presented at EUROPEC/EAGE Conference and
Exhibition, Amsterdam, The Netherlands, 8-11 June 2009.
Rao, D. N. (1996). Wettability effects in thermal recovery operations. SPE/DOE Improved
Oil Recovery Symposium, Society of Petroleum Engineers.
RezaeiDoust, A., et al. (2009). "Smart water as wettability modifier in carbonate &
sandstone: A discussion of similarities/differences in the chemical mechanisms."
Energy & Fuels 23(9): 4479-4485.
Shariatpanahi, S. F., et al. (2011). "Initial wetting properties of carbonate oil reservoirs:
effect of the temperature and presence of sulfate in formation water." Energy &
fuels 25(7): 3021-3028.
Shimoyama, A. and W. D. Johns (1972). "Formation of alkanes from fatty acids in th
e presence of CaCO3." Geochimica et Cosmochimica Acta 36(1): 87-91.
Sheng, J. (2013). Enhanced oil recovery field case studies, Gulf Professional Publishing.
Speight, J. G. (1999). The desulfurization of heavy oils and residua, CRC Press.

89
Strand, S., D.C. Standnes and T. Austad (2006). New Wettability tests for chalk. J. Pet.
Sci. Eng., v. 52, pp. 187-197.
Standnes, D. C. and T. Austad (2000). "Wettability alteration in chalk 2. The mechanism for wettability alteration from oil-wet to water-wet using surfactants." Journal ofPetroleum Science and Engineering 28(3): 123-14
Standnes, D. C. and T. Austad (2000). "Wettability alteration in chalk: 1. Preparation c
ore material and oil properties." Journal of Petroleum Science and Engineering
28(3): 111-121.
Standnes, D. C. and T. Austad (2000). "Wettability alteration in chalk: 2. The
mechanism for wettability alteration from oil-wet to water-
wet using surfactants." Journal of Petroleum Science and Engineering 28(3): 123-
143.
Sylte, J. E., Hallenbeck, L.D., and Thomas, L.K.:"Ekofisk Formation Pilot
Waterflood,"SPE 18276, presented at SPE Annual Technical Conference and
Exhibition, Houston, Texas, 2-5 October 1988.
Taber, J.J., and Martin, F. D.:"Technical Screening Guides for Enhanced Recovery of Oil,"
SPE 12069, presented at SPE Annual Technical Conference and Exhibition,
SanFranscico California, 5-8 October 1982.
Vledder, P., Fonsica, J. C., Gonzalez, I., Lighthelm, D. 2010. Low Salinity Water Flooding:
Proof of Wettability Alteration on a Field Wide Scale. Paper SPE 129564 presented
at the SPE Improved Oil Recovery Symposium, Tulsa, Oklahoma, USA. 24-28 April.
Xie, X., et al. (2004). Improved oil recovery from carbonate reservoirs by chemical stimulation. SPE/DOE Symposium on Improved Oil Recovery, Society of
Petroleum Engineers.
Yousef, Ali A, Al-Saleh, S., Al-kaabi, A., &Al-jawfi, M. (2010). Laboratory Investigation
of Novel Oil Recovery Method for Carbonate Reservoirs," SPE 137634" paper
presented at the Canadian Unconventional Resources and International Petroleum
Conference, 19-21 October, Calgary, Alberta, Canada.
Yousef, Ali A, Al –Saleh, S., & Al-jawfi, M. (2011). Smart Waterflooding for Carbonate
Reservoirs: Salinity and Role of Ions. "SPE 141082" paper presented at the SPE
Middle East Oil and Gas Show and Conference, 25-28 September, Manama, Bahrain,
(September), 25-28.
Yousef, Ali A, Al-Saleh, S., & Al-jawfi, M. (2012).Improved / Enhanced Oil Recovery
from Carbonate Reservoirs by Tuning Injection Water Salinity and Ionic Content.
"SPE 154076" paper presented at the SPE Improved Oil Recovery Symposium, 14-
18 April, Tulsa, Oklahoma, USA.

90
Yousef, Ali A., Al-Saleh, S., &Al-jawfi, M. (2012). The Impact of the Injection water
chemistry on Oil Recovery from Carbonate Reservoirs. "SPE 154077" paper
presented at the SPE EOR Conference at Oil and Gas West Asia held in Muscat,
Oman, 16-18 April 2012.
Yousef, A. A., Ayirala, S. C., Al-Saleh, S. (2014). A Novel Water Ionic Composition
Optimization Technology for Smart Water Flooding Application in Carbonate
Reservoirs. "SPE 169052-MS" paper presented at the SPE Improved Oil Recovery
Symposium, 12-16 April, Tulsa, Oklahoma, USA.
Yu, L., et al. (2007). Wettability Alteration of Chalk by Sulphate Containing Water,
Monitored by Contact Angle Measurement. Paper SCA2007-01 presented at the
International Symposium of the Society of Core Analysts, Calgary, Canada.
Zahid, A., Shpiro, A. and Skauge, A.2012. Experimental Studies of Low Salinity Water
Flooding in Carbonate Reservoir: A New Promising Approach. Paper SPE-155625-
MS presented at the SPE EOR Conference at Oil and Gas West Asia, Muscat, Oman,
16-18 April.
Zerki, A.Y., Nasr, M. S., and Al-Arabai, Z. I. (2011). Effect of LoSal on wettability and
oil recovery of carbonate and sandstone formation. Paper SPE 14131-MS presented
at the international petroleum technology conference, 15-17 November, Bangkok,
Thailand.
Zhang, P., et al. (2007). "Wettability alteration and improved oil recovery by spontaneous
imbibition of seawater into chalk: Impact of the potential determining ions Ca 2+,
Mg 2+, and SO 4 2−." Colloids and Surfaces A: Physicochemical and Engineering
Aspects 301(1): 199-208.

91
VITA
Ahmed Abdul Kareem Hussein Albahrani graduated and was awarded his Bachelor
degree in Petroleum Engineering in July 2006 from Baghdad University. He was
outstanding student ranked 8th from 110 undergraduate students. He has been a member of
Society of Petroleum Engineers (SPE) since September 2014. His experiences in Maysan
Oil Company (M.O.C) extended to 9 years as Production Engineer, Reservoir Engineer,
Petrophysical Engineer, Documentation and Administration, Drilling Equipment Design
and Programming, and finally as a Drilling Supervisor. He started his study in Missouri
University of Science and Technology in Fall 2014. In December 2016, he received his
MSc. in Petroleum Engineering from the Missouri University of Science and Technology,
Rolla, Missouri, USA.