conceptualizing drivers of change for improved food security policies
Upload: international-food-policy-research-institute-development-strategy-and-governance-division
Post on 16-Feb-2017
232 views
TRANSCRIPT

Conceptualizing Drivers of Change
for Improved Food Security Policies
Danielle Resnick (IFPRI)
October 28, 2015
Maputo, Mozambique

Outline
1) Motivations for a conceptual framework of drivers of policy change
2) Introducing components of Kaleidoscope Model
3) Brief application of the Model to Ghana’s input subsidy program

Motivations and Objectives
• Achieving policy impact requires a deep understanding of the national policy process to identify practical entry points
• The process is messy, opaque, with volatility and incoherence, but…can we find an operational framework with testable hypotheses?
• Doing so requires reconciling silver bullet approaches from the development community with academic policy process theorizing

Development Community Approaches
Hypotheses Operational examples
Monte Carlo Changes in the payoff matrix influence the
likelihood and direction of public
investments and policy change.
• Policy lending, 1960s
• SAPs, 1980s
• CAADP investment plans, 2000s
Sherlock Holmes Better empirical evidence leads to better
policies.
• IFPRI, HIID, ReSAKSS
• UN - HLPE, HLTF, SCN
Contagion
Inoculation
Policy inoculation, by showcasing
prominent policy “success stories,” can
spur international emulation.
• SUN initiative
• Abuja Fertilizer Summit
Frank Lloyd
Wright
Open, transparent, inclusive, evidence-
based policy processes improve policy
outcomes.
• CAADP peer-reviewed country
investment programs
• Joint Sector Reviews
• GAFSP
• New Alliance
Hercules Champions of policy change can overcome
flawed institutional architecture to effect
policy change.
• Africa-Lead “Champions of Change”
• AGRA policy champions
• Transform Nutriton Champions
Masters of the
Universe
Top-down negotiations and high-level
commitments can enable and enforce
policy change.
• New Alliance agreements
• CAADP regional compacts

Academic Approaches
Dominant view of
the state
What shapes actors' behavior?
Interests Institutions Ideas and Identity
Captured by society Public choice theory
Marxism
Autonomous from
society, unitary
preferences
Elitist theory Street level bureaucrats
Corporatism
Developmental states
Interactive with
society, diverse
preferences
Multiple streams
Punctuated equilibrium
Policy paradigms
Policy networks theory
Advocacy coalitions
Social construction theory
Our Approach
• Inductively derived by comparing existing case studies of policy change in developing regions in domains related to food security (e.g. health, education, agriculture, social protection)
• Macro variables were identified across cases that were consistently important in explaining why a policy reached a particular stage of the policy process
• Attention given to highlighting necessary and sufficient conditions for policy change to occur

The Kaleidoscope Model

Application to Policy Domains
Characteristics of
Policy Domain
Input Subsidies
Ghana, Tanzania, Zambia
Micronutrients
Malawi, S. Africa, Zambia
Evidence Base More contested
(social science)
Less contested
(medical science)
Awareness of
Problem
Short-term Long-term
Visibility of Response High Low
Beneficiaries Targeted Disperse
First Movers Domestic governments International donors
Vertical Policy
Implementation
More Complex Less Complex
Horizontal Policy
Implementation
Less Complex More Complex

Analytical Tools
• Policy chronologies –process tracing by indicating whether certain events precipitated subsequent policy changes
• Agricultural policy mapping- identifies key institutions and frameworks, regulations, procedures, etc.
• Policy domain mapping - roles of key actors (e.g.formulation, administration, oversight, or knowledge)
• Stakeholder inventories - identifies perceived winners and losers and their preferences
• Circle of influence graphics - aligns stakeholders in a two dimensional space to map their preferences vis-à-vis a policy with their power

Application to Ghana FSP
Item 2008 2009 2010 2011 2012 2013 2014 2015
Average subsidy
as share of
market price (%)
30.3 40.4 41.2 44.2 47.0 25.8 N/A 21
Actual
subsidized
fertilizer (mt)
43,176 72,795 91,244 176,278 173,755 166,809 N/A 180,000
Subsidy
expenditures as
% of total MoFA
agricultural
expenditures
20.2 23.6 18.8 32.6 53.3 19.5 N/A 22
• Started in mid-2008 through a voucher system and is based on a private sector “friendly” approach
• Switched to a waybill system in 2010• Targeting food crop producers
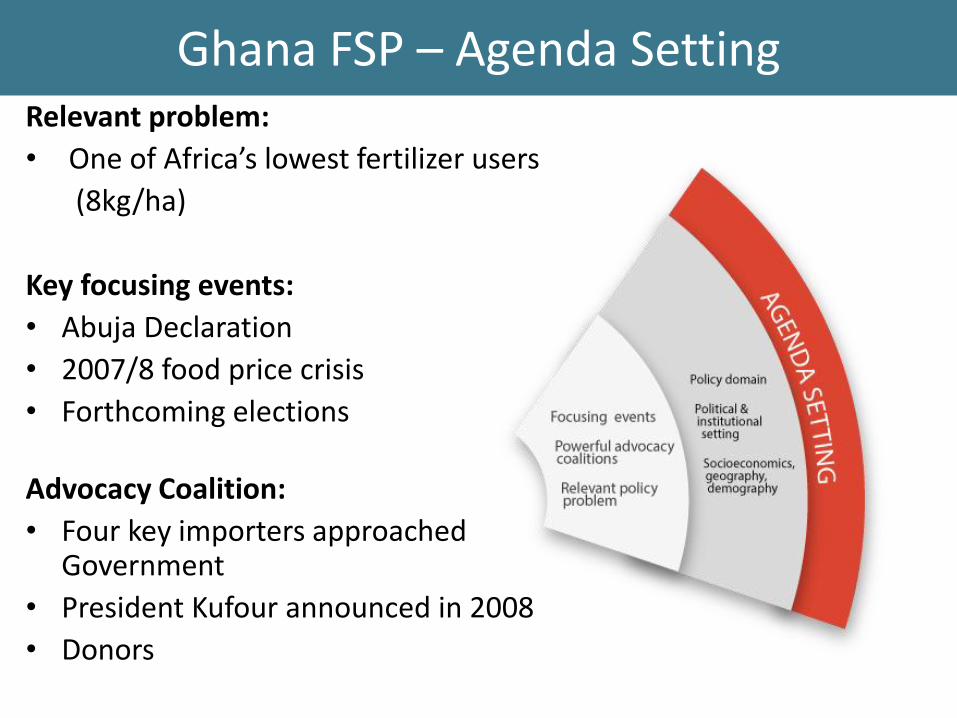
Ghana FSP – Agenda Setting Relevant problem:
• One of Africa’s lowest fertilizer users
(8kg/ha)
Key focusing events:
• Abuja Declaration
• 2007/8 food price crisis
• Forthcoming elections
Advocacy Coalition:
• Four key importers approached Government
• President Kufour announced in 2008
• Donors
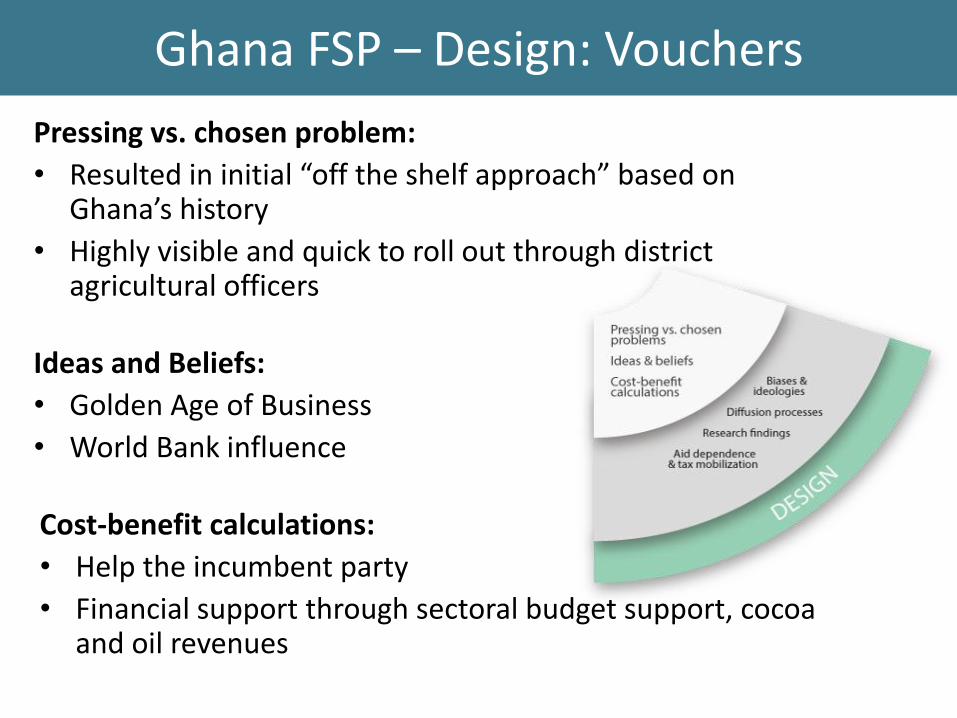
Ghana FSP – Design: Vouchers
Pressing vs. chosen problem:
• Resulted in initial “off the shelf approach” based on Ghana’s history
• Highly visible and quick to roll out through district agricultural officers
Ideas and Beliefs:
• Golden Age of Business
• World Bank influence
Cost-benefit calculations:
• Help the incumbent party
• Financial support through sectoral budget support, cocoa and oil revenues
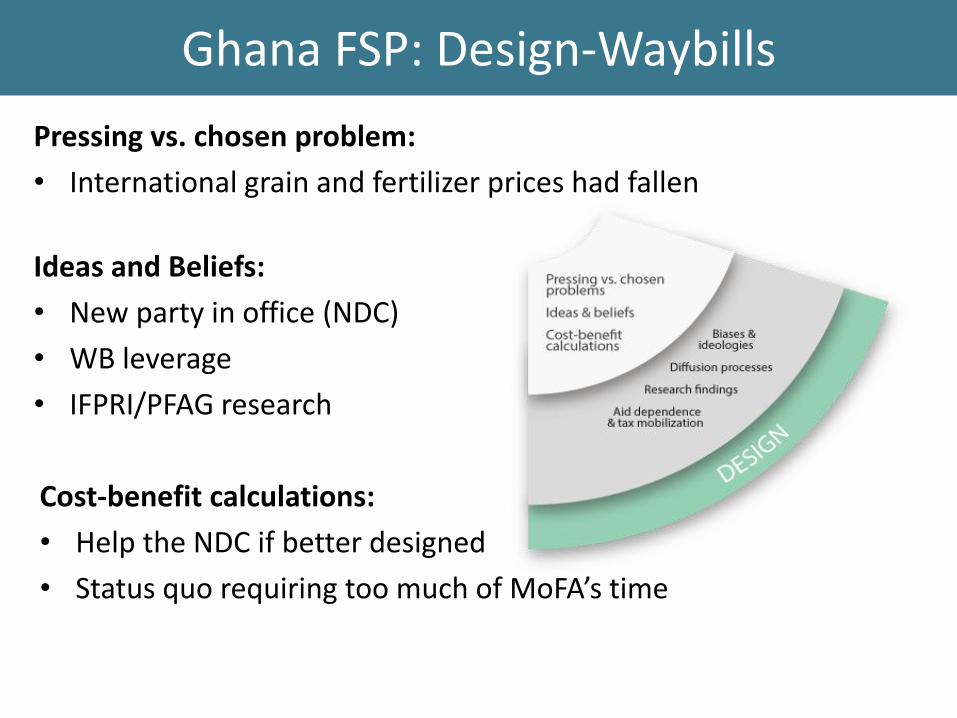
Ghana FSP: Design-Waybills
Pressing vs. chosen problem:
• International grain and fertilizer prices had fallen
Ideas and Beliefs:
• New party in office (NDC)
• WB leverage
• IFPRI/PFAG research
Cost-benefit calculations:
• Help the NDC if better designed
• Status quo requiring too much of MoFA’s time

Ghana FSP: Adoption
Veto players:
• “Our democracy is such that if the President says we want to invest in more roads (for instance), that becomes a policy imperative that year”
Power of opponents vs. proponents:
• Opposed by Committee for Joint Action
• Supported by PFAG & MoF
Propitious timing:
• 7 months before elections
• AgDPO approved just a few weeks before program announcement

Conclusions about Kaleidoscope Model
• Potential for predictive explanation for why some policies are adopted but never implemented, and why some never even get on the agenda
• Opportunities for controlled comparative analysis by identifying common drivers of policy change in…– similar policy domains across different countries – different policy domains within the same country
• Integrates importance of interests, ideas, and institutions, as well as the relative weight of external and domestic actors
• Identifies relative weight of research compared with many other factors and when research may have the most impact

Thank you!
www.feedthefuture.gov