conceptualizing proportional representationpaperroom.ipsa.org/papers/paper_31318.pdf ·...
TRANSCRIPT

1
Conceptualizing proportional representation
IPSA Paper Montreal 2014. Panel Electoral Systems, Competition and Participation
Luis Eduardo Medina Torres, Karolina Gilas1
Classification of electoral systems has been constantly discussed in the Political
Science. Usually, classifying one particular system as a part of a bigger family
(majoritarian or proportional), we expect that such a system will lead to more or less
distributive effects. However, this assumption is not very precise, as some
proportional systems may generate majoritarian effects.
Sartori indicates that, for example, the German electoral system has been
misunderstood, being clearly proportional in its effects, although considered as mixed
or combined. In fact it is none of these two, because "... the combination of its
elements does not imply a mixed result. As I said, the result is totally proportional ...
"(Sartori, 2010: 32).
We will take this Sartori's statement to argue that the conceptualization of
proportional systems should be done according to the results their produce, as there
are systems that, despite of being called proportional, act as a majoritarian (ex.
Spain), and facing the diversity of designs and variables that determine electoral
systems' effects (Lijphart 1995).
In the paper, we review the variables of electoral systems, analyze them in 32
Mexican local congress elections and propose a classification scheme based on
systems’ effects. Then we organize the thirty-two cases based on their effects.
Finally, we set parameters that we consider relevant to conceptualize and distinguish
proportional systems, from the Mexican subnational diversity.
According to previous studies (Gilas and Medina 2012; Emmerich and Medina 2005)
our initial hypotheses are:
Hypothesis 1: The adjudication system is the most disproportional, while the least
disproportional is pure proportionality; the largest reminders system lies in the middle.
Hypothesis 2: The higher the seats number limit for the biggest party,
disproportionality increases, and vice versa (the lower the limit, disproportionality
decreases).
1. Electoral systems' variables
1 Please send any questions, comments and feedback to [email protected] or [email protected].
2
The literature recognizes a number of variables that affect the configuration of
electoral systems. The decision principle (Nohlen 2004) or the electoral formula
(Lijphart 1995) usually are considered as the central variable, although Sartori (2010)
has indicated that the size of the assembly is more important.
Here we review the conventional variables plus the size of the assembly. As
suggested elsewhere (Gilas and Medina 2012), the operationalization of the variables
should be done translating legal concepts into statistical terms.
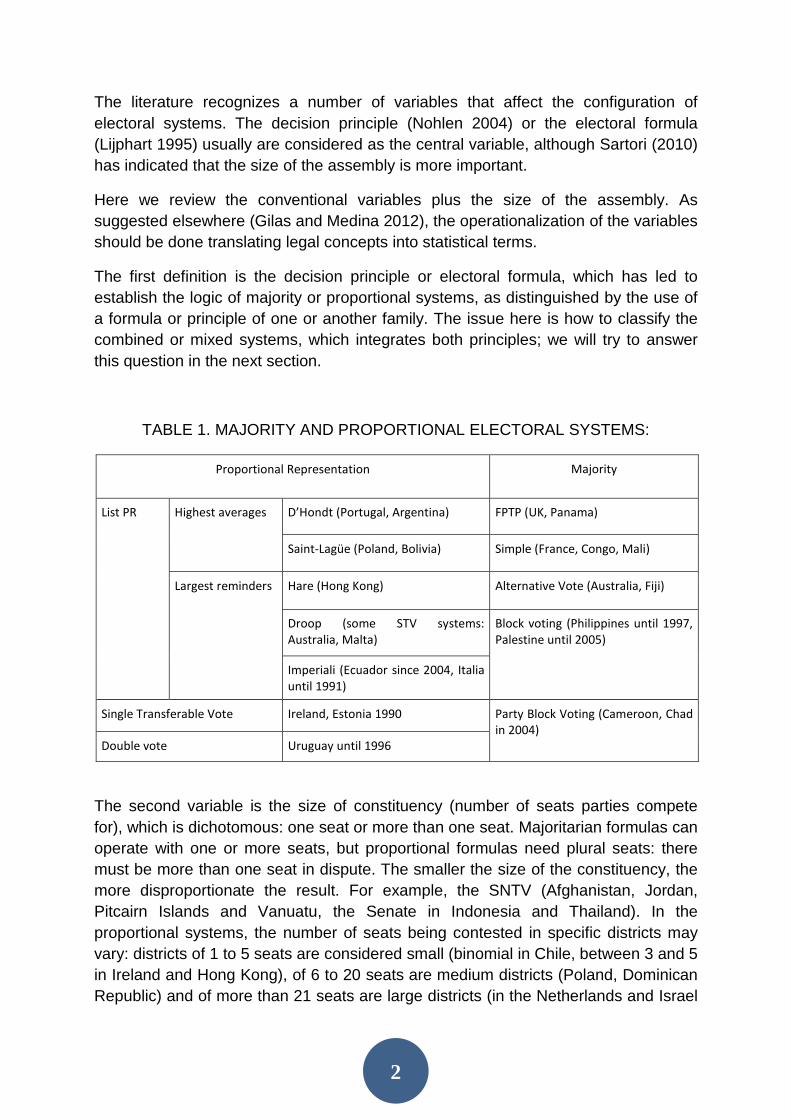
The first definition is the decision principle or electoral formula, which has led to
establish the logic of majority or proportional systems, as distinguished by the use of
a formula or principle of one or another family. The issue here is how to classify the
combined or mixed systems, which integrates both principles; we will try to answer
this question in the next section.
TABLE 1. MAJORITY AND PROPORTIONAL ELECTORAL SYSTEMS:
Proportional Representation Majority
List PR Highest averages D’Hondt (Portugal, Argentina) FPTP (UK, Panama)
Saint-Lagüe (Poland, Bolivia) Simple (France, Congo, Mali)
Largest reminders Hare (Hong Kong) Alternative Vote (Australia, Fiji)
Droop (some STV systems: Australia, Malta)
Block voting (Philippines until 1997, Palestine until 2005)
Imperiali (Ecuador since 2004, Italia until 1991)
Single Transferable Vote Ireland, Estonia 1990 Party Block Voting (Cameroon, Chad in 2004)
Double vote Uruguay until 1996
The second variable is the size of constituency (number of seats parties compete
for), which is dichotomous: one seat or more than one seat. Majoritarian formulas can
operate with one or more seats, but proportional formulas need plural seats: there
must be more than one seat in dispute. The smaller the size of the constituency, the
more disproportionate the result. For example, the SNTV (Afghanistan, Jordan,
Pitcairn Islands and Vanuatu, the Senate in Indonesia and Thailand). In the
proportional systems, the number of seats being contested in specific districts may
vary: districts of 1 to 5 seats are considered small (binomial in Chile, between 3 and 5
in Ireland and Hong Kong), of 6 to 20 seats are medium districts (Poland, Dominican
Republic) and of more than 21 seats are large districts (in the Netherlands and Israel

3
the whole territory is one constituency, with 150 seats in the first case and 120 in the
second; Mexico applies a system with five constituencies of 40 seats).
The third variable is the number of votes that a voter has. Here too, the choice is
dichotomous: one vote or more than one vote, both possibilities may be adapted to
proportional or majoritarian systems. For example, under the system of limited voting,
which is used in multi-member districts, each voter has more than one vote, but their
number is less than the number of representatives to be elected. The candidates with
the most votes win the seats. Its implementation at the national level is limited to
Gibraltar and the Spanish Senate (since 1977). Luxembourg and Switzerland uses
panachage (voters have as many votes as there are seats to fill and may distribute
them among the candidates of a single party or among several different lists, as they
prefer).
The fourth variable is the list type and there are two designs. First, an individual list,
is used for one-seat districts. The second one, party list, is used when there is more
than one seat in the game.
TABLE 2. LIST TYPES
Individual (USA, Mexico – majority tier) Closed and blocked list (Argentina, Israel)
Closed not blocked list (Brazil, Holland)
Open list (Luxemburgo, Suiza)
The fifth variable that was operationalized by Lijphart, and then adapted by Sartori, is
the size of the assembly. Its effect is similar to that of district size: the bigger the size
of the assembly, the system becomes more proportional. For example, in Mexico the
lower house has 500 deputies, in Brazil it's 513, 150 in Belgium, 130 in Uruguay and
650 in England.
These variables are used to systematize the characteristics of electoral systems. We
will use these variables to analyze Mexican subnational systems, adding one more
variable (instead of threshold): legal limit for the biggest party seats share. This
makes our classification different and organizes our cases in three families:
adjudication, largest reminders and pure proportionality.
2. Classification of Mexican subnational electoral systems
We propose to classify Mexican subnational systems into three major groups, but not
based on the electoral formula. It is so because all Mexican electoral systems are
4
combined systems, applying majoritarian and proportional formulas. For example, in
case of adjudication, there is one seat granted to any political party whose votes
number is above certain threshold. Usually there is another formula used on following
distribution steps, but in some cases adjudication itself grants all available seats.
In other cases, adjudication is followed by second or even third step, frequently
largest reminders method. Similar phenomena can be observed within largest
reminders and pure proportionality systems, where frequently use of another formula
will be required to complete the distribution and hand over all the seats.
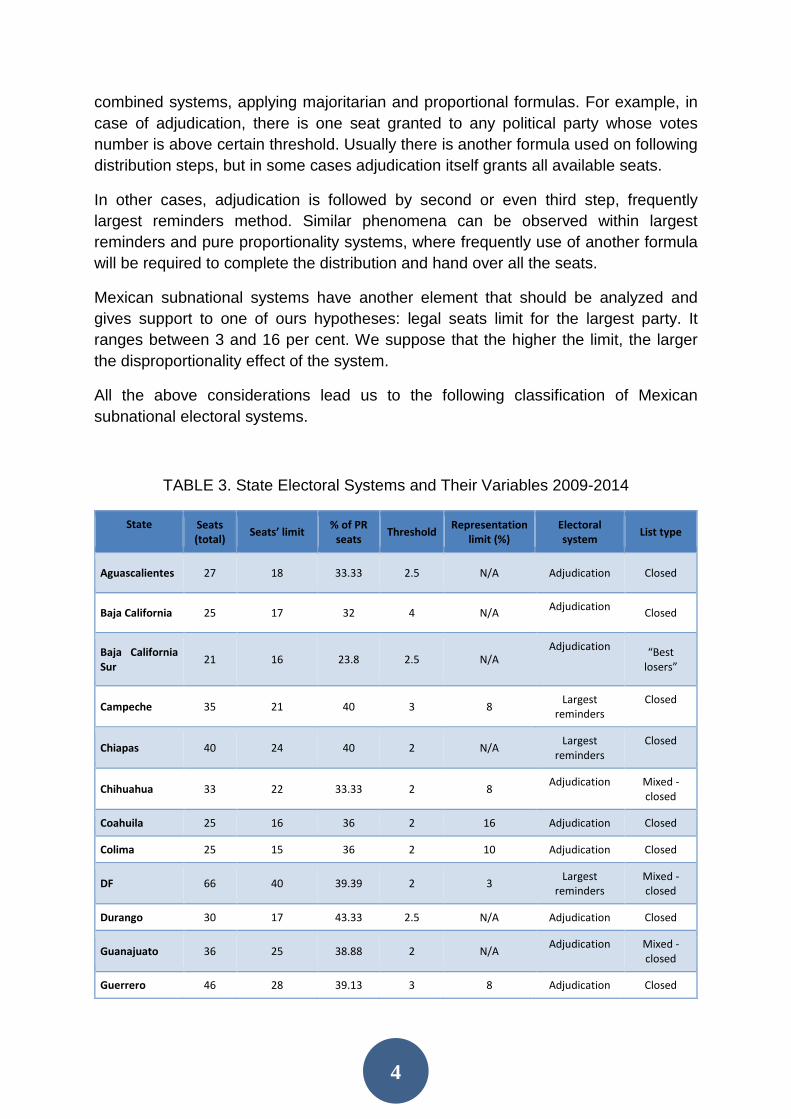
Mexican subnational systems have another element that should be analyzed and
gives support to one of ours hypotheses: legal seats limit for the largest party. It
ranges between 3 and 16 per cent. We suppose that the higher the limit, the larger
the disproportionality effect of the system.
All the above considerations lead us to the following classification of Mexican
subnational electoral systems.
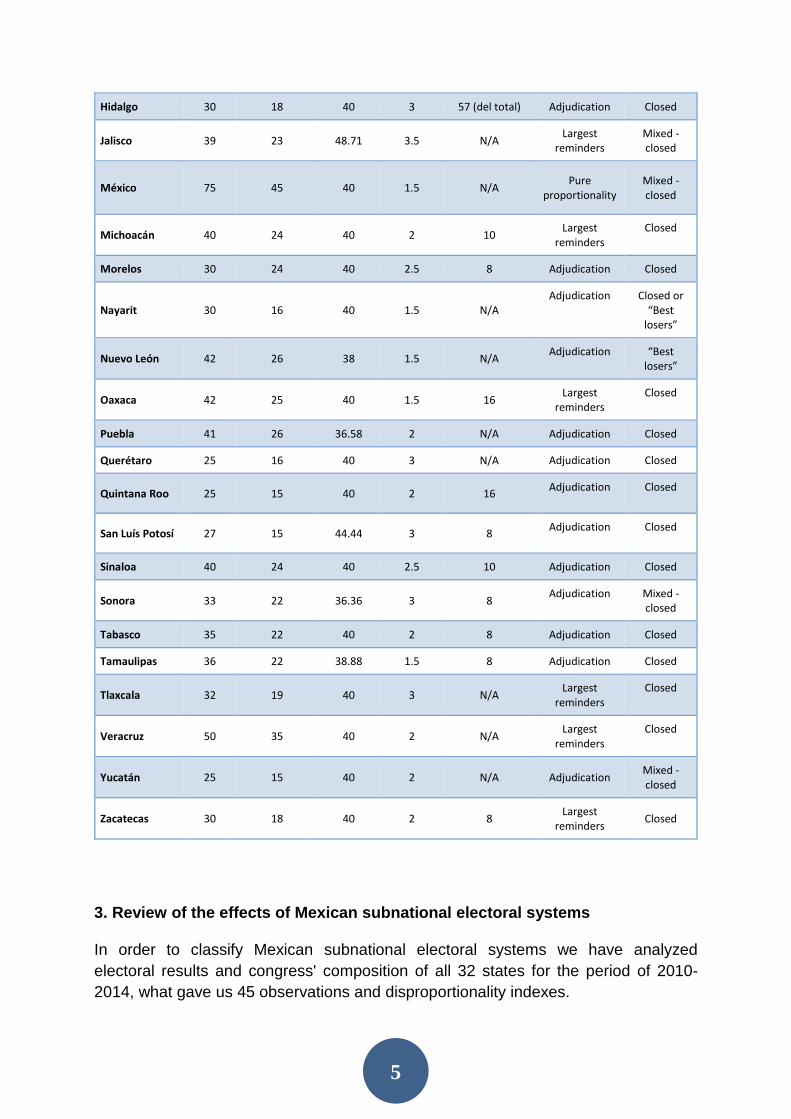
TABLE 3. State Electoral Systems and Their Variables 2009-2014
State Seats (total) Seats’ limit % of PR
seats Threshold Representation limit (%)
Electoral system List type
Aguascalientes 27 18 33.33 2.5 N/A Adjudication Closed
Baja California 25 17 32 4 N/A Adjudication Closed
Baja California Sur 21 16 23.8 2.5 N/A
Adjudication “Best losers”
Campeche 35 21 40 3 8 Largest reminders
Closed
Chiapas 40 24 40 2 N/A Largest reminders
Closed
Chihuahua 33 22 33.33 2 8 Adjudication Mixed - closed
Coahuila 25 16 36 2 16 Adjudication Closed
Colima 25 15 36 2 10 Adjudication Closed
DF 66 40 39.39 2 3 Largest reminders
Mixed - closed
Durango 30 17 43.33 2.5 N/A Adjudication Closed
Guanajuato 36 25 38.88 2 N/A Adjudication Mixed - closed
Guerrero 46 28 39.13 3 8 Adjudication Closed
5
Hidalgo 30 18 40 3 57 (del total) Adjudication Closed
Jalisco 39 23 48.71 3.5 N/A Largest
reminders Mixed - closed
México 75 45 40 1.5 N/A Pure proportionality
Mixed - closed
Michoacán 40 24 40 2 10 Largest
reminders Closed
Morelos 30 24 40 2.5 8 Adjudication Closed
Nayarit 30 16 40 1.5 N/A Adjudication Closed or
“Best losers”
Nuevo León 42 26 38 1.5 N/A Adjudication “Best losers”
Oaxaca 42 25 40 1.5 16 Largest
reminders Closed
Puebla 41 26 36.58 2 N/A Adjudication Closed
Querétaro 25 16 40 3 N/A Adjudication Closed
Quintana Roo 25 15 40 2 16 Adjudication Closed
San Luís Potosí 27 15 44.44 3 8 Adjudication Closed
Sinaloa 40 24 40 2.5 10 Adjudication Closed
Sonora 33 22 36.36 3 8 Adjudication Mixed - closed
Tabasco 35 22 40 2 8 Adjudication Closed
Tamaulipas 36 22 38.88 1.5 8 Adjudication Closed
Tlaxcala 32 19 40 3 N/A Largest reminders
Closed
Veracruz 50 35 40 2 N/A Largest reminders
Closed
Yucatán 25 15 40 2 N/A Adjudication Mixed - closed
Zacatecas 30 18 40 2 8 Largest reminders Closed
3. Review of the effects of Mexican subnational electoral systems
In order to classify Mexican subnational electoral systems we have analyzed
electoral results and congress' composition of all 32 states for the period of 2010-
2014, what gave us 45 observations and disproportionality indexes.

6
First thing noticed is that adjudication (understood as a first step in which every
political party that reaches the threshold receives one seat) was used in 31 cases
which is 68.89% of all the observations (N=45). The second most used formula is the
largest reminders method (13 observations, 28.89%), where a seat is granted on a
basis of a quota, and in case of having more seats left, largest reminders method is
applied. The third and last formula is pure proportionality, used in only one case
(2.22%), where a projection based on proportionality is made and then the number of
seats is adjusted to the size of the legislature.
For the second variable, we have found that legal limits of seat number fall between 1
and 9 points in 13 cases (28.89%); 9 or more in 9 cases (20%), and in 23 cases
(51.11%), there was no specific limit. Connecting these two variables, we could
notice that adjudication formula is accompanied by a lower limit (1 to 9 points) in 9
cases, a higher one (10 and more) in 6 cases, and there were 16 observation with no
legal limit. For the largest reminders method (12 cases) we have found that it is
followed by a lower limit in 3 observations, a higher one also in three, and there was
no legal limit in 6 cases. The only case with pure proportionality has no legal limit. So,
in most of observations there was no specific legal limit (23 observations).
The hypotheses we established at the beginning were: first, adjudication mechanism
is the most disproportional, and pure proportionality the least, while the larges
reminders lies somewhere in the middle; second, the higher the legal limit, higher the
disproportionality, and vice versa.
To verify both hypotheses we created 45 disproportionality indexes (ID) for all the
observations. The ID is an analytical method that allows to examine legislature
composition. It relates the number of votes with number of seats, normalizing both
measures in order to observe the difference that empirically exists between each
party's votes and seats numbers. Adding the reminders we obtain the measure of
how far it lies from the proportionality, assuming that pure proportionality or
disproportionality never exist.
For our observations we have found that the lowest ID was of 3.99 (Baja California
2013), while the highest was of 29.52 (Durango 2013). In order to classify all the 45
observations we used the decile mechanism, with the following results:
first decile: 6 observations (13.3%);
second decile: 25 observations (55.6%);
third decile: 14 observations (31.1%).
In only one observation there was a low disproportionality (ID 3.99), in 5 - medium
(5.1 to 10), while in the remaining 39 observations the disproportionality was high
(10.1 to 20) or very high (more than 20).
7
Contrasting our indexes with variables we have found the following association
between electoral systems and indexes themselves:
adjudication: 5 observations (11.11%) with low and medium disproportionality,
16 observations (35.56%) with high and 10 observations (22.22%) with very
high disproportionality.
largest reminders: one observation (2.22%) with medium disproportionality, 9
(20%) with high and 3 (6.67%) with very high disproportionality.
pure proportionality: one case (2.22%) with high disproportionality.
This first relation shows that our hypothesis of pure proportionality formula being the
most and adjudication the least proportional is false. The only case of pure
proportionality resulted the most disproportional of all, while among adjudication
cases we have found four different disproportionality levels, as well as among the
largest reminders method.
The second relation we studied is between indexes and legal limits. Of our cases 23
(51.11%) have no legal limits. The remaining 22 cases may be divided between low
limit (1-9 points) in 13 cases (28.89%) and high (10 and more) in another 9 cases
(20%).
Our hypothesis indicates that lower legal limit causes higher disproportionality and
vice versa. To be able to analyze this relation we have to exclude the cases with no
legal limit, what has left us with only 22 cases:
Low legal limit (0-4 points): 1 observation with high disproportionality;
Medium legal limit (5-9 points): 12 observations, 10 with high and 2 with very
high disproportionality;
High legal limit (10 and more): 9 observations, 2 with medium, 5 with high and
2 with very high disproportionality.
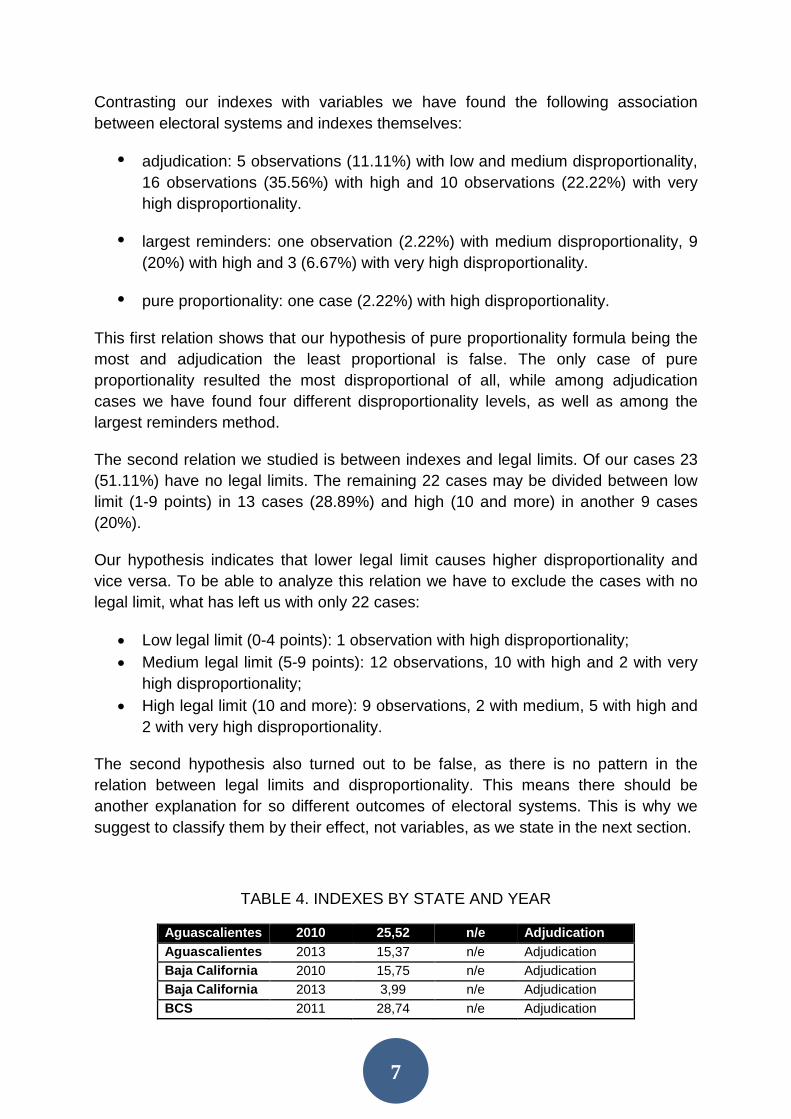
The second hypothesis also turned out to be false, as there is no pattern in the
relation between legal limits and disproportionality. This means there should be
another explanation for so different outcomes of electoral systems. This is why we
suggest to classify them by their effect, not variables, as we state in the next section.
TABLE 4. INDEXES BY STATE AND YEAR
Aguascalientes 2010 25,52 n/e Adjudication
Aguascalientes 2013 15,37 n/e Adjudication
Baja California 2010 15,75 n/e Adjudication
Baja California 2013 3,99 n/e Adjudication
BCS 2011 28,74 n/e Adjudication

8
Campeche 2012 11,87 8% Largest reminder
Chiapas 2012 23,08 n/e Largest reminder
Chihuahua 2010 26,57 8% Adjudication
Chihuahua 2013 28,51 8% Adjudication
Coahuila 2011 27,8 16% Adjudication
Colima 2012 12,48 10% Adjudication
DF 2012 22,05 3% Largest reminder
Durango 2010 19,21 n/e Adjudication
Durango 2013 29,52 n/e Adjudication
Guanajuato 2012 11,17 n/e Adjudication
Guerrero 2012 12,63 8% Adjudication
Hidalgo 2010 23,55 n/e Adjudication
Hidalgo 2013 21,09 n/e Adjudication
Jalisco 2012 16,98 n/e Largest reminder
México 2012 26,96 n/e Pure proportionality
Michoacán 2011 7,46 10% Largest reminder
Morelos 2012 16,1 8% Adjudication
Nayarit 2011 7,46 n/e Adjudication
Nuevo León 2012 8,38 n/e Adjudication
Oaxaca 2010 12,6 16% Largest reminder
Oaxaca 2013 18,97 16% Largest reminder
Puebla 2010 9,49 n/e Adjudication
Puebla 2013 23,05 n/e Adjudication
Querétaro 2012 18,41 n/e Adjudication
Quintana Roo 2010 15,7 16% Adjudication
Quintana Roo 2013 22,93 16% Adjudication
Sinaloa 2010 8,87 10% Adjudication
Sinaloa 2013 10,45 10% Adjudication
SLP 2012 15,53 8% Adjudication
Sonora 2012 12,5 8% Adjudication
Tabasco 2012 15,65 8% Adjudication
Tamaulipas 2010 18,09 8% Adjudication
Tamaulipas 2013 13,31 8% Adjudication
Tlaxcala 2010 12,81 n/e Largest reminder
Tlaxcala 2013 16,48 n/e Largest reminder
Veracruz 2010 16,17 n/e Largest reminder
Veracruz 2013 28,13 n/e Largest reminder
Yucatán 2012 18,56 n/e Adjudication
Zacatecas 2010 10,51 8% Largest reminder
Zacatecas 2013 11,23 8% Largest reminder
4. The discussion
A part of the literature (Colomer, 2007) considers that the difference between the
systems lies in that some are distributive and generated several winners (proportional

9
systems), while others tend to concentrate and generate a single winner (majoritarian
systems). The same perspective assumes that proportional systems are better
because they satisfy more citizens than majoritarian ones; something similar had said
John Stuart Mill in the XIX century, when proposed proportional representation Great
Britain.
If those considerations are true, then most classifications of electoral systems are
wrong, as electoral systems should be classified by their effects, mainly
disproportionality, assuming that no system can be fully proportional.
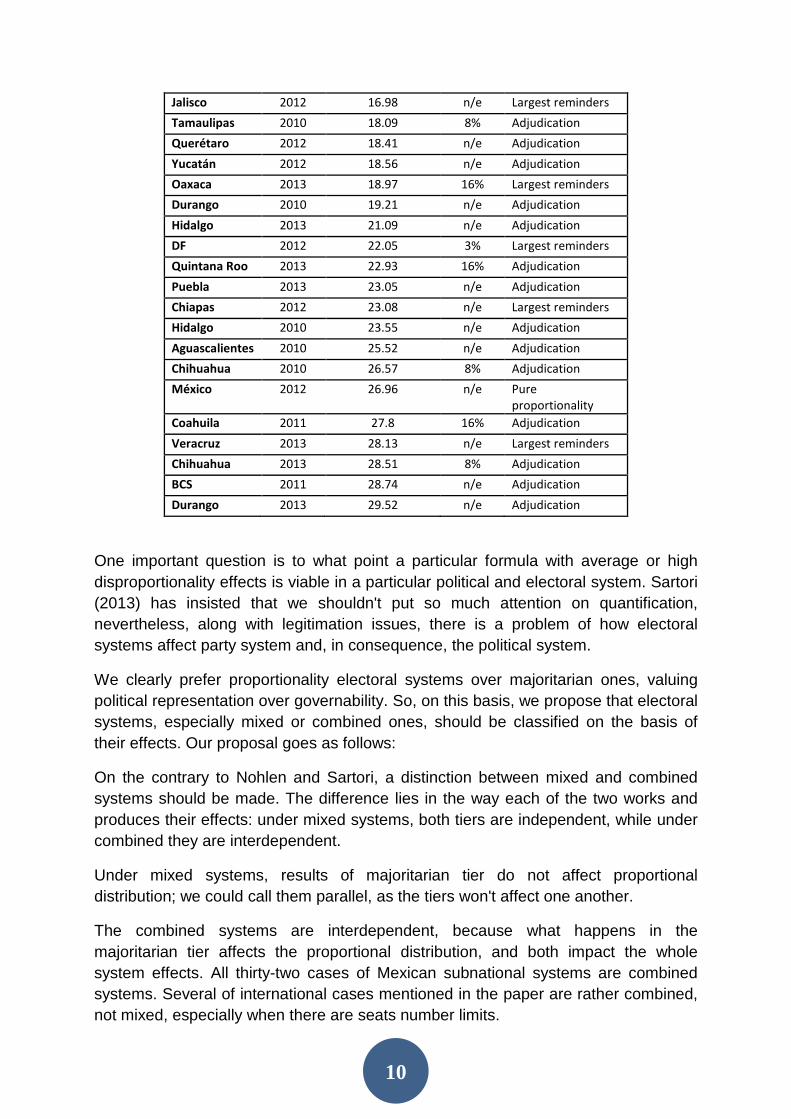
So, electoral systems can be placed in a continuum scale from more to less
proportional. We will take 0 to 5.0 points as a low disproportionality, from 5.1 to 10.0
points its average disproportionality and over 10.1 points it would be a high
disproportionality. The next table shows Mexican subnational electoral systems
ranked according to this rule.
TABLE 5. INDEXES BY DISPROPORTIONALITY RATE
State Year Disproportionality index
Legal limit
Formula
Baja California 2013 3.99 n/e Adjudication
Michoacán 2011 7.46 10% Largest reminders
Nayarit 2011 7.46 n/e Adjudication
Nuevo León 2012 8.38 n/e Adjudication
Sinaloa 2010 8.87 10% Adjudication
Puebla 2010 9.49 n/e Adjudication
Sinaloa 2013 10.45 10% Adjudication
Zacatecas 2010 10.51 8% Largest reminders
Guanajuato 2012 11.17 n/e Adjudication
Zacatecas 2013 11.23 8% Largest reminders
Campeche 2012 11.87 8% Largest reminders
Colima 2012 12.48 10% Adjudication
Sonora 2012 12.5 8% Adjudication
Oaxaca 2010 12.6 16% Largest reminders
Guerrero 2012 12.63 8% Adjudication
Tlaxcala 2010 12.81 n/e Largest reminders
Tamaulipas 2013 13.31 8% Adjudication
Aguascalientes 2013 15.37 n/e Adjudication
SLP 2012 15.53 8% Adjudication
Tabasco 2012 15.65 8% Adjudication
Quintana Roo 2010 15.7 16% Adjudication
Baja California 2010 15.75 n/e Adjudication
Morelos 2012 16.1 8% Adjudication
Veracruz 2010 16.17 n/e Largest reminders
Tlaxcala 2013 16.48 n/e Largest reminders
10
Jalisco 2012 16.98 n/e Largest reminders
Tamaulipas 2010 18.09 8% Adjudication
Querétaro 2012 18.41 n/e Adjudication
Yucatán 2012 18.56 n/e Adjudication
Oaxaca 2013 18.97 16% Largest reminders
Durango 2010 19.21 n/e Adjudication
Hidalgo 2013 21.09 n/e Adjudication
DF 2012 22.05 3% Largest reminders
Quintana Roo 2013 22.93 16% Adjudication
Puebla 2013 23.05 n/e Adjudication
Chiapas 2012 23.08 n/e Largest reminders
Hidalgo 2010 23.55 n/e Adjudication
Aguascalientes 2010 25.52 n/e Adjudication
Chihuahua 2010 26.57 8% Adjudication
México 2012 26.96 n/e Pure proportionality
Coahuila 2011 27.8 16% Adjudication
Veracruz 2013 28.13 n/e Largest reminders
Chihuahua 2013 28.51 8% Adjudication
BCS 2011 28.74 n/e Adjudication
Durango 2013 29.52 n/e Adjudication
One important question is to what point a particular formula with average or high
disproportionality effects is viable in a particular political and electoral system. Sartori
(2013) has insisted that we shouldn't put so much attention on quantification,
nevertheless, along with legitimation issues, there is a problem of how electoral
systems affect party system and, in consequence, the political system.
We clearly prefer proportionality electoral systems over majoritarian ones, valuing
political representation over governability. So, on this basis, we propose that electoral
systems, especially mixed or combined ones, should be classified on the basis of
their effects. Our proposal goes as follows:
On the contrary to Nohlen and Sartori, a distinction between mixed and combined
systems should be made. The difference lies in the way each of the two works and
produces their effects: under mixed systems, both tiers are independent, while under
combined they are interdependent.
Under mixed systems, results of majoritarian tier do not affect proportional
distribution; we could call them parallel, as the tiers won't affect one another.
The combined systems are interdependent, because what happens in the
majoritarian tier affects the proportional distribution, and both impact the whole
system effects. All thirty-two cases of Mexican subnational systems are combined
systems. Several of international cases mentioned in the paper are rather combined,
not mixed, especially when there are seats number limits.

11
So the name of the thing (Sartori): mixed (parallel) system or combined system
implies a real difference. It can be observed best comparing the results, because
mixed systems won't show major difference in disproportionality, while combined
systems can be ranked according to disproportionality.
Thus, to classify electoral systems, at the very beginning is important to establish if
they include proportional representation (alone or combined) and if so, we suggest to:
First, distinguish whether the system is interdependent and, therefore, it is
combined system;
Second, if it is a combined system, determine which is the electoral formula;
Third, analyze empirical results given by this particular system, contrasting
against hypothetical data, in order to test different formulas with the same
data.
After these three steps we will clearly obtain the difference between combined
systems and other alternatives, so we will get our cases ranked according to formula
and their effects. So the first step allows to differentiate the cases and the following
two to rank them by their effects, according to more congruent principle than solely
majoritarian versus proportional principle.
This brings us back to the original problem. Till now, the literature classified electoral
systems by principle used, what have generated countless inconsistencies, for
example, in cases of German (Sartori 2010) and Mexican (Nohlen 2004) national
electoral systems. Our proposal tries to override these inconsistencies focusing on
electoral systems' effects. Applying our guidelines to analyze both German and
Mexican cases we can observe they are both interdependent. In German electoral
system the proportional tier determines the majoritarian one (Sartori 2010) and in
Mexico it the other way round (Emmerich and Medina 2005). According to last twenty
years electoral results, German system is more proportional than the Mexican, what
is consistent with our outline. So both Nohlen and Sartori are wrong about those
cases classification.
5. Conclusion
The analyze of our data and existing literature brings us toward two considerations.
First, an electoral system with high disproportionality cannot be classified easily as a
proportional representation system. Second, existing classifications should be
modified and based on electoral systems’ outcomes, which is a different approach
form the one commonly used. They both correspond with two political and strategic
dilemmas.

12
First dilemma goes as follows: in a particular period of time, which system’s outcome
is preferred: concentrate political power in a clearly defined winner, enforcing
governability, or distribute it within multiple players and favor representation principle.
The other one is a strategic and practical dilemma (Cox, 2004: 221 y ss.): which is
the specific modality to create: a system with independent or independent effects.
With this two elements, concentration/distribution and
independency/interdependency, we can obtain a better classification and
conceptualization of electoral systems.
TABLE 6. SYSTEMS’ EFFECTS
Effect on seats Effect on formulas
Concentration Independent
Distribution Interdependent
Effects on seats indicate the possibility of higher or lower proportionality: usually,
electoral systems that go for concentration tend to be less proportional, while
distributive systems produce more proportional outcomes. Commonly it was thought
that concentrating systems are majoritarian and distributive ones are proportional, but
as we can observe in many cases (e.g. Mexican subnational electoral systems), the
PR systems may result not so proportional. So, it is clear that PR systems with high
ID (index od disproportionality) are not distributive.
The effects of different formulas are important in the discussion, especially in mixed
or combined systems. The relation is: when legal and political design choose to
combine both tiers, it will generate interdependency; when both tiers won’t affect
each other, the result will be independent.
This is an important question in electoral system analyze, although the literature on
the topic haven’t paid much attention to it, gathering both mechanisms under “mixed
electoral systems” term, and without studying the outcomes they produce. So, if we
relate formulas with their effects we will obtain a better classification, as follows:
Independent systems are those with double vote, where the voters can cast
their vote in two different ways (tiers), choosing the same options in both or
differentiating the vote. These systems may have different effect, and may be
called mixed or parallel, because both tiers work with no major relation
between them.
Interdependent formulas are those with a joint vote (Cox, 2004: 63), where the
voter cast the vote for the same option in both tiers. These systems tend to

13
have concentrating effects and may be called combined, as both tiers are
related to each other.
These definitions allows to classify different electoral systems that use more than one
electoral formula. As a first step, we have to define whether there is independency or
interdependency between the tiers. After that, we have to establish which is the effect
of the whole system on the lower or higher proportionality scale. Finally, they can be
classified as distributive or concentrating, depending on the proportionality rate. So
now will apply these definitions to the Mexican cases.
After analyzing Mexican subnational electoral systems, we have to abandon their
classification as mixed systems, and categorize them on the basis of their effects on
formulas and seats allocation. All 32 Mexican subnational electoral systems are
interdependent, because the legal and political design determined they would go
from majoritarian tier to proportional representation. The FPTP is the first tier applied
in all electoral systems in Mexico.
Of all 45 observations we have done, only 6 are proportional, with an ID lower than
10 points, and may be considered as distributive. The remaining 39 have an ID
higher than 10 points, so they cannot be considered as distributive.
So, the classification we propose is more reasonable, as we can clearly see the
interdependency relation between the two tiers: the results of the FPTP tier impact
the proportional one. Even though Mexico has been classified as a mixed electoral
system, in fact it is an interdependent and concentrating one (combined), with both
tiers related to each other and the proportional one depending on the FPTP.
References
Colomer, Josep M. (2001), Instituciones políticas, Ariel, Barcelona.
Colomer, Josep M. (2004), Cómo votamos. Los sistemas electorales del mundo:
pasado, presente y futuro, Gedisa, Barcelona.
Cox, Gary W. (2004), La coordinación estratégica de los sistemas electorales del
mundo, Gedisa, Barcelona.
Duverger, Maurice (1954), Los partidos políticos, FCE, México.
Emmerich, Gustavo (2012), La representación proporcional en los legislativos
mexicanos, TEPJF, México.

14
Emmerich, Gustavo y Medina Torres, Luis Eduardo (2005), “La cláusula de
gobernabilidad y la representación proporcional en la Asamblea Legislativa del
Distrito Federal” en Boletín Mexicano de Derecho Comparado, UNAM, México.
Gilas, Karolina y Medina Torres, Luis Eduardo (2012), Manual de asignación de
representación proporcional, TEPJF, México.
Klingemann, Hans-Dieter (eds.) 2009, The Comparative Study of Electoral Systems, Oxford University Press
Lijphart, Arend (1995), Electoral Systems and Party Systems, Oxford, Avon.
Lijphart, Arend (2000), Modelos de democracia, Ariel, Barcelona.
Moser, Robert G. and Ethan Scheiner, 2012, Electoral Systems and Political Context. How the Effects of Rules Vary Across New and Established Democracies.
Cambridge University Press
Nohlen, Dieter (2004), Sistemas electorales y partidos políticos, FCE, México.
Nohlen, Dieter (2011), La democracia: instituciones, conceptos y contexto, UNAM,
México.
Rae, Douglas (1971), The Political Consequences of Electoral Laws, Yale, New Haven.
Sartori, Giovanni (2010); Ingeniería constitucional comparada, FCE, México.
Sartori, Giovanni (2013), La política. Lógica y método en las ciencias sociales, FCE,
México.
Shugart, Matthew Sobert and Martin P. Wattenberg, eds., 2001, Mixed-Member Electoral Systems. The Best of Both Worlds? Oxford University Press
Taagepera, Rein y Shugart, Matthew (1979) Seats and votes, Yale, New Haven.
Judgements:
SUP-REC-161/2012
SUP-REC-163/2012
SUP-REC-164/2012
SUP-REC-172/2012
SUP-REC-178/2012
SUP-REC-185/2012

15
SUP-REC-192/2012
SUP-REC-194/2012
SUP-REC-202/2012
SUP-REC-210/2012
SUP-REC-246/2012
SUP-REC-247/2012
SUP-REC-249/2012
SUP-REC-251/2012
SX-JDC-5552/2012
SX-JRC-94/2012
SX-JRC-120/2012
TEDF-JEL354/2012
SUP-REC-78/2013
SUP-REC-113/2012
SUP-REC-175/2012
SM-JDC-733/2013
SM-JRC-65/2013
SX-JRC-169/2013