concia2012_cristina miranda silva
TRANSCRIPT

OBTENTION AND DATA MANAGEMENT IN PREDICTIVE MICROBIOLOGY MODELS
Cristina L.M. Silva
5th September 2012
CBQF – Centro de Biotecnologia e Química Fina,Escola Superior de Biotecnologia,Centro Regional do Porto da Universidade Católica Portuguesa

OUTLINE Objectives of food industry The challenge Predictive microbiology How to obtain the data Available software Validation studies Acknowledgement by regulation The complexity of dynamic conditions Conclusions

OUTLINE Objectives of food industry The challenge Predictive microbiology How to obtain the data Available software Validation studies Acknowledgement by regulation The complexity of dynamic conditions Conclusions

Objectives of food industry
Prediction of shelf life
Preservation of foods

Control/monitor the growth of microorganisms
Predict microbial death
6
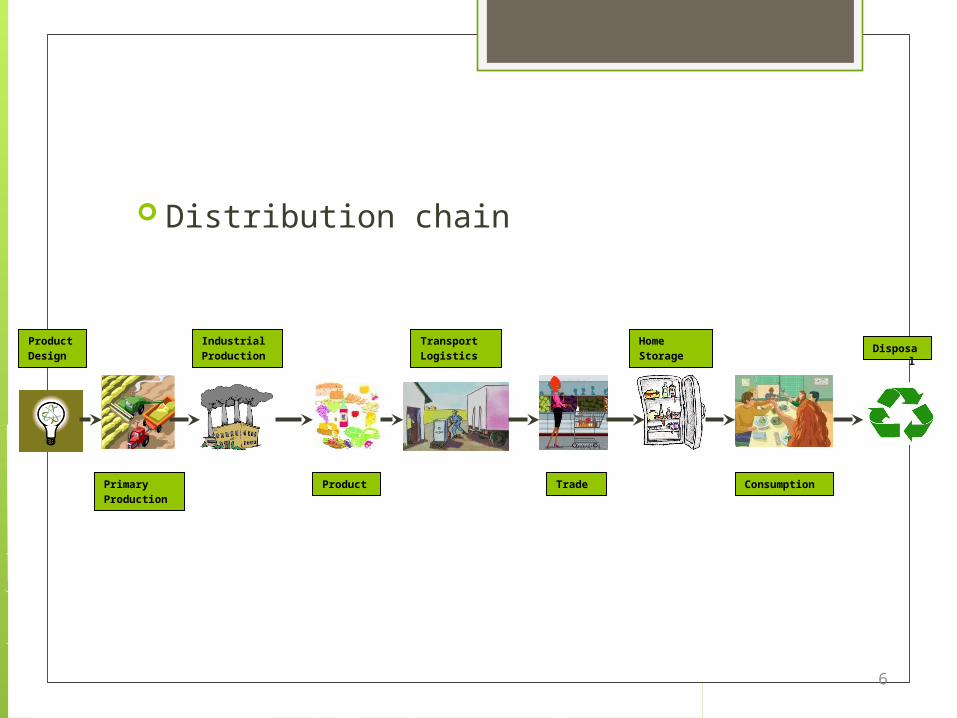
Product Design
Primary Production
IndustrialProduction
Product
TransportLogistics
Trade
Home Storage
Consumption
Disposal
Distribution chain

7
Product Design
Primary Production
IndustrialProduction
Product
TransportLogistics
Trade
Home Storage
Consumption
Disposal
Distribution chain

OUTLINE Objectives of food industry The challenge Predictive microbiology How to obtain the data Available software Validation studies Acknowledgement by regulation The complexity of dynamic conditions Conclusions

The challenge Microorganisms response depends on:
- Intrinsic factors
- Extrinsic factors
- System dynamics
pHaw
others
TpHhumidity saltgas concentrationothers

• microbial interaction
• natural strains diversity
• history of initial population
• complexity of food structure
• interaction food/microorganism
• predictions in real and varying environmental conditions

OUTLINE Objectives of food industry The challenge Predictive microbiology How to obtain the data Available software Validation studies Acknowledgement by regulation The complexity of dynamic conditions Conclusions

Predictive microbiology
The use of mathematical models in the description of
microbial responses to environmental stressing factors

Thermal lethality - D and z values – Bigelow model
F dtcT T ztpc refm m 10
0
( )/
The idea is not even recent!

mathematics
microbiology
statistics
predictivemicrobiology

Model mathematical expression
i=1,2,...,n (number of experimental runs/observations)
j=1,2,...,vk=1,2,...,p
yi = f(xij, k) + i
0
0.1
0.2
0.3
0.4
0.5
0.6
0.7
0.8
0 1000 2000 3000 4000 5000
x
y
ymodel
yexp
q*Precise ? Accurate ?
Minimize differences
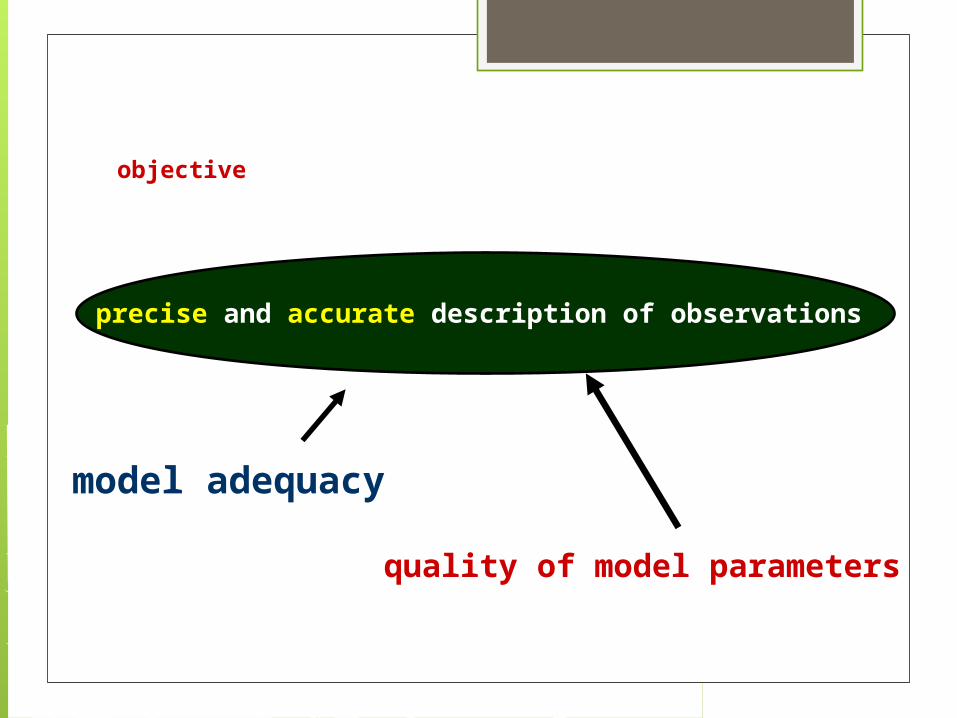
precise and accurate description of observations
model adequacy
quality of model parameters
objective
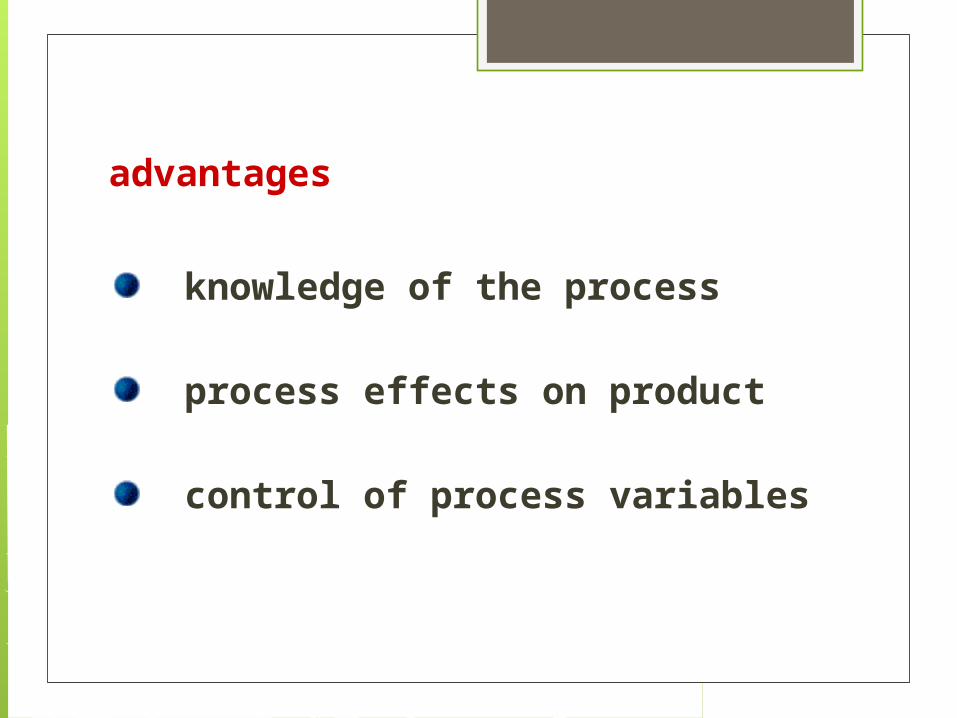
knowledge of the process
process effects on product
control of process variables
advantages

Processes
ChemicalPhysical
Food Processes
Transport Phenomena• heat• mass• momentum
Reaction kinetics
Properties
Modelling
mathematical function
variablesparameters
data
regression schemes
experimental design
design Criterium
validation
control
optimization Objectives
quality safety

prediction / simulation
development of efficient processes
contribution to safety
aplication

sigmoidal behaviour
presence of aggregated microorganisms or sub populations
more heat (or other stress factor) resistent
inactivation
0
1
2
3
4
5
6
7
8
9
0 500 1000 1500 2000
time(s)
log
N

0
1
2
3
4
5
6
7
8
0 20 40 60 80 100 120 140
0
1
2
3
4
5
6
7
8
0 20 40 60 80 100 120 140
Miller (2004)
52.5 ºC
Listeria innocualiquid medium
55 ºC57.5 ºC
60 ºC
62.5 ºC
65 ºC
log N
time (min)

0
1
2
3
4
5
6
7
8
0 20 40 60 80 100 120 140
52.5 ºC55 ºC57.5 ºC
60 ºC
62.5 ºC
65 ºC
log N
time (min)
Miller (2004)
Listeria innocualiquid medium

primary
0
1
2
3
4
5
6
7
8
0 0.5 1 1.5 2 2.5Time (min)
Lo
g C
FU
/g
kinetics
parameters
Types of models
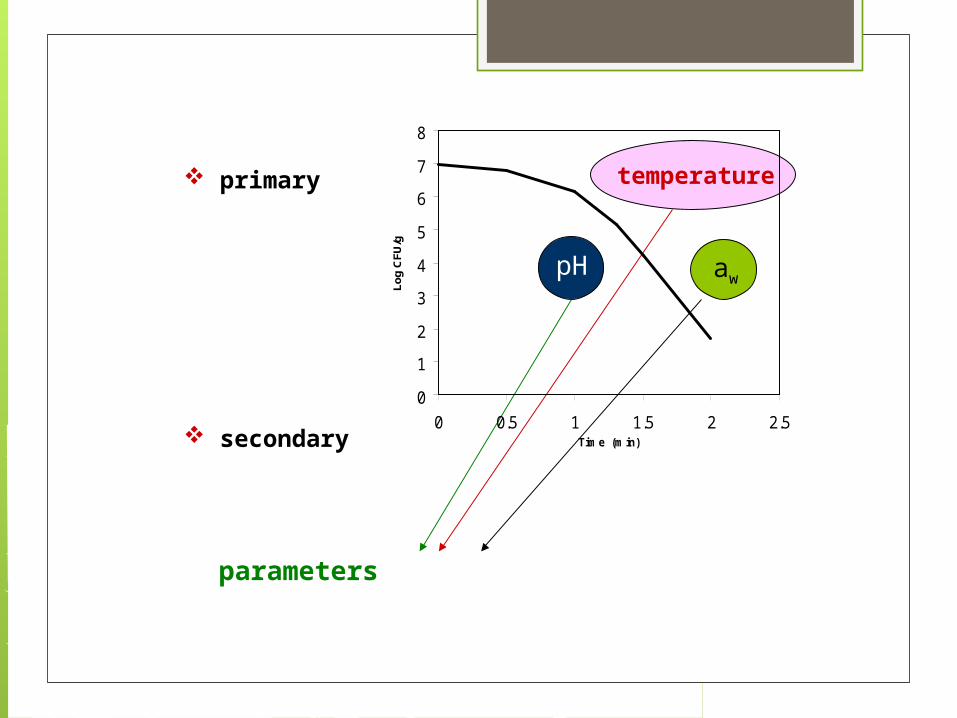
primary
secondary
0
1
2
3
4
5
6
7
8
0 0.5 1 1.5 2 2.5Time (min)
Lo
g C
FU
/g
parameters
pH aw
temperature

primary
secondary
terciary - integration of the previous models - software
0
1
2
3
4
5
6
7
8
0 0,5 1 1,5 2 2,5Time (min)
Lo
g C
FU
/g
parameters
pH aw
temperature

primary
0
1
2
3
4
5
6
7
8
9
0 500 1000 1500 2000
logN
k
logN0
logNres
L
Time (s)
empirical fundamental
N0 number of initial viable spore cellsNres number of residual spore cellsk maximum inactivation rate L lag or shoulder
Inactivation models

primary
First order ktexpNN 0 Dt
NloglogN 0
tkexpF1tkexpFNN
21110
Cerf (1977)
Kamau et al. (1990)
tkexp1F12
tkexp1F2
logNN
log2
1
1
1
0
D – decimal reduction time
F1 – fraction of inactivated microorganismsk1 e k2– kinetic constants biphasic
0
1
2
3
4
5
6
7
8
0 2 4 6 8Time (min)
Lo
gC
FU/g
0
1
2
3
4
5
6
7
8
0 1 2 3 4 5 6
Time (min)
Lo
g C
FU/m
l

primary
Cole et al. (1993)
σwtlogλσ4
exp1
αwαNlog
0
1
2
3
4
5
6
7
8
0 0.5 1 1.5 2 2.5Time (min)
Lo
g C
FU/g
Ltkexp1Lkexp1F1
Ltkexp1Lkexp1F
logNN
log2
21
1
11
0
Whiting & Buchanan
(1992)
distribution of heat sensibility of
microbial populations
L – lag or shoulder

primary
Baranyi et al.(1993)
0N0tN
NttkdtdN
‘lag’ function
‘tail’ function
0
1
2
3
4
5
6
7
8
9
0 500 1000 1500 2000
tempo (s)
log
N
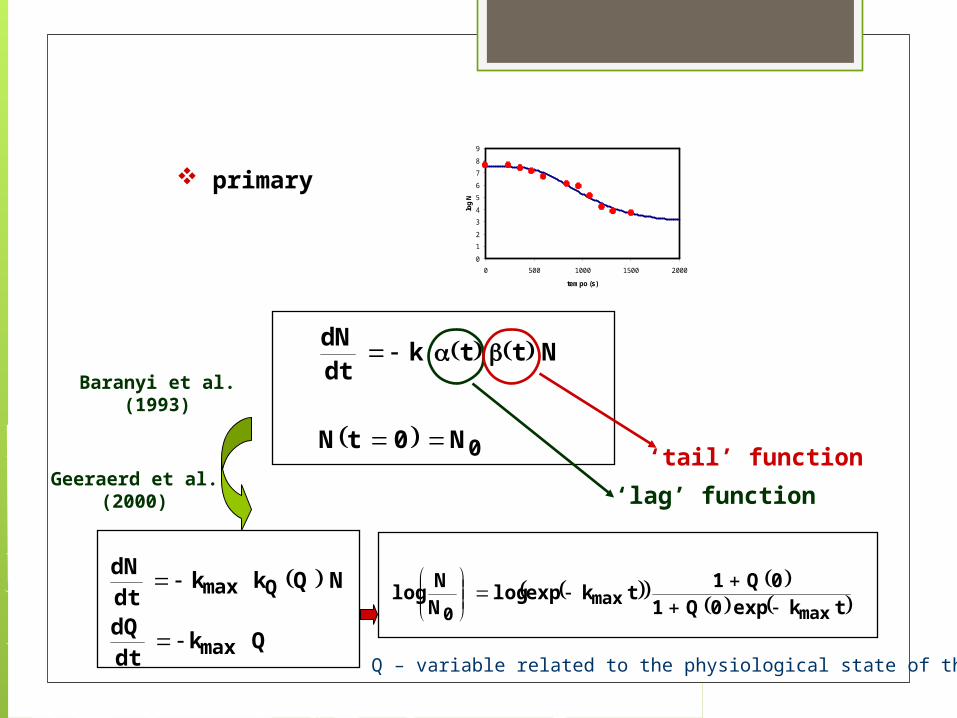
primary
Baranyi et al.(1993)
0N0tN
NttkdtdN
‘lag’ function
‘tail’ function
0
1
2
3
4
5
6
7
8
9
0 500 1000 1500 2000
tempo (s)
log
N
tkexp0Q1
0Q1tkexplog
NN
logmax
max0
Geeraerd et al.(2000)
QkdtdQ
NQkkdtdN
max
Qmax
Q – variable related to the physiological state of the cells

primary
Gompertz
0
1
2
3
4
5
6
7
8
9
0 500 1000 1500 2000
tempo (s)
log
N
Bhaduri et al (1991)Linton et al. (1995, 1996)Xiong et al. (1999)
1tL
NN
log
ek expexp
NN
loglogNlogN
res
0res
00
Logistic
Listeria monocytogenes
L-tkexp1c
logN
c – constant
reparameterized for inactivation based in Zwitering (1990)

secondary
Arrhenius
Davey / Arrhenius modified
“Square-root type models”
Ratkowsky et al. (1982)
McMeekin et al. (1987)
Adams et al. (1991)
McMeekin et al. (1992)
)Tb(Tk min
)a(a)Tb(Tk minwwmin
)pH(pH)Tb(Tk minmin
RTE
-expkk a0 RT
Elnklnk a
0
2
W4W3221
0 aCaCT
CTC
Clnk
)pH(pH)a(a)Tb(Tk minminwwmin
min – minimal value for growth
ref
aref T
1T1
RE
-expkk
tertiary
softwares
Microbial growth
Shelf life prediction
Microbial inactivation

Difficulties in food processes modelling:
Dynamic processes
Complexity and heterogeneity of products
Structural and physicochemical changes

Gompertz
)time(d
Nlogd
'dt1'tL
NN
log
)1exp(kexpexp1'tL
NN
log
)1exp(kexp)1exp(kNlogNlog
t
0res
0
res
00
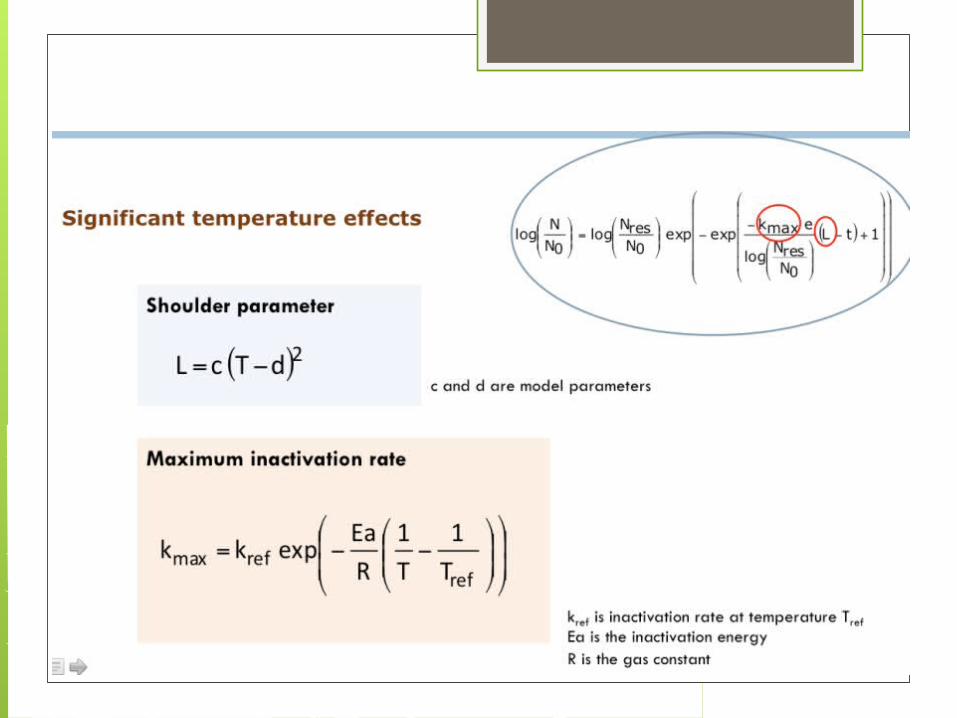
dynamic situation of temperature
ref
aref T
1T1
RE
-expkk
refT1
T1
bexpaL
Gill (2011)

Linear
)time(d
Nlogd
dynamic situation of temperature
refTTz1
ref 10DD
PT
0
ZrefTT
refTdt10
D1
0
10NN
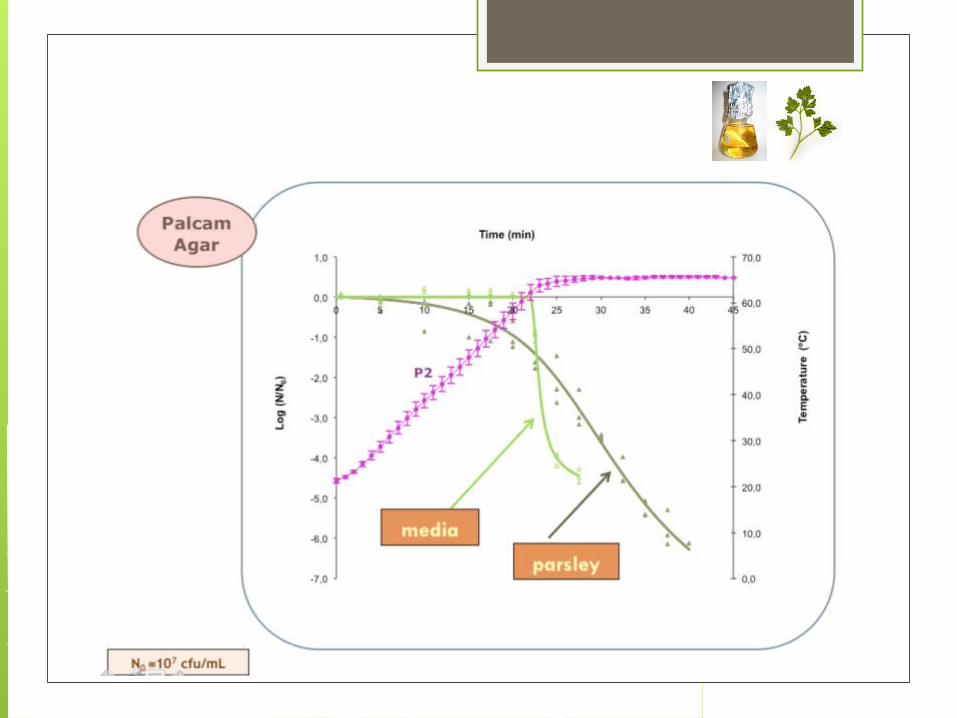
approach by Vieira et al. (2002)Cupuaçu nectar
different temperature histories

Case studies:
1tL
NN
log
ekexpexp
N
NloglogNlogN
res
0
max
res
00
Square-root
dTckmax
Arrhenius
ref
arefmax T
1T1
RE
-expkk
Williams-Landel-Ferry
min
min
T-Tb
T-Ta
10L
Arrhenius
refT1
T1
bexpaL
c, dconstants
Kref reaction rate at Tref
Ea activation energy
a, bconstants
1
2
4
3
Gill (2011)

log N
time (s)
0
1
2
3
4
5
6
7
8
9
0 1000 2000 3000 4000 5000 6000 7000
T=52ºC
T=56ºC
logN
time (s)
0
1
2
3
4
5
6
7
8
9
0 100 200
T=60ºCT=64ºC
T=68ºC
0
500
1000
1500
2000
2500
3000
320 325 330 335 340 345
T (K)
L (s
)
0
0,05
0,1
0,15
0,2
0,25
0,3
320 325 330 335 340 345
T (K)
km
ax
(s-1
)
0
1
2
3
4
5
6
7
8
9
0 1000 2000 3000 4000 5000 6000 7000time (s)
log N
T=52ºC
T=56ºC
0
1
2
3
4
5
6
7
8
9
0 100 200
time (s)
log
N
T=60ºCT=64ºCT=68ºC
Gompertz
Two-step
L= f(T)
kmax= f(T)
One-stepEquations 1 and 4 selected
L. Monocytogenes in half-cream at 52, 56, 60, 64 e 68ºC (Casadei et al. 1998)

Tank with water +
L. innocua
15 minutes
Weibull model
Inumeration
Ozonation

OUTLINE Objectives of food industry The challenge Predictive microbiology How to obtain the data Available software Validation studies Acknowledgement by regulation The complexity of dynamic conditions Conclusions

How to obtain the data
Experiments in broth at various conditions (pH, T, aw, [growth inhibitors], etc.)
Inoculation studies in foods under various conditions
Derive model parameters

Heuristic sampling
Experimental design Minimize variance of:
predicted response
parameter estimates
Sampling:
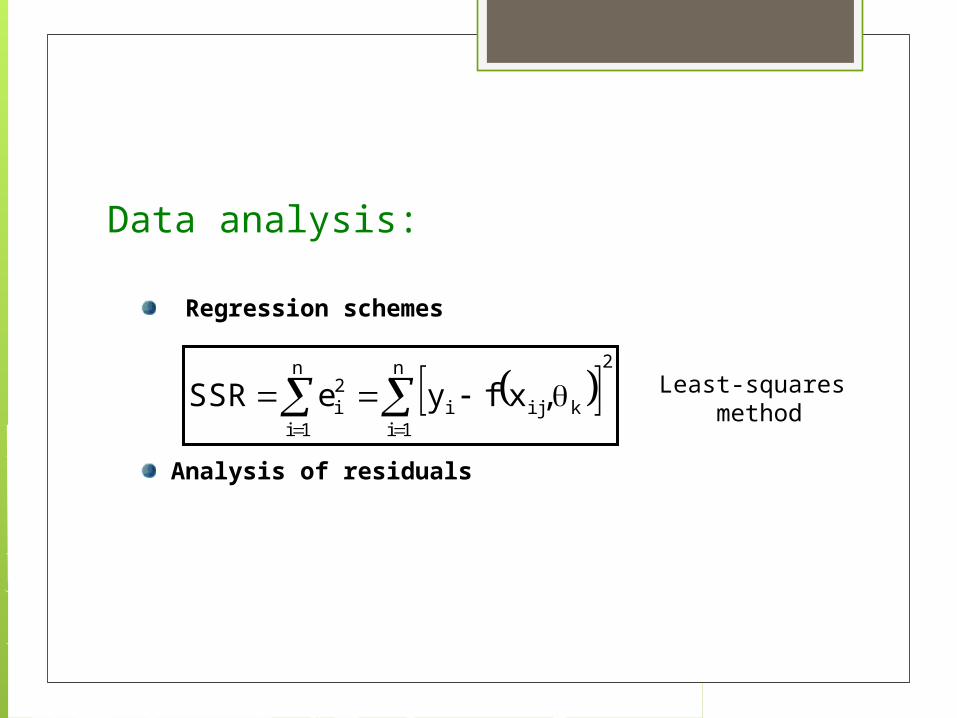
Regression schemes
Analysis of residuals
2n
1ikiji
n
1i
2i ,xfyeSSR
Least-squares method
Data analysis:

Mathematical complexity
Adequate description
model parameters
quality

OUTLINE Objectives of food industry The challenge Predictive microbiology How to obtain the data Available software Validation studies Acknowledgement by regulation The complexity of dynamic conditions Conclusions

Available software
predicts shelf-life as well as growth of spoilage and pathogenic bacteria in seafood
evaluates the effect of constant or fluctuating temperature storage conditions (Dalgaard et al. 2002, 2003, 2008)

more than 40 models for different bacterial pathogens
the software allows growth or inactivation of pathogens to be predicted for different combinations of constant temperature, pH, NaCl/aw and, in some cases, other conditions such as organic acid type and concentration, atmosphere, or nitrate

includes more than 40.000 curves/data on growth, survival or inactivation of microorganism in foods.
data has been obtained from the literature or provided by supporting institutions
the modelling toolbox within ComBase includes the Combase Predictor (previously Growth Predictor and Food MicroMoodel).

French decision support system that includes (i) a database with growth and inactivation responses of microorganisms in foods and (ii) predictive models for growth and inactivation of pathogenic bacteria and some spoilage microorganisms

predicts the effect of organic acids, temperature, pH and moisture on growth of Listeria monocytogenes in products

predict the growth of Listeria monocytogenes and Staphylococcus aureus on Ready-To-Eat meat products as a function of pH and water activity

OUTLINE Objectives of food industry The challenge Predictive microbiology How to obtain the data Available software Validation studies Acknowledgement by regulation The complexity of dynamic conditions Conclusions

Validation studies
Before market introduction, validation has to be carried out for new or altered products
After the concept/prototype
acceptance tests refinement of models final formulation validations in challenge test
have to be performed
Milkowski (2012)
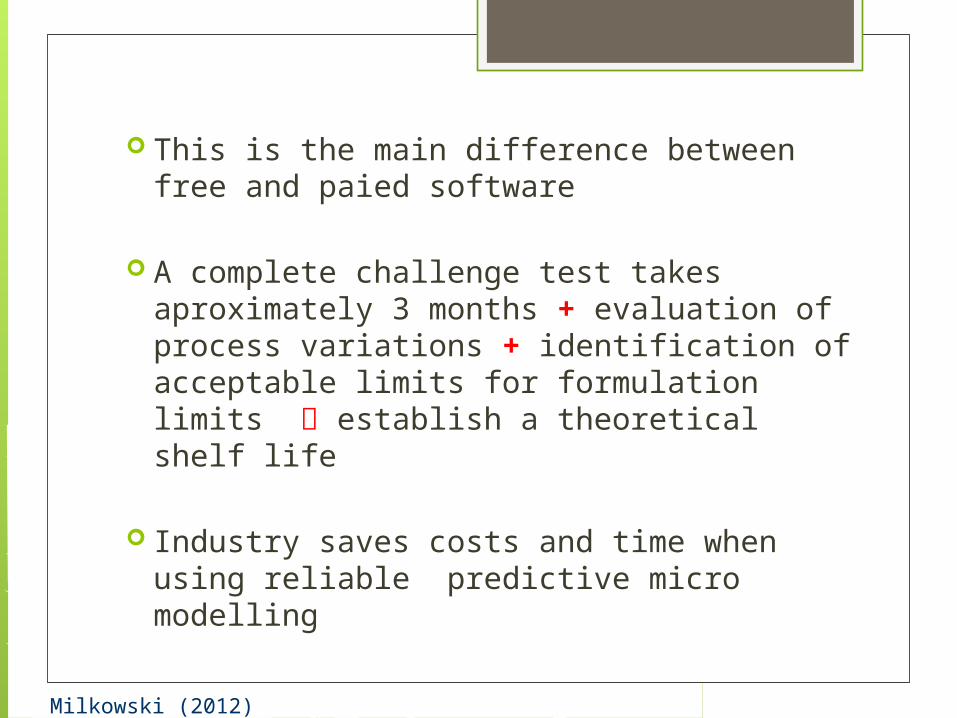
This is the main difference between free and paied software
A complete challenge test takes aproximately 3 months + evaluation of process variations + identification of acceptable limits for formulation limits establish a theoretical shelf life
Industry saves costs and time when using reliable predictive micro modelling
Milkowski (2012)

Industry has to perform validation studies, for final verification
The analytical values for pH, water activity, moisture, etc are crucial
However, predictive microbiology does not replace hygiene measure or Good Manufacturing Practices
models can not be the only hurdle to pathogens
Milkowski (2012)

OUTLINE Objectives of food industry The challenge Predictive microbiology How to obtain the data Available software Validation studies Acknowledgement by regulation The complexity of dynamic conditions Conclusions
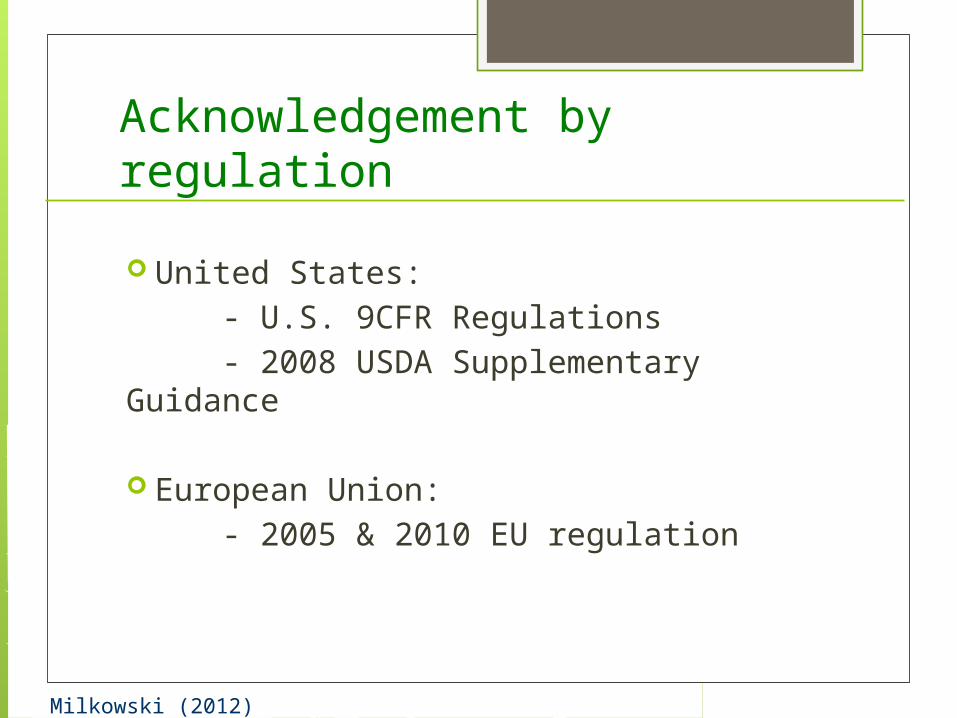
Acknowledgement by regulation
Milkowski (2012)
United States: - U.S. 9CFR Regulations - 2008 USDA Supplementary Guidance
European Union: - 2005 & 2010 EU regulation

OUTLINE Objectives of food industry The challenge Predictive microbiology How to obtain the data Available software Validation studies Acknowledgement by regulation The complexity of dynamic conditions Conclusions
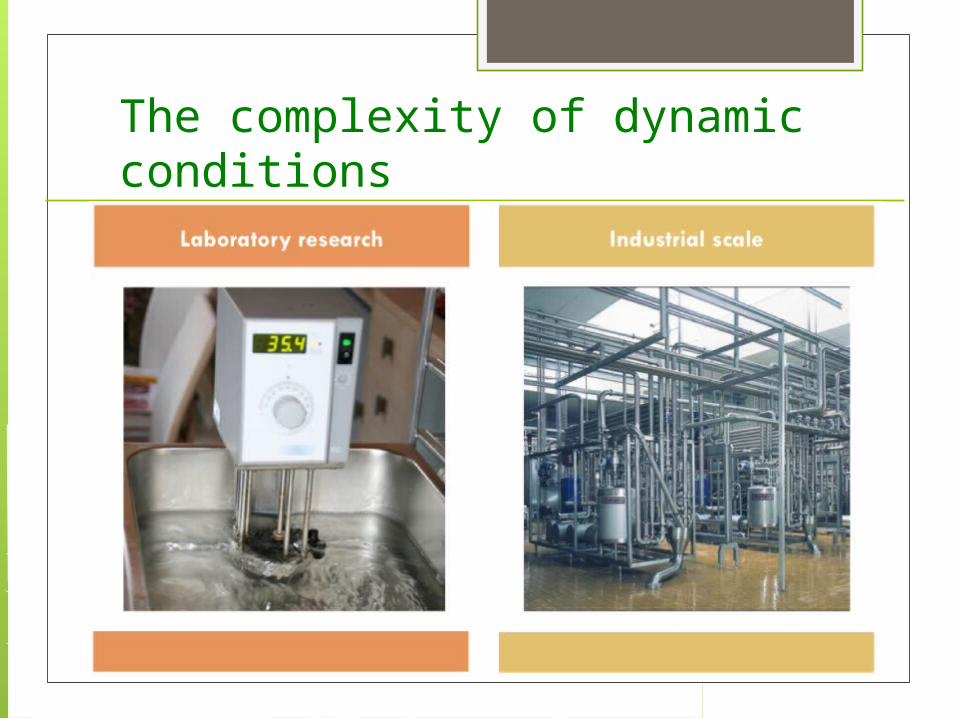
The complexity of dynamic conditions
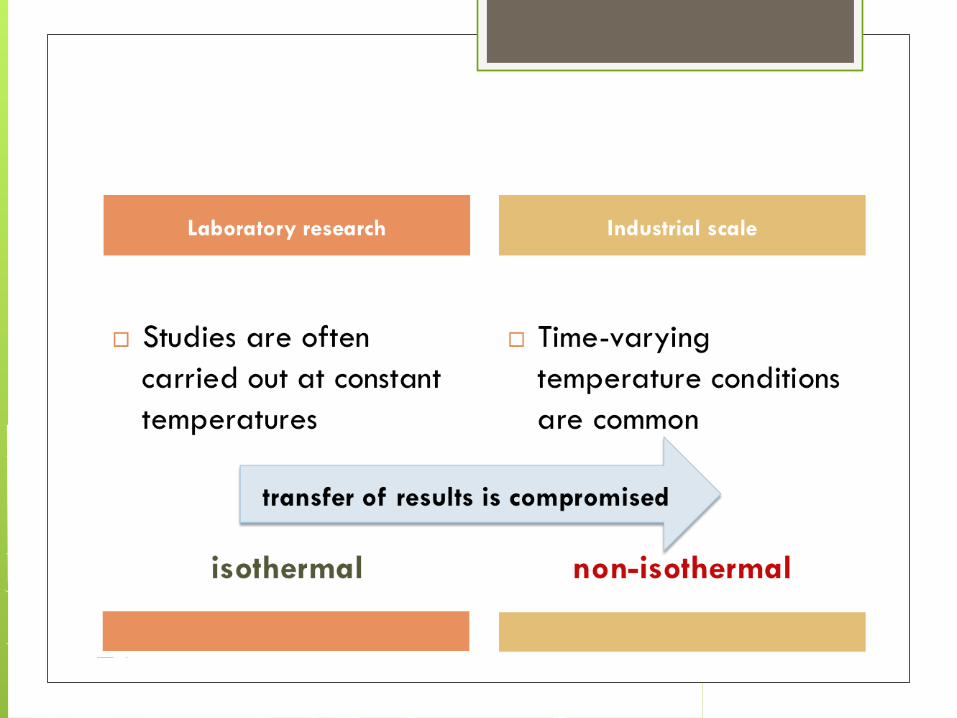

The greatest modeller’s effort has been given to data obtained under constant (or static) environmental conditions
From a realistic point of view this is somehow restrictive, since the majority of thermal processes occur under time-varying environmental conditions, and kinetic parameters obtained under such circumstances may differ from the ones estimated at static conditions, which compromises safety control

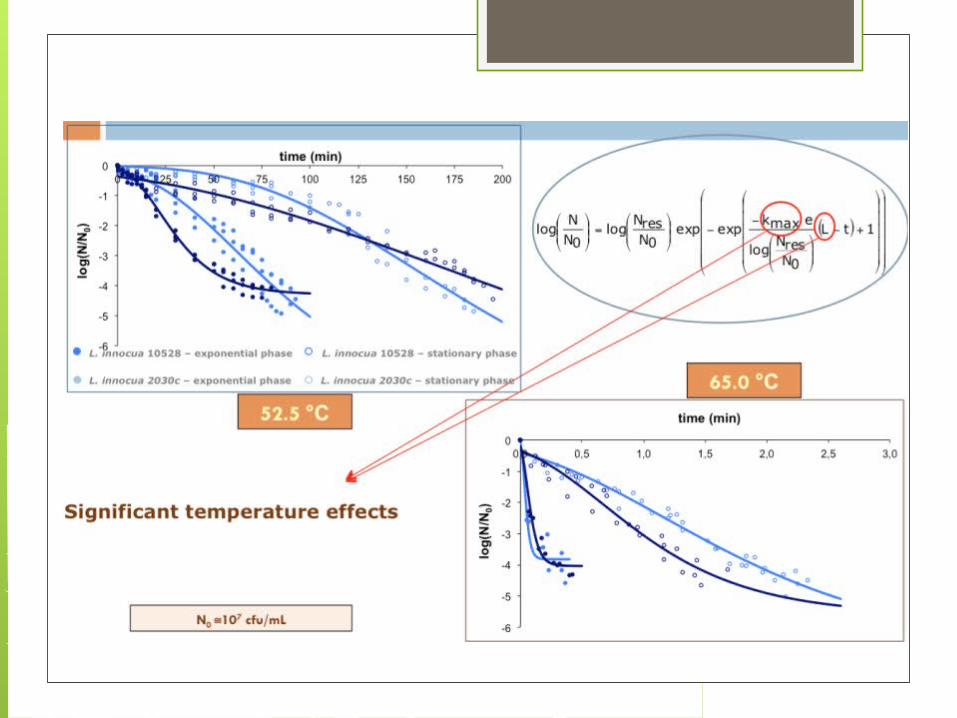
Case study


OUTLINE Objectives of food industry The challenge Predictive microbiology How to obtain the data Available software Validation studies Acknowledgement by regulation The complexity of dynamic conditions Conclusions

Conclusions
Great progresses in the past 20 years
There are many models available, each with its benefits and limitations
Yet much work has still to be developed, particularly kinetic studies under dynamic conditions

Validation studies have to be carried out for new or altered products, due to the complexity of the systems
Predictive microbiology is a powerful tool, but does not replace hygiene measures or Good Manufacturing Practices

Thank you!
Teresa BrandãoMª Manuel GilMª Fátima MillerElisabeth Alexandre