concording eu trade andproduction data over time - nbb.be · concording eu trade and ... and...
TRANSCRIPT

Working Paper Research
Concording EU trade and production data over time
by I. Van Beveren, A.B. Bernard and H. Vandenbussche
December 2012 No 239
© Illustrations : National Bank of Belgium
Layout : Analysis and Research Group Cover : NBB AG – Prepress & Image
Published in December 2012
Editor
Jan SmetsMember of the Board of directors of the National Bank of Belgium
National Bank of Belgium Limited liability company RLP Brussels – Company’s number : 0203.201.340 Registered office : boulevard de Berlaimont 14 – BE -1000 Brussels www.nbb.be

NBB WORKING PAPER No.239 - DECEMBER 2012
Abstract
This paper provides concordance procedures for product-level trade and production data in the EU
and examines the implications of changing product classifications on measured product adding and
dropping at Belgian firms. Using the algorithms developed by Pierce and Schott (2012a, 2012b), the
paper develops concordance procedures that allow researchers to trace changes in coding systems
over time and to translate product-level production and trade data into a common classification that
is consistent both within a single year and over time. Separate procedures are created for the eight-
digit Combined Nomenclature system used to classify international trade activities at the product
level within the European Union as well as for the eight-digit Prodcom categories used to classify
products in European domestic production data. The paper further highlights important differences
in coverage between the Prodcom and Combined Nomenclature classifications which need to be
taken into account when generating combined domestic production and international trade data at
the product level. The use of consistent product codes over time results in less product adding and
dropping at continuing firms in the Belgian export and production data.
Key Words: Prodcom, Combined Nomenclature, Harmonized System, concordance, exports,
imports.
JEL Classification: F1, C81.
Corresponding authors: Ilke Van Beveren, Research Department NBB (e-mail: [email protected]), Lessius
Department of Business Studies, KULeuven CES & LICOS, e-mail: [email protected]
Andrew B. Bernard, Tuck School of Business at Dartmouth, CEPR, & NBER, e-mail: [email protected]
Hylke Vandenbussche, Research Department NBB, IRES-CORE, Université Catholique de Louvain, LICOS & CEPR, e-mail: [email protected]
We are grateful to Danny Delcambre, Karo Nuortila and Jussi Ala-Kihnia from Eurostat for providing us with supplementary files and clarifications related to the concordances, and to Catherine Fuss (NBB) for her comments and insights. This paper was written while Ilke Van Beveren and Hylke Vandenbussche were visiting the National Bank of Belgium. All remaining errors are our own. The views expressed in this paper are those of the authors and do not necessarily reflect the views of the National Bank of Belgium or any other institution to which the authors are affiliated.

NBB WORKING PAPER No.239 - DECEMBER 2012
TABLE OF CONTENTS
1. Introduction ............................................................................................................................. 1
2. Classification systems for international trade and domestic production in the European Union ....................................................................................................................................... 2
2.1 International trade activities: The Combined Nomenclature classification .............................. 3
2.2 Domestic production activities: The Prodcom classification ................................................... 5
2.3 Combining data on international trade and domestic production ........................................... 7
3. Concording data ..................................................................................................................... 9
3.1 Generic concordance procedure and terminology ................................................................. 9
3.2 Combined Nomenclature (CN8) over time .......................................................................... 12
3.3 Prodcom (PC8) over time ................................................................................................... 13
3.4 Concording CN8 and PC8 in a single year to HS6 .............................................................. 15
4. Applying concordances to Belgian trade and production data .......................................... 17
4.1 Exports at continuing firms ................................................................................................. 17
4.2 Production at continuing firms ............................................................................................ 19
5. Conclusion ............................................................................................................................ 20
References ................................................................................................................................. 22
Tables and figures ....................................................................................................................... 23
National Bank of Belgium - Working papers series ....................................................................... 33

1 Introduction
In recent years there has been a rapid increase of research using product-level data to
study both international trade and domestic production. Increasingly this research con-
siders changes over time within and across detailed product categories. However, product
classification systems are constantly being modified by government authorities charged with
data collection and, as a result, underlying physical goods may be classified in different cat-
egories in different years and in some cases may not be part of the classification system in
all years. Pierce and Schott (2012a,b) address these concerns for US data and provide a
methodology for creating consistent product codes across and between trade and production
data. In this paper, we modify their concordance methodology for use with EU production
and trade data at the product-level.1
A number of recent papers either employ longitudinal EU trade and production data or
link trade and production data at the product-level. Alvarez et al. (2006) follow prices of
individual products from distinct establishments over time to examine price stickiness in the
Euro area. Colantone and Crino (2011) employ European data on production and imports
at the product level over time to examine the role of imported inputs on the introduction of
new products. Bernard et al. (2012) use domestic production and international trade data
for Belgium in 2005 to examine the relationship between produced and exported products
by manufacturing firms. Mejean and Schwellnus (2006) use a panel of international trade
data at the firm-product-country level to examine whether price convergence in the euro
area is driven by within-firm or firm composition effects.
In this paper, we provide insights into the coverage and structure of the EU production
and trade classifications and the variation of those classifications over time. We highlight
issues related to the development of a common classification that allows researchers to
compare product-level production and trade data. Data sets requiring these concordance
procedures might cover product-level trade data over time, product-level production data
over time, or linked trade and production data by product for individual years or over time.
Using the algorithms developed by Pierce and Schott (2012a,b) we develop general con-
cordance programs that allow individual researchers to create internally-consistent product
1Alternative concordance procedures can be used to keep track of changes in classification systems overtime. For instance, Fuss and Zhu (2012) use the methodology developed by E. Dhyne (NBB) to concord thedomestic production data for Belgium over time by assuming constant production shares over time, i.e. ifa firm produces a particular product in t that has been split into more than one product category in t+1,they split production into the different categories in t by applying the production shares of t+1 (firm-levelor average across firms if the firm no longer produces any of the product categories in t+1). They convertthe data to the product classification observed in the last year of the sample.
1

classifications that are appropriate to the countries and years in their data. All the programs
and product classification files discussed in this paper are available for download.2
We examine the implications of using data without adjustments for variation in the
trade and production classifications for Belgian firm-level data from 1995-2003. Ignoring
changes in the product classifications results in a substantial overstatement of product
adding and dropping for continuing exporters. Employing consistent export product codes
causes the number of added and dropped export products to fall by more than 5 percent
while the value of exports in added and dropped products decreases by more than 50
percent. Using consistent product codes for production also substantially reduces product
adding and dropping, more than 10 percent for the number of products and more than a
third for the value of production.
Perhaps most important are the year-by-year changes. Years with major revisions to the
export or production classification systems also appear to be years with disproportionately
large amounts of product adding and dropping. However, the large amount of product
churning is almost entirely a result of the classification changes themselves. The use of
consistent codes shows that product adding and dropping is not abnormally high in such
years.
Section 2 describes the classification systems used in the EU to record domestic produc-
tion and international trade activities and provides insights into the differences in coverage
between the domestic production and trade classifications. Section 3 describes the generic
concordance algorithm, developed by Pierce and Schott (2012a) and then applies this algo-
rithm to EU international trade and production data. Section 4 applies the concordances
developed to firm-product level production and trade data for Belgium and Section 5 con-
cludes.
2 Classification systems for international trade and domesticproduction in the European Union
In this section, we introduce the product classification systems used in the European Union
for trade and production. While the two systems are designed to be similar there are impor-
tant differences between the two at a point in time and across years. All the concordances
developed below rely on classification lists and concordance tables provided by Eurostat.3
2 www.sites.google.com/site/ilkevanbeveren/Concordances.3Most classifications and concordance tables are available for download on the European Union’s classi-
fication metadata server, i.e. the Ramon server (http://ec.europa.eu/eurostat/ramon/). Supplementaryfiles have been provided by Danny Delcambre, Karo Nuortila and Jussi Ala-Kihnia from Eurostat.
2
2.1 International trade activities: The Combined Nomenclature classifi-cation
EU Statistics on the international trade of goods register the value and quantity of goods
traded (i) between Member States of the EU (intra-EU trade) and (ii) by EU Member
States with non-EU countries (extra-EU trade). When goods are declared to customs in the
European Union, they have to be classified according to the 8-digit Combined Nomenclature
or CN8. The first six digits of the CN8 codes correspond to the (international) Harmonized
System (HS6) nomenclature. The Harmonized System is established and maintained by
the World Customs Organization (WCO). This systematic list of commodities forms the
basis for international trade negotiations, and is applied by most trading nations. The
European CN8 classification system is an (8-digit) extension of the HS6 classification system,
analogous to the ten-digit extensions (HS10) employed by the US.
The CN8 classification was developed to meet, at the same time, the requirements both
of the Common Customs Tariffs and of the external trade statistics of the European Union
(extra-EU trade). The CN8 classification is also used to record intra-Community trade
statistics (intra-EU trade). In 2010 there were 9443 CN8 products but the number varies
across years, reaching a peak of 10606 CN8 products in 1997.
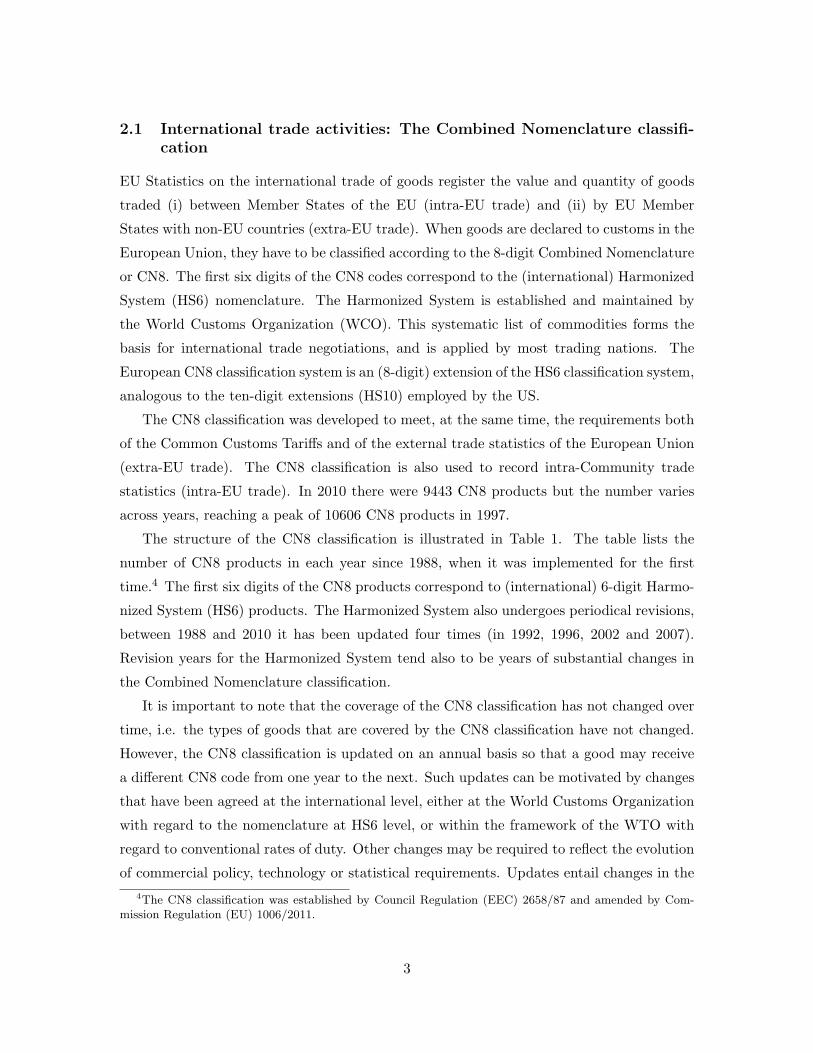
The structure of the CN8 classification is illustrated in Table 1. The table lists the
number of CN8 products in each year since 1988, when it was implemented for the first
time.4 The first six digits of the CN8 products correspond to (international) 6-digit Harmo-
nized System (HS6) products. The Harmonized System also undergoes periodical revisions,
between 1988 and 2010 it has been updated four times (in 1992, 1996, 2002 and 2007).
Revision years for the Harmonized System tend also to be years of substantial changes in
the Combined Nomenclature classification.
It is important to note that the coverage of the CN8 classification has not changed over
time, i.e. the types of goods that are covered by the CN8 classification have not changed.
However, the CN8 classification is updated on an annual basis so that a good may receive
a different CN8 code from one year to the next. Such updates can be motivated by changes
that have been agreed at the international level, either at the World Customs Organization
with regard to the nomenclature at HS6 level, or within the framework of the WTO with
regard to conventional rates of duty. Other changes may be required to reflect the evolution
of commercial policy, technology or statistical requirements. Updates entail changes in the
4The CN8 classification was established by Council Regulation (EEC) 2658/87 and amended by Com-mission Regulation (EU) 1006/2011.
3

coding system and necessitate a concordance procedure to be able to compare product-level
EU trade data across years.
Although regulation on external trade statistics is EU-based, the trade data are main-
tained and collected by the National Statistical Institutes (NSIs)5 of the member states.6
Member states are required to report country-product-level aggregated data to Eurostat.
These country-product-level data come from a combination of mandatory firm surveys and
customs records. Whether firms have to report their trade transactions depends on the
value and destination/origin of trade flows.
Specifically, for intra-EU trade flows, firms have to report their product-country level
trade flows on a monthly basis, using an electronic submission system. EUmember states are
allowed to exempt firms from reporting intra-EU trade to ease the burden of reporting, but
member states have to ensure that at least 97 percent of total trade is covered. Therefore,
different EU countries can impose different cutoffs for reporting (usually defined in terms
of current or past trade value). Cutoffs have to be defined annually by the member states,
hence they can increase in size.
For trade flows destined for or originating in countries outside of the European Union
(extra-EU trade), data are collected from customs data. Usually these data are collected on
a transaction basis, though a few companies are exempt from this. Exempted companies file
a monthly declaration with their NSI. Customs declarations are collected on a daily basis
and aggregated by the NSIs. For extra-EU trade, all transactions whose value is higher
than e1,000 or whose weight is greater than 1,000kg have to be recorded. Since 2006, elec-
tronic reporting procedures have been more widely implemented for customs transactions,
resulting in very small transactions also being reported.
It should also be noted that the group of destination and origin countries in the intra-EU
and extra-EU declaration has changed over time due to changes in EU membership. For the
time period considered here (1988-2010), there are three such changes. In 1995, Austria,
Finland and Sweden joined the EU. In May 2004, ten new countries joined: Cyprus, Czech
Republic, Estonia, Hungary, Latvia, Lithuania, Malta, Poland, Slovakia and Slovenia. In
2007, Bulgaria and Romania joined.
5Collection and dissemination of statistics in the European Union is carried out by the “European Statisti-cal System” (ESS), consisting of the European Commission (Eurostat), the national statistical institutes andother national authorities of the member states. See http://epp.eurostat.ec.europa.eu/portal/page/
portal/pgp_ess/about_ess for the list of NSIs and other national institutes involved in data collection.6See http://epp.eurostat.ec.europa.eu/statistics_explained/index.php/International_trade_
in_goods for more detailed information regarding the collection of data on international trade in goods,relevant EU regulation and other metadata.
4

If a country joins the EU, exports to and imports from that destination are no longer
reported in the extra-EU trade statistics (there is no customs declaration within the EU)
and have to be declared in the intra-EU trade statistics. However, due to the cutoffs for
reporting intra-EU trade, it is possible that a particular firm’s exports to the country may
no longer be recorded after the accession. The 2004 enlargement poses particular difficulties
for researchers as it occurred in the middle of the calendar year (May 1, 2004). Trade with
these ten countries is covered by different rules before and after May 1, 2004 and numerous
firms that are probably trading continuously appear to be exiting these ten markets on that
date.
2.2 Domestic production activities: The Prodcom classification
The name Prodcom refers to “statistics on the production of manufactured goods”. Specif-
ically, Prodcom refers to both a database that records data on the physical production of
manufactured products within EU countries and to a product classification used to classify
physical production of manufactured goods. The term comes from the French “PRODuction
COMmunautaire” (Community Production).
In the Prodcom survey, EU firms are required to report their industrial production and
services in products that are on the Prodcom list. Although Prodcom regulation is EU-
based, firm-product level Prodcom data are obtained by the NSIs of the member states.7
The member states are required to report product-level aggregated data to Eurostat. Mem-
ber states can exempt firms from reporting to Prodcom to ease the reporting burden, but
they have to ensure that 90 percent of national production in each NACE 4d sector covered
by Prodcom is included in the Prodcom survey.8 Cutoffs for reporting can therefore differ
in different EU countries and can increase over time. The Prodcom survey is mandatory
for all qualifying firms. All EU member states, EFTA (European Free Trade Association)
countries Norway and Iceland and some future EU accession countries are bound by the
Prodcom reporting requirements (Eurostat, 2006a).
In the Prodcom declaration, which has to be filed to the appropriate NSI on a monthly
basis, firms are required to record their production activities at the 8-digit Prodcom (PC8)
product level. Among other information, the Prodcom declaration includes (firm-)product
7See http://epp.eurostat.ec.europa.eu/statistics_explained/index.php/PRODCOM_statistics formore detailed information regarding the Prodcom regulation and other metadata. PRODCOM was estab-lished by Council Regulation (EEC) 3924/91, ammended by Regulation (EC) 1882/2003 and 1893/2003 ofthe European Parliament and the Council.
8The NACE classification is the statistical classification of economic activities in the European Union,cfr. infra.
5
level data on the physical volume and value of production sold during the survey period.
Products are defined as Prodcom products, i.e. they are part of the European Prodcom
list. As with the EU trade data, the PC8 codes are also subject to annual changes, i.e. the
same good covered by the Prodcom survey in neighboring years might be reported under
different PC8 codes.
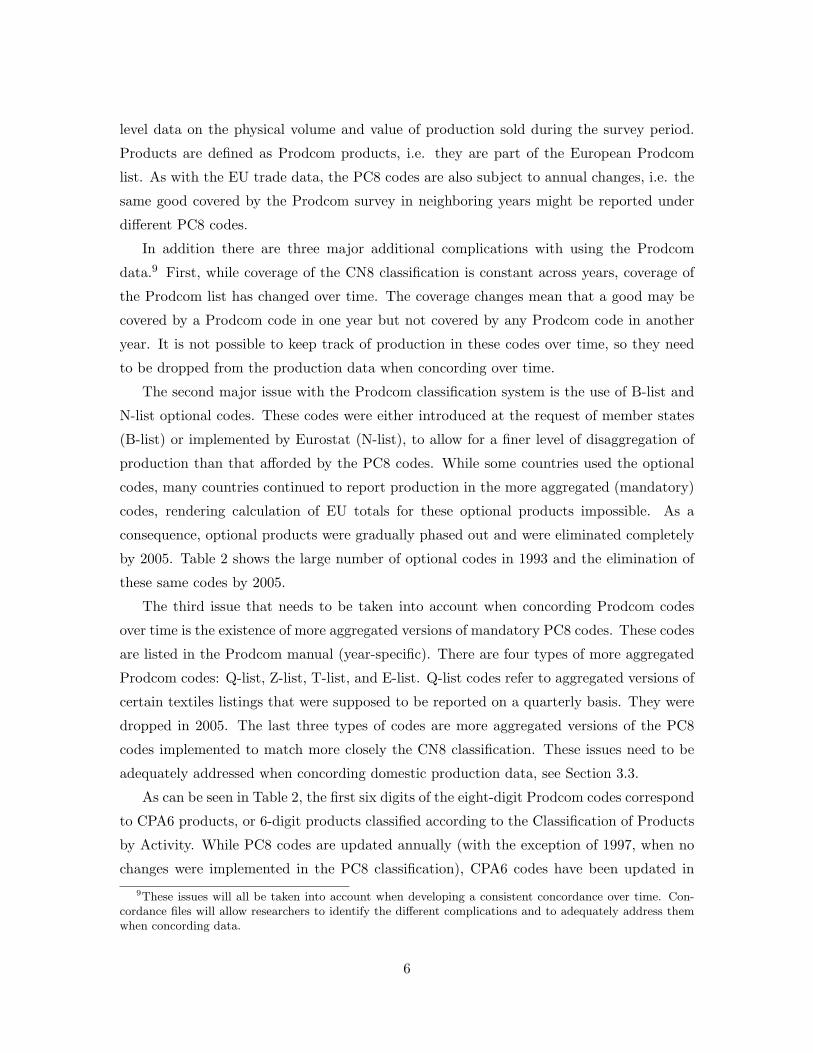
In addition there are three major additional complications with using the Prodcom
data.9 First, while coverage of the CN8 classification is constant across years, coverage of
the Prodcom list has changed over time. The coverage changes mean that a good may be
covered by a Prodcom code in one year but not covered by any Prodcom code in another
year. It is not possible to keep track of production in these codes over time, so they need
to be dropped from the production data when concording over time.
The second major issue with the Prodcom classification system is the use of B-list and
N-list optional codes. These codes were either introduced at the request of member states
(B-list) or implemented by Eurostat (N-list), to allow for a finer level of disaggregation of
production than that afforded by the PC8 codes. While some countries used the optional
codes, many countries continued to report production in the more aggregated (mandatory)
codes, rendering calculation of EU totals for these optional products impossible. As a
consequence, optional products were gradually phased out and were eliminated completely
by 2005. Table 2 shows the large number of optional codes in 1993 and the elimination of
these same codes by 2005.
The third issue that needs to be taken into account when concording Prodcom codes
over time is the existence of more aggregated versions of mandatory PC8 codes. These codes
are listed in the Prodcom manual (year-specific). There are four types of more aggregated
Prodcom codes: Q-list, Z-list, T-list, and E-list. Q-list codes refer to aggregated versions of
certain textiles listings that were supposed to be reported on a quarterly basis. They were
dropped in 2005. The last three types of codes are more aggregated versions of the PC8
codes implemented to match more closely the CN8 classification. These issues need to be
adequately addressed when concording domestic production data, see Section 3.3.
As can be seen in Table 2, the first six digits of the eight-digit Prodcom codes correspond
to CPA6 products, or 6-digit products classified according to the Classification of Products
by Activity. While PC8 codes are updated annually (with the exception of 1997, when no
changes were implemented in the PC8 classification), CPA6 codes have been updated in
9These issues will all be taken into account when developing a consistent concordance over time. Con-cordance files will allow researchers to identify the different complications and to adequately address themwhen concording data.
6

1996, 2002 and 2008. Not all CPA6 codes are covered by the PC list, so the total number of
CPA6 products is not directly comparable to the number of PC8 products. The first four
digits of the PC8 code correspond to the NACE4 classification. The NACE4 classification
was revised in 2002 and 2008. It should be noted that the NACE4 classification is not
a classification of products, but rather a classification of economic activities that create
products. The NACE4 classification is often used to classify European firms into sectors
based on their (main) economic activities. Similar to the CPA6 products, some NACE4
activities are not covered by the Prodcom list.
Eurostat developed the Prodcom list with two principal goals in mind: (i) measure
production in the EU member states on a comparable basis and (ii) enable a comparison
between production and foreign trade statistics (Eurostat, 2006a). In light of the second aim,
the Prodcom list has a close relationship with the Combined Nomenclature classification
which is used to record foreign trade statistics.
The Prodcom list (i.e. the list of PC8 products for which firms are required to report
their domestic production activities) is revised on a yearly basis (cfr. Table 2). Changes
include changes in the classification system (two codes in 1998 are replaced by one new
code in 1999 for instance) and changes in coverage of the Prodcom list. The choice of
products included in the list generally depends on their economic importance; if a product
is considered as important either in value or volume it is included as a distinct item; if it
is (or becomes) less important it may be aggregated with other products. In general, the
Prodcom list covers production activities in Mining, Quarrying and Manufacturing: sections
C, D and E of the NACE4 (Rev. 1.1) classification.
Products not included in the Prodcom list are products that, although they belong to
sections C, D or E of NACE, are not considered as manufactured products (for instance
waste, some agricultural products where the processing is not considered as manufacturing
etc.). The Prodcom list also does not cover Fuel products. The coverage of the Prodcom
list (and changes in coverage over time) has important implications for the translation of
European trade and domestic production data into a common classification. We will come
back to these issues below.
2.3 Combining data on international trade and domestic production
When concording international trade and domestic production data at the (firm-)product
level, it is necessary to translate the CN8 product codes (used for international trade) and
PC8 product codes (used for domestic production) into a common classification. Since
7

there are more CN8 codes than PC8 codes (i.e. the CN8 classification is less aggregated),
the most straightforward correspondence maps the CN8 products into PC8 products.10
However, Prodcom codes are not used internationally (outside of Europe) which renders
international comparisons difficult. Moreover, reported trade flows and tariffs, which are
often used in international trade research, are often available only for HS6 product codes.
The current paper therefore focuses on the translation of CN8 and PC8 products into
six-digit Harmonized System (HS6) products. Since the first six digits of the CN8 codes
correspond to the HS6 codes, EU concordance files between PC8 and CN8 can be adapted
for this purpose.
As noted above, Eurostat developed the Prodcom list with the specific goal to enable
comparison between production and foreign trade statistics. However, there are some im-
portant differences in coverage between the two classifications that need to be taken into
account. Figure 1 illustrates the concordance of the PC8 and CN8 classifications into a
common classification system (HS6+) for a single year.11
A first issue that needs to be addressed when concording trade and production data is
that not all CN8 products are covered by the Prodcom list. These CN8 codes therefore do
not feature in the concordance files provided by Eurostat and need to be excluded from the
international trade data. Since the Prodcom list changes every year, the list of CN8 codes
that do not feature in the Prodcom list is also year-specific. CN8 codes not covered by
the PC8 classification in a particular year can be identified by comparing the list of CN8
codes present in Eurostat’s concordance files between CN8 and PC8 with the complete list
of CN8 codes for that year. All codes present in the CN8 classification but not present in
the concordance from CN8 to PC8 are CN8 codes that are not covered by the Prodcom
list. These CN8 codes necessarily have to be excluded from the international trade data
when merging domestic production and trade data at the product level. The remaining
CN8 codes are all covered by the Prodcom List in that particular year and can hence be
translated into the HS6+ classification, as can be seen in Figure 1.
Second, not all PC8 products are covered by the CN8 classification. This is the case
for certain industrial services and for activities related to installation, maintenance, repair
or processing activities. PC8 codes not covered by the CN8 classification in a particular
year can be identified by comparing the PC8 classification in a particular year with the
10The concordance between CN8 and PC8 codes is available at www.sites.google.com/site/
ilkevanbeveren/Concordances11We use the ”+” to refer to a classification system where some of the original (HS6) categories have been
combined.
8

list of PC8 codes present in Eurostat’s concordance files between CN8 and PC8. Prodcom
codes that feature on the Prodcom list, but not in the concordance between CN8 and
PC8 are either PC8 codes not covered by the CN8 classification (industrial services, waste
products, ...), or the disaggregated versions of codes on the Z-, T-, Q- or E-list (aggregated
PC8 products). These aggregated PC8 codes feature as disaggregated PC8 products in the
Prodcom list, but they appear as aggregated (Z-, Q-, T- or E-list) codes in the concordance
files between CN8 and PC8.12 Moreover, prior to 2005, the PC8 classification will feature
optional codes (B- and N-list, cfr. Section 2.2).13 Like the disaggregated products, which
have to be recoded into their aggregate counterparts, the optional codes need to be recoded
into their mandatory counterparts prior to concording the data. After dropping industrial
services and recoding optional and disaggregated PC8 products into their mandatory and
aggregate counterparts, the PC8 classification can be concorded into the HS6 classification,
as shown in Figure 1. We will come back to these issues in Section 3.4.
Finally, when combining data on international trade and domestic production over time,
it is important to take into account changes in the coverage of the Prodcom list, differences
in coverage between the PC8 and CN8 classification (industrial services, CN8 products not
covered by Prodcom) and changes in both classification systems (CN8 and PC8) over time.
3 Concording data
3.1 Generic concordance procedure and terminology
The terminology used in this section largely follows the terminology of Pierce and Schott
(2012a, henceforth PS). Specifically, to develop consistent classifications over time, we will
refer to “effyr” as the year in which a particular change in a classification over time becomes
effective. “Obsolete” refers to codes that are no longer used starting in the effective year
(effyr) and “new” refers to codes that will be used starting in the effective year. When
we refer to concordances between two classifications (e.g. PC8 to HS6), we do not refer to
obsolete and new codes, but rather to source and destination codes.
Concordance files (between two years, or between two classifications) are always orga-
nized in a similar way. All codes that are subject to a change over time or that need to
12For Q-, T-, and E-aggregates, both the aggregate and disaggregate codes feature in the concordance filesbetween PC8 and CN8, hence they do not have to be recoded. Z-codes only feature in their more aggregatedversions in the concordance file however.
13Since optional codes were not consistently used in all countries, we provide PC8 classification files thatonly list mandatory and disaggregated PC8 codes. Optional codes can be recoded in the data using theonline files provided prior to concording.
9
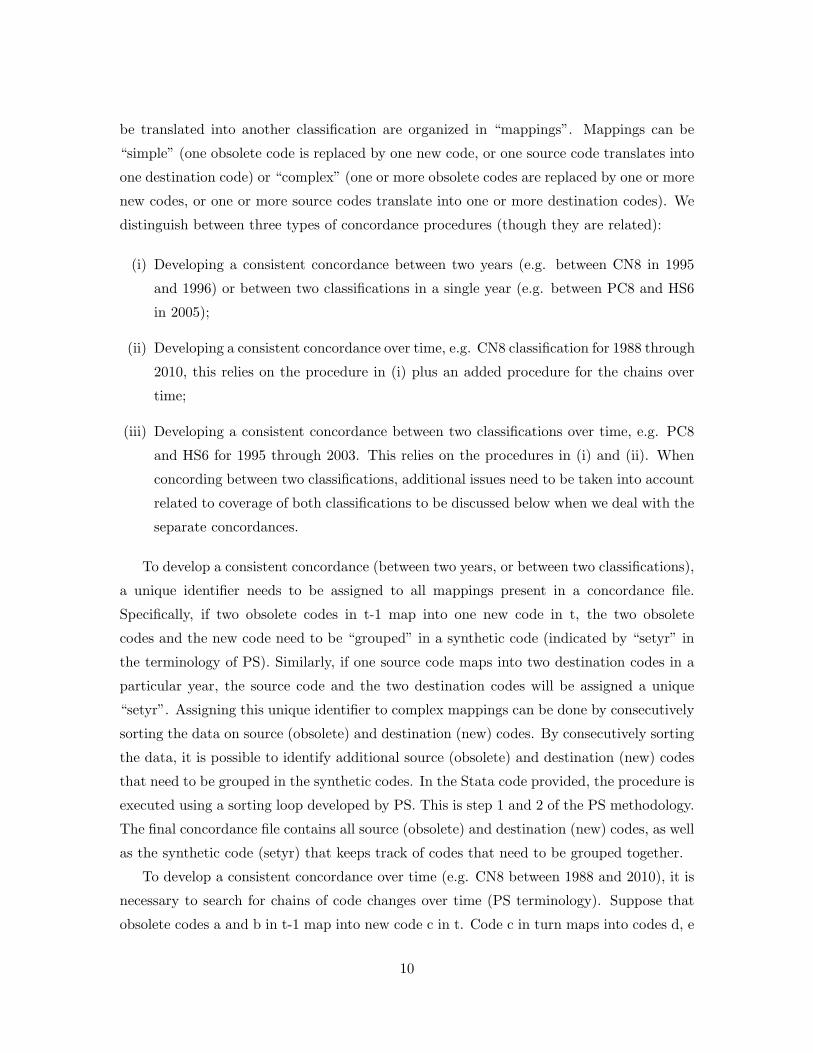
be translated into another classification are organized in “mappings”. Mappings can be
“simple” (one obsolete code is replaced by one new code, or one source code translates into
one destination code) or “complex” (one or more obsolete codes are replaced by one or more
new codes, or one or more source codes translate into one or more destination codes). We
distinguish between three types of concordance procedures (though they are related):
(i) Developing a consistent concordance between two years (e.g. between CN8 in 1995
and 1996) or between two classifications in a single year (e.g. between PC8 and HS6
in 2005);
(ii) Developing a consistent concordance over time, e.g. CN8 classification for 1988 through
2010, this relies on the procedure in (i) plus an added procedure for the chains over
time;
(iii) Developing a consistent concordance between two classifications over time, e.g. PC8
and HS6 for 1995 through 2003. This relies on the procedures in (i) and (ii). When
concording between two classifications, additional issues need to be taken into account
related to coverage of both classifications to be discussed below when we deal with the
separate concordances.
To develop a consistent concordance (between two years, or between two classifications),
a unique identifier needs to be assigned to all mappings present in a concordance file.
Specifically, if two obsolete codes in t-1 map into one new code in t, the two obsolete
codes and the new code need to be “grouped” in a synthetic code (indicated by “setyr” in
the terminology of PS). Similarly, if one source code maps into two destination codes in a
particular year, the source code and the two destination codes will be assigned a unique
“setyr”. Assigning this unique identifier to complex mappings can be done by consecutively
sorting the data on source (obsolete) and destination (new) codes. By consecutively sorting
the data, it is possible to identify additional source (obsolete) and destination (new) codes
that need to be grouped in the synthetic codes. In the Stata code provided, the procedure is
executed using a sorting loop developed by PS. This is step 1 and 2 of the PS methodology.
The final concordance file contains all source (obsolete) and destination (new) codes, as well
as the synthetic code (setyr) that keeps track of codes that need to be grouped together.
To develop a consistent concordance over time (e.g. CN8 between 1988 and 2010), it is
necessary to search for chains of code changes over time (PS terminology). Suppose that
obsolete codes a and b in t-1 map into new code c in t. Code c in turn maps into codes d, e
10
and f in t+3. Codes a, b, c, d, e and f then need to be grouped in all years. In other words,
consecutive changes in codes (new codes in some year become obsolete in a later year) need
to be chained together in “family trees”.
Depending on the beginning and end year of the concordance, the family trees can be
different.14 Once a start and end year have been chosen, families can be identified. The Stata
code identifies families by searching for updates of new codes in later years (“news” loop).
Specifically, for each new code in a particular year, the algorithm searches for matching
(identical) obsolete codes in later years. If a new code has become obsolete in later years,
the two families of which the code is part are chained together. These family trees can then
be merged back into the file with all obsolete and new mappings.15 The final concordance
contains new and obsolete codes in all years, as well as the synthetic code (setyr) that keeps
track of codes that need to be grouped together.
To develop a consistent concordance between two classifications over time (e.g. PC8
to HS6 between 1995 and 2003), it is necessary to keep track of changes over time in
both the source and destination classification and to take the mappings between the two
classifications into account. This can be done by merging the concordance files developed in
(i) and (ii). Specifically, if the source classification is PC8 and the destination classification
is HS6 for the period 1995-2003, step (i) will result in a list of PC8 codes in each year
and their corresponding synthetic code (setyr-pc8) and in a list of HS6 codes in each year
and their corresponding synthetic code (setyr-hs6).16 Step (ii) will result in a list of PC8
14Essentially, the concordance procedure will result in a different number of synthetic codes dependingon the time period chosen. Since synthetic codes group original products that were recorded either more(shrinking family) or less (growing family) detailed in previous years, the number of synthetic codes andhence the level of detail of the final (synthetic) product classification will be reduced as the time periodconsidered increases. For instance, expressed as a share of the average number of original yearly CN8products, the average number of CN8+ products observed in the Belgian trade data drops from above 90%when a time period of five years is considered to below 75% when a time period of 18 years is considered.Similarly, for the Prodcom classification, the average yearly share of PC8+ products observed in the Belgiandata, compared to the original number of yearly PC8 codes drops from above 95% for a period of five yearsto below 90% for a period of 16 years. Intuitively, the final (synthetic) product classification becomes moreaggregated as the time period considered increases. The interested reader is referred to the online appendixof this paper, which documents a sensitivity analysis for different time periods. Alternative concordanceprocedures, such as the one employed by Fuss and Zhu (2012), who concord Belgian production data to theproduct classification observed in the final year by assuming identical production shares over time, have theadvantage that they would result in an identical number of (potential) products observed in the data (i.e.the number of PC8 products in the classification in the final year of the concordance), regardless of the timeperiod chosen. However, the assumption of identical production shares is likely to become less realistic astime increases, leading to other interpretation and measurement issues.
15The news loop only retains codes that have undergone multiple changes over the time period considered,hence the family trees have to be combined with the original mappings to obtain a final unique identifierthat keeps track of changes between two years and family trees over time.
16A correspondence for HS6 codes over time can easily be derived from the CN8 classification and cor-
11
and HS6 codes, as well as the synthetic code that keeps track of the complex mappings
between the two classifications in 2003. By merging the files resulting from steps (i) and
(ii) for the final year of the concordance (2003 in this case), a list of PC8 and HS6 codes is
obtained with a corresponding synthetic code over time (setyr-pc8 and setyr-hs6), as well as
a synthetic code (HS6+) that keeps track of the mappings between the two classifications.
This file can be used to assign a unique (final) identifier to all codes that need to be grouped
due to (i) a change of PC8 codes over time, (ii) a change of HS6 codes over time and (iii)
a complex mapping between PC8 and HS6 in the final year of the concordance that takes
differences in coverage in the PC8 and CN8 classification in a single year as well as over
time into account.
In what follows, we will apply these concordance procedures to three specific situa-
tions. Section 3.2 will focus on concording international trade data over time, i.e. con-
cording the CN8 classification into CN8+, while section 3.3 discusses the concordance of
production data over time, i.e. concording the PC8 classification into PC8+. Section 3.4
focuses on the translation of trade (CN8) and production (PC8) data into a common
classification (HS6+) for a single year. All concordance files and Stata implementation
files can be downloaded from https://www.sites.google.com/site/ilkevanbeveren/
Concordances. Concordances for some other applications, such as translating CN8 into
PC8 for a single year and translating HS6 products over time, are also available online.
3.2 Combined Nomenclature (CN8) over time
As noted above, CN8 codes are subject to yearly revisions. Table 3 lists the yearly changes
in the CN8 classification between 1988 and 2010.17 Changes in CN8 codes between t-1
and t can be simple (one obsolete CN8 code translates in a new CN8 code the next year)
or complex (involving more than one obsolete and/or new code). Complex mappings can
be one-many (one obsolete CN8 code maps into more than one new CN8 code), many-one
(more than one obsolete CN8 code maps into one new CN8 code) or many-many (multiple
obsolete codes translate into multiple new CN8 codes). If the mapping is many-one, the
family of codes is shrinking. If the mapping is one-many, the family is growing.
The six-digit Harmonized System codes are also subject to changes over time, specifically
in 1992, 1996, 2002 and 2007. While there are changes in the CN8 classification in every
respondence files, since the first 6 digits of the CN8 classification correspond to the HS6 classification.Concordance files are available at https://www.sites.google.com/site/ilkevanbeveren/Concordances.
17The CN8 classification was first implemented in 1988. The first year in which changes to the classificationbecame effective (effyr) is therefore 1989.
12

pair of years, the largest numbers of revisions tend to occur in years when the HS6 codes
are revised, in particular 1996, 2002 and 2007.
Depending on the start and end year chosen for the concordance, the concordance pro-
cedure will result in different synthetic groups (CN8+ codes). The Stata code provided
allows for start and end years between 1988 and 2010. The final concordance file gener-
ated by the procedure provides a year-specific list of all existing CN8 products and their
corresponding CN8+ code.18 This file can be merged with international trade data at the
year-CN8 product level to translate CN8 products into the consistent CN8+ classification.
After concording, the data need to be aggregated to the CN8+ level, yielding comparable
product-level trade data for the time period chosen. Section 4.1 illustrates the importance of
concording the data in order to avoid spurious entry and exit dynamics at the product-level.
3.3 Prodcom (PC8) over time
Similar to the CN8 classification, the Prodcom list (PC8 classification) is also subject to
yearly revisions. Table 4 lists the yearly changes in the PC8 classification between 1993
and 2010.19 Like the CN8 codes, changes in PC8 codes between t-1 and t can be simple
(one obsolete PC8 code translates in a new PC8 code the next year) or complex (involving
more than one obsolete and/or new code). However, unlike the CN8 classification, the PC8
classification has been subject to changes in coverage over time. This is illustrated in the
last two columns of Table 4, where the number of codes that enter or exit the Prodcom list
are listed. If a PC8 product is listed on the Prodcom list in some years, but not in others,
it needs to be excluded from the data and concordance procedure in all years to avoid
spurious dynamics. Specifically, if products that “enter” the list in a particular year are
included in the concorded data, this would (erroneously) be interpreted as product entry,
while products that “exit” the list would be interpreted as product exit. The concordance
procedure allows for identification of these entry/exit codes as well as all the products that
map into these codes (in earlier or later years), retaining only PC8 products that are on
the PC list in every year.
Moreover, when concording Prodcom codes over time, it is important to take the exis-
tence of optional (B-list, N-list) and aggregated (Q-, T-, E-, Z-list) PC8 codes into account.
Yearly concordance files provided by Eurostat typically include (some) optional and aggre-
18Concordance files for different time periods are also available in comma-separated format for non-Statausers.
19The Prodcom list was first implemented in 1993. The first year in which changes became effective istherefore 1994.
13
gated codes. For instance, between 2004 and 2005, all existing optional codes are listed as
“exit” codes (no new code is provided, since the optional codes are no longer used after
2005) even though in the majority of cases the corresponding mandatory code still exists
in 2005. Similarly, it can occur that a particular Z-heading (more aggregated PC8 code)
disappears from the list, while the underlying (more disaggregated) PC8 product(s) is (are)
still covered by the PC8 list.20 Identifying these cases requires manual verification of the
changes in PC8 codes over time (using the Prodcom structure files in adjacent years).21 We
provide concordance files for the period 1993-2010 that have been adjusted to adequately
deal with these issues (i.e. optional codes are replaced with mandatory codes and are only
considered as changes in coverage if the mandatory code drops from the Prodcom list) and
corrections are implemented for the aggregate codes if necessary. We further provide in-
put files that allow for identification of optional codes in the data (different EU countries
have implemented different sets of optional codes) and to reclassify them according to their
mandatory PC8 product code if they feature in the data.
Changes in the PC8 classification vary over time, with no or very few changes in some
years (1997, 1998, 2006). Between 2007 and 2008, the Prodcom list, CPA classification and
NACE classification were completely revised, resulting in 4396 obsolete PC8 codes in 2008
and 3864 new codes. However, many of these changes were simple changes (3258).
Similar to the CN8 concordance, the PC8 concordance will result in different groups
of PC8 products depending on the start and end year chosen. The Stata code provided
allows for start and end years between 1993 and 2010. Different from the CN8 classification
and concordance, coverage of the PC8+ classification will drop somewhat as more years
are included in the concordance, due to the changes in coverage of the PC8 classification.22
The final PC8 concordance file provides a year-specific list of all existing PC8 products,
their corresponding PC8+ code and a dummy indicating whether the PC8 product should
be dropped for consistency over time.23 This file can be merged with production data at
the year-PC8 level to translate PC8 products into the consistent PC8+ classification. After
concording and dropping all PC8 codes marked for exit, the data need to be aggregated
to the PC8+ level, yielding comparable product-level production data for the time period
20This can occur for instance if the underlying PC8 products have been replaced by a “regular” moreaggregated PC8 product.
21Prodcom structure files provide detailed lists of aggregated and optional codes in each year. Dependingon the year, these files can be available in PDF, Excel or Access format.
22Cfr. Table 8 illustrates that the changes in coverage only account for a minor share of total soldproduction value in the Belgian data for the time period 1995-2003.
23Concordance files for different time periods are also available in comma-separated format for non-Statausers.
14
chosen. Section 4.2 illustrates the importance of concording the data in order to avoid
spurious entry and exit dynamics at the product-level.
3.4 Concording CN8 and PC8 in a single year to HS6
Concording the trade and production data for a single year introduces several additional
complications, due to differences in coverage between the PC8 and CN8 classifications.
Specifically, (i) some PC8 codes are not covered by CN8 (industrial services24, waste, cfr.
supra), (ii) some PC8 codes are recorded as “aggregated” codes in the PC8-CN8 concor-
dance, because there would otherwise be a large number of codes mapping into a single CN8
code.25, (iii) not all CN8 codes feature in the Prodcom list, these include Fuel products for
instance.
The concordance procedure starts out from the yearly CN8-PC8 concordance files pro-
vided by Eurostat. Since the first 6 digits of the CN8 classification are Harmonized System
products (HS6), this concordance file can easily be modified to translate both the CN8 and
PC8 classification into the HS6+ classification. Moreover, the PC8-CN8 concordance files
allow for easy identification of differences in coverage between the two classifications.
Specifically, for any particular year, it is necessary to merge the (mandatory) PC8
codes26 that feature in the Prodcom list with the PC8 codes that feature in the PC8-
CN8 concordance. Codes that feature in the concordance but not in the Prodcom list are
aggregated codes (Z-, T-, Q- and E-list). Codes that feature on the PC list, but not in the
concordance files between CN8 and PC8 are the disaggregated equivalents of the aggregate-
list codes or industrial services. After recoding the disaggregated PC8 products into their
corresponding aggregates27 and dropping the industrial services from the PC8 classification,
the PC8 classification can be concorded to HS6.
Table 5 lists the number of PC8 products in 2005 as well as the corresponding number of
HS6 and HS6+ products. If a mapping between the PC8 and HS6 classification is one-one
24Examples of industrial services include: dyeing, finishing and printing of textiles, electronic books,coating of metals and book binding services.
25These codes can be identified (manually) in the Prodcom manual. These are the so-called Z-, T-, Q-and E-aggregates. The Z-, T-, Q- and E-codes are the grouped PC8 codes, the underlying PC8 codes thatmap into these codes are the codes that are on the PC list (cfr. supra). While the Prodcom structurefiles are available in excel or access format in some years (in other years only PDF files are available), thisinformation is not structured in an easily accessible way. Files for PC8-CN8 and PC8-HS6 are available for2003 and 2005 at https://www.sites.google.com/site/ilkevanbeveren/Concordances. Aggregate codesare grouped in the structure files under headings 99.t, 99.z, 99.q and 99.e.
26If optional codes feature in the data, they need to be recoded prior to concording the data.27Technically, recoding is only required for Z-list aggregates, as for the other aggregates both the aggregate
and disaggregate codes feature in the yearly concordance files between PC8 and CN8.
15

(simple) or many-one (complex), the PC8 product(s) translate(s) into a single HS6 product.
This is the case for the majority of PC8 products (3351 out of 4220), these products map
into 2563 HS6 products. The remaining PC8 products map into more than one HS6 code,
resulting in 606 HS6+ groupings. The table also illustrates the differences in coverage
between the two classification. Out of a total of 5224 existing HS6 codes in 2005 (cfr. Table
1), 4784 HS6 products are covered by the Prodcom list. Similarly, out of 4489 mandatory
PC8 on the Prodcom list for 2005, 4242 are covered by the CN8 classification and some
of these 4242 codes are recorded in aggregate (Z-)codes, resulting in 4220 PC8 categories
covered by the CN8 classification.
Since the first six digits of the CN8 products are identical to the Harmonized System
(HS6) products, concording international trade data in a single year to HS6 requires a
straightforward aggregation to the HS6+ level (where the HS6+ groupings are identical to
the groups used to concord the production data), after dropping all CN8 products that are
not covered by the PC8 classification in that particular year. To identify these CN8 prod-
ucts, the list of CN8 products for a particular year has to be merged with the concordance
between CN8 and PC8 for that year to obtain a list of CN8 products that are not covered
by the PC8 classification.
The concordance procedure and Stata code allows researchers to concord production
(PC8) and trade (CN8) data into a common HS6+ classification that takes differences in
coverage between the two classification systems adequately into account. The procedure
yields two final concordance files, one for the translation of domestic production data into
the HS6+ classification and a second file to concord CN8 products into the HS6+ classifica-
tion. In addition, auxiliary files are provided that allow for the identification (and recoding
if applicable) of optional and disaggregated PC8 codes as well as industrial services in the
domestic production data. Once industrial services are dropped from the data and dis-
aggregated/optional codes have been recoded, the domestic production data can then be
translated into the HS6+ classification (by merging the data with the concordance using
the PC8 product code).
The concordance file for the international trade data includes a dummy “notpc”, which
identifies CN8 products that are not covered by the Prodcom List. After merging this
concordance file with the data, all CN8 products marked by this dummy should be dropped
from the data. Note that this implies that some HS6 products are covered only partially
by the merged production and trade data, if one or more CN8 codes that map into the HS6
code are not covered by the Prodcom list. Both the domestic production and international
16

trade data then need to be aggregated to the HS6+ level, after which both databases can
be merged at the HS6+ level.
4 Applying concordances to Belgian trade and productiondata
To assess the importance of appropriate handling of product classification changes over
time, we consider firm-level trade and production data from Belgium from 1995-2003.28
Separately for export and production data, we focus on product adding and dropping by
continuing firms and examine the fraction of production and exports at these firms that is
accounted by new and dropped products. We show that the overall value of product adding
and dropping is overstated in the unconcorded data and that years of particularly high
product adding and dropping are largely artifacts of changes in the product classification
systems.29
4.1 Exports at continuing firms
Table 6 documents characteristics of aggregate Belgian exports and imports over the period
as well as the number of products in both the unconcorded CN8 classification and in the
concorded CN8+ codes.30 Both exports and imports increase substantially over time while
28The choice of this interval avoids issues having to do with EU accession and includes only one relativelysmall change in the cutoff for recording intra-EU trade.
29It should be noted that the amount of product adding and dropping in the concorded data is sensitiveto the time period chosen. Since the concorded (synthetic) product classification becomes more aggregated(less detailed, lower number of products compared to the original classification system, cfr. Section 3), theamount of product adding and dropping (and value associated with it) is likely to become smaller in anygiven year as the time period considered for the concordance increases. We can illustrate this, specificallyfor the Belgian trade data, by comparing the amount of adding and dropping (products and value) forcontinuing firms in the concorded data for the year 1995, using the concordance for the years 1993-2010(18 years) and alternatively using the concordance for the years 1995-1999 (only five years). Applying theconcordance for the longer period (93-10) results in a decrease in the amount of product adding (dropping) of24% (24%) compared to the unconcorded data, while the concordance for the shorter period (95-99) resultsin a decrease in the amount of product adding (dropping) of only 14% (14%) compared to the unconcordeddata. In terms of value associated with product adding (dropping), the concordance for 93-10 is associatedwith a drop of 80% (81%) in export value, while the concordance for 95-99 results in a drop of 71% (78%)of export value in added (dropped) products, each time compared to the dynamics in the unconcorded datafor 1995. Intuitively, as the number of CN8+ products relative to the number of original CN8 productsgoes down (i.e. as longer time periods are being considered in the concordance procedure), the dynamics inthe sample due to product adding and dropping by continuing firms will be reduced. A similar exercise canbe performed for the domestic production data, although in this case matters are complicated by the factthe coverage of the PC8 classification changes over time, resulting in different dynamics in the unconcordeddata for a specific year, depending on the time period chosen. The interested reader is referred to the onlineappendix of this paper, which documents a sensitivity analysis for different time periods.
30Whether Belgian firms have to report their intra-EU trade transactions depends on the value of exportsand imports reported in the VAT returns in the previous year. Between 1995 and 1997, all firms that imported
17

in contrast there are no strong trends over time in the number of product codes, either
unconcorded or concorded. However the value of exports and imports affected by coding
changes more than doubles. The share of export value in synthetic codes increases from
29.3 percent of total exports in 1995 to 37.0 percent in 2003 while the shares for imports
are 27.2 and 32.7 respectively.
In Table 7 we examine the effect of product coding changes on the reported importance
of product adding and dropping in Belgian exports. Bernard et al. (2009) emphasize the
importance of within-firm margins of adjustment (both product and country) at continuing
exporters in explaining aggregate annual changes in exports and imports for the US. In
Belgium, as for other countries, the vast majority of exports are by continuing exporters.
More than 98 percent of exports in any given year are handled by firms that will remain
exporters in the following year; the net effect of firms entering and exiting export markets
is relatively small.
Table 7 reports the number and value of added and dropped products at these con-
tinuing exporters for both concorded and unconcorded product codes. A large fraction of
products, more than a third, are added and dropped in every year. Not surprisingly the
value of exports in these added and dropped products is much smaller as average exports of
new and dropped products are much smaller than for continued products. Looking at the
unconcorded data, we find that on average 40.2 percent of products are new in any given
year accounting for 7.7 percent of export value. For dropped products the corresponding
numbers are 38.8 and 6.7 percent. However there is substantial variation across years with
the share of value in both adding and dropping being much larger in 1995-1996 and 2001-
2002 than in other pairs of years. Looking back to Table 3 we see that 1996 and 2002 were
years of unusually large changes in the CN8 product classification system.
Columns 7-10 of Table 7 evaluate the importance of product adding and product drop-
ping using the concorded data. Two important differences between the unconcorded and
concorded results stand out. First, the number and value of added or dropped products
are smaller in the concorded data, both in levels and as a percentage of the totals at the
continuing exporters. Changes in the export product mix are still substantial, more than a
third of the continuing exporters’ product mix is churned every year. However, using con-
sistent product definitions over time, we find that share of export value in added (dropped)
(exported) more than e104,115 were required to report their import (export) transactions. Between 1998and 2003, all firms exporting (importing) more than e250,000 were required to report their export (import)transactions. We use data for the population of exporters. All transactions with transfer of ownership areincluded, with the exception of trade recorded in residual product categories specific to Belgium (accountingfor 4.7 percent of total export value and 1.4 percent of total import value).
18
products is less than half as large, only 3.5 (2.8) percent.
Second, the year-to-year variation is much lower in the concorded data. Years with
large number of coding changes no longer stand out as having unusually large values of
exports in added and dropped products. Both the number of churned products and their
associated export value is relatively stable across years. These results confirm that correctly
classifying products over time can result in substantial differences in the magnitudes of
export activity and help reduce the possibility of spurious annual fluctuations in product
adding and dropping.
4.2 Production at continuing firms
We now turn to the analysis of product adding and dropping in Belgian firm-level produc-
tion data. Using US manufacturing census data, Bernard et al. (2010) report important
contributions of new and dropped products in total output for continuing firms over five-
year intervals. Table 8 documents characteristics of produced sales at continuing firms in
the Belgian Prodcom survey from 1995-2003 as well as the number of products in both
the unconcorded PC8 classification and in the concorded PC8+ codes.31 Produced sales
increase substantially over time (30.0 percent) while in contrast there is a modest decline
over time in the number of product codes, either unconcorded or concorded.
Using the EU production data over time involves an additional complication. The
coverage of products changes over time, i.e. the underlying production activity is not
necessarily present in all years. Columns 7-10 examine the importance of the changes in
coverage from 1995-2003. The magnitudes are relatively modest, annually 0.5 percent of
produced sales are in codes that are affected by changing coverage. However, coding changes
that are distinct from coverage changes are more important, affecting more than 10 percent
of product and 9 percent of produced sales on average. Looking across years we find that
2003 is a substantial outlier in terms of the value of production in synthetic codes. As with
the export data, a quick look at the production codes changes in Table 4 shows that 2003
was a year of unusually large changes to the product classification system.
31Whether or not Belgian firms have to file a Prodcom declaration is based on their employment levelsas tabulated from the firm-level Social Security records of the previous years, their primary activity (in oroutside manufacturing) and their turnover in the previous year. In general, manufacturing firms with morethan ten employees and non-manufacturing firms (with some manufacturing activity) employing more than20 people had to file a monthly Prodcom declaration in Belgium between 1995 and 2003. The Prodcomsurvey records the value of production sold, which does not necessarily correspond with the actual valueproduced in a particular period. All transactions with positive sold production value are included, with theexception of sold production value recorded in unknown PC8 products (these are most likely coding errors,they account for 0.06% of total value of production sold in the population).
19

We examine the effect of product coding changes on the reported importance of prod-
uct adding and dropping in Belgian manufacturing firms in Table 9. Product churning is
less extensive in the production data for continuing firms relative to the trade data. The
unconcorded data show that on average 8.8 percent of products are new and 9.6 percent
of products are dropped across years. Not surprisingly, as in the export data, the value
of these added and dropped products is much smaller, 2.9 and 2.2 percent respectively.
As with the export data, there is substantial variation across years with both adding and
dropping being more important in years with major changes in the product classifications,
see Table 4.
Looking at the concorded data, we find a similar story to the export findings. Both the
number and values of added and dropped products is reduced and the year-to-year variation
is much lower in the concorded data. Years with large number of coding changes no longer
stand out as having a large value of output in added and dropped products.
5 Conclusion
This paper develops a set of procedures to produce consistent product-level classification
codes (either over time and/or between trade and production data) for the EU. Based on
Pierce and Schott (2012a,b), we develop a set of concordance procedures, we develop a
set of Stata do-files to run these procedures and we make the associated files and final
concordances available to researchers who wish to use and compare EU product-level data
over time and across classifications. The programs allow the product codes to be tailored
to the specific countries and year(s) of interest.
We also document the substantial variation that exists in EU product classification
systems over time. For trade data, the set of products that is covered is constant over time
but the number of individual product codes varies from year to year; more than 10 percent
of products may see code changes in a given year. For EU production data, the changes
in the classification system are equally pervasive (almost every code changes in 2008) and
there is the additional complication that the range of goods covered by the system changes
over time.
To evaluate the economic significance of these changes, we examine Belgian export
and production data from 1995-2003, both prior to and after concording the data into a
consistent classification system over time. Comparing the unconcorded and concorded data
shows that the degree of product adding and dropping by firms that continue from one
year to the next falls substantially when a consistent product classification is employed
20

(i.e. after concording the data). In particular, years with unusually large changes in the
classifications systems are associated with spuriously high amounts of product churning
by firms in the unconcorded data, pointing to the importance of developing a consistent
product classification over time.
21

References
Alvarez, Luis J., Emmanuel Dhyne, Marco M. Hoeberichts, Claudia Kwapil,
Herve Le Bihan, Patrick Lunnemann, Fernando Martins, Roberto Sabbatini,
Harald Stahl, Philip Vermeulen, and Jouko Vilmunen, “Sticky Prices in the
Euro Area: A Summary of New Micro Evidence,” Journal of the European Economic
Association, April-May 2006, 4 (2-3). 1
Bernard, Andrew B., Emily J. Blanchard, Ilke Van Beveren, and Hylke Van-
denbussche, “Carry-Along Trade,” NBER Working Paper Series, 2012, 18246. 1
, J. Bradford Jensen, Stephen J. Redding, and Peter K. Schott, “The Margins
of US Trade,” American Economic Review, May 2009, 99 (2), 487–93. 18
, Stephen J. Redding, and Peter K. Schott, “Multiple-Product Firms and Product
Switching,” American Economic Review, March 2010, 100 (1), 70–97. 19
Colantone, Italo and Rosario Crino, “New imported inputs, new domestic products,”
EFIGE Working Paper Series, 2011, 34. 1
Eurostat, Prodcom: Statistics on the production of manufactured goods, Luxembourg: Eu-
rostat, 2006a. 5, 7
Fuss, Catherine and Linke Zhu, “Comparative advantage, multi-product firms and
trade liberalisation: An empirical test,” National Bank of Belgium Working Paper Series,
2012, 219. 1, 11
Mejean, Isabel Jeanne and Cyrille Schwellnus, “Price Convergence in the European
Union: Within Firms or Composition of Firms?,” Journal of International Economics,
2006, 78 (1), 1–10. 1
Pierce, Justin R. and Peter K. Schott, “Concording US Harmonized System Categories
over Time,” Journal of Official Statistics, 2012a, 28 (1), 53–68. 1, 2, 9, 20
and , “A concordance between ten-digit US Harmonized System codes and
SIC/NAICS product classes and industries,” Journal of Economic and Social Measur-
ment, 2012b, 37 (1-2), 61–96. 1, 20
22

Figure 1: Concording trade and production data in a single year
CN8 products covered
by Prodcom List
CN8 products not
covered by Prodcom
List (e.g. Fuel)
International trade
CN8 classification
Common classification
system: HS6+
Domestic production
PC8 classification
PC8 products not
covered by CN8
(industrial services)
PC8 products
(mandatory +
aggregated)
Optional and
disaggregated PC8
products
Translate
HS6+
Covered by CN8 and
PC8
23

Table 1: Structure of the Combined Nomenclature (CN8) Classification
Year # of CN8 products
1988 9506
1989 9579
1990 9695
1991 9743
1992 9837
1993 9906
1994 10108
1995 10448
1996 10495
1997 10606
1998 10587
1999 10428
2000 10314
2001 10274
2002 10400
2003 10404
2004 10174
2005 10096
2006 9841
2007 9720
2008 9699
2009 9569
2010 9443
Combined Nomenclature
8-digit (CN8)
Harmonized System 6-
digit (HS6)
All classification files are obtained from the Eurostat Ramon server, with the exception of
the files for 1988-1994, which were provided by Eurostat on request.
HS6 1988
(# HS6 = 5019)
HS6 1992
(# HS6 = 5018)
HS6 2002
(# HS6 = 5224)
HS6 2007
(# HS6 = 5051)
HS6 1996
(# HS6 = 5113)
24

Table 2: Structure of the Prodcom (PC8) Classification
Year
# of
mandatory
PC8 products
# of optional
PC8 products (B-
list + N-list)
1993 4802 1225
1994 4830 1183
1995 4840 1220
1996 4807 1216
1997 4807 1216
1998 4809 1212
1999 4839 1185
2000 4832 854
2001 4793 814
2002 4764 787
2003 4693 787
2004 4683 788
2005 4489 0
2006 4487 0
2007 4418 0
2008 3864 0
2009 3851 0
2010 3832 0
All classification files are obtained from the Eurostat Ramon server. The number of CPA6 codes and NACE4 codes is
not directly comparable to the number of PC8 products, since not all CPA6 products and NACE4 industries are covered
by the Prodcom List, i.e. coverage of the PC8 classification is more limited than the coverage of the CPA6 and NACE4
classification. Optional codes provide a more detailed breakdown of (some) mandatory codes. B-list codes were
implemented at the request of the member states. B-list codes were gradually phased out, both B-list and N-list codes
have been dropped since 2005.
NACE4 Rev. 2
(# NACE4 = 615)
NACE4 Rev. 1.1.
(# NACE4 = 514)
Classification of
Products by Activity
(CPA) 6-digit
Classification of
economic activities
(NACE)
CPA6 1996
(# CPA6 = 2303)
CPA6 2002
(# CPA6 = 2608)
CPA6 2008
(# CPA6 = 3142)
CPA6 1993
(# CPA6 = 2303)
NACE4 Rev. 1
(since 1990)
(# NACE4 = 503)
Prodcom 8-digit
25

Table 3: Changes in the Combined Nomenclature Classification over time
Effective year
Number of
obsolete codes
Number of new
codes
Number of
families
(including simple
changes)
Number of simple
(one-one) changes
1989 76 149 58 1
1990 122 238 111 11
1991 85 133 64 8
1992 128 222 85 2
1993 276 345 171 14
1994 233 435 197 11
1995 531 871 383 31
1996 1257 1304 792 435
1997 170 281 130 0
1998 334 315 175 0
1999 303 144 132 3
2000 223 109 96 0
2001 90 50 42 1
2002 847 973 504 311
2003 16 20 12 0
2004 503 273 211 7
2005 186 108 95 5
2006 743 489 281 11
2007 1202 1080 630 387
2008 96 75 54 2
2009 257 127 111 0
2010 381 255 151 1
The table shows the number of obsolete and new codes in each year, as well as the number of families
(shrinking, growing or simple) and the number of simple changes (one-one). The effective year refers to the
year in which the change becomes effective. HS6 codes have been revised in 1992, 1996, 2002 and 2007.
The changes in the CN8 classification over time are obtained from the Eurostat Ramon server.
26

Table 4: Changes in the Prodcom Classification over time
Effective year
Number of
obsolete codes
Number of
new codes
Number of
families
(including
simple
changes)
Number of
simple (one-
one) changes
Number of
codes that are
dropped (exit)
Number of
codes that are
new on the list
(entry)
1994 32 46 29 17 4 3
1995 33 52 15 12 19 29
1996 118 80 54 12 14 15
1997 0 0 0 0 0 0
1998 2 0 1 0 2 0
1999 68 90 31 2 3 60
2000 16 12 9 1 0 0
2001 113 76 57 0 0 0
2002 82 54 30 3 0 3
2003 362 294 214 189 1 12
2004 35 24 17 1 1 2
2005 303 105 96 7 65 1
2006 4 2 2 0 0 0
2007 184 131 76 13 3 9
2008 4396 3864 3651 3258 52 19
2009 28 15 15 1 1 1
2010 45 26 23 4 0 0
The table shows the number of obsolete and new codes in each year, as well as the number of families (shrinking,
growing, simple, entry or exit) and the number of simple changes (one-one). The effective year refers to the year in which
the change became effective. Some PC8 codes are not covered throughout the whole sample period, resulting in new codes
(entry) appearing on the list and old codes (exit) disappearing from the list. All changes in the PC8 classification over time
are obtained from the Eurostat Ramon server, optional codes have been removed (or replaced by their mandatory
aggregates) to ensure comparability over time and across countries.
27

Table 5: Prodcom (PC8) to Harmonized System (HS6) - 2005
Type of match PC-HS
Number of PC8 products
Number of HS6 products
Number of HS6+ products
Simple (one-one) PC8-HS6 2140 2140 2140
Many-one PC8-HS6 1211 423 423
One-many PC8-HS6 495 1750
Many-many PC8-HS6 374 471
Total 4220 4784 3169Overall, there are 5224 HS6 products in 2005 (HS2002 classification). However, only 4784 HS6
products are covered by the Prodcom List in 2005. Similarly, there are 4489 (mandatory) PC8 products
on the Prodcom List for 2005, 4242 of these are covered by the CN8 concordance. Some PC8 products
are aggregated into a Z- or T-aggregate for the purpose of concording them to the CN8 classification,
resulting in 4220 PC8 categories in the correspondence file between PC8 and CN8.
606
28

Table 6: Belgian Trade Data, 1995-2003
Value of
exports
(€mio) # Codes
Value in
synthetic
codes (€mio)
% of value in
synthetic
codes
# Codes
replaced by
synthetic
codes
# Final CN8+
codes (original
+ sets)
1995 103,962 9,541 30,454 29.3 2,520 8,426
1996 112,554 9,723 32,992 29.3 2,616 8,542
1997 129,891 9,802 38,339 29.5 2,686 8,540
1998 133,869 9,600 39,515 29.5 2,599 8,408
1999 141,411 9,453 42,918 30.4 2,476 8,378
2000 163,421 9,387 54,994 33.7 2,372 8,420
2001 169,210 9,347 57,458 34.0 2,335 8,420
2002 180,678 9,456 66,962 37.1 2,437 8,435
2003 182,158 9,470 67,419 37.0 2,431 8,451
Average 146,351 9,531 47,895 32.2 2,497 8,447
Value of
imports
(€mio) # Codes
Value in
synthetic
codes (€mio)
% of value in
synthetic
codes
# Codes
replaced by
synthetic
codes
# Final CN8+
codes
(originals +
sets)
1995 94,719 10,098 25,751 27.2 2,653 8,920
1996 104,670 10,144 29,432 28.1 2,708 8,922
1997 122,535 10,215 33,718 27.5 2,802 8,895
1998 124,751 10,183 35,281 28.3 2,781 8,890
1999 132,332 10,012 37,888 28.6 2,615 8,866
2000 158,223 9,911 48,346 30.6 2,504 8,880
2001 163,225 9,873 50,940 31.2 2,469 8,875
2002 170,976 9,976 58,790 34.4 2,567 8,876
2003 170,727 9,968 55,751 32.7 2,574 8,861
Average 138,018 10,042 41,766 29.8 2,630 8,887
Note: The Table shows the value of exports (panel A) and imports (panel B), as well as the number of CN8 and
CN8+ products for the population of Belgian exporters (in panel A) or importers (panel B) between 1995 and
2003. All transactions with transfer of ownership are included, with the exception of trade recorded in residual
product categories specific to Belgium (4.7% of total export value and 1.4% of total import value). Column 2-3
show the value of trade in the data and the number of unconcorded CN8 products. Columns 4-7 report the value
of trade grouped in synthetic (CN8+) codes, as well as the total number of synthetic codes and the total number
of products in the final CN8+ classification.
Panel A: Exports
Panel B: Imports
Year
Year
Unconcorded data Concorded data
Concorded dataUnconcorded data
29

Table 7: Added and Dropped Products at Continuing Belgian Exporters, 1995-2003
# Added
products in
t+1 by
continuing
firms
Value of
exports in
added
products
(t+1) (€mio)
# Dropped
products in
t+1 by
continuing
firms
Value of
exports in
dropped
products (t)
(€mio)
# Added
products in
t+1 by
continuing
firms
Value of
exports in
added
products
(t+1) (€mio)
# Dropped
products in
t+1 by
continuing
firms
Value of
exports in
dropped
products (t)
(€mio)
1995-1996 24,202 125,889 15,381 113,906 14,056 105,383 4,126 95,599 3,030
49.3% 14.5% 44.6% 13.3% 43.7% 3.9% 39.6% 2.9%
1996-1997 24,518 113,200 11,064 107,915 8,755 101,645 5,084 97,314 3,279
42.1% 9.4% 40.1% 7.4% 40.2% 4.3% 38.5% 2.8%
1997-1998 20,336 108,741 9,261 106,620 8,175 95,856 5,049 91,807 4,199
45.3% 7.2% 44.4% 6.4% 42.3% 3.9% 40.5% 3.3%
1998-1999 19,543 94,968 6,971 93,652 5,778 86,079 4,539 84,597 3,536
38.7% 5.2% 38.2% 4.3% 37.0% 3.4% 36.4% 2.6%
1999-2000 19,581 94,130 8,024 93,872 6,910 85,906 4,555 83,490 4,314
37.9% 5.4% 37.8% 4.7% 36.3% 3.1% 35.3% 2.9%
2000-2001 20,319 92,935 5,112 87,557 4,269 86,989 4,608 81,847 3,671
36.5% 3.1% 34.4% 2.6% 35.7% 2.8% 33.6% 2.2%
2001-2002 20,215 98,130 22,912 95,989 20,461 85,041 5,923 83,709 5,539
37.6% 13.3% 36.8% 11.9% 34.1% 3.4% 33.6% 3.2%
2002-2003 19,457 89,598 5,924 89,037 5,636 83,692 5,198 83,026 4,895
33.8% 3.3% 33.6% 3.2% 33.1% 2.9% 32.8% 2.8%
Average 21,021 102,199 10,581 98,569 9,255 91,324 4,885 87,674 4,058
40.2% 7.7% 38.8% 6.7% 37.8% 3.5% 36.3% 2.8%
Without Concordance With Concordance
Note: The Table shows the number of continuing Belgian exporters across pairs of years as well as the number of added and dropped firm-products and the value
of exports in added and dropped products. Columns 3-6 use the CN8 product classification with no concordance for product code changes across years, while
columns 7-10 use a CN8+ classification that uses consistent product codes across all years from 1995-2003. For added (dropped) products, the italicized
numbers indicate the percentage of average continuing firm export products or value in year t+1 and year t that is accounted for by added (dropped) products.
# Continuing
firms
(exports in t
and t+1)Year
30

Table 8: Belgian Production Data, 1995-2003
Value of
produced
sales
(€mio) # Codes
Value in
synthetic
codes (€mio)
% of value in
synthetic
codes
# Codes
replaced by
synthetic
codes
Value in
products that
need to be
dropped due
to changes in
coverage
(€mio)
% of value in
products that
need to be
dropped due
to changes in
coverage
# PC8
products that
have to be
dropped due
to changes in
coverage
# Final PC8+
codes
(original +
sets)
1995 91,676 3,116 8,311 9.1 352 469.4 0.51 13 2,990
1996 91,639 3,014 7,879 8.6 331 442.1 0.48 17 2,898
1997 100,385 2,984 8,543 8.5 317 472.2 0.47 15 2,876
1998 103,528 2,941 8,970 8.7 312 370.9 0.36 15 2,833
1999 102,078 2,955 8,882 8.7 305 381.9 0.37 17 2,857
2000 115,361 2,928 10,506 9.1 297 427.4 0.37 15 2,833
2001 116,544 2,903 10,405 8.9 275 440.1 0.38 17 2,825
2002 114,106 2,879 10,394 9.1 265 417.3 0.37 19 2,808
2003 118,903 2,896 15,797 13.3 281 462.7 0.39 26 2,808
Average 106,025 2,957 9,965 9.3 304 431.5 0.41 17 2,859
Value of Produced Sales
Concorded data
Note: The Table shows the value of sold production, as well as the number of PC8 and PC8+ products for the population of Belgian firms that have participated
in the Prodcom survey between 1995 and 2003. All transactions with positive sold production value are included, with the exception of sold production value
recorded in unknown PC8 products (coding errors, 0.1% of total production value in the population). The first two columns show the value of produced sales in
the data and the number of unconcorded PC8 products. Columns 3-7 report the value of produced sales grouped in synthetic (PC8+) codes, as well as the total
number of synthetic codes and the total number of products in the final PC8+ classification.
Year
Unconcorded data
31

Table 9: Added and Dropped Products at Continuing Belgian Manufacturers, 1995-2003
# Added
products in
t+1 by
continuing
firms
Value in
added
products
(t+1) (€mio)
# Dropped
products in
t+1 by
continuing
firms
Value in
dropped
products (t)
(€mio)
# Added
products in
t+1 by
continuing
firms
Value in
added
products
(t+1) (€mio)
# Dropped
products in
t+1 by
continuing
firms
Value in
dropped
products (t)
(€mio)
1995-1996 5,708 1,980 1,419 2,316 1,052 1,882 1,218 2,221 837
11.8% 1.6% 13.8% 1.2% 11.3% 1.4% 13.3% 0.9%
1996-1997 5,682 1,402 2,984 1,729 1,650 1,379 2,981 1,699 1,650
8.7% 3.2% 10.7% 1.8% 8.6% 3.2% 10.6% 1.8%
1997-1998 5,917 981 860 1,280 1,230 964 860 1,255 1,227
6.0% 0.9% 7.9% 1.2% 6.0% 0.9% 7.8% 1.2%
1998-1999 5,990 1,557 2,202 1,473 2,075 1,450 1,940 1,356 1,833
9.6% 2.2% 9.1% 2.1% 9.0% 1.9% 8.4% 1.8%
1999-2000 6,635 1,092 2,508 1,261 1,522 1,044 1,468 1,207 982
6.3% 2.4% 7.3% 1.4% 6.1% 1.4% 7.0% 0.9%
2000-2001 6,471 1,733 5,278 1,754 4,990 1,316 1,866 1,291 2,006
10.3% 4.7% 10.4% 4.4% 7.8% 1.7% 7.7% 1.8%
2001-2002 6,493 1,204 1,736 1,177 1,441 1,095 863 1,058 587
7.1% 1.5% 6.9% 1.3% 6.5% 0.8% 6.2% 0.5%
2002-2003 6,328 1,776 7,407 1,764 4,771 1,218 4,298 1,233 1,781
10.7% 6.6% 10.6% 4.3% 7.3% 3.8% 7.4% 1.6%
Average 6,153 1,466 3,049 1,594 2,341 1,294 1,937 1,415 1,363
8.8% 2.9% 9.6% 2.2% 7.8% 1.9% 8.6% 1.3%
Note: The Table shows the number of continuing Belgian producers across pairs of years as well as the number of added and dropped firm-products and the
value of produced sales in the added and dropped products. Observations that need to be dropped for consistency over time (changes in PC8 coverage) are
dropped in both the unconcorded and concorded samples. Columns 3-6 use the PC8 product classification with no concordance for product code changes across
years, while columns 7-10 use a PC8+ classification that uses consistent product codes across all years from 1995-2003. For added (dropped) products, the
italicized numbers indicate the percentage of average continuing firm produced products or value in year t+1 and year t that is accounted by added (dropped)
products.
With ConcordanceWithout Concordance
# Continuing
firms
(positive
production
in t and t+1)
32
NBB WORKING PAPER No. 239 - DECEMBER 2012 33
NATIONAL BANK OF BELGIUM - WORKING PAPERS SERIES The Working Papers are available on the website of the Bank: http://www.nbb.be. 184. "Discriminatory fees, coordination and investment in shared ATM networks" by S. Ferrari, Research
series, January 2010. 185. "Self-fulfilling liquidity dry-ups", by F. Malherbe, Research series, March 2010. 186. "The development of monetary policy in the 20th century - some reflections", by O. Issing, Research
series, April 2010. 187. "Getting rid of Keynes? A survey of the history of macroeconomics from Keynes to Lucas and beyond",
by M. De Vroey, Research series, April 2010. 188. "A century of macroeconomic and monetary thought at the National Bank of Belgium", by I. Maes,
Research series, April 2010. 189. "Inter-industry wage differentials in EU countries: What do cross-country time-varying data add to the
picture?", by Ph. Du Caju, G. Kátay, A. Lamo, D. Nicolitsas and S. Poelhekke, Research series, April 2010.
190. "What determines euro area bank CDS spreads?", by J. Annaert, M. De Ceuster, P. Van Roy and C. Vespro, Research series, May 2010.
191. "The incidence of nominal and real wage rigidity: An individual-based sectoral approach", by J. Messina, Ph. Du Caju, C. F. Duarte, N. L. Hansen, M. Izquierdo, Research series, June 2010.
192. "Economic importance of the Belgian ports: Flemish maritime ports, Liège port complex and the port of Brussels - Report 2008", by C. Mathys, Document series, July 2010.
193. "Wages, labor or prices: how do firms react to shocks?", by E. Dhyne and M. Druant, Research series, July 2010.
194. "Trade with China and skill upgrading: Evidence from Belgian firm level data", by G. Mion, H. Vandenbussche, and L. Zhu, Research series, September 2010.
195. "Trade crisis? What trade crisis?", by K. Behrens, G. Corcos and G. Mion, Research series, September 2010.
196. "Trade and the global recession", by J. Eaton, S. Kortum, B. Neiman and J. Romalis, Research series, October 2010.
197. "Internationalization strategy and performance of small and medium sized enterprises", by J. Onkelinx and L. Sleuwaegen, Research series, October 2010.
198. "The internationalization process of firms: From exports to FDI?", by P. Conconi, A. Sapir and M. Zanardi, Research series, October 2010.
199. "Intermediaries in international trade: Direct versus indirect modes of export", by A. B. Bernard, M. Grazzi and C. Tomasi, Research series, October 2010.
200. "Trade in services: IT and task content", by A. Ariu and G. Mion, Research series, October 2010. 201. "The productivity and export spillovers of the internationalisation behaviour of Belgian firms", by
M. Dumont, B. Merlevede, C. Piette and G. Rayp, Research series, October 2010. 202. "Market size, competition, and the product mix of exporters", by T. Mayer, M. J. Melitz and
G. I. P. Ottaviano, Research series, October 2010. 203. "Multi-product exporters, carry-along trade and the margins of trade", by A. B. Bernard, I. Van Beveren
and H. Vandenbussche, Research series, October 2010. 204. "Can Belgian firms cope with the Chinese dragon and the Asian tigers? The export performance of multi-
product firms on foreign markets" by F. Abraham and J. Van Hove, Research series, October 2010. 205. "Immigration, offshoring and American jobs", by G. I. P. Ottaviano, G. Peri and G. C. Wright, Research
series, October 2010. 206. "The effects of internationalisation on domestic labour demand by skills: Firm-level evidence for
Belgium", by L. Cuyvers, E. Dhyne, and R. Soeng, Research series, October 2010. 207. "Labour demand adjustment: Does foreign ownership matter?", by E. Dhyne, C. Fuss and C. Mathieu,
Research series, October 2010. 208. "The Taylor principle and (in-)determinacy in a New Keynesian model with hiring frictions and skill loss",
by A. Rannenberg, Research series, November 2010. 209. "Wage and employment effects of a wage norm: The Polish transition experience" by
A. de Crombrugghe and G. de Walque, Research series, February 2011. 210. "Estimating monetary policy reaction functions: A discrete choice approach" by J. Boeckx,
Research series, February 2011. 211. "Firm entry, inflation and the monetary transmission mechanism" by V. Lewis and C. Poilly,
Research series, February 2011. 212. "The link between mobile telephony arrears and credit arrears" by H. De Doncker, Document series,
March 2011.

NBB WORKING PAPER No. 239 - DECEMBER 2012 34
213. "Development of a financial health indicator based on companies' annual accounts", by D. Vivet, Document series, April 2011.
214. "Wage structure effects of international trade: Evidence from a small open economy", by Ph. Du Caju, F. Rycx and I. Tojerow, Research series, April 2011.
215. "Economic importance of the Belgian ports: Flemish maritime ports, Liège port complex and the port of Brussels - Report 2009", by C. Mathys, Document series, June 2011.
216. "Verti-zontal differentiation in monopolistic competition", by F. Di Comite, J.-F. Thisse and H. Vandenbussche, Research series, October 2011.
217. "The evolution of Alexandre Lamfalussy's thought on the international and European monetary system (1961-1993)" by I. Maes, Research series, November 2011.
218. "Economic importance of air transport and airport activities in Belgium – Report 2009", by X. Deville and S. Vennix, Document series, December 2011.
219. "Comparative advantage, multi-product firms and trade liberalisation: An empirical test", by C. Fuss and L. Zhu, Research series, January 2012.
220. "Institutions and export dynamics", by L. Araujo, G. Mion and E. Ornelas, Research series, February 2012.
221. "Implementation of EU legislation on rail liberalisation in Belgium, France, Germany and the Netherlands", by X. Deville and F. Verduyn, Document series, March 2012.
222. "Tommaso Padoa-Schioppa and the origins of the euro", by I. Maes, Document series, March 2012. 223. "(Not so) easy come, (still) easy go? Footloose multinationals revisited", by P. Blanchard, E. Dhyne,
C. Fuss and C. Mathieu, Research series, March 2012. 224. "Asymmetric information in credit markets, bank leverage cycles and macroeconomic dynamics", by
A. Rannenberg, Research series, April 2012. 225. "Economic importance of the Belgian ports: Flemish maritime ports, Liège port complex and the port of
Brussels - Report 2010", by C. Mathys, Document series, July 2012. 226. "Dissecting the dynamics of the US trade balance in an estimated equilibrium model", by P. Jacob and
G. Peersman, Research series, August 2012. 227. "Regime switches in volatility and correlation of financial institutions", by K. Boudt, J. Daníelsson,
S.J. Koopman and A. Lucas, Research series, October 2012. 228. "Measuring and testing for the systemically important financial institutions", by C. Castro and S. Ferrari,
Research series, October 2012. 229. "Risk, uncertainty and monetary policy", by G. Bekaert, M. Hoerova and M. Lo Duca, Research series,
October 2012. 230. "Flights to safety", by L. Baele, G. Bekaert, K. Inghelbrecht and M. Wei, Research series, October 2012. 231. "Macroprudential policy, countercyclical bank capital buffers and credit supply: Evidence from the
Spanish dynamic provisioning experiments", by G. Jiménez, S. Ongena, J.-L. Peydró and J. Saurina, Research series, October 2012.
232. "Bank/sovereign risk spillovers in the European debt crisis", by V. De Bruyckere, M. Gerhardt, G. Schepens and R. Vander Vennet, Research series, October 2012.
233. "A macroeconomic framework for quantifying systemic risk", by Z. He and A. Krishnamurthy, Research series, October 2012.
234. "Fiscal policy, banks and the financial crisis", by R. Kollmann, M. Ratto, W. Roeger and J. in't Veld, Research series, October 2012.
235. "Endogenous risk in a DSGE model with capital-constrained financial intermediaries", by H. Dewachter and R. Wouters, Research series, October 2012.
236. "A macroeconomic model with a financial sector", by M.K. Brunnermeier and Y. Sannikov, Research series, October 2012.
237. "Services versus goods trade : Are they the same?", by A. Ariu, Research series, December 2012. 238. "Importers, exporters, and exchange rate disconnect", by M. Amiti, O. Itskhoki and J. Konings, Research
series, December 2012. 239. "Concording EU trade and production data over time", by I. Van Beveren, A.B. Bernard and
H. Vandenbussche, Research series, December 2012.