concrete box-girder bridges - transportation...
TRANSCRIPT

50
the one- and the two-dimensional analyses gave the same magnitude for the residual stress problem, but occurrence in the cross section differed. With the presence of unsymmetrical thermal boundary conditions, therefore, a one-dimensional approach (Figure 11) could be misleading with respect to a residual stress distribution.
Therefore, because of the multitude of possible thermal surface conditions, a simple analytical model is not feasible at this time. However, most design specifications account for the possible combinations of loading extremes by allowing a percentage increase (usually 33 1/3 percent) above the specified working stress limitation. Therefore, it should prove adequate to specify a 600 psi increase in the actual working stress, considering the percentage increase in the allowable working stress. Until more extensive work is performed, such a s i mplified approach seems prudent.
REFERENCES
1. M.J .N. Priestley. Thermal Gradients in Bridges: Some Design Considerations, New Zealand Engineering, Vol. 27, No, 7, July 1972, pp. 228-233.
2. W.J. Price, Introductory Note, Bridge Temperatures. TRRL Report SR442. Transport and Road Research Laboratory, Crowthorne, Berkshire, England, 1978.
3, P.C. Hoffman, R.M. McClure, and H.H. west. Temperature Studies for an Experimental Segmental Bridge. Research Project 75-3, Report PTI 8010. Pennsylvania Transportation Institute, Pennsylvania State University, University Park, 1980.
Transportation Research Record 982
4. P .c. Hoffman . Thermal Design Considerations for an Experimental Prestressed Segmental Box Girder. Ph.D. dissertation. Pennsylvania State University, University Park, 1982.
5. R.M. McClure and H.H. West. Field Testing of an Experimental Segmental Bridge. Research Project No, 75-3, Report PTI 8009. Pennsylvania Transportation Ino;tltut.,, Pennsylvania State University, University Park, 1980.
6. M,J,N, Priestley and I.G. Buckle. Ambient Thermal Respono;e uf ConcreLe Bridges, Bulletin 42. Roads Research Unit, National Roads Board, New Zealand, 1979, pp. 26-27.
7. P.C. Hoffman, R.M. McClure, and H.H. West. Temperature: A Service Design Problem. Proc., National Bridge Conference, Pittsburgh, Pa., June 1983.
This study covers only a portion of a major 6-yea r investigation of an exper imental segme ntal br idy e that was conducted at The Pennsylvania Transportation Institute of The Pennsylvania State University. Th i s study was sponsored and fu nded by the Pennsylva nia Depar tment of Transporta t i o n and the FHWA. The contents of this paper reflect the views of the authors, who are responsible for the facts and the accuracy of the data. The contents do not necessarily reflect the official views or policies of the sponsors.
Publication of this paper sponsored by Committee on Concrete Bridges.
Seasonal and Diurnal Behavior of Concrete Box-Girder Bridges K. NAM SHIU
ABSTRACT
Measurements from three instrumented bridges in different parts of the United States were used to assess seasonal and diurnal behavior of concrete box-girder bridges. Effective bridge temperatures were used to evaluate seasonal thermal changes in bridges. Effective bridge temperature is defined as the temperature that governs longitudinal bridge movements. The effective bridge temperatures followed the same seasonal fluctuation as monthly average air temperature at the bridge site. Measured temperature differentials from top to bottom slabs for the three box-girder bridges were between +20°F and -10°F (+ll.1°C and -5.6°C) regardless of
geographic location. Temperature differentials were calculated by subtracting temperatures of the bottom slab from those of the top slab. Diurnal behavior of one bridge was continuously monitored for 24 hours during each of the four seasons. Longitudinal strains and temperatures were used to evaluate effects of nonlinear temperature gradient on bridge behavior. Internal thermal stresses at the instrumented bridge sections are reported,
Most materials expand with a rise in temperature and contract with a fall ~n temperature. In the past designers have assumed that structures respond lin-

Nam Shiu
early to temperature changes. Recent measurements on box-girder bridges (l-5) indicate that thermal response of structures- is highly nonlinear and complex. Therefore, design provisions for thermal effects based on assumed linear behavior may be misleading.
Overseas researchers have conducted extensive investigations on thermal behavior of bridges (1,3-5). As a result, thermal provisions based on no~lin;ar behavior have been i ncorporated into design codes in Great Britain and New Zealand. However, no similar provisions exist in the AASHTO specifications (6).
Although no major structural distress ha;- been attributed to temperature alone, temperature effects have contributed to structural distress reported in recent years (}_,_?.) • As more and more bridges are built with longer spans and complex sections, thermal response of bridges becomes an increasingly important factor to consider in design.
THERMAL BEHAVIOR OF CONCRETE BRIDGES
The thermal response of bridges is discussed in terms of two deformation categories: (a) overall longitudinal movements and (b) temperature-induced curvatures.
overall Longitudinai Movements
Bridges respond primarily in the longitudinal direction to gradual seasonal temperature variations. Overall longitudinal expansion of a simply supported beam is shown in Figures la and lb. With a gradual temperature rise, the beam expands uniformly in the longitudinal direction by t>L. The temperature distribution causing this thermal movement is a uniform temperature distribution, l>T, across the bridge section, as shown in Figure lb.
If longitudinal movement of the beam is fully restrained, internal stresses will be induced in the beam and no thermal strains will occur. If partial
l l L
a) Simply Sup~orted B ea~
-46~ l:IT 1..-----------Til = D b) Overall Longitudinal Move menLH
.:r~---------------=~~1 v
Depth
of Section
c) Temperature Indt1ced Cur va tt1re
Effective Curvoture
n ) Restraint The rmal Stres s es
FIGURE 1 Thermal behavior of a simply supported beam.
51
longitudinal restraint is provided, a combination of thermal strains and thermal stresses will occur.
Temperature-I nduc ed Cu rvat ure
In addition to seasonal temperature variations, bridges experience daily temperature variations. As the sun shines on a bridge, the deck heats up. The deck generally responds much faster than the rest of the bridge section. Consequently, temperature gradients exist between the top and the bottom of the bridge superstructure. In the case of a simply supported beam, the beam cambers as shown in Figure le. It is generally assumed that the temperature distribution effecting such thermal movement is a linear gradient across the beam section.
However, actual temperature distributions across bridge s ect ions are nonlinear <l-.~.l· Investigat ions (_!,_ll have shown that t empera ture distribution can be more realistically represented by a fifth-order parabola.
For a given nonlinear temperature gradient, the bridge deforms to attain an effective curvature. Because plane sections are assumed to remain plane according to beam theory, the resulting strain has to vary linearly across the bridge section. However, concrete tends to expand or contract according to the coefficient of thermal expansion; consequently, internal restraint stresses are induced, as shown in Figure ld. Restraint stresses occur in all sections with nonlinear temperature distributions. Some researchers (2,3) have indicated that restraint stresses can be- substantial.
FIELD MEASUREMENTS
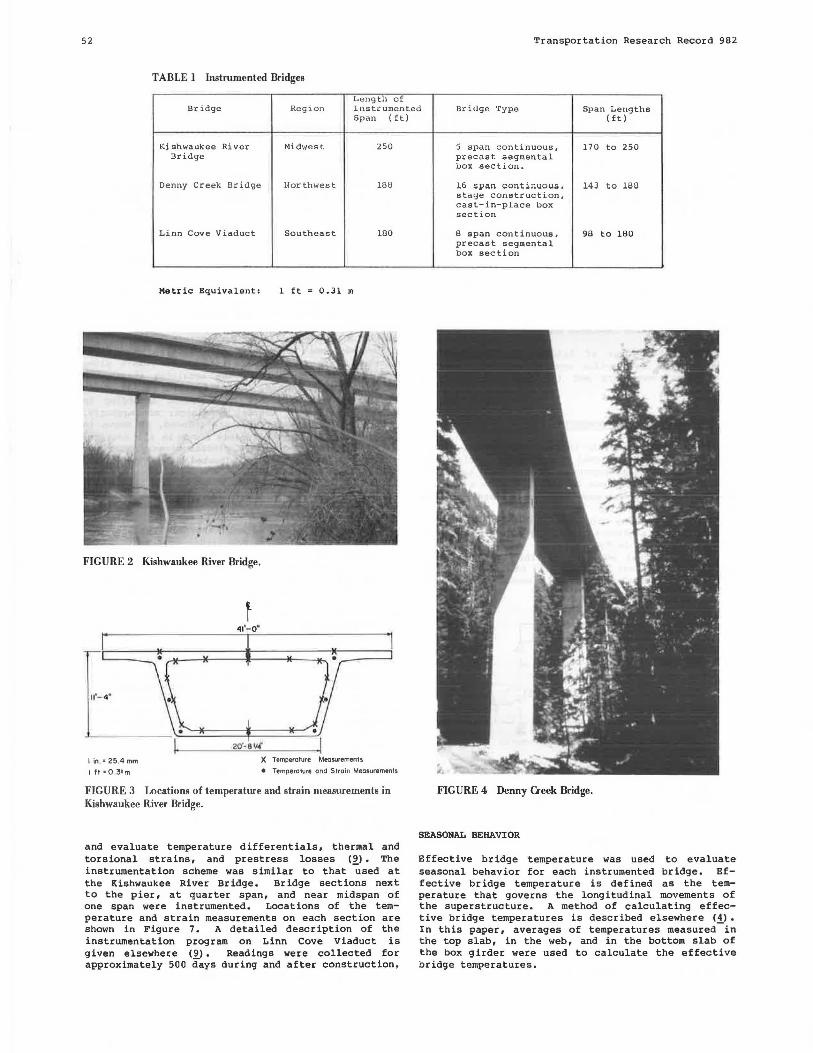
To understand the actual thermal behavior of bridges, three long-span box-girder bridges were instrumented during construction by the Construction Technology Laboratories. They are Kishwaukee River Bridge Ill in Illinois, Denny Creek Bridge (_!!) in Washington, and Linn Cove Viaduct (~) in North Carolina. A summary of the characteristics of the three bridges is given in Table 1.
Kishwaukee River Bridge, shown in Figure 2, was instrumented to investigate time-dependent behavior of segmental box-girder bridges. Three sections of a selected span were instrumented. The sections were located next to the pier, at quarter span, and near midspan. Measurements included longitudinal concrete strains, air and concrete temperatures, and deflections. Locations of temperature and strain measurements at a section are shown in Figure 3. Detailed description of the instrumentation program is given elsewhere <2>· Readings were taken seasonally for a period of 5 years. In addition, four sets of 24-hour continuous readings on the bridge were taken to monitor diurnal bridge behavior in different seasons.
Denny Creek Bridge, shown in Figure 4, was instrumented to determine time-dependent behavior of a cast-in-place, stage-constructed, box-girder bridge. The instrumentation layout was similar to that used in the Kishwaukee River Bridge. Bridge sections located next to the pier, at quarter span, and near midspan were instrumented. Details of the instrumented span are reported elsewhere (!!_) • Locations of the temperature and strain measurements on each section are shown in Figure 5. Readings were taken periodically during 2 years.
Linn Cove Viaduct in North Carolina is a con-tinuous, precast, box-girder bridge with a highly unusual geometric configuration as shown in Figure 6. The objective of instrumentation was to measure
52 Transportation Research Record 982
TABLE I Instrumented Bridges
Length of Bridge Region Ins tr urnen ted Bri<lge Type Span Leng t h s
Ki shwaukce Ri ve r Bri<lge
Denny Creek Bri<l9e
Linn Cove Viaduct
Metric Equivalent:
FIGURE 2 Kishwaukee River Bridge.
11'- 4"
I in • 25 .4 mm I II• 0 31 m
Span (ft)
Midwest 250
Northwest 188
Southeast 180
l ft 0.31 m
X Temperature Measurements
• Temperature and Strain Measurements
FIGURE 3 Locations of temperature and strain measurements in Kishwaukee River Bridge.
and evaluate temperature differentials, thermal and torsional strains, and prestress losses (2_) • The instrumentation scheme was similar to that used at the Kishwaukee River Bridge. Bridge sections next to the pier, at quarter span, and near midspan of one span were instrumented. Locations of the temperature and strain measurements on each section are shown in Figure 7. A detailed description of the instrumentation program on Linn Cove Viaduct is given elsewhere (9). Readings were collected for approximately 500 days during and after construction,
(ft)
5 span continuous, 170 to 250 precas t segmental box section.
16 span continuous, 143 to 188 stage construction, cast-in-place box section
8 span continuous, 90 to 180 precast segmental box section
FIGURE 4 Denny Creek Bridge.
SEASONAL BEHAVIOR
Effective bridge temperature was used to evaluate seasonal behavior for each instrumented bridge. Effective bridge temperature is defined as the temperature that governs the longitudinal movements of the superstructure. A method of calculating effective bridge temperatures is described elsewhere <!l. In this paper, averages of temperatures measured in the top slab, in the web, and in the bottom slab of the box girder were used to calculate the effective bridge temperatures.

Nam Shiu
52'- 0 "
- ·il::::::::===· ~w::::=I===:• ~==u==:====::ii·· .._9·_-_o_· _______ • \_·\: ; jj X Temperature Measurements I 16'-0'"
• Tempera1ure and Strain Measurements
FIGURE 5 Locations of temperature and strain measurements in Denny Creek Bridge.
FIGURE 6 Linn Cove Viaduct.
I in "' 25 4 mm I ft •031 m
A comparison of the calculated effective bridge temperatures of the Kishwaukee River Bridge and the monthly average air temperature near the bridge site (10) is shown in Figure B. Monthly average air temperatures are based on temperature records since 1945. The effective bridge temperature follows the monthly average air temperature fluctuation. Overall
I In. • 25.4 nm I It • 0.31 m
4-37 '- 6 "
18'-o" X Temperature Measurements
• Temperature and Strain Mta1urtm1nt1
91-0
FIGURE 7 Locations of temperature and atrain measurements in Linn Cove Viaduct.
100
80
60
40
20
0
80
Temperature 1
"F 60
40
20
0
80
60
40
20
0 0
Near Midspan
500
• Effective BridQe Temperature --Monthly Av Air Temperature
1000 1500 2000
Time , days
FIG RE 8 Comparison of effective bridge temperature of Kishwaukee River Bridge wilh monthly av rage air temperature near bridge site.
53
longitudinal movements of the Kishwaukee River Bridge are proportional to var iations in monthly average air temperature near the bridge site.
A s imilar observation was made for the Denny Creek Bridge in Washington as shown in Figure 9. No comparison was per£ormed for the Linn Cove Viaduct
IOO
80
60
40
20
0
80
Temperature,
"F 60
40
20
0
80
60
40
20
0 0
Near Midepan
At Quarter Span
Next to Pier
• Effective Bridge r.._.,ture -Monthly Av. Air TemporallW•
500 1000
Time , days
1500
FIGURE 9 omparieon of effective bridge tempera.ture of Denny Creek Bridge with monthly nvcrnge air temperature near bridge site.

54
because the collected data were very limited. At Linn Cove readings were taken over a period of l year with collected data points clustered in two seasons only. Consequently, comparison of effective bridge temperatures with monthly air temperatures can be misleading.
On the basis of these comparisons, it is concluded that longitudinal thermal movements of concrete box-girder bridges can be estimated by using the average air temperature at the bridge site.
The ranges of temperature specified in the AASHTO specifications (6) for designing concrete str.uctures are a temperature rise of 30°F (17°C) and a temperature fall of 40°F (22°C) in moderate climates, and a temperature rise of 35°F (19°C) and a temperature fall of 45°F ( 25°C) in cold climates. However, if the average monthly air temperature (10) were used, Kishwaukee River Bridge would have to accommodate a temperature rise of 32°F (18°C) and a temperature fall of 32°F (18°C) relative to the annual mean temperature at the bridge site. For the Denny Creek Bridge, the temperature range would only be a temperature rise of 24°F (13°C) and a temperature fall of l8°F (10°C). It is therefore suggested that monthly average air temperature at bridge sites may be used as a guide for determining the overall longitudinal be.havior of bridges as an alternative to the ranges given in the AASHTO specifications (§).
Variation of measured differentials between the temperature of the top and of the bottom slabs of the three instrumented bridges with time is plotted in Figure 10. Temperature differentials were calculated by subtracting temperatures of the bottom
30
20 .. "' 10 I a, II>
T-roturo i'
Olffertntlol, 15' •F 1000 0 1500 2000
Time1 Da~s
· 20
• 30 il) Kishwaukee !1.iver Brid'Je
30
20
Temperature Dltf•rentlol, e "F 500 1000 .
Time, Days
·20
-30 b) Denny Creek Bridge
30
20
10
Temperature .. Olfferenllal, 0
"F 500 1000
-10 Time, Days
-20
1°F:1~e 0c
-30 c) Linn ~ave Viu(luct
FIGURE 10 Variation of temperature differentials between top slab and bottom slab with time.
Transportation Research Record 982
slab from those of the top slab. As shown in Figure 10, temperature differentials for the three bridges were within the range of +20°F and -10°F (+ll°C and -6°C) regardless of their geographic location. This implies that concrete temperature differentials in box girders are independent of air temperature variations due to change in geogra1,1hk location. However, it is noted that the observation was based on a limited data sample. More data are needed to confirm this observation. Further investigationo on temperature differentials of box girders are recommended.
DIURNAL BEHAVIOR
Four sets of 24-hour measurements were made on Kishwaukee River Bridge. Measurements included air temperature inside and outside the box girder, concrete temperature, and longitudinal concrete strains. Daily variations in the measured air temperatures for four seasons are shown in Figure 11. Air temperature outside the box girder fluctuated more than air temperature inside.
100
75
50
Air
Temperalure , 25
"F 0
75
50
25
0
Summer
~
Winter
~
o--o Outside Box
_.....lft1idt BoJt Fall
...
... ~
Spring
~ I
Noon Midnight
Noon Noon MidriQht
Noon
t0 F • I 8 '•c + 32
FIGURE 11 Daily variation of air temperntures in8id and out eide the box girder for four scasonl! al the Ki hwaukee River Bridge.
Temperature distributions in the top and in the bottom slabs of the segment next to the pier in the summer and winter of 1979 are plotted in Figure 12. Values shown at the bottom of the slab are the ambient air temperature. Because of the delayed response of concrete to outside air temperature, temperature distributions across the box section were nonlinear.
Longitudinal strains and temperatures measured during the 24-hour periods were used to evaluate effects of diurnal temperature changes on bridge behavior. Two procedures were used to adjust measured strains for thermal expansion or contraction of both concrete and strain gauges to a standard temperature Of 73°F (23°C) ,
In the first procedure, concrete and strain gauges were assumed to expand or contract proportionally to their respective coefficient of thermal expansion. This simple procedure assumes unrestrained movement of concrete and strain gauges.
In the second procedure, effects of nonlinear temperature gradient were included. The followinq steps were used to adjust strain readings to the standard temperature of 73°F (23°C) :

Nam Shiu
11 1 -4 11 Air Cell I
4 •15 pm
(a) Summer
86°F 92°F
80°F
77°F
76°F
of 1979
23°F
20°F
18°F
66°F ,_....._ _ _ J'5°F
73°F
73°F
76°F
5 •00 am
18°F
21 °F
11 '-4 • I Air Cell
t0 F = 1.6 t0 c+ 32
I in.•25.4 mm
I ft •0.31 m
6•10 pm 6•00 am
(l>) '.·linter of l97g
FIGURE 12 Temperature distribution in the top and bottom slabs of the segment next to the pier for the Kishwaukee River Bridge.
1. Measured temperature data were fitted to a fifth-order parabola to determine temperature distr ibution across the box girder:
2. Curvature of the section resulting from the calculated parabolic temperature distribution was calculated:
3. From the computed curvature, an equivalent linear temperature distribution to cause the same curvature was determined;
4. Using the equivalent temperature distribution, effective temperatures at the location of the strain gauges were calculated: and
5. Because effective temperatures corresponded to thermal movements across the section, strain readings were adjusted from the calculated effective temperatures to 73°F (23°C).
Comparisons of strains calculated according to the two temperature correction procedures are shown in Figures 13 and 14. Dotted lines in the figures represent reduced strain data using the first temperature correction procedure. Solid lines represent reduced strain data using the second temperature correction procedure. Figure 13 shows daily variation of strains measured in the top slab and Figure 14 represents daily variation of strains measured in the web of the box girder. The difference
Compressive
Strain,
millionths
· · •· · · First Temperature Correction Procedure
-- Second Temperature Correction Procedure 550 ..--------------.,------------.
525 -
500
475
525
500
Noon
Summer
Winter
M1d
niQhl
Foll
-~·
Noon Noon
Spring
I
Mid
night
Noon
FIGURE 13 Comparison of the daily strain variation in the top slab of the Kishwaukee River Bridge.
Compressive
Strain, millionths
675 ....
650 >-;
•• · • •• First Temperature Correction Procedure
-- Second Temperature Correction Procedure
Summer Foll
.... ~
....
62: ~ 0 ..... . ·•
675
650
625
a~ .. Neon
Winter
Mid
nioht
Noon Noon
Spring
~ ..... ·
Mid
night
Noon
FIGURE 14 Comparison of the daily strain variation in the web of the Kishwaukee River Bridge.
55
between strains obtained from the two temperature correction procedures is the restraint thermal strain corresponding to the induced thermal stress.
When the modified compressive strains at each location were less than the strains calculated with the assumption of free expansion and contraction, tension restraint stresses were induced. Likewise, when the modified compressive strains were larger than the strains calculated using the free thermal movement assumption, compressive stresses were induced in the section.
In Figures 13 and 14, maximum restraint strains ranged from 20 millionths in compression to 20 millionths in tension. Measured concrete modulus of elasticity was between 4,190 ksi (28.9 GPa) and 4,760 ksi (32.8 GPa). For simplicity, a modulus of 5,000 ksi (34.5 GPa) was used to calculate the equivalent restraint stresses. Calculated restraint stresses ranged from 100 psi (689 kPa) in tension to 100 psi (689 kPa) in compression. The restraint stress range is based on a limited number of field measurements. Therefore, reported stress range should not be treated as the range of maximum anticipated restraint stress levels.
The calculated restraint stresses of 100 psi (689

56
kPa) in magnitude is substantially less than stresses predicted from the modified New Zealand temperature distribution. Restraint stresses calculated for the Pennsylvania box-girder bridge (~)
using the modified New Zealand temperature distribution (1,3) were reported to range from 488 psi (3362 kPa) in tension to 577 poi (3976 kPa) in compression.
In addition, restraint stresses were quite transient. Internal restraint stresses increase and decrease within hours. Although reQtraint stresses are present only for a short time, some consideration should be given to these stresses in design.
CONCLUSIONS
On the basis of the preceding discussion, the following conclusions are drawn:
1. Annual variation in the effective bridge temperature was found to be quite similar to the variation in monthly average air temperature at the bridge site.
2. Measured temperature differentials between the top and the bottom slabs of three box-girder bridges ranged between +20°F and -10°F (+11°C and -6°C). Measured temperature differentials seem to be independent of geographic location. Further investigations of temperature differentials in box girders are needed.
3. For the Kishwaukee River Bridge, internal restraint stresses from nonlinear temperature distribution varied between 100 psi (689 kPa) in tension to 100 psi (689 kPa) in compression. The calculated restraint stresses were substantially less than stresses computed using the temperature provision of the New Zealand Code (~).
4. Internal restraint stresses were transient in nature.
ACKNOWLEDGMENT
Data used in this paper were obtained from three investigations conducted by the Structural Experimental Section of the Construction Technology Laboratories, a division of Portland Cement Association, under the direction of D.M. Schultz, Manager, H.G. Russell, Director, and W.G. Corley, Divisional Director. Sponsors of the investigations were the Illinois Department of Transportation, the Washington State Department of Transportation, and the FHWA.
Transportation Research Record 982
REFERENCES
1. A. Churchward and Y. Sokal. Prediction of Temperatures in Concrete Bridges. Journal of the Structural Division of ASCE, Vol. 107, No. STll, Nov. 1981, pp. 2163-2175.
2. P.C. Hoffman, R,M, McClure, and H.H. West. Temperature Study of an Experimental Segmental Concrete Bridge. Journal of Prestressed Concrete Institute, Vol. 28, No. 2, March-April 1983, pp. 79-97.
3. M.J.N. Priestley. Design of Concrete Bridges for Temperature Gradients. Journal of the American Concrete Institute, Vol. 75, No. 5, May 1978, pp. 209-217.
4. M. Emerson. Temperature Differences in Bridges: Basis of Design Requirements. TRRL Report LR765. Transport and Road Research Laboratory, Crowthorne, Berkshire, England, 1977.
5 . W.J. Price. Introductory Note. In Bridge Temperatures, TRRL Report SR442, Transport and Road Research Laboratory, Crowthorne, Berkshire, England, 1978.
6. Standard Specifications for Highway Bridges, 12th ed. American Association of State Highway and Transportation Officials, Washington, D.C., 1977 and Interim 1978.
7. K.N. Shiu, J.I. Daniel, and H.G. Russell. TimeDependent Behavior of Segmental Cantilever Concrete Bridges. Illinois Department of Transportation, Springfield1 Construction Technology Laboratories, Skokie, Ill., March 1983.
8. K.N. Shiu, J.D. Aristizabal-Ochoa, and H.G. Russell. Instrumentation of Denny Creek Bridge. Confidential Report. Washington State Department of Transportation, Olympiai Construction Technology Laboratories, Skokie, Ill., Aug. 1981.
9. K.N. Shiu and H.G. Russell. Instrumentation of Linn Cove Viaduct. Confidential Interim Report to Teng and Associates, Inc. Construction Technology Laboratories, Skokie, Ill., May 1981.
10. Weather of U.S. Cities, Vols. 1 and 2. Gale Research Company, Detroit, Mich., 1982.
Any opinions, findings, and conclusions expressed herein are those of the author and do not necessarily reflect official views of the sponsors. This report does not constitute a standard, specification, or regulation.
Publication of this paper sponsored by Committee on Concrete Bridges.