concrete mixture designs for o’hare modernization plan chicago o’hare january 12, 2006...
TRANSCRIPT

Concrete Mixture Designs for Concrete Mixture Designs for O’Hare Modernization PlanO’Hare Modernization Plan
Chicago O’Hare
January 12, 2006
University of Illinois (Urbana-Champaign)
Department of Civil and Environmental Engineering

Project GoalProject Goal
Investigate cost-effective concrete properties and pavement design features required to achieve long-term rigid pavement performance at Chicago O’Hare International.

Project TeamProject Team
Principal InvestigatorsProf. Jeff RoeslerProf. David Lange
StudentsCristian GaedickeSal VillalobosZach GrasleyRob Rodden

Project ObjectivesProject ObjectivesDevelop concrete material constituents and proportions for airfield concrete mixes
Strengthvolume stabilityfracture properties
Develop / improve models to predict concrete material behavior
Crack width and shrinkage
Evaluate material properties and structural design interactionsjoint type & joint spacing (curling and load transfer)Saw-cut timing

Project ObjectivesProject Objectives
Concrete properties
Long-term perfor-
mance at ORD
Material constituents and
mix design
Analysis of existing concrete mix designs
Laboratory tests
Optimal joint types and spacing.
ModelingTest for material properties

FY2005 AccomplishmentsFY2005 Accomplishments
Tech Notes (TN) - TN2: PCC Mix Design TN3: Fiber Reinforced Concrete for Airfield Rigid PavementsTN4: Feasibility of Shrinkage Reducing Admixtures for Concrete Runway PavementsTN11: Measurement of Water Content in Fresh Concrete Using the Microwave MethodTN12: Guiding Principles for the Optimization of the OMP PCC Mix DesignTN15: Evaluation, testing and comparison between crushed manufactured sand and natural sandTN16: Concrete Mix Design Specification EvaluationTN17: PCC Mix Design Phase 1
www.cee.uiuc.edu/research/ceat

TN2: PCC Mix DesignTN2: PCC Mix Design
Mix Id.Proposed Mix #1905
(2000)
Revised Mix #1905
(2000)
Mix #1933 (2000)
Proposed Mix #1994
(2000)
Mix K-5 003-
00(2004)Units
Water 280 262 280 262 258 lb/yd3Type I Cement 541 588 588 588 541 lb/yd3Type C Fly Ash 135 100 100 130 135 lb/yd3Coarse aggregate (# 57 Limestone, 1" max size. )
1850 1850 1850 1800 1840 lb/yd3
Fine aggregate 1125 1103 1115 1100 1117 lb/yd3Steel Fibers 0 0 0 85 0 lb/yd3Air entrainment admixture (Excel Air)
N/A 7 N/A N/A 6.8 oz/yd3
Water Reducer (Excel Redi Set)
29 15 28 29 30.4 oz/yd3
PropertiesProposed Mix #1905
Revised Mix #1905 Mix #1933
Proposed Mix #1904
Mix K-5 003-00
Units
W/CM 0.41 0.38 0.41 0.36 0.38 -fr7 N/A 788 802 N/A 770 psifr28 N/A 1030 842 N/A 855 psiAir 5-8 5-8 5-7 5-8 6.2 %Slump 2 3 +/- 1 3 +/- 1 3 +/- 1 1 in

Survey of Existing MixesSurvey of Existing Mixes
AirportCapital Airport
St. louis Lambert
St. louis Lambert
St. louis Lambert
St. louis Lambert
St. louis Lambert
St. louis Lambert
St. louis Lambert
St. louis Lambert
Fort Wayne
California
California
Mix Id. N/A Mix 1 F Mix 4 FMix 4 F
w/ fibers Mix 3 F Mix 5 F
Mix 5 F w/fibers
Mix 6 F Mix P 5 Mix 1 Mix 1 Mix 2
Water 233 250 258 258 248 258 258 258 250 218 300 258 lb/yd3Cement 490 510 535 535 354 310 310 372 680 288 489 479 lb/yd3
Type C Fly Ash 150 80 80 80 88 93 93 93 - 192 122 85 lb/yd3GGBS - - - - 148 217 217 155 - - - - lb/yd3
Coarse aggregate #1 1842 1866 1834 1834 1872 1808 1808 1836 1790 1424 1570 1400 lb/yd3Coarse aggregate #2 - - - - - - - - - 615 400 475 lb/yd3
Fine aggregate 1156 1225 1220 1220 1228 1232 1232 1206 1280 1198 1165 1310 lb/yd3Fibers - - - 3 - - 3 - - - - lb/yd3
Air entrainment admixture N/A 5.6 5.6 5.6 3 3.1 3.1 3.1 N/A N/A N/A 1.7 oz/yd3Water Reducer 19.6 14.2 14.2 14.2 17.7 18.6 18.6 18.6 N/A N/A N/A 16.92 oz/yd3
Materials PropertiesCement Type I I I I I I I I I I I IICoarse aggregate # 1 max. size. (in)
N/A 3/4" (#67) 3/4" (#67) 3/4" (#67) 3/4" (#67) 3/4" (#67) 3/4" (#67) 3/4" (#67) 3/4" (#67) 1" (57) 1" (57) 1" (57)
Coarse aggregate # 2 max. size. (in)
- - - - - - - - - 3/8" 3/8"1/2 x #4"
Fine aggregate type N/ARiver Sand
River Sand River SandRiver Sand
River Sand
River Sand
River Sand
River Sand
N/A,FM= 2.68
N/A,FM= 2.96
Sechelt Sand
AEA type AEA GracePolychen AE VRC
Polychen AE VRC
Polychen AE VRC
Polychen AE VRC
Polychen AE VRC
Polychen AE VRC
Polychen AE VRC
GRT AEA N/A N/A MBAE
WR typeDaracem Grace
Polychen MC 400
Polychen MC 400
Polychen MC 400
Polychen MC 400
Polychen MC 400
Polychen MC 400
Polychen MC 400
GRT KB 1000
N/A N/APozz 200N
Fiber type - - -GRT Polymesh fibers
- -GRT Polymesh fibers
- - - - -
Concrete Properties Units W/CM 0.36 0.42 0.42 0.42 0.42 0.42 0.42 0.42 0.37 0.45 0.49 0.46 -fr28 770 1033 850 905 700 675 675 675 1280 N/A N/A 767 psiAir 5.5 7.6 7 7 5 5 5 5 6 N/A N/A 3 %
Slump 4 1/2" 2" 3 3/4 " 3 3/4 " 1 1/4 " 3" 3" 3" 1 1/2" N/A N/A 3 1/4" in
Tech Note 3Tech Note 3
Fiber Reinforced Concrete for Airfield Rigid Pavements
0
25
50
75
100
125
150
175
200
225
0 1 2 3 4 5 6 7 8 9 10 11 12 13
Average Interior Maximum Surface Deflection (mm)
Lo
ad
(k
N)
Plain
0.48% Synthetic Macro Fiber
0.32% Synthetic Macro Fiber
Final cost: reduction of 6% to an increase of 11%
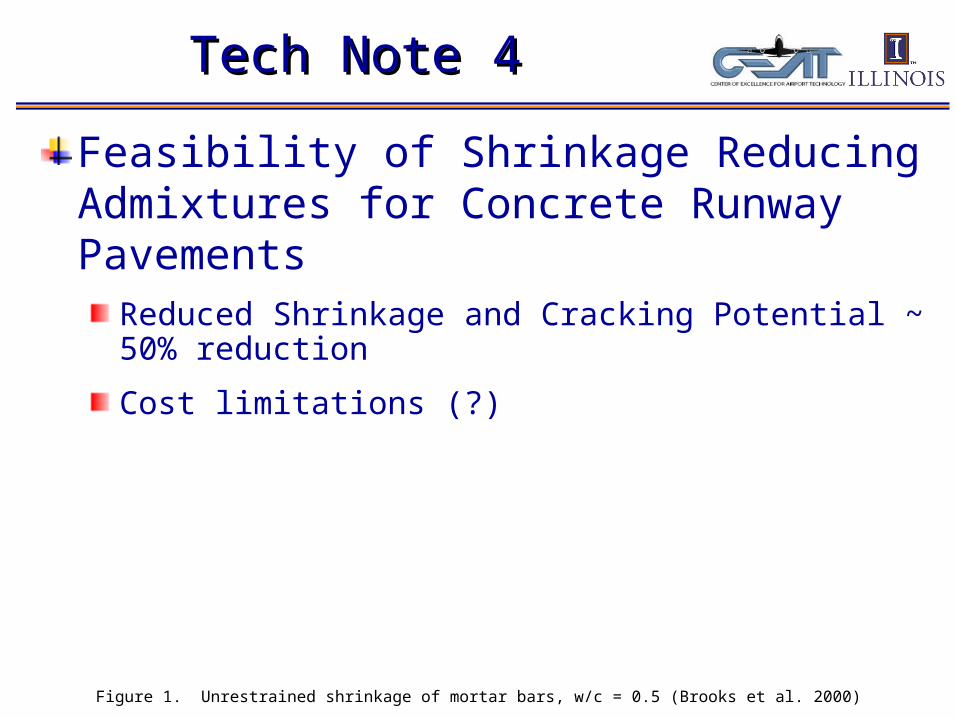
Tech Note 4Tech Note 4
Feasibility of Shrinkage Reducing Admixtures for Concrete Runway Pavements
Reduced Shrinkage and Cracking Potential ~ 50% reduction
Cost limitations (?)
Figure 1. Unrestrained shrinkage of mortar bars, w/c = 0.5 (Brooks et al. 2000)

Tech Note 11Tech Note 11
Measurement of Water Content in Fresh Concrete Using the Microwave Method
Strengths: quick, simple, and inexpensive
Limitations: need accurate information on cement content aggregate moisture and absorption capacity

TN 12: Guiding Principles for the TN 12: Guiding Principles for the Optimization of the OMP PCC Mix DesignOptimization of the OMP PCC Mix Design
1st order:Strength, workability
2nd Order:Shrinkage, fracture properties
LTE & strength gain
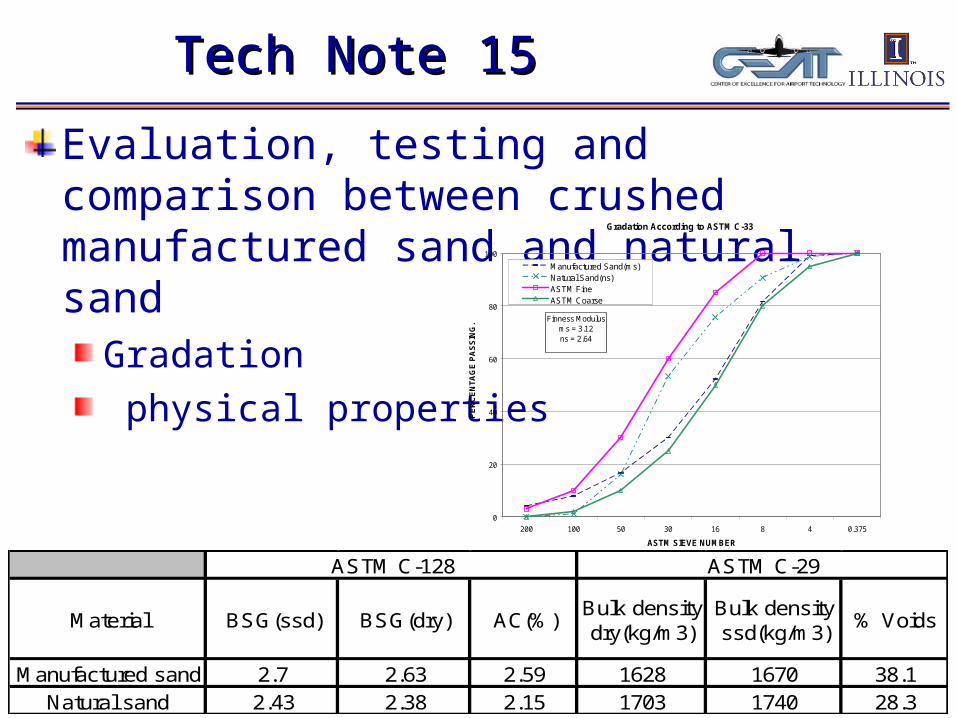
Tech Note 15Tech Note 15
Evaluation, testing and comparison between crushed manufactured sand and natural sand
Gradation
physical properties
Material BSG(ssd) BSG(dry) AC(%)Bulk density dry(kg/m3)
Bulk density ssd(kg/m3)
% Voids
Manufactured sand 2.7 2.63 2.59 1628 1670 38.1Natural sand 2.43 2.38 2.15 1703 1740 28.3
ASTM C-29ASTM C-128
Gradation According to ASTM C-33
0
20
40
60
80
100
200 100 50 30 16 8 4 0.375
ASTM SIEVE NUMBER
PE
RC
EN
TA
GE
PA
SS
ING
.
Manufactured Sand(ms)Natural Sand(ns)ASTM FineASTM Coarse
Finness Modulusms = 3.12ns = 2.64
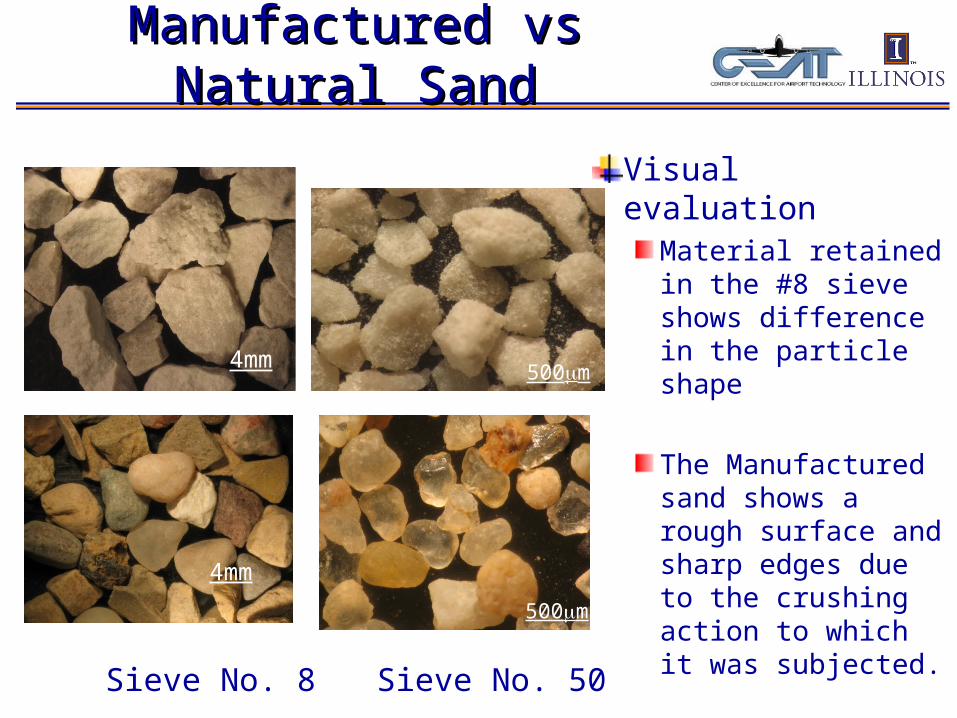
Manufactured vs Natural SandManufactured vs Natural Sand
Visual evaluationMaterial retained in the #8 sieve shows difference in the particle shape
The Manufactured sand shows a rough surface and sharp edges due to the crushing action to which it was subjected.
4mm
4mm
500m
500m
Sieve No. 50Sieve No. 8

Tech Note 16Tech Note 16
Concrete Mix Design Specification Evaluation
Preliminary P-501 evaluation
Strength, shrinkage, and material constituent contents
P-501 Guidelines Our View
max w/cm = 0.50 Ok
Min cement content = 500 lb/yd3 This could be lower min flexural strength = 600 psi @ 28 d 700 ok, could be 90 d
fly ash content range = 10-20% Ok fly ash + slag range = 25-55% Ok
max slag when temp < 55 F = 30% Ok air content = 5.5% for 1.5" topsize CA Ok air content = 6.0% for 0.75" topsize CA Ok
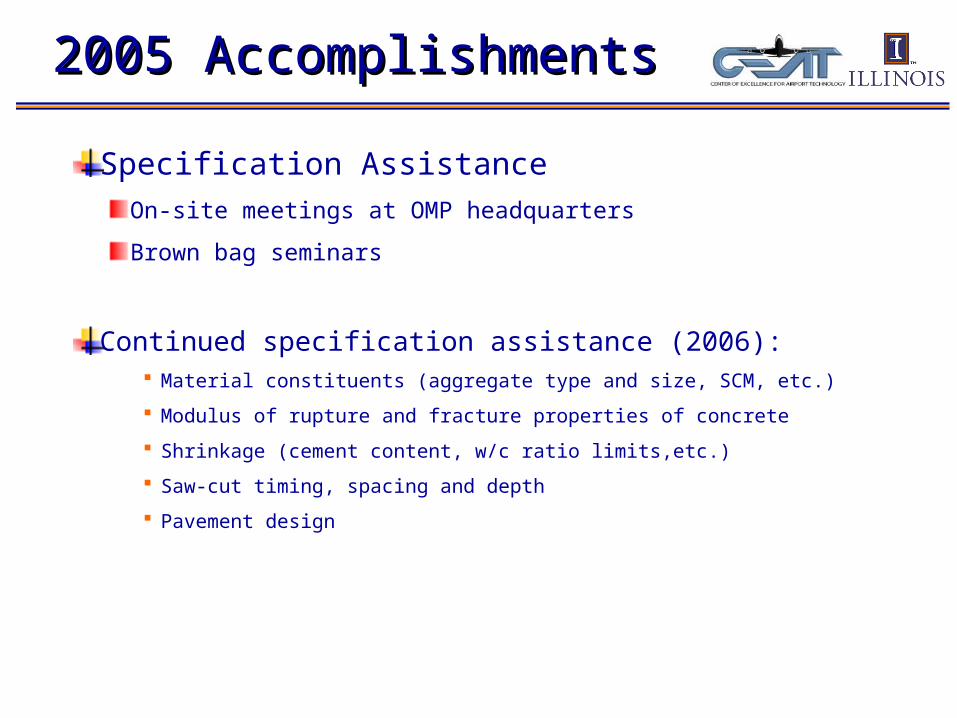
2005 Accomplishments2005 Accomplishments
Specification Assistance
On-site meetings at OMP headquarters
Brown bag seminars
Continued specification assistance (2006): Material constituents (aggregate type and size, SCM, etc.)
Modulus of rupture and fracture properties of concrete
Shrinkage (cement content, w/c ratio limits,etc.)
Saw-cut timing, spacing and depth
Pavement design

PCC Mix Evaluation – Phase IIPCC Mix Evaluation – Phase II
Effect of aggregate size (0.75” vs. 1.5”)
Effect of 1.5” coarse aggregate:Total cementitious content: 688 lb/yd3, 571 lb/yd3, 555 lb/yd3 and 535 lb/yd3
Water / cementitious ratio: 0.38 versus 0.44
Fly Ash / cementitious ratio: 14.5% versus 0%
Effect of coarse aggregate cleaniness

PCC Mix Evaluation – Phase IIPCC Mix Evaluation – Phase II
TestingFresh concrete properties
Slump, Air Content, Unit Weight
Mechanical Testing Compressive strength (fc) at 7 and 28 days Modulus of Elasticity (E) at 7 and 28 days Split tensile strength (fsp) at 7 and 28 days Modulus of Rupture (MOR) at 7 and 28 days
Volume Stability Testing Drying and Autogenous Shrinkage trends for 28+ days
Fracture tests Early-ages (<48 hrs) Mature age (28 days)

Mixture design nomenclatureMixture design nomenclature
9 mixes were prepared:
555.44 – 555.44 st – 688.38 – 688.38 st
AAA.BB **
Cementitious content (17%FA)
lbs/cy
w/cm**max aggregate size
st = 0.75”
Otherwise 1.5”

Phase II Mix Design ResultsPhase II Mix Design Results
ID
688.38 (1.5" CA) CLEAN
AGG
688.38 standard (3/4 " CA)
688.44 (1.5" CA)
688.38 (1.5" CA)
571.44 (1.5" CA)
571.38 (1.5" CA)
571.44 Nof (1.5" CA)
535.44 (1.5" CA)
555.44 (1.5" CA)
water (lb/yd3) 261 262 303 261 251 217 251 235 244cement (lb/yd3) 588 588 588 588 488 488 571 535 455fly ash (lb/yd3) 100 100 100 100 83 83 0 0 100
CA (lb/yd3) 1842 1850 1772 1842 1924 1982 1938 1984 1942FA (lb/yd3) 1083 1103 1042 1083 1132 1166 1140 1167 1142
AEA (oz/yd3) 19.4 12.7 19.4 19.4 16.1 16.1 16.1 15.1 15.6w/cm 0.38 0.38 0.44 0.38 0.44 0.38 0.44 0.44 0.44
CA/ FA 1.7 1.68 1.7 1.7 1.7 1.7 1.7 1.7 1.7cm 688 688 688 688 570.96 570.96 571 535 555w/c 0.44 0.45 0.51 0.44 0.51 0.44 0.44 0.44 0.54Fl\y Ash/ CM 0.15 0.15 0.15 0.15 0.15 0.15 0.00 0.00 0.18
Slump (in) 6.13 7.63 9.00 6.25 7.38 2.50 2.25 8.63 7.88Air (%) 7.0 6.5 6.0 8.0 2.9 7.3 6.5 2.9 3.7
Density (pcf) 143.8 145.1 141.8 141.8 150.4 143.9 146.2 150.9 150.2
fs7 (psi) 362 526 275 440 412 416 505 390 480
fs28 (psi) #¡DIV/0! 570 423 454 513 429 524 415 490
fc7 (psi) 3,393 4,045 3,267 3,241 3,608 3,369 3,329 2,338 3,327
fc28 (psi) #¡DIV/0! 4,217 4,131 3,785 4,344 3,744 5,366 3,369 4,212
Ec7 (psi) 3,236 3,476 4,177 4,031 3,879 4,224 3,326 3,426 3,692
Ec28 (psi) #¡DIV/0! 3,752 3,695 3,438 4,204 3,881 3,958 3,311 4,209 MOR28 (psi) #¡DIV/0! 802 668 639 688 651 794 619 663
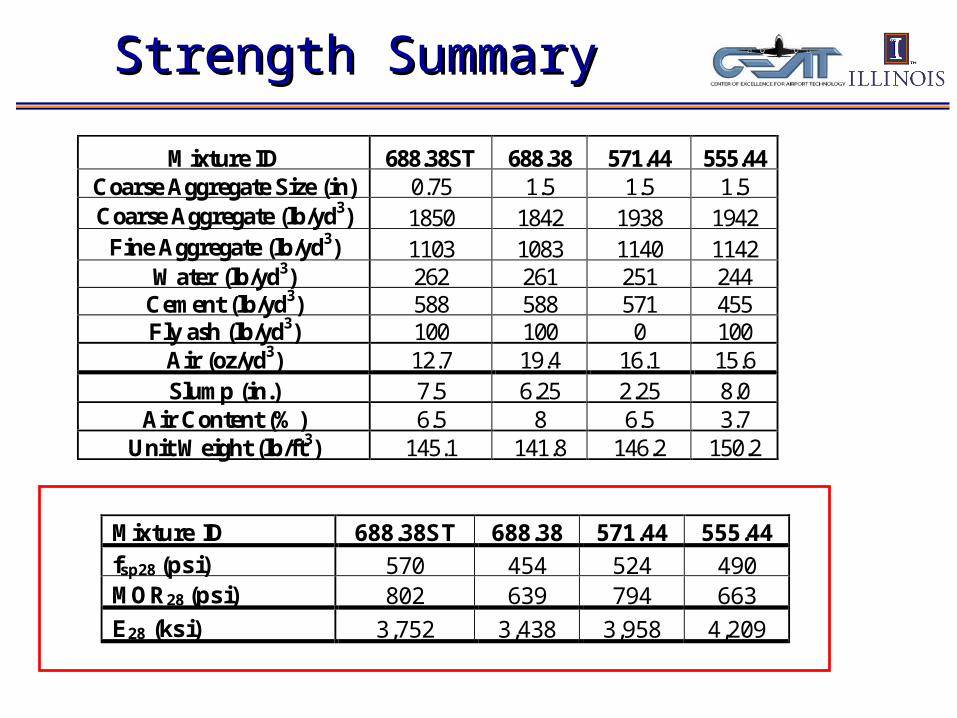
Strength SummaryStrength Summary
Mixture ID 688.38ST 688.38 571.44 555.44 fsp28 (psi) 570 454 524 490 MOR28 (psi) 802 639 794 663
E28 (ksi) 3,752 3,438 3,958 4,209
Mixture ID 688.38ST 688.38 571.44 555.44 Coarse Aggregate Size (in) 0.75 1.5 1.5 1.5 Coarse Aggregate (lb/yd3) 1850 1842 1938 1942
Fine Aggregate (lb/yd3) 1103 1083 1140 1142 Water (lb/yd3) 262 261 251 244
Cement (lb/yd3) 588 588 571 455 Fly ash (lb/yd3) 100 100 0 100
Air (oz/yd3) 12.7 19.4 16.1 15.6 Slump (in.) 7.5 6.25 2.25 8.0
Air Content (%) 6.5 8 6.5 3.7 Unit Weight (lb/ft3) 145.1 141.8 146.2 150.2

Shrinkage Results Phase IIShrinkage Results Phase II
Total and Autogenous shrinkageExperimental Shrinkage Data for all Mixes
-0.1
0
0.1
0.2
0.3
0.4
0.5
0.6
0 5 10 15 20 25
Age of Concrete (days)
Sh
rin
ka
ge
(m
m/m
)
688.38ST Total 688.44 Total 688.44 Autog. 688.38 Total
688.38 Autog. 571.44 Total 571.38 Total 571.38 Autog.
571.44 NF Total 535.44 Total 555.44 Total
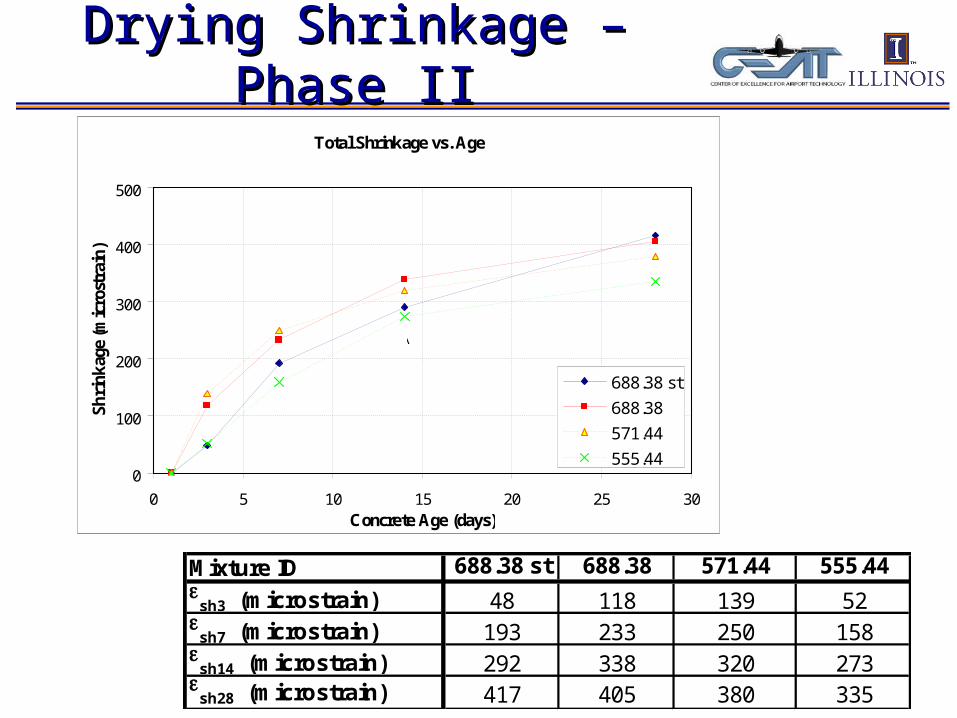
Drying Shrinkage – Phase IIDrying Shrinkage – Phase II
Total Shrinkage vs. Age
0
100
200
300
400
500
0 5 10 15 20 25 30Concrete Age (days)
Sh
rin
kag
e (m
icro
stra
in).
.
688.38 st
688.38
571.44
555.44
\
Mixture ID 688.38 st 688.38 571.44 555.44
sh3 (microstrain) 48 118 139 52
sh7 (microstrain) 193 233 250 158
sh14 (microstrain) 292 338 320 273
sh28 (microstrain) 417 405 380 335

Fracture Energy – Phase IIFracture Energy – Phase II
GF = cracking resistance of material
GF = joint surface roughness indicatorLoad vs Displacement
0
500
1000
1500
2000
2500
3000
3500
4000
0 0.1 0.2 0.3 0.4 0.5 0.6 0.7 0.8 0.9 1CMOD (mm)
Lo
ad
(N
)
PeakLoad
GF = Area under the Curve Cracking Area
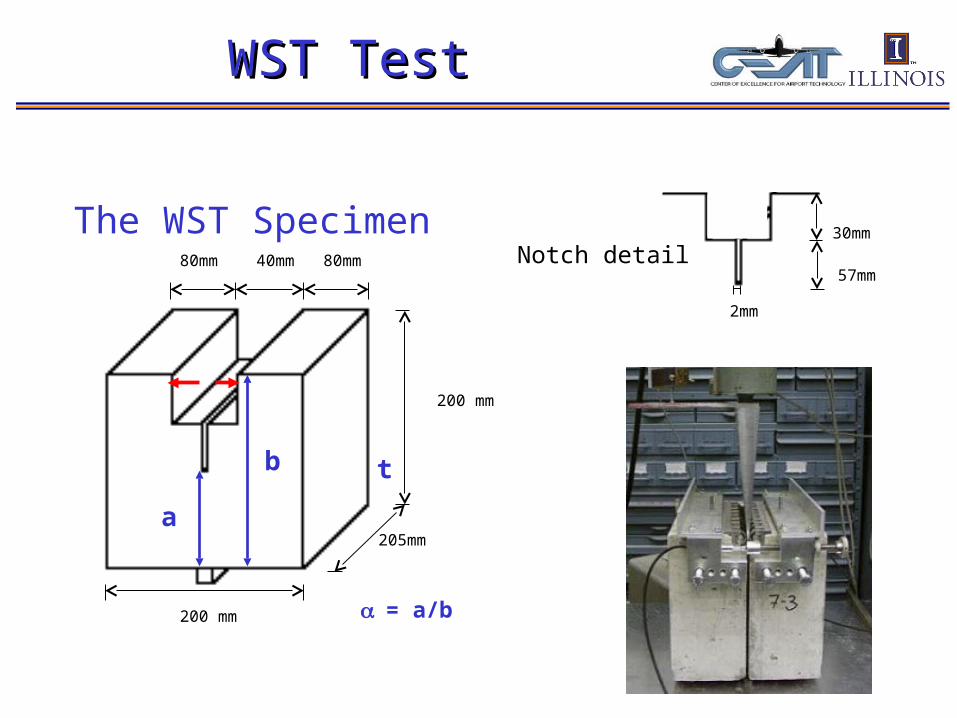
WST Test WST Test
30mm
57mm
2mm
Notch detail
200 mm
205mm
200 mm
80mm 40mm 80mm
The WST Specimen
a
b
= a/b
t

Testing Plan – 4 MixturesTesting Plan – 4 Mixtures
Wedge splitting specimens (7) 6, 8, 10, 12 and 24 hours
7 and 28 days
Cylinders for compression and split tensile strength for 1,7 and 28 days and E values for 7 and 28 days
MOR for 28 days
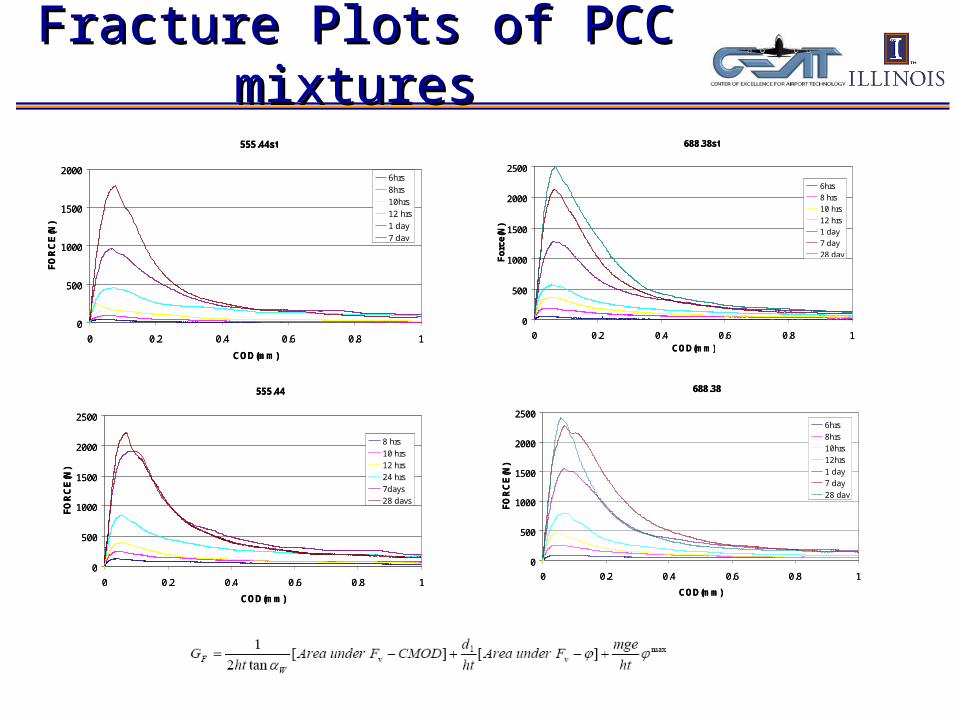
Fracture Plots of PCC mixturesFracture Plots of PCC mixtures
688.38st
0
500
1000
1500
2000
2500
0 0.2 0.4 0.6 0.8 1COD(mm)
Fo
rce(
N)
6hrs
8 hrs
10 hrs
12 hrs
1 day
7 day
28 day
688.38
0
500
1000
1500
2000
2500
0 0.2 0.4 0.6 0.8 1
COD(mm)
FO
RC
E(N
)
6hrs
8hrs
10hrs
12hrs
1 day
7 day
28 day
555.44
0
500
1000
1500
2000
2500
0 0.2 0.4 0.6 0.8 1
COD(mm)
FO
RC
E(N
)
8 hrs
10 hrs
12 hrs
24 hrs
7days
28 days
555.44st
0
500
1000
1500
2000
0 0.2 0.4 0.6 0.8 1
COD(mm)
FO
RC
E(N
)
6hrs
8hrs
10hrs
12 hrs
1 day
7 day

Fracture Energy Results-Phase IIFracture Energy Results-Phase II
Age = 28-days Load vs. CMOD curves for Wedge Splitting Samples
0
500
1000
1500
2000
2500
3000
0 0.5 1 1.5 2
CMOD(mm)
Fv
(N)
688.38st
688.38
555.44
Mixture ID 688.38 st 688.38 571.44 555.44
GF (Nm) 156 166 N/A 161

Concrete BrittlenessConcrete Brittleness
Characteristic Length2fsp
EGl Fch
Mixture ID 688.38ST 688.38 571.44 555.44 fsp28 (psi) 570 454 524 490 E28 (ksi) 3,752 3,438 3,958 4,209
GF (Nm) @ 28-day 156 166 N/A 161 lch (in) 10.3 15.8 N/A 16.1
Less brittle mixes w/ larger MSA
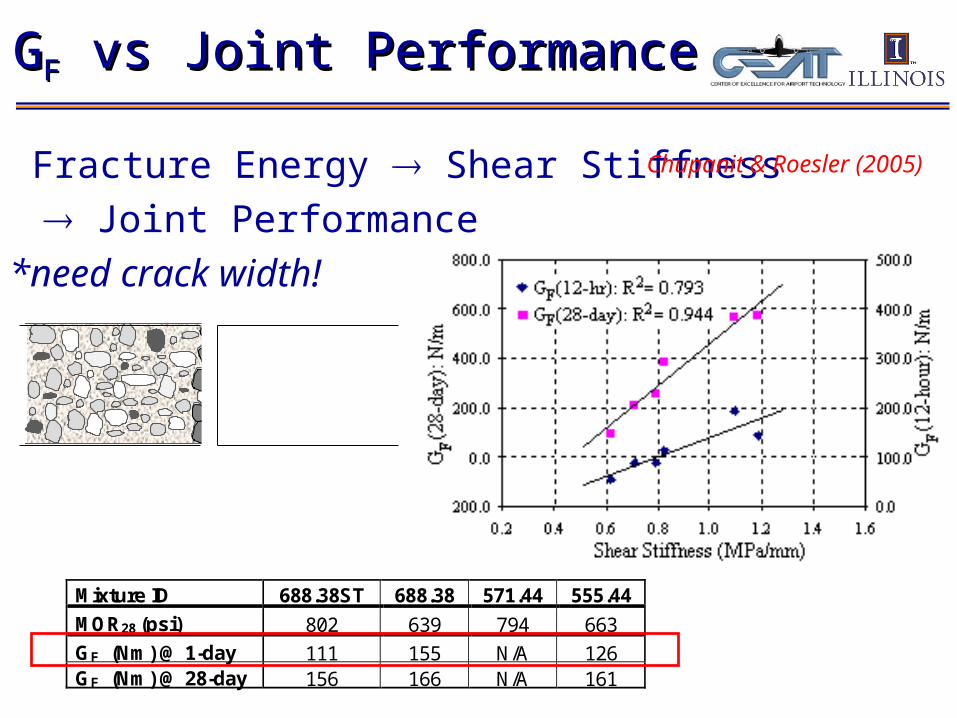
Fracture Energy Shear Stiffness
Joint Performance
*need crack width!
GGFF vs Joint Performance vs Joint Performance
Chupanit & Roesler (2005)
Mixture ID 688.38ST 688.38 571.44 555.44
MOR28 (psi) 802 639 794 663
GF (Nm) @ 1-day 111 155 N/A 126 GF (Nm) @ 28-day 156 166 N/A 161

PCC Mix Design – Phase IIPCC Mix Design – Phase II
Summary*Larger aggregates reduce strength by 20%
28-day GF similar similar cracking resistance
Larger aggregates reduce concrete brittleness
1-day fracture energy with larger MSA greater joint stiffness / performance
No significant shrinkage difference
TNXX – February 2006*Roesler, J., Gaedicke, C., Lange, Villalobos, S., Rodden, R., and Grasley, Z. (2006), “Mechanical Properties of Concrete Pavement Mixtures with Larger Size Coarse Aggregate,” accepted for publication in ASCE 2006 Airfield and Highway Pavement Conference, Atlanta, GA.

Saw-cut timing and depthSaw-cut timing and depth
Stress analysis of slab (temp & shrink)
Size Effect (fracture) Model
Concrete Material Fracture Parameters Wedge Splitting Test @ early ages
No method to obtain Critical Stress Intensity Factor (KIC) and Critical Crack Tip Opening Displacement (CTOCC) for WST
FEM MODEL FOR THE WST SPECIMEN
200 mm
205mm
200 mm
80mm 40mm 80mm
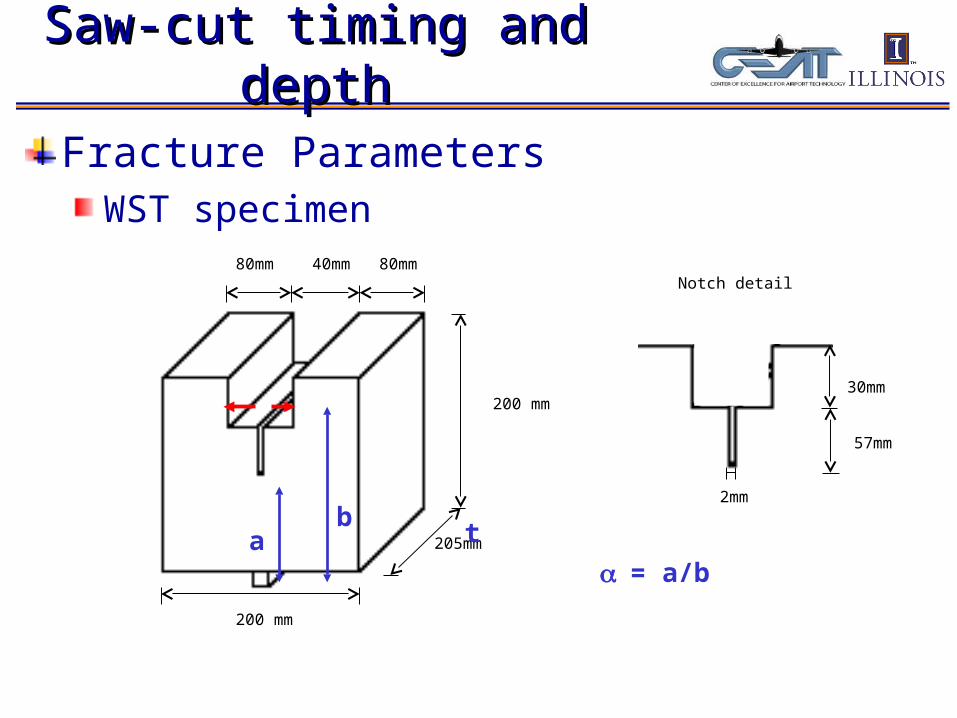
Saw-cut timing and depthSaw-cut timing and depth
Fracture Parameters WST specimen
30mm
57mm
2mm
Notch detail
ab
= a/b
t

Saw-cut timing and depthSaw-cut timing and depth
FEM Model Special Mesh around crack tip
Q8 elements
Symmetry and BC consi-derations
200
mm100 mm

Saw-cut timing and depthSaw-cut timing and depth
FEM Model Stress around crack tip
Calculation of KI
Quarter point nodes

FEM ANALISYSFEM ANALISYS
)(f *b*t
P K 11/2
smaxIC
)(f*E*t
PCMOD 2
sp
CMOD*)(fCTOD 3
Psmax = peak splitting load
KIC = critical SIF
CTODc= critical CTOD
CMODc= critical CMOD
f1() = geometrical factor 1
f2() = geometrical factor 2
f3() = geometrical factor 3
E = modulus of elasticity
Gf = initial fracture energy
E
KG IC
f
2
FEM MODELING OF THE WST
2*
32
IC
Cf K
ECTODc
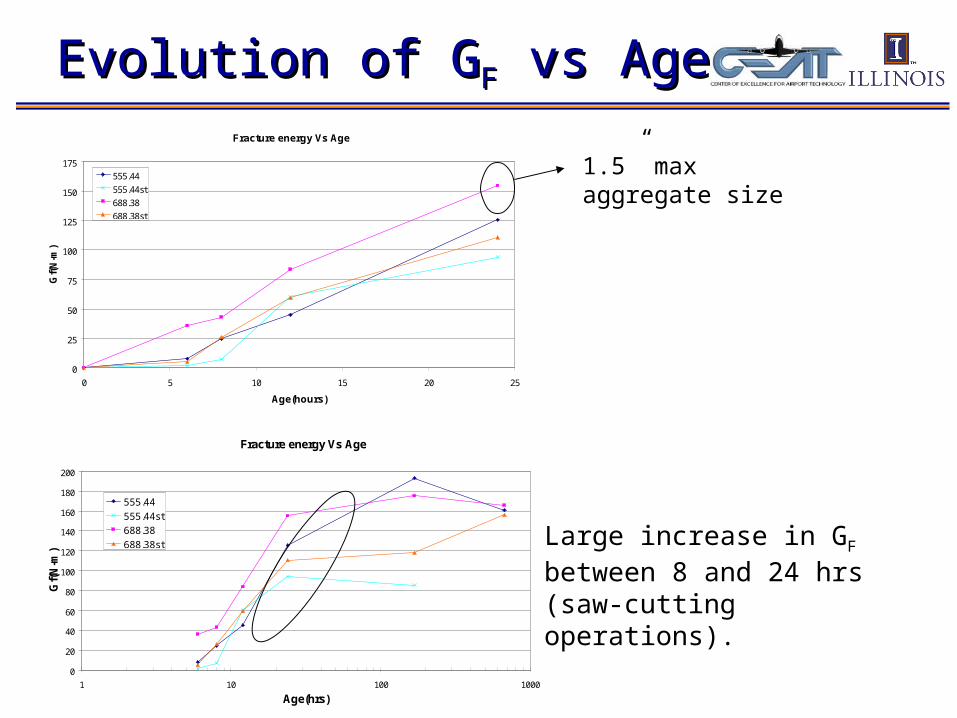
Evolution of GEvolution of GFF vs Age vs AgeFracture energy Vs Age
0
25
50
75
100
125
150
175
0 5 10 15 20 25
Age(hours)
Gf(
N-m
)
555.44
555.44st
688.38
688.38st
1.5” max aggregate size
Fracture energy Vs Age
0
20
40
60
80
100
120
140
160
180
200
1 10 100 1000
Age(hrs)
Gf(
N-m
)
555.44
555.44st
688.38
688.38st Large increase in GF between 8 and 24 hrs (saw-cutting operations).

Saw-Cut Timing ModelSaw-Cut Timing Model
Concrete E and fracture properties(cf ,KIC) at early ages.
Using Bazant’s Size Effect Model to analyze finite size slabs.
Develop curves of nominal strength vs notch depth for timing.
Nominal strength vs ao/d for the 300mm slab
0.00
0.20
0.40
0.60
0.80
1.00
1.20
0.000 0.100 0.200 0.300 0.400 0.500 0.600
ao/d
No
min
al s
tren
gth
ls@6hr
ls@12hr
rg@6hr
rg@12hr
•After Soares (1997)

Joint Type AnalysisJoint Type Analysis
How can we rationally choose dowel vs. aggregate interlock joint type & joint spacing?
Need to predict crack width & LTEShrinkage, zero-stress temperature, creep
Aggregate size and type (GF)
Slab length & base friction

Reduced aggregate interlock with Reduced aggregate interlock with small max. size CAsmall max. size CA
Crack width, w
Dowels deemed necessary
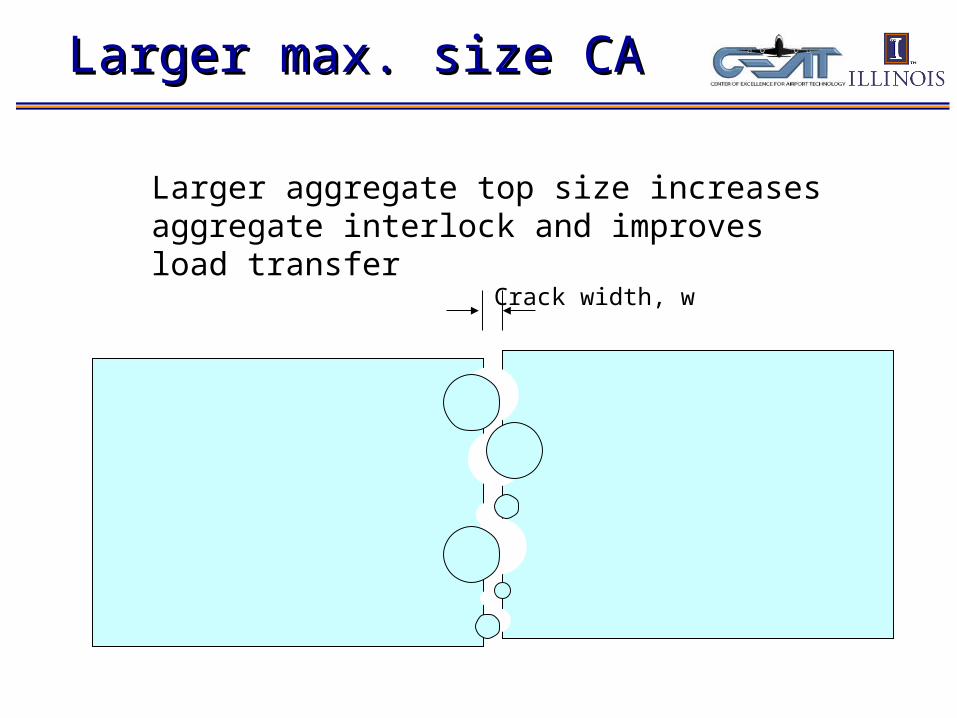
Larger max. size CALarger max. size CA
Larger aggregate top size increases aggregate interlock and improves load transfer
Crack width, w

Crack Width Model ApproachCrack Width Model Approach
Step 1: Predict crack opening, w
Step 2: Predict differential
deflection, δdiff
Step 3: Determine
LTE
Inputs:RH, T, L, E, , C
Inputs:w, CA topsize,
Step 4: Acceptable
LTE?
Inputs:δfree, δdiff,
Inputs:FAA
recommendation
iPCC
i
PCCiSHRi E
fcTLCCCW
i
2
fL
hC
dc
PULf
bi
m
2
210
1i
Base frictionCurling (thermal and moisture)Steel reinforcement
Crack spacing
Drying shrinkage
Temperature drop
Restraints
*after DG2002

Step 1: Predicting crack width Step 1: Predicting crack width opening, wopening, w
Average increase with age due to shrinkage

Future Joint Analysis QuestionsFuture Joint Analysis Questions
What is an acceptable LTE?
What is LTE when dowels are removed?
Can joint spacing be increase from 18.75 to 25 ft?
How much can LTE be changed by concrete property changes?

Literature ReviewSurvey of existing mix designsReview of mix design strategies
Volume Stability TestsDrying and Autogenous shrinkageOptimization of concrete mixes to reduce volumetric changes
Strength TestingModulus of rupture, splitting and compressive strengthFracture energy and fracture surface roughness
Project Tasks and ProgressProject Tasks and Progress
Done,
TN2, 3, 4, 15
Done, TN 12
Done
Done,
TN 12 and TN 17.
Done, TN 12, TN 17, conf. paper
Fracture Tests Done
Status

Project Tasks and ProgressProject Tasks and Progress
Joint Type Design Slab size and jointing plans: productivity, cost, performance.
Optimization of concrete aggregate interlock to ensure shear transfer.
Joint (crack) width prediction model for concrete materials.
In progress, TN 3. Analysis pending, fracture and shrinkage tests done.
In progress, TN 12. Fracture tests
In progress

Project Tasks and ProgressProject Tasks and Progress
Saw-cut timing and depthSaw-cut timing criteria for the expected materials
Analytical model / Validation
Fiber Reinforced Concrete Materials
Overview of structural fibers for rigid pavement
Literature Review done, TN 3.
FEM model developed to obtain fracture results from WST samples, currently applying results to determine saw-cut timing and depth.

New Work for FY2006New Work for FY2006
Functionally-layered concrete pavementsMulti-functional rigid pavement
Cost saving
GREEN-CRETE Recycled concrete aggregate
Effect of recycled aggregate on mechanical and volumetric properties of concrete

Current work:Current work:Recycled Concrete as Aggregates (RCA) Recycled Concrete as Aggregates (RCA)
for new Concretefor new Concrete

Recycled Concrete AggregateRecycled Concrete Aggregate
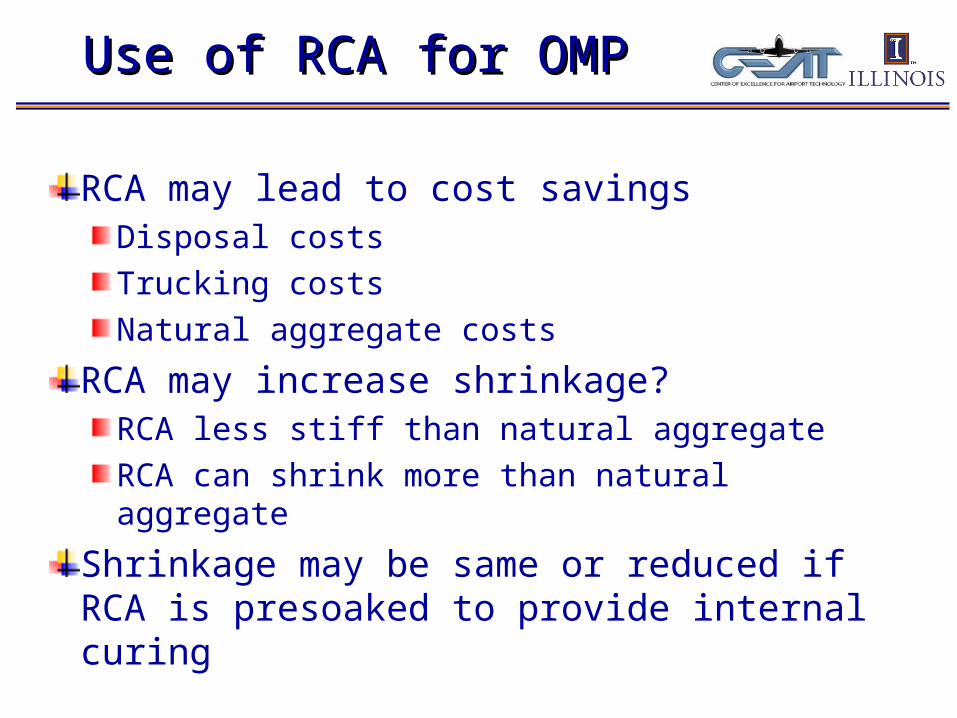
Use of RCA for OMPUse of RCA for OMP
RCA may lead to cost savingsDisposal costs
Trucking costs
Natural aggregate costs
RCA may increase shrinkage?RCA less stiff than natural aggregate
RCA can shrink more than natural aggregate
Shrinkage may be same or reduced if RCA is presoaked to provide internal curing

UIUC First TrialUIUC First Trial
RCA from Champaign recycling plantConcrete came from pavements, parking garages, etc.
Mix of materials with unknown properties
Material washed, dried, and sieved to match natural fine aggregate
Soaked for 24 hrs, surface dried, and then 100% replacement of natural fine aggregate

Saturated RCA vs Lab AggregatesSaturated RCA vs Lab Aggregates
-100
-80
-60
-40
-20
0
20
0 5 10 15 20
Age (d)
Shr
inka
ge s
trai
n x
10-6 lab stock
lab ssdRCA SSD
•Similar autogenous shrinkage curves
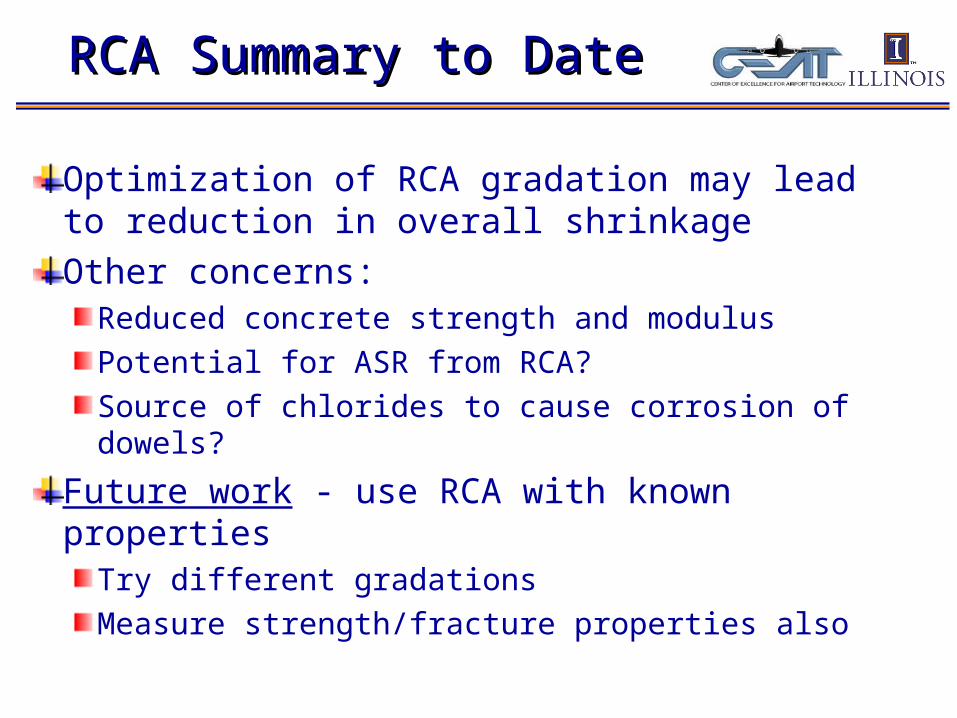
RCA Summary to DateRCA Summary to Date
Optimization of RCA gradation may lead to reduction in overall shrinkage
Other concerns:Reduced concrete strength and modulus
Potential for ASR from RCA?
Source of chlorides to cause corrosion of dowels?
Future work - use RCA with known propertiesTry different gradations
Measure strength/fracture properties also
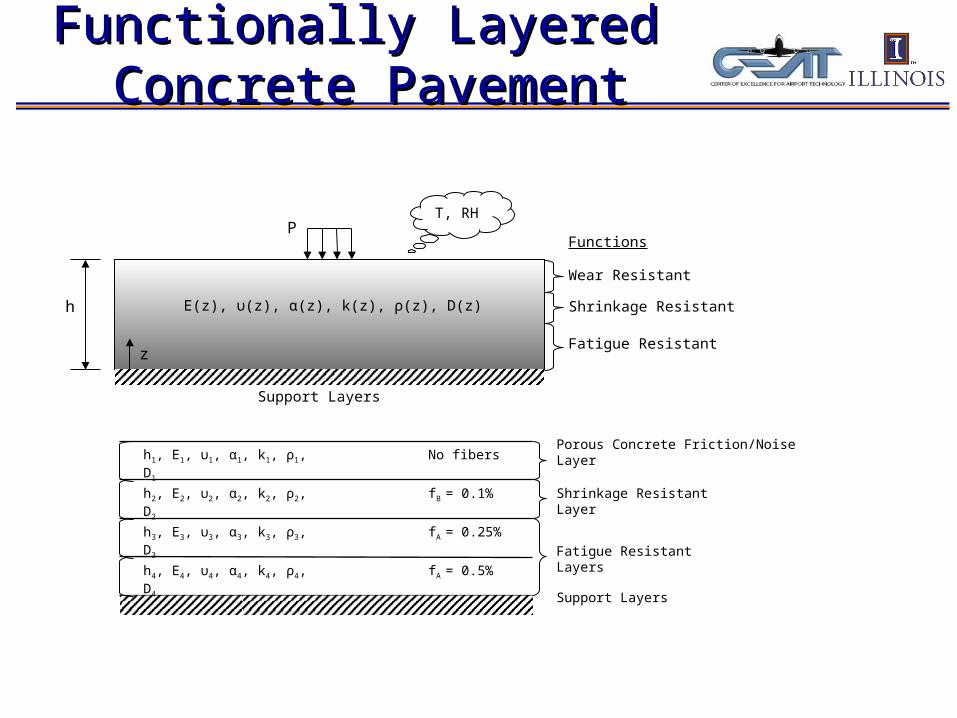
Functionally LayeredFunctionally Layered Concrete Pavement Concrete Pavement
T, RHP
E(z), υ(z), α(z), k(z), ρ(z), D(z)h
z
Wear Resistant
Shrinkage Resistant
Fatigue Resistant
Support Layers
Functions
Shrinkage Resistant Layer
Support Layers
No fibers
fB = 0.1%
fA = 0.25%
fA = 0.5%
h1, E1, υ1, α1, k1, ρ1, D1
h2, E2, υ2, α2, k2, ρ2, D2
h3, E3, υ3, α3, k3, ρ3, D3
h4, E4, υ4, α4, k4, ρ4, D4
Porous Concrete Friction/Noise Layer
Fatigue Resistant Layers

Functionally Layered Functionally Layered Concrete PavementConcrete Pavement
Experimental Program:
P
h
CMOD
Bottom layer
Top layer
ao
h1
h2
(a) (b)
Bottom layer
Top layer
Configuration ID PCC/PCC PCC/FRCPP FRCPP/PCC FRCPP/FRCPP PCC / FRCCS
FRCCS
/ PCC FRCCS / FRCCS
Top layer (h1) PCC PCC FRCPP FRCPP PCC FRCPP FRCPP Bottom layer (h2) PCC FRCPP PCC FRCPP FRCPP PCC FRCPP Type of specimen TPB WST TPB WST TPB WST TPB WST TPB TPB TPB # of specimens 3 / 3 2 3 2 3 2 3 2 3 3 3

Functionally Layered Functionally Layered Concrete PavementConcrete Pavement
Structural Synthetic Fibers in Beams
P
h
CMOD
Bottom layer
Top layer
ao
h1
h2

Functionally Layered Functionally Layered Concrete PavementConcrete Pavement
Steel Fibers in Beams
P
h
CMOD
Bottom layer
Top layer
ao
h1
h2

Functionally Layered Functionally Layered Concrete PavementConcrete Pavement
Synthetic Fibers in WST Specimen

Project Tasks and ProgressProject Tasks and Progress
Recycled Concrete Aggregate (RCA)
Review of previous experiences with RCA
Experimental program, and test to determine effect of RCA on relevant mix properties
In progress
In progress

Project Tasks and ProgressProject Tasks and Progress
Functionally Layered Concrete Pavement
Overview of structural fibers for rigid pavement
Layered pavement systems- preliminary study
Fracture resistance of two layer concrete pavement systems
Literature Review done, TN 3.
Done, preliminary results show potential
In progress

2006 First Quarter Deliverables2006 First Quarter Deliverables
TN - Phase II concrete mix evaluation
Large aggregate mixtures paper (ASCE)
TN – Fracture Properties of Concrete Mixtures (WST)

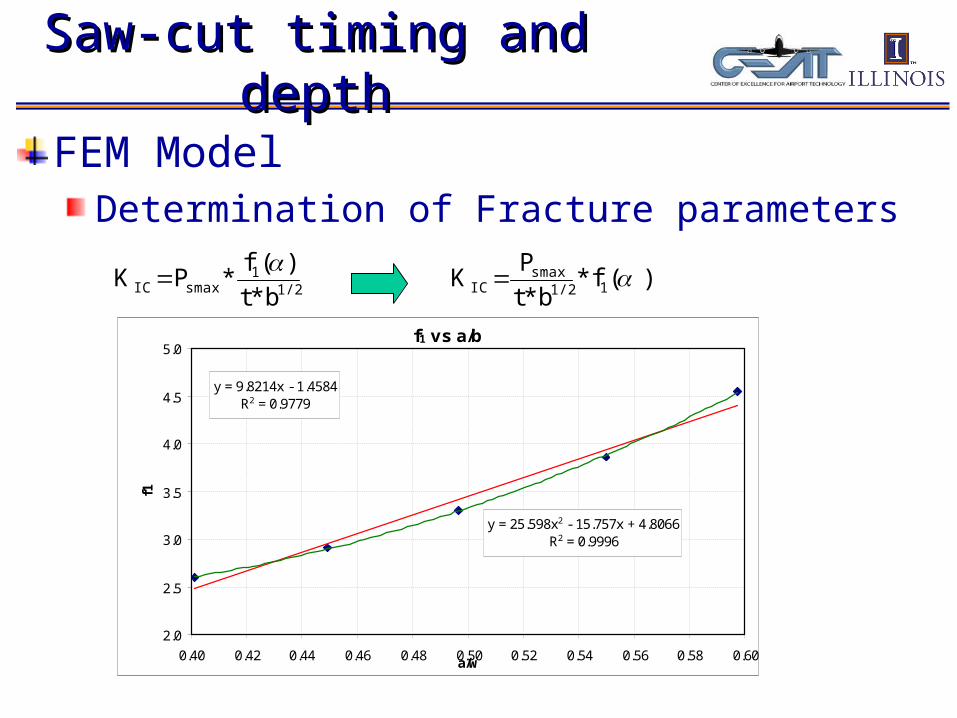
Saw-cut timing and depthSaw-cut timing and depth
FEM Model Determination of Fracture parameters
1/21
smaxIC b*t
)(f *P K
)(f *
b*t
P K 11/2
smaxIC
f1 vs a/b
y = 9.8214x - 1.4584R2 = 0.9779
y = 25.598x2 - 15.757x + 4.8066R2 = 0.9996
2.0
2.5
3.0
3.5
4.0
4.5
5.0
0.40 0.42 0.44 0.46 0.48 0.50 0.52 0.54 0.56 0.58 0.60a/w
f1
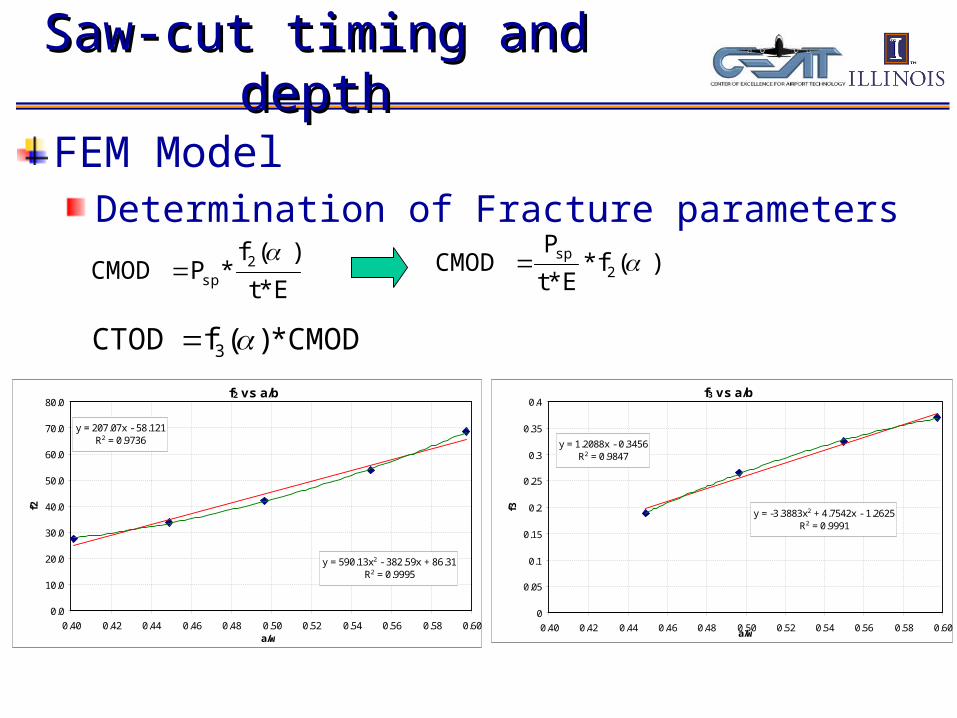
Saw-cut timing and depthSaw-cut timing and depth
FEM Model Determination of Fracture parameters
E*t
)(f *PCMOD 2
sp
)(f*
E*t
PCMOD 2
sp
CMOD*)(fCTOD 3 f2 vs a/b
y = 207.07x - 58.121R2 = 0.9736
y = 590.13x2 - 382.59x + 86.31R2 = 0.9995
0.0
10.0
20.0
30.0
40.0
50.0
60.0
70.0
80.0
0.40 0.42 0.44 0.46 0.48 0.50 0.52 0.54 0.56 0.58 0.60a/w
f2
f3 vs a/b
y = 1.2088x - 0.3456R2 = 0.9847
y = -3.3883x2 + 4.7542x - 1.2625R2 = 0.9991
0
0.05
0.1
0.15
0.2
0.25
0.3
0.35
0.4
0.40 0.42 0.44 0.46 0.48 0.50 0.52 0.54 0.56 0.58 0.60a/w
f3

Recycled Concrete AggregateRecycled Concrete Aggregate
Some findings from literatureWhen used with a very low w/cm, RCAC compressive strength can exceed 9000psi at 28 d
Autogenous shrinkage can be lowered by 60% by adding saturated RCA
While there are no reports in the literature, it is likely that RCA increases tensile creep, which would reduce propensity for
shrinkage cracking or curling
I. Maruyama, R. Sato, “A trial of reducing autogenous shrinkage by recycled aggregate”, in Proceedings of self-desiccation and its importance in concrete technology, Gaithersburg, MD, June 2005.