concrete spillway and dam inspection using … · 1 concrete spillway and dam inspection using...
TRANSCRIPT
1
Concrete Spillway and Dam Inspection Using Nondestructive Techniques
Presented at HydroVision 2006
By Dennis A. Sack and Larry D. Olson, Associate and Principal Engineers, Olson
Engineering, Inc., 12401 W. 49th
Avenue, Wheat Ridge, CO 80033, e-mails –
[email protected] and [email protected]
ABSTRACT
There are a number of nondestructive evaluation methods applicable to investigations
into the condition of concrete dam structures. Included in this paper is a discussion of the
methods themselves, the applicability of the methods to different types of dams and
structures related to dams, as well as several case histories of the methods in application.
The nondestructive evaluation methods to be discussed include Impact Echo, Spectral
Analysis of Surface Waves, Slab Impulse Response, Ground Penetrating Radar, and
Cross-Dam Tomography for imaging inside concrete thin-arch dams. The methods are
applicable to a variety of concrete elements found on many types of dams. These
elements include spillway concrete evaluation, spillway subgrade evaluation, dam wall
concrete evaluation, and thin-arch dam interior evaluation. Several of the techniques
discussed can be applied from the downstream face of a thin-arch concrete dam to
evaluate the condition of the concrete through the entire cross-section with no dewatering
required. In fact, the Cross Dam Tomography method works best when the dam is as full
as possible.
INTRODUCTION
As the nation’s infrastructure ages, it becomes increasingly important to be able to
determine the condition of existing structures, and track changes in condition over time.
This is especially true for critical infrastructure elements such as large dams. The long
expected life and large mass of concrete dams and spillways tends to make them
susceptible to gradual degradation mechanisms which begin in very small ways which are
easy to miss, but can accelerate over time. Some of these mechanisms include freeze-
thaw damage on the downstream face and crown, seepage under and around outflow
pipes and spillways, slow-developing cracks in the dam interior, and erosion due to water
flow and weathering. Each of these types of degradation can start out as a very minor
problem, which sometimes can be present for years before being noticed. The presence
of the initial degradation, however, tends to accelerate future problems. Freeze-thaw
damaged surfaces hold more moisture than usual, leading to greater damage. Small
cracks in the dam face become stress concentrators which lead to deeper cracking, while
cracks which seep can lead to erosion and cracking due to the action of the water.
Seepage under a spillway or around an outflow pipe slowly erodes the subgrade, leading
to faster flow rates and even greater erosion rates.
2
The best defense a dam owner has against these threats is periodic inspection.
Visual inspections, however, often only find problems after they have developed into
major degradation. Some types of damage, such as voids under a spillway slab or
cracking in the dam interior or on the upstream, submerged face, are very difficult or
impossible to find with only visual means. This is where the use of Nondestructive
Evaluation (NDE) techniques enters the picture. The various nondestructive methods
available use sound waves, radio waves, and other types of low-level energy to penetrate
through the concrete beyond what the eye can see. These methods can locate a void
under a spillway, measure the depth and severity of freeze-thaw or other surface damage,
and create an image slice through the interior of a dam to show cracks, debonded joints,
and other degraded zones. Most of these methods can be done without dewatering the
dam, and all are completely nondestructive and nonintrusive. In this paper, several of the
NDE methods most commonly applied to dams will be discussed, along with sample
results from investigations of a number of dams of various types.
NDE METHODS
While a number of NDE methods can be applied to the investigation of the condition of
various concrete elements in a dam structure, there are three techniques that are
particularly useful in most dam investigations. The first technique discussed is the
Spectral Analysis of Surface Waves (SASW) method, which is used for measuring the
condition of concrete versus depth from the test surface as well as for crack depth
measurement. The second method discussed is the application of Ground Penetrating
Radar (GPR) to spillway investigations. This method is used to map out voids and water
seepage paths under a spillway, and will also provide information as to the spacing and
depth of any reinforcing in the concrete for cases where this information is not known.
The final method discussed is the used of sound wave transmission through a thin-arch
dam interior to create a tomographic image slice through the dam from upstream to
downstream faces. This Acoustic Tomography (AT) method is a very powerful and
relatively quick way to see beyond just the downstream face to the interior and upstream
faces without dewatering.
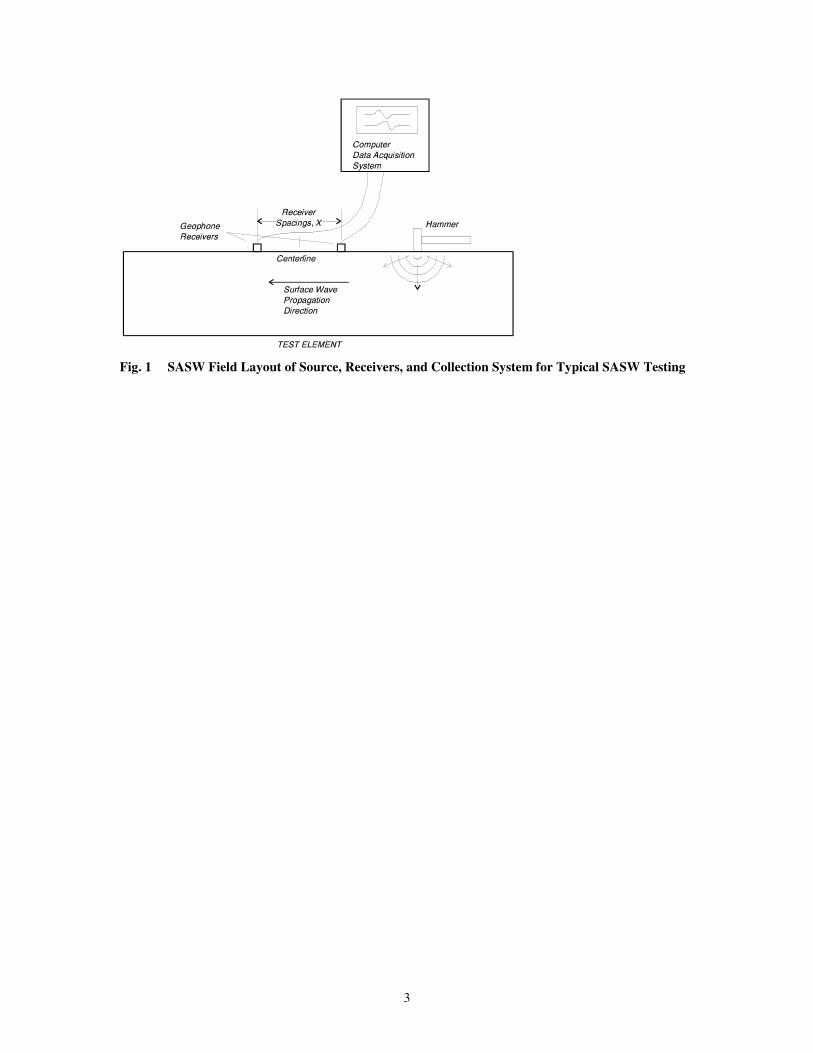
SASW TEST METHOD AND SAMPLE RESULTS The SASW method is based upon measuring surface waves propagating in
layered elastic media and is illustrated in Fig. 1. The ratio of surface wave velocity to
shear wave velocity varies with Poisson's ratio. However, reasonable estimates of
Poisson's ratio and mass density for concrete and other materials can normally be made
with only a small effect on the accuracy of the shear wave velocity profile. Knowledge
of the shear wave velocity combined with reasonable estimates of mass density of the
material layers allows calculation of shear moduli for low-strain amplitudes.
3
Fig. 1 SASW Field Layout of Source, Receivers, and Collection System for Typical SASW Testing
4
Surface wave (also termed Rayleigh; R-wave) velocity varies with frequency in a
layered system with differing velocities. This variation in velocity with frequency is
termed dispersion. A plot of surface wave velocity versus wavelength is called a
dispersion curve.
The SASW tests and analyses are generally performed in three phases: (1)
collection of data in situ; (2) construction of an experimental dispersion curve from the
field data; and (3) forward modeling of the theoretical dispersion curve, if desired, to
match theoretical and experimental curves so that a shear wave velocity versus depth
profile can be constructed. Wavelength (8), frequency (f), and wave velocity (Vr), are
related as follows:
Vr = f*λ (1)
Surface wave dispersion can be expressed in terms of a plot of surface wave velocity
versus wavelength. This plot is called a dispersion curve plot. For sound concrete, the
dispersion curve plot is flat (constant velocity) versus wavelength throughout the
concrete thickness. If degradation or cracking present at the test location, the dispersion
curve will have zones of lower velocity. The depth of the cracking or degradation can be
estimated from the wavelength range of the dispersion curve.
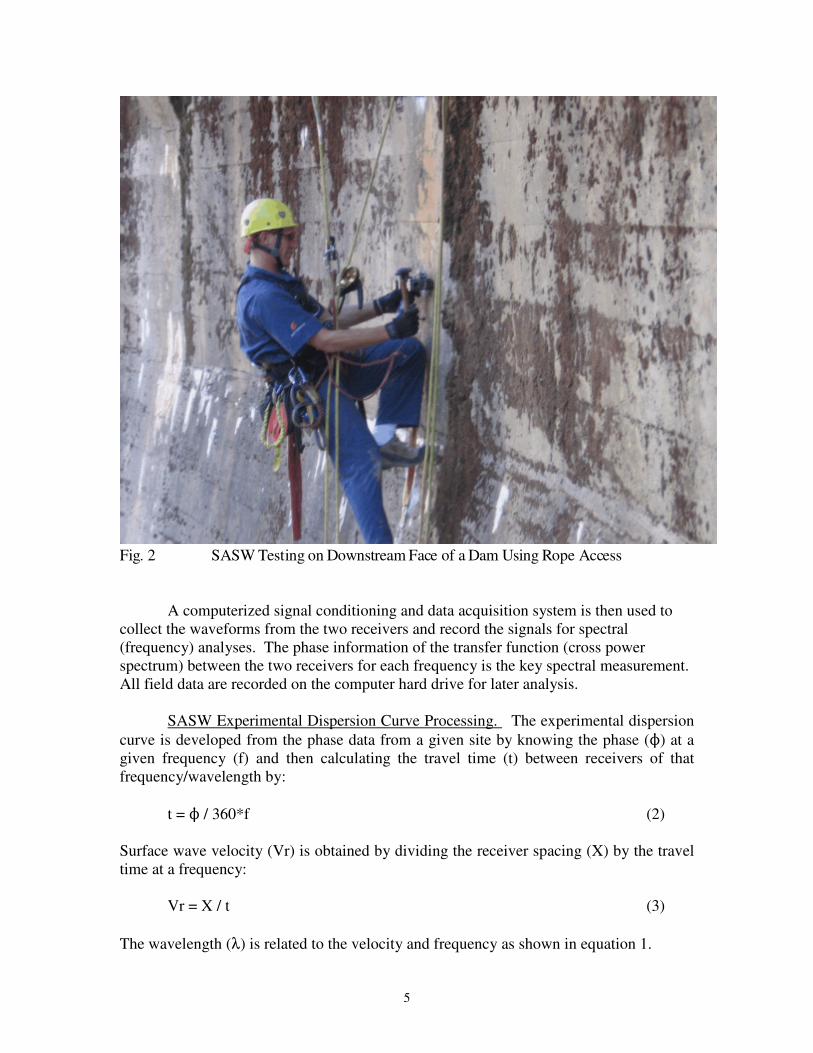
Collection of SASW Field Data. Typical SASW field tests are conducted with a
pair of matched vibration transducers and an impact source. The transducers are typically
displacement transducers or accelerometers mounted to or held in contact with the
concrete surface. One example of an SASW data collection system is an Olson
Instruments SASW-S test system, consisting of two displacement transducers mounted
on a bar at a fixed spacing. The bar is pressed against a given test surface, and impacts
made with a small hammer in line with the receivers. A photograph of SASW data
collection on a thin arch dam face using rope access is shown in Fig. 2.
5
A computerized signal conditioning and data acquisition system is then used to
collect the waveforms from the two receivers and record the signals for spectral
(frequency) analyses. The phase information of the transfer function (cross power
spectrum) between the two receivers for each frequency is the key spectral measurement.
All field data are recorded on the computer hard drive for later analysis.
SASW Experimental Dispersion Curve Processing. The experimental dispersion
curve is developed from the phase data from a given site by knowing the phase (N) at a
given frequency (f) and then calculating the travel time (t) between receivers of that
frequency/wavelength by:
t = N / 360*f (2)
Surface wave velocity (Vr) is obtained by dividing the receiver spacing (X) by the travel
time at a frequency:
Vr = X / t (3)
The wavelength (λ) is related to the velocity and frequency as shown in equation 1.
Fig. 2 SASW Testing on Downstream Face of a Dam Using Rope Access
6
By repeating the above procedure for any given frequency, the surface wave
velocity corresponding to a given wavelength is evaluated, and the dispersion curve is
determined. The phase data is typically viewed on the PC data acquisition system in the
field to ensure that acceptable data is being collected. The phase data is then returned to
the office for further processing. The phase of the cross power spectrum (transfer
function) between the two receivers and the coherence function are used in creating the
dispersion curves.
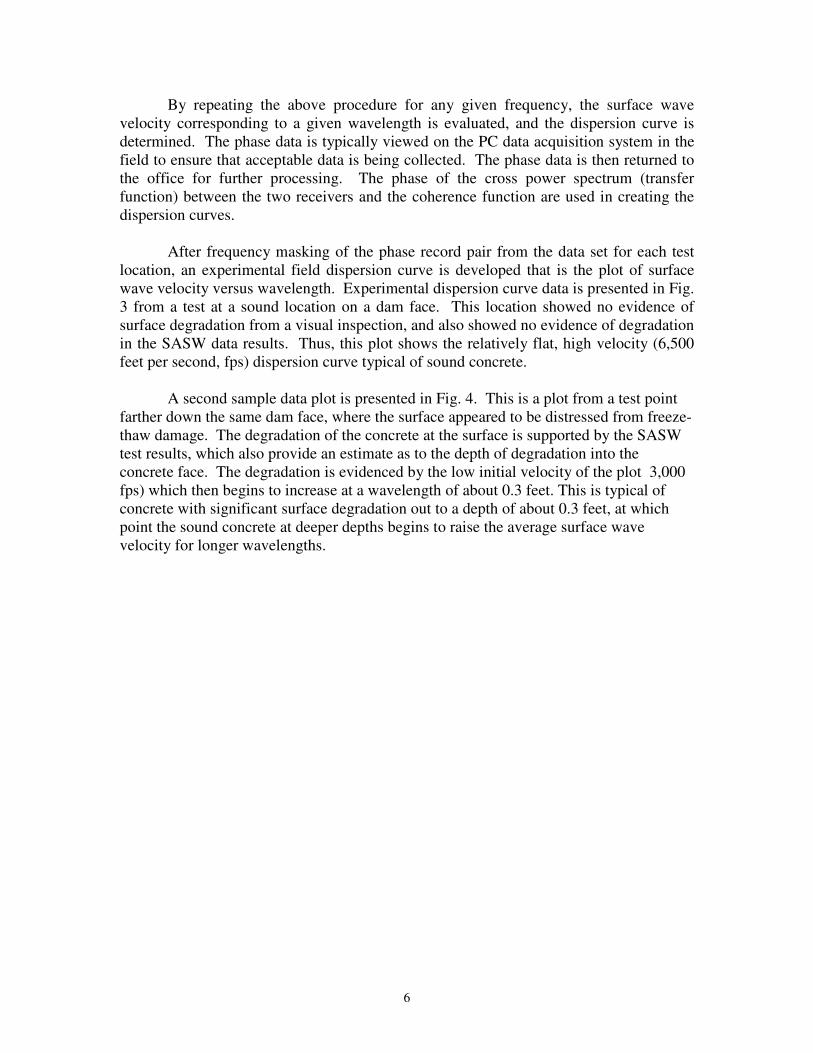
After frequency masking of the phase record pair from the data set for each test
location, an experimental field dispersion curve is developed that is the plot of surface
wave velocity versus wavelength. Experimental dispersion curve data is presented in Fig.
3 from a test at a sound location on a dam face. This location showed no evidence of
surface degradation from a visual inspection, and also showed no evidence of degradation
in the SASW data results. Thus, this plot shows the relatively flat, high velocity (6,500
feet per second, fps) dispersion curve typical of sound concrete.
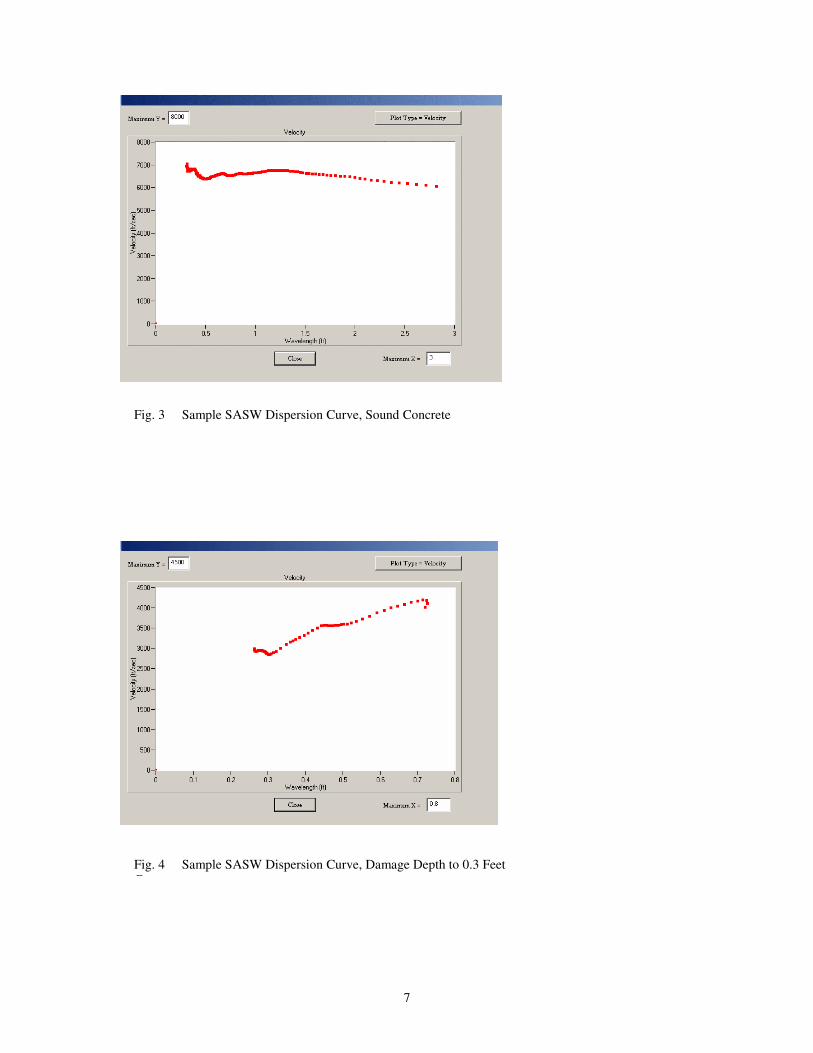
A second sample data plot is presented in Fig. 4. This is a plot from a test point
farther down the same dam face, where the surface appeared to be distressed from freeze-
thaw damage. The degradation of the concrete at the surface is supported by the SASW
test results, which also provide an estimate as to the depth of degradation into the
concrete face. The degradation is evidenced by the low initial velocity of the plot 3,000
fps) which then begins to increase at a wavelength of about 0.3 feet. This is typical of
concrete with significant surface degradation out to a depth of about 0.3 feet, at which
point the sound concrete at deeper depths begins to raise the average surface wave
velocity for longer wavelengths.
7
Fig. 3 Sample SASW Dispersion Curve, Sound Concrete
Fig. 4 Sample SASW Dispersion Curve, Damage Depth to 0.3 Feet
Concrete
8
GROUND PENETRATING RADAR (GPR) METHOD AND SAMPLE RESULTS
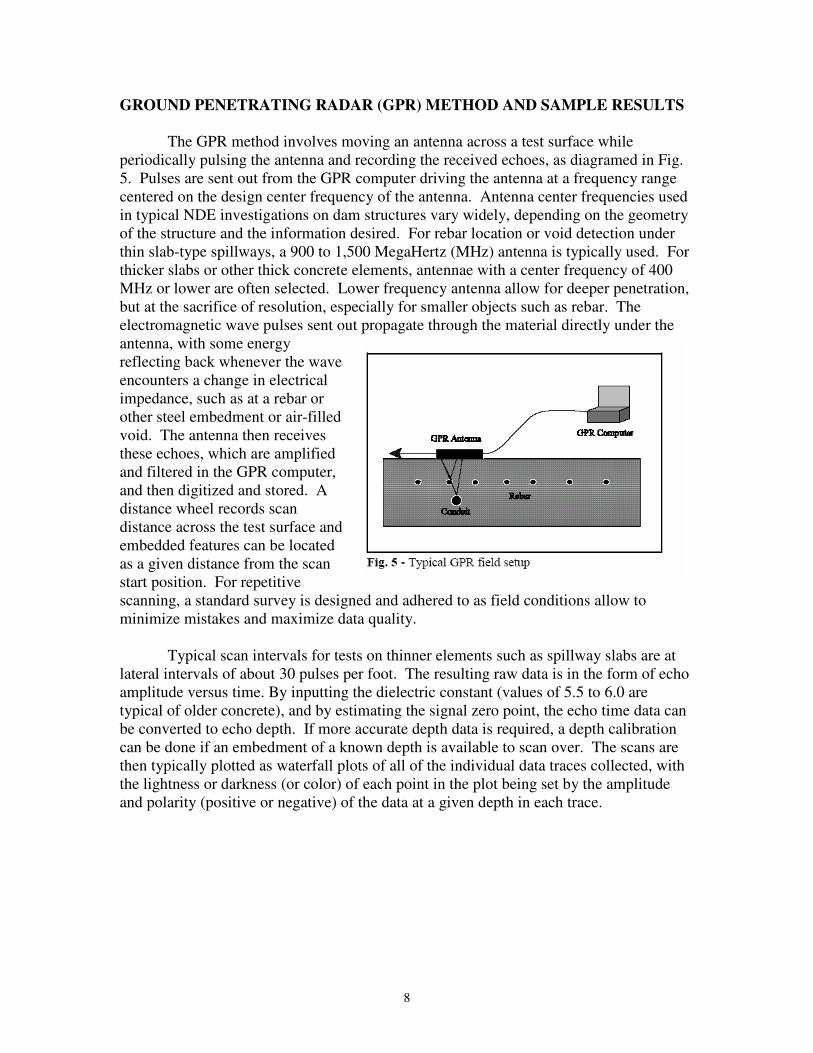
The GPR method involves moving an antenna across a test surface while
periodically pulsing the antenna and recording the received echoes, as diagramed in Fig.
5. Pulses are sent out from the GPR computer driving the antenna at a frequency range
centered on the design center frequency of the antenna. Antenna center frequencies used
in typical NDE investigations on dam structures vary widely, depending on the geometry
of the structure and the information desired. For rebar location or void detection under
thin slab-type spillways, a 900 to 1,500 MegaHertz (MHz) antenna is typically used. For
thicker slabs or other thick concrete elements, antennae with a center frequency of 400
MHz or lower are often selected. Lower frequency antenna allow for deeper penetration,
but at the sacrifice of resolution, especially for smaller objects such as rebar. The
electromagnetic wave pulses sent out propagate through the material directly under the
antenna, with some energy
reflecting back whenever the wave
encounters a change in electrical
impedance, such as at a rebar or
other steel embedment or air-filled
void. The antenna then receives
these echoes, which are amplified
and filtered in the GPR computer,
and then digitized and stored. A
distance wheel records scan
distance across the test surface and
embedded features can be located
as a given distance from the scan
start position. For repetitive
scanning, a standard survey is designed and adhered to as field conditions allow to
minimize mistakes and maximize data quality.
Typical scan intervals for tests on thinner elements such as spillway slabs are at
lateral intervals of about 30 pulses per foot. The resulting raw data is in the form of echo
amplitude versus time. By inputting the dielectric constant (values of 5.5 to 6.0 are
typical of older concrete), and by estimating the signal zero point, the echo time data can
be converted to echo depth. If more accurate depth data is required, a depth calibration
can be done if an embedment of a known depth is available to scan over. The scans are
then typically plotted as waterfall plots of all of the individual data traces collected, with
the lightness or darkness (or color) of each point in the plot being set by the amplitude
and polarity (positive or negative) of the data at a given depth in each trace.
9
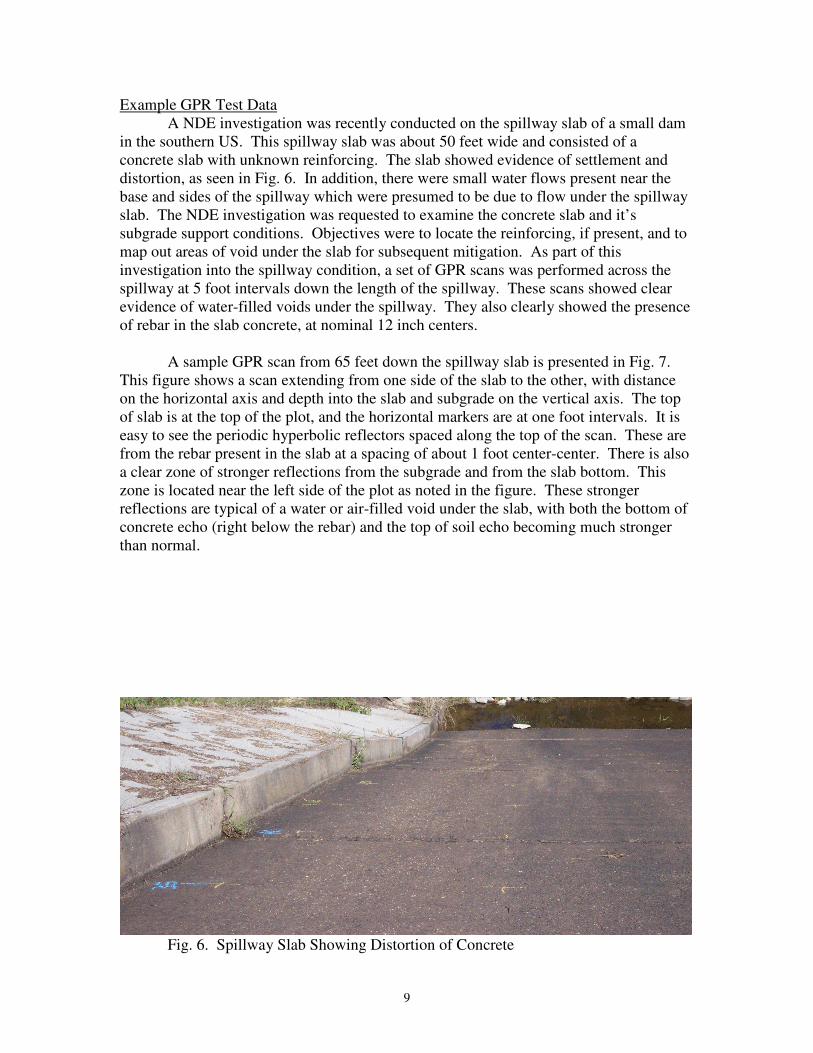
Example GPR Test Data
A NDE investigation was recently conducted on the spillway slab of a small dam
in the southern US. This spillway slab was about 50 feet wide and consisted of a
concrete slab with unknown reinforcing. The slab showed evidence of settlement and
distortion, as seen in Fig. 6. In addition, there were small water flows present near the
base and sides of the spillway which were presumed to be due to flow under the spillway
slab. The NDE investigation was requested to examine the concrete slab and it’s
subgrade support conditions. Objectives were to locate the reinforcing, if present, and to
map out areas of void under the slab for subsequent mitigation. As part of this
investigation into the spillway condition, a set of GPR scans was performed across the
spillway at 5 foot intervals down the length of the spillway. These scans showed clear
evidence of water-filled voids under the spillway. They also clearly showed the presence
of rebar in the slab concrete, at nominal 12 inch centers.
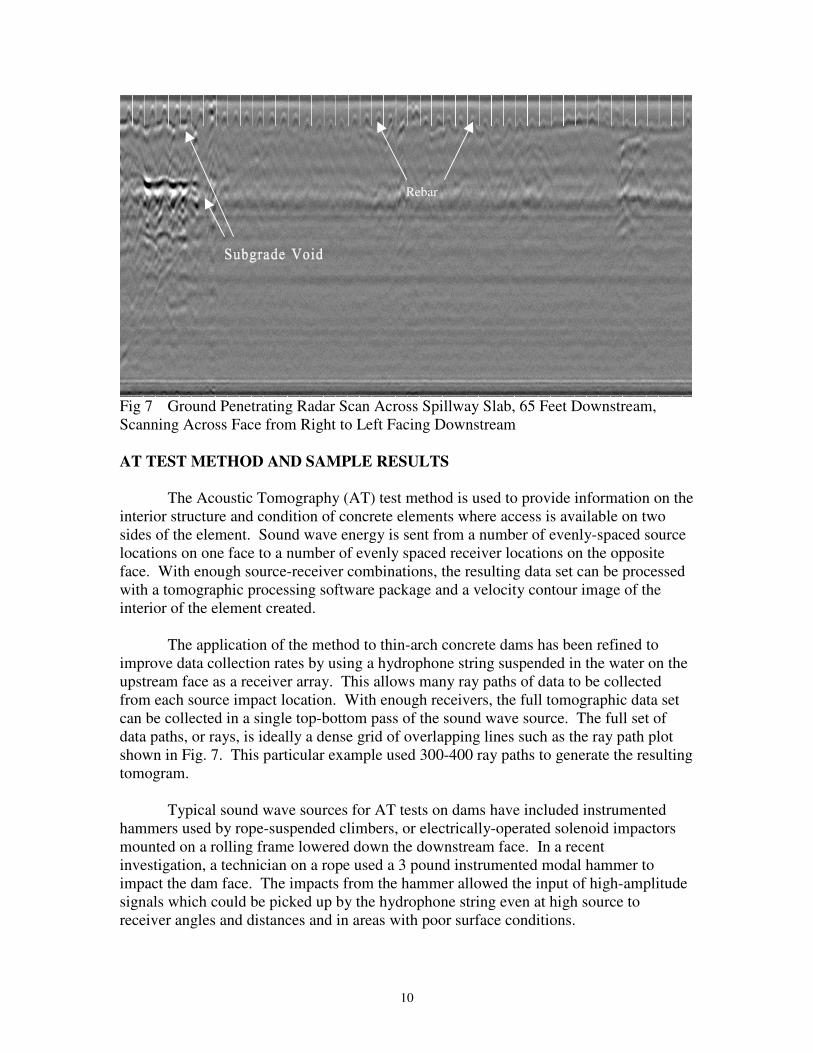
A sample GPR scan from 65 feet down the spillway slab is presented in Fig. 7.
This figure shows a scan extending from one side of the slab to the other, with distance
on the horizontal axis and depth into the slab and subgrade on the vertical axis. The top
of slab is at the top of the plot, and the horizontal markers are at one foot intervals. It is
easy to see the periodic hyperbolic reflectors spaced along the top of the scan. These are
from the rebar present in the slab at a spacing of about 1 foot center-center. There is also
a clear zone of stronger reflections from the subgrade and from the slab bottom. This
zone is located near the left side of the plot as noted in the figure. These stronger
reflections are typical of a water or air-filled void under the slab, with both the bottom of
concrete echo (right below the rebar) and the top of soil echo becoming much stronger
than normal.
Fig. 6. Spillway Slab Showing Distortion of Concrete
10
Rebar
Fig 7 Ground Penetrating Radar Scan Across Spillway Slab, 65 Feet Downstream,
Scanning Across Face from Right to Left Facing Downstream
AT TEST METHOD AND SAMPLE RESULTS
The Acoustic Tomography (AT) test method is used to provide information on the
interior structure and condition of concrete elements where access is available on two
sides of the element. Sound wave energy is sent from a number of evenly-spaced source
locations on one face to a number of evenly spaced receiver locations on the opposite
face. With enough source-receiver combinations, the resulting data set can be processed
with a tomographic processing software package and a velocity contour image of the
interior of the element created.
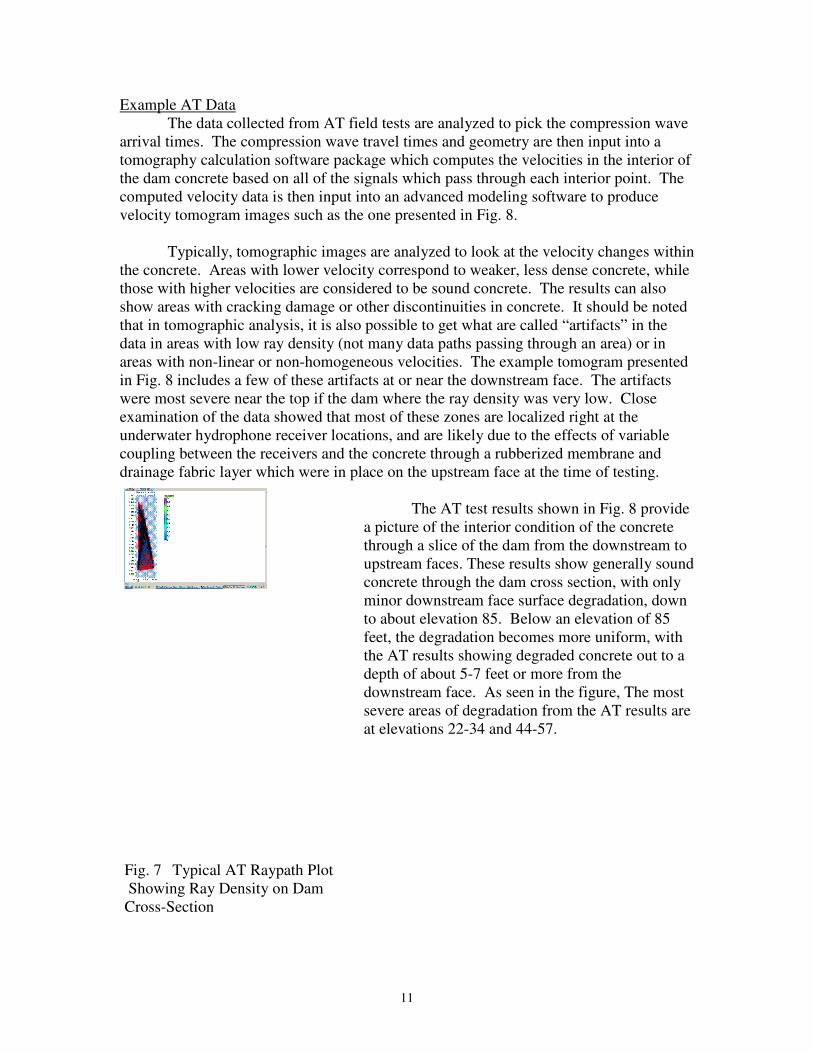
The application of the method to thin-arch concrete dams has been refined to
improve data collection rates by using a hydrophone string suspended in the water on the
upstream face as a receiver array. This allows many ray paths of data to be collected
from each source impact location. With enough receivers, the full tomographic data set
can be collected in a single top-bottom pass of the sound wave source. The full set of
data paths, or rays, is ideally a dense grid of overlapping lines such as the ray path plot
shown in Fig. 7. This particular example used 300-400 ray paths to generate the resulting
tomogram.
Typical sound wave sources for AT tests on dams have included instrumented
hammers used by rope-suspended climbers, or electrically-operated solenoid impactors
mounted on a rolling frame lowered down the downstream face. In a recent
investigation, a technician on a rope used a 3 pound instrumented modal hammer to
impact the dam face. The impacts from the hammer allowed the input of high-amplitude
signals which could be picked up by the hydrophone string even at high source to
receiver angles and distances and in areas with poor surface conditions.
11
Example AT Data
The data collected from AT field tests are analyzed to pick the compression wave
arrival times. The compression wave travel times and geometry are then input into a
tomography calculation software package which computes the velocities in the interior of
the dam concrete based on all of the signals which pass through each interior point. The
computed velocity data is then input into an advanced modeling software to produce
velocity tomogram images such as the one presented in Fig. 8.
Typically, tomographic images are analyzed to look at the velocity changes within
the concrete. Areas with lower velocity correspond to weaker, less dense concrete, while
those with higher velocities are considered to be sound concrete. The results can also
show areas with cracking damage or other discontinuities in concrete. It should be noted
that in tomographic analysis, it is also possible to get what are called “artifacts” in the
data in areas with low ray density (not many data paths passing through an area) or in
areas with non-linear or non-homogeneous velocities. The example tomogram presented
in Fig. 8 includes a few of these artifacts at or near the downstream face. The artifacts
were most severe near the top if the dam where the ray density was very low. Close
examination of the data showed that most of these zones are localized right at the
underwater hydrophone receiver locations, and are likely due to the effects of variable
coupling between the receivers and the concrete through a rubberized membrane and
drainage fabric layer which were in place on the upstream face at the time of testing.
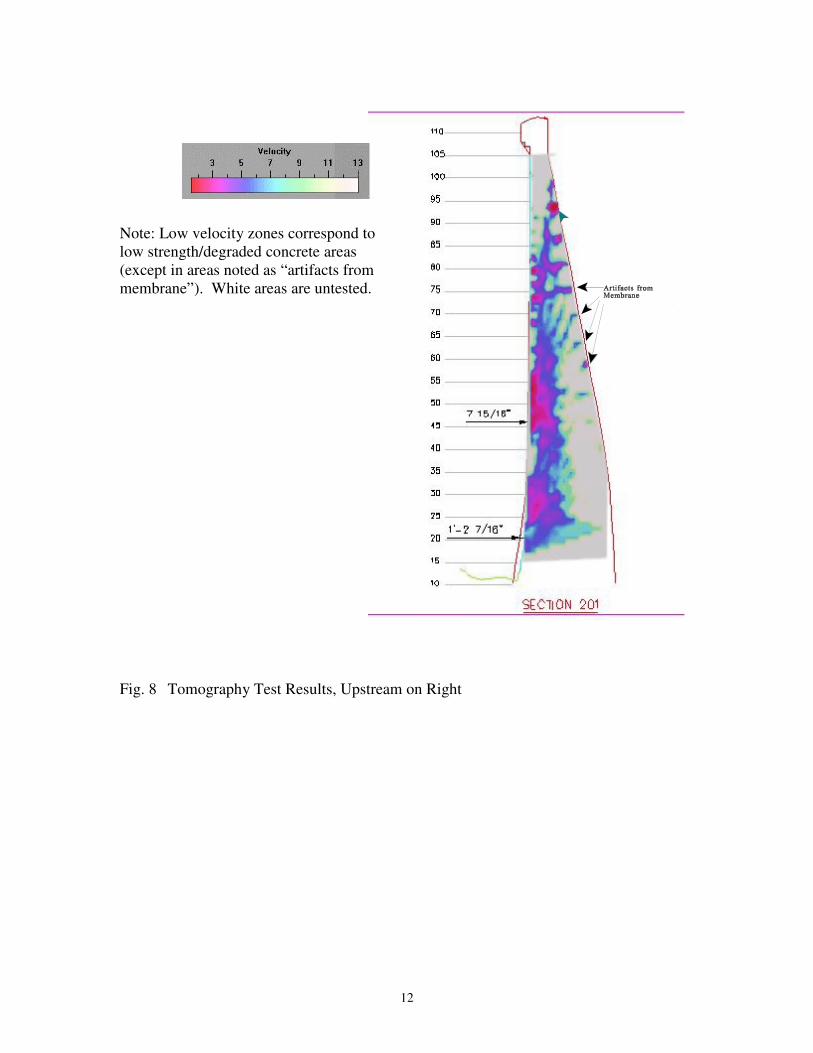
The AT test results shown in Fig. 8 provide
a picture of the interior condition of the concrete
through a slice of the dam from the downstream to
upstream faces. These results show generally sound
concrete through the dam cross section, with only
minor downstream face surface degradation, down
to about elevation 85. Below an elevation of 85
feet, the degradation becomes more uniform, with
the AT results showing degraded concrete out to a
depth of about 5-7 feet or more from the
downstream face. As seen in the figure, The most
severe areas of degradation from the AT results are
at elevations 22-34 and 44-57.
Fig. 7 Typical AT Raypath Plot
Showing Ray Density on Dam
Cross-Section
12
Note: Low velocity zones correspond to
low strength/degraded concrete areas
(except in areas noted as “artifacts from
membrane”). White areas are untested.
Fig. 8 Tomography Test Results, Upstream on Right
13
SUMMARY AND CONCLUSIONS
Three methods for NDE investigations of concrete dam elements have been
presented, each of which can provide information on damage and degradation not
available from a simple visual inspection. The methods presented include SASW tests
for surface damage and crack depth, GPR for rebar location and spillway slab subgrade
void location, and AT tests to survey the entire cross-section of a dam interior. The
methods presented are all completely nondestructive and non-invasive, and usually can
be applied to dams without dewatering or other interference with normal operations.
Together, these methods provide a powerful set of tools that can be used by owners and
operators of dams and similar facilities to ensure that the structures in their care continue
to safely perform the service for which they were originally constructed.