condensate recovery in mutrafiah project
TRANSCRIPT
CONDENSATION RECOVERY QURANIC GIRL INTERMEDIATE SCHOOL CASE STUDY, JUBAIL KINGDOM OF
SAUDI ARABIA
PREPARED BY: MUDASSAR IDRIS RAUT – LEED GREEN ASSOCIATE
PAGE 1
1.1 ABSTRACT
The biggest reliable source of potable water in Saudi Arabia is from Desalination Water
treatment. Since Ground source water resources are very minimal due to geographical location,
country largest demand depends on Desalination water from Sea. However the production cost to
convert saline water to Potable water is considerable [1.09 US$ per cubic meter]. Since water is
very crucial for daily activities & converting Saline Water into potable consume ample amount of
energy & money, it obviously increases an alarm to reduce water consumption at site & look for
other replaceable derivatives which can replace Potable water intake from Municipal Bodies. The
Saudi Minister of Water & Electricity estimated that 25% of Saudi Oil & Gas Production in fiscal yr.
2009 was used domestically to generate electricity & produce water, with present demand rates
suggesting that this figure will reach 50% by yr. 2030 as per research by [BELFER CENER for science
& International Affair].
To focus on this cause Mechanical Engineering Division of Abdul Al Rahman AL Naim
Consultant- Dammam has developed a conceptual design for Water Reclaim use at Quranic School
Project- a Royal Commissioning Project in Jubail, Kingdom Of Saudi Arabia.
1.2 BACKGROUND STUDY ON CONDENSATION
Proposed HVAC system designed is of Chilled Water System where in there are 5 No’s Air
Handling Unit used in Girl Intermediate School & 2 No’s Air Cooled Chillers. Since this schools are
located in Jubail where there is enough amount of humidity present in air, the water present can
be used after condensation. As per ASHRAE [American Society Heating Refrigeration & Air
Conditioning Engineers] standards school requires larger amount of outside air to main inside
school environment healthy. Now this outside brings large load on Air Handlers Cooling Coils in
turn increasing the amount of moist air passing through these Coils. As this air passes through
these coil, temperature of air drops as a result the air can no longer holds the amount of moisture
as it was holding when it was relatively hot. This process can easily be understood in Psychometric
analysis of Air handling units. As a result the moisture present in moist air drops off & this entire
process is called Condensation. Note that not all the moisture present in moist air drops as there
is still resultant moisture present in air leaving the cooling coil. The exact theoretical amount of
moisture required depends on Indoor Desired room condition: - In this case we are maintaining
50% relative humidity as commanded by ASHRAE standards for school project & it also complying
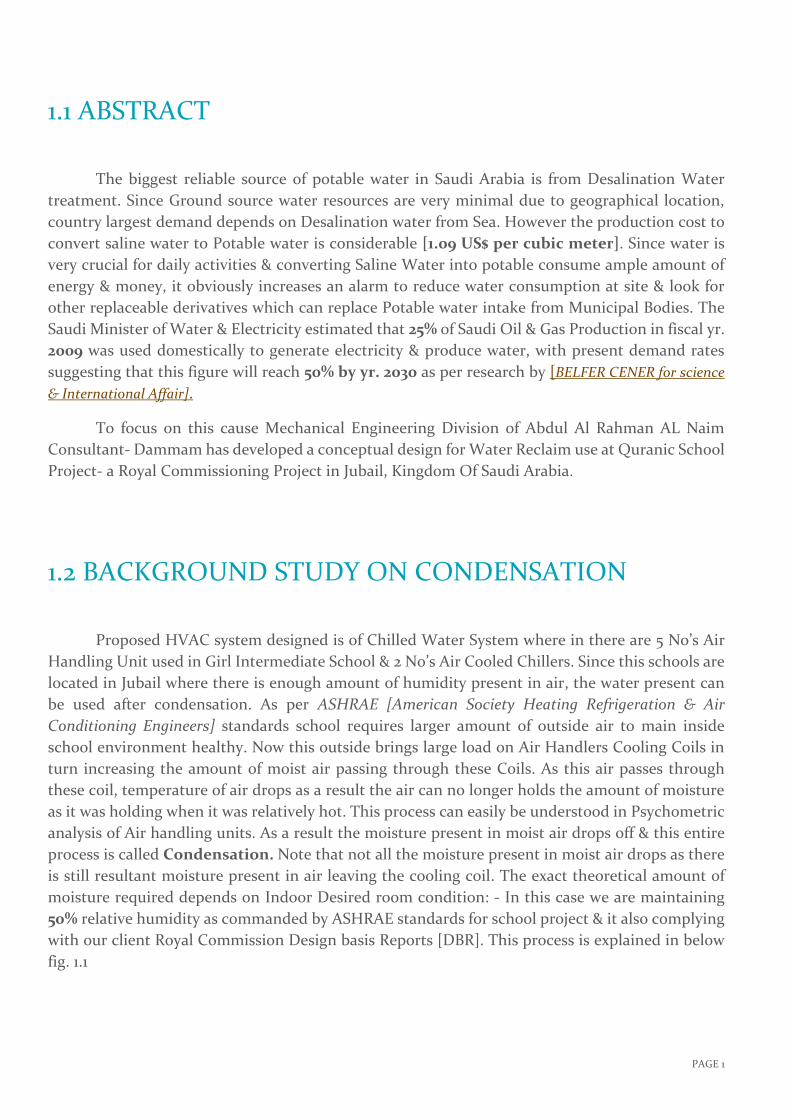
with our client Royal Commission Design basis Reports [DBR]. This process is explained in below
fig. 1.1
PAGE 2
1.3 WHAT IS CONDENSATE WATER?
Condensate is a byproduct generated during Air Conditioning process which is
usually wasted & drained to sewer. Condensate is generated in the same manner as distilled
water, which has a slightly acidic pH value around 5.8, as compared to a neutral pH value of 7.0,
and contains no minerals. However, unlike distilled water, condensate is subject to environmental
contamination during the process of collection and transport. Microorganisms (e.g., bacteria and
viruses) suspended in air drawn from inside and/or outside the building (i.e., return air and/or
outside air) through the Air Handling Unit (AHU) can collect on the cooling coils with the moisture
when condensate is formed (see Fig 1.1 for a schematic of an AHU). In addition, being slightly acidic,
condensate tends to react with materials with which it comes in contact. Such reactions can raise
the pH value of condensate. Any molecules or particulates the condensate picks up during
formation or along its flow path can be referred to as a contaminant and must be considered when
making treatment decisions.
Fig: 1.1
PAGE 3
1.4 ACCUSTOMED CONDENSATE PRACTICES
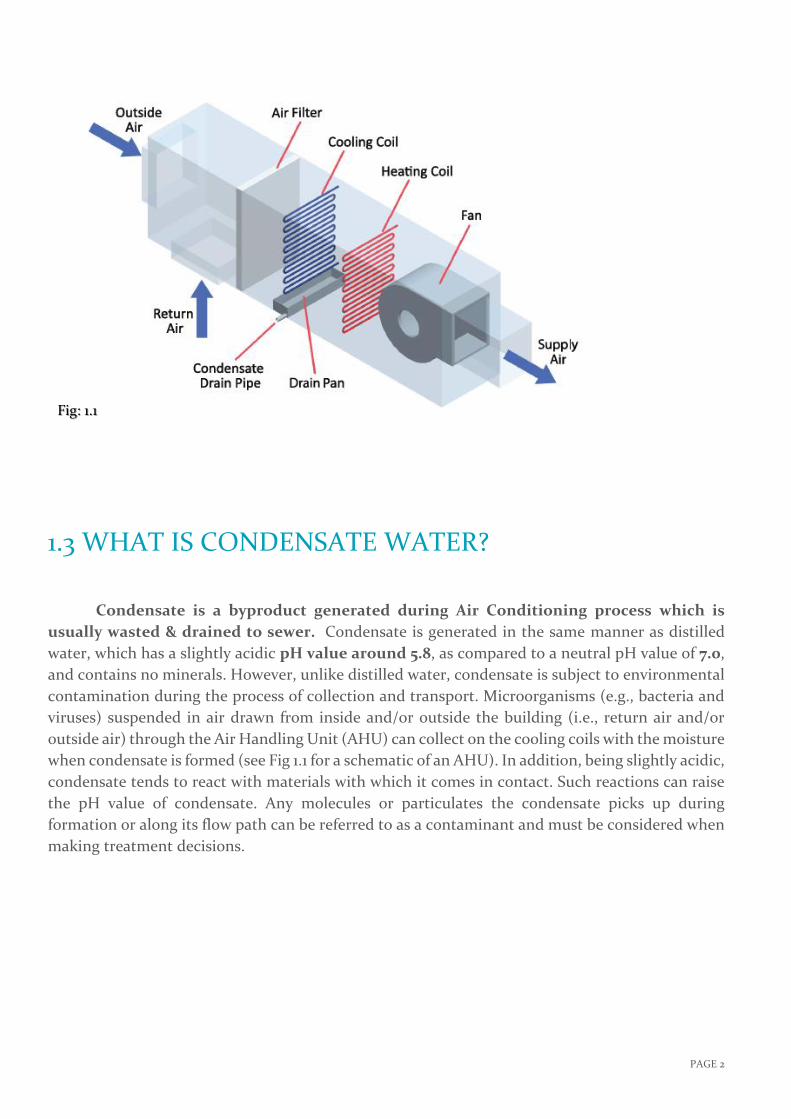
Largely the condensate collected is discarded through various drain points & dumped into
normal sewers. This not only waste this high valuable clean Distilled water but also adds loads in
Sewer Treatment Plant on Local municipal bodies thus increasing additional Energy & Cost factors
to the Government. This not only burden the Government organization but also results in
additional GHG [Greenhouse Gas] emission into environment.
Fig: 1.2
PAGE 4
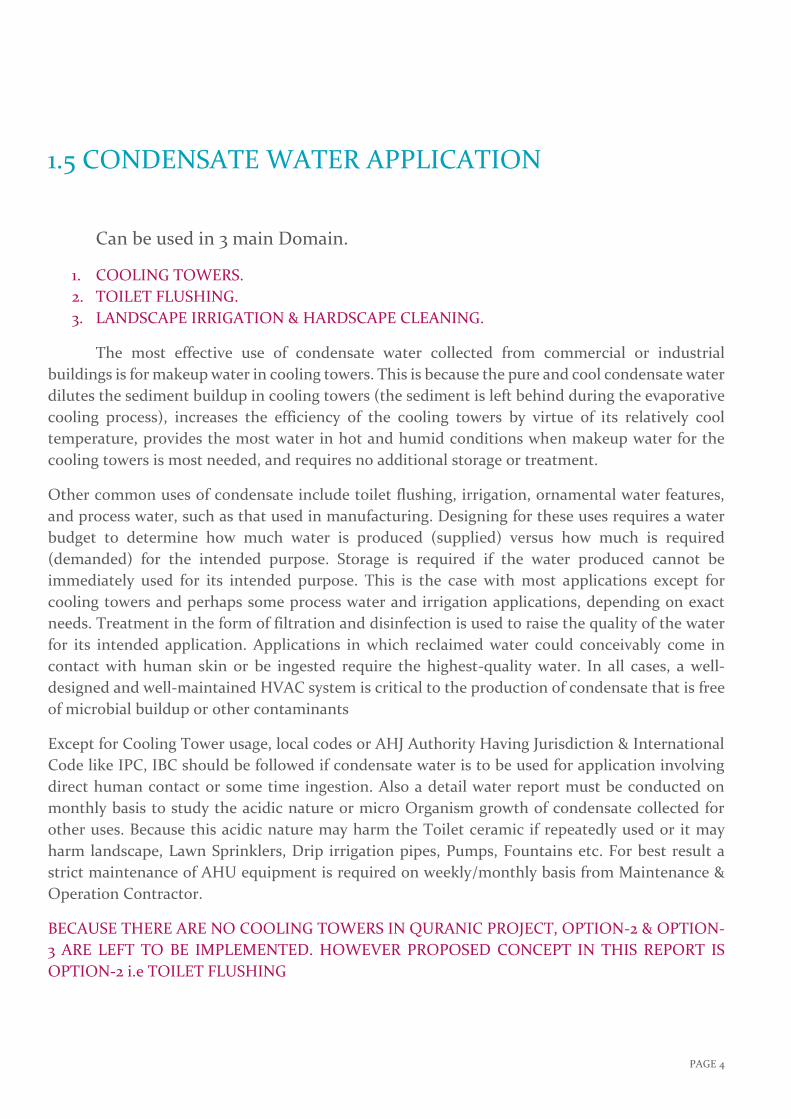
1.5 CONDENSATE WATER APPLICATION
Can be used in 3 main Domain.
1. COOLING TOWERS.
2. TOILET FLUSHING.
3. LANDSCAPE IRRIGATION & HARDSCAPE CLEANING.
The most effective use of condensate water collected from commercial or industrial
buildings is for makeup water in cooling towers. This is because the pure and cool condensate water
dilutes the sediment buildup in cooling towers (the sediment is left behind during the evaporative
cooling process), increases the efficiency of the cooling towers by virtue of its relatively cool
temperature, provides the most water in hot and humid conditions when makeup water for the
cooling towers is most needed, and requires no additional storage or treatment.
Other common uses of condensate include toilet flushing, irrigation, ornamental water features,
and process water, such as that used in manufacturing. Designing for these uses requires a water
budget to determine how much water is produced (supplied) versus how much is required
(demanded) for the intended purpose. Storage is required if the water produced cannot be
immediately used for its intended purpose. This is the case with most applications except for
cooling towers and perhaps some process water and irrigation applications, depending on exact
needs. Treatment in the form of filtration and disinfection is used to raise the quality of the water
for its intended application. Applications in which reclaimed water could conceivably come in
contact with human skin or be ingested require the highest-quality water. In all cases, a well-
designed and well-maintained HVAC system is critical to the production of condensate that is free
of microbial buildup or other contaminants
Except for Cooling Tower usage, local codes or AHJ Authority Having Jurisdiction & International
Code like IPC, IBC should be followed if condensate water is to be used for application involving
direct human contact or some time ingestion. Also a detail water report must be conducted on
monthly basis to study the acidic nature or micro Organism growth of condensate collected for
other uses. Because this acidic nature may harm the Toilet ceramic if repeatedly used or it may
harm landscape, Lawn Sprinklers, Drip irrigation pipes, Pumps, Fountains etc. For best result a
strict maintenance of AHU equipment is required on weekly/monthly basis from Maintenance &
Operation Contractor.
BECAUSE THERE ARE NO COOLING TOWERS IN QURANIC PROJECT, OPTION-2 & OPTION-
3 ARE LEFT TO BE IMPLEMENTED. HOWEVER PROPOSED CONCEPT IN THIS REPORT IS
OPTION-2 i.e TOILET FLUSHING
PAGE 5
1.6 HOW MUCH CONDENSATE WATER CAN QURANIC
INTERMEDIATE SCHOOL GIVE?
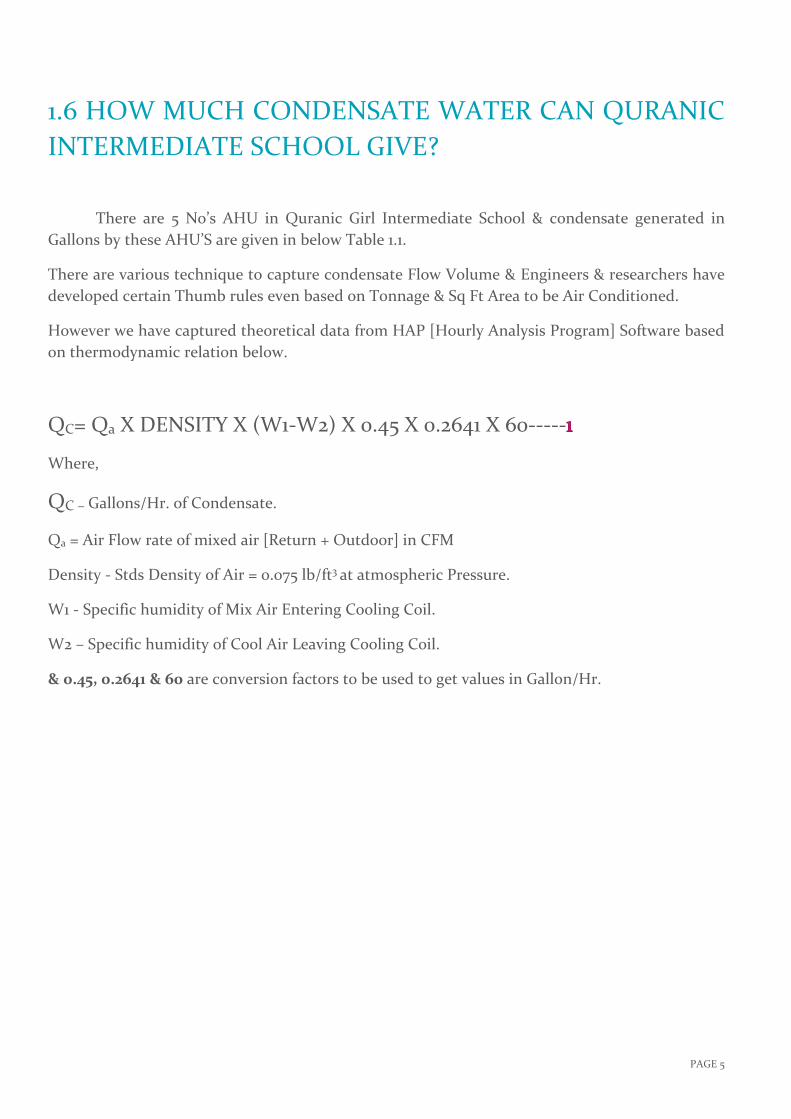
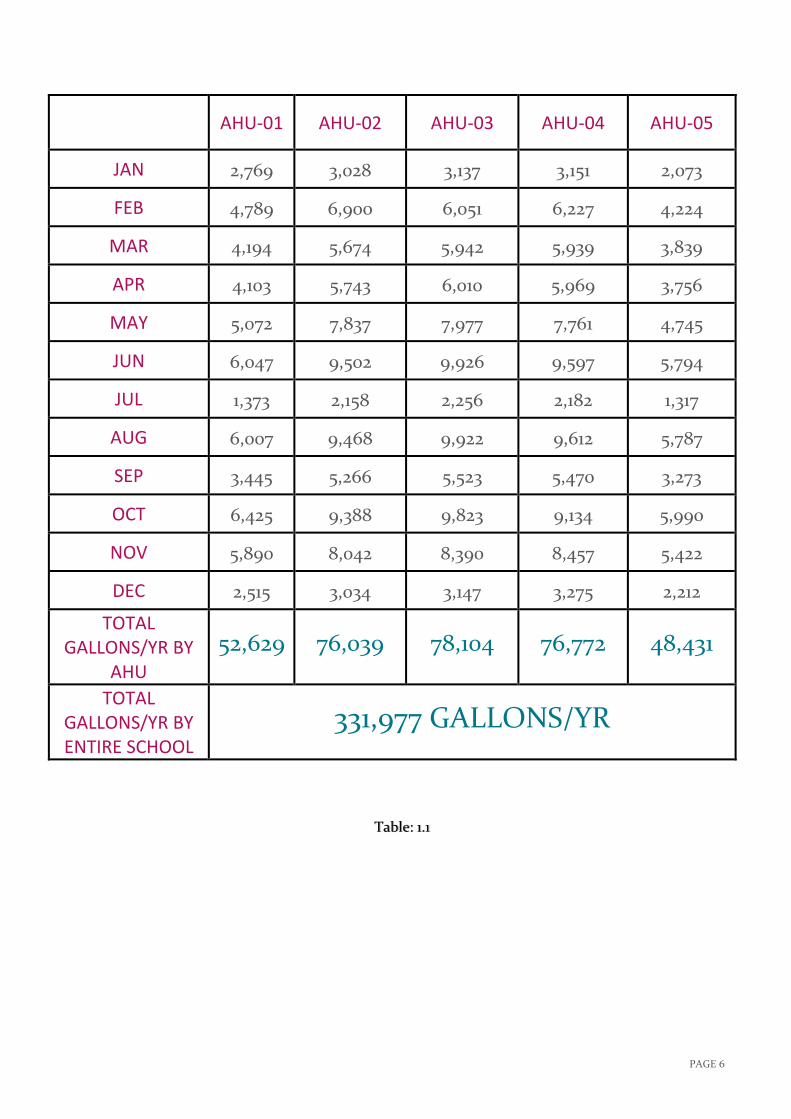
There are 5 No’s AHU in Quranic Girl Intermediate School & condensate generated in
Gallons by these AHU’S are given in below Table 1.1.
There are various technique to capture condensate Flow Volume & Engineers & researchers have
developed certain Thumb rules even based on Tonnage & Sq Ft Area to be Air Conditioned.
However we have captured theoretical data from HAP [Hourly Analysis Program] Software based
on thermodynamic relation below.
QC= Qa X DENSITY X (W1-W2) X 0.45 X 0.2641 X 60-----
Where,
QC – Gallons/Hr. of Condensate.
Qa = Air Flow rate of mixed air [Return + Outdoor] in CFM
Density - Stds Density of Air = 0.075 lb/ft3 at atmospheric Pressure.
W1 - Specific humidity of Mix Air Entering Cooling Coil.
W2 – Specific humidity of Cool Air Leaving Cooling Coil.
& 0.45, 0.2641 & 60 are conversion factors to be used to get values in Gallon/Hr.
PAGE 6
AHU-01 AHU-02 AHU-03 AHU-04 AHU-05
JAN 2,769 3,028 3,137 3,151 2,073
FEB 4,789 6,900 6,051 6,227 4,224
MAR 4,194 5,674 5,942 5,939 3,839
APR 4,103 5,743 6,010 5,969 3,756
MAY 5,072 7,837 7,977 7,761 4,745
JUN 6,047 9,502 9,926 9,597 5,794
JUL 1,373 2,158 2,256 2,182 1,317
AUG 6,007 9,468 9,922 9,612 5,787
SEP 3,445 5,266 5,523 5,470 3,273
OCT 6,425 9,388 9,823 9,134 5,990
NOV 5,890 8,042 8,390 8,457 5,422
DEC 2,515 3,034 3,147 3,275 2,212
TOTAL GALLONS/YR BY
AHU
52,629 76,039 78,104 76,772 48,431
TOTAL GALLONS/YR BY ENTIRE SCHOOL
331,977 GALLONS/YR
Table: 1.1
PAGE 7
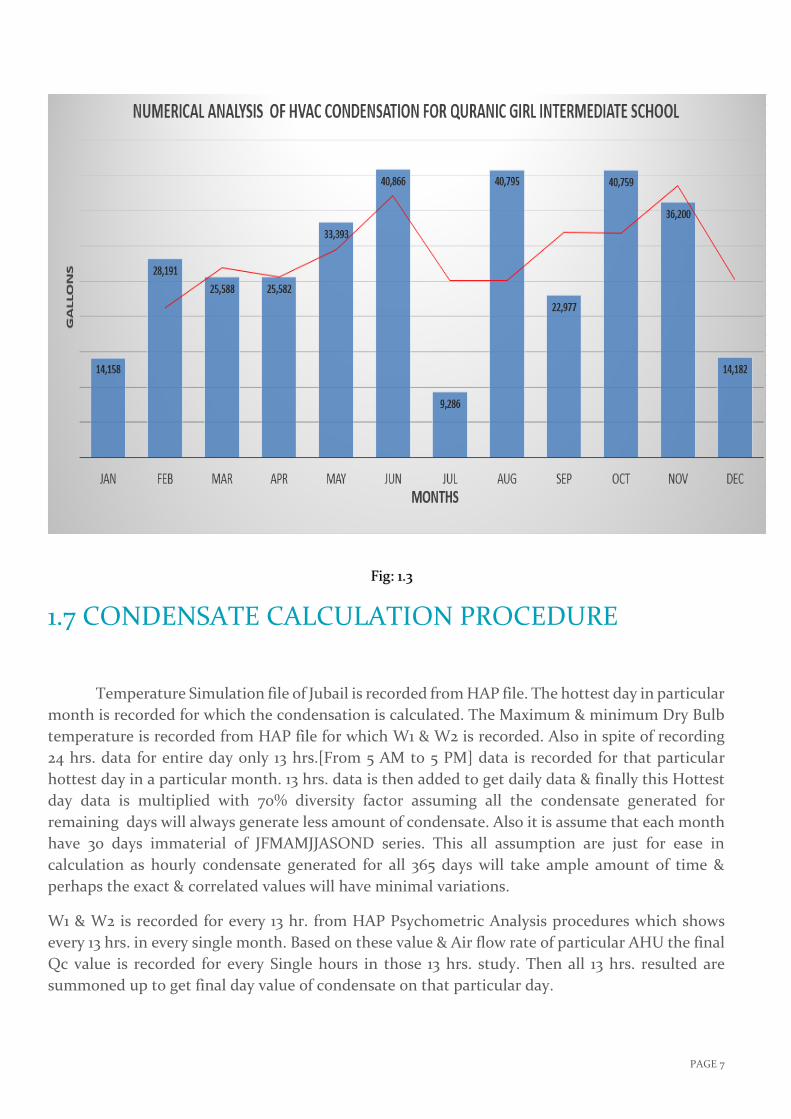
1.7 CONDENSATE CALCULATION PROCEDURE
Temperature Simulation file of Jubail is recorded from HAP file. The hottest day in particular
month is recorded for which the condensation is calculated. The Maximum & minimum Dry Bulb
temperature is recorded from HAP file for which W1 & W2 is recorded. Also in spite of recording
24 hrs. data for entire day only 13 hrs.[From 5 AM to 5 PM] data is recorded for that particular
hottest day in a particular month. 13 hrs. data is then added to get daily data & finally this Hottest
day data is multiplied with 70% diversity factor assuming all the condensate generated for
remaining days will always generate less amount of condensate. Also it is assume that each month
have 30 days immaterial of JFMAMJJASOND series. This all assumption are just for ease in
calculation as hourly condensate generated for all 365 days will take ample amount of time &
perhaps the exact & correlated values will have minimal variations.
W1 & W2 is recorded for every 13 hr. from HAP Psychometric Analysis procedures which shows
every 13 hrs. in every single month. Based on these value & Air flow rate of particular AHU the final
Qc value is recorded for every Single hours in those 13 hrs. study. Then all 13 hrs. resulted are
summoned up to get final day value of condensate on that particular day.
Fig: 1.3
PAGE 8
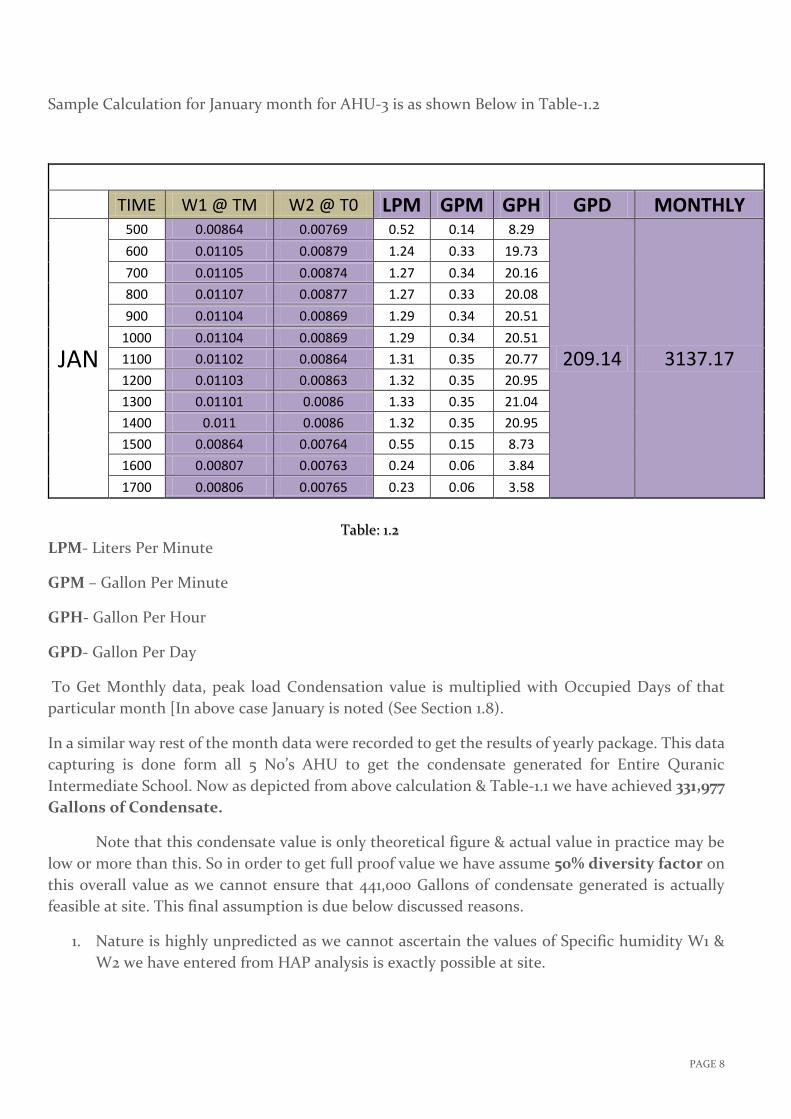
Sample Calculation for January month for AHU-3 is as shown Below in Table-1.2
TIME W1 @ TM W2 @ T0 LPM GPM GPH GPD MONTHLY
JAN
500 0.00864 0.00769 0.52 0.14 8.29
209.14 3137.17
600 0.01105 0.00879 1.24 0.33 19.73
700 0.01105 0.00874 1.27 0.34 20.16
800 0.01107 0.00877 1.27 0.33 20.08
900 0.01104 0.00869 1.29 0.34 20.51
1000 0.01104 0.00869 1.29 0.34 20.51
1100 0.01102 0.00864 1.31 0.35 20.77
1200 0.01103 0.00863 1.32 0.35 20.95
1300 0.01101 0.0086 1.33 0.35 21.04
1400 0.011 0.0086 1.32 0.35 20.95
1500 0.00864 0.00764 0.55 0.15 8.73
1600 0.00807 0.00763 0.24 0.06 3.84
1700 0.00806 0.00765 0.23 0.06 3.58
LPM- Liters Per Minute
GPM – Gallon Per Minute
GPH- Gallon Per Hour
GPD- Gallon Per Day
To Get Monthly data, peak load Condensation value is multiplied with Occupied Days of that
particular month [In above case January is noted (See Section 1.8).
In a similar way rest of the month data were recorded to get the results of yearly package. This data
capturing is done form all 5 No’s AHU to get the condensate generated for Entire Quranic
Intermediate School. Now as depicted from above calculation & Table-1.1 we have achieved 331,977
Gallons of Condensate.
Note that this condensate value is only theoretical figure & actual value in practice may be
low or more than this. So in order to get full proof value we have assume 50% diversity factor on
this overall value as we cannot ensure that 441,000 Gallons of condensate generated is actually
feasible at site. This final assumption is due below discussed reasons.
1. Nature is highly unpredicted as we cannot ascertain the values of Specific humidity W1 &
W2 we have entered from HAP analysis is exactly possible at site.
Table: 1.2
PAGE 9
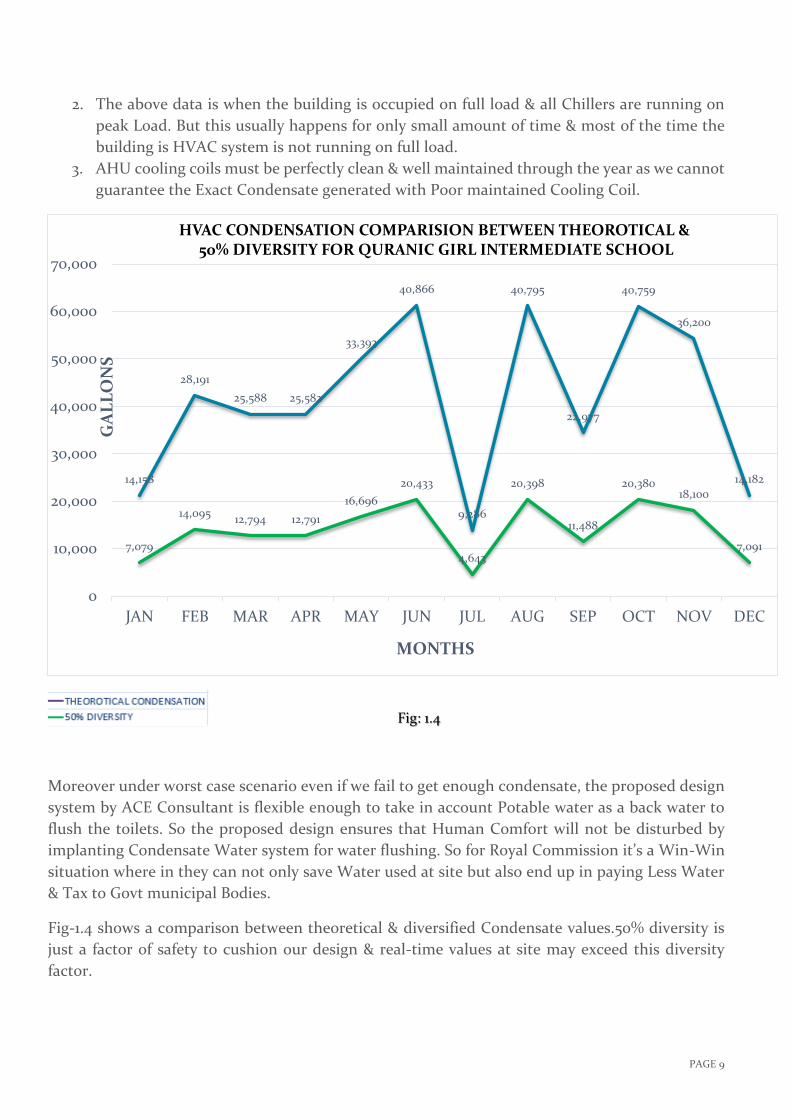
2. The above data is when the building is occupied on full load & all Chillers are running on
peak Load. But this usually happens for only small amount of time & most of the time the
building is HVAC system is not running on full load.
3. AHU cooling coils must be perfectly clean & well maintained through the year as we cannot
guarantee the Exact Condensate generated with Poor maintained Cooling Coil.
Moreover under worst case scenario even if we fail to get enough condensate, the proposed design
system by ACE Consultant is flexible enough to take in account Potable water as a back water to
flush the toilets. So the proposed design ensures that Human Comfort will not be disturbed by
implanting Condensate Water system for water flushing. So for Royal Commission it’s a Win-Win
situation where in they can not only save Water used at site but also end up in paying Less Water
& Tax to Govt municipal Bodies.
Fig-1.4 shows a comparison between theoretical & diversified Condensate values.50% diversity is
just a factor of safety to cushion our design & real-time values at site may exceed this diversity
factor.
7,079
14,09512,794 12,791
16,696
20,433
4,643
20,398
11,488
20,38018,100
7,091
14,158
28,191
25,588 25,582
33,393
40,866
9,286
40,795
22,977
40,759
36,200
14,182
0
10,000
20,000
30,000
40,000
50,000
60,000
70,000
JAN FEB MAR APR MAY JUN JUL AUG SEP OCT NOV DEC
GA
LL
ON
S
MONTHS
HVAC CONDENSATION COMPARISION BETWEEN THEOROTICAL &50% DIVERSITY FOR QURANIC GIRL INTERMEDIATE SCHOOL
Fig: 1.4
PAGE 10
1.8 SCHOOL HOLIDAYS
SEP – 9 TO SEP – 17---------EID AL ADHA HOLIDAYS
DEC-16 TO JAN- 7----------WINTER BREAK
MARCH – 24 TO APRIL – 8-----SPRING BREAK
JUNE – 20 TO JULY – 29 ---------SUMMER BREAK
Above holiday structure is taken from KAUST[King Abdulla University of Science & Technology-
Thuwal]. Although holiday structure of University is followed, this holiday structure is subjected
to change as per Royal Commission School guidelines.
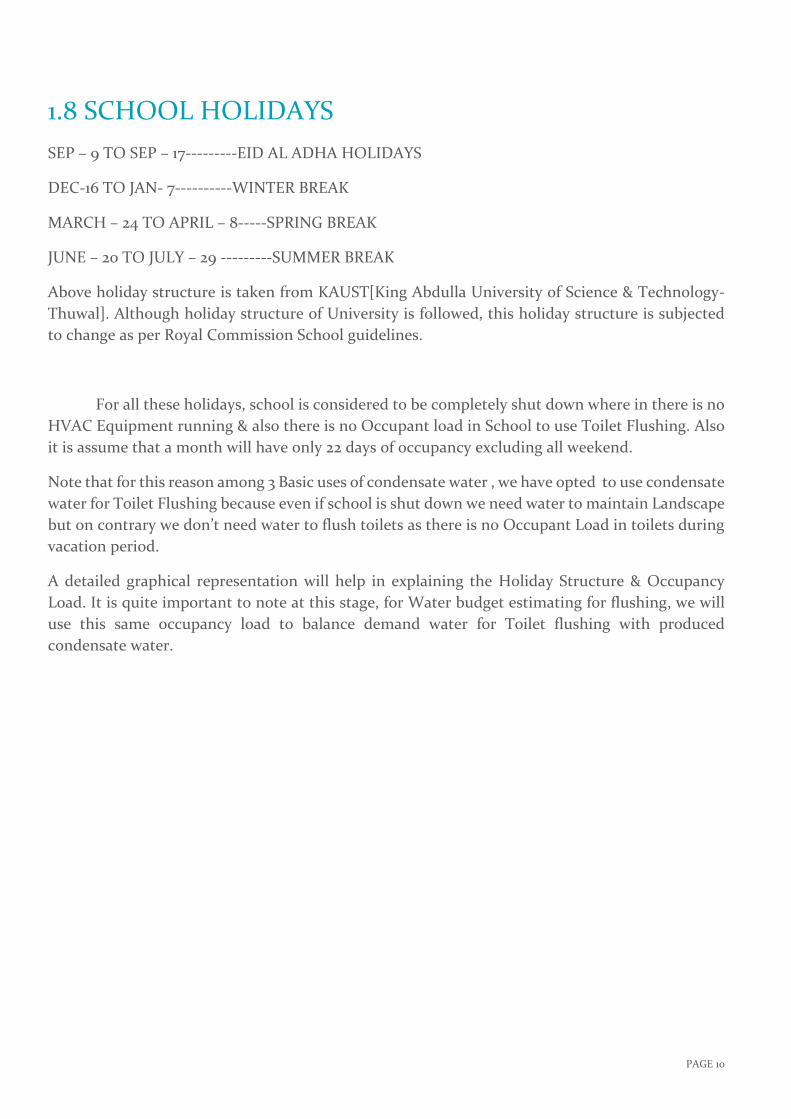
For all these holidays, school is considered to be completely shut down where in there is no
HVAC Equipment running & also there is no Occupant load in School to use Toilet Flushing. Also
it is assume that a month will have only 22 days of occupancy excluding all weekend.
Note that for this reason among 3 Basic uses of condensate water , we have opted to use condensate
water for Toilet Flushing because even if school is shut down we need water to maintain Landscape
but on contrary we don’t need water to flush toilets as there is no Occupant Load in toilets during
vacation period.
A detailed graphical representation will help in explaining the Holiday Structure & Occupancy
Load. It is quite important to note at this stage, for Water budget estimating for flushing, we will
use this same occupancy load to balance demand water for Toilet flushing with produced
condensate water.
PAGE 11
1.9 WATER BUDGET
One of the prime motive to develop water budget is to estimate the Water demand used for
flushing of Water Closet. We are using highly efficient Toilets in this school with flush rate ranging
from 0.8-1.28 Gallons/Flush.
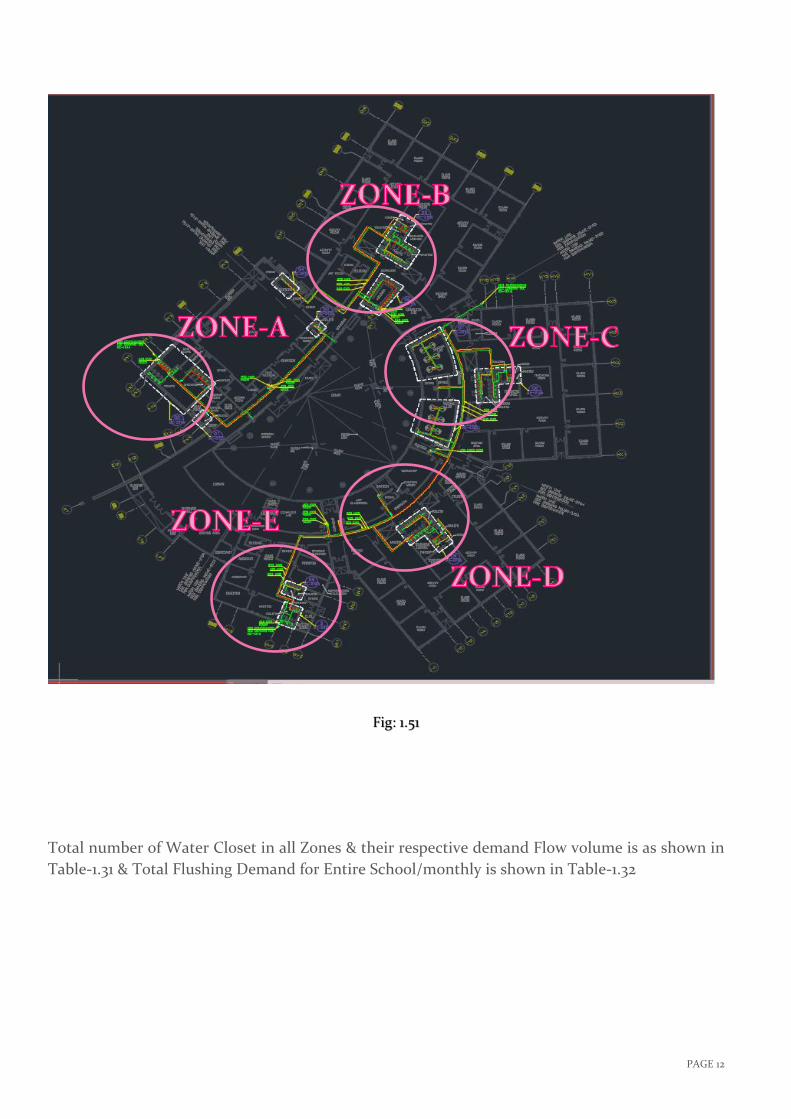
Quranic Girl Intermediate School is divided into 5 Zones for both HVAC & plumbing
Calculations. The detail Sub-Division of these zone is shown below in figure-1.51
Fig: 1.5
PAGE 12
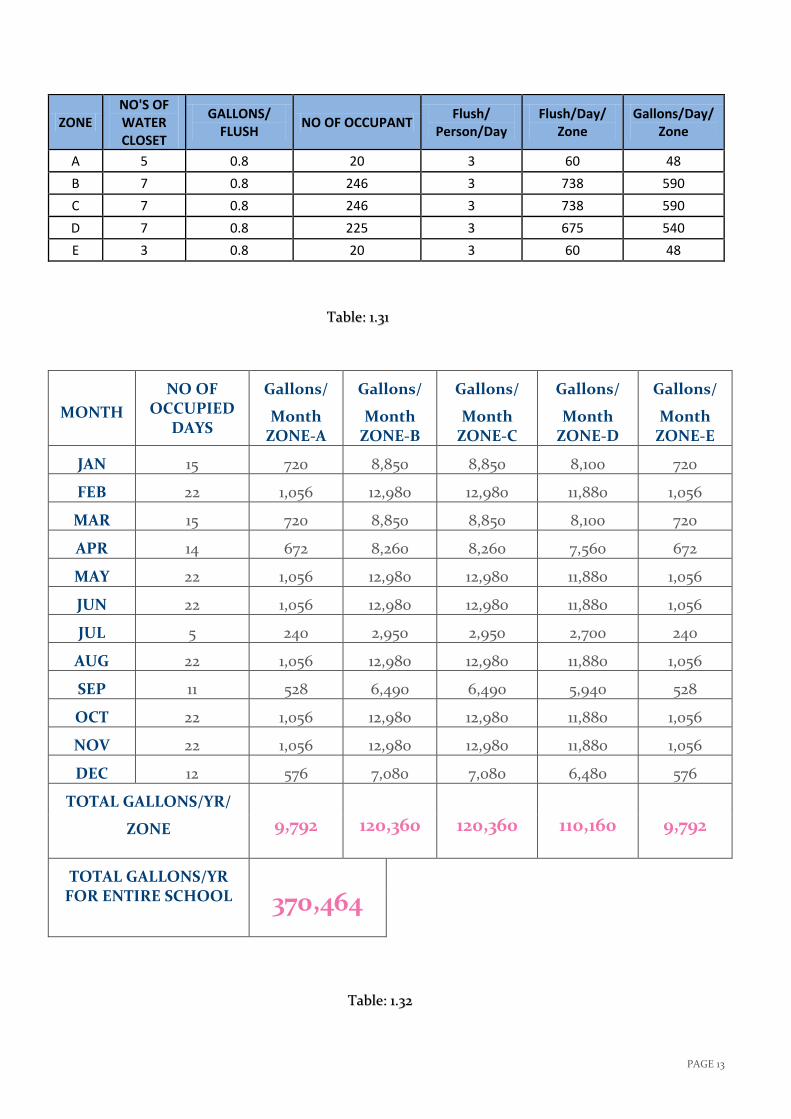
Total number of Water Closet in all Zones & their respective demand Flow volume is as shown in
Table-1.31 & Total Flushing Demand for Entire School/monthly is shown in Table-1.32
Fig: 1.51
PAGE 13
ZONE NO'S OF WATER CLOSET
GALLONS/ FLUSH
NO OF OCCUPANT Flush/
Person/Day Flush/Day/
Zone Gallons/Day/
Zone
A 5 0.8 20 3 60 48
B 7 0.8 246 3 738 590
C 7 0.8 246 3 738 590
D 7 0.8 225 3 675 540
E 3 0.8 20 3 60 48
MONTH
NO OF OCCUPIED
DAYS
Gallons/
Month ZONE-A
Gallons/
Month ZONE-B
Gallons/
Month ZONE-C
Gallons/
Month ZONE-D
Gallons/
Month ZONE-E
JAN 15 720 8,850 8,850 8,100 720
FEB 22 1,056 12,980 12,980 11,880 1,056
MAR 15 720 8,850 8,850 8,100 720
APR 14 672 8,260 8,260 7,560 672
MAY 22 1,056 12,980 12,980 11,880 1,056
JUN 22 1,056 12,980 12,980 11,880 1,056
JUL 5 240 2,950 2,950 2,700 240
AUG 22 1,056 12,980 12,980 11,880 1,056
SEP 11 528 6,490 6,490 5,940 528
OCT 22 1,056 12,980 12,980 11,880 1,056
NOV 22 1,056 12,980 12,980 11,880 1,056
DEC 12 576 7,080 7,080 6,480 576
TOTAL GALLONS/YR/
ZONE 9,792 120,360 120,360 110,160 9,792
TOTAL GALLONS/YR FOR ENTIRE SCHOOL 370,464
Table: 1.31
Table: 1.32
PAGE 14
1.91 DETAIL WATER BUDGET CALCULATION OF ZONE-
A FOR JANUARY MONTH
Assuming 3 flushes/day/student or staff in Girl Intermediate School
Toilet Flush & Gallons used in ZONE-A:
No of occupant = 20
Flush/person/day = 3
Flush/Day/Zone = 20 x 3 = 60
Gallons/Day = 60 x 0.8 = 48
No of Occupied days in January Month = 15 Days
Total Demand Gallons/month = 15 x 48 = 720 Gallons-----------A
Available Gallons of Condensate Generated in January month for this Zone
2769 Gallons-----------------B
Assuming 50% diversity factor as discussed above in section 1.7
Total Supply Condensate = 2769 x 0.5 = 1385---------------C
[Please read Point 1,2,3 in section 1.7 to know more about this Diversity Factor]
From Equ-A & Equ-C it’s clear that Condensate generated is enough to take all the flushes
assumed & still 1385-720= 665 Gallons will be left unused for any uncertain demand.
This explains that condensate generated in January Month for Zone-A in GIRL
INTERMEDIATE SCHOOL IS SUFFICIENT TO FLUSH THESE TOILETS
1.92 DETAIL WATER BUDGET CALCULATION OF ZONE-
B FOR JANUARY MONTH
Assuming 3 flushes/day/student or staff in Girl Intermediate School
Toilet Flush & Gallons used in ZONE-B:
No of occupant = 246
PAGE 15
Flush/person/day = 3
Flush/Day/Zone = 246 x 3 = 738
Gallons/Day = 738 x 0.8 = 591
No of Occupied days in January Month = 15 Days
Total Demand Gallons/month = 15 x 591 = 8856 Gallons-----------A
Available Gallons of Condensate Generated in January month for this Zone
3028 Gallons-----------------B
Assuming 50% diversity factor as discussed above in section 1.7
Total Supply Condensate = 3028 x 0.5 = 1514---------------C
[Please read Point 1,2,3 in section 1.7 to know more about this Diversity Factor]
From Equ-A & Equ-C it’s clear that Condensate generated is not enough to take all the
flushes assumed & still 8856-1328= 7528 Gallons will be additional demand.
This explains that condensate generated in January Month for Zone-B in GIRL
INTERMEDIATE SCHOOL IS NOT SUFFICIENT TO FLUSH THESE TOILETS
1.93 DETAIL WATER BUDGET CALCULATION OF ZONE-
C FOR JANUARY MONTH
Assuming 3 flushes/day/student or staff in Girl Intermediate School
Toilet Flush & Gallons used in ZONE-C:
No of occupant = 246
Flush/person/day = 3
Flush/Day/Zone = 246 x 3 = 738
Gallons/Day = 738 x 0.8 = 591
No of Occupied days in January Month = 15 Days
Total Demand Gallons/month = 15 x 591 = 8856 Gallons-----------A
PAGE 16
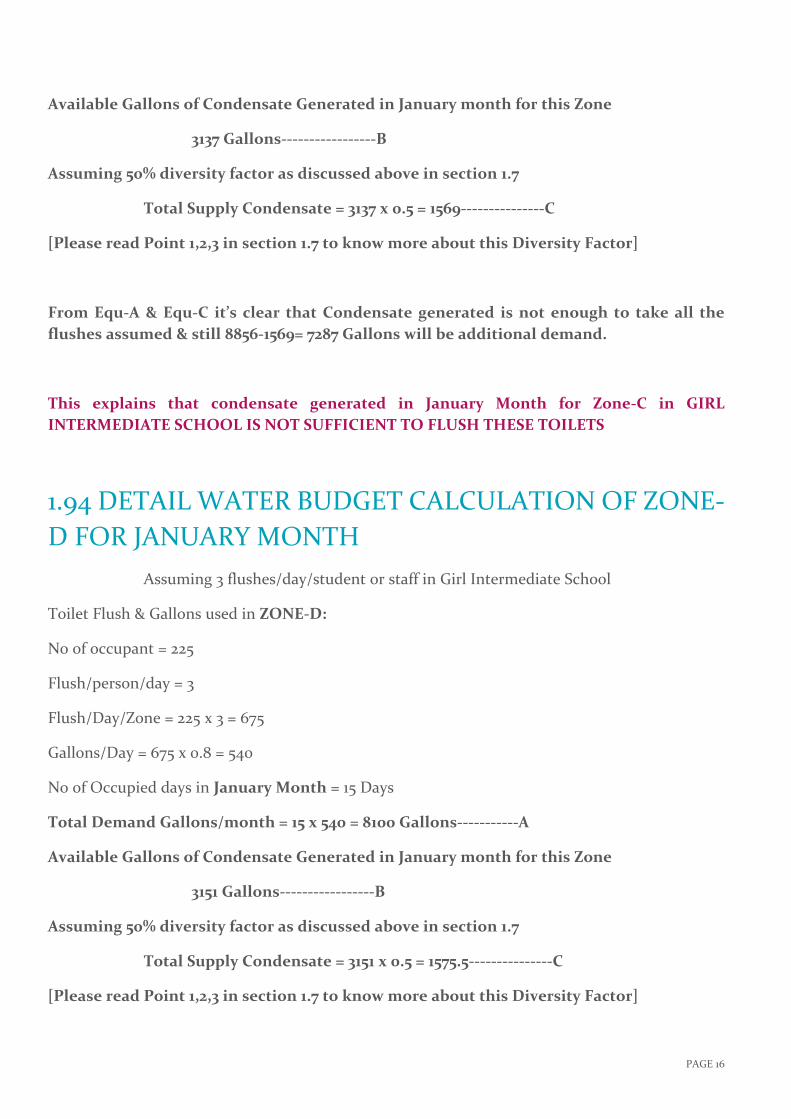
Available Gallons of Condensate Generated in January month for this Zone
3137 Gallons-----------------B
Assuming 50% diversity factor as discussed above in section 1.7
Total Supply Condensate = 3137 x 0.5 = 1569---------------C
[Please read Point 1,2,3 in section 1.7 to know more about this Diversity Factor]
From Equ-A & Equ-C it’s clear that Condensate generated is not enough to take all the
flushes assumed & still 8856-1569= 7287 Gallons will be additional demand.
This explains that condensate generated in January Month for Zone-C in GIRL
INTERMEDIATE SCHOOL IS NOT SUFFICIENT TO FLUSH THESE TOILETS
1.94 DETAIL WATER BUDGET CALCULATION OF ZONE-
D FOR JANUARY MONTH
Assuming 3 flushes/day/student or staff in Girl Intermediate School
Toilet Flush & Gallons used in ZONE-D:
No of occupant = 225
Flush/person/day = 3
Flush/Day/Zone = 225 x 3 = 675
Gallons/Day = 675 x 0.8 = 540
No of Occupied days in January Month = 15 Days
Total Demand Gallons/month = 15 x 540 = 8100 Gallons-----------A
Available Gallons of Condensate Generated in January month for this Zone
3151 Gallons-----------------B
Assuming 50% diversity factor as discussed above in section 1.7
Total Supply Condensate = 3151 x 0.5 = 1575.5---------------C
[Please read Point 1,2,3 in section 1.7 to know more about this Diversity Factor]
PAGE 17
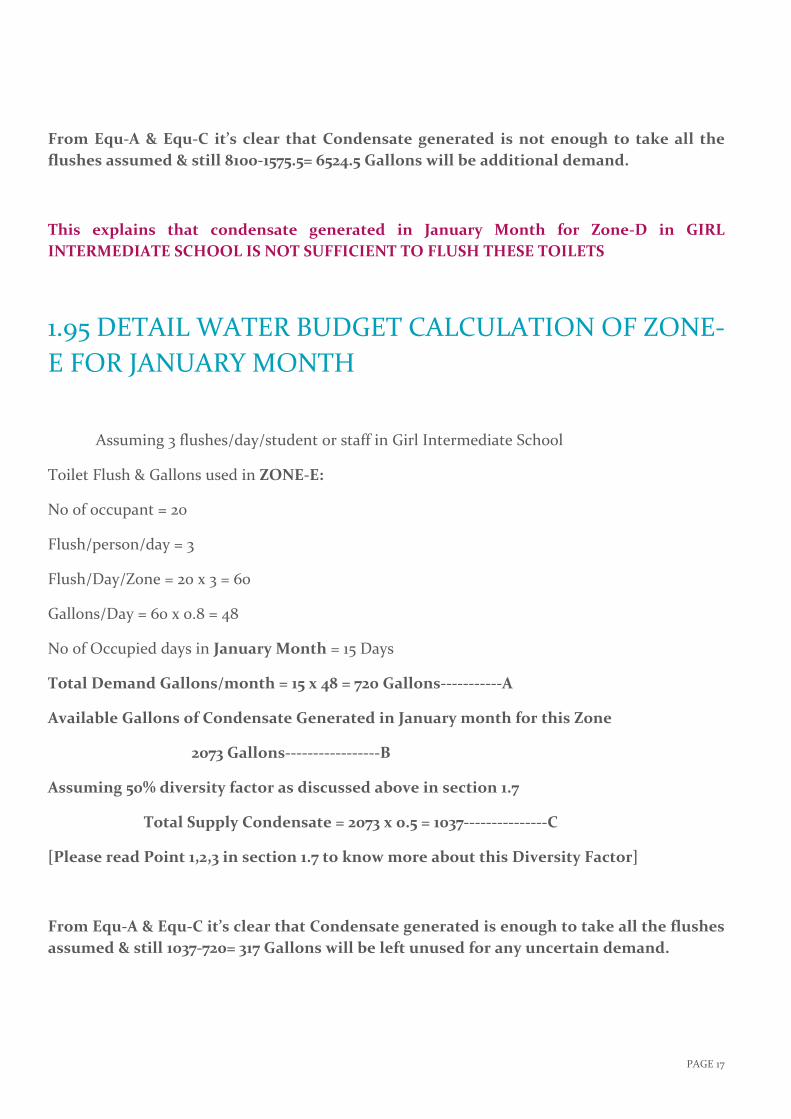
From Equ-A & Equ-C it’s clear that Condensate generated is not enough to take all the
flushes assumed & still 8100-1575.5= 6524.5 Gallons will be additional demand.
This explains that condensate generated in January Month for Zone-D in GIRL
INTERMEDIATE SCHOOL IS NOT SUFFICIENT TO FLUSH THESE TOILETS
1.95 DETAIL WATER BUDGET CALCULATION OF ZONE-
E FOR JANUARY MONTH
Assuming 3 flushes/day/student or staff in Girl Intermediate School
Toilet Flush & Gallons used in ZONE-E:
No of occupant = 20
Flush/person/day = 3
Flush/Day/Zone = 20 x 3 = 60
Gallons/Day = 60 x 0.8 = 48
No of Occupied days in January Month = 15 Days
Total Demand Gallons/month = 15 x 48 = 720 Gallons-----------A
Available Gallons of Condensate Generated in January month for this Zone
2073 Gallons-----------------B
Assuming 50% diversity factor as discussed above in section 1.7
Total Supply Condensate = 2073 x 0.5 = 1037---------------C
[Please read Point 1,2,3 in section 1.7 to know more about this Diversity Factor]
From Equ-A & Equ-C it’s clear that Condensate generated is enough to take all the flushes
assumed & still 1037-720= 317 Gallons will be left unused for any uncertain demand.
PAGE 18
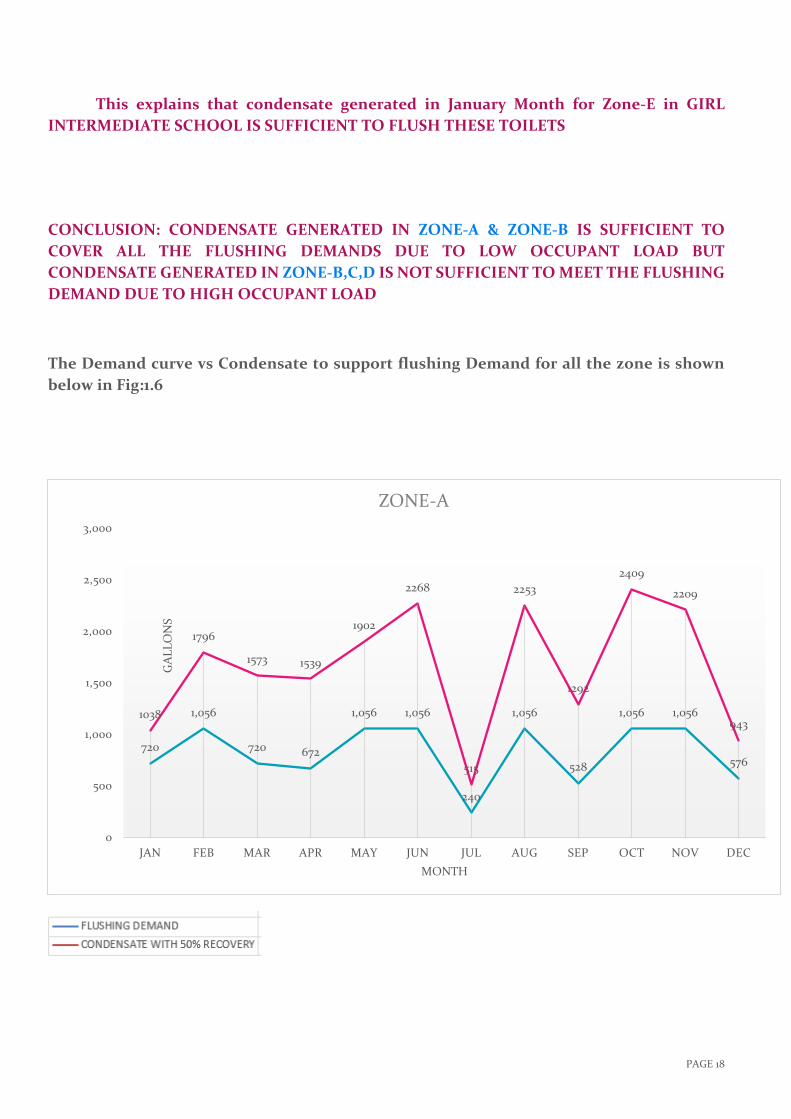
This explains that condensate generated in January Month for Zone-E in GIRL
INTERMEDIATE SCHOOL IS SUFFICIENT TO FLUSH THESE TOILETS
CONCLUSION: CONDENSATE GENERATED IN ZONE-A & ZONE-B IS SUFFICIENT TO
COVER ALL THE FLUSHING DEMANDS DUE TO LOW OCCUPANT LOAD BUT
CONDENSATE GENERATED IN ZONE-B,C,D IS NOT SUFFICIENT TO MEET THE FLUSHING
DEMAND DUE TO HIGH OCCUPANT LOAD
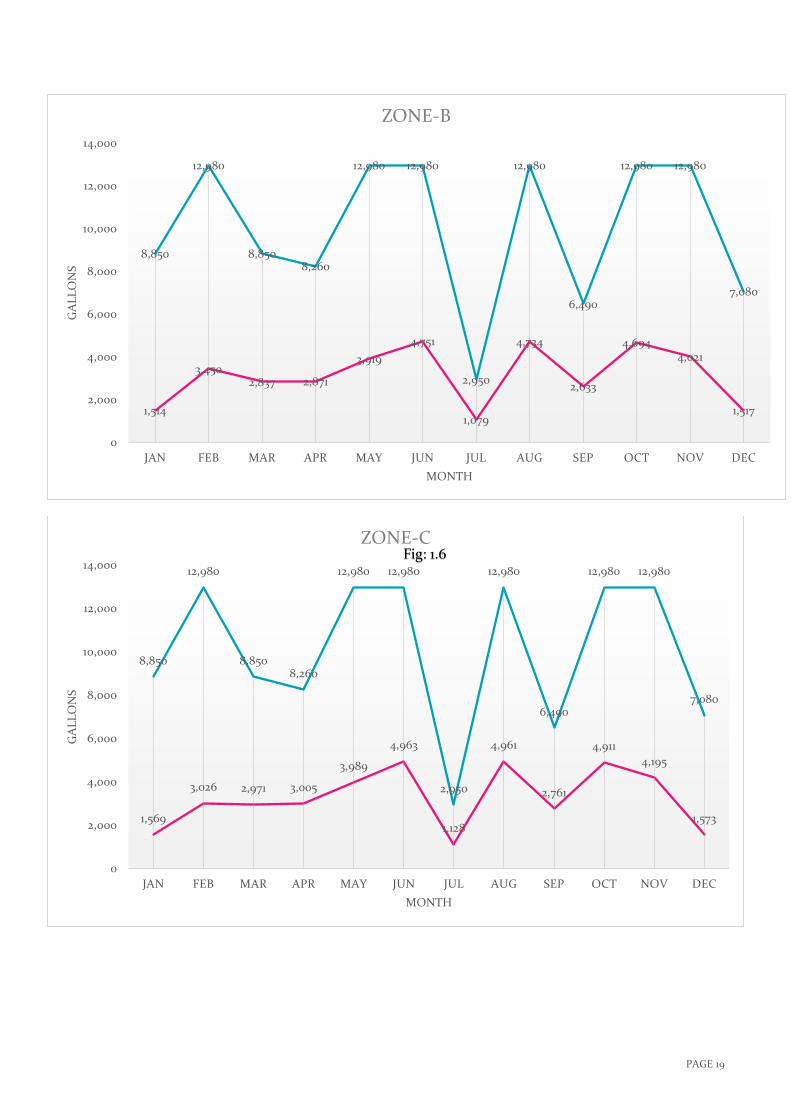
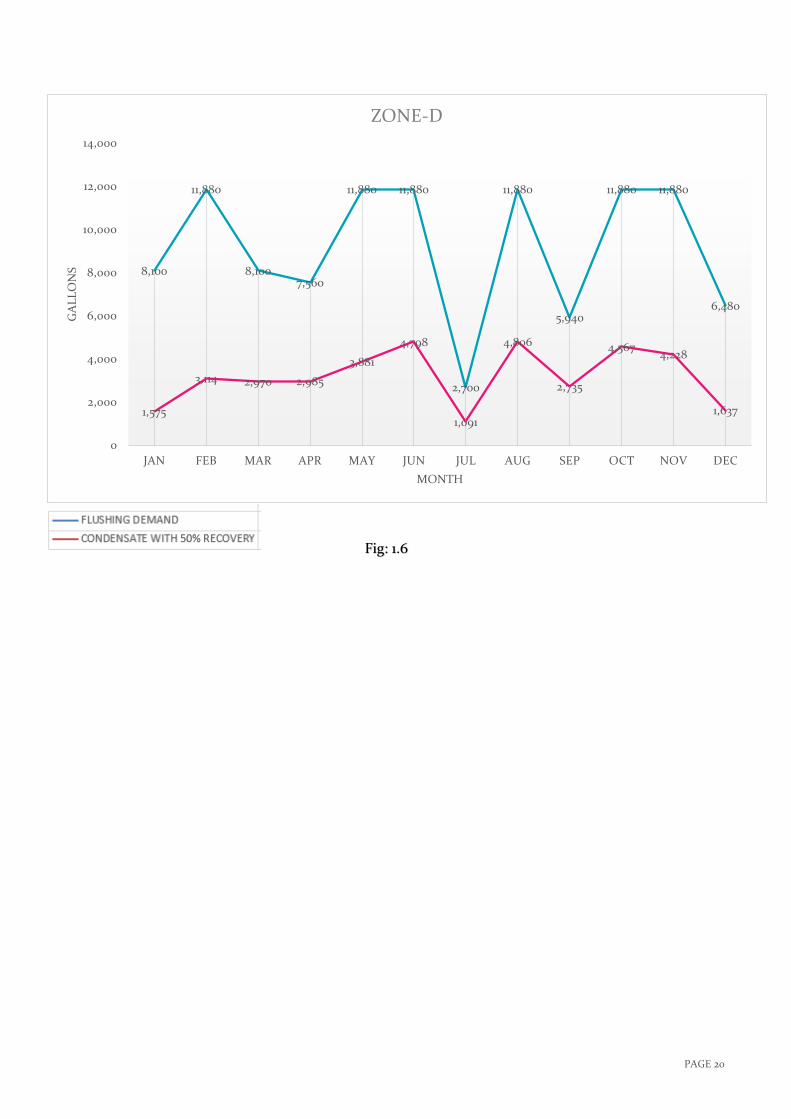
The Demand curve vs Condensate to support flushing Demand for all the zone is shown
below in Fig:1.6
720
1,056
720 672
1,056 1,056
240
1,056
528
1,056 1,056
576
1038
1796
1573 1539
1902
2268
515
2253
1292
2409
2209
943
0
500
1,000
1,500
2,000
2,500
3,000
JAN FEB MAR APR MAY JUN JUL AUG SEP OCT NOV DEC
GA
LL
ON
S
MONTH
ZONE-A
PAGE 19
8,850
12,980
8,8508,260
12,980 12,980
2,950
12,980
6,490
12,980 12,980
7,080
1,514
3,4502,837 2,871
3,919
4,751
1,079
4,734
2,633
4,6944,021
1,517
0
2,000
4,000
6,000
8,000
10,000
12,000
14,000
JAN FEB MAR APR MAY JUN JUL AUG SEP OCT NOV DEC
GA
LL
ON
S
MONTH
ZONE-B
8,850
12,980
8,8508,260
12,980 12,980
2,950
12,980
6,490
12,980 12,980
7,080
1,569
3,026 2,971 3,005
3,989
4,963
1,128
4,961
2,761
4,911
4,195
1,573
0
2,000
4,000
6,000
8,000
10,000
12,000
14,000
JAN FEB MAR APR MAY JUN JUL AUG SEP OCT NOV DEC
GA
LL
ON
S
MONTH
ZONE-CFig: 1.6
PAGE 20
8,100
11,880
8,1007,560
11,880 11,880
2,700
11,880
5,940
11,880 11,880
6,480
1,575
3,114 2,970 2,985
3,881
4,798
1,091
4,806
2,735
4,5674,228
1,637
0
2,000
4,000
6,000
8,000
10,000
12,000
14,000
JAN FEB MAR APR MAY JUN JUL AUG SEP OCT NOV DEC
GA
LL
ON
S
MONTH
ZONE-D
Fig: 1.6
PAGE 21
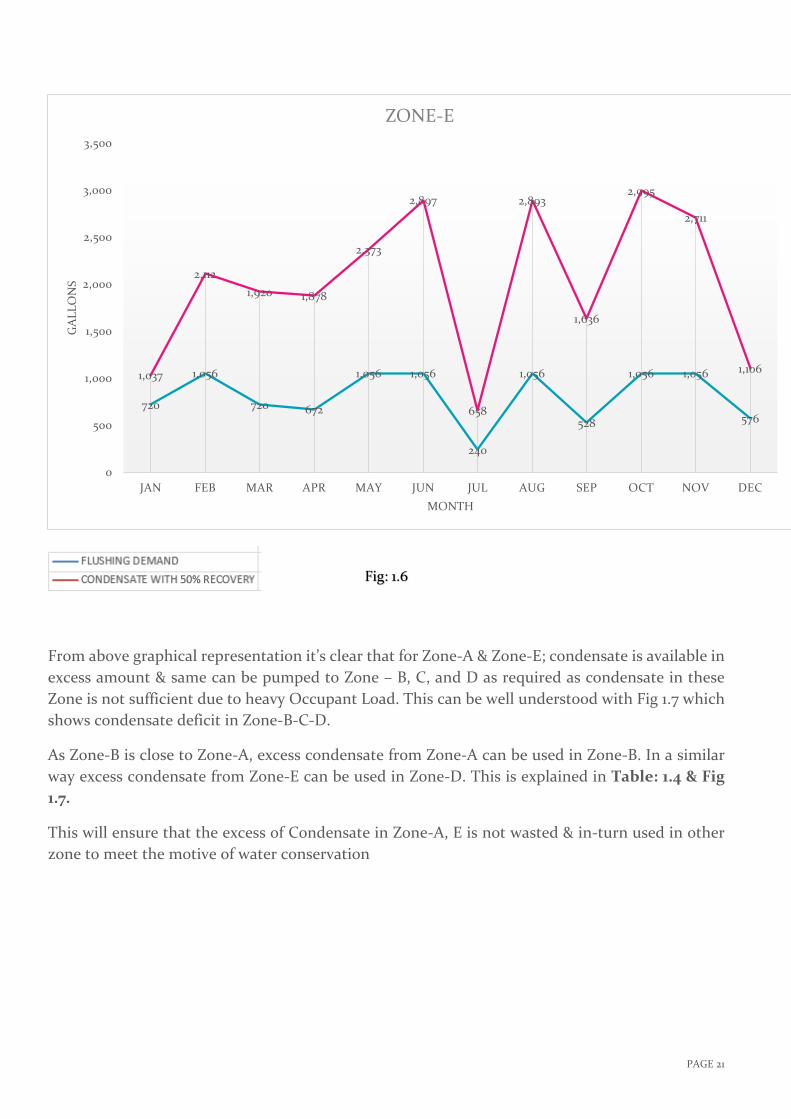
From above graphical representation it’s clear that for Zone-A & Zone-E; condensate is available in
excess amount & same can be pumped to Zone – B, C, and D as required as condensate in these
Zone is not sufficient due to heavy Occupant Load. This can be well understood with Fig 1.7 which
shows condensate deficit in Zone-B-C-D.
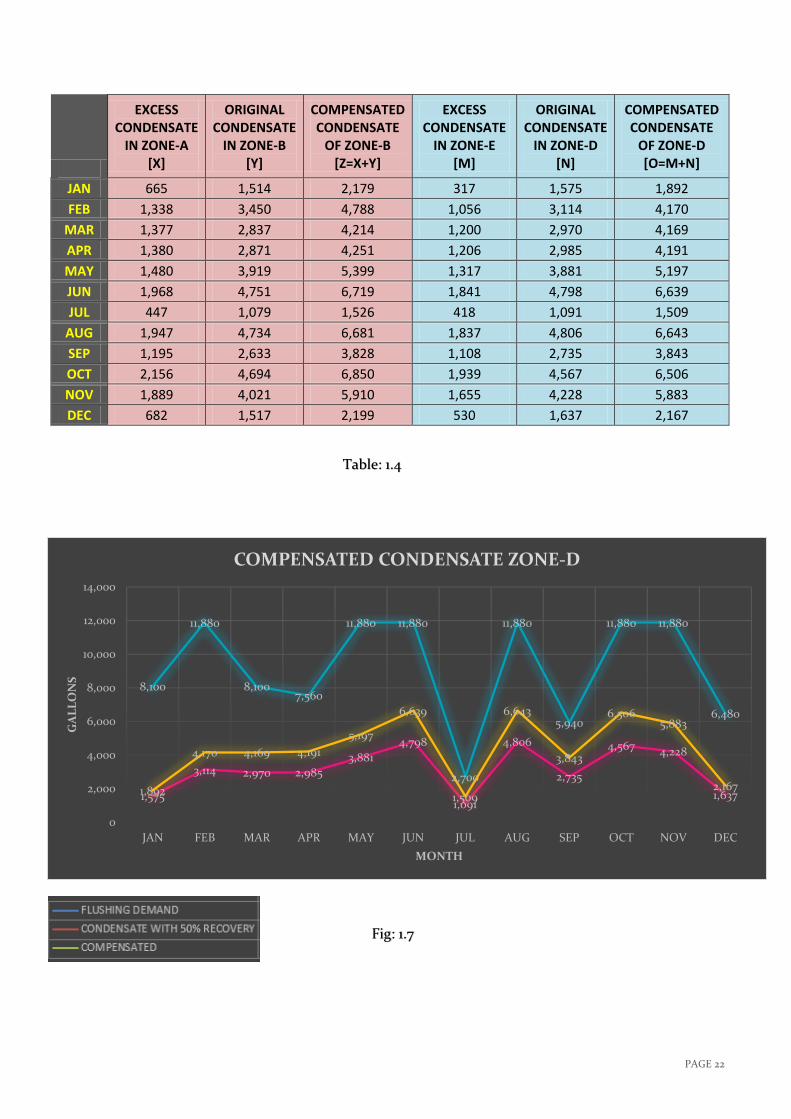
As Zone-B is close to Zone-A, excess condensate from Zone-A can be used in Zone-B. In a similar
way excess condensate from Zone-E can be used in Zone-D. This is explained in Table: 1.4 & Fig
1.7.
This will ensure that the excess of Condensate in Zone-A, E is not wasted & in-turn used in other
zone to meet the motive of water conservation
720
1,056
720 672
1,056 1,056
240
1,056
528
1,056 1,056
576
1,037
2,112
1,920 1,878
2,373
2,897
658
2,893
1,636
2,995
2,711
1,106
0
500
1,000
1,500
2,000
2,500
3,000
3,500
JAN FEB MAR APR MAY JUN JUL AUG SEP OCT NOV DEC
GA
LL
ON
S
MONTH
ZONE-E
Fig: 1.6
PAGE 22
EXCESS CONDENSATE
IN ZONE-A [X]
ORIGINAL CONDENSATE
IN ZONE-B [Y]
COMPENSATED CONDENSATE
OF ZONE-B [Z=X+Y]
EXCESS CONDENSATE
IN ZONE-E [M]
ORIGINAL CONDENSATE
IN ZONE-D [N]
COMPENSATED CONDENSATE
OF ZONE-D [O=M+N]
JAN 665 1,514 2,179 317 1,575 1,892
FEB 1,338 3,450 4,788 1,056 3,114 4,170
MAR 1,377 2,837 4,214 1,200 2,970 4,169
APR 1,380 2,871 4,251 1,206 2,985 4,191
MAY 1,480 3,919 5,399 1,317 3,881 5,197
JUN 1,968 4,751 6,719 1,841 4,798 6,639
JUL 447 1,079 1,526 418 1,091 1,509
AUG 1,947 4,734 6,681 1,837 4,806 6,643
SEP 1,195 2,633 3,828 1,108 2,735 3,843
OCT 2,156 4,694 6,850 1,939 4,567 6,506
NOV 1,889 4,021 5,910 1,655 4,228 5,883
DEC 682 1,517 2,199 530 1,637 2,167
8,100
11,880
8,1007,560
11,880 11,880
2,700
11,880
5,940
11,880 11,880
6,480
1,575
3,114 2,970 2,985
3,881
4,798
1,091
4,806
2,735
4,567 4,228
1,6371,892
4,170 4,169 4,191
5,197
6,639
1,509
6,643
3,843
6,5065,883
2,167
0
2,000
4,000
6,000
8,000
10,000
12,000
14,000
JAN FEB MAR APR MAY JUN JUL AUG SEP OCT NOV DEC
GA
LL
ON
S
MONTH
COMPENSATED CONDENSATE ZONE-D
Table: 1.4
Fig: 1.7
PAGE 23
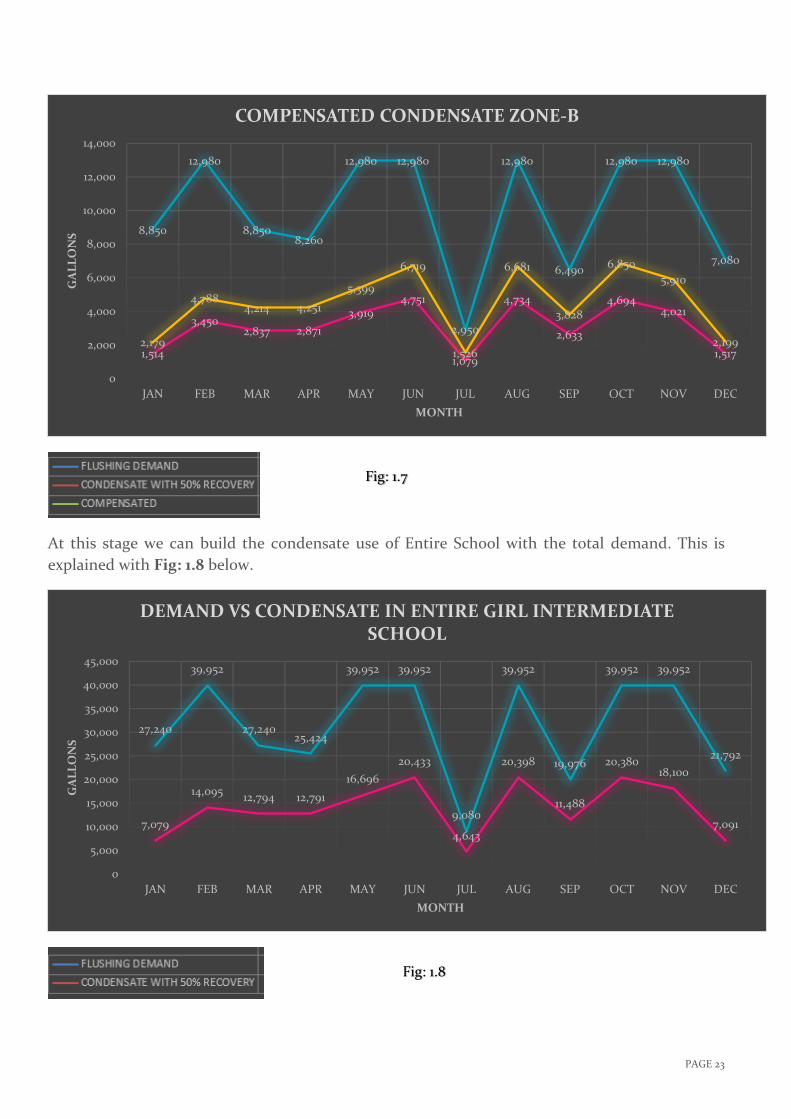
At this stage we can build the condensate use of Entire School with the total demand. This is
explained with Fig: 1.8 below.
8,850
12,980
8,8508,260
12,980 12,980
2,950
12,980
6,490
12,980 12,980
7,080
1,514
3,4502,837 2,871
3,9194,751
1,079
4,734
2,633
4,6944,021
1,5172,179
4,7884,214 4,251
5,399
6,719
1,526
6,681
3,828
6,850
5,910
2,199
0
2,000
4,000
6,000
8,000
10,000
12,000
14,000
JAN FEB MAR APR MAY JUN JUL AUG SEP OCT NOV DEC
GA
LL
ON
S
MONTH
COMPENSATED CONDENSATE ZONE-B
27,240
39,952
27,24025,424
39,952 39,952
9,080
39,952
19,976
39,952 39,952
21,792
7,079
14,09512,794 12,791
16,696
20,433
4,643
20,398
11,488
20,38018,100
7,091
0
5,000
10,000
15,000
20,000
25,000
30,000
35,000
40,000
45,000
JAN FEB MAR APR MAY JUN JUL AUG SEP OCT NOV DEC
GA
LL
ON
S
MONTH
DEMAND VS CONDENSATE IN ENTIRE GIRL INTERMEDIATE SCHOOL
Fig: 1.7
Fig: 1.8
PAGE 24
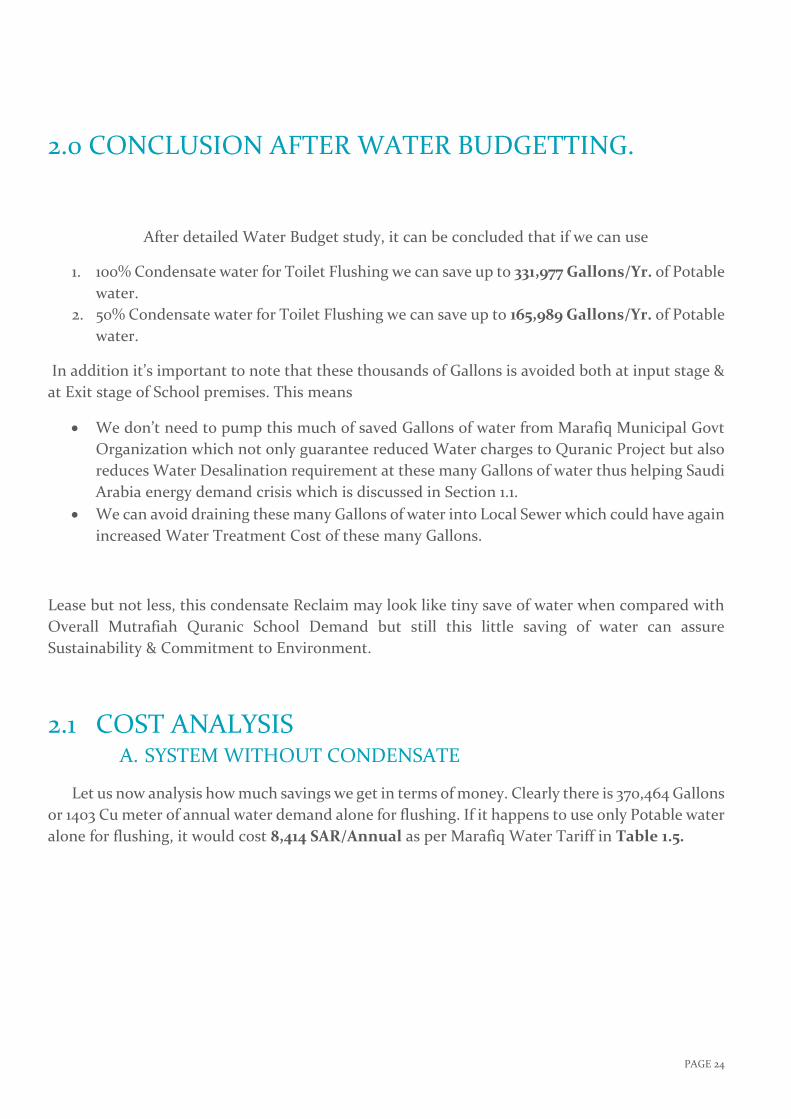
2.0 CONCLUSION AFTER WATER BUDGETTING.
After detailed Water Budget study, it can be concluded that if we can use
1. 100% Condensate water for Toilet Flushing we can save up to 331,977 Gallons/Yr. of Potable
water.
2. 50% Condensate water for Toilet Flushing we can save up to 165,989 Gallons/Yr. of Potable
water.
In addition it’s important to note that these thousands of Gallons is avoided both at input stage &
at Exit stage of School premises. This means
We don’t need to pump this much of saved Gallons of water from Marafiq Municipal Govt
Organization which not only guarantee reduced Water charges to Quranic Project but also
reduces Water Desalination requirement at these many Gallons of water thus helping Saudi
Arabia energy demand crisis which is discussed in Section 1.1.
We can avoid draining these many Gallons of water into Local Sewer which could have again
increased Water Treatment Cost of these many Gallons.
Lease but not less, this condensate Reclaim may look like tiny save of water when compared with
Overall Mutrafiah Quranic School Demand but still this little saving of water can assure
Sustainability & Commitment to Environment.
2.1 COST ANALYSIS A. SYSTEM WITHOUT CONDENSATE
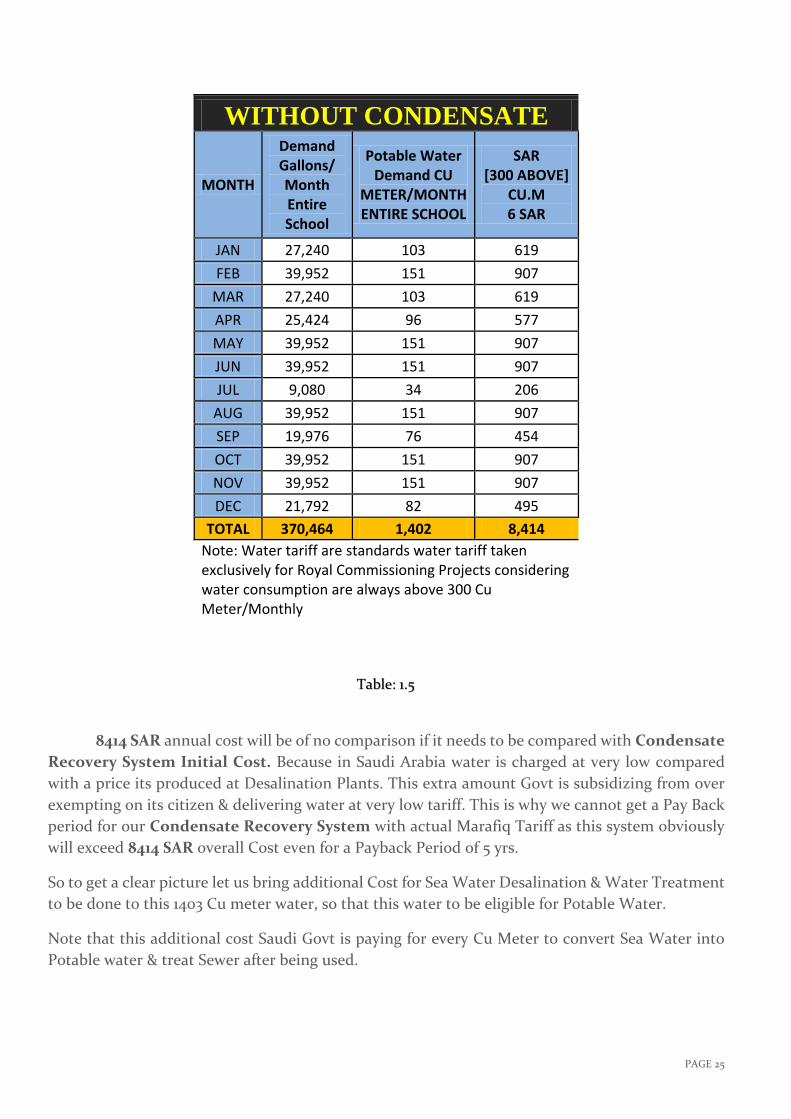
Let us now analysis how much savings we get in terms of money. Clearly there is 370,464 Gallons
or 1403 Cu meter of annual water demand alone for flushing. If it happens to use only Potable water
alone for flushing, it would cost 8,414 SAR/Annual as per Marafiq Water Tariff in Table 1.5.
PAGE 25
WITHOUT CONDENSATE
MONTH
Demand Gallons/ Month Entire School
Potable Water Demand CU
METER/MONTH ENTIRE SCHOOL
SAR [300 ABOVE]
CU.M 6 SAR
JAN 27,240 103 619
FEB 39,952 151 907
MAR 27,240 103 619
APR 25,424 96 577
MAY 39,952 151 907
JUN 39,952 151 907
JUL 9,080 34 206
AUG 39,952 151 907
SEP 19,976 76 454
OCT 39,952 151 907
NOV 39,952 151 907
DEC 21,792 82 495
TOTAL 370,464 1,402 8,414
Note: Water tariff are standards water tariff taken exclusively for Royal Commissioning Projects considering water consumption are always above 300 Cu Meter/Monthly
8414 SAR annual cost will be of no comparison if it needs to be compared with Condensate
Recovery System Initial Cost. Because in Saudi Arabia water is charged at very low compared
with a price its produced at Desalination Plants. This extra amount Govt is subsidizing from over
exempting on its citizen & delivering water at very low tariff. This is why we cannot get a Pay Back
period for our Condensate Recovery System with actual Marafiq Tariff as this system obviously
will exceed 8414 SAR overall Cost even for a Payback Period of 5 yrs.
So to get a clear picture let us bring additional Cost for Sea Water Desalination & Water Treatment
to be done to this 1403 Cu meter water, so that this water to be eligible for Potable Water.
Note that this additional cost Saudi Govt is paying for every Cu Meter to convert Sea Water into
Potable water & treat Sewer after being used.
Table: 1.5
PAGE 26
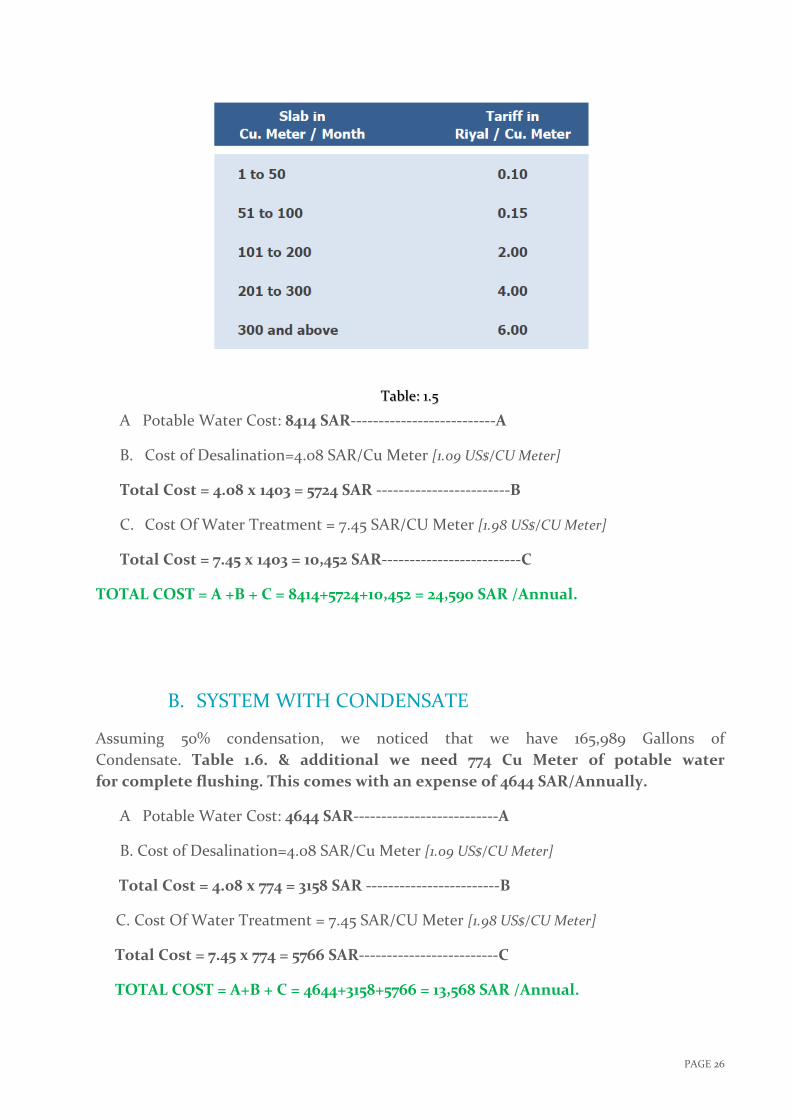
A Potable Water Cost: 8414 SAR--------------------------A
B. Cost of Desalination=4.08 SAR/Cu Meter [1.09 US$/CU Meter]
Total Cost = 4.08 x 1403 = 5724 SAR ------------------------B
C. Cost Of Water Treatment = 7.45 SAR/CU Meter [1.98 US$/CU Meter]
Total Cost = 7.45 x 1403 = 10,452 SAR-------------------------C
TOTAL COST = A +B + C = 8414+5724+10,452 = 24,590 SAR /Annual.
B. SYSTEM WITH CONDENSATE
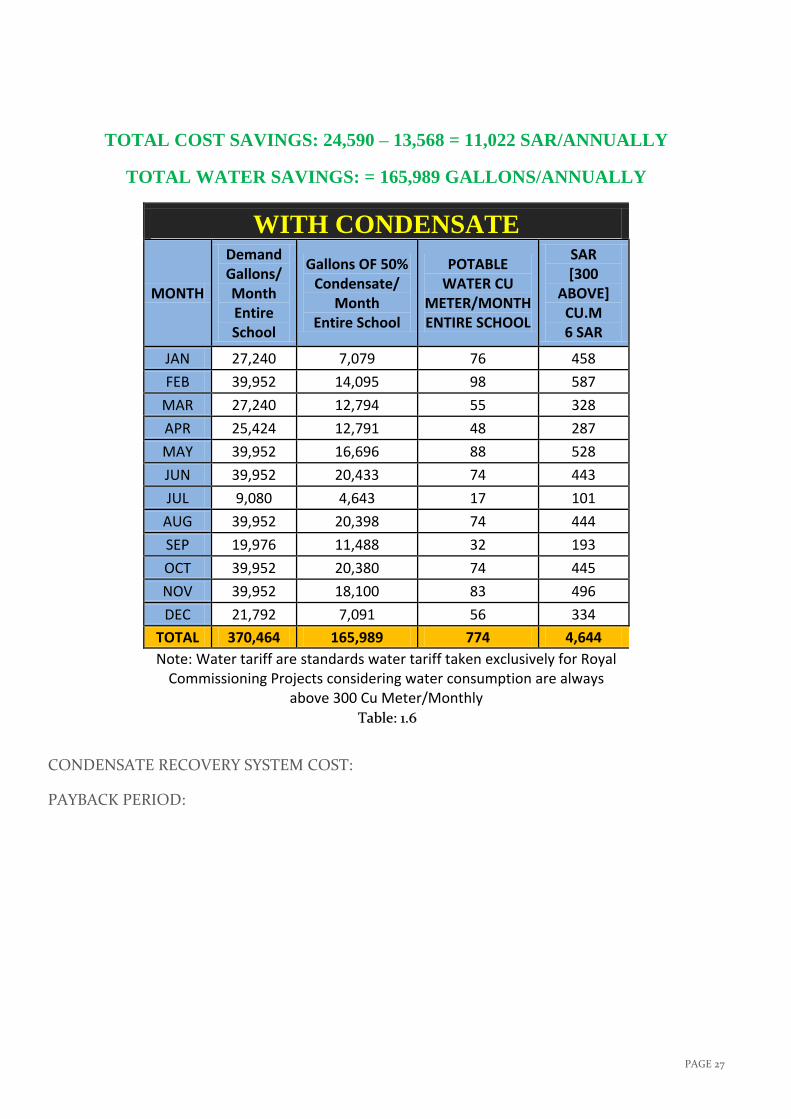
Assuming 50% condensation, we noticed that we have 165,989 Gallons of
Condensate. Table 1.6. & additional we need 774 Cu Meter of potable water
for complete flushing. This comes with an expense of 4644 SAR/Annually.
A Potable Water Cost: 4644 SAR--------------------------A
B. Cost of Desalination=4.08 SAR/Cu Meter [1.09 US$/CU Meter]
Total Cost = 4.08 x 774 = 3158 SAR ------------------------B
C. Cost Of Water Treatment = 7.45 SAR/CU Meter [1.98 US$/CU Meter]
Total Cost = 7.45 x 774 = 5766 SAR-------------------------C
TOTAL COST = A+B + C = 4644+3158+5766 = 13,568 SAR /Annual.
Table: 1.5
PAGE 27
TOTAL COST SAVINGS: 24,590 – 13,568 = 11,022 SAR/ANNUALLY
TOTAL WATER SAVINGS: = 165,989 GALLONS/ANNUALLY
WITH CONDENSATE
MONTH
Demand Gallons/ Month Entire School
Gallons OF 50% Condensate/
Month Entire School
POTABLE WATER CU
METER/MONTH ENTIRE SCHOOL
SAR [300
ABOVE] CU.M 6 SAR
JAN 27,240 7,079 76 458
FEB 39,952 14,095 98 587
MAR 27,240 12,794 55 328
APR 25,424 12,791 48 287
MAY 39,952 16,696 88 528
JUN 39,952 20,433 74 443
JUL 9,080 4,643 17 101
AUG 39,952 20,398 74 444
SEP 19,976 11,488 32 193
OCT 39,952 20,380 74 445
NOV 39,952 18,100 83 496
DEC 21,792 7,091 56 334
TOTAL 370,464 165,989 774 4,644
Note: Water tariff are standards water tariff taken exclusively for Royal Commissioning Projects considering water consumption are always
above 300 Cu Meter/Monthly
CONDENSATE RECOVERY SYSTEM COST:
PAYBACK PERIOD:
Table: 1.6

PAGE 28
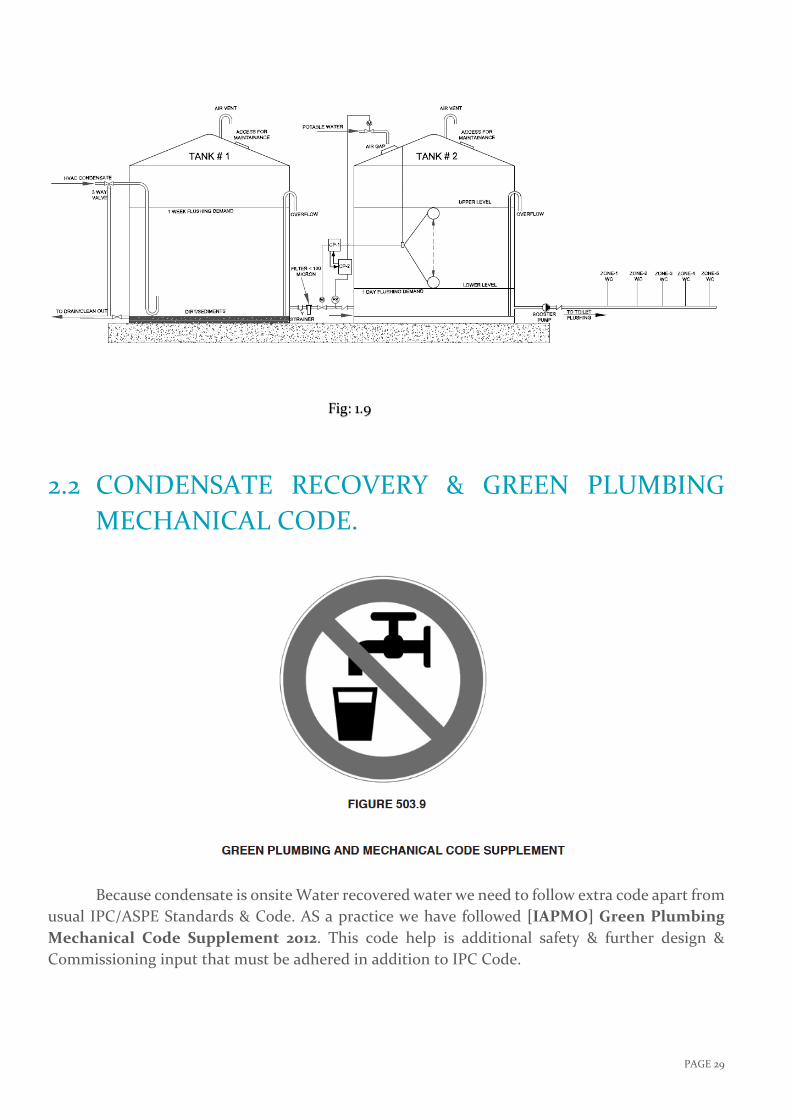
2.2 BASIC DESIGN
Concept of Initial Design is made simple with the use of 2 No’s Condensation Tank. Exact
tank sizing & Pipe Sizing is not done at this stage of design as the whole Condensate Reclaim
Engineering need prior approval from Royal Commissioning.
2 tank concept is used to overcome all the unpredicted condensation thus adding more
safety & reliability. Tank-1 is designed to hold 1 week condensate & Tank-2 is designed to depend
on Tank-1 to meet the Flushing demand. Also 2 or more Zones can be combined to use this Dual
Design concept. Tank-1 can hold 1 week condensate demand to feed the Flushing requirement in
School. Float switch installed in Tank-2 is preset between Upper & Lower layer; where in lower
layer is set for at least 1 day Flushing Demand of Zones involved in that design
Fig-1.9 explain the schematic layout of typical Condensate Collection System.
NOTE:
1. To capture the flow of condensate Water Metering may be required. This will be
mandate if any building is applying for LEED Certification; as per LEED V4 is concerned
Building Level Water Metering is both Pre-requisite & Credit. However in this proposed
designed we have not included any Water meters since Quranic Project didn’t applied
for any LEED certification.
2. It will be an optional step to use water treatment depending on the pH value of the
condensate. If pH reduces drastically then a chlorine Dosing tank along with pH sensor
installed & interlocked with dosing tank may be used. It all depends on pH value of
condensate at the time of Commissioning Phase.
SEQUENCE OF OPERATION
Float switch in Tank-2 after reaching at lower level sends a control signal to Motorized
Valve-1 through Control Logic Panel-1[CP-1]. This will activate the valve to open & condensate
collected in Tank 1 reaches Tank-2. This flow is sensed by Flow-Switch installed & this in turn gives
a Control Logic Signal to Motorized valve-2 to get closed.
If the Motorized Valve-1 open & there is no condensate in Tank 1; then in this case the Flow Switch
will send signal to Motorized Valve-2 to open through Cp-2. This will activate Potable Water Feed
in Tank-1 & once upper level is reached Potable water is stopped.
CP-1 & CP-2 are interlocked to control Potable Water feeding.
PAGE 29
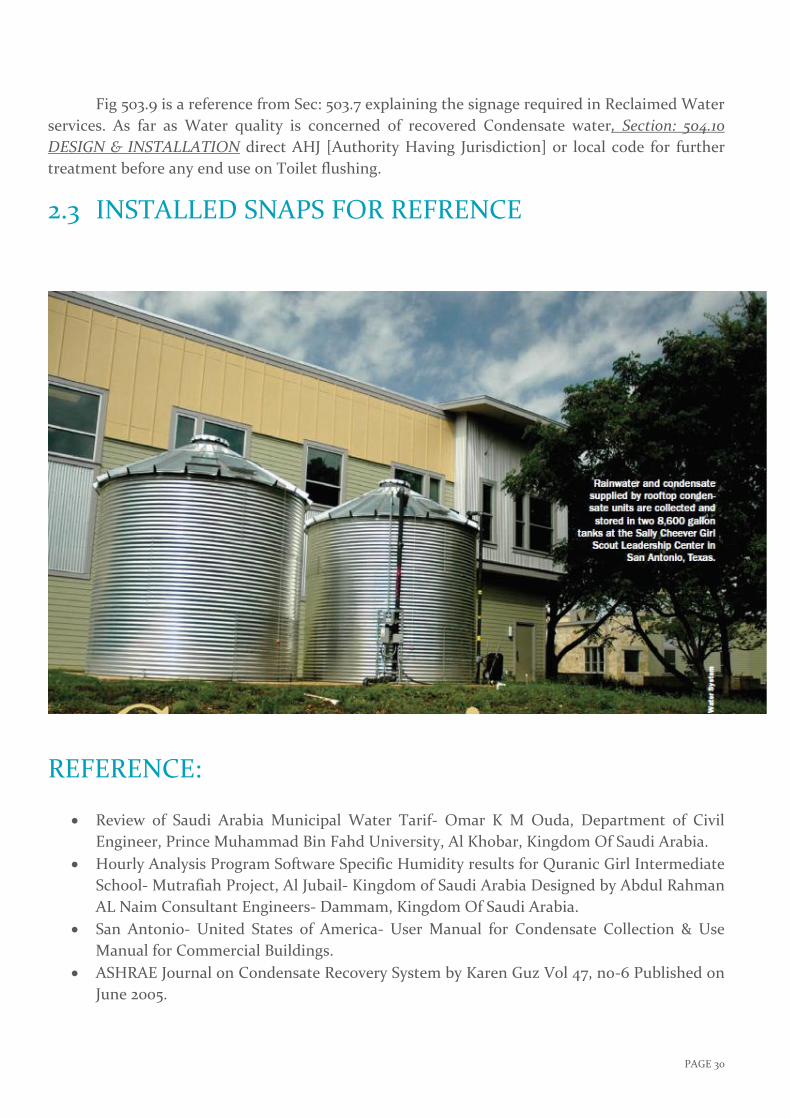
2.2 CONDENSATE RECOVERY & GREEN PLUMBING
MECHANICAL CODE.
Because condensate is onsite Water recovered water we need to follow extra code apart from
usual IPC/ASPE Standards & Code. AS a practice we have followed [IAPMO] Green Plumbing
Mechanical Code Supplement 2012. This code help is additional safety & further design &
Commissioning input that must be adhered in addition to IPC Code.
Fig: 1.9
PAGE 30
Fig 503.9 is a reference from Sec: 503.7 explaining the signage required in Reclaimed Water
services. As far as Water quality is concerned of recovered Condensate water, Section: 504.10
DESIGN & INSTALLATION direct AHJ [Authority Having Jurisdiction] or local code for further
treatment before any end use on Toilet flushing.
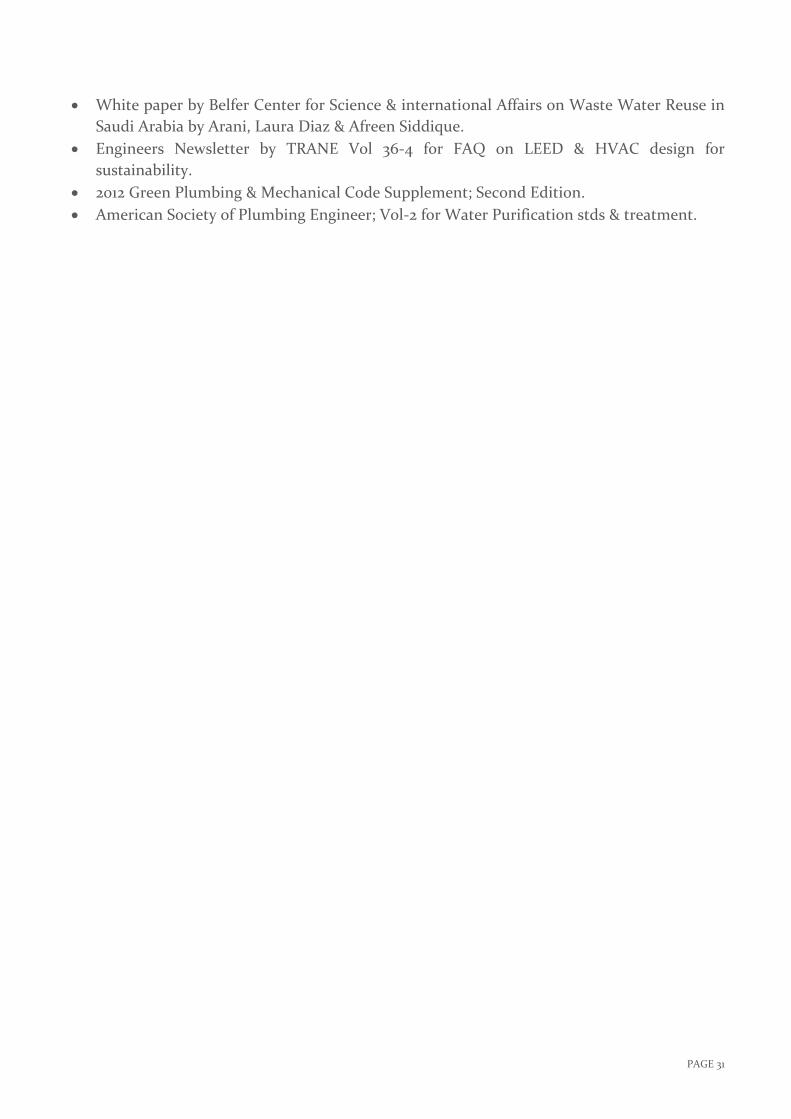
2.3 INSTALLED SNAPS FOR REFRENCE
REFERENCE:
Review of Saudi Arabia Municipal Water Tarif- Omar K M Ouda, Department of Civil
Engineer, Prince Muhammad Bin Fahd University, Al Khobar, Kingdom Of Saudi Arabia.
Hourly Analysis Program Software Specific Humidity results for Quranic Girl Intermediate
School- Mutrafiah Project, Al Jubail- Kingdom of Saudi Arabia Designed by Abdul Rahman
AL Naim Consultant Engineers- Dammam, Kingdom Of Saudi Arabia.
San Antonio- United States of America- User Manual for Condensate Collection & Use
Manual for Commercial Buildings.
ASHRAE Journal on Condensate Recovery System by Karen Guz Vol 47, no-6 Published on
June 2005.
PAGE 31
White paper by Belfer Center for Science & international Affairs on Waste Water Reuse in
Saudi Arabia by Arani, Laura Diaz & Afreen Siddique.
Engineers Newsletter by TRANE Vol 36-4 for FAQ on LEED & HVAC design for
sustainability.
2012 Green Plumbing & Mechanical Code Supplement; Second Edition.
American Society of Plumbing Engineer; Vol-2 for Water Purification stds & treatment.