condensate tank emissions - us epa · pdf filecondensate tank emissions were identified in the...
TRANSCRIPT

1
Condensate Tank Emissions Dale Wells Modeling, Meteorology, and Emission Inventory Unit Technical Services Program Air Pollution Control Division Colorado Department of Public Health and Environment APCD-TS-B1 4300 Cherry Creek Drive South Denver, CO 80246-1530 [email protected] ABSTRACT There is evidence that oil and gas (O&G) volatile organic compound (VOC) emissions in northeastern Colorado are underestimated. The largest O&G source category in the Denver Metro Area & North Front Range 8-hour Ozone Nonattainment Area is condensate tanks. These are the tanks where the condensate is dumped after it comes out of the ground. We have evidence from observations, ambient monitors and inverse photochemical modeling that condensate tanks leak. Most of the emissions are from "flash" events (the sudden release of gas from solution). This occurs when pressurized condensate is dumped into the tank. To account for theses leaks, we assumed 75% of the emissions are sent to a flare for the purposes of our recent modeling exercise. Calculation of controlled emissions (emissions after the control that go to the environment) can be presented as follows: Controlled Emissions = Uncontrolled Emissions x (1 - Control Device Efficiency x Rule Effectiveness x Capture Efficiency). The control device is a flare of 95% efficiency. Rule effectiveness is a measure of how well the rule is enforced. We are using 83%. Capture efficiency is the fraction of emissions going to the control device. The formula therefore becomes: Controlled Emissions = Uncontrolled Emissions x (1-0.95 x 0.83 x 0.75). Controlled emissions increase by a factor of eight but because all condensate tanks are not controlled, overall emissions increase by a factor of about three. Applying the resulting inventory in a photochemical model improved results over earlier models when compared to monitored observations.

2
INTRODUCTION Since 1999 oil and gas production has steadily increased in the northeastern region of Colorado. In 2003, elevated values of 8-hour ozone caused the Denver metro region's three year average to violate the 8-hour ozone National Ambient Air Quality Standard (NAAQS). The area would have been designated as nonattainment in 2004. However, because an Early Action Compact (EAC) was implemented, EPA deferred the nonattainment designation as long as the region continued to meet the terms of the agreement and demonstrated attainment by December 31, 2007. Failure to meet the obligations of the agreement would result in immediate reversion to the traditional nonattainment process. Condensate tank emissions were identified in the EAC inventory as the second largest source of VOC at 143 tons per day (tpd). Condensate tank emissions contributed about 24% of the total anthropogenic emissions, and the next largest source category, on-road vehicles, contributed 30%. The EAC called for a VOC reduction in uncontrolled emissions of 47.5% for both new and existing tanks. This was the single largest VOC reduction for any source category. The area did not attain the standard by the end of 2007, and a full State Implementation Plan (SIP) was required by the EPA. The Denver ozone nonattainment area has nine counties, including the Denver Metropolitan Area and Weld County where most of the oil and gas development in the area occurs. This area is approximately 11,000 square miles, about the size of Massachusetts. 2008 Ozone SIP The 2008 ozone SIP used base data from the year 2006 to project attainment in 2010. On February 13, 2008, the EPA approved revisions to Colorado Regulation No. 7. One of these revisions required a 75% system-wide reduction of condensate tank VOC emissions from new and existing tanks for the 2007 summer ozone season. This mandate was required by May 1, 2007, with a further increased reduction to 78% for the 2012 summer ozone season using technology that could achieve a 95% reduction in VOC emissions. The 2010 emissions inventory estimate was based on the 75% system-wide emission control reduction requirement which includes all tanks owned by a single operator, an idea providing flexibility as to which tanks were controlled by what kind of device (the devise is nearly always a flare with an assumed control efficiency of 95%). Another revision to the SIP further amended Regulation No. 7 to a system-wide reduction of 81% of condensate tank VOC emissions for tanks with emissions of two tons or more per year (tpy) for the 2009 summer ozone season. For 2010 the control increased to 85% and increased again to 90% for 2011. Another of these revisions required the installation and operation of auto-igniting flares on all tanks with emissions of two tons per year effective May 1, 2010. By February 2009, condensate tanks serving newly drilled, re-completed, or stimulated wells had to control emissions during the first 90 days of production. After that, the control may be removed if emissions do not exceed, or will not exceed, two tons per year. The reduction from these strategies for 2010 was estimated at 24 tons per day in total condensate tank VOC emissions based on an assumed Rule Effectiveness adjustment factor of 0.83. The results of the 2010 projected inventory were based on both the above controls and the projected oil production growth. The 2008 SIP inventory for condensate tanks is presented in Table 1.

3
Table 1. Tank VOC Condensate Emissions Inventory in Tons per Day for 2006 Base Year and 2010 Projection Year
Tons per Day 2006 Base Year 126.5 2010 Projection Year 129.6
Recent Studies and Modeling Photochemical modeling to demonstrate compliance met the EPA model performance criteria and the control strategy demonstration was approved by the EPA. However, post SIP inverse photochemical modeling indicated that there were VOC emissions missing from the inventory. Condensate tank inspections discovered open hatches and other leaks. Forward Looking Infrared Camera (FLIR) images also showed leaking condensate tanks. A study by the National Oceanic and Atmospheric Administration (NOAA) in 2011 and another study by the EPA in 2011 indicated that the emissions from oil and gas were underestimated as well. In an effort to support future planning activities and SIP efforts, the Colorado Air Pollution Control Division and the Regional Air Quality Council contracted with ENVIRON and Alpine Geophysics to perform additional photochemical modeling for a 2008 base year and a 2018 projection year. Because of the under estimation of oil and gas VOC emissions, the inventory for the 2008 base year was revised not only to account for Rule Effectiveness, but also to account for condensate tank leaks. Engineering judgment was used to arrive at a capture efficiency of 75%. This meant that 75% of the emissions from the tanks with control equipment were in deed controlled and that 25% of the emissions were estimated to leak into the atmosphere. Uncontrolled emissions are calculated by multiplying the number of barrels of condensate production by an emission factor, a factor which is calculated by the EPA E&P Tanks Model or a similar such model. This model takes onto consideration condensate speciation, pressure, and other variables. The default emission factor for the ozone nonattainment area is 13.7 pounds of VOC per barrel of condensate. In the Denver ozone nonattainment area condensate production is equivalent to oil production. The calculation of emissions that escape control mechanism devices and are released into the environment can be presented as follows: Controlled Emissions = Uncontrolled Emissions x (1 - Control Device Efficiency x Rule Effectiveness x Rule Penetration x Capture Efficiency). The control device in this equation is a flare with an efficiency of 95%. Rule Penetration (in this case the percentage of tanks requiring control) is not used since we have actual emissions

4
estimates reported by source operators. Rule Effectiveness is a measure of how well the regulation is enforced and we are using 83% from the 2008 SIP. Capture Efficiency is the fraction of emissions going to the control device as explained above. The calculation, using equal units of weight, is: Controlled Emissions = Uncontrolled Emissions x 0.41 the factor 0.41 being calculated by (1- 0.95 x 0.83 x 0.75). The calculation without adjustment for Capture Efficiency and Rule Effectiveness is: Controlled Emissions = Uncontrolled Emissions x (1- 0.95), or Controlled Emissions = Uncontrolled Emissions x .05). Dividing adjusted Controlled Emissions (Uncontrolled x 0.41) by Controlled Emissions without adjustment (Uncontrolled Emissions x 0.05) yields an increase by a factor of about 8 (0.41/0.05). Because all condensate tanks are not controlled, overall emissions increase by a factor of about three. Table 2. shows uncontrolled, reported, and adjusted emissions corrected for Rule Effectiveness (83%) and Capture Efficiency (75%) as reported in the Colorado Air Pollutant Emissions Notice (APEN) system for condensate tanks. In 2008, there were over 5000 condensate tank batteries (combinations of one or more tanks) in the Denver ozone nonattainment area.
Table 2. 2008 Condensate Tank Emissions
Emissions Tons Per Day
Uncontrolled 351 Reported 58
Adjusted 168 The 2008 base year preliminary modeling has been completed using the inventory with the adjusted condensate tank emission estimates. As can be seen by comparing the following Figures 1, 2, and 3, calculated from the new 2008 base year modeling, with Figures 4 and 5 from the 2008 SIP, model performance has improved. The 2008 base year modeling more correctly reflects the observed concentrations where as the SIP model nearly always underestimates the concentration.

5
Figure 1. Preliminary 2008 Base Year Contour Plots Showing Estimated -Hour and 8-Hour Ozone Concentrations

6
Figure 2. Preliminary Ozone Observed Compared to Predicted 2008 Base Year July 8th Through July 11th

7
Figure 3. Preliminary Ozone Observed Compared to Predicted 2008 Base Year July 14th Through July 18th
8
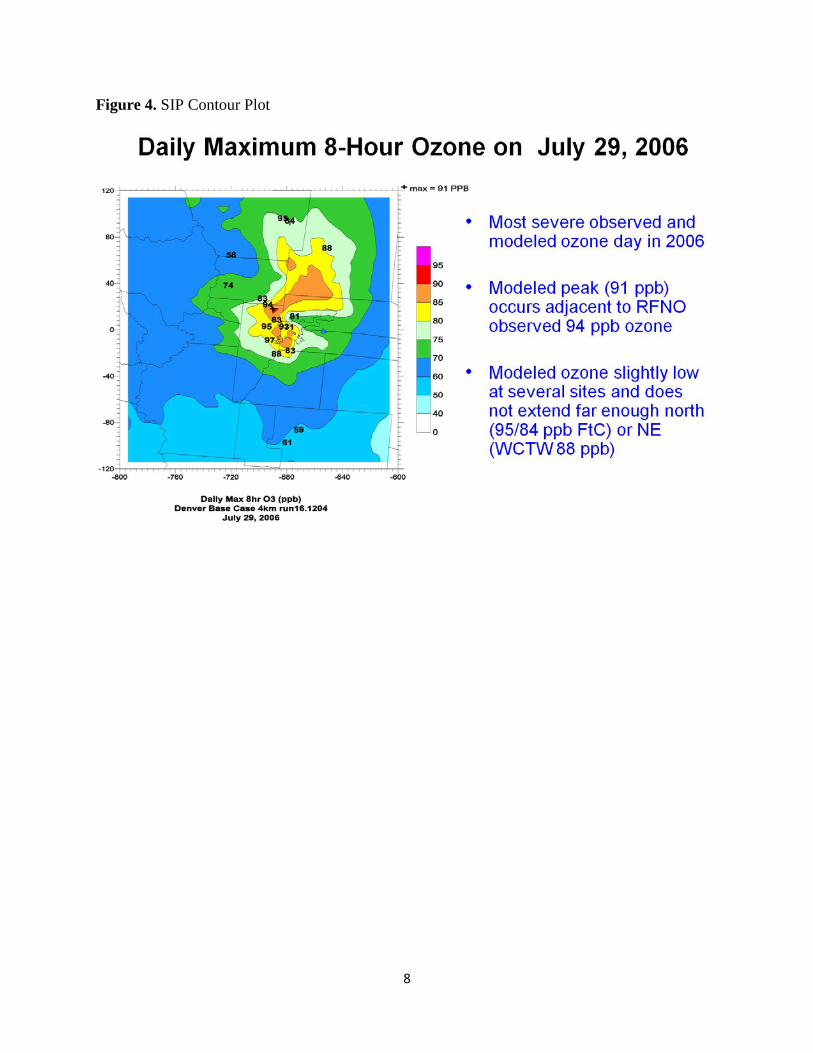
Figure 4. SIP Contour Plot

9
Figure 5. SIP Modeled Ozone Concentrations Compared to Monitored Ozone Concentrations
Figure 6, below, provides a chart representing the entire anthropogenic VOC inventory for the Denver ozone nonattainment area. Condensate tank emissions are now the largest VOC source category, larger than highway vehicle emissions.

10
Figure 6. 2008 Ozone Nonattainment Area VOC Emission Inventory by Tons Per Day
RESULTS AND DISCUSSION Besides the improved ozone model performance, the adjustment of condensate tank emissions has been confirmed through work done by the EPA’s Office of Research and Development (ORD) in a study conducted last year. The EPA used a vehicle fitted with measuring devises to remotely measure and calculate emissions in grams per second from 52 condensate tanks in Weld County oil and gas fields. Colorado provided estimates of uncontrolled emissions, emission reported by operators, and emission estimates adjusted for Capture Efficiency and Rule Effectiveness for those condensate tanks within 500 meters of the EPA measurement locations. The Colorado emission estimates were also converted to grams per second. The results are shown in Figure 7, below. The median of the ORD results of 0.17 grams per second were nearly identical to the median of the Colorado emission estimates adjusted for Rule Effectiveness and Capture Efficiency which were 0.18 grams per second. The EPA measurements are an independent verification in addition to the modeling results that the adjustment in condensate tank emissions are more correct than the emissions reported by the industry.
ConsumerSolvents, 30.8, 6%
Highway Vehicles on net, 15.6, 3%
Highway Vehicles off net(start&evap),
79.1, 16%
Lawn and Garden Equipment (Com),
31.0, 6%
Lawn and Garden Equipment (Res),
10.9, 2% O&G area, 71.0, 14%
Condensate Tanks, 167.9, 33%
otherO&Gpoint, 9.9, 2%
OtherAreaSource, 18.9, 4%
OtherNonRoadEquipment, 24.2, 5%
OtherPoint, 30.0, 6% Architectural
Coatings, 13.60, 3%
Preliminary: Ozone NAA Counties 2008 VOC Tons/Day 502.9

11
Figure 7. Comparison Among EPA ORD Results, Uncontrolled Emissions Estimates, Adjusted Emissions Estimates, and Reported Emissions
DISCLAIMER The views expressed in this paper are those of the author(s) and do not necessarily represent those of the Colorado Department of Public Health and Environment. No official Agency endorsement should be inferred.
KEY WORDS Condensate Tank Emissions, Oil and Gas, Ozone, Photochemical Grid Model

12
REFERENCES Early Action Compact, Ozone Action Plan, Proposed Revision to the State Implementation Plan, Approved by: Colorado Air Quality Control Commission, March 12, 2004 Ozone Action Plan, Including Revisions to the State Implementation Plan, Approved by: Colorado Air Quality Control Commission, December 12, 2008
INITIAL OZONE MODEL PERFORMANCE EVALUATION OF THE JUNE – JULY 2006 DENVER OZONE EPISODE AND DIAGNOSTICS TESTING AND ANALYSIS Prepared for: Regional Air Quality Council 1445 Market Street, Suite 260 Denver, Colorado 80202 Prepared by: ENVIRON and Alpine Geophysics
Hydrocarbon emissions characterization in the Colorado Front Range: A pilot study. Journal of Geophysical Research--Atmospheres, VOL. 117, D04304, 19 PP., 2012 doi: 10.1029/2011JD016360, Gabrielle Pétron, Gregory Frost et al, NOAA Earth System Research Laboratory' Boulder, Colorado Assessment of Methane and VOC Emissions from Select Upstream Oil and Gas Production Operations Using Remote Measurements, Interim Report on Recent Survey Studies in Proceedings of 105thAnnual Conference of the Air & Waste Management Association - June 19-22, 2012, in San Antonio, Texas, Thoma et al U.S. EPA, Office of Research and Development Preliminary Ozone Model Performance Evaluation for the Denver 2008 Episode, Prepared for: Gerald Dilley Denver Regional Air Quality Council Denver, Colorado 80202 by ENVIRON and Alpine Geophysics