condensed consolidated interim financial … · 1 condensed consolidated interim financial...
TRANSCRIPT

JANUARY – JUNE 2016
CONDENSED CONSOLIDATED
INTERIM FINANCIAL STATEMENTS 2016
(UNAUDITED)

CONTENTS
1. INCOME STATEMENT 1
2. STATEMENT OF COMPREHENSIVE INCOME 2
3. BALANCE SHEET 3
4. STATEMENT OF CHANGES IN EQUIT Y 5
5. CASH FLOW STATEMENT 7
6. NOTES TO THE CONDENSED CONSOLIDATED INTERIM
FINANCIAL STATEMENTS 8
7. FINANCIAL CALENDAR 16
Schindellegi, July 18, 2016
1 Condensed Consolidated Interim Financial Statements 2016 INCOME STATEMENT
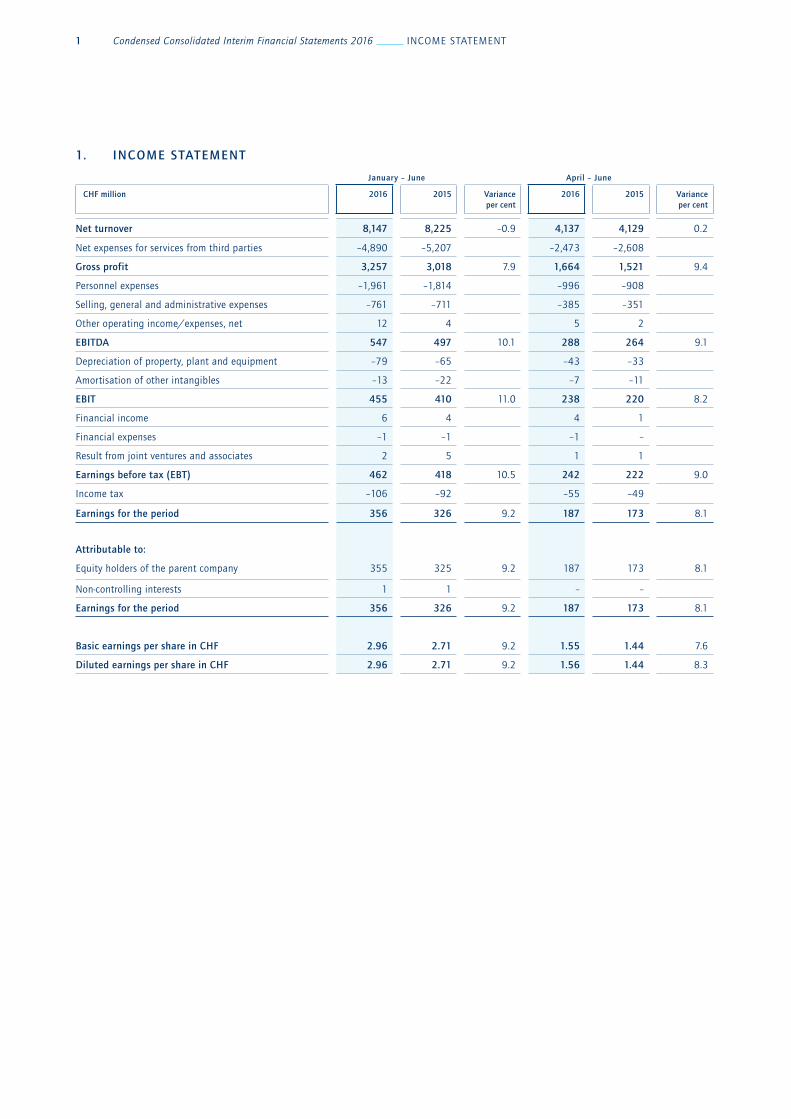
1. INCOME STATEMENT
January – June April – June
CHF million 2016 2015 Varianceper cent
2016 2015 Varianceper cent
Net turnover 8,147 8,225 –0.9 4,137 4,129 0.2
Net expenses for services from third parties –4,890 –5,207 –2,473 –2,608
Gross profit 3,257 3,018 7.9 1,664 1,521 9.4
Personnel expenses –1,961 –1,814 –996 –908
Selling, general and administrative expenses –761 –711 –385 –351
Other operating income/expenses, net 12 4 5 2
EBITDA 547 497 10.1 288 264 9.1
Depreciation of property, plant and equipment –79 –65 –43 –33
Amortisation of other intangibles –13 –22 –7 –11
EBIT 455 410 11.0 238 220 8.2
Financial income 6 4 4 1
Financial expenses –1 –1 –1 –
Result from joint ventures and associates 2 5 1 1
Earnings before tax (EBT) 462 418 10.5 242 222 9.0
Income tax –106 –92 –55 –49
Earnings for the period 356 326 9.2 187 173 8.1
Attributable to:
Equity holders of the parent company 355 325 9.2 187 173 8.1
Non-controlling interests 1 1 – –
Earnings for the period 356 326 9.2 187 173 8.1
Basic earnings per share in CHF 2.96 2.71 9.2 1.55 1.44 7.6
Diluted earnings per share in CHF 2.96 2.71 9.2 1.56 1.44 8.3
Condensed Consolidated Interim Financial Statements 2016 STATEMENT OF COMPREHENSIVE INCOME 2
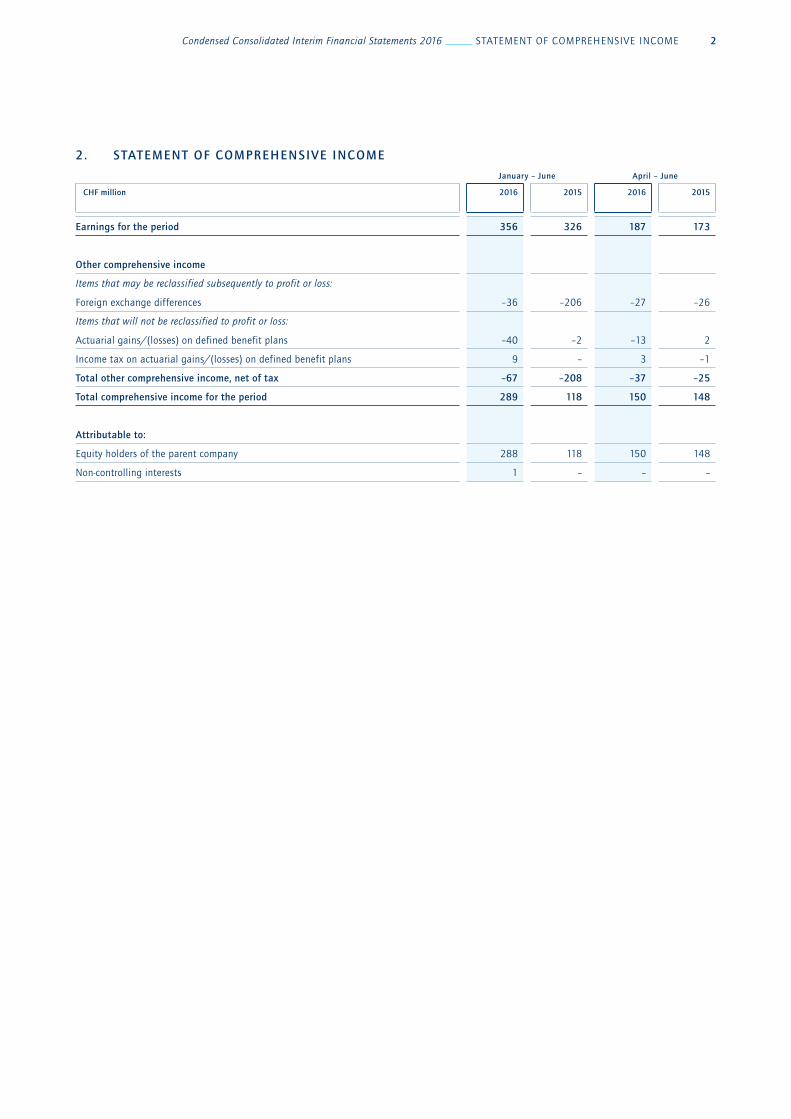
2. STATEMENT OF COMPREHENSIVE INCOME
January – June April – June
CHF million 2016 2015 2016 2015
Earnings for the period 356 326 187 173
Other comprehensive income
Items that may be reclassified subsequently to profit or loss:
Foreign exchange differences –36 –206 –27 –26
Items that will not be reclassified to profit or loss:
Actuarial gains/(losses) on defined benefit plans –40 –2 –13 2
Income tax on actuarial gains/(losses) on defined benefit plans 9 – 3 –1
Total other comprehensive income, net of tax –67 –208 –37 –25
Total comprehensive income for the period 289 118 150 148
Attributable to:
Equity holders of the parent company 288 118 150 148
Non-controlling interests 1 – – –
3 Condensed Consolidated Interim Financial Statements 2016 BAL ANCE SHEET
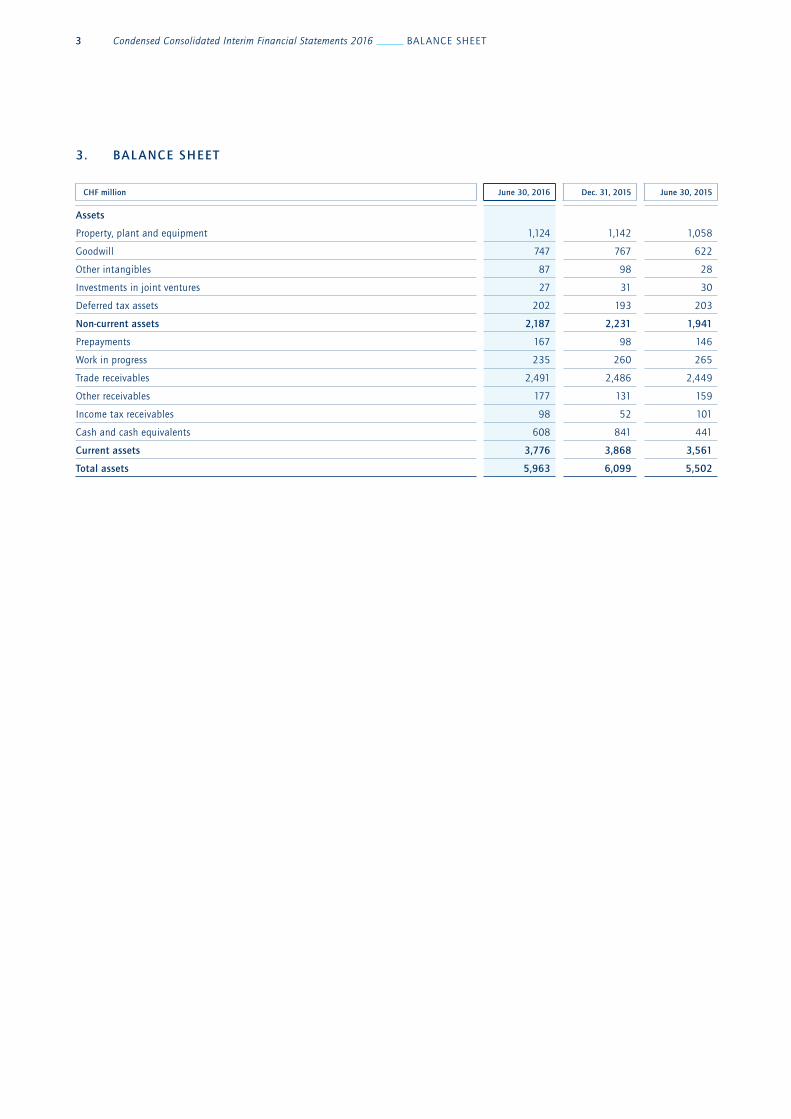
3. BAL ANCE SHEET
CHF million June 30, 2016 Dec. 31, 2015 June 30, 2015
Assets
Property, plant and equipment 1,124 1,142 1,058
Goodwill 747 767 622
Other intangibles 87 98 28
Investments in joint ventures 27 31 30
Deferred tax assets 202 193 203
Non-current assets 2,187 2,231 1,941
Prepayments 167 98 146
Work in progress 235 260 265
Trade receivables 2,491 2,486 2,449
Other receivables 177 131 159
Income tax receivables 98 52 101
Cash and cash equivalents 608 841 441
Current assets 3,776 3,868 3,561
Total assets 5,963 6,099 5,502
Condensed Consolidated Interim Financial Statements 2016 BAL ANCE SHEET 4
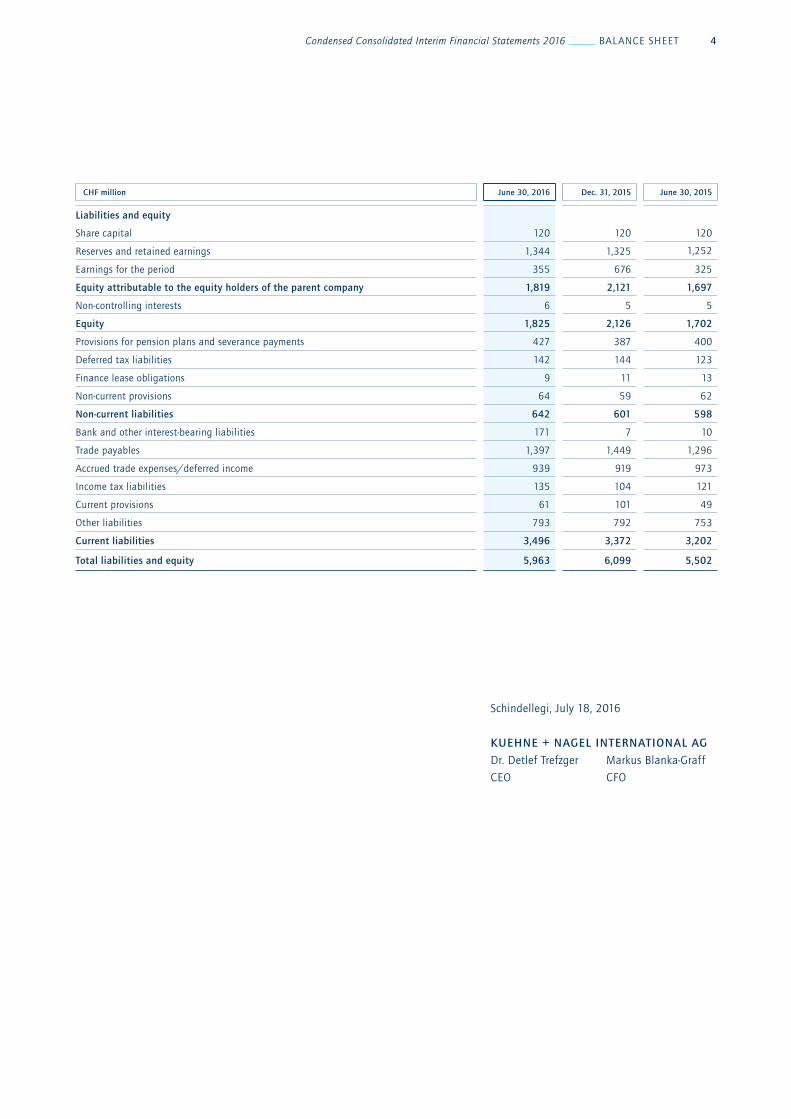
Schindellegi, July 18, 2016
KUEHNE + NAGEL INTERNATIONAL AG
Dr. Detlef Trefzger Markus Blanka-Graff
CEO CFO
CHF million June 30, 2016 Dec. 31, 2015 June 30, 2015
Liabilities and equity
Share capital 120 120 120
Reserves and retained earnings 1,344 1,325 1,252
Earnings for the period 355 676 325
Equity attributable to the equity holders of the parent company 1,819 2,121 1,697
Non-controlling interests 6 5 5
Equity 1,825 2,126 1,702
Provisions for pension plans and severance payments 427 387 400
Deferred tax liabilities 142 144 123
Finance lease obligations 9 11 13
Non-current provisions 64 59 62
Non-current liabilities 642 601 598
Bank and other interest-bearing liabilities 171 7 10
Trade payables 1,397 1,449 1,296
Accrued trade expenses/deferred income 939 919 973
Income tax liabilities 135 104 121
Current provisions 61 101 49
Other liabilities 793 792 753
Current liabilities 3,496 3,372 3,202
Total liabilities and equity 5,963 6,099 5,502

5 Condensed Consolidated Interim Financial Statements 2016 STATEMENT OF CHANGES IN EQUIT Y
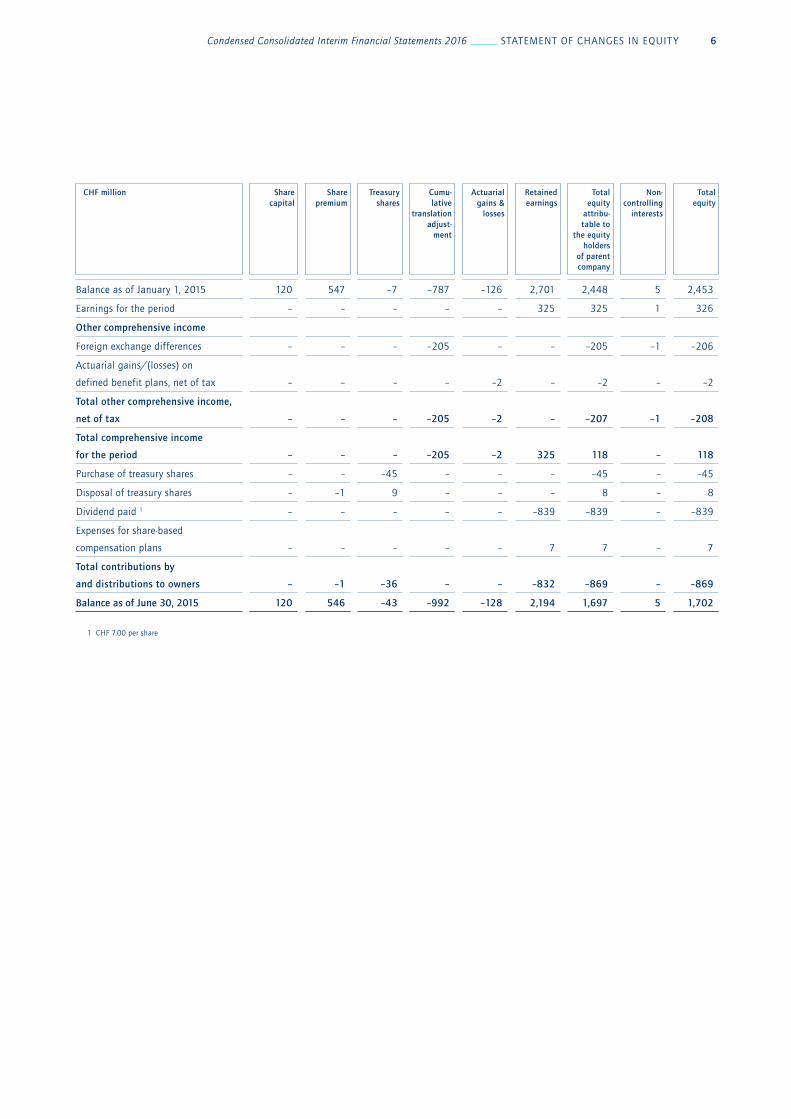
4. STATEMENT OF CHANGES IN EQUIT Y
CHF million Sharecapital
Sharepremium
Treasuryshares
Cumu-lative
translation adjust-
ment
Actuarial gains &
losses
Retained earnings
Total equity
attribu-table to
the equity holders
of parent company
Non-controlling
interests
Total equity
Balance as of January 1, 2016 120 532 –19 –959 –106 2,553 2,121 5 2,126
Earnings for the period – – – – – 355 355 1 356
Other comprehensive income
Foreign exchange differences – – – –36 – – –36 – –36
Actuarial gains/(losses) on
defined benefit plans, net of tax – – – – –31 – –31 – –31
Total other comprehensive income,
net of tax – – – –36 –31 – –67 – –67
Total comprehensive income
for the period – – – –36 –31 355 288 1 289
Purchase of treasury shares – – –8 – – – –8 – –8
Disposal of treasury shares – –1 6 – – – 5 – 5
Dividend paid 1 – – – – – –599 –599 – –599
Expenses for share-based
compensation plans – – – – – 12 12 – 12
Total contributions by
and distributions to owners – –1 –2 – – –587 –590 – –590
Balance as of June 30, 2016 120 531 –21 –995 –137 2,321 1,819 6 1,825
1 CHF 5.00 per share
Condensed Consolidated Interim Financial Statements 2016 STATEMENT OF CHANGES IN EQUIT Y 6
CHF million Sharecapital
Sharepremium
Treasuryshares
Cumu-lative
translation adjust-
ment
Actuarial gains &
losses
Retained earnings
Total equity
attribu-table to
the equity holders
of parent company
Non-controlling
interests
Total equity
Balance as of January 1, 2015 120 547 –7 –787 –126 2,701 2,448 5 2,453
Earnings for the period – – – – – 325 325 1 326
Other comprehensive income
Foreign exchange differences – – – –205 – – –205 –1 –206
Actuarial gains/(losses) on
defined benefit plans, net of tax – – – – –2 – –2 – –2
Total other comprehensive income,
net of tax – – – –205 –2 – –207 –1 –208
Total comprehensive income
for the period – – – –205 –2 325 118 – 118
Purchase of treasury shares – – –45 – – – –45 – –45
Disposal of treasury shares – –1 9 – – – 8 – 8
Dividend paid 1 – – – – – –839 –839 – –839
Expenses for share-based
compensation plans – – – – – 7
7 – 7
Total contributions by
and distributions to owners – –1 –36 – – –832 –869 – –869
Balance as of June 30, 2015 120 546 –43 –992 –128 2,194 1,697 5 1,702
1 CHF 7.00 per share
7 Condensed Consolidated Interim Financial Statements 2016 CASH FLOW STATEMENT
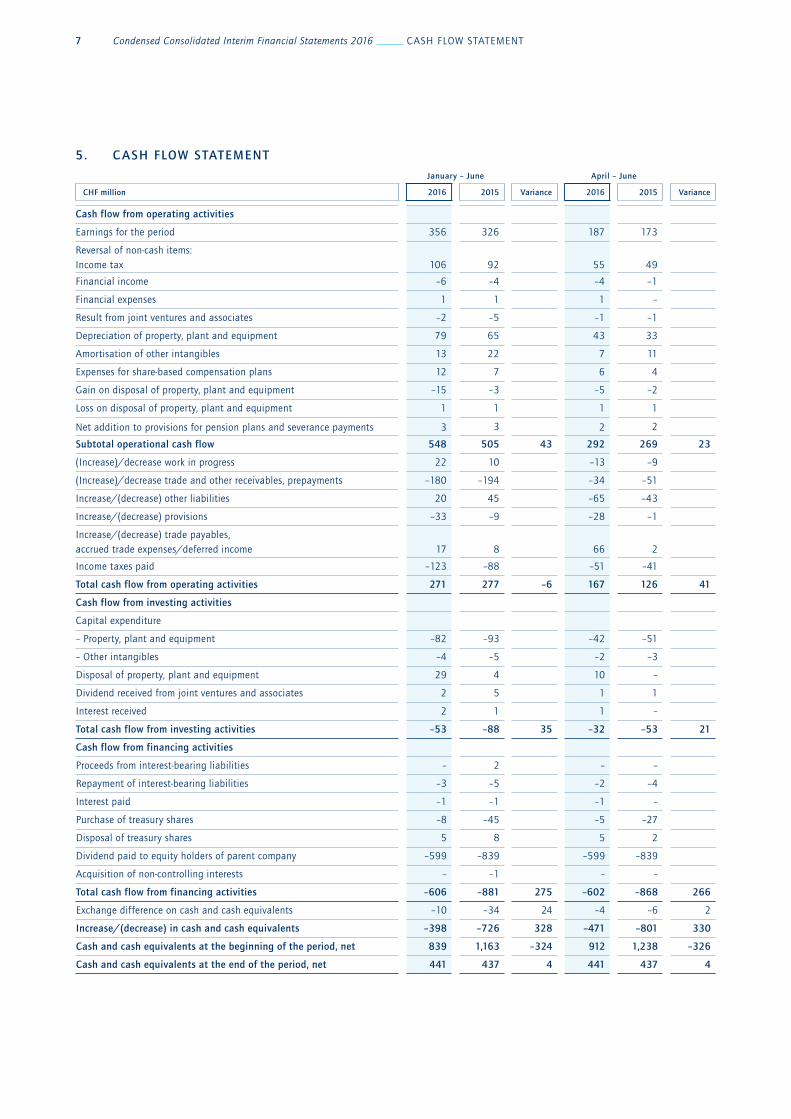
5. C ASH FLOW STATEMENT
January – June April – June
CHF million 2016 2015 Variance 2016 2015 Variance
Cash flow from operating activities
Earnings for the period 356 326 187 173
Reversal of non-cash items: Income tax 106 92 55 49
Financial income –6 –4 –4 –1
Financial expenses 1 1 1 –
Result from joint ventures and associates –2 –5 –1 –1
Depreciation of property, plant and equipment 79 65 43 33
Amortisation of other intangibles 13 22 7 11
Expenses for share-based compensation plans 12 7 6 4
Gain on disposal of property, plant and equipment –15 –3 –5 –2
Loss on disposal of property, plant and equipment 1 1 1 1
Net addition to provisions for pension plans and severance payments 3 3 2 2
Subtotal operational cash flow 548 505 43 292 269 23
(Increase)/decrease work in progress 22 10 –13 –9
(Increase)/decrease trade and other receivables, prepayments –180 –194 –34 –51
Increase/(decrease) other liabilities 20 45 –65 –43
Increase/(decrease) provisions –33 –9 –28 –1
Increase/(decrease) trade payables, accrued trade expenses/deferred income 17 8 66 2
Income taxes paid –123 –88 –51 –41
Total cash flow from operating activities 271 277 –6 167 126 41
Cash flow from investing activities
Capital expenditure
– Property, plant and equipment –82 –93 –42 –51
– Other intangibles –4 –5 –2 –3
Disposal of property, plant and equipment 29 4 10 –
Dividend received from joint ventures and associates 2 5 1 1
Interest received 2 1 1 –
Total cash flow from investing activities –53 –88 35 –32 –53 21
Cash flow from financing activities
Proceeds from interest-bearing liabilities – 2 – –
Repayment of interest-bearing liabilities –3 –5 –2 –4
Interest paid –1 –1 –1 –
Purchase of treasury shares –8 –45 –5 –27
Disposal of treasury shares 5 8 5 2
Dividend paid to equity holders of parent company –599 –839 –599 –839
Acquisition of non-controlling interests – –1 – –
Total cash flow from financing activities –606 –881 275 –602 –868 266
Exchange difference on cash and cash equivalents –10 –34 24 –4 –6 2
Increase/(decrease) in cash and cash equivalents –398 –726 328 –471 –801 330
Cash and cash equivalents at the beginning of the period, net 839 1,163 –324 912 1,238 –326
Cash and cash equivalents at the end of the period, net 441 437 4 441 437 4
Condensed Consolidated Interim Financial Statements 2016 NOTES 8
6. NOTES TO THE CONDENSED CONSOLIDATED INTERIM FINANCIAL STATEMENTS
6.1 ORGANISATION
Kuehne + Nagel International AG (the Company) is incorporated
in Schindellegi (Feusisberg), Switzerland. The Company is one of
the world’s leading logistics providers. Its strong market position
lies in the seafreight, airfreight, overland and contract logistics
businesses.
The Condensed Consolidated Interim Financial Statements of
the Company for the six months ended June 30, 2016, comprise
the Company, its subsidiaries (the Group) and its interests in
joint ventures.
The Group voluntarily presents a balance sheet as of June 30,
2015.
6.2 STATEMENT OF COMPLIANCE
The unaudited Condensed Consolidated Interim Financial State-
ments have been prepared in accordance with IAS 34 Interim
Financial Reporting. They do not include all of the information
required for full annual financial statements, and should be read
in conjunction with the Consolidated Financial Statements of
the Group for the year ended December 31, 2015.
6.3 BASIS OF PREPARATION
The Condensed Consolidated Interim Financial Statements are
presented in Swiss Francs (CHF) million. They are prepared on a
historical cost basis except for certain financial instruments
which are stated at fair value. Non-current assets and disposal
groups held for sale are stated at the lower of the carrying
amount and fair value less costs to sell.
The preparation of Condensed Consolidated Interim Financial
Statements in conformity with IFRS requires the management to
make judgements, estimates and assumptions that affect the
application of policies and reported amounts of assets and lia-
bilities, income and expenses. The actual result may differ from
these estimates. Judgements made by the management in the
application of IFRS that have a significant effect on the Con-
densed Consolidated Interim Financial Statements and esti-
mates with a significant risk of material adjustment in the next
period were the same as those applied to the Consolidated
Financial Statements for the year ended December 31, 2015.
Accounting policies
The accounting policies are the same as those applied in the Con-
solidated Financial Statements for the year ended December 31,
2015.
New, revised and amended standards that are effective for the
2016 reporting year are either not relevant for the Group, or
do not have a material impact on the Condensed Consolidated
Interim Financial Statements.
9 Condensed Consolidated Interim Financial Statements 2016 NOTES
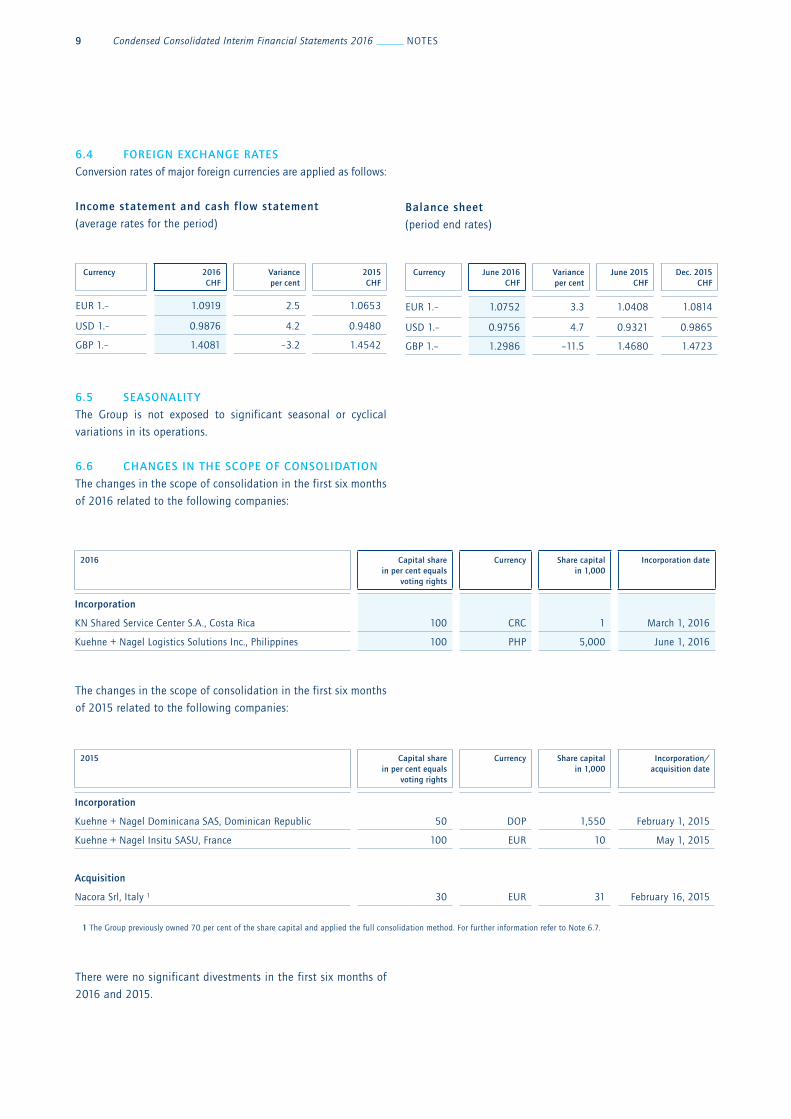
The changes in the scope of consolidation in the first six months
of 2015 related to the following companies:
There were no significant divestments in the first six months of
2016 and 2015.
6.4 FOREIGN EXCHANGE RATES
Conversion rates of major foreign currencies are applied as follows:
Income statement and cash f low statement
(average rates for the period)Balance sheet
(period end rates)
6.5 SEASONALIT Y
The Group is not exposed to significant seasonal or cyclical
variations in its operations.
6.6 CHANGES IN THE SCOPE OF CONSOLIDATION The changes in the scope of consolidation in the first six months
of 2016 related to the following companies:
Currency 2016CHF
Varianceper cent
2015CHF
EUR 1.– 1.0919 2.5 1.0653
USD 1.– 0.9876 4.2 0.9480
GBP 1.– 1.4081 –3.2 1.4542
Currency June 2016CHF
Varianceper cent
June 2015CHF
Dec. 2015CHF
EUR 1.– 1.0752 3.3 1.0408 1.0814
USD 1.– 0.9756 4.7 0.9321 0.9865
GBP 1.– 1.2986 –11.5 1.4680 1.4723
2016 Capital sharein per cent equals
voting rights
Currency Share capital in 1,000
Incorporation date
Incorporation
KN Shared Service Center S.A., Costa Rica 100 CRC 1 March 1, 2016
Kuehne + Nagel Logistics Solutions Inc., Philippines 100 PHP 5,000 June 1, 2016
2015 Capital sharein per cent equals
voting rights
Currency Share capital in 1,000
Incorporation/acquisition date
Incorporation
Kuehne + Nagel Dominicana SAS, Dominican Republic 50 DOP 1,550 February 1, 2015
Kuehne + Nagel Insitu SASU, France 100 EUR 10 May 1, 2015
Acquisition
Nacora Srl, Italy 1 30 EUR 31 February 16, 2015
1 The Group previously owned 70 per cent of the share capital and applied the full consolidation method. For further information refer to Note 6.7.
Condensed Consolidated Interim Financial Statements 2016 NOTES 10
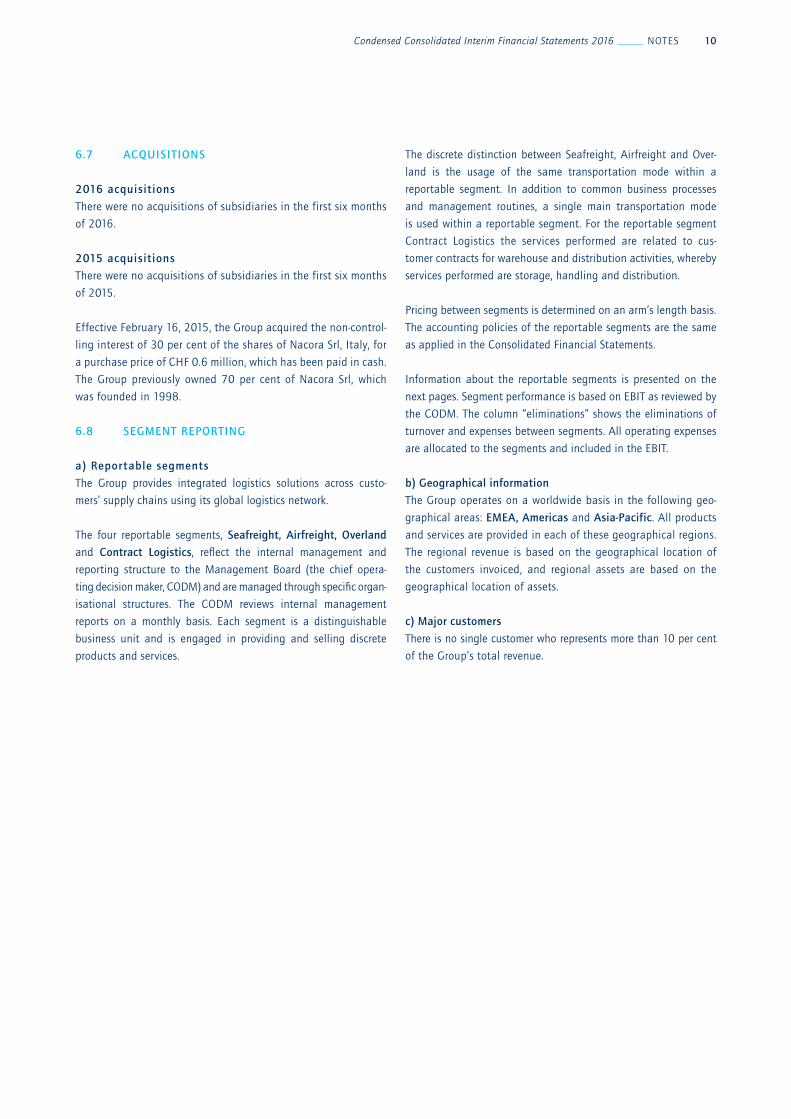
6.7 ACQUISITIONS
2016 acquisitions
There were no acquisitions of subsidiaries in the first six months
of 2016.
2015 acquisitions
There were no acquisitions of subsidiaries in the first six months
of 2015.
Effective February 16, 2015, the Group acquired the non-control-
ling interest of 30 per cent of the shares of Nacora Srl, Italy, for
a purchase price of CHF 0.6 million, which has been paid in cash.
The Group previously owned 70 per cent of Nacora Srl, which
was founded in 1998.
6.8 SEGMENT REPORTING
a) Reportable segments
The Group provides integrated logistics solutions across custo-
mers’ supply chains using its global logistics network.
The four reportable segments, Seafreight, Airfreight, Overland
and Contract Logistics, reflect the internal management and
reporting structure to the Management Board (the chief opera-
ting decision maker, CODM) and are managed through specific organ-
isational structures. The CODM reviews internal management
reports on a monthly basis. Each segment is a distinguishable
business unit and is engaged in providing and selling discrete
products and services.
The discrete distinction between Seafreight, Airfreight and Over-
land is the usage of the same transportation mode within a
reportable segment. In addition to common business processes
and management routines, a single main transportation mode
is used within a reportable segment. For the reportable segment
Contract Logistics the services performed are related to cus-
tomer contracts for warehouse and distribution activities, whereby
services performed are storage, handling and distribution.
Pricing between segments is determined on an arm’s length basis.
The accounting policies of the reportable segments are the same
as applied in the Consolidated Financial Statements.
Information about the reportable segments is presented on the
next pages. Segment performance is based on EBIT as reviewed by
the CODM. The column “eliminations” shows the eliminations of
turnover and expenses between segments. All operating expenses
are allocated to the segments and included in the EBIT.
b) Geographical information
The Group operates on a worldwide basis in the following geo-
graphical areas: EMEA, Americas and Asia-Pacific. All products
and services are provided in each of these geographical regions.
The regional revenue is based on the geographical location of
the customers invoiced, and regional assets are based on the
geographical location of assets.
c) Major customers
There is no single customer who represents more than 10 per cent
of the Group’s total revenue.
11 Condensed Consolidated Interim Financial Statements 2016 NOTES
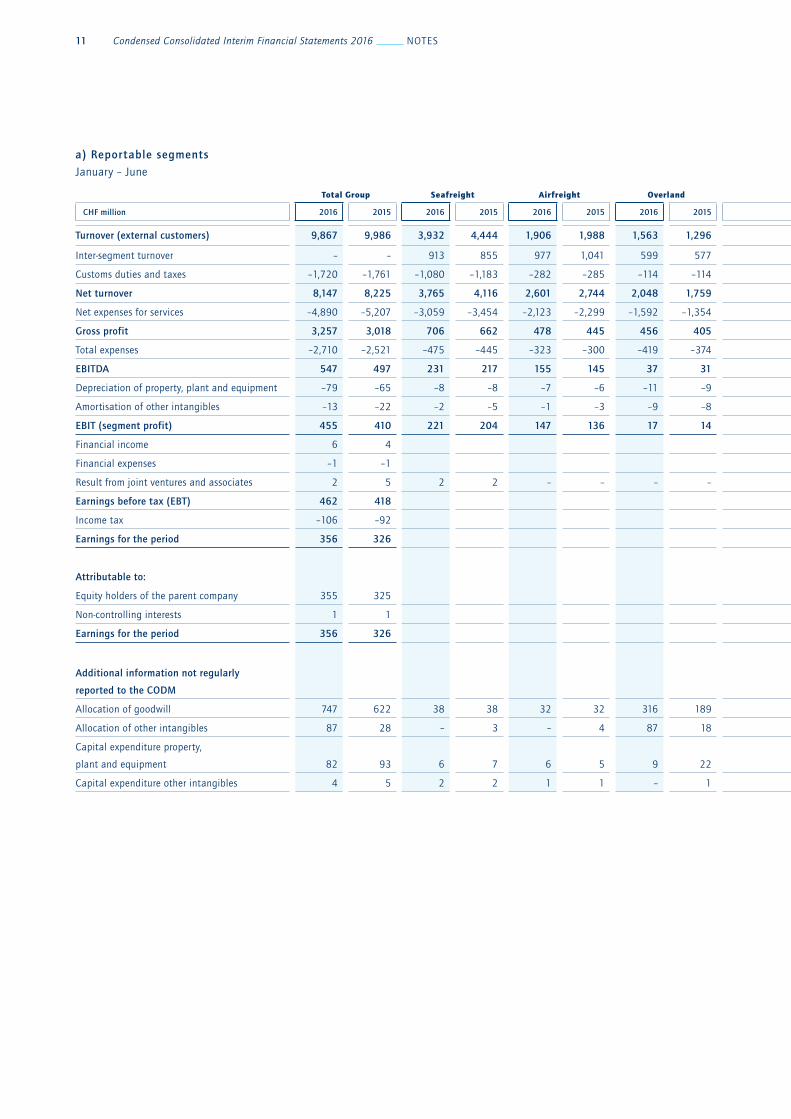
a) Reportable segments
January – June
Total Group Seafreight Airfreight Overland Contract Logistics Total
reportable segments Eliminations
CHF million 2016 2015 2016 2015 2016 2015 2016 2015 2016 2015 2016 2015 2016 2015
Turnover (external customers) 9,867 9,986 3,932 4,444 1,906 1,988 1,563 1,296 2,466 2,258 9,867 9,986 – –
Inter-segment turnover – – 913 855 977 1,041 599 577 66 78 2,555 2,551 –2,555 –2,551
Customs duties and taxes –1,720 –1,761 –1,080 –1,183 –282 –285 –114 –114 –244 –179 –1,720 –1,761 – –
Net turnover 8,147 8,225 3,765 4,116 2,601 2,744 2,048 1,759 2,288 2,157 10,702 10,776 –2,555 –2,551
Net expenses for services –4,890 –5,207 –3,059 –3,454 –2,123 –2,299 –1,592 –1,354 –671 –651 –7,445 –7,758 2,555 2,551
Gross profit 3,257 3,018 706 662 478 445 456 405 1,617 1,506 3,257 3,018 – –
Total expenses –2,710 –2,521 –475 –445 –323 –300 –419 –374 –1,493 –1,402 –2,710 –2,521 – –
EBITDA 547 497 231 217 155 145 37 31 124 104 547 497 – –
Depreciation of property, plant and equipment –79 –65 –8 –8 –7 –6 –11 –9 –53 –42 –79 –65 – –
Amortisation of other intangibles –13 –22 –2 –5 –1 –3 –9 –8 –1 –6 –13 –22 – –
EBIT (segment profit) 455 410 221 204 147 136 17 14 70 56 455 410 – –
Financial income 6 4
Financial expenses –1 –1
Result from joint ventures and associates 2 5 2 2 – – – – – 3 2 5 – –
Earnings before tax (EBT) 462 418
Income tax –106 –92
Earnings for the period 356 326
Attributable to:
Equity holders of the parent company 355 325
Non-controlling interests 1 1
Earnings for the period 356 326
Additional information not regularly
reported to the CODM
Allocation of goodwill 747 622 38 38 32 32 316 189 361 363 747 622 – –
Allocation of other intangibles 87 28 – 3 – 4 87 18 – 3 87 28 – –
Capital expenditure property,
plant and equipment 82 93 6 7 6 5 9 22 61 59 82 93 – –
Capital expenditure other intangibles 4 5 2 2 1 1 – 1 1 1 4 5 – –
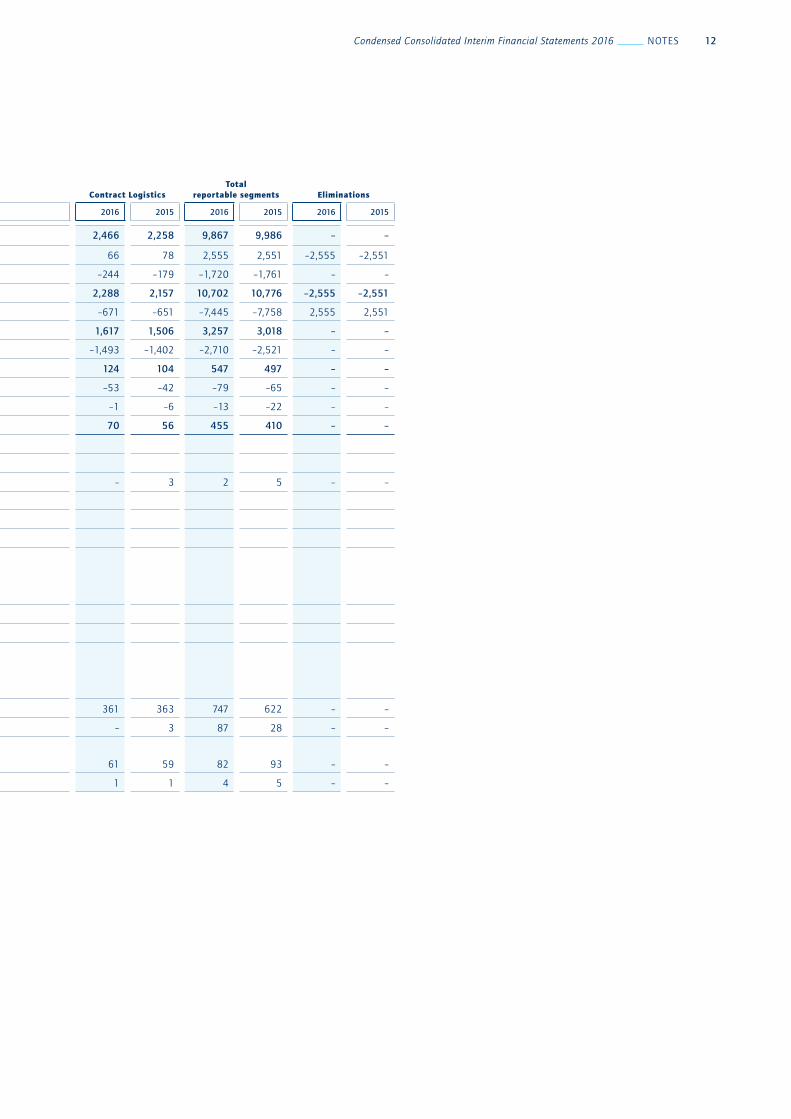
Condensed Consolidated Interim Financial Statements 2016 NOTES 12
Total Group Seafreight Airfreight Overland Contract Logistics
Total reportable segments Eliminations
CHF million 2016 2015 2016 2015 2016 2015 2016 2015 2016 2015 2016 2015 2016 2015
Turnover (external customers) 9,867 9,986 3,932 4,444 1,906 1,988 1,563 1,296 2,466 2,258 9,867 9,986 – –
Inter-segment turnover – – 913 855 977 1,041 599 577 66 78 2,555 2,551 –2,555 –2,551
Customs duties and taxes –1,720 –1,761 –1,080 –1,183 –282 –285 –114 –114 –244 –179 –1,720 –1,761 – –
Net turnover 8,147 8,225 3,765 4,116 2,601 2,744 2,048 1,759 2,288 2,157 10,702 10,776 –2,555 –2,551
Net expenses for services –4,890 –5,207 –3,059 –3,454 –2,123 –2,299 –1,592 –1,354 –671 –651 –7,445 –7,758 2,555 2,551
Gross profit 3,257 3,018 706 662 478 445 456 405 1,617 1,506 3,257 3,018 – –
Total expenses –2,710 –2,521 –475 –445 –323 –300 –419 –374 –1,493 –1,402 –2,710 –2,521 – –
EBITDA 547 497 231 217 155 145 37 31 124 104 547 497 – –
Depreciation of property, plant and equipment –79 –65 –8 –8 –7 –6 –11 –9 –53 –42 –79 –65 – –
Amortisation of other intangibles –13 –22 –2 –5 –1 –3 –9 –8 –1 –6 –13 –22 – –
EBIT (segment profit) 455 410 221 204 147 136 17 14 70 56 455 410 – –
Financial income 6 4
Financial expenses –1 –1
Result from joint ventures and associates 2 5 2 2 – – – – – 3 2 5 – –
Earnings before tax (EBT) 462 418
Income tax –106 –92
Earnings for the period 356 326
Attributable to:
Equity holders of the parent company 355 325
Non-controlling interests 1 1
Earnings for the period 356 326
Additional information not regularly
reported to the CODM
Allocation of goodwill 747 622 38 38 32 32 316 189 361 363 747 622 – –
Allocation of other intangibles 87 28 – 3 – 4 87 18 – 3 87 28 – –
Capital expenditure property,
plant and equipment 82 93 6 7 6 5 9 22 61 59 82 93 – –
Capital expenditure other intangibles 4 5 2 2 1 1 – 1 1 1 4 5 – –
13 Condensed Consolidated Interim Financial Statements 2016 NOTES
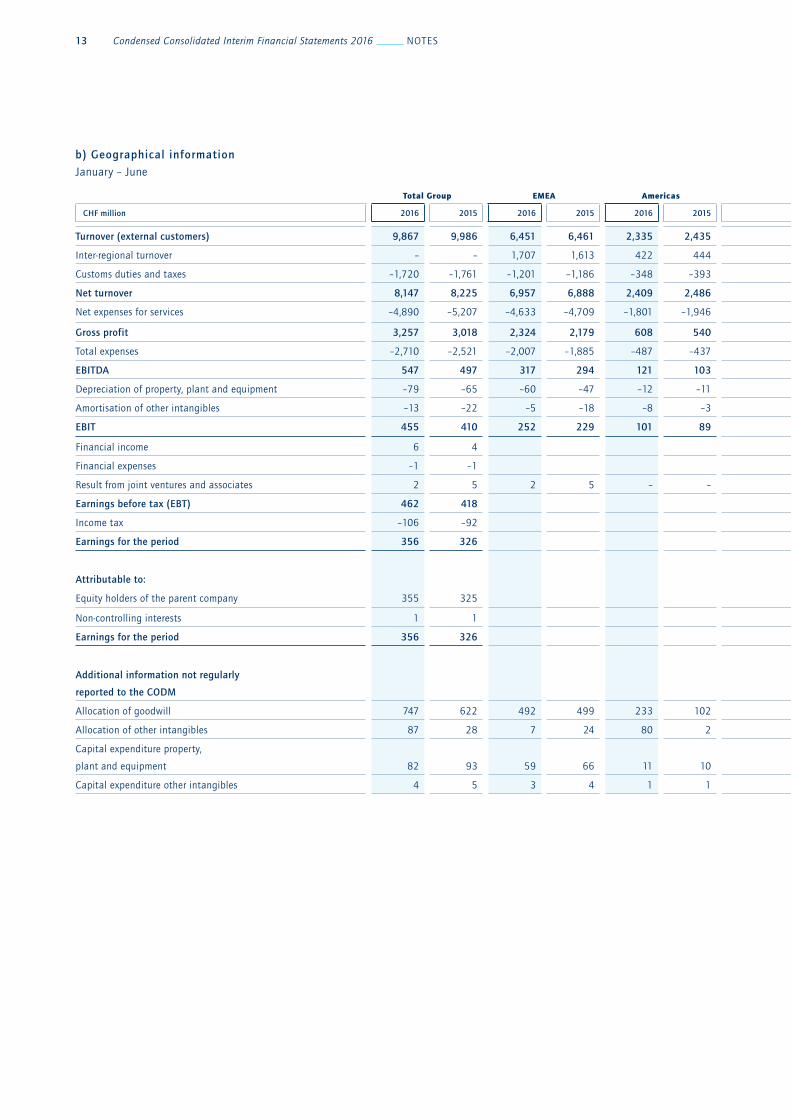
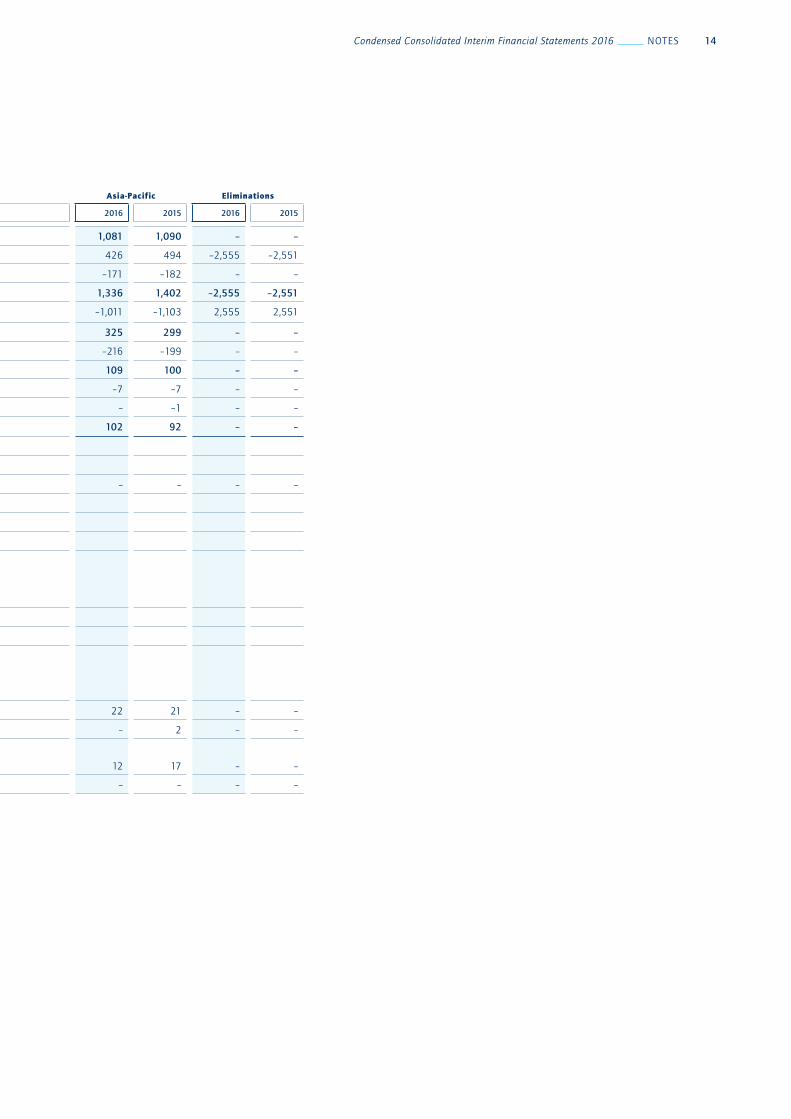
b) Geographical information
January – June
Total Group EMEA Americas Asia-Pacific Eliminations
CHF million 2016 2015 2016 2015 2016 2015 2016 2015 2016 2015
Turnover (external customers) 9,867 9,986 6,451 6,461 2,335 2,435 1,081 1,090 – –
Inter-regional turnover – – 1,707 1,613 422 444 426 494 –2,555 –2,551
Customs duties and taxes –1,720 –1,761 –1,201 –1,186 –348 –393 –171 –182 – –
Net turnover 8,147 8,225 6,957 6,888 2,409 2,486 1,336 1,402 –2,555 –2,551
Net expenses for services –4,890 –5,207 –4,633 –4,709 –1,801 –1,946 –1,011 –1,103 2,555 2,551
Gross profit 3,257 3,018 2,324 2,179 608 540 325 299 – –
Total expenses –2,710 –2,521 –2,007 –1,885 –487 –437 –216 –199 – –
EBITDA 547 497 317 294 121 103 109 100 – –
Depreciation of property, plant and equipment –79 –65 –60 –47 –12 –11 –7 –7 – –
Amortisation of other intangibles –13 –22 –5 –18 –8 –3 – –1 – –
EBIT 455 410 252 229 101 89 102 92 – –
Financial income 6 4
Financial expenses –1 –1
Result from joint ventures and associates 2 5 2 5 – – – – – –
Earnings before tax (EBT) 462 418
Income tax –106 –92
Earnings for the period 356 326
Attributable to:
Equity holders of the parent company 355 325
Non-controlling interests 1 1
Earnings for the period 356 326
Additional information not regularly
reported to the CODM
Allocation of goodwill 747 622 492 499 233 102 22 21 – –
Allocation of other intangibles 87 28 7 24 80 2 – 2 – –
Capital expenditure property,
plant and equipment 82 93 59 66 11 10 12 17 – –
Capital expenditure other intangibles 4 5 3 4 1 1 – – – –
Condensed Consolidated Interim Financial Statements 2016 NOTES 14
Total Group EMEA Americas Asia-Pacific Eliminations
CHF million 2016 2015 2016 2015 2016 2015 2016 2015 2016 2015
Turnover (external customers) 9,867 9,986 6,451 6,461 2,335 2,435 1,081 1,090 – –
Inter-regional turnover – – 1,707 1,613 422 444 426 494 –2,555 –2,551
Customs duties and taxes –1,720 –1,761 –1,201 –1,186 –348 –393 –171 –182 – –
Net turnover 8,147 8,225 6,957 6,888 2,409 2,486 1,336 1,402 –2,555 –2,551
Net expenses for services –4,890 –5,207 –4,633 –4,709 –1,801 –1,946 –1,011 –1,103 2,555 2,551
Gross profit 3,257 3,018 2,324 2,179 608 540 325 299 – –
Total expenses –2,710 –2,521 –2,007 –1,885 –487 –437 –216 –199 – –
EBITDA 547 497 317 294 121 103 109 100 – –
Depreciation of property, plant and equipment –79 –65 –60 –47 –12 –11 –7 –7 – –
Amortisation of other intangibles –13 –22 –5 –18 –8 –3 – –1 – –
EBIT 455 410 252 229 101 89 102 92 – –
Financial income 6 4
Financial expenses –1 –1
Result from joint ventures and associates 2 5 2 5 – – – – – –
Earnings before tax (EBT) 462 418
Income tax –106 –92
Earnings for the period 356 326
Attributable to:
Equity holders of the parent company 355 325
Non-controlling interests 1 1
Earnings for the period 356 326
Additional information not regularly
reported to the CODM
Allocation of goodwill 747 622 492 499 233 102 22 21 – –
Allocation of other intangibles 87 28 7 24 80 2 – 2 – –
Capital expenditure property,
plant and equipment 82 93 59 66 11 10 12 17 – –
Capital expenditure other intangibles 4 5 3 4 1 1 – – – –
15 Condensed Consolidated Interim Financial Statements 2016 NOTES
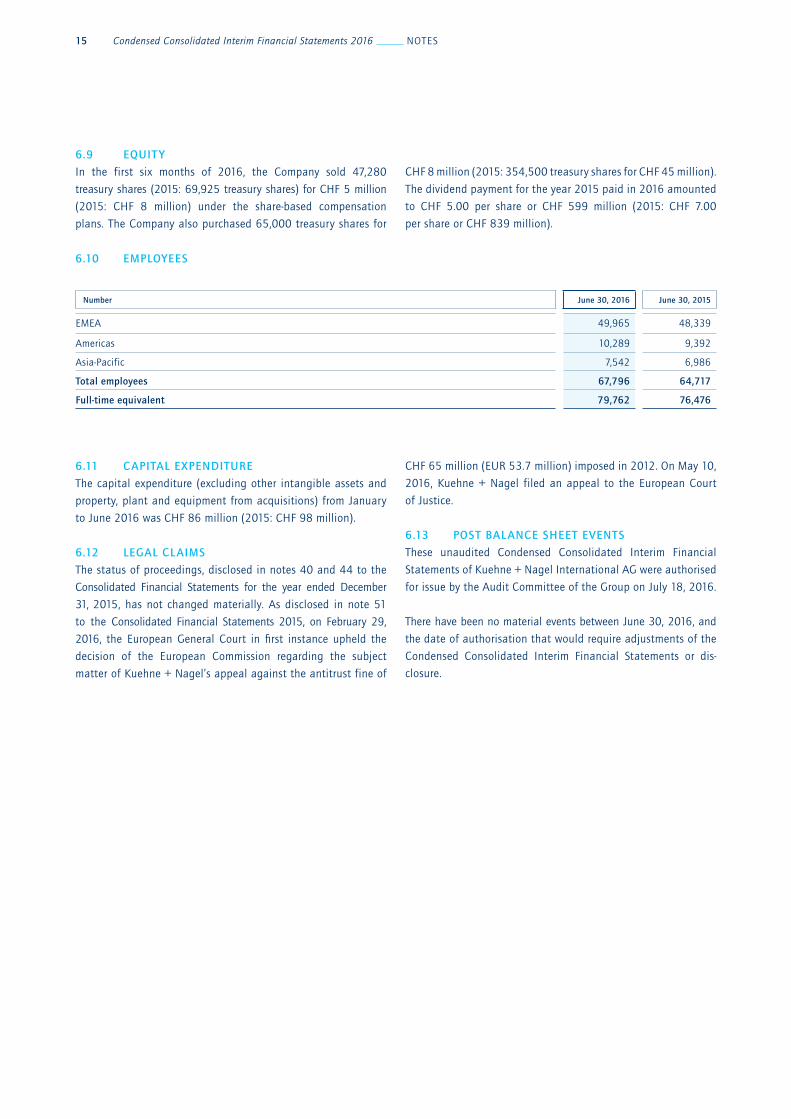
6.9 EQUIT Y
In the first six months of 2016, the Company sold 47,280
trea sury shares (2015: 69,925 treasury shares) for CHF 5 million
(2015: CHF 8 million) under the share-based compensation
plans. The Company also purchased 65,000 treasury shares for
6.10 EMPLOYEES
6.11 CAPITAL EXPENDITURE
The capital expenditure (excluding other intangible assets and
property, plant and equipment from acquisitions) from January
to June 2016 was CHF 86 million (2015: CHF 98 million).
6.12 LEGAL CLAIMS
The status of proceedings, disclosed in notes 40 and 44 to the
Con solidated Financial Statements for the year ended December
31, 2015, has not changed materially. As disclosed in note 51
to the Consolidated Financial Statements 2015, on February 29,
2016, the European General Court in first instance upheld the
decision of the European Commission regarding the subject
matter of Kuehne + Nagel’s appeal against the antitrust fine of
CHF 8 million (2015: 354,500 treasury shares for CHF 45 million).
The dividend payment for the year 2015 paid in 2016 amounted
to CHF 5.00 per share or CHF 599 million (2015: CHF 7.00
per share or CHF 839 million).
CHF 65 million (EUR 53.7 million) imposed in 2012. On May 10,
2016, Kuehne + Nagel filed an appeal to the European Court
of Justice.
6.13 POST BALANCE SHEET EVENTS
These unaudited Condensed Consolidated Interim Financial
State ments of Kuehne + Nagel International AG were authorised
for issue by the Audit Committee of the Group on July 18, 2016.
There have been no material events between June 30, 2016, and
the date of authorisation that would require adjustments of the
Con densed Consolidated Interim Financial Statements or dis-
closure.
Number June 30, 2016 June 30, 2015
EMEA 49,965 48,339
Americas 10,289 9,392
Asia-Pacific 7,542 6,986
Total employees 67,796 64,717
Full-time equivalent 79,762 76,476

Condensed Consolidated Interim Financial Statements 2016 FINANCIAL CALENDAR 16
7. F INANCIAL C ALENDAR
October 18, 2016 Nine-months 2016 results
March 1, 2017 Full year 2016 results
April 20, 2017 Three-months 2017 results
May 9, 2017 Annual General Meeting
July 18, 2017 Half-year 2017 results
October 16, 2017 Nine-months 2017 results

Kuehne + Nagel International AG
Kuehne + Nagel House
P.O. Box 67
CH-8834 Schindellegi
Telephone +41 (0) 44 786 95 11
Fax +41 (0) 44 786 95 95
www.kuehne-nagel.com