condensed consolidated interim financial statements comprehensive income: items that will never be...
TRANSCRIPT

Condensed consolidated interim financial statements for the six months ended 30 September 2016
Taking action with a strategic focus…

NICTUS LIMITED | CONDENSED CONSOLIDATED INTERIM FINANCIAL STATEMENTS 2016 3NICTUS LIMITED | CONDENSED CONSOLIDATED INTERIM FINANCIAL STATEMENTS 20162
CONDENSED CONSOLIDATED STATEMENT OF FINANCIAL POSITIONat 30 September 2016
Unaudited Audited
Figures in R’00030 Sept
201630 Sept
201531 March
2016
AssetsNon-current assetsProperty, plant and equipment 17 458 17 275 17 230 Intangible assets 228 480 355 Investments 25 210 39 658 39 841 Deferred tax assets 2 616 2 457 1 145 Loans and receivables 3 382 4 847 4 768
48 894 64 717 63 339
Current assetsCurrent assets 500 923 466 366 453 217 Total assets 549 817 531 083 516 556
Equity and liabilitiesEquityStated capital 48 668 48 668 48 668 Revaluation reserve 7 983 8 170 7 983 Retained earnings 37 949 34 462 37 749
94 600 91 300 94 400
LiabilitiesNon-current liabilitiesDeferred tax liabilities 2 475 2 584 2 602
2 475 2 584 2 602
Current liabilitiesTrade and other payables 9 277 9 819 7 610 Insurance contract liability 443 465 427 380 411 944
452 742 437 199 419 554 Total liabilities 455 217 439 783 422 156 Total equity and liabilities 549 817 531 083 516 556
VISION
Nictus is an independent diversified investment holding group that creates above average value for shareholders and other stakeholders through sustainable growth.
CORE VALUES• Individual and collective ownership• Teamwork• Respect• Adaptability• Integrity• Transparency• Fanatical discipline
• Protecting our independence• Expanding our business base in
Southern Africa• Growing a satisfied customer base• Optimising all resources• Being innovative and technology driven• Being the preferred employer
MISSION
With a culture of EXCELLENCE and through a visionary and dynamic leadership we will achieve our vision through:
“We are what we repeatedly do. Excellence then, is not an act but a habit.”
Aristotle (384 BC – 322 BC)
Hudson incliner high-lift electrical chair

NICTUS LIMITED | CONDENSED CONSOLIDATED INTERIM FINANCIAL STATEMENTS 2016 5NICTUS LIMITED | CONDENSED CONSOLIDATED INTERIM FINANCIAL STATEMENTS 20164
Unaudited Audited
Figures in R’000
Six months
ended 30 Sept
2016
Six months
ended30 Sept
2015
Yearended
31 March2016
Revenue 21 364 26 955 51 062
Cost of sales (9 067) (10 567) (20 621)
Gross profit 12 297 16 388 30 441
Other income 1 012 2 617 4 062
Investment income from operations 17 637 13 152 30 699
Operating and administrative expenses (30 460) (29 356) (59 772)
Results from operating activities 486 2 801 5 430
Investment income 2 613 2 241 3 869
Profit before taxation 3 099 5 042 9 299
Taxation expense (911) (169) (1 312)
Profit for the period 2 188 4 873 7 987
Other comprehensive income:
Items that will never be reclassified to profit or loss
Taxation related to components of other comprehensive income – – (187)
Total comprehensive income for the period 2 188 4 873 7 800
Profit attributable to:
Owners of the parent 2 188 4 873 7 987
2 188 4 873 7 987
Total comprehensive income attributable to:
Owners of the parent 2 188 4 873 7 800
2 188 4 873 7 800
Basic earnings per share (cents) 3,30 7,35 12,05
Diluted basic earnings per share (cents) 3,30 7,35 12,05
Weighted average number of shares in issue (000s) 66 270 66 270 66 270
CONDENSED CONSOLIDATED STATEMENT OF COMPREHENSIVE INCOMEfor the six months ended 30 September 2016
CONDENSED CONSOLIDATED STATEMENT OF CASH FLOWSfor the six months ended 30 September 2016
Unaudited Audited
Figures in R’000
Six months
ended 30 Sept
2016
Six months
ended30 Sept
2015
Yearended
31 March2016
Cash flows from operating activities
Cash utilised by operations (27 920) (34 171) (75 909)
Investment income received from operations 16 975 12 340 29 264
Dividends received 662 812 1 435
Dividends paid (1 988) (1 988) (1 988)
Net cash utilised by operating activities (12 271) (23 007) (47 198)
Net cash (utilised by)/generated from investing activities (28 223) 20 827 107 194
Total cash movement for the period (40 494) (2 180) 59 996
Cash and cash equivalents at the beginning of the period 118 112 58 116 58 116
Total cash and cash equivalents at end of the period 77 618 55 936 118 112

NICTUS LIMITED | CONDENSED CONSOLIDATED INTERIM FINANCIAL STATEMENTS 2016 7NICTUS LIMITED | CONDENSED CONSOLIDATED INTERIM FINANCIAL STATEMENTS 20166
CONDENSED CONSOLIDATED STATEMENT OF CHANGES IN EQUITYfor the six months ended 30 September 2016
Figures in R’000Share
capitalRevaluation
reserveRetainedearnings
Total equity
Balance at 31 March 2015 48 668 8 170 31 577 88 415 Total comprehensive income for the period
Profit for the period – – 4 873 4 873 Total comprehensive income for the period – – 4 873 4 873 Transactions with the owners of the Company
Distributions to the owners of the CompanyDividend – – (1 988) (1 988)Total transactions with the owners of the Company – – (1 988) (1 988)Balance at 30 September 2015 48 668 8 170 34 462 91 300 Total comprehensive income for the period
Profit for the period – – 3 114 3 114
Other comprehensive income
Deferred tax on property revaluations – capital gains tax rate change – (187) – (187)
Total comprehensive income for the period – (187) 3 114 2 927
Transactions with the owners of the Company
Distributions to the owners of the CompanyPrescribed dividends – – 173 173
Total transactions with the owners of the Company – – 173 173
Balance at 31 March 2016 48 668 7 983 37 749 94 400
Total comprehensive income for the period
Profit for the period – – 2 188 2 188
Total comprehensive income for the period – – 2 188 2 188
Transactions with the owners of the Company
Distributions to the owners of the CompanyDividend (note 6) – – (1 988) (1 988)
Total transactions with the owners of the Company – – (1 988) (1 988)
Balance at 30 September 2016 48 668 7 983 37 949 94 600
CONDENSED SEGMENTAL REPORTfor the six months ended 30 September 2016
Unaudited Audited
Figures in R’000
Six months
ended 30 Sept
2016
Six months
ended30 Sept
2015
Yearended
31 March2016
Segment assets
Furniture retail 64 346 64 452 63 679
Insurance and finance 522 998 510 061 486 431
587 344 574 513 550 110
Head office and eliminations (37 527) (43 430) (33 554)
549 817 531 083 516 556
Segment revenue
Furniture retail 16 101 18 849 36 564
Insurance and finance 6 167 8 829 15 918
22 268 27 678 52 482
Head office and eliminations (904) (723) (1 420)
21 364 26 955 51 062
Segment profit for the period
Furniture retail (1 204) 446 820
Insurance and finance 2 783 2 656 3 627
1 579 3 102 4 447
Head office and eliminations 609 1 771 3 540
2 188 4 873 7 987

NICTUS LIMITED | CONDENSED CONSOLIDATED INTERIM FINANCIAL STATEMENTS 2016 9NICTUS LIMITED | CONDENSED CONSOLIDATED INTERIM FINANCIAL STATEMENTS 20168
RECONCILIATION BETWEEN EARNINGS AND HEADLINE EARNINGSfor the six months ended 30 September 2016
Figures in R’000
Profit on ordinary activities Taxation
Non-controlling
interestNet
profit
Unaudited – Six months ended 30 September 2016
Profit before taxation 3 099 (911) – 2 188
Adjustments for:
Profit on disposal of property, plant and equipment (10) 3 – (7)
Headline earnings 3 089 (908) – 2 181
Headline earnings per share from operations (cents) 3,29
Diluted headline earnings per share from operations (cents) 3,29
Unaudited – Six months ended 30 September 2015
Profit before taxation 5 042 (169) – 4 873
Adjustments for:
Profit on disposal of property, plant and equipment (35) 10 – (25)
Headline earnings 5 007 (159) – 4 848
Headline earnings per share from operations (cents) 7,32
Diluted headline earnings per share from operations (cents) 7,32
Audited – Year ended 31 March 2016
Profit before taxation 9 299 (1 312) – 7 987
Adjustments for:
Profit on disposal of property, plant and equipment (18) 5 – (13)
Headline earnings 9 281 (1 307) – 7 974
Headline earnings per share from operations (cents) 12,03
Diluted headline earnings per share from operations (cents) 12,03
1. Basis of preparationThe condensed consolidated interim financial statements (interim financial statements) are prepared in accordance with International Financial Reporting Standards, IAS 34 Interim Financial Reporting, the SAICA Financial Reporting Guides as issued by the Accounting Practices Committee, the Financial Pronouncements as issued by the Financial Reporting Standards Council and the requirements of the Companies Act of South Africa. The accounting policies applied in the preparation of these interim financial statements are in terms of International Financial Reporting Standards and are consistent with those applied in the previous annual financial statements.
The interim financial statements are presented in thousands of South African Rand (R’000s) on the historical cost basis, except held for trading investments which are measured at fair value and land and buildings held for administrative purposes which are measured at revalued amounts.
The interim financial statements for the period ended 30 September 2016, together with the statements regarding the prospects of the group, have not been audited by the group’s auditors.
The interim financial statements as reported herein have been prepared by the group financial director of Nictus Limited, Eckhart H Prozesky CA(SA).
2. Directors’ responsibilityThe directors take full responsibility for the preparation of the interim financial statements.
3. Related partiesDuring the period, certain companies within the group entered into transactions with each other. These intra-group transactions have been eliminated on consolidation. Related party information is unchanged from that reported at 31 March 2016. Refer to the 2016 audited financial statements for further information, accessible on the Nictus website.
4. Events after reporting dateThere were no events after the reporting date and up to the date of approval of these interim financial statements that affected the presentation of the interim financial statements for the period ended 30 September 2016.
5. Changes to the board Nicolaas C Tromp and Barend J Willemse were re-elected as directors of Nictus Limited at the annual general meeting on 18 August 2016.
6. DividendThe board declared a final dividend of 3 cents per ordinary share for the year ended 31 March 2016 on 30 June 2016, to all ordinary shareholders recorded in the books of Nictus Limited at the close of business on Friday, 22 July 2016. The dividend was paid on Monday, 25 July 2016.
No interim dividend has been declared.
NOTES TO THE FINANCIAL INFORMATIONfor the six months ended 30 September 2016

NICTUS LIMITED | CONDENSED CONSOLIDATED INTERIM FINANCIAL STATEMENTS 2016 11NICTUS LIMITED | CONDENSED CONSOLIDATED INTERIM FINANCIAL STATEMENTS 201610
7. Determination and disclosure of fair valuesFair values have been determined for measurement and/or disclosure purposes based on the following methods:
Property, plant and equipmentThe fair value of land and buildings is estimated by using a combination of the income capitalisation method and the depreciated replacement value method. This method requires the net annual income generated by the property, based on market trends, to be capitalised at an appropriate rate of return to reflect risk, specific investment demands and the overall condition of the structures.
Investments in equity and debt securitiesThe fair value of financial assets at fair value through profit or loss is determined by reference to their quoted closing market price at the reporting date. The fair value of held-to-maturity investments is determined for disclosure purposes only.
The fair values of the financial assets were determined as follows:• The fair values of listed or quoted investments are based on the quoted market price; and• The fair values of debt securities are based on the quoted closing market price as reflected on the
recognised exchange.
Trade and other receivablesThe fair value of trade and other receivables is estimated as the present value of future cash flows, discounted at the market rate of interest at the reporting date. The carrying amount of short-term trade and other receivables at amortised cost is believed to approximate their fair values.
Non-derivative financial liabilitiesFair value, which is determined for disclosure purposes, is calculated based on the present value of future principal and interest cash flows, discounted at the market rate of interest at the reporting date.
Interest-bearing loans and borrowings and loans to group companiesFair value is calculated based on the present value of future principal and interest cash flows, discounted at the market rate of interest at the reporting date. The interest rate used for determining the fair value is the prime interest rate.
Trade and other payablesAll trade and other payables are of a short-term nature and the carrying value of trade and other payables at amortised cost is believed to approximate their fair value.
Cash and cash equivalentsThe cash and cash equivalents for the group is of a short-term nature and the fair value of bank overdrafts approximates the carrying amount.
NOTES TO THE FINANCIAL INFORMATION continued
for the six months ended 30 September 2016
NOTES TO THE FINANCIAL INFORMATION continued
for the six months ended 30 September 2016
7. Determination and disclosure of fair values continued
7.1 Fair value of land and buildingsLand and buildings, which consist of business premises situated on erf 2134, Ferndale, Johannesburg, are independently valued on an ad-hoc basis. The last independent valuation was performed on 31 March 2014. The company’s directors value the group’s property portfolio on an annual basis. An external, independent valuation company, having appropriate recognised professional qualifications and recent experience in the locations and category of property being valued, also provides supporting information used in the annual directors’ valuation process. The fair values are based on valuations and other market information that take into consideration the estimated rental value and depreciated replacement value of the property. A market yield is applied to the estimated rental value to arrive at the gross property valuation. The directors have assessed the residual value of the properties at 31 March 2016 and calculated that the residual value approximates the current carrying value. No depreciation has therefore been recognised in the current period in respect of the properties.
Figures in R’000 Level 1 Level 2 Level 3 Total
Land and buildings – – 16 100 16 100
The valuation techniques to fair value assets and liabilities in Level 3.
Assets Method Major assumptions
Land and buildings Income capitalisation method Capitalisation rateRental per square metre
per Rode report
Figures in R’000Land and
buildings
Reconciliation of land and buildings at fair value in Level 3
Balance at 1 April 2016 16 100
Total gains or losses in other comprehensive income –
Fair value measurements –
Balance at 30 September 2016 16 100
Sensitivity analysis Land and buildings
Presented below is an analysis of the impact on the fair value of the land and buildings for changes in the key valuation assumptions.
Figures in R’000 Capitalisation rate
Income method 13,25% 14,25% 15,25%
Rental (5% decrease) 16 550 15 400 14 400
Rental (rate per Rode report) 17 400 16 100 15 100
Rental (5% increase) 18 300 17 000 15 900
NICTUS LIMITED | CONDENSED CONSOLIDATED INTERIM FINANCIAL STATEMENTS 2016 13NICTUS LIMITED | CONDENSED CONSOLIDATED INTERIM FINANCIAL STATEMENTS 201612
7. Determination and disclosure of fair values continued
7.1 Fair value of land and buildings continued
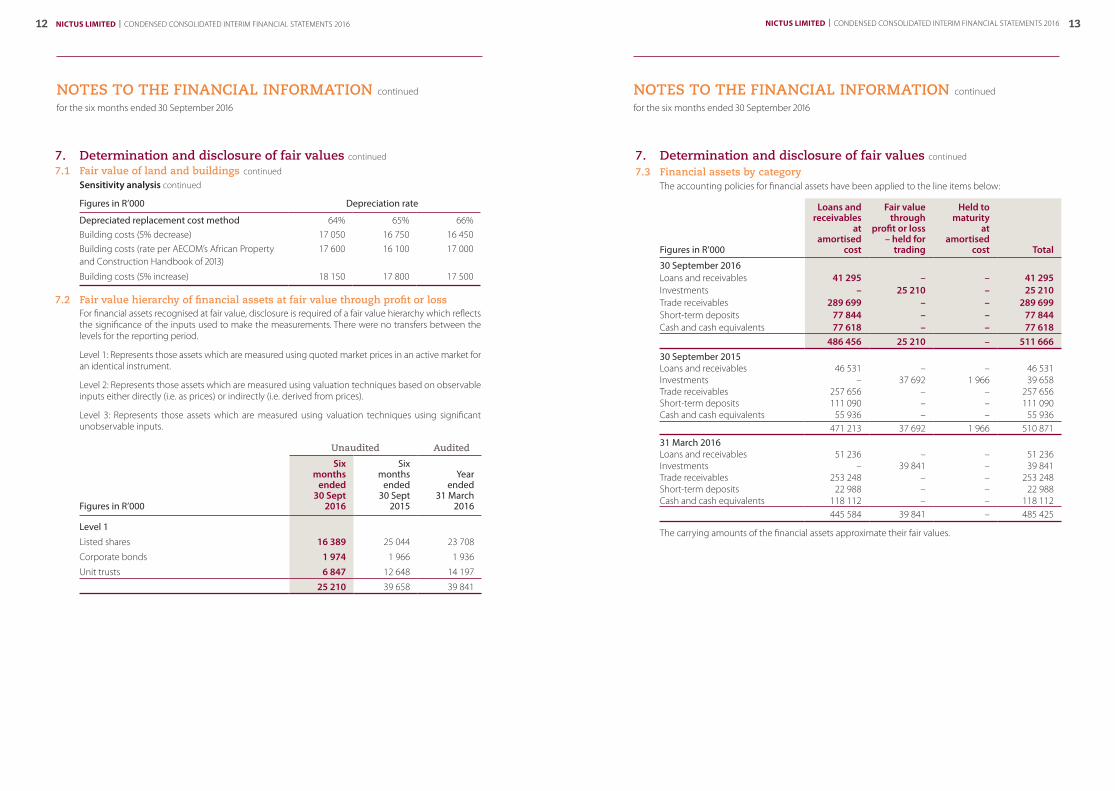
Sensitivity analysis continued
Figures in R’000 Depreciation rate
Depreciated replacement cost method 64% 65% 66%Building costs (5% decrease) 17 050 16 750 16 450Building costs (rate per AECOM’s African Property and Construction Handbook of 2013)
17 600 16 100 17 000
Building costs (5% increase) 18 150 17 800 17 500
7.2 Fair value hierarchy of financial assets at fair value through profit or lossFor financial assets recognised at fair value, disclosure is required of a fair value hierarchy which reflects the significance of the inputs used to make the measurements. There were no transfers between the levels for the reporting period.
Level 1: Represents those assets which are measured using quoted market prices in an active market for an identical instrument.
Level 2: Represents those assets which are measured using valuation techniques based on observable inputs either directly (i.e. as prices) or indirectly (i.e. derived from prices).
Level 3: Represents those assets which are measured using valuation techniques using significant unobservable inputs.
Unaudited Audited
Figures in R’000
Six months
ended 30 Sept
2016
Six months
ended30 Sept
2015
Yearended
31 March2016
Level 1
Listed shares 16 389 25 044 23 708
Corporate bonds 1 974 1 966 1 936
Unit trusts 6 847 12 648 14 197
25 210 39 658 39 841
NOTES TO THE FINANCIAL INFORMATION continued
for the six months ended 30 September 2016
NOTES TO THE FINANCIAL INFORMATION continued
for the six months ended 30 September 2016
7. Determination and disclosure of fair values continued
7.3 Financial assets by categoryThe accounting policies for financial assets have been applied to the line items below:
Figures in R’000
Loans andreceivables
at amortised
cost
Fair valuethrough
profit or loss – held for
trading
Held to maturity
at amortised
cost Total
30 September 2016Loans and receivables 41 295 – – 41 295 Investments – 25 210 – 25 210 Trade receivables 289 699 – – 289 699 Short-term deposits 77 844 – – 77 844 Cash and cash equivalents 77 618 – – 77 618
486 456 25 210 – 511 666
30 September 2015Loans and receivables 46 531 – – 46 531 Investments – 37 692 1 966 39 658 Trade receivables 257 656 – – 257 656 Short-term deposits 111 090 – – 111 090 Cash and cash equivalents 55 936 – – 55 936
471 213 37 692 1 966 510 871 31 March 2016Loans and receivables 51 236 – – 51 236 Investments – 39 841 – 39 841 Trade receivables 253 248 – – 253 248 Short-term deposits 22 988 – – 22 988 Cash and cash equivalents 118 112 – – 118 112
445 584 39 841 – 485 425
The carrying amounts of the financial assets approximate their fair values.

NICTUS LIMITED | CONDENSED CONSOLIDATED INTERIM FINANCIAL STATEMENTS 2016 15NICTUS LIMITED | CONDENSED CONSOLIDATED INTERIM FINANCIAL STATEMENTS 201614
NOTES TO THE FINANCIAL INFORMATION continued
for the six months ended 30 September 2016
7. Determination and disclosure of fair values continued
7.4 Financial liabilities by categoryThe accounting policies for financial liabilities have been applied to the line items below:
Figures in R’000
Financial liabilities at
amortisedcost Total
30 September 2016Trade and other payables 6 429 6 429
30 September 2015Trade and other payables 9 701 9 701 31 March 2016Trade and other payables 6 905 6 905
The carrying amounts of the financial liabilities approximate their fair values.
8. Results overview8.1 Furniture segment
The retail environment is currently subject to weaker consumer demand and high interest rates. Due to lower sales levels achieved and reduced profit margins the profitability of the furniture segment was under pressure during the six-month period ended 30 September 2016.
8.2 Insurance and finance segmentThe segment continued to deliver positive results during the six-month period ended 30 September 2016. Corporate Guarantee reduced its exposure to equity markets to restrict potential losses caused by currency and share price fluctuations attributed to the political, global and local economic instability. The active management of the investments contributed to an increase in investment income generated by operations.
8.3 Holding Company levelThe company continued to invest in expanding its talent pool and succession planning to support its current and future business operations. This resulted in reduced profitability, however we believe it to be prudent and necessary to achieve its strategies.
9. ProspectsThe Group has historically generated higher earnings in the second part of the financial year. The board is confident that despite the economic, political and environmental challenges within the South African economy, the various segments are well placed to build on the results achieved in the first six months.
On behalf of the board
Gerard R de V Tromp Eckhart H ProzeskyGroup managing director Group financial director
Randburg9 December 2016
CONTACT INFORMATION
Nictus Limited(Nictus or the company)(Incorporated in the Republic of South Africa)Registration number RSA: 81/011858/06Registration number NAM: 781/11858JSE share code: NCSISIN number: NA0009123481
www.nictuslimited.co.za
Company secretaryVeritas Board of Executors Proprietary LimitedRegistration number 1984/007487/071st Floor, Nictus BuildingCorner of Pretoria and Dover Street, RandburgPO Box 2878, Randburg 2125
Auditors and reporting accountantKPMG Inc.Registration number 1999/021543/21KPMG Crescent85 Empire Road, Parktown 2193Private Bag 9, Parktown 2122
SponsorKPMG Services Proprietary LimitedRegistration No: 1999/012876/0785 Empire Road, ParktownJohannesburg, 2193Private Bag X9, Parkview, 2122
Registered office of the CompanyHead office1st Floor, Nictus BuildingCorner of Pretoria and Dover Street, RandburgPO Box 2878, Randburg 2125
Windhoek officeNictus Building, 1st floor140 Mandume Ndemufayo AvenueWindhoek Private Bag 13231, Windhoek
DirectorsBarend J Willemse (Independent non-executive chairman)Gerard Swart (Independent non-executive)John D Mandy (Independent non-executive)Philippus J de W Tromp (Non-executive)Nicolaas C Tromp (Non-executive)Gerard R de V Tromp (Group managing director)Eckhart H Prozesky (Group financial director)
Atlas 6 piece corner
lounge suite

www.nictuslimited.co.za