condensed interim consolidated financial statements€¦ · consolidated statement of cash flows 8...
TRANSCRIPT

Condensed interim consolidated Financial
Statements
Six months ended June 30, 2016
Disclaimer
This is a free translation into English of the condensed interim consolidated financial statements prepared in French and is provided
solely for the convenience of English speaking readers.
First half 2016 - Condensed interim consolidated financial statements 2
Financial statements
Consolidated income statement 3 Consolidated statement of comprehensive income 4 Consolidated statement of financial position 5 Consolidated statements of changes in shareholders' equity 6 Consolidated statement of cash flows 8
Segment information
Revenues 10 Revenues to reported EBITDA 12 Reported EBITDA to operating income and investments 14 Consolidated statement of financial position for the half-year ended June 30, 2016 16 Consolidated statement of financial position for year ended December 31, 2015 18
Notes to the consolidated financial statements
NOTE 1 Basis of preparation of the consolidated financial statements 20
1.1 Basis of preparation of the financial statements 20 1.2 Change in segment information reporting – Financial
measures 20 1.3 Uses of estimates and judgment 21 1.4 New standards and interpretations compulsory after June 30,
2106 21
NOTE 2 Gains and losses on disposal and main changes in scope of consolidation 23
NOTE 3 Sales 24 3.1 Changes in revenues from the Group 24 3.2 Management of the working capital - receivables 24
NOTE 4 Purchases and other expenses 24 4.1 External purchases 24 4.2 Other operating expenses 24 4.3 Restructuring 24 4.4 Management of the working capital - payables 25
NOTE 5 Impairment loss 25 NOTE 6 Income tax 26 NOTE 7 Financial assets, liabilities and financial result 26 7.1 Financial result 26 7.2 Change of cash flow hedges in the consolidated
statement of comprehensive income 26 7.3 Net financial debt 26 7.4 Main debt issues and redemptions 27 7.5 Orange's debt ratings 27 7.6 Management of covenants 27 7.7 Assets available for sale 27 7.8 Fair value levels of financial assets and liabilities 28
NOTE 8 Shareholders' equity 28 8.1 Changes in share capital 28 8.2 Treasury shares 28 8.3 Dividends 28 8.4 Non-controlling interests 29 8.5 Cumulative translation adjustment 29 8.6 Subordinated notes 29
NOTE 9 Litigations and unrecognized contractual commitments 30
9.1 Litigations 30 9.2 Unrecognized contractual commitments 30
NOTE 10 Related party transaction 30 NOTE 11 Subsequent events 31
The accompanying notes are an integral part of the consolidated financial statements.
First half 2016 - Condensed interim consolidated financial statements 3
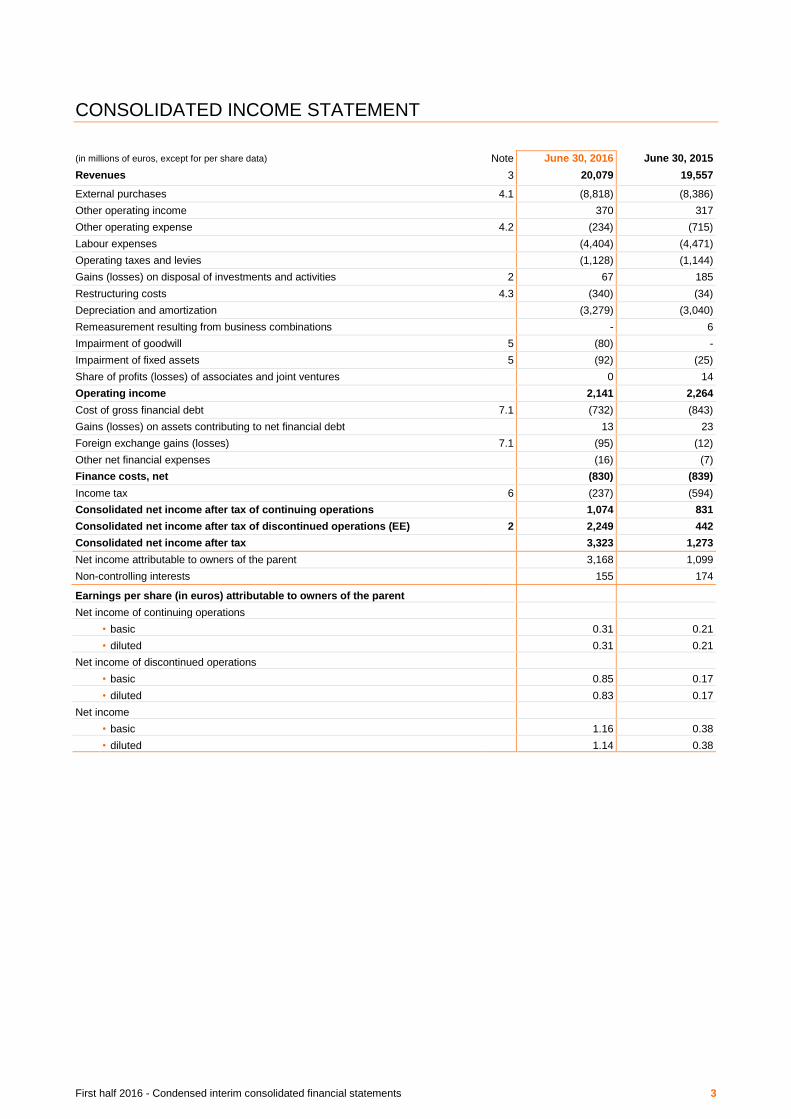
CONSOLIDATED INCOME STATEMENT
(in millions of euros, except for per share data) Note June 30, 2016 June 30, 2015
Revenues 3 20,079 19,557
External purchases 4.1 (8,818) (8,386)
Other operating income 370 317
Other operating expense 4.2 (234) (715)
Labour expenses (4,404) (4,471)
Operating taxes and levies (1,128) (1,144)
Gains (losses) on disposal of investments and activities 2 67 185
Restructuring costs 4.3 (340) (34)
Depreciation and amortization (3,279) (3,040)
Remeasurement resulting from business combinations - 6
Impairment of goodwill 5 (80) -
Impairment of fixed assets 5 (92) (25)
Share of profits (losses) of associates and joint ventures 0 14
Operating income 2,141 2,264
Cost of gross financial debt 7.1 (732) (843)
Gains (losses) on assets contributing to net financial debt 13 23
Foreign exchange gains (losses) 7.1 (95) (12)
Other net financial expenses (16) (7)
Finance costs, net (830) (839)
Income tax 6 (237) (594)
Consolidated net income after tax of continuing operations 1,074 831
Consolidated net income after tax of discontinued operations (EE) 2 2,249 442
Consolidated net income after tax 3,323 1,273
Net income attributable to owners of the parent 3,168 1,099
Non-controlling interests 155 174
Earnings per share (in euros) attributable to owners of the parent
Net income of continuing operations
• basic 0.31 0.21
• diluted 0.31 0.21
Net income of discontinued operations
• basic 0.85 0.17
• diluted 0.83 0.17
Net income
• basic 1.16 0.38
• diluted 1.14 0.38
First half 2016 - Condensed interim consolidated financial statements 4
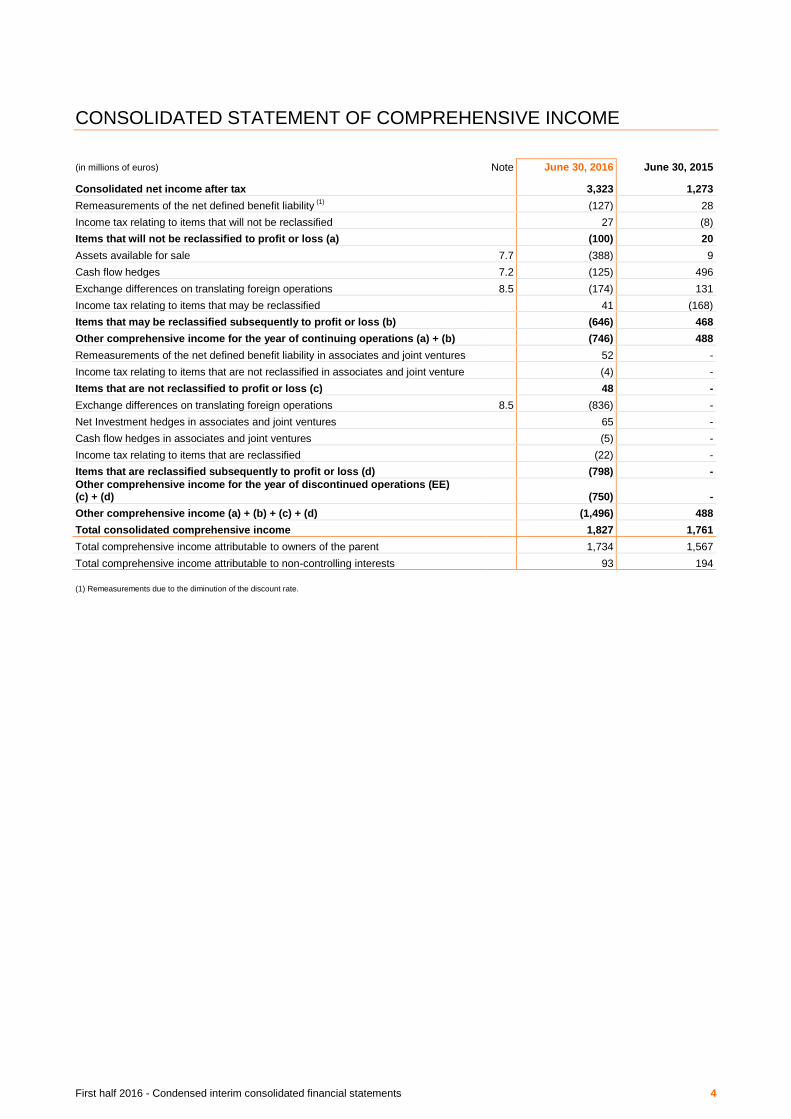
CONSOLIDATED STATEMENT OF COMPREHENSIVE INCOME
(in millions of euros) Note June 30, 2016 June 30, 2015
Consolidated net income after tax 3,323 1,273
Remeasurements of the net defined benefit liability (1)
(127) 28
Income tax relating to items that will not be reclassified 27 (8)
Items that will not be reclassified to profit or loss (a) (100) 20
Assets available for sale 7.7 (388) 9
Cash flow hedges 7.2 (125) 496
Exchange differences on translating foreign operations 8.5 (174) 131
Income tax relating to items that may be reclassified 41 (168)
Items that may be reclassified subsequently to profit or loss (b) (646) 468
Other comprehensive income for the year of continuing operations (a) + (b) (746) 488
Remeasurements of the net defined benefit liability in associates and joint ventures 52 -
Income tax relating to items that are not reclassified in associates and joint venture (4) -
Items that are not reclassified to profit or loss (c) 48 -
Exchange differences on translating foreign operations 8.5 (836) -
Net Investment hedges in associates and joint ventures 65 -
Cash flow hedges in associates and joint ventures (5) -
Income tax relating to items that are reclassified (22) -
Items that are reclassified subsequently to profit or loss (d) (798) -
Other comprehensive income for the year of discontinued operations (EE) (c) + (d)
(750) -
Other comprehensive income (a) + (b) + (c) + (d) (1,496) 488
Total consolidated comprehensive income 1,827 1,761
Total comprehensive income attributable to owners of the parent 1,734 1,567
Total comprehensive income attributable to non-controlling interests 93 194
(1) Remeasurements due to the diminution of the discount rate.
First half 2016 - Condensed interim consolidated financial statements 5
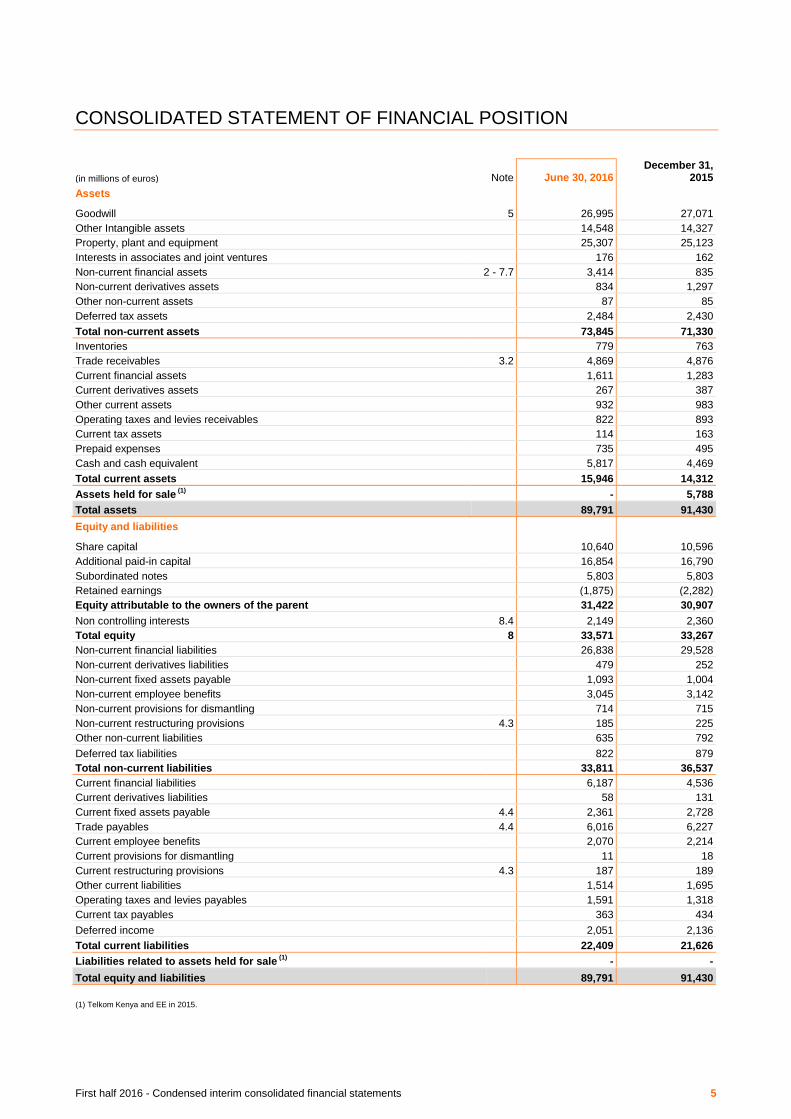
CONSOLIDATED STATEMENT OF FINANCIAL POSITION
(in millions of euros) Note June 30, 2016 December 31,
2015
Assets
Goodwill 5 26,995 27,071
Other Intangible assets 14,548 14,327
Property, plant and equipment 25,307 25,123
Interests in associates and joint ventures 176 162
Non-current financial assets 2 - 7.7 3,414 835
Non-current derivatives assets 834 1,297
Other non-current assets 87 85
Deferred tax assets 2,484 2,430
Total non-current assets 73,845 71,330
Inventories 779 763
Trade receivables 3.2 4,869 4,876
Current financial assets 1,611 1,283
Current derivatives assets 267 387
Other current assets 932 983
Operating taxes and levies receivables 822 893
Current tax assets 114 163
Prepaid expenses 735 495
Cash and cash equivalent 5,817 4,469
Total current assets 15,946 14,312
Assets held for sale (1)
- 5,788
Total assets 89,791 91,430
Equity and liabilities
Share capital 10,640 10,596
Additional paid-in capital 16,854 16,790
Subordinated notes 5,803 5,803
Retained earnings (1,875) (2,282)
Equity attributable to the owners of the parent 31,422 30,907
Non controlling interests 8.4 2,149 2,360
Total equity 8 33,571 33,267
Non-current financial liabilities 26,838 29,528
Non-current derivatives liabilities 479 252
Non-current fixed assets payable 1,093 1,004
Non-current employee benefits 3,045 3,142
Non-current provisions for dismantling 714 715
Non-current restructuring provisions 4.3 185 225
Other non-current liabilities 635 792
Deferred tax liabilities 822 879
Total non-current liabilities 33,811 36,537
Current financial liabilities 6,187 4,536
Current derivatives liabilities 58 131
Current fixed assets payable 4.4 2,361 2,728
Trade payables 4.4 6,016 6,227
Current employee benefits 2,070 2,214
Current provisions for dismantling 11 18
Current restructuring provisions 4.3 187 189
Other current liabilities 1,514 1,695
Operating taxes and levies payables 1,591 1,318
Current tax payables 363 434
Deferred income 2,051 2,136
Total current liabilities 22,409 21,626
Liabilities related to assets held for sale (1)
- -
Total equity and liabilities 89,791 91,430
(1) Telkom Kenya and EE in 2015.
First half 2016 - Condensed interim consolidated financial statements 6
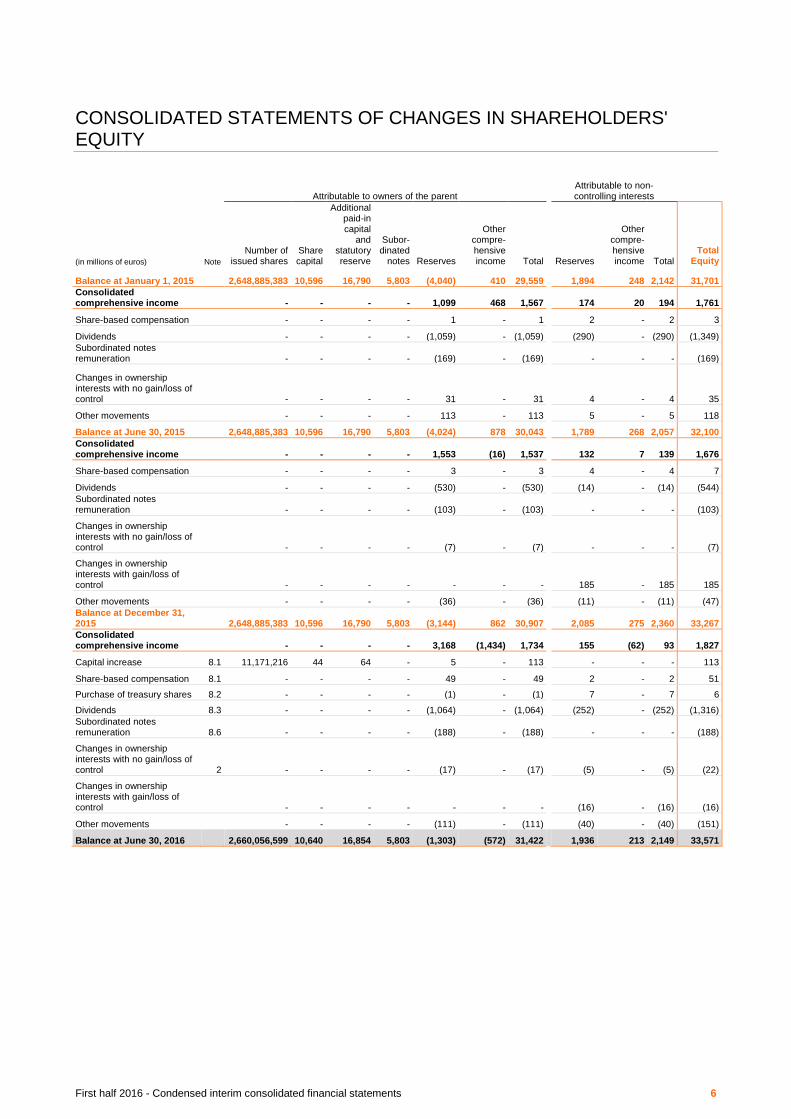
CONSOLIDATED STATEMENTS OF CHANGES IN SHAREHOLDERS' EQUITY
(in millions of euros) Note
Attributable to owners of the parent Attributable to non-controlling interests
Number of issued shares
Share capital
Additional paid-in capital
and statutory reserve
Subor- dinated
notes Reserves
Other compre- hensive income Total Reserves
Other compre- hensive income Total
Total Equity
Balance at January 1, 2015 2,648,885,383 10,596 16,790 5,803 (4,040) 410 29,559 1,894 248 2,142 31,701
Consolidated comprehensive income - - - - 1,099 468 1,567 174 20 194 1,761
Share-based compensation - - - - 1 - 1 2 - 2 3
Dividends - - - - (1,059) - (1,059) (290) - (290) (1,349)
Subordinated notes remuneration - - - - (169) - (169) - - - (169)
Changes in ownership interests with no gain/loss of control - - - - 31 - 31 4 - 4 35
Other movements - - - - 113 - 113 5 - 5 118
Balance at June 30, 2015 2,648,885,383 10,596 16,790 5,803 (4,024) 878 30,043 1,789 268 2,057 32,100
Consolidated comprehensive income - - - - 1,553 (16) 1,537 132 7 139 1,676
Share-based compensation - - - - 3 - 3 4 - 4 7
Dividends - - - - (530) - (530) (14) - (14) (544)
Subordinated notes remuneration - - - - (103) - (103) - - - (103)
Changes in ownership interests with no gain/loss of control - - - - (7) - (7) - - - (7)
Changes in ownership interests with gain/loss of control - - - - - - - 185 - 185 185
Other movements - - - - (36) - (36) (11) - (11) (47)
Balance at December 31, 2015 2,648,885,383 10,596 16,790 5,803 (3,144) 862 30,907 2,085 275 2,360 33,267
Consolidated comprehensive income - - - - 3,168 (1,434) 1,734 155 (62) 93 1,827
Capital increase 8.1 11,171,216 44 64 - 5 - 113 - - - 113
Share-based compensation 8.1 - - - - 49 - 49 2 - 2 51
Purchase of treasury shares 8.2 - - - - (1) - (1) 7 - 7 6
Dividends 8.3 - - - - (1,064) - (1,064) (252) - (252) (1,316)
Subordinated notes remuneration 8.6 - - - - (188) - (188) - - - (188)
Changes in ownership interests with no gain/loss of control 2 - - - - (17) - (17) (5) - (5) (22)
Changes in ownership interests with gain/loss of control - - - - - - - (16) - (16) (16)
Other movements - - - - (111) - (111) (40) - (40) (151)
Balance at June 30, 2016 2,660,056,599 10,640 16,854 5,803 (1,303) (572) 31,422 1,936 213 2,149 33,571

First half 2016 - Condensed interim consolidated financial statements 7
ANALYSIS OF CHANGES IN SHAREHOLDERS' EQUITY RELATED TO COMPONENTS OF THE OTHER COMPREHENSIVE INCOME
Attributable to owners of the parent Attributable to non-controlling interests
Assets available
for sale Hedging
instruments
Transla- tion
adjust- ment
Actuarial gains
and losses
Defer- red
taxes
Other components
of comprehen- sive income
of associates and joint ventures Total
Hedging instruments
Transla- tion
adjust- ment
Actuarial gains
and losses
Defer- red
taxes Total
Total other
compre-hensive income
Balance at January 1, 2015 21 (487) 1,152 (516) 312 (72) 410 (1) 272 (30) 7 248 658
Variation 9 496 111 28 (176) - 468 - 20 - - 20 488
Balance at June 30, 2015 30 9 1,263 (488) 136 (72) 878 (1) 292 (30) 7 268 1,146
Variation 6 43 (51) 8 (20) (2) (16) (1) (3) 17 (6) 7 (9)
Balance at December 31, 2015 36 52 1,212 (480) 116 (74) 862 (2) 289 (13) 1 275 1,137
Variation (388) (62) (946) (127) 46 43 (1,434) 2 (64) - - (62) (1,496)
Balance at June 30, 2016 (352) (10) 266 (607) 162 (31) (572) - 225 (13) 1 213 (359)
First half 2016 - Condensed interim consolidated financial statements 8
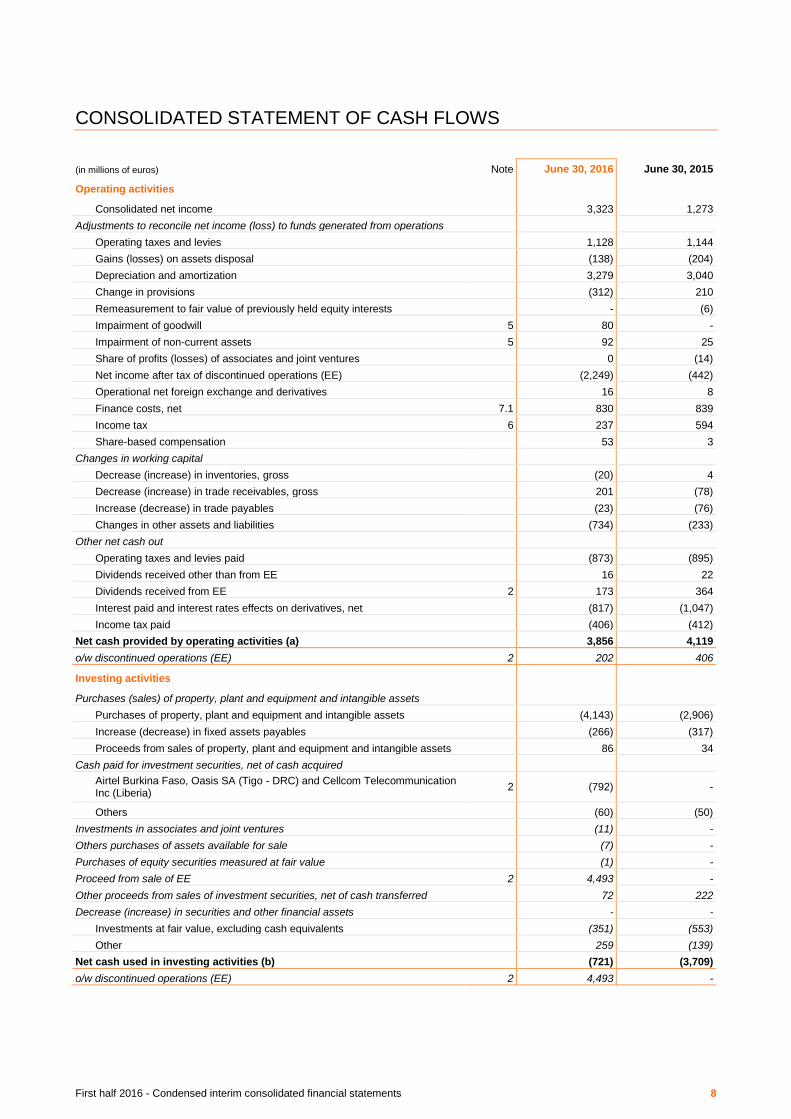
CONSOLIDATED STATEMENT OF CASH FLOWS
(in millions of euros) Note June 30, 2016 June 30, 2015
Operating activities
Consolidated net income 3,323 1,273
Adjustments to reconcile net income (loss) to funds generated from operations
Operating taxes and levies 1,128 1,144
Gains (losses) on assets disposal (138) (204)
Depreciation and amortization 3,279 3,040
Change in provisions (312) 210
Remeasurement to fair value of previously held equity interests - (6)
Impairment of goodwill 5 80 -
Impairment of non-current assets 5 92 25
Share of profits (losses) of associates and joint ventures 0 (14)
Net income after tax of discontinued operations (EE) (2,249) (442)
Operational net foreign exchange and derivatives 16 8
Finance costs, net 7.1 830 839
Income tax 6 237 594
Share-based compensation 53 3
Changes in working capital
Decrease (increase) in inventories, gross (20) 4
Decrease (increase) in trade receivables, gross 201 (78)
Increase (decrease) in trade payables (23) (76)
Changes in other assets and liabilities (734) (233)
Other net cash out
Operating taxes and levies paid (873) (895)
Dividends received other than from EE 16 22
Dividends received from EE 2 173 364
Interest paid and interest rates effects on derivatives, net (817) (1,047)
Income tax paid (406) (412)
Net cash provided by operating activities (a) 3,856 4,119
o/w discontinued operations (EE) 2 202 406
Investing activities
Purchases (sales) of property, plant and equipment and intangible assets
Purchases of property, plant and equipment and intangible assets (4,143) (2,906)
Increase (decrease) in fixed assets payables (266) (317)
Proceeds from sales of property, plant and equipment and intangible assets 86 34
Cash paid for investment securities, net of cash acquired
Airtel Burkina Faso, Oasis SA (Tigo - DRC) and Cellcom Telecommunication Inc (Liberia)
2 (792) -
Others (60) (50)
Investments in associates and joint ventures (11) -
Others purchases of assets available for sale (7) -
Purchases of equity securities measured at fair value (1) -
Proceed from sale of EE 2 4,493 -
Other proceeds from sales of investment securities, net of cash transferred 72 222
Decrease (increase) in securities and other financial assets - -
Investments at fair value, excluding cash equivalents (351) (553)
Other 259 (139)
Net cash used in investing activities (b) (721) (3,709)
o/w discontinued operations (EE) 2 4,493 -
First half 2016 - Condensed interim consolidated financial statements 9
ESPACE
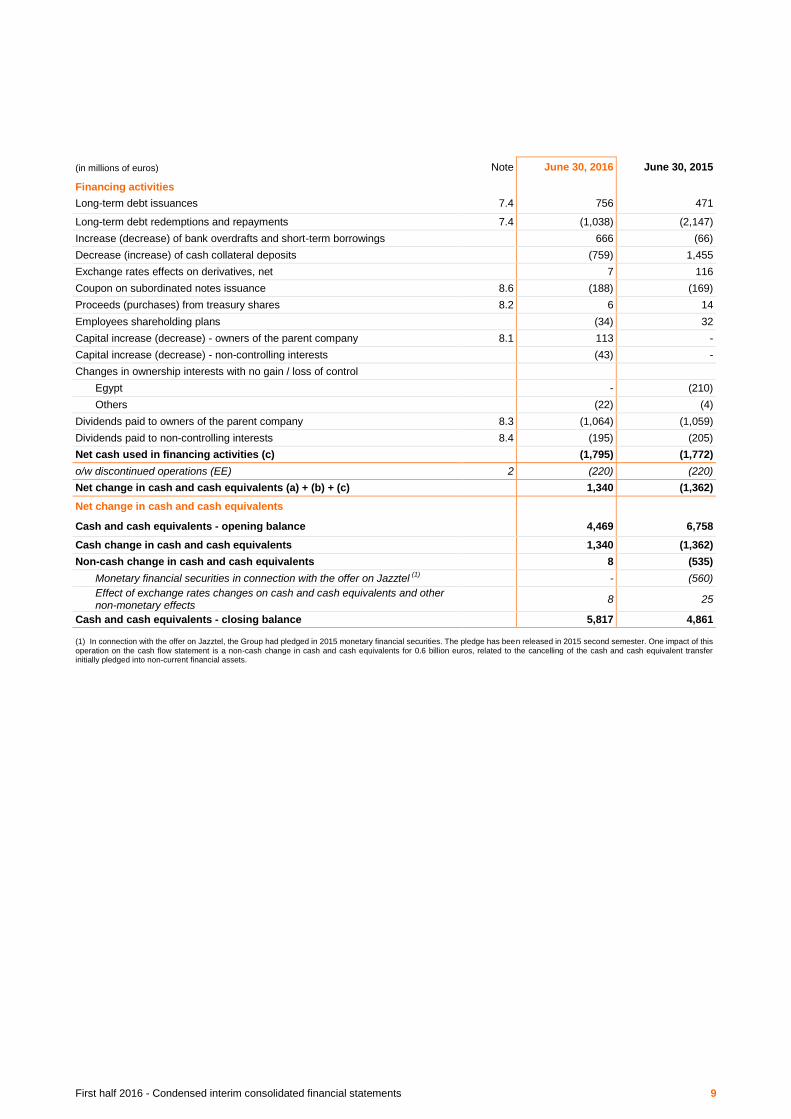
(in millions of euros) Note June 30, 2016 June 30, 2015
Financing activities
Long-term debt issuances 7.4 756 471
Long-term debt redemptions and repayments 7.4 (1,038) (2,147)
Increase (decrease) of bank overdrafts and short-term borrowings 666 (66)
Decrease (increase) of cash collateral deposits (759) 1,455
Exchange rates effects on derivatives, net 7 116
Coupon on subordinated notes issuance 8.6 (188) (169)
Proceeds (purchases) from treasury shares 8.2 6 14
Employees shareholding plans (34) 32
Capital increase (decrease) - owners of the parent company 8.1 113 -
Capital increase (decrease) - non-controlling interests (43) -
Changes in ownership interests with no gain / loss of control
Egypt - (210)
Others (22) (4)
Dividends paid to owners of the parent company 8.3 (1,064) (1,059)
Dividends paid to non-controlling interests 8.4 (195) (205)
Net cash used in financing activities (c) (1,795) (1,772)
o/w discontinued operations (EE) 2 (220) (220)
Net change in cash and cash equivalents (a) + (b) + (c) 1,340 (1,362)
Net change in cash and cash equivalents
Cash and cash equivalents - opening balance 4,469 6,758
Cash change in cash and cash equivalents 1,340 (1,362)
Non-cash change in cash and cash equivalents 8 (535)
Monetary financial securities in connection with the offer on Jazztel (1)
- (560)
Effect of exchange rates changes on cash and cash equivalents and other non-monetary effects
8 25
Cash and cash equivalents - closing balance 5,817 4,861
(1) In connection with the offer on Jazztel, the Group had pledged in 2015 monetary financial securities. The pledge has been released in 2015 second semester. One impact of this operation on the cash flow statement is a non-cash change in cash and cash equivalents for 0.6 billion euros, related to the cancelling of the cash and cash equivalent transfer initially pledged into non-current financial assets.

First half 2016 - Condensed interim consolidated financial statements 10
SEGMENT INFORMATION
Revenues
(in millions of euros) France
Spain Poland
Belgium &
Luxembourg
June 30, 2016
Revenues 9,376
2,418
1,306
609
Mobile services 3,590
1,263
614
504
Mobile equipment sales 326
240
106
56
Fixed services 5,183
915
542
36
Other revenues 277
-
44
13
Voice services -
-
-
-
Data services -
-
-
-
IT & integration services -
-
-
-
International Carriers -
-
-
-
Shared services -
-
-
-
external 9,016
2,404
1,290
602
inter-operating segments 360
14
16
7
June 30, 2015
Revenues 9,485
1,847
1,436
607
Mobile services 3,732
1,145
664
495
Mobile equipment sales 312
238
69
63
Fixed services 5,162
463
627
42
Other revenues 279
1
76
7
Voice services -
-
-
-
Data services -
-
-
-
IT & integration services -
-
-
-
International Carriers -
-
-
-
Shared services -
-
-
-
external 9,113
1,829
1,419
598
inter-operating segments 372
18
17
9
(1) Including, in 2016, revenues of 2,128 million euros in France, 14 million euros in Spain, 9 million euros in Poland, 758 million euros in other European countries and 280 million euros in other countries. Including, in 2015, revenues of 2,110 million euros in France, 15 million euros in Spain, 9 million euros in Poland, 341 million euros in other European countries and 696 million euros in other countries.
(2) Including revenues of 859 million euros in France in 2016.
Including revenues of 905 million euros in France in 2015.

First half 2016 - Condensed interim consolidated financial statements 11
Europe Africa &
Middle-East
Enterprise(1)
International Carriers &
Shared Services
(2)
Eliminations Consolidated
accounts
Central European countries
Eliminations Europe
Total
798 (3)
5,128
2,516
3,189
904
(1,034)
20,079
658 (1)
3,038
2,055
-
-
-
-
51 -
453
39
-
-
-
-
67 -
1,560
380
-
-
-
-
22 (2)
77
42
-
-
-
-
- -
-
-
757
-
-
-
- -
-
-
1,425
-
-
-
- -
-
-
1,007
-
-
-
- -
-
-
-
757
-
-
- -
-
-
-
147
-
-
789 -
5,085
2,371
3,009
598
-
20,079
9 (3)
43
145
180
306
(1,034)
-
805 (2)
4,693
2,283
3,171
956
(1,031)
19,557
671 (1)
2,974
1,825
-
-
-
-
50 -
420
37
-
-
-
-
63 -
1,195
372
-
-
-
-
21 (1)
104
49
-
-
-
-
- -
-
-
773
-
-
-
- -
-
-
1,469
-
-
-
- -
-
-
929
-
-
-
- -
-
-
-
769
-
-
- -
-
-
-
187
-
-
793 -
4,639
2,137
3,002
666
-
19,557
12 (2)
54
146
169
290
(1,031)
-
First half 2016 - Condensed interim consolidated financial statements 12
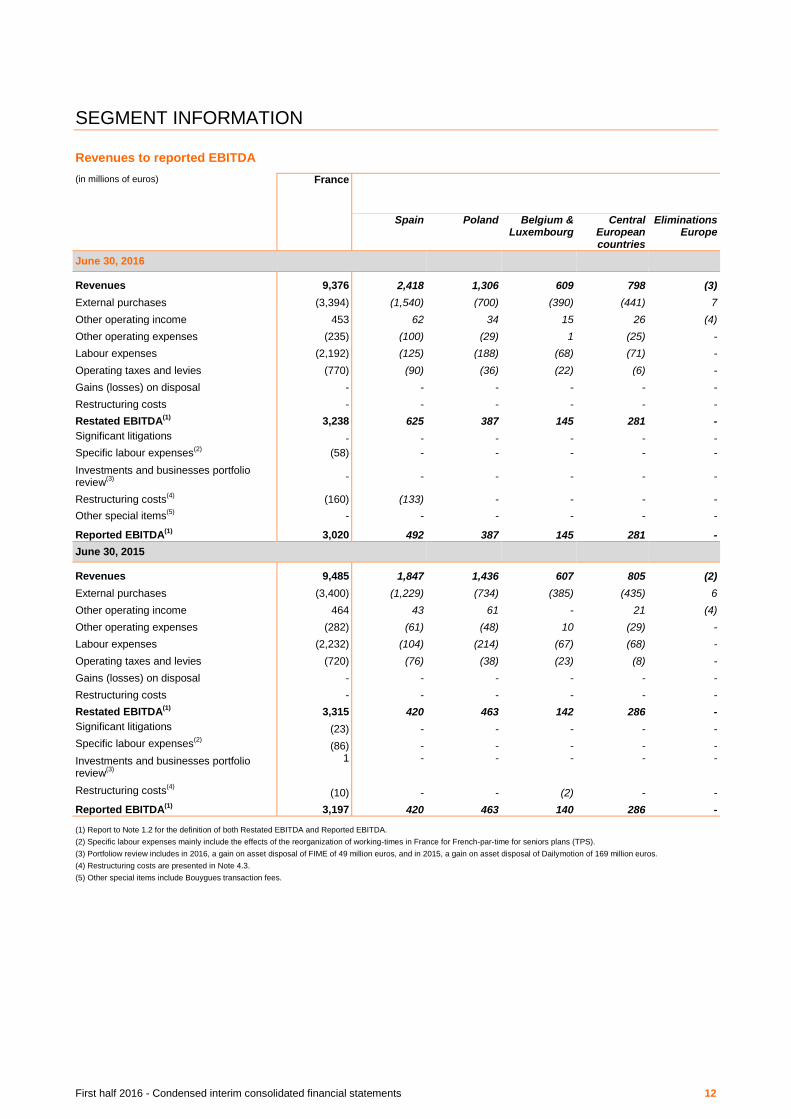
SEGMENT INFORMATION
Revenues to reported EBITDA
(in millions of euros) France
Spain Poland
Belgium &
Luxembourg
Central European countries
Eliminations Europe
June 30, 2016
Revenues 9,376
2,418
1,306
609
798
(3)
External purchases (3,394)
(1,540)
(700)
(390)
(441)
7
Other operating income 453
62
34
15
26
(4)
Other operating expenses (235)
(100)
(29)
1
(25)
-
Labour expenses (2,192)
(125)
(188)
(68)
(71)
-
Operating taxes and levies (770)
(90)
(36)
(22)
(6)
-
Gains (losses) on disposal -
-
-
-
-
-
Restructuring costs -
-
-
-
-
-
Restated EBITDA(1)
3,238 625
387
145
281
-
Significant litigations -
-
-
-
-
-
Specific labour expenses(2)
(58) -
-
-
-
-
Investments and businesses portfolio review
(3)
- -
-
-
-
-
Restructuring costs(4)
(160) (133)
-
-
-
-
Other special items(5)
- -
-
-
-
-
Reported EBITDA(1)
3,020 492
387
145
281
-
June 30, 2015
Revenues 9,485
1,847
1,436
607
805
(2)
External purchases (3,400)
(1,229)
(734)
(385)
(435)
6
Other operating income 464
43
61
-
21
(4)
Other operating expenses (282)
(61)
(48)
10
(29)
-
Labour expenses (2,232)
(104)
(214)
(67)
(68)
-
Operating taxes and levies (720)
(76)
(38)
(23)
(8)
-
Gains (losses) on disposal -
-
-
-
-
-
Restructuring costs -
-
-
-
-
-
Restated EBITDA(1)
3,315 420
463
142
286
-
Significant litigations (23)
-
-
-
-
-
Specific labour expenses(2)
(86) -
-
-
-
-
Investments and businesses portfolio review
(3)
1 -
-
-
-
-
Restructuring costs(4)
(10) -
-
(2)
-
-
Reported EBITDA(1)
3,197 420
463
140
286
-
(1) Report to Note 1.2 for the definition of both Restated EBITDA and Reported EBITDA.
(2) Specific labour expenses mainly include the effects of the reorganization of working-times in France for French-par-time for seniors plans (TPS).
(3) Portfoliow review includes in 2016, a gain on asset disposal of FIME of 49 million euros, and in 2015, a gain on asset disposal of Dailymotion of 169 million euros.
(4) Restructuring costs are presented in Note 4.3.
(5) Other special items include Bouygues transaction fees.

First half 2016 - Condensed interim consolidated financial statements 13
Europe Africa &
Middle-East
Enterprise International
Carriers & Shared
Services
Eliminations Total
Presentation
restatements Consolidated
accounts
Total
5,128 2,516
3,189
904
(1,034)
20,079
-
20,079
(3,064) (1,231)
(1,677)
(1,490)
2,038
(8,818)
-
(8,818)
133 53
77
1,224
(1,578)
362
8
370
(153) (105)
(211)
(43)
574
(173)
(61)
(234)
(452) (224)
(831)
(620)
-
(4,319)
(85)
(4,404)
(154) (181)
(55)
(58)
-
(1,218)
90
(1,128)
- -
-
-
-
-
67
67
- -
-
-
-
-
(340)
(340)
1,438 828
492
(83)
-
5,913
(321)
-
- -
-
40
-
40
(40)
-
- -
(3)
(19)
-
(80)
80
-
- 17
56
(6)
-
67
(67)
-
(133) (2)
(24)
(21)
-
(340)
340
-
- -
-
(8)
-
(8)
8
-
1,305 843
521
(97)
-
5,592
-
5,592
4,693 2,283
3,171
956
(1,031)
19,557
-
19,557
(2,777) (1,071)
(1,842)
(1,522)
2,226
(8,386)
-
(8,386)
121 16
79
1,227
(1,590)
317
-
317
(128) (86)
(92)
2
395
(191)
(524)
(715)
(453) (196)
(822)
(660)
-
(4,363)
(108)
(4,471)
(145) (169)
(56)
(54)
-
(1,144)
-
(1,144)
- -
-
-
-
-
185
185
- -
-
-
-
-
(34)
(34)
1,311 777
438
(51)
-
5,790
(481)
-
- -
-
(390)
-
(413)
413
-
- -
(7)
(15)
-
(108)
108
-
- (112)
22
163
-
74
(74)
-
(2) (4)
(6)
(12)
-
(34)
34
-
1,309 661
447
(305)
-
5,309
-
5,309
First half 2016 - Condensed interim consolidated financial statements 14
SEGMENT INFORMATION
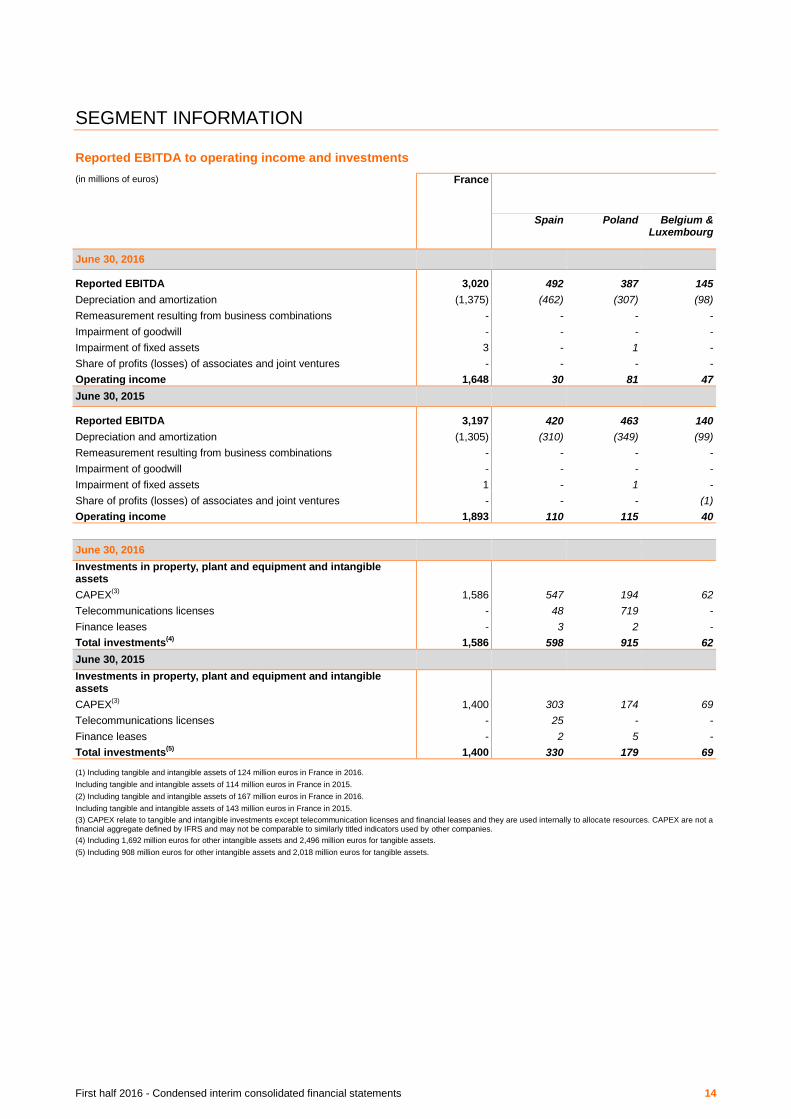
Reported EBITDA to operating income and investments
(in millions of euros) France
Spain Poland
Belgium &
Luxembourg
June 30, 2016
Reported EBITDA 3,020
492
387
145
Depreciation and amortization (1,375)
(462)
(307)
(98)
Remeasurement resulting from business combinations -
-
-
-
Impairment of goodwill -
-
-
-
Impairment of fixed assets 3
-
1
-
Share of profits (losses) of associates and joint ventures -
-
-
-
Operating income 1,648
30
81
47
June 30, 2015
Reported EBITDA 3,197
420
463
140
Depreciation and amortization (1,305)
(310)
(349)
(99)
Remeasurement resulting from business combinations -
-
-
-
Impairment of goodwill -
-
-
-
Impairment of fixed assets 1
-
1
-
Share of profits (losses) of associates and joint ventures -
-
-
(1)
Operating income 1,893
110
115
40
June 30, 2016
Investments in property, plant and equipment and intangible assets
CAPEX(3)
1,586 547
194
62
Telecommunications licenses -
48
719
-
Finance leases -
3
2
-
Total investments(4)
1,586 598
915
62
June 30, 2015
Investments in property, plant and equipment and intangible assets
CAPEX(3)
1,400 303
174
69
Telecommunications licenses -
25
-
-
Finance leases -
2
5
-
Total investments(5)
1,400 330
179
69
(1) Including tangible and intangible assets of 124 million euros in France in 2016.
Including tangible and intangible assets of 114 million euros in France in 2015.
(2) Including tangible and intangible assets of 167 million euros in France in 2016.
Including tangible and intangible assets of 143 million euros in France in 2015.
(3) CAPEX relate to tangible and intangible investments except telecommunication licenses and financial leases and they are used internally to allocate resources. CAPEX are not a financial aggregate defined by IFRS and may not be comparable to similarly titled indicators used by other companies.
(4) Including 1,692 million euros for other intangible assets and 2,496 million euros for tangible assets.
(5) Including 908 million euros for other intangible assets and 2,018 million euros for tangible assets.
First half 2016 - Condensed interim consolidated financial statements 15
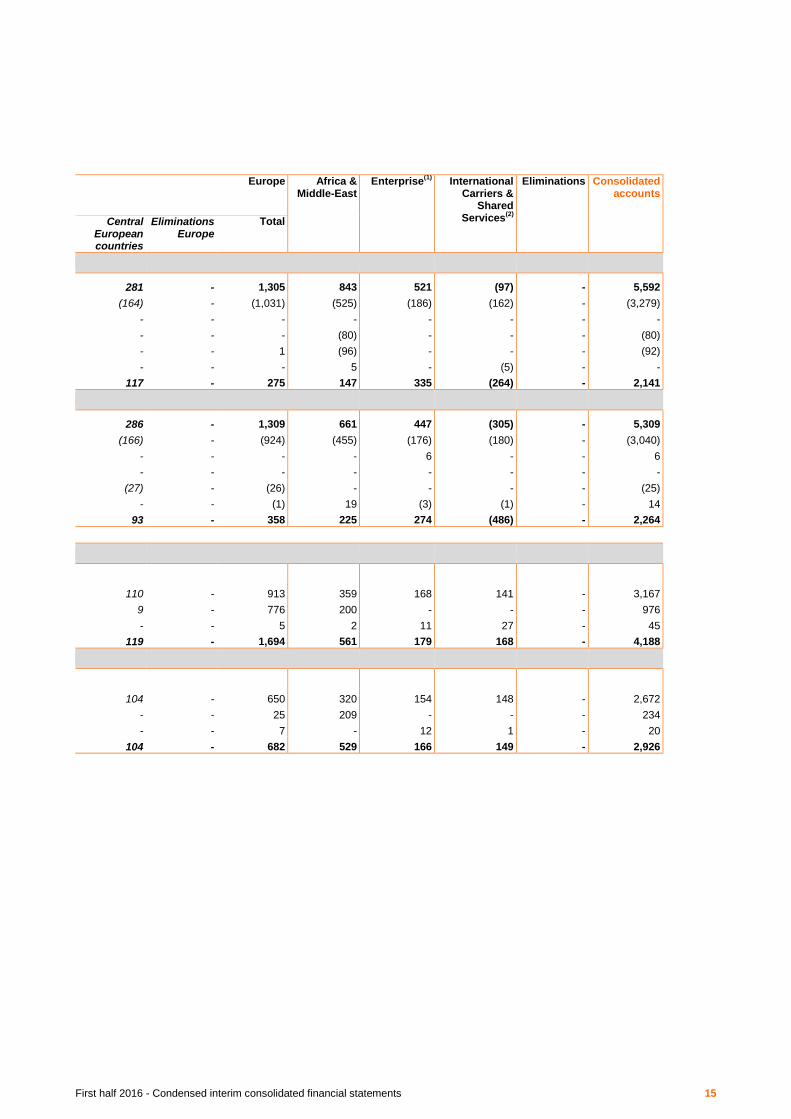
Europe Africa &
Middle-East
Enterprise(1)
International Carriers &
Shared Services
(2)
Eliminations Consolidated
accounts
Central European countries
Eliminations Europe
Total
281 -
1,305
843
521
(97)
-
5,592
(164) -
(1,031)
(525)
(186)
(162)
-
(3,279)
- -
-
-
-
-
-
-
- -
-
(80)
-
-
-
(80)
- -
1
(96)
-
-
-
(92)
- -
-
5
-
(5)
-
-
117 -
275
147
335
(264)
-
2,141
286 -
1,309
661
447
(305)
-
5,309
(166) -
(924)
(455)
(176)
(180)
-
(3,040)
- -
-
-
6
-
-
6
- -
-
-
-
-
-
-
(27) -
(26)
-
-
-
-
(25)
- -
(1)
19
(3)
(1)
-
14
93 -
358
225
274
(486)
-
2,264
110 -
913
359
168
141
-
3,167
9 -
776
200
-
-
-
976
- -
5
2
11
27
-
45
119 -
1,694
561
179
168
-
4,188
104 -
650
320
154
148
-
2,672
- -
25
209
-
-
-
234
- -
7
-
12
1
-
20
104 -
682
529
166
149
-
2,926
First half 2016 - Condensed interim consolidated financial statements 16
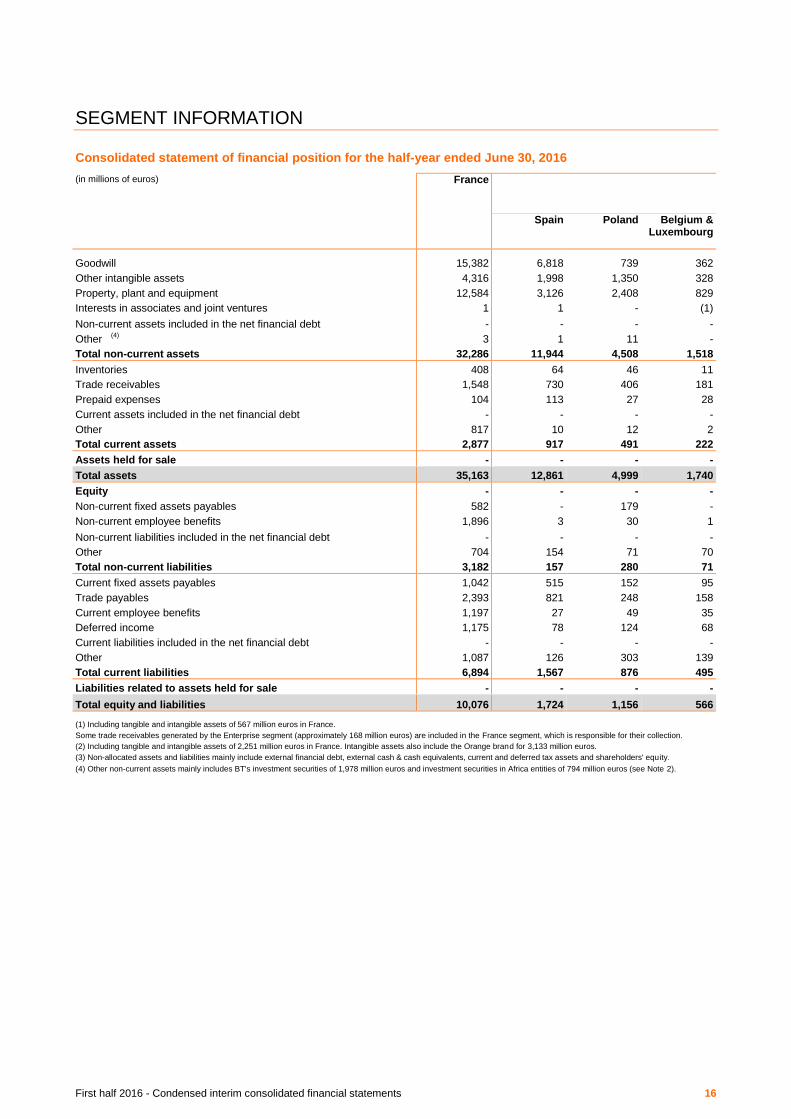
SEGMENT INFORMATION
Consolidated statement of financial position for the half-year ended June 30, 2016
(in millions of euros) France
Spain Poland Belgium & Luxembourg
Goodwill 15,382 6,818 739 362
Other intangible assets 4,316 1,998 1,350 328
Property, plant and equipment 12,584 3,126 2,408 829
Interests in associates and joint ventures 1 1 - (1)
Non-current assets included in the net financial debt - - - -
Other (4)
3 1 11 -
Total non-current assets 32,286 11,944 4,508 1,518
Inventories 408 64 46 11
Trade receivables 1,548 730 406 181
Prepaid expenses 104 113 27 28
Current assets included in the net financial debt - - - -
Other 817 10 12 2
Total current assets 2,877 917 491 222
Assets held for sale - - - -
Total assets 35,163 12,861 4,999 1,740
Equity - - - -
Non-current fixed assets payables 582 - 179 -
Non-current employee benefits 1,896 3 30 1
Non-current liabilities included in the net financial debt - - - -
Other 704 154 71 70
Total non-current liabilities 3,182 157 280 71
Current fixed assets payables 1,042 515 152 95
Trade payables 2,393 821 248 158
Current employee benefits 1,197 27 49 35
Deferred income 1,175 78 124 68
Current liabilities included in the net financial debt - - - -
Other 1,087 126 303 139
Total current liabilities 6,894 1,567 876 495
Liabilities related to assets held for sale - - - -
Total equity and liabilities 10,076 1,724 1,156 566
(1) Including tangible and intangible assets of 567 million euros in France.
Some trade receivables generated by the Enterprise segment (approximately 168 million euros) are included in the France segment, which is responsible for their collection.
(2) Including tangible and intangible assets of 2,251 million euros in France. Intangible assets also include the Orange brand for 3,133 million euros.
(3) Non-allocated assets and liabilities mainly include external financial debt, external cash & cash equivalents, current and deferred tax assets and shareholders' equity.
(4) Other non-current assets mainly includes BT's investment securities of 1,978 million euros and investment securities in Africa entities of 794 million euros (see Note 2).
First half 2016 - Condensed interim consolidated financial statements 17
Europe Africa & Middle-East
Enterprise(1)
International Carriers &
Shared Services
(2)
Eliminations and
unallocated items
(3)
Consolidated accounts
Central European countries
Eliminations Europe
Total
2,158 - 10,077 1,036 485 15 - 26,995
717 - 4,393 1,817 321 3,700 1 14,548
874 - 7,237 3,296 491 1,699 - 25,307
- - - 160 1 14 - 176
- - - - - - 931 931
(1) - 11 797 10 1,979 3,088 5,888
3,748 - 21,718 7,106 1,308 7,407 4,020 73,845
57 - 178 84 64 45 - 779
203 4 1,524 709 716 1,018 (646) 4,869
14 - 182 132 201 127 (11) 735
- - - - - - 7,665 7,665
7 - 31 469 149 156 276 1,898
281 4 1,915 1,394 1,130 1,346 7,284 15,946
- - - - - - - -
4,029 4 23,633 8,500 2,438 8,753 11,304 89,791
- - - - - - 33,571 33,571
222 - 401 110 - - - 1,093
3 - 37 61 333 718 - 3,045
- - - - - - 27,317 27,317
57 - 352 51 35 159 1,055 2,356
282 - 790 222 368 877 28,372 33,811
68 - 830 359 42 89 (1) 2,361
200 4 1,431 1,060 651 1,127 (646) 6,016
22 - 133 75 340 325 - 2,070
68 - 338 194 257 97 (10) 2,051
- - - - - - 6,245 6,245
36 - 604 717 192 581 485 3,666
394 4 3,336 2,405 1,482 2,219 6,073 22,409
- - - - - - - -
676 4 4,126 2,627 1,850 3,096 68,016 89,791

First half 2016 - Condensed interim consolidated financial statements 18
SEGMENT INFORMATION
Consolidated statement of financial position for year ended December 31, 2015
(in millions of euros) France
Spain Poland Belgium & Luxembourg
Goodwill 15,382 6,818 769 362
Other intangible assets 4,378 2,222 707 347
Property, plant and equipment 12,294 2,768 2,583 840
Interests in associates and joint ventures 1 1 - -
Non-current assets included in the net financial debt - - - -
Other 4 - 10 1
Total non-current assets 32,059 11,809 4,069 1,550
Inventories 370 67 57 21
Trade receivables 1,614 903 422 194
Prepaid expenses 67 43 20 17
Current assets included in the net financial debt - - - -
Other 824 29 28 2
Total current assets 2,875 1,042 527 234
Assets held for sale(4)
- - - -
Total assets 34,934 12,851 4,596 1,784
Equity - - - -
Non-curent fixed assets payables 584 - 180 -
Non-current employee benefits 2,017 - 55 -
Non-current liabilities included in the net financial debt - - - -
Other 750 168 84 73
Total non-current liabilities 3,351 168 319 73
Current fixed assets payables 1,252 470 233 129
Trade payables 2,491 847 271 170
Current employee benefits 1,292 47 48 36
Deferred income 1,220 89 127 70
Current liabilities included in the net financial debt - - - -
Other 748 65 232 126
Total current liabilities 7,003 1,518 911 531
Liabilities related to assets held for sale(4)
- - - -
Total equity and liabilities 10,354 1,686 1,230 604
(1) Including tangible and intangible assets of 577 million euros in France.
Some trade receivables generated by the Enterprise segment (approximately 182 million euros) are included in the France segment, which is responsible for their collection.
(2) Including tangible and intangible assets of 2,251 million euros in France and 12 million euros in other countries. Intangible assets also include the Orange brand for
3,133 million euros.
(3) Non-allocated assets and liabilities mainly include external financial debt, external cash & cash equivalents, current and deferred tax assets and shareholders' equity.
(4) Relates to EE and Telkom Kenya, classified under discontinued operations.

First half 2016 - Condensed interim consolidated financial statements 19
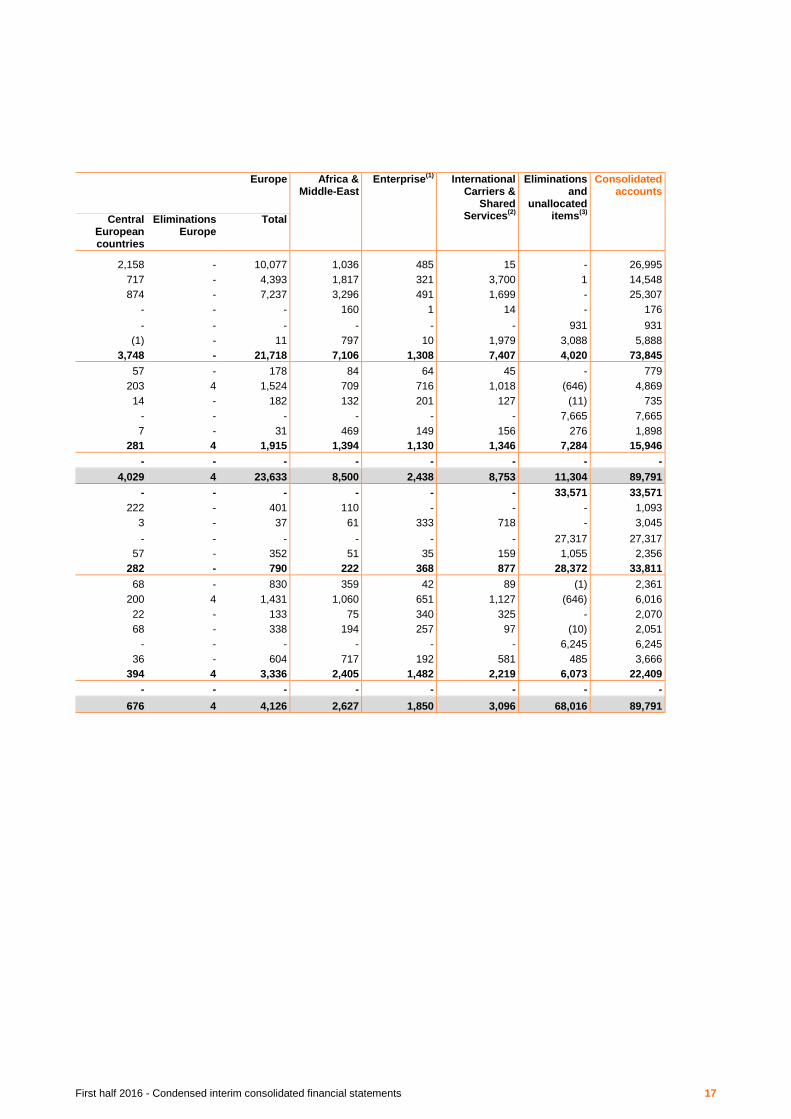
Europe Africa & Middle-East
Enterprise(1)
International Carriers &
Shared Services
(2)
Eliminations and
unallocated items
(3)
Consolidated accounts
Central European countries
Eliminations Europe
Total
2,159 - 10,108 1,117 449 15 - 27,071
743 - 4,019 1,936 322 3,672 - 14,327
897 - 7,088 3,504 505 1,732 - 25,123
- - 1 155 1 4 - 162
- - - - - - 1,392 1,392
- - 11 4 11 - 3,225 3,255
3,799 - 21,227 6,716 1,288 5,423 4,617 71,330
63 - 208 71 59 55 - 763
181 - 1,700 728 703 759 (628) 4,876
12 - 92 71 179 94 (8) 495
- - - - - - 6,086 6,086
14 - 73 360 141 92 602 2,092
270 - 2,073 1,230 1,082 1,000 6,052 14,312
- - - - - 5,788 - 5,788
4,069 - 23,300 7,946 2,370 12,211 10,669 91,430
- - - - - - 33,267 33,267
205 - 385 35 - - - 1,004
3 - 58 60 290 717 - 3,142
- - - - - - 29,780 29,780
60 - 385 148 34 183 1,111 2,611
268 - 828 243 324 900 30,891 36,537
111 - 943 399 40 95 (1) 2,728
219 - 1,507 1,086 638 1,133 (628) 6,227
21 - 152 69 347 354 - 2,214
67 - 353 208 270 94 (9) 2,136
- - - - - - 4,667 4,667
16 - 439 515 201 940 811 3,654
434 - 3,394 2,277 1,496 2,616 4,840 21,626
- - - - - - - -
702 - 4,222 2,520 1,820 3,516 68,998 91,430
First half 2016 - Condensed interim consolidated financial statements 20
NOTE 1 Basis of preparation of the consolidated financial statements
This note describes the changes in the accounting policies since the publication of the consolidated financial statements for
2015 and which were used by Orange (hereafter called "the Group") for the preparation of its interim financial statements at
June 30, 2016.
1.1 Basis of preparation of the financial statements
The condensed consolidated financial statements and notes were approved by the Board of Directors on July 25, 2016.
In accordance with European regulation n° 1606/2002 dated July 19, 2002, the condensed consolidated financial statements for
the first half of 2016 were prepared in accordance with IAS 34 "Interim Financial Reporting”, as endorsed by the European
Union (EU) and published by the IASB.
The interim financial statements were prepared using the same accounting policies as the financial statements for the year
ended December 31, 2015, with the exception of the specific requirements of IAS 34. For the reported periods, the accounting
standards and interpretations endorsed by the EU (available on the website:
http://ec.europa.eu/internal_market/accounting/ias/index_en.htm) are similar to the compulsory standards and interpretations
published by the IASB with the exception of the carve-out of IAS 39 and the standards and interpretations currently being
endorsed, which has no effect on the Group’s accounts. Consequently, the Group’s financial statements are prepared in
accordance with the IFRS standards and interpretations, as published by the IASB.
When a specific transaction is not dealt with in any standard or interpretation, management uses its judgment to define and
apply an accounting policy that will result in relevant and reliable information, such that the financial statements:
fairly present the Group’s financial position, financial performance and cash flows;
reflect the economic substance of the transactions;
are neutral;
are prepared on a prudent basis; and
are complete in all material respects.
1.2 Change in segment information reporting – Financial measures
Restated EBITDA and reported EBITDA are measures of operating performance used by the Group to:
manage and assess its operating results and operating segments’ results, and
implement its investments and resource allocation strategy.
Group management believes that disclosing these measures is relevant because it provides the monitoring measures used
internally to the users of the financial statements.
At the end of 2015, the European Securities and Markets Authority (ESMA) issued guidelines relating to the alternative
performance measures of listed companies. In this context, the Group decided to include the reconciliation of restated EBITDA
with reported EBITDA, which was historically included in the management report, within the financial statements.
Reported EBITDA corresponds to Earnings Before Interest, Tax, Depreciation and Amortization, remeasurement resulting from
business combinations and share of profits (losses) of associates and joint ventures.
Restated EBITDA corresponds to reported EBITDA adjusted for the effects of significant litigation, specific labour expenses, the
review of the investments and businesses portfolio, restructuring costs, and other special items if any.
This alternative performance measure, compared with reported EBITDA, enables the isolation of some special factors
attributable to:
significant litigation:
The litigation proceedings result from a third-party decision (regulatory bodies, courts of justice, etc.) and occur over a period
different from that of the root cause of such costs. By their nature, the costs are hard to predict, be it for their legal grounds,
amount and period in which they occur.
specific labour expenses:
Independent from the costs of personnel separation plans included in restructuring costs, some personnel programs, mainly
those relating to reorganization of working-times, have a negative effect over the period they are implemented. These are
notably French part-time for seniors plans (TPS).
investments and businesses portfolio review:
First half 2016 - Condensed interim consolidated financial statements 21
The Group reviews on an ongoing-basis its investments and businesses portfolio. In this context, some disposal decisions
are implemented and affect the income statement for the period when the disposal occurs. The related disposal income or
loss affects either the reported EBITDA or consolidated net income after tax from continuing operations.
restructuring costs:
The Group business adaptation to changes in the environment could also generate other types of transformation costs.
These actions may have a negative effect over the period they are communicated and initiated. For illustrative purposes and
the list is not exhaustive, they result from action plans validated by internal governance bodies in terms of land use,
distribution network, subcontracting network, lay-offs, and communication networks (for costs other than assets depreciation
and impairment).
if any, other special items which are systematically identified, whether they are charges or gains.
Restated EBITDA and reported EBITDA are not performance measures defined by IFRS and may not be comparable to other
similarly-titled indicators used by other groups. They are provided as additional information only and should not be considered
as a substitute for operating income or net cash provided by operating activities.
1.3 Uses of estimates and judgment
In preparing the Group’s consolidated financial statements, Orange’s management makes estimates insofar as many elements
included in the financial statements cannot be measured with precision. The underlying assumptions used for the main
estimates are similar to those described as of December 31, 2015. The management revises these estimates if the underlying
circumstances evolve or in light of new information or experience. Consequently, estimates made at June 30, 2016 may be
changed subsequently.
Group management also uses its judgment to define appropriate accounting policies to apply to certain transactions when the
current IFRS standards and interpretations do not specifically deal with the related accounting issues.
1.4 New standards and interpretations compulsory after June 30, 2106
Among these standards and interpretations, the following might affect the Group’s future consolidated financial statements:

First half 2016 - Condensed interim consolidated financial statements 22
Standard / Interpretation
(application date for the Group)
Consequences for the Group
IFRS 9
Financial Instruments
(January 1, 2018)
IFRS 9 modifies the recognition criteria for hedging transactions and main
financial assets and liabilities categories : given the nature of the Group’s
transactions, no major change is expected.
IFRS 9 requires also the change in the credit risk recognition using the expected
losses approach versus the incurred losses one. For the Group, this would notably
imply impairment of non-matured receivables.
IFRS 15
Revenue from Contracts with Customers
(January 1, 2018)
This standard relates to revenue recognition and is applicable on a retrospective
basis either limited to the cumulative effect of the new method at the opening date
of the annual reporting period that includes the date of initial application (January
1, 2018) or by adjusting the reported comparative periods.
For the Group, this standard would mainly impact the accounting for bundled
offers which include a handset component with a discounted price and a
communication service component : the cumulative revenue will not change but its
allocation between the handset sold and the communication service will change
(more equipment revenue and less service revenue). The resulting acceleration of
the revenue recognition would lead to the recognition of a contract asset in the
statement of financial position which would be settled against an asset receivable
as the communication service is provided.
In addition, some incremental subscriber acquisition and retention costs (i.e.
payments to distributors directly attributable to a contract, excluding subsidies) will
be recognized over the duration of the bundled offer.
IFRS 16
Leases
(January 1, 2018 or 2019)
This standard relates to the accounting for leases and will be compulsory
applicable from January 1, 2019 or on a retrospective basis from January 1, 2018
together with IFRS 15. It is retrospective either at the first application date or at the
opening date of the reported comparative period.
The Group is analyzing the retrospective application provisions as well as the first
application date of this new standard.
The standard introduces a new basis for splitting supplier arrangements based on
a new accounting definition of a lease and a service arrangement.
It will mainly change the lease accounting for lessees with the recognition of an
asset which represents the right of use at the delivery date granted by the lessor
against a financial liability.
It will also impact the presentation of the income statement (depreciation and
interest expense instead of operating expense) and the statement of cash flows
(interest expense will only impact the operating cash flows whereas the debt
repayment will affect the financing cash flows). In the statement of financial
position, the net equity will be reduced at the beginning of the arrangement (due to
the acceleration of expenses attributable to the interest component) and the
intangible and tangible assets as well as the lease liability will increase.
The effects are analyzed as part of Group-wide projects for implementing these new standards, though a reliable estimate of the
quantitative effects is not possible until the projects have been completed.

First half 2016 - Condensed interim consolidated financial statements 23
NOTE 2 Gains and losses on disposal and main changes in scope of consolidation
Changes in scope during the first half of 2016
Disposal of EE
On January 29, 2016, Orange sold its whole stake in EE to BT Group plc (BT) against 3,438 million pounds sterling (4,500
million euros) in cash and a 4 % stake in the share capital of BT which is measured at 1,877 million pounds sterling (2,462
million euros) based on the opening market price on January 29, 2016. The Group’s commitments relating to the BT shares are
disclosed in Note 7.7. The amount received net of the transaction costs was 4,493 million euros. In accordance with the
agreements, this amount is being subject to adjustments relating to EE’s net debt, working capital and capital expenditures at
January 29, 2016.
(in millions of euros) June 30, 2016
EE's net disposal value(1)
(a) 7,134
EE's net book value (b) (5,725)
Reclassification adjustment of other comprehensive income to net income(2)
(c) 840
Consolidated net income after tax of discontinued operations (a) + (b) + (c) 2,249
(1) Includes transaction costs and 173 million euros of dividends paid by EE before the disposal in January 2016.
(2) Mainly includes 836 million euros of cumulative translation adjustment reclassified in profit or loss.
The commitments relating to EE’s disposal are listed in the 2015 consolidated financial statements.
Disposal of Telkom Kenya
Following the agreement signed on November 6, 2015 with Helios Investment Partners, and after obtaining the required
authorizations, the Group sold its whole stake in Telkom Kenya on June 10, 2016. This transaction has no material impact on
the net income of the first half of 2016.
Entities acquired in Africa
The Group acquired on:
- April 5, 2016, Cellcom Telecommunications Inc in Liberia,
- April 20, 2016, Oasis SA in the Democratic Republic of the Congo from Millicom Group,
- June 22, 2016, Airtel in Burkina Faso from Bharti Group.
The cash outflow to acquire these entities amounted to 792 million euros during the first half of 2016. It will be subject to
adjustments primarily relating to net debt, working capital and capital expenditures. These adjustments will be finalized during
the second half of 2016.
Due to the recent acquisitions of these entities, their financial statements prepared in accordance with IFRS could not be
completed within a timeframe compatible with that of the Group. As a consequence, the related investment is classified under
“non-current financial assets” as at June 30, 2016.
Transaction in progress as at June 30, 2016
Acquisition of Groupama Banque
On April 21, 2016, Orange and Groupama signed an agreement which would lead the Group to acquire 65 % of Groupama
Banque share capital. Groupama will retain a 35 % stake.
The completion of this transaction is subject to the approval of the supervisory authorities which are expected to be obtained
during the second half of 2016.
First half 2016 - Condensed interim consolidated financial statements 24
NOTE 3 Sales
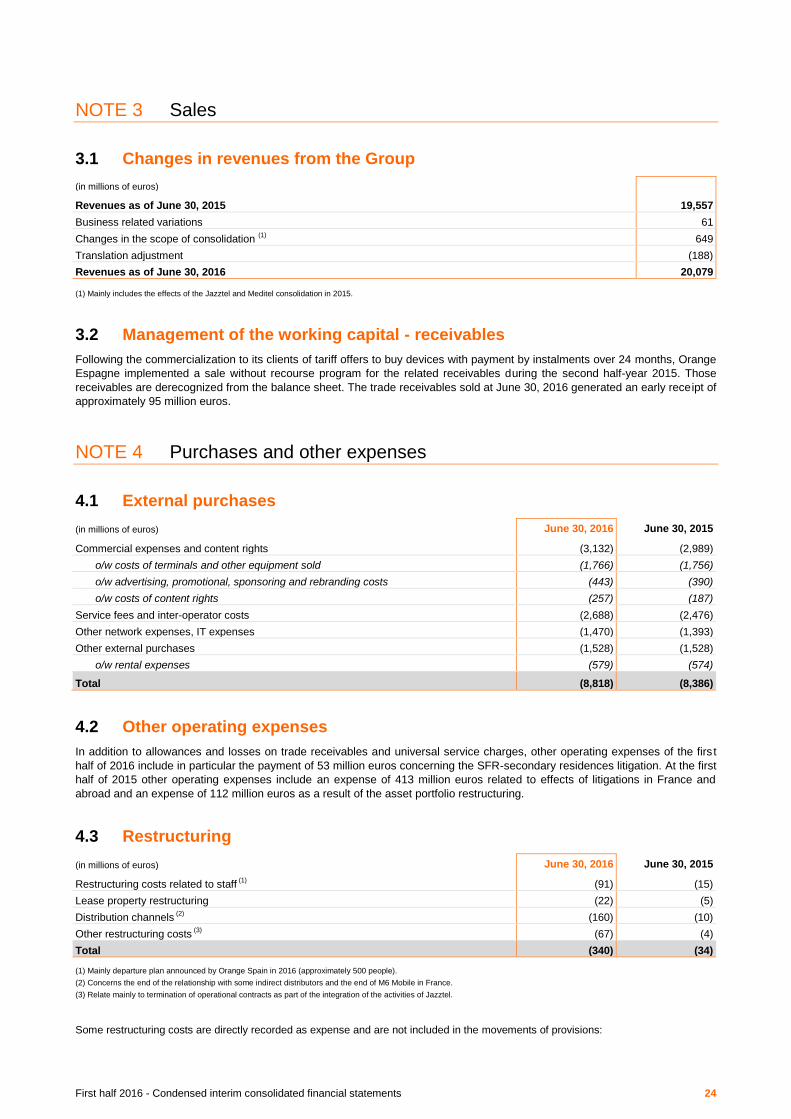
3.1 Changes in revenues from the Group
(in millions of euros)
Revenues as of June 30, 2015 19,557
Business related variations 61
Changes in the scope of consolidation (1)
649
Translation adjustment (188)
Revenues as of June 30, 2016 20,079
(1) Mainly includes the effects of the Jazztel and Meditel consolidation in 2015.
3.2 Management of the working capital - receivables
Following the commercialization to its clients of tariff offers to buy devices with payment by instalments over 24 months, Orange
Espagne implemented a sale without recourse program for the related receivables during the second half-year 2015. Those
receivables are derecognized from the balance sheet. The trade receivables sold at June 30, 2016 generated an early receipt of
approximately 95 million euros.
NOTE 4 Purchases and other expenses
4.1 External purchases
(in millions of euros) June 30, 2016 June 30, 2015
Commercial expenses and content rights (3,132) (2,989)
o/w costs of terminals and other equipment sold (1,766) (1,756)
o/w advertising, promotional, sponsoring and rebranding costs (443) (390)
o/w costs of content rights (257) (187)
Service fees and inter-operator costs (2,688) (2,476)
Other network expenses, IT expenses (1,470) (1,393)
Other external purchases (1,528) (1,528)
o/w rental expenses (579) (574)
Total (8,818) (8,386)
4.2 Other operating expenses
In addition to allowances and losses on trade receivables and universal service charges, other operating expenses of the firs t
half of 2016 include in particular the payment of 53 million euros concerning the SFR-secondary residences litigation. At the first
half of 2015 other operating expenses include an expense of 413 million euros related to effects of litigations in France and
abroad and an expense of 112 million euros as a result of the asset portfolio restructuring.
4.3 Restructuring
(in millions of euros) June 30, 2016 June 30, 2015
Restructuring costs related to staff (1)
(91) (15)
Lease property restructuring (22) (5)
Distribution channels (2)
(160) (10)
Other restructuring costs (3)
(67) (4)
Total (340) (34) (1) Mainly departure plan announced by Orange Spain in 2016 (approximately 500 people).
(2) Concerns the end of the relationship with some indirect distributors and the end of M6 Mobile in France.
(3) Relate mainly to termination of operational contracts as part of the integration of the activities of Jazztel.
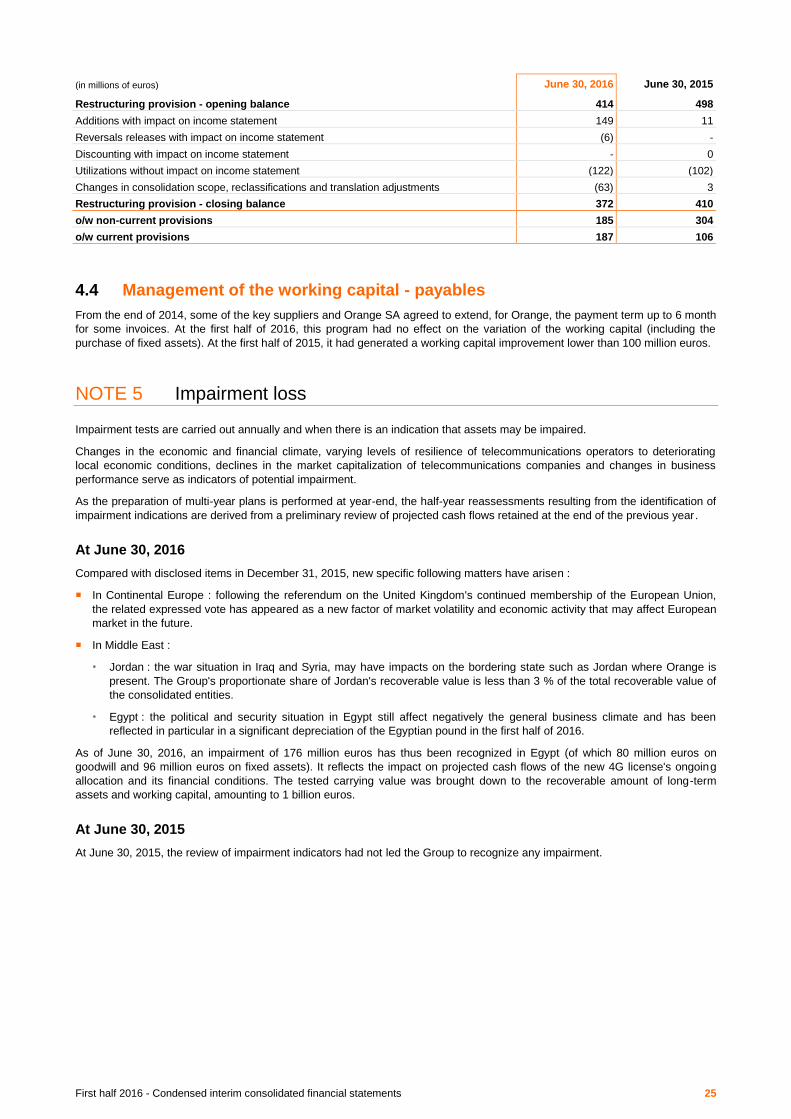
Some restructuring costs are directly recorded as expense and are not included in the movements of provisions:
First half 2016 - Condensed interim consolidated financial statements 25
(in millions of euros) June 30, 2016 June 30, 2015
Restructuring provision - opening balance 414 498
Additions with impact on income statement 149 11
Reversals releases with impact on income statement (6) -
Discounting with impact on income statement - 0
Utilizations without impact on income statement (122) (102)
Changes in consolidation scope, reclassifications and translation adjustments (63) 3
Restructuring provision - closing balance 372 410
o/w non-current provisions 185 304
o/w current provisions 187 106
4.4 Management of the working capital - payables
From the end of 2014, some of the key suppliers and Orange SA agreed to extend, for Orange, the payment term up to 6 month
for some invoices. At the first half of 2016, this program had no effect on the variation of the working capital (including the
purchase of fixed assets). At the first half of 2015, it had generated a working capital improvement lower than 100 million euros.
NOTE 5 Impairment loss
Impairment tests are carried out annually and when there is an indication that assets may be impaired.
Changes in the economic and financial climate, varying levels of resilience of telecommunications operators to deteriorating
local economic conditions, declines in the market capitalization of telecommunications companies and changes in business
performance serve as indicators of potential impairment.
As the preparation of multi-year plans is performed at year-end, the half-year reassessments resulting from the identification of
impairment indications are derived from a preliminary review of projected cash flows retained at the end of the previous year.
At June 30, 2016
Compared with disclosed items in December 31, 2015, new specific following matters have arisen :
In Continental Europe : following the referendum on the United Kingdom's continued membership of the European Union,
the related expressed vote has appeared as a new factor of market volatility and economic activity that may affect European
market in the future.
In Middle East :
Jordan : the war situation in Iraq and Syria, may have impacts on the bordering state such as Jordan where Orange is
present. The Group's proportionate share of Jordan's recoverable value is less than 3 % of the total recoverable value of
the consolidated entities.
Egypt : the political and security situation in Egypt still affect negatively the general business climate and has been
reflected in particular in a significant depreciation of the Egyptian pound in the first half of 2016.
As of June 30, 2016, an impairment of 176 million euros has thus been recognized in Egypt (of which 80 million euros on
goodwill and 96 million euros on fixed assets). It reflects the impact on projected cash flows of the new 4G license's ongoing
allocation and its financial conditions. The tested carrying value was brought down to the recoverable amount of long-term
assets and working capital, amounting to 1 billion euros.
At June 30, 2015
At June 30, 2015, the review of impairment indicators had not led the Group to recognize any impairment.
First half 2016 - Condensed interim consolidated financial statements 26
NOTE 6 Income tax
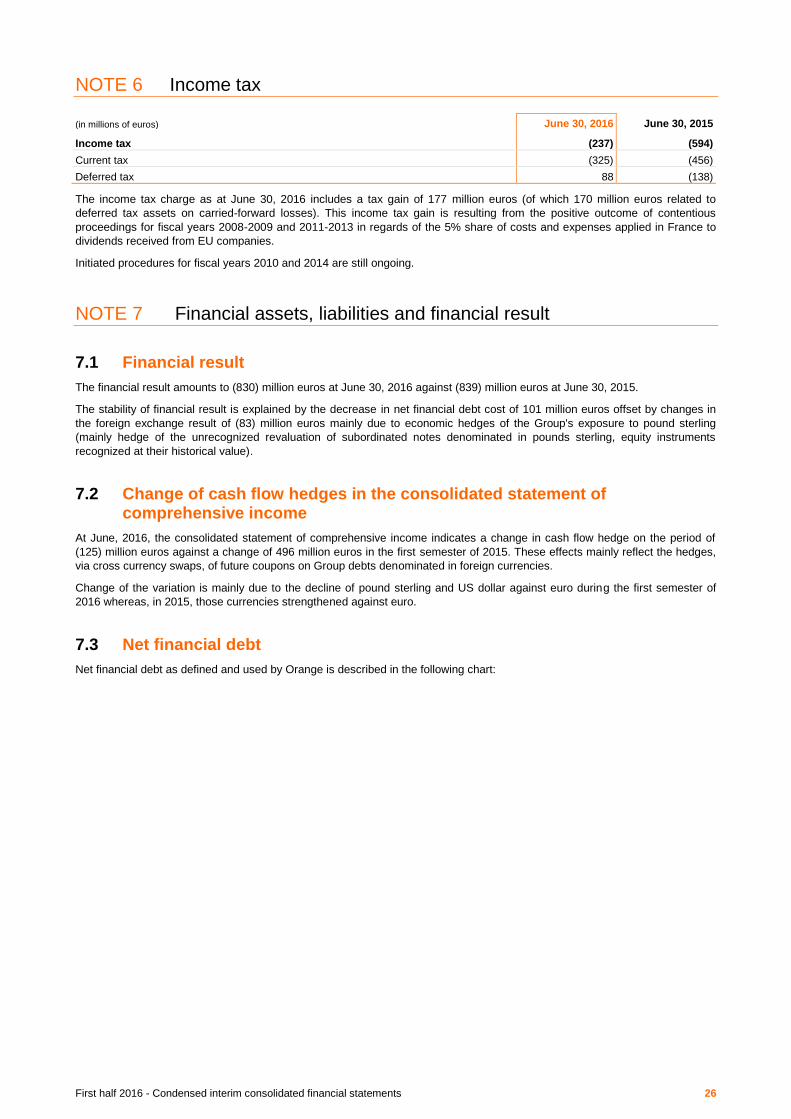
(in millions of euros) June 30, 2016 June 30, 2015
Income tax (237) (594)
Current tax (325) (456)
Deferred tax 88 (138)
The income tax charge as at June 30, 2016 includes a tax gain of 177 million euros (of which 170 million euros related to
deferred tax assets on carried-forward losses). This income tax gain is resulting from the positive outcome of contentious
proceedings for fiscal years 2008-2009 and 2011-2013 in regards of the 5% share of costs and expenses applied in France to
dividends received from EU companies.
Initiated procedures for fiscal years 2010 and 2014 are still ongoing.
NOTE 7 Financial assets, liabilities and financial result
7.1 Financial result
The financial result amounts to (830) million euros at June 30, 2016 against (839) million euros at June 30, 2015.
The stability of financial result is explained by the decrease in net financial debt cost of 101 million euros offset by changes in
the foreign exchange result of (83) million euros mainly due to economic hedges of the Group's exposure to pound sterling
(mainly hedge of the unrecognized revaluation of subordinated notes denominated in pounds sterling, equity instruments
recognized at their historical value).
7.2 Change of cash flow hedges in the consolidated statement of comprehensive income
At June, 2016, the consolidated statement of comprehensive income indicates a change in cash flow hedge on the period of
(125) million euros against a change of 496 million euros in the first semester of 2015. These effects mainly reflect the hedges,
via cross currency swaps, of future coupons on Group debts denominated in foreign currencies.
Change of the variation is mainly due to the decline of pound sterling and US dollar against euro during the first semester of
2016 whereas, in 2015, those currencies strengthened against euro.
7.3 Net financial debt
Net financial debt as defined and used by Orange is described in the following chart:

First half 2016 - Condensed interim consolidated financial statements 27
(in millions of euros) June 30, 2016 December 31,
2015
TDIRA 1,204 1,198
Bonds 26,575 26,826
Bank and multilateral lending institutions loans 2,169 2,690
Finance lease liabilities 597 592
Cash collateral received 690 1,447
Commercial papers 1,338 725
Bank overdrafts 316 209
Commitments to purchase non-controlling interests 22 21
Other financial liabilities 114 356
Current and non-current financial liabilities (excluding derivatives) included in the calculation of net financial debt 33,025 34,064
Derivatives (liabilities) current and non-current(1)
537 384
Derivatives (assets) current and non-current(1)
(1,101) (1,684)
Equity components related to unmatured hedging instruments (504) (418)
Gross financial debt after derivatives (a) 31,957 32,346
Cash collateral paid (97) (94)
Investments at fair value (1,581) (1,231)
Cash equivalents (4,077) (2,281)
Cash (1,740) (2,188)
Assets included in the calculation of net financial debt (b) (7,495) (5,794)
Net financial debt (a) + (b) 24,462 26,552
(1) At June 2016, the foreign exchange effect of the cross currency swaps hedging foreign exchange risk on gross debt notional is a gain of 1 128 million euros.
7.4 Main debt issues and redemptions
On May 12, 2016, Orange issued bonds for 750 million euros maturing on May 12, 2025 with a coupon of 1%.
Orange SA redeemed bonds outstanding as at December 2015 and maturing during the first semester of 2016.
7.5 Orange's debt ratings
Regarding the evolution of Orange rating during the first semester of 2016, rating agency Standard & Poor's revised, on January
27, 2016, the outlook on Orange's long term debt from Negative to Stable while confirming Orange's long-term debt rating at
BBB+ as well as Orange's short-term debt rating at A2.
At June 30, 2016, Orange's debt ratings are set forth below:
Standard & Poor's Moody's Fitch Ratings Japan Credit Rating
Long-term debt BBB+ Baa1 BBB+ A-
Outlook Stable Stable Stable Stable
Short-term debt A2 P2 F2
7.6 Management of covenants
The specific covenants with regards to financial ratios described in December 2015 remain met.
7.7 Assets available for sale
(in millions of euros) June 30, 2016 December 31, 2015
Assets available for sale - opening balance 144 91
BT shares received as remuneration for EE 2,462 -
Change in fair value of BT shares (484) -
Other change in fair value (10) 15
Other movements 3 38
Assets available for sale - closing balance 2,115 144

First half 2016 - Condensed interim consolidated financial statements 28
BT shares
On January 29, 2016, as a result of the disposal of EE, Orange received a 4% stake in the share capital of BT Group plc (BT),
i.e. 399 million shares for an amount of 2,462 million euros (valued at the ECB reference exchange rate on January 28, i.e.
0.76228).
The Group committed not to sell BT Group plc shares for a one year period, starting from the date shares were delivered
(January 29, 2016). However, the Group benefits from some exemptions, such as a disposal to Deutsche Telekom, to BT Group
plc or to qualified investors taking over the commitments granted by Orange, subject to conditions. Besides, in case Orange's
stake becomes less than or equal to 2%, the Group will be entitled to implement hedges of share price risk.
BT shares are classified under "Assets available for sales" and amount to 1,978 million euros at June 30, 2016. Temporary
changes in value of shares, net of foreign exchange hedging effects, are recorded in other comprehensive income and not in
income statement, except when there is objective evidence of a significant or prolonged impairment loss. As of June 30, 2016,
the net change in fair value of BT shares recorded in other comprehensive income amounts to (378) million euros. This includes
the change in fair value of shares for (484) million euros and the foreign exchange hedging effect for 106 million euros.
7.8 Fair value levels of financial assets and liabilities
During the first half-year of 2016, no significant event has occurred regarding the fair value of financial assets and liabilities.
NOTE 8 Shareholders' equity
At June 30, 2016, Orange SA's share capital, based on the number of issued shares at this date, amounted to
10,640,226,396 euros, comprising 2,660,056,599 ordinary shares with a par value of 4 euros each.
Since April 3, 2016, with the application of the law voted on March 29, 2014 (known as the "Florange law"), the shares held in
registered form for at least two years by the same shareholder are granted with a double voting rights. At June 30, 2016, the
French State owned 22.95% of Orange SA's share capital and 29.39% of the voting rights either directly or indirectly in concert
with Bpifrance Participations. At that date, the employees of the Group owned either within the employee shareholding plan or in
registered form 5.47% of Orange SA's share capital and 8.28% of the voting rights.
8.1 Changes in share capital
During the period, Orange SA issued 11,171,216 new shares, representing 0.42% of the capital, following the employee
shareholding plan recorded by the Board of Directors at its meeting held on October 21, 2015, on delegation granted by the
Shareholders' Meeting held on May 27, 2015. The related capital increase (including additional paid-in capital) realized on May
31, 2016, amounts to 113 million euros.
The number of subscribed shares at a unit price of 11.92 euros (which represent a discount of 20% to the market reference
price) amounts to 9.5 million of shares, of which are added 1.7 million of free shares through employer's contribution.
The average fair value of the benefit granted to employees and former employees of the Group is 4.45 euros per share
(including the free shares), resulting into an expense of 50 million euros against share-based compensation.
During the six months ended June 30, 2016, the weighted average number of ordinary shares outstanding was 2,648,855,960
and the weighted average number of ordinary and dilutive shares outstanding was 2,700,935,310.
8.2 Treasury shares
As authorized by the Shareholders' Meeting of June 7, 2016, the Board of Directors instituted a new share buyback program
(the 2016 Buyback Program) and cancelled the 2015 Buyback Program, with immediate effect. The 2016 Buyback Program is
described in the Orange Registration Document filed with the French Securities Regulator on April 4, 2016.
The only shares bought back by Orange during the first 2016 semester were shares bought back as part of the liquidity contract.
At June 30, 2016, Orange held 458,487 of its own shares (including 435,000 shares as part of the liquidity contract), compared
to 27,663 at December 31, 2015 (of which 0 shares as part of the liquidity contract).
8.3 Dividends
The Shareholders' Meeting held on June 7, 2016 approved the payment of a dividend of 0.60 euro per share in respect of 2015
exercise. After payment of the interim dividend of 0.20 euro per share on December 9, 2015 for a total of 530 million euros, the
balance of the dividend amounting to 0.40 euro per share was paid on June 23, 2016 for an amount of 1,064 million euros.
First half 2016 - Condensed interim consolidated financial statements 29
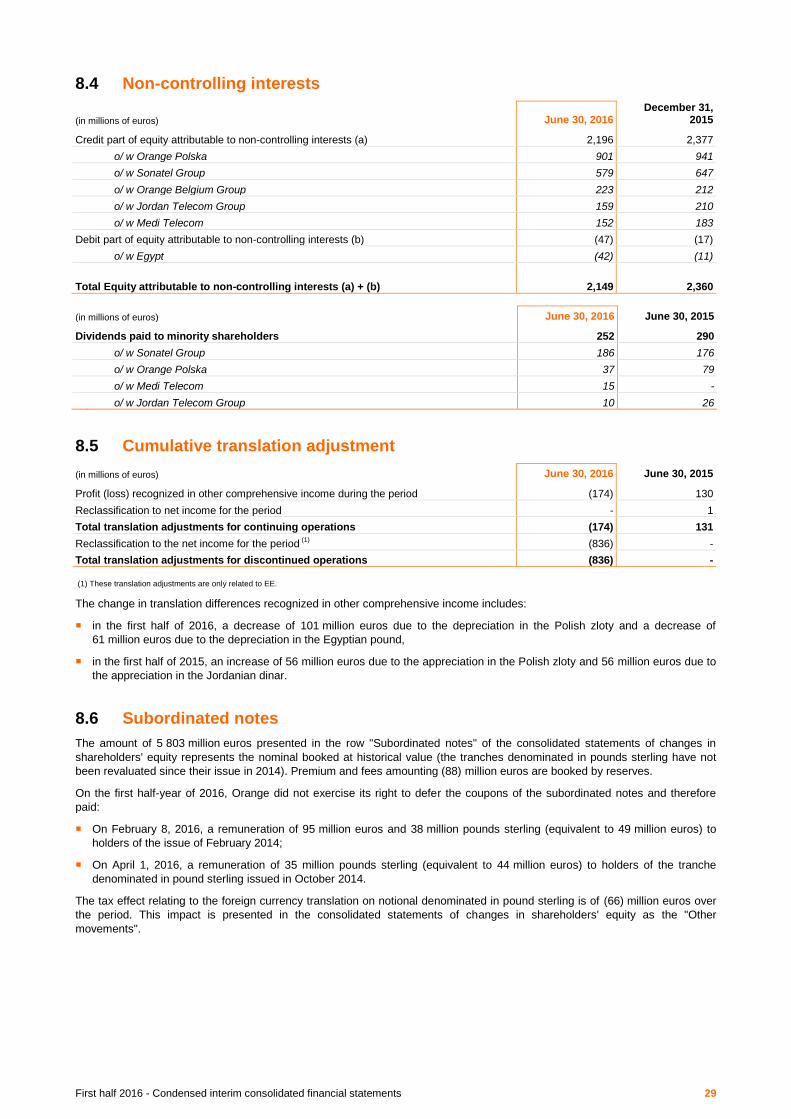
8.4 Non-controlling interests
(in millions of euros) June 30, 2016 December 31,
2015
Credit part of equity attributable to non-controlling interests (a) 2,196 2,377
o/ w Orange Polska 901 941
o/ w Sonatel Group 579 647
o/ w Orange Belgium Group 223 212
o/ w Jordan Telecom Group 159 210
o/ w Medi Telecom 152 183
Debit part of equity attributable to non-controlling interests (b) (47) (17)
o/ w Egypt (42) (11)
Total Equity attributable to non-controlling interests (a) + (b) 2,149 2,360
(in millions of euros) June 30, 2016 June 30, 2015
Dividends paid to minority shareholders 252 290
o/ w Sonatel Group 186 176
o/ w Orange Polska 37 79
o/ w Medi Telecom 15 -
o/ w Jordan Telecom Group 10 26
8.5 Cumulative translation adjustment
(in millions of euros) June 30, 2016 June 30, 2015
Profit (loss) recognized in other comprehensive income during the period (174) 130
Reclassification to net income for the period - 1
Total translation adjustments for continuing operations (174) 131
Reclassification to the net income for the period (1)
(836) -
Total translation adjustments for discontinued operations (836) -
(1) These translation adjustments are only related to EE.
The change in translation differences recognized in other comprehensive income includes:
in the first half of 2016, a decrease of 101 million euros due to the depreciation in the Polish zloty and a decrease of
61 million euros due to the depreciation in the Egyptian pound,
in the first half of 2015, an increase of 56 million euros due to the appreciation in the Polish zloty and 56 million euros due to
the appreciation in the Jordanian dinar.
8.6 Subordinated notes
The amount of 5 803 million euros presented in the row "Subordinated notes" of the consolidated statements of changes in
shareholders' equity represents the nominal booked at historical value (the tranches denominated in pounds sterling have not
been revaluated since their issue in 2014). Premium and fees amounting (88) million euros are booked by reserves.
On the first half-year of 2016, Orange did not exercise its right to defer the coupons of the subordinated notes and therefore
paid:
On February 8, 2016, a remuneration of 95 million euros and 38 million pounds sterling (equivalent to 49 million euros) to
holders of the issue of February 2014;
On April 1, 2016, a remuneration of 35 million pounds sterling (equivalent to 44 million euros) to holders of the tranche
denominated in pound sterling issued in October 2014.
The tax effect relating to the foreign currency translation on notional denominated in pound sterling is of (66) million euros over
the period. This impact is presented in the consolidated statements of changes in shareholders' equity as the "Other
movements".
First half 2016 - Condensed interim consolidated financial statements 30
NOTE 9 Litigations and unrecognized contractual commitments
9.1 Litigations
At June 30, 2016, the contingency reserves recorded by the Group for all disputes in which it is involved (excluding liabilities
relating to disputes between Orange and the tax or social administrations in relation to operational or income taxes or social
contributions, which are recognized in the corresponding items of the balance sheet) amounted to 515 million euros compared
with 528 million euros at December 31, 2015. Orange believes that the disclosure of provisions that may be recorded on a case-
by-case basis could seriously harm its position.
This note describes the new proceedings and developments in existing litigations having occurred since the publication of the
consolidated financial statements for the year ended December 31, 2015, that have had or may have a material impact on the
Group’s financial position.
In the procedure brought by SFR in 2012 before the Paris Commercial Court denouncing its retail offers to the secondary
residences and claiming 218 million euros in damages for the loss allegedly suffered, the French Supreme Court annulled on
April 12, 2016 the Paris Court of Appeal’s decision of October 8, 2014, which had ruled in favor of Orange. As a
consequence, Orange had to pay 53 million euros to SFR pursuant to the first instance judgment rendered on February 12,
2014. The Paris Court of Appeal will have to examine the case on remand.
Orange and Altitude Infrastructure put an end on June 30, 2016 to the dispute which opposed them on the time allowed and
the tariffs set by Orange to provide its wholesale offer to operators on the market for the services leading to the reduction of
zones in local communities not yet covered by a broadband network. Altitude Infrastructure consequently withdrew from its
action for damages before the Paris Commercial Court and from its complaint before the Competition Authority.
In the action brought before the Paris Commercial Court by SFR against Orange SA in 2015 for damages suffered because
of Orange’s practices on the B-to-B markets, SFR increased on April 12, 2016 its claims up to 2.4 billion euros. This increase
does not alter Orange’s assessment of the dispute. Given the decision of the French Competition Authority of December 17,
2015, which fined Orange 350 million euros in connection with its competitive practices, Orange has already disclosed in the
notes to its 2015 financial statements that this claim represents a risk, provided that any right for SFR to be indemnified
remains subject to SFR characterizing an actual damage suffered resulting from the sanctioned practices.
On May 19, 2016, the Paris Court of Appeal upheld the decision of the French Competition Authority regarding the scope
and significance of Orange's practices, which led the Authority to fine Orange in 2012 for having implemented, as part of its
unlimited offers launched in 2005, an excessive price discrimination between calls made within its own network and calls
made to its competitor’s network. However, the Court reduced by 20% (i.e. from 117 million euros to 94 million euros) the
amount of the fine since the practice had never before been sanctioned by the Authority. In June 2016, the Authority
reimbursed 23 million euros to Orange. Since the parameters condemning the practice itself were not challenged by the
Court of Appeal, Orange lodged an appeal before the French Supreme Court.
Apart from the proceedings mentioned above, there are no governmental, legal or arbitration proceedings (whether pending,
suspended or threatened) of which Orange is aware, either new or having evolved since the publication of the consolidated
financial statements for the year ended December 31, 2015, which have had over the period, or which may have, a material
impact on the Company’s or the Group’s financial position or profitability.
9.2 Unrecognized contractual commitments
No major event has impacted the unrecognized contractual commitments described in the consolidated financial statements for
2015.
NOTE 10 Related party transaction
During the first six months of 2016, no operation had significant effect on the amounts of the transactions with the related parties
published on December 31, 2015.

First half 2016 - Condensed interim consolidated financial statements 31
NOTE 11 Subsequent events
Changes in scope of consolidation
On July 19, 2016 the Group acquired Airtel in Sierra Leone from Bharti Group.
Orange SA: distribution of an interim dividend
At its meeting held on July 25, 2016, the Board of Directors resolved to distribute an interim dividend of 0.2 euro per share in
respect of 2016. This interim dividend will be paid in cash on December 7, 2016. The estimated payment amounts to 532 million
euros based on the number of ordinary shares outstanding at June 30, 2016.

First half 2016 - Condensed interim consolidated financial statements 32
Statutory auditors’ review report on the half-year financial information
To the Shareholders,
In compliance with the assignment entrusted to us by your annual general meeting and in accordance with the requirements of
article L. 451-1-2 III of the French monetary and financial code (“Code monétaire et financier”), we hereby report to you on:
the review of the accompanying condensed half-yearly consolidated financial statements of Orange, for the period from
January 1 to June 30, 2016,
the verification of the information presented in the half-yearly management report.
These condensed half-yearly consolidated financial statements are the responsibility of your board of directors. Our role is to
express a conclusion on these financial statements based on our review.
1. Conclusion on the financial statements
We conducted our review in accordance with professional standards applicable in France. A review of interim financial
information mainly consists of making inquiries, primarily of persons responsible for financial and accounting matters, and
applying analytical and other review procedures. A review is substantially less in scope than an audit conducted in accordance
with professional standards applicable in France and consequently does not enable us to obtain assurance that we would
become aware of all significant matters that might be identified in an audit. Accordingly, we do not express an audit opinion.
Based on our review, nothing has come to our attention that causes us to believe that the accompanying condensed half-yearly
consolidated financial statements are not prepared in all material respects in accordance with IAS 34 – the standard of the
IFRSs as adopted by the European Union applicable to interim financial information.
2. Specific verification
We have also verified the information provided in the half-yearly management report in respect of the condensed half-yearly
consolidated financial statements subject to our review.
We have no matters to report on the fair presentation and consistency of this information with the condensed half-yearly
consolidated financial statements.
Paris-La Défense, July 25, 2016
The statutory auditors
French original signed by
KPMG SA ERNST & YOUNG Audit
Marie Guillemot Charles-Emmanuel Chosson