conditional pricing of currency risk in africa's equity market · 1. some summary statistics...
TRANSCRIPT

Af
ric
An
Ec
on
om
ic r
Es
EA
rc
h c
on
so
rt
ium
Co
ns
or
tiu
m p
ou
r l
a r
eCh
erC
he
ÉCo
no
miq
ue
en a
friq
ue
Bringing Rigour and Evidence to Economic Policy Making in Africa
Research Paper 354
conditional Pricing of currency risk in Africa's
Equity market
Odongo Kodongoand
Kalu Ojah
THIS RESEARCH STUDY was supported by a grant from the African Economic Research Consortium. The findings, opinions and recommendations are those of the author, however, and do not necessarily reflect the views of the Consortium, its individual members or the AERC Secretariat.
Published by: The African Economic Research Consortium P.O. Box 62882 - City Square Nairobi 00200, Kenya
Printed by: Modern Lithographic (K) Ltd P.O. Box 52810 - City Square Nairobi 00200, Kenya
ISBN 978-9966-61-047-8
© 2018, African Economic Research Consortium.
contentsList of tablesList of figuresList of abbreviations and acronymsAbstract
1. Introduction 1
2. Methodology 7
3. Data and descriptive statistics 11
4. Empirical results 15
5. Additional tests 22
6. Conclusion 26
Notes 27
References 29
List of tables1. Some summary statistics for real exchange rate indexes 32. Basic nexus between the “Afro” real exchange rate index and stock 4 market indexes3. Equity returns in local currency units and in the US dollars 54. Descriptive statistics 125. Suitability of conditioning variables 146. Additional preliminary statistics 147. Parameter estimates for SDF model specifications 178. The dynamic performance of the SDF model specifications 219. Tests results for market-size-augmented ICAPM 2310. Average pricing errors 2311. Unconditional ICAPM estimates 24

List of figures 1. Trends in trade-weighted real exchange rates 22. Trends in the “Afro” real exchange rate index and stock market indexes 33. Actual versus fitted returns for the ICAPM 204. Size-augmented ICAPM pricing errors 24

List of abbreviations and acronyms
AfDB African Development BankAPMs Asset Pricing ModelsCAPM Capital Asset Pricing ModelICAPM Intertemporal Capital Asset Pricing ModelIMF International Monetary FundOITP Other Important Trading PartnersRER Real Exchange RateSDF Stochastic Discount FactorSMV Small Market VariableWDI World Development IndicatorsWTO World Trade Organization
Abstract In this paper, we sought to establish whether Africa’s volatile currencies drive equity risk premium. We use the stochastic discount factor (SDF) framework to estimate various conditional specifications of the International Capital Asset Pricing Model through generalized method of moments technique. Our results show strong evidence of conditional, time-varying currency risk premium in equity returns. Currency risk is also perceived by international investors as important in informing the equities pricing kernel. We also find evidence that international investors are worried about Africa’s small size equity markets and build anticipated low trading into their pricing calculus.
JEL classification: G12; G15; F21; F31Keywords: Africa; currency risk; equity markets; stochastic discount factor; GMM.


Conditional PriCing of CurrenCy risk in afriCa's equity Market 1
1
1. introductionAfrica’s equity markets have recently attracted increased interest among international investors. According to the African Development Bank (AfDB) (2013), total external financial flows to Africa reached a historic high of an estimated US$186.3 billion in 2012, up from US$158.3 billion in 2011, while the flow of foreign direct investment and portfolio investment has quadrupled since 2001. Although the interest in Africa’s equity markets as important investment destinations has been explained by the recent fast pace of growth of Africa’s economies (AfDB, 2013), Africa’s equity markets are also considered attractive for portfolio diversification purposes because they tend to exhibit low correlations with the rest of the world (Harvey, 1995; Alagidede et al, 2011). Indeed, many of the stock markets in Africa performed better, on a risk-adjusted basis, than most markets around the world during the 2007/8 financial crisis, with some markets actually realizing positive returns (Allen et al, 2011).
In practice, portfolio diversification benefits are evaluated against associated risks. In particular, international investors, whose returns are denominated in foreign currencies, find it necessary to adjust their returns for currency risk. In a fixed exchange rate regime, exchange rate fluctuations are minimal, if any, and governments guarantee the convertibility of their currencies. Thus, if monetary policy can achieve stability in inflation rates, real exchange rates would be stable and foreign investors would worry less about real exchange rate fluctuations.1 When nominal exchange rates are flexible, monetary policy management becomes more complex, and, real exchange rates typically exhibit volatility.
When exchange rates are volatile, international portfolio investors face the prospects of earning negative risk-adjusted returns on the foreign assets in their portfolios. Thus, they might demand a premium commensurate with the perceived risk of excessive exchange rates fluctuations. But, how volatile are real exchange rates in Africa? Kodongo and Ojah (2011) developed a representative trade-weighted real exchange rate index (against the US dollar) for Africa, labelled the “Afro”. To make it more comparable with similar indexes, we have slightly modified the Afro index to incorporate time-varying weights.2 Thus, we now construct the Afro index at time t, It, as:
It = It-1 Πnj=1 (REERj,t /REERj,t-1)wjt (1)
where, RERj,t and Wjt are, respectively, the local currency-US dollar real exchange rate and the weight
of country j at time t; Wjt = Xjt∑Xjt
(Xjt = φjt + ∑ nj=1 Wjt = 1), such that φjt =
Country j's imports from USA in month tCountry j's total imports in month t
; and φjt = Country j's exports to USA in month t
Country j's total exports in month t .We obtain the direction of trade data from the International
Monetary Fund (IMF) and the World Trade Organization (WTO).The time series trend of the Afro index, for the period January 1999 through December 2013, is
juxtaposed against the OITP (other important trading partners), MAJOR and BROAD indexes of the Reserve Bank of the USA, in Figure 1.3 The OITP index is constructed from currencies of emerging countries which we believe to be in direct competition with African countries for capital flows. The MAJOR index comprises (the most studied) currencies of major industrial economies and is used
2 researCh PaPer 354
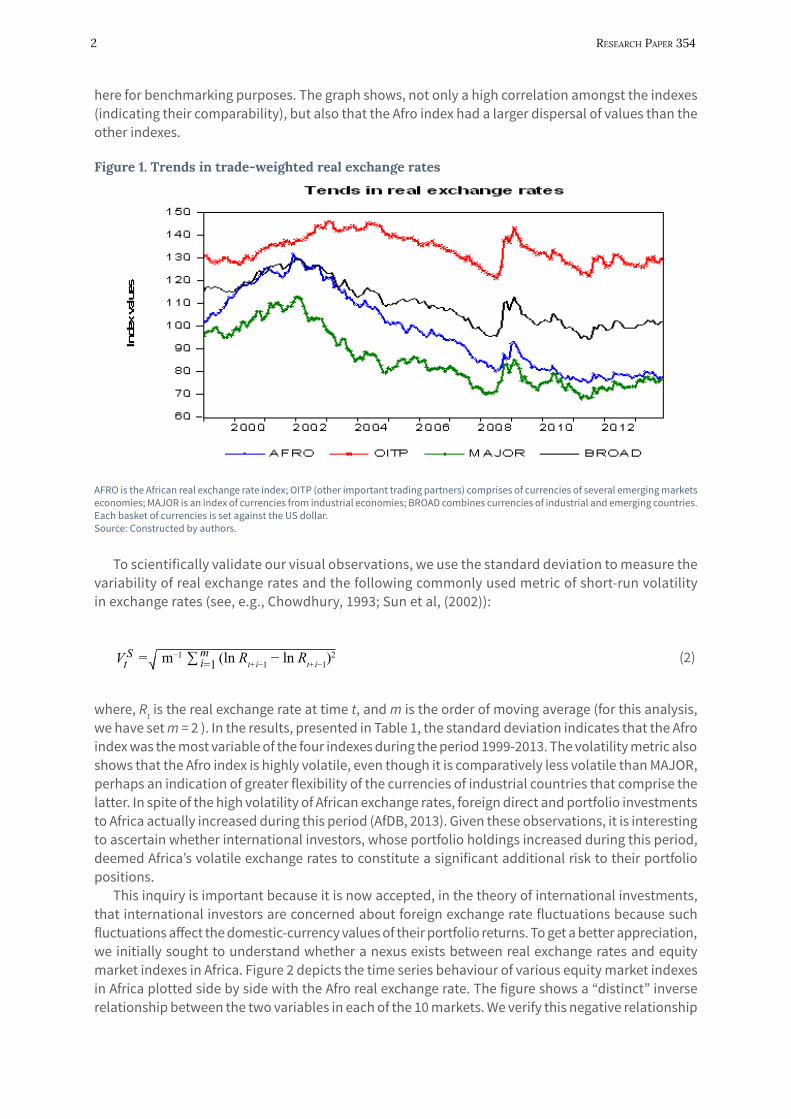
here for benchmarking purposes. The graph shows, not only a high correlation amongst the indexes (indicating their comparability), but also that the Afro index had a larger dispersal of values than the other indexes.
figure 1. trends in trade-weighted real exchange rates
AFRO is the African real exchange rate index; OITP (other important trading partners) comprises of currencies of several emerging markets economies; MAJOR is an index of currencies from industrial economies; BROAD combines currencies of industrial and emerging countries. Each basket of currencies is set against the US dollar.Source: Constructed by authors.
To scientifically validate our visual observations, we use the standard deviation to measure the variability of real exchange rates and the following commonly used metric of short-run volatility in exchange rates (see, e.g., Chowdhury, 1993; Sun et al, (2002)):
V St ∑ m
i=1√= m−1 (ln Rt+ί−1 − ln Rt+ί−1)2 (2)
where, Rt is the real exchange rate at time t, and m is the order of moving average (for this analysis, we have set m = 2 ). In the results, presented in Table 1, the standard deviation indicates that the Afro index was the most variable of the four indexes during the period 1999-2013. The volatility metric also shows that the Afro index is highly volatile, even though it is comparatively less volatile than MAJOR, perhaps an indication of greater flexibility of the currencies of industrial countries that comprise the latter. In spite of the high volatility of African exchange rates, foreign direct and portfolio investments to Africa actually increased during this period (AfDB, 2013). Given these observations, it is interesting to ascertain whether international investors, whose portfolio holdings increased during this period, deemed Africa’s volatile exchange rates to constitute a significant additional risk to their portfolio positions.
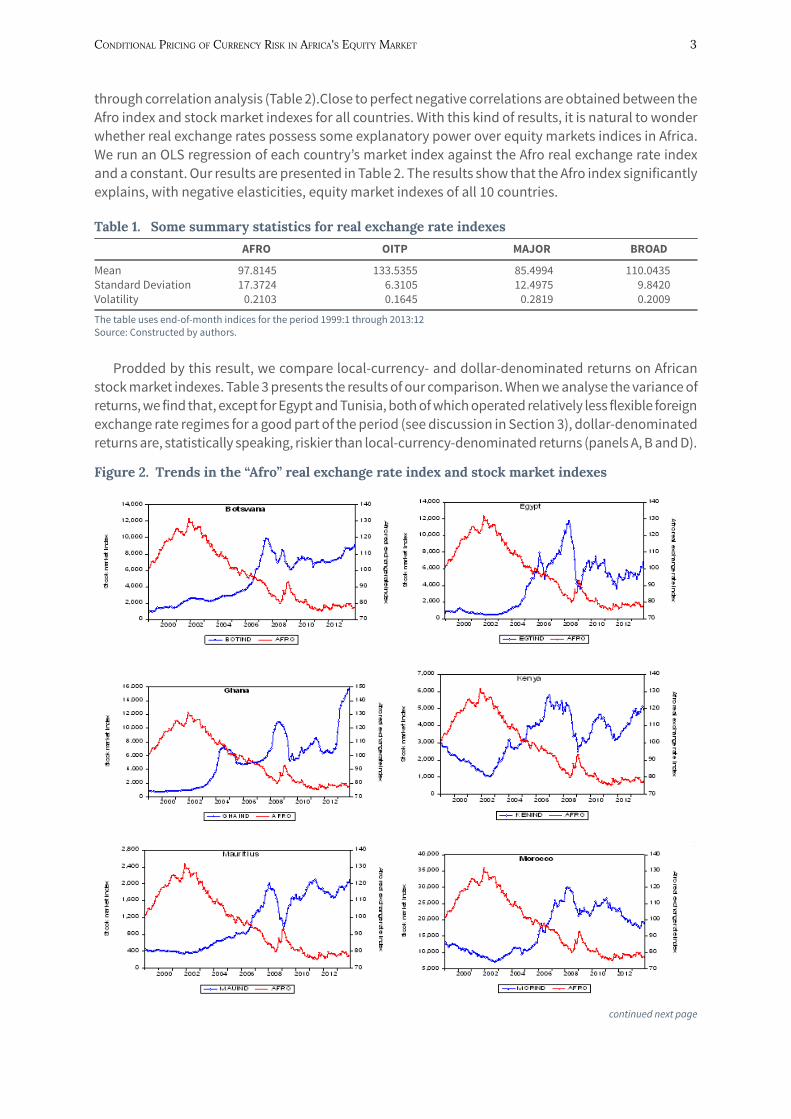
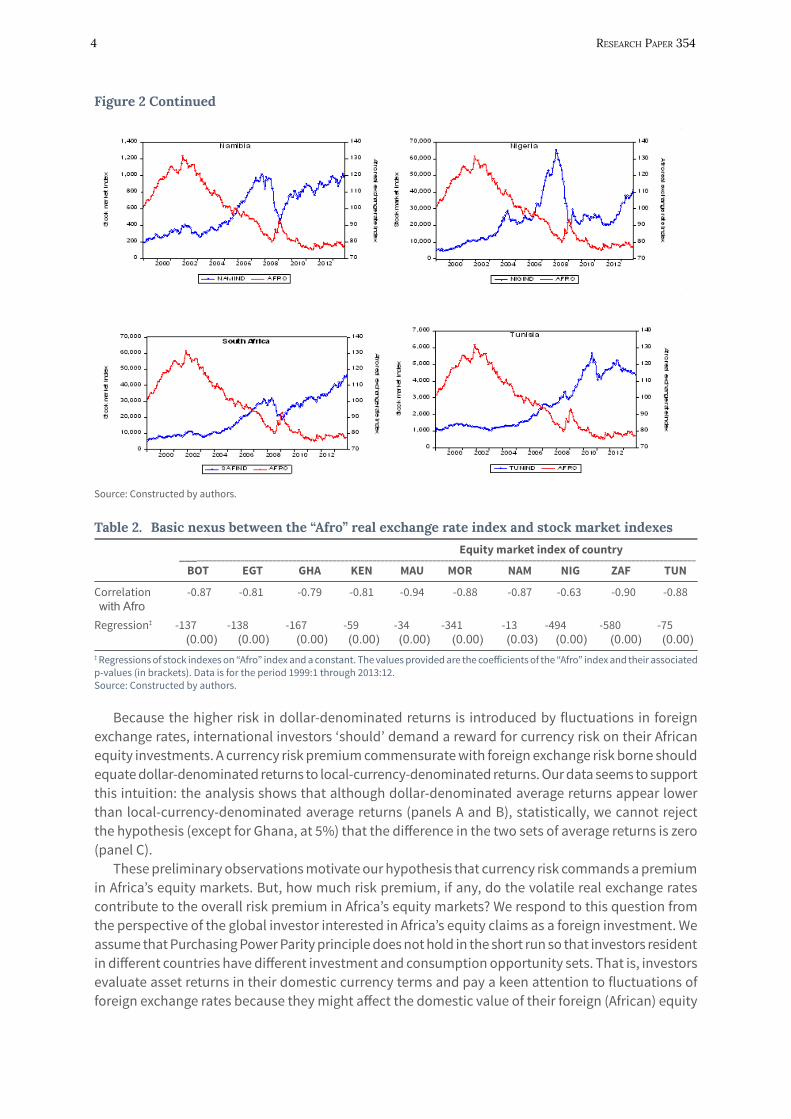
This inquiry is important because it is now accepted, in the theory of international investments, that international investors are concerned about foreign exchange rate fluctuations because such fluctuations affect the domestic-currency values of their portfolio returns. To get a better appreciation, we initially sought to understand whether a nexus exists between real exchange rates and equity market indexes in Africa. Figure 2 depicts the time series behaviour of various equity market indexes in Africa plotted side by side with the Afro real exchange rate. The figure shows a “distinct” inverse relationship between the two variables in each of the 10 markets. We verify this negative relationship
Conditional PriCing of CurrenCy risk in afriCa's equity Market 3
through correlation analysis (Table 2).Close to perfect negative correlations are obtained between the Afro index and stock market indexes for all countries. With this kind of results, it is natural to wonder whether real exchange rates possess some explanatory power over equity markets indices in Africa. We run an OLS regression of each country’s market index against the Afro real exchange rate index and a constant. Our results are presented in Table 2. The results show that the Afro index significantly explains, with negative elasticities, equity market indexes of all 10 countries.
table 1. some summary statistics for real exchange rate indexes
AFRO OITP MAJOR BROAD
Mean 97.8145 133.5355 85.4994 110.0435Standard Deviation 17.3724 6.3105 12.4975 9.8420Volatility 0.2103 0.1645 0.2819 0.2009
The table uses end-of-month indices for the period 1999:1 through 2013:12Source: Constructed by authors.
Prodded by this result, we compare local-currency- and dollar-denominated returns on African stock market indexes. Table 3 presents the results of our comparison. When we analyse the variance of returns, we find that, except for Egypt and Tunisia, both of which operated relatively less flexible foreign exchange rate regimes for a good part of the period (see discussion in Section 3), dollar-denominated returns are, statistically speaking, riskier than local-currency-denominated returns (panels A, B and D).
figure 2. trends in the “Afro” real exchange rate index and stock market indexes
continued next page
4 researCh PaPer 354
figure 2 continued
Source: Constructed by authors.
table 2. Basic nexus between the “Afro” real exchange rate index and stock market indexes
Equity market index of country ________________________________________________________________________________________________________________________________
BOT EGT GHA KEN MAU MOR NAM NIG ZAF TUN
Correlation -0.87 -0.81 -0.79 -0.81 -0.94 -0.88 -0.87 -0.63 -0.90 -0.88 with AfroRegression‡ -137 -138 -167 -59 -34 -341 -13 -494 -580 -75 (0.00) (0.00) (0.00) (0.00) (0.00) (0.00) (0.03) (0.00) (0.00) (0.00)‡ Regressions of stock indexes on “Afro” index and a constant. The values provided are the coefficients of the “Afro” index and their associated p-values (in brackets). Data is for the period 1999:1 through 2013:12.Source: Constructed by authors.
Because the higher risk in dollar-denominated returns is introduced by fluctuations in foreign exchange rates, international investors ‘should’ demand a reward for currency risk on their African equity investments. A currency risk premium commensurate with foreign exchange risk borne should equate dollar-denominated returns to local-currency-denominated returns. Our data seems to support this intuition: the analysis shows that although dollar-denominated average returns appear lower than local-currency-denominated average returns (panels A and B), statistically, we cannot reject the hypothesis (except for Ghana, at 5%) that the difference in the two sets of average returns is zero (panel C).
These preliminary observations motivate our hypothesis that currency risk commands a premium in Africa’s equity markets. But, how much risk premium, if any, do the volatile real exchange rates contribute to the overall risk premium in Africa’s equity markets? We respond to this question from the perspective of the global investor interested in Africa’s equity claims as a foreign investment. We assume that Purchasing Power Parity principle does not hold in the short run so that investors resident in different countries have different investment and consumption opportunity sets. That is, investors evaluate asset returns in their domestic currency terms and pay a keen attention to fluctuations of foreign exchange rates because they might affect the domestic value of their foreign (African) equity
Conditional PriCing of CurrenCy risk in afriCa's equity Market 5
investment returns. If they perceive exchange rate volatility to be a significant factor affecting the net returns on their investments in African equities, foreign exchange risk would command a premium that would constitute a part of their overall required rate of return.
table 3. Equity returns in local currency units and in us dollars
Botswana Egypt Ghana Kenya Mauritius Morocco Namibia Nigeria S. Africa Tunisia
A. Local currency market index returns
Mean 0.013 0.013 0.016 0.003 0.008 0.002 0.010 0.011 0.012 0.009S. Dev. 0.039 0.098 0.062 0.060 0.045 0.046 0.063 0.073 0.053 0.040
B. Dollar market index returns
Mean 0.009 0.004 0.003 -0.001 0.007 0.002 0.006 0.000 0.009 0.006S. Dev. 0.047 0.102 0.068 0.071 0.058 0.053 0.086 0.104 0.075 0.044
C. Are dollar-denominated returns lower?
p-value1 0.19 0.20 0.02 0.31 0.37 0.50 0.30 0.13 0.30 0.26
D. Are dollar-denominated returns riskier?
p-value2 0.01 0.30 0.08 0.01 0.00 0.03 0.00 0.00 0.00 0.111 p-values of the one-tailed t-test for the hypothesis that dollar-denominated returns are, on average, equal to local-currency-denominated returns. The test assumes unequal variances in the distribution of returns.2 p-values of the one-tailed F-testfor the hypothesis that the variance of dollar-denominated returns equals the variance of local-currency-denominated returns.Source: Constructed by authors.
Empirical evidence on the pricing of foreign exchange risk has been mixed. Some studies, based on unconditional asset pricing models (APMs), have failed to find any evidence of currency risk pricing in various equity markets (Jorion, 1991; Loudon, 1993; Kodongo and Ojah, 2011); some have reported mixed and inconclusive results (Choi et al, 1998; Iorio and Faff, 2002); while others have reported high degrees of currency risk exposure (Dominguez and Tesar, 2001; Carrieri and Majerbi, 2006). Failure by unconditional asset pricing tests to resolve the issue as to whether currency risk is priced in the equity markets has motivated the search for alternative frameworks. Thus, conditional APMs have become a plausible alternative. According to Dumas and Solnik (1995), it is natural to test any asset pricing model in its conditional form because investors’ decisions are informed by conditioning information such as interest rates and past equity prices. Based on this logic, several studies, using different empirical designs, have found that changes in foreign exchange rates constitute additional sources of risk to equity investors in industrial countries (Dumas and Solnik, 1995; de Santis and Gerard, 1998; Doukas et al, 1999; Tai, 1999; MacDonald, 2000; Kolari et al, 2008) as well as in the emerging markets (Phylaktis and Ravazzolo, 2004; Carrieri et al, 2006; Aysun and Guldi, 2011; Sirr et al, 2011; Antell and Vaihekoski; 2012).
Clearly, if well specified, conditional APMs are better suited, than unconditional APMs, to finding currency risk priced in international equity markets. In Africa, bivariate cointegration tests have not been able to find evidence of a long-run relationship between stock prices and real exchange rates (Ndako, 2013; Kodongo and Ojah, 2013). This probably explains why Kodongo and Ojah (2011) could not find an unconditionally priced currency risk in Africa’s equity markets. Yet, when the world equity market (proxied by the US equity market, the apparent transition mechanism between the two financial markets) is introduced, a long-run cointegration is found to exist between equity and stock prices (Kodongo&Ojah, 2013). The latter finding is, in our view, consistent with a conditionally priced currency risk in equity markets. However, the conditional pricing of currency risk has not been investigated in Africa’s equity markets. Thus, whether the findings from less exotic emerging markets can be generalized to Africa’s nascent stock markets is an open empirical question.
In this study, we employ the stochastic discount factor (SDF) framework with the world equity portfolio and foreign exchange risk as priced risk factors. Later, we add a small market size variable

6 researCh PaPer 354
to our risk factors. The SDF approach, a fairly recent development in financial econometrics, has gained widespread usage in asset pricing tests. Several studies employing the SDF approach have demonstrated that currency risk premium are time-varying and account for a significant part of the excess returns on international assets in advanced countries (Zhang, 2006; Cappiello and Panigirtzoglou, 2008)4 and in the emerging markets (Drobetz et al, 2002; Poghosyan and Kočenda, 2008; Poghosyan, 2010). The SDF approach allows for the modelling of time-variation in the pricing kernel as well as in the risk premium. We assume that a set of information, existing at the beginning of each month, conditions investors’ decisions. We proxy the conditioning information by six macroeconomic variables believed by international finance researchers to be able to predict equity returns. The conditioning variables include three worldwide variables, namely, the returns on the MSCI world equity portfolio, dividend yields on the MSCI world equity portfolio, the Eurodollar deposit rate and one foreign variable, the USA term premium. At the local level, we use inflation rates and deposit rates. All conditioning variables are lagged one period and differenced if not stationary in levels. Our study covers 10 equity markets in Africa: Botswana, Egypt, Ghana, Kenya, Mauritius, Morocco, Namibia, Nigeria, South Africa and Tunisia, the choice of which we discuss in Section 3.
Our findings suggest that foreign exchange risk is priced with time-varying premium in the stock markets of African countries. We also find strong evidence that the currency risk factor enters the equity pricing kernel in these stock markets. Our estimates of the zero-beta rate are reasonably close to observed values. These findings suggest that international investors in these markets should hedge their portfolio positions against foreign exchange risk. In this regard, policy makers should either move to avail hedging instruments or free markets sufficiently to enable investors to avail themselves of the same in offshore markets. The rest of this paper proceeds as follows: Section 2 presents the theoretical model and empirical procedures. Section 3 describes the data and descriptive statistics. Section 4 presents the primary empirical estimates of the baseline models; Section 5 explores additional tests as a way of providing robustness checks for our baseline results. Section 6 concludes.
Conditional PriCing of CurrenCy risk in afriCa's equity Market 7
2. methodologythe sDf asset pricing framework
The first order conditions for an investor-consumer’s portfolio decision problem are5:
Et−1(MtRit) = 1 (3)
where, Et (∙) is the conditional expectations operator, Mt is the investor-consumer’s intertemporal marginal rate of substitution (or the pricing kernel), Rίt is the gross return on asset ί, (ί = 1,2,…,N) at time t. Ferson (1995) points out that, without more structure, the SDF model in Equation 3 has little empirical content because it is easy to find some random variable Mt for which the equation holds. Equation 3 implies a factor model structure of the form6:
Et−1(Rit) = λ0 + βi,M λM (4)
where, λ0 is the price of the zero-beta asset: it is assumed that λ0 is uncorrelated with Mt; λM is the risk per unit of the expected return (price of risk) on Mt; βi,M is the regression coefficient of Rί on Mt, loosely interpreted as a measure of systematic risk (quantity of risk) of asset ί. The above result can be easily extended to the multi-factor case:
Et−1(Rit) = λ0 + βi,1 λ1 + βi,2 λ2 + βi,k λk (5)
It is easy to show (see, e.g., Kodongo, 2011) that Equation 5 is equivalent to:
E (Rit) = λ0 + λ1 cov ( f1t Rίt )
var ( f1t ) + λ2
cov ( f2t Rίt )var ( f1t )
+ ... + λk cov ( fkt Rίt )
var ( fkt ) (6)
Given the factor structure in Equation 5, Cochrane (2000) shows that the pricing kernel can be expressed as a linear combination of k factors (with bt as a k-vector of factor loadings; Ft as a k-vector of factors):
Mt = at + b't Ft (7)
7
8 researCh PaPer 354
Incorporating conditioning information
We can assume, under the SDF approach, that returns are conditional on the full set of market-wide information, Ωt−1, available to investors at time t−1, usually proxied in econometric tests by a set of a few, carefully selected and judiciously transformed, instrumental variables, Zt−1 (∈Ωt−1). We use the conditioning information set, Z_(t-1), to scale risk factors. Scaling is done following Cochrane (1996): by modelling the parameters as linear functions of Zt−1: at = a' Zt-1) and bt = b' Zt−1, where Zt−1 is the vector of s instruments. Thus, the model in Equation 7 can be expressed as Mt =a' Zt−1 + b' Zt−1)Ft. Let Ft ≡ ft, where f represents scaled and unscaled factors; let a' = (a0 a1); b' = [b'0,b'1] and define Zt−1 =(1 zt−1 )'. In this setup, zt−1 is, effectively, a scalar, implying that in actual application, one conditioning variable is used at a time (see, e.g., Hodrick and Zhang, 2001 and Iqbal et al, 2010). Thus, the scaled-factor representation becomes:
Mt = a0 + a1 zt−1 + (b'0 + b'1 zt−1) ⊗ ft (8)
where, ⊗ is the Kronecker product (i.e., multiply each term in the bracket by every factor). If there are only two risk factors, Equation 8 becomes:
Mt = a0 + a1 zt−1 + b01 f1t + b02 f2t + b11 ( f1t zt-1) + b12 ( f2t zt-1) (9)
Thus, instead of a two-factor model with time-varying factor weights, scaling results in a four-factor model (two of which are scaled by conditioning variables) with constant weights. However, parameters b11 and b12 capture time variation in the risk factors. In our empirical analysis, we drop the second term, following Cochrane (1996). Many other authors (e.g., Lettau and Ludvigson, 2001 and Iqbal et al, 2010) have employed this approach successfully in conditional asset pricing tests in various equity markets.
Rationale for scaling
An important implication of equations 8 and 9 is that the risk of an equity investment is a function of the covariance of its returns with the risk factor (e.g., foreign exchange risk) conditional on some variable that reflects time variation in risk premium (Lettau and Ludvigson, 2001). Time variation in risk premium can be explained by changes in the magnitude of risk inherent in the investment or changes in risk aversion among investors. For example, a rise in the Eurodollar deposit rates (indicating an increment in interest rates) may dim investors’ return expectations from international fixed income assets in general. The diminished return prospects from fixed income assets may lower investors’ aversion to equity risk and hence shift their preference in favour of international equities. Thus, although returns on international equity investments will be subjected to exchange rate fluctuations, the risk introduced by exchange rate changes to equity returns (covariance between equity returns and exchange rate returns) is informed by changes in investors’ risk aversion, emanating from changes in Eurodollar deposit rates, over time.
Conditional PriCing of CurrenCy risk in afriCa's equity Market 9
Empirical specification
Estimating the pricing kernel
The scaled factor model can be tested unconditionally by applying the Law of Iterated Expectations7. Plugging (8) into (3), the unconditional sample moment conditions, which we evaluate through the Generalized Method of Moments (GMM), are expressed parsimoniously as:
gT (Ɵ) = 1T
Tt=1Σ {[a0 + (b'0 + b'zt−1) ⊗ ft ] Rit − 1} = 0i = 1,2,..., n (10)
where, Ɵ is the set of all parameters (a, b) to be estimated and 0 is an n-vector of zeros. Non-zero elements of b indicate the significance of a factor in the pricing kernel. We initially model Equation 10 with two risk factors: the world market risk factor and the currency risk factor.
Estimating factor risk premiumUsing the parameterization in Equation 6, and following previous studies (Harvey and Kirby, 1995; Shanken and Zhou, 2007), the sample moment conditions evaluated are:
gT (Ɵ) = 1T
Tt=1Σ
(Rt − μr )
(ft − μf )2f
σ
(ft − μjf ) = 0 (11)
Rt − ιλ0 − Tt=1Σ λj
(Rt − μr ) (ft − μjf )2jf
σ
where, a circumflex indicates that the parameter is an estimate; i is an n-vector of ones; Rt is an n-vector of asset returns with mean vector μr; ft is a k-vector of scaled and unscaled factors with mean vector μf; and σ 2
j f = Var (fjt). There are a total of 2(n + k) moment conditions in the system (11). We estimate the system’s parameters through the sequential GMM procedure of Ogaki (1993). Accordingly, we first obtain the GMM estimator θ1 = ( )' from the first 2n + k moment conditions in system (11). Since θ1 is a vector of n + 2k parameters consisting of means and variances of returns and factors, the first sub-system is exactly identified and is independent of the weighting matrix. The second (and last) step in the sequence involves plugging θ1 into the last n moment conditions in system (11), then solving for the estimator θ2 = λ, a vector of k + 1 risk premium. Since (k + 1) < n, the second sub-system is over-identified and the weighting matrix used in the GMM estimation matters. We use the inverse of estimates of the variance-covariance matrix of the n moment conditions as the weighting matrix. Harvey and Kirby (1995) demonstrate that the GMM estimator θ2 is fully efficient. Iqbal et al (2010) point out that the estimator is not subject to errors-in-variables problem because there are no generated regressors employed in the estimation of the risk premium; rather, only the means and variances of returns and factors from the first stage of the sequential GMM process are used.
The GMM approach is particularly suitable because of its robustness to heteroskedasticity. Further, Hall (1993) explains that, under the GMM approach, one need not make an explicit specification of the data generating process. This can be contrasted to the traditional techniques, such as maximum
10 researCh PaPer 354
likelihood estimation, where a data generating process, informed by an explicitly defined probability density function, necessarily forms a part of the estimation process. If the specified distribution function does not accurately reflect the true data generating process, such traditional techniques produce biased parameter estimates. The GMM does not suffer this shortcoming.
Stability tests
Garcia and Ghysels (1998) document the importance of testing for structural changes in the context of emerging markets, especially given the strong political and economic idiosyncrasies that have disrupted these markets in comparison with developed markets. To check the structural stability in the SDF parameters, we use the sup-LM test of Andrews (1993). The null hypothesis for the sup-LM test is that there are no structural shifts so that parameters are stable. This is tested against the alternative that there is a single structural break at some unknown point in time. We compute the sup-LM statistic as the largest of LM statistics computed at 5% increments between 15% and 85% of the sample. The calculated sup-LM statistics are evaluated against critical values in Table 1 of Andrews (2003).
Conditional PriCing of CurrenCy risk in afriCa's equity Market 11
3. Data and descriptive statisticsWe study the pricing of currency risk in 10 African countries’ equity markets, sampled by data availability. Although liquidity levels for many of the sampled markets are very low by the standards of equity markets of industrial countries (Allen et al, 2011), foreign investor participation in many of the sampled markets is substantial. Indeed, for some of the markets, the volume of foreign transactions is, often, a substantial proportion of total volume traded in a period: for example, foreign investor participation at the end of 2013 was about 58% at the Nairobi Securities Exchange and about 56% of the total volume at the Nigerian Stock Exchange.8 The data cover the period 1998:11 through 2013:12. After log differencing and lagging some series, we end up with data for the period 1999:1 through 2013:12 – a total of 180 monthly observations.
Equity market indexes (denominated in domestic currency units),and market capitalization are sourced from Bloomberg9. For Ghana, we obtain cedi-denominated market indexes from Ghana
Stock Exchange: the indexes were revised in January 2011, with December 31, 2010 as 1000. For
consistency in our returns computations, we reconstruct indices from January 2011 using their
percentage changes and the “old” index of December 2010. To illustrate, the reconstructed index
(RI) for January 2011 is computed as RIJan11 = OIDec10 × NIJan11 − NIDec10
NIDec101 + , where OI is “Old” index
and NI is “New” index, such that NIDec10 = 1000. RIJan11 is then used to update the next index, and so
on. All the equity indexes do not include dividends but are adjusted for corporate actions such as stock splits. The random rate of return on an equity index (in local currency) is computed as r~jt = ln Ijt − ln Ij,t−1, where Ijt is the value of African stock market index, j, at time t. We compute US dollar-denominated returns as r~USD,t = ln (1 + r~j,t ) − ln (1 + SD,t ), where r~j is the local currency return and SD is change in the nominal value of the US dollar.
Panel A of Table 4 presents a summary of stock market index returns and their autocorrelations. Consistent with expectations, the assumption of normality is violated by the distributions of returns for all the national market indexes as well as the MSCI world equity portfolio index. Very high positive first order autocorrelation (above 20%) is observed for five of the 10 countries and the world equity portfolio index. Ghana’s index returns exhibit the highest persistent return predictability with its autocorrelation function remaining significant up to the sixth lag. However, high serial correlation is not an issue for us because our GMM estimates are robust to autocorrelation and heteroskedasticity. The market capitalization statistics show that the South African equity market is substantially larger than the rest of the African markets. For this reason, we run some of our tests with South Africa excluded.
Three distinct exchange rate regimes can be identified for the 10 sampled countries. According to IMF (2008), Morocco, Namibia, and Tunisia operate a conventional fixed peg: Namibia has pegged one-for-one against the South African rand while Morocco and Tunisia have pegged against a basket of currencies of key trading partners; Botswana operates a crawling peg (against a basket comprising the South African rand and the Special Drawing Rights); South Africa operates an independent float. The rest of the countries officially operated a freely floating exchange rate regime during the study period. However, a country’s actual (de facto) exchange rate regime might differ from her officially declared (de jure) exchange rate regime and, in reality, some countries that have declared to have floated their currencies actually only targeted stable exchange rates (Bubula and Ötker-Robe, 2002).
11
12 researCh PaPer 354
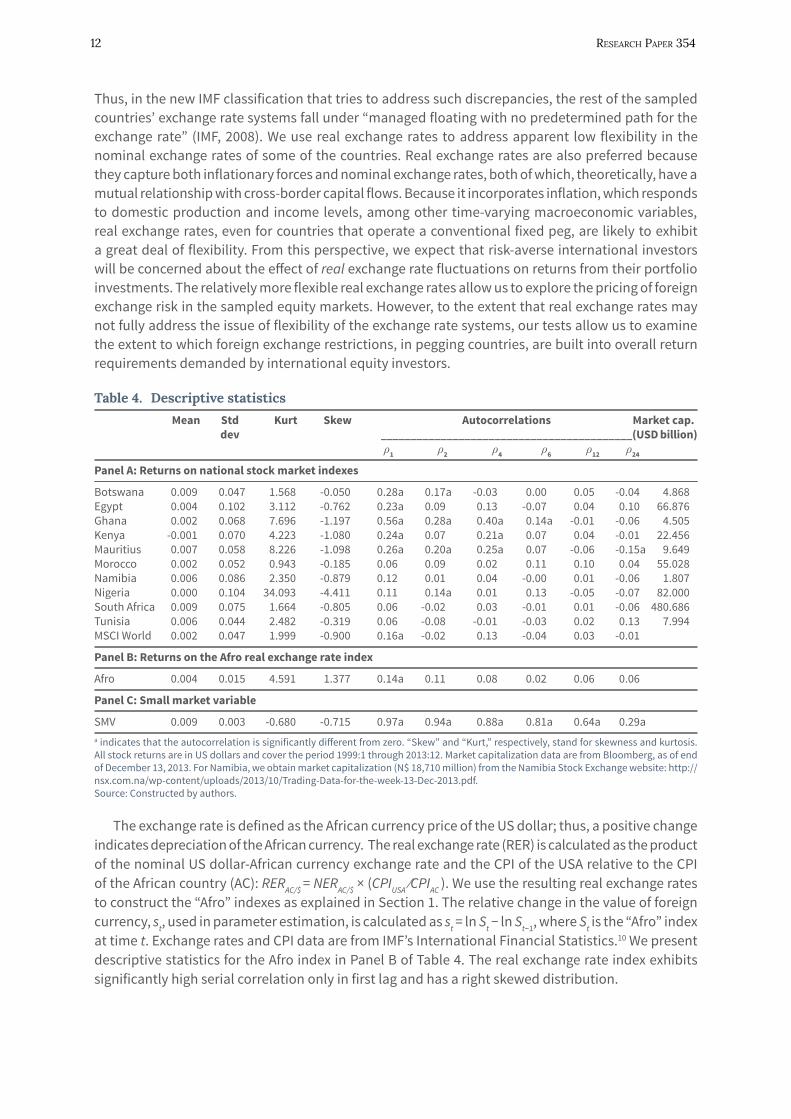
Thus, in the new IMF classification that tries to address such discrepancies, the rest of the sampled countries’ exchange rate systems fall under “managed floating with no predetermined path for the exchange rate” (IMF, 2008). We use real exchange rates to address apparent low flexibility in the nominal exchange rates of some of the countries. Real exchange rates are also preferred because they capture both inflationary forces and nominal exchange rates, both of which, theoretically, have a mutual relationship with cross-border capital flows. Because it incorporates inflation, which responds to domestic production and income levels, among other time-varying macroeconomic variables, real exchange rates, even for countries that operate a conventional fixed peg, are likely to exhibit a great deal of flexibility. From this perspective, we expect that risk-averse international investors will be concerned about the effect of real exchange rate fluctuations on returns from their portfolio investments. The relatively more flexible real exchange rates allow us to explore the pricing of foreign exchange risk in the sampled equity markets. However, to the extent that real exchange rates may not fully address the issue of flexibility of the exchange rate systems, our tests allow us to examine the extent to which foreign exchange restrictions, in pegging countries, are built into overall return requirements demanded by international equity investors.
table 4. Descriptive statistics
Mean Std Kurt Skew Autocorrelations Market cap. dev __________________________________________ (USD billion) ρ1 ρ2 ρ4 ρ6 ρ12 ρ24
Panel A: Returns on national stock market indexes
Botswana 0.009 0.047 1.568 -0.050 0.28a 0.17a -0.03 0.00 0.05 -0.04 4.868Egypt 0.004 0.102 3.112 -0.762 0.23a 0.09 0.13 -0.07 0.04 0.10 66.876Ghana 0.002 0.068 7.696 -1.197 0.56a 0.28a 0.40a 0.14a -0.01 -0.06 4.505Kenya -0.001 0.070 4.223 -1.080 0.24a 0.07 0.21a 0.07 0.04 -0.01 22.456Mauritius 0.007 0.058 8.226 -1.098 0.26a 0.20a 0.25a 0.07 -0.06 -0.15a 9.649Morocco 0.002 0.052 0.943 -0.185 0.06 0.09 0.02 0.11 0.10 0.04 55.028Namibia 0.006 0.086 2.350 -0.879 0.12 0.01 0.04 -0.00 0.01 -0.06 1.807Nigeria 0.000 0.104 34.093 -4.411 0.11 0.14a 0.01 0.13 -0.05 -0.07 82.000South Africa 0.009 0.075 1.664 -0.805 0.06 -0.02 0.03 -0.01 0.01 -0.06 480.686 Tunisia 0.006 0.044 2.482 -0.319 0.06 -0.08 -0.01 -0.03 0.02 0.13 7.994MSCI World 0.002 0.047 1.999 -0.900 0.16a -0.02 0.13 -0.04 0.03 -0.01
Panel B: Returns on the Afro real exchange rate index
Afro 0.004 0.015 4.591 1.377 0.14a 0.11 0.08 0.02 0.06 0.06
Panel C: Small market variable
SMV 0.009 0.003 -0.680 -0.715 0.97a 0.94a 0.88a 0.81a 0.64a 0.29a a indicates that the autocorrelation is significantly different from zero. “Skew” and “Kurt,” respectively, stand for skewness and kurtosis. All stock returns are in US dollars and cover the period 1999:1 through 2013:12. Market capitalization data are from Bloomberg, as of end of December 13, 2013. For Namibia, we obtain market capitalization (N$ 18,710 million) from the Namibia Stock Exchange website: http://nsx.com.na/wp-content/uploads/2013/10/Trading-Data-for-the-week-13-Dec-2013.pdf. Source: Constructed by authors.
The exchange rate is defined as the African currency price of the US dollar; thus, a positive change indicates depreciation of the African currency. The real exchange rate (RER) is calculated as the product of the nominal US dollar-African currency exchange rate and the CPI of the USA relative to the CPI of the African country (AC): RERAC/$ = NERAC/$ × (CPIUSA ⁄CPIAC ). We use the resulting real exchange rates to construct the “Afro” indexes as explained in Section 1. The relative change in the value of foreign currency, st, used in parameter estimation, is calculated as st = ln St − ln St−1, where St is the “Afro” index at time t. Exchange rates and CPI data are from IMF’s International Financial Statistics.10 We present descriptive statistics for the Afro index in Panel B of Table 4. The real exchange rate index exhibits significantly high serial correlation only in first lag and has a right skewed distribution.
Conditional PriCing of CurrenCy risk in afriCa's equity Market 13
We also develop a small market size variable (SMV) factor to capture the relatively low equity trading activity in most of Africa. The SMV factor is a construct developed from monthly equity market capitalization series reported in Bloomberg.11 The data are available from September 2003 to December 2013 – a total of 124 observations. The small market size variable (SMV) construct is derived in two steps: we first determine the equity market capitalization of each African country relative to the US equity market capitalization (proxy for the world equity market capitalization): MCAPAC /MCAPUSA, where AC means “African country”. Surrogating the world equity market with the US equity market is consistent with our usage of the US dollar also as a proxy for the world currency. In the second step, we convert the country-specific relative market capitalizations into a weighted average stock market size construct for Africa using number of stocks listed in each of our 10 countries as weights. We obtain the number of listed companies in each African equity market from the World Bank’s World Development Statistics (WDI) up to 2012 and from the respective websites of the Exchanges for 2013. The figures are provided in annual frequencies in WDI. To use them in our empirical analysis, which employs monthly frequencies, we assume that any changes in the number of listed companies in each bourse occur only at year-end. The summary statistics for SMV are shown in Panel C of Table 4.
conditioning variables
Dumas and Solnik (1995) explain that conditioning variables can be proxied by frequently observed financial and economic variables. The general criteria for inclusion of such variables are that they must be predictors of return or leading indicators of business cycle (Drobetz et al, 2002). Importantly, conditioning variables should approximate the information set used by investors in setting prices. In practice, the selection of conditioning variables can be guided by the literature. In addition to worldwide factors (such as the dividend yield on world market portfolio and the Eurodollar deposit rate) assumed to be able to predict equity returns across countries, Harvey (1991) considers the following country-specific instruments: lagged equity market index returns, dividend yields, short-term interest rates, foreign exchange rate changes, and maturity spreads. Buckberg (1995) reports substantial improvements in return prediction following inclusion of lagged local market instruments: lagged local dividend yield and lagged return on the dollar-local currency exchange rate.
In addition, we use three worldwide variables – MSCI world equity portfolio returns, MSCI world equity portfolio dividend yields and three-month Eurodollar deposit rates, and one foreign country variable – the USA term premium.12 Now, except the lagged world market portfolio returns and local inflation, the rest of these variables exhibit unit roots. Therefore, using them in the regression might violate the stationarity requirements for GMM estimation. To deal with this problem, we use the first differences of these variables in our estimation, following Dumas and Solnik (1995). We obtain CPI and African deposit rates data from IMF’s International Financial Statistics; Eurodollar deposit rates and USA term premium from USA Reserve Bank, and world market equity portfolio dividend yield from Bloomberg.
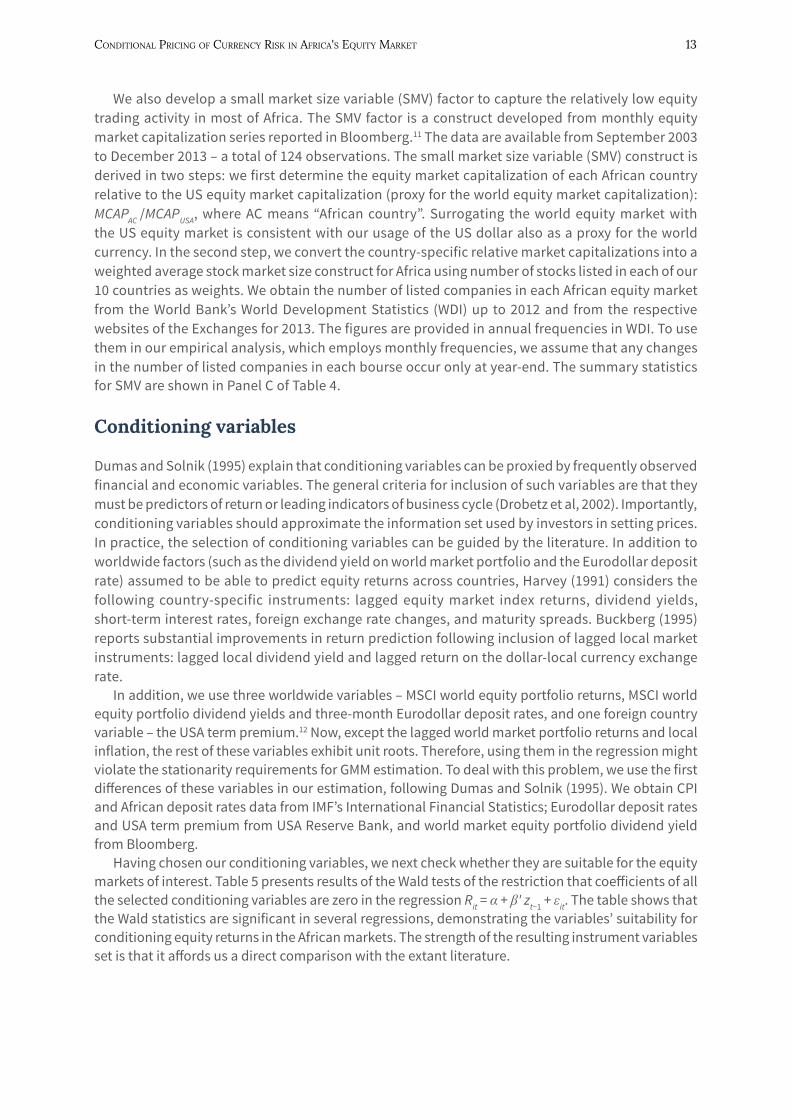
Having chosen our conditioning variables, we next check whether they are suitable for the equity markets of interest. Table 5 presents results of the Wald tests of the restriction that coefficients of all the selected conditioning variables are zero in the regression Rit = α + β' zt−1 + εit. The table shows that the Wald statistics are significant in several regressions, demonstrating the variables’ suitability for conditioning equity returns in the African markets. The strength of the resulting instrument variables set is that it affords us a direct comparison with the extant literature.
14 researCh PaPer 354
table 5. suitability of conditioning variables
Botswana Egypt Ghana Kenya Mauritius Morocco Namibia Nigeria S. Africa Tunisia
Wald 1.74 9.14 1.38 2.94 4.35 0.83 2.32 1.53 1.84 2.40p-value (0.11) (0.00) (0.22) (0.01) (0.00) (0.55) (0.04) (0.17) (0.09) (0.03)
The table reports results for the test of the restriction that coefficients (β) of the regression (Rit = α + β' zt−1 + εit ) of stock market index returns on the set of the conditioning variables are all zero. The conditioning variables are lagged values of world equity index returns (WLR), dividend yield on the world equity portfolio (WDY), three-month Eurodollar deposit rates (UDR), United States term premium (UTP), local deposit rates (ADR), and local inflation (INF). Save for WLR and INF, which are stationary, all conditioning variables are first differenced. Data are for the period 1999:1 through 2013:12.Source: Constructed by authors.
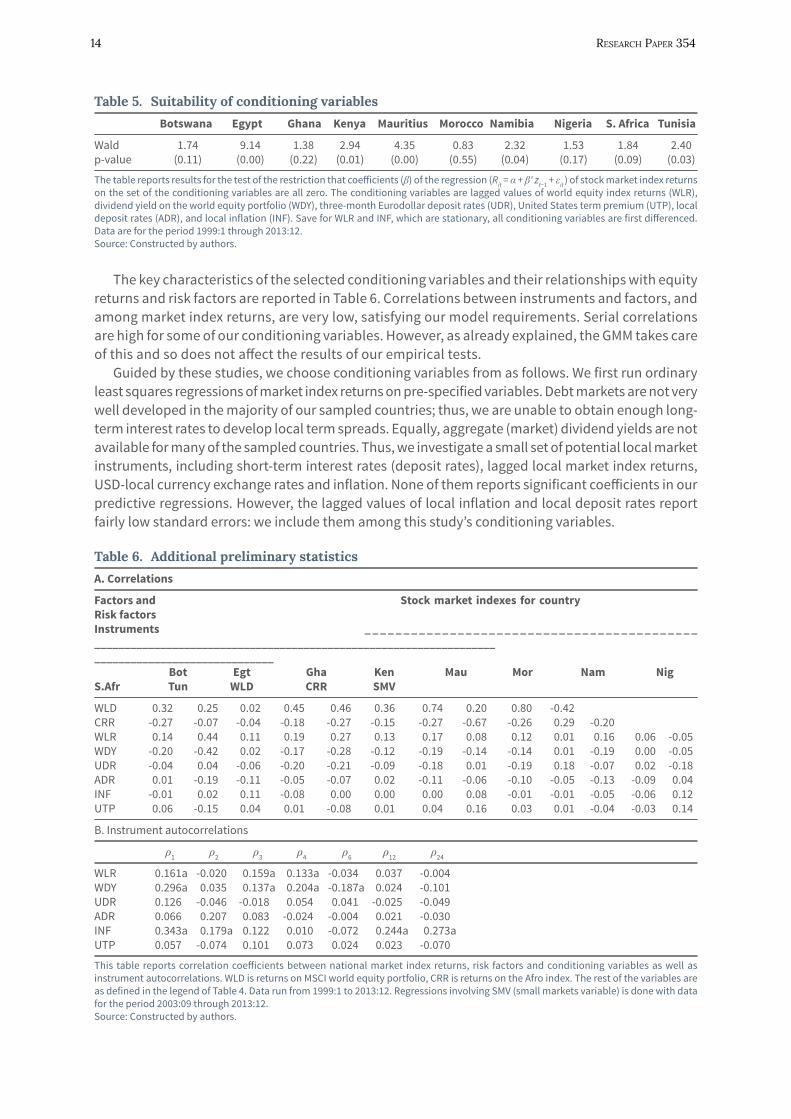
The key characteristics of the selected conditioning variables and their relationships with equity returns and risk factors are reported in Table 6. Correlations between instruments and factors, and among market index returns, are very low, satisfying our model requirements. Serial correlations are high for some of our conditioning variables. However, as already explained, the GMM takes care of this and so does not affect the results of our empirical tests.
Guided by these studies, we choose conditioning variables from as follows. We first run ordinary least squares regressions of market index returns on pre-specified variables. Debt markets are not very well developed in the majority of our sampled countries; thus, we are unable to obtain enough long-term interest rates to develop local term spreads. Equally, aggregate (market) dividend yields are not available for many of the sampled countries. Thus, we investigate a small set of potential local market instruments, including short-term interest rates (deposit rates), lagged local market index returns, USD-local currency exchange rates and inflation. None of them reports significant coefficients in our predictive regressions. However, the lagged values of local inflation and local deposit rates report fairly low standard errors: we include them among this study’s conditioning variables.
table 6. Additional preliminary statistics
A. Correlations
Factors and Stock market indexes for country Risk factors Instruments _ _ _ _ _ _ _ _ _ _ _ _ _ _ _ _ _ _ _ _ _ _ _ _ _ _ _ _ _ _ _ _ _ _ _ _ _ _ _ _ _ _ ____________________________________________________________________ ______________________________ Bot Egt Gha Ken Mau Mor Nam Nig S.Afr Tun WLD CRR SMV
WLD 0.32 0.25 0.02 0.45 0.46 0.36 0.74 0.20 0.80 -0.42 CRR -0.27 -0.07 -0.04 -0.18 -0.27 -0.15 -0.27 -0.67 -0.26 0.29 -0.20 WLR 0.14 0.44 0.11 0.19 0.27 0.13 0.17 0.08 0.12 0.01 0.16 0.06 -0.05WDY -0.20 -0.42 0.02 -0.17 -0.28 -0.12 -0.19 -0.14 -0.14 0.01 -0.19 0.00 -0.05UDR -0.04 0.04 -0.06 -0.20 -0.21 -0.09 -0.18 0.01 -0.19 0.18 -0.07 0.02 -0.18ADR 0.01 -0.19 -0.11 -0.05 -0.07 0.02 -0.11 -0.06 -0.10 -0.05 -0.13 -0.09 0.04INF -0.01 0.02 0.11 -0.08 0.00 0.00 0.00 0.08 -0.01 -0.01 -0.05 -0.06 0.12UTP 0.06 -0.15 0.04 0.01 -0.08 0.01 0.04 0.16 0.03 0.01 -0.04 -0.03 0.14
B. Instrument autocorrelations
ρ1 ρ2 ρ3 ρ4 ρ6 ρ12 ρ24
WLR 0.161a -0.020 0.159a 0.133a -0.034 0.037 -0.004WDY 0.296a 0.035 0.137a 0.204a -0.187a 0.024 -0.101 UDR 0.126 -0.046 -0.018 0.054 0.041 -0.025 -0.049 ADR 0.066 0.207 0.083 -0.024 -0.004 0.021 -0.030 INF 0.343a 0.179a 0.122 0.010 -0.072 0.244a 0.273a UTP 0.057 -0.074 0.101 0.073 0.024 0.023 -0.070
This table reports correlation coefficients between national market index returns, risk factors and conditioning variables as well as instrument autocorrelations. WLD is returns on MSCI world equity portfolio, CRR is returns on the Afro index. The rest of the variables are as defined in the legend of Table 4. Data run from 1999:1 to 2013:12. Regressions involving SMV (small markets variable) is done with data for the period 2003:09 through 2013:12.Source: Constructed by authors.
Conditional PriCing of CurrenCy risk in afriCa's equity Market 15
4. Empirical results We now present empirical results for the estimates of the SDF models discussed in Section 3. As already explained, each conditioning variable is incorporated separately into the SDF model. Results are presented separately for each of the different specifications. Inferences are based on the J-statistic of Hansen’s (1982) optimal iterated GMM.
Parameter estimates
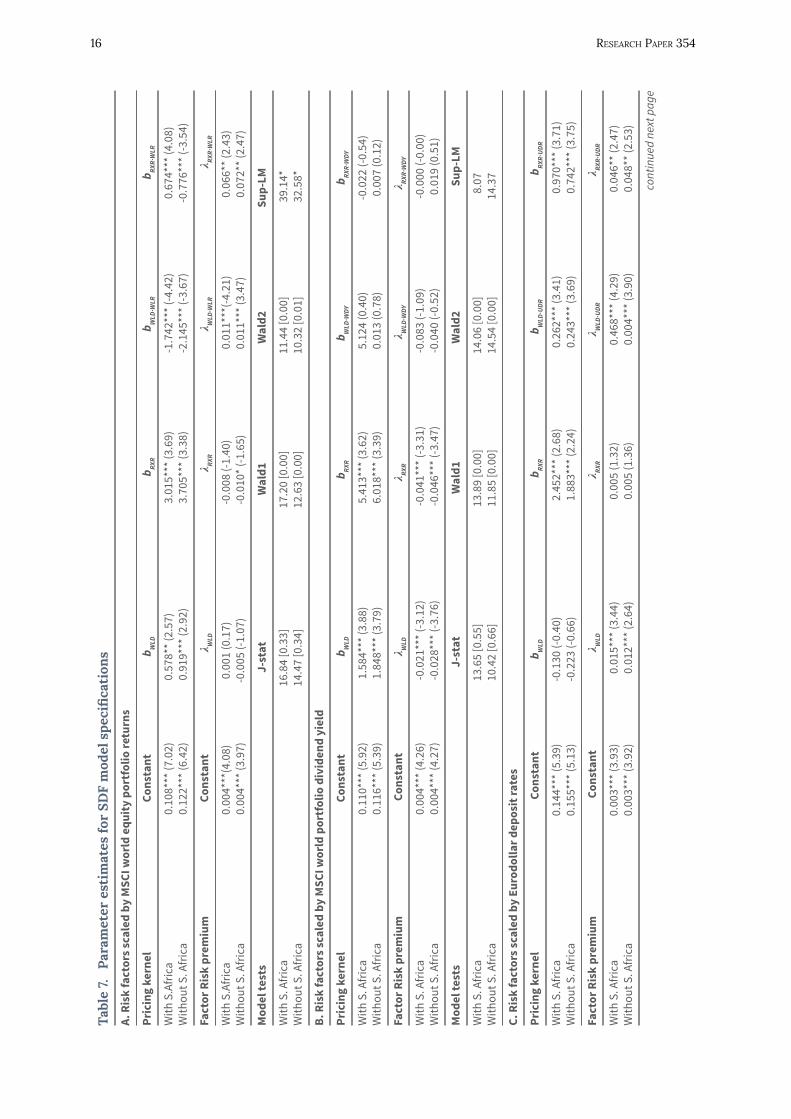
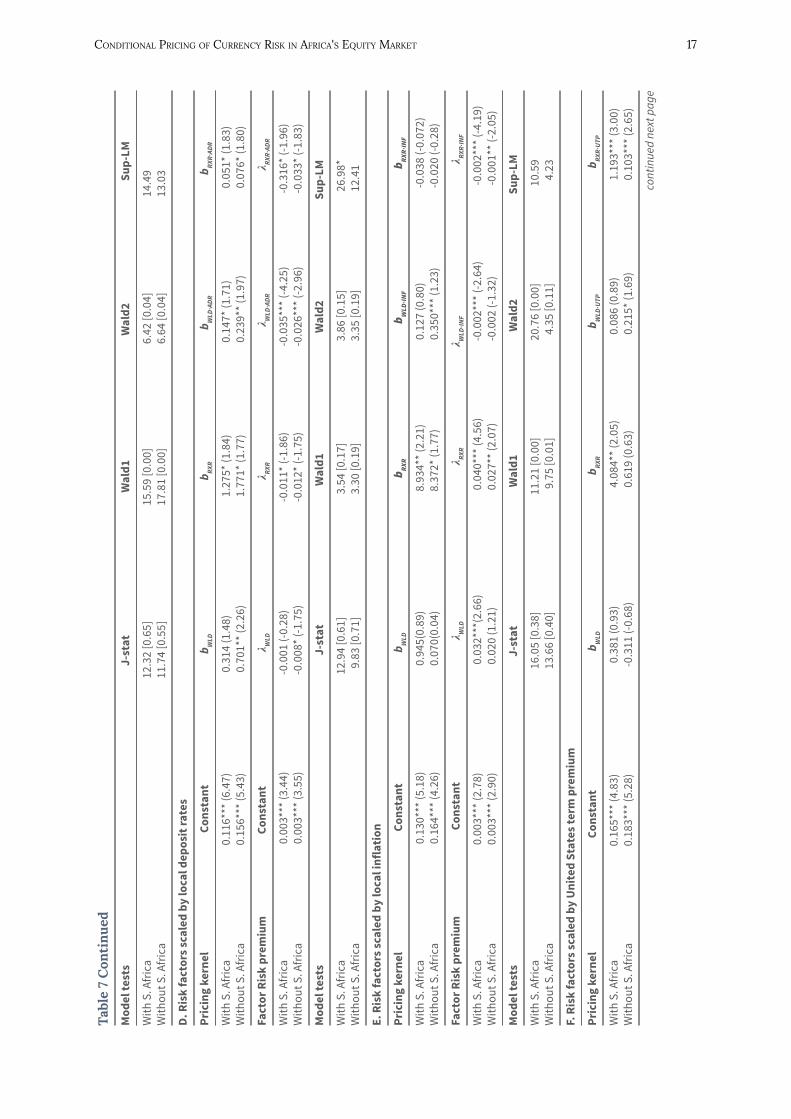
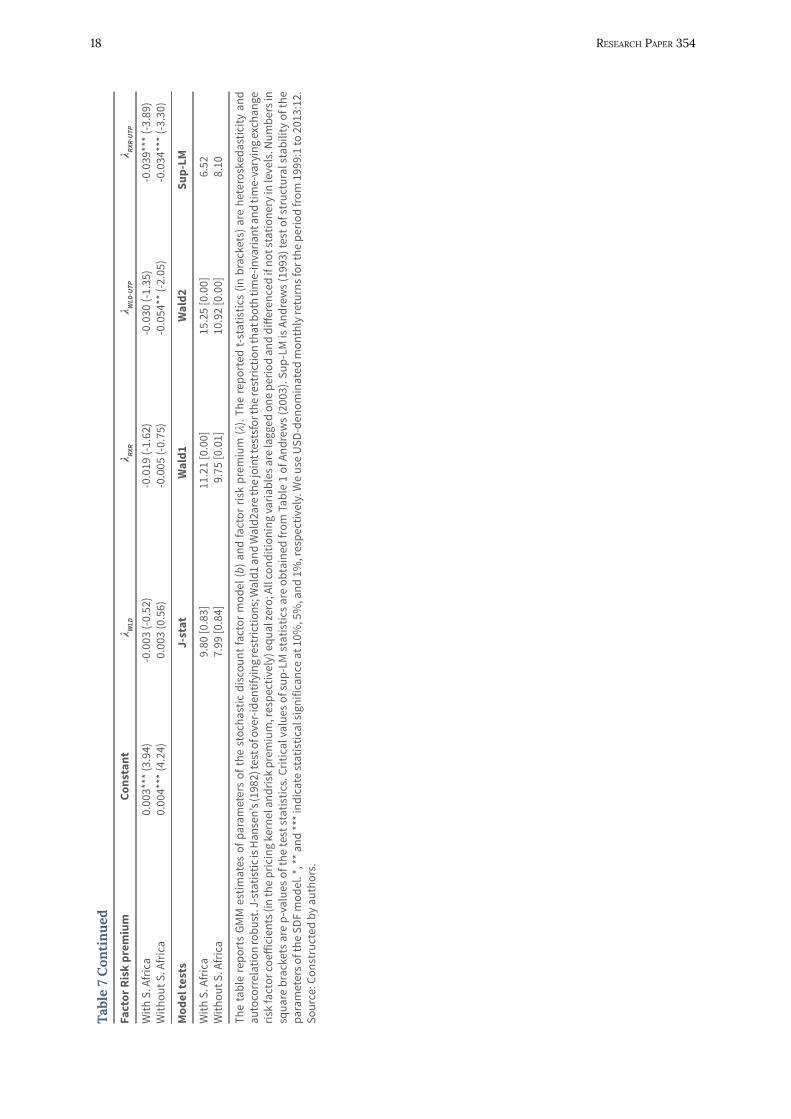
Table 7 contains estimation outputs for parameters of the stochastic discount factor (b) as defined in Equation 10. These parameters provide information on the importance of each factor in the equity pricing kernel. The table also reports estimates of factor risk premium (λ) as presented in Equation 11. These parameters impart information on the relative importance of each factor in influencing expected returns of equity securities in Africa’s capital markets.
We present results of tests including, and tests excluding, South Africa. The results show that the real exchange risk factor significantly enters the pricing kernel in the equity markets either in the time-varying form or in the time-invariant form under all specifications. Lettau and Ludvigson (2001) explain that scaling risk factors does not impose the requirement that the betas for the scaled and unscaled risk factor be individually significant; only that they be jointly significant. In this respect, a risk factor’s coefficient is the (weighted) average of the “scaled” and “unscaled” coefficients. We use the reported t-statistics as the weighting basis. Therefore, the SDF parameter for the foreign exchange risk factor, in panel A, is the weighted average of 3.015 and 0.674, which is 1.786 (this is the nominal pricing kernel coefficient of the foreign exchange risk factor). For all specifications, excepting panel D, our tests for the restriction that the two foreign exchange risk coefficients in the pricing kernel are jointly zero (Wald1) reject the null. Exclusion of South Africa’s equity markets does not, qualitatively, change our results. The pricing kernel is viewed as a single variable that summarizes all of the information about the state of the economy that is relevant for pricing financial assets. Thus, our findings suggest that international investors in Africa’s equities regard the real exchange rate as providing important information about the state of the economy and hence the performance of financial claims.
Even more interesting are factor risk premium estimates. The zero-beta asset return is around 0.3% to 0.4% per month. Lettau and Ludvigson (2001) argue that, the zero-beta rate should lie between borrowing rates and lending rates in the economy, in this case the USA, because we have used US dollar-denominated returns in our tests.
15
16 researCh PaPer 354
Tabl
e 7.
Para
met
er e
stim
ates
for
SDF
mod
el s
peci
fica
tion
s
A. R
isk
fact
ors s
cale
d by
MSC
I wor
ld e
quity
por
tfol
io re
turn
s
Pric
ing
kern
el
Cons
tant
b W
LD
b RXR
b WLD
∙WLR
b RX
R∙W
LR
With
S.A
fric
a 0.
108*
** (7
.02)
0.
578*
* (2.
57)
3.01
5***
(3.6
9)
-1.7
42**
* (-4
.42)
0.
674*
** (4
.08)
With
out S
. Afr
ica
0.12
2***
(6.4
2)
0.91
9***
(2.9
2)
3.70
5***
(3.3
8)
-2.1
45**
* (-3
.67)
-0
.776
*** (
-3.5
4)
Fact
or R
isk
prem
ium
Co
nsta
nt
λ WLD
λ RX
R λ W
LD∙W
LR
λ RXR∙
WLR
With
S.A
fric
a 0.
004*
**(4
.08)
0.
001
(0.1
7)
-0.0
08 (-
1.40
) 0.
011*
**(-4
.21)
0.
066*
* (2.
43)
With
out S
. Afr
ica
0.00
4***
(3.9
7)
-0.0
05 (-
1.07
) -0
.010
* (-1
.65)
0.
011*
** (3
.47)
0.
072*
* (2.
47)
Mod
el te
sts
J-
stat
W
ald1
W
ald2
Su
p-LM
With
S. A
fric
a
16.8
4 [0
.33]
17
.20
[0.0
0]
11.4
4 [0
.00]
39
.14*
With
out S
. Afr
ica
14
.47
[0.3
4]
12.6
3 [0
.00]
10
.32
[0.0
1]
32.5
8*
B. R
isk
fact
ors s
cale
d by
MSC
I wor
ld p
ortf
olio
div
iden
d yi
eld
Pric
ing
kern
el
Cons
tant
b W
LD
b RXR
b WLD
∙WDY
b RX
R∙W
DY
With
S. A
fric
a 0.
110*
** (5
.92)
1.
584*
** (3
.88)
5.
413*
** (3
.62)
5.
124
(0.4
0)
-0.0
22 (-
0.54
)W
ithou
t S. A
fric
a 0.
116*
** (5
.39)
1.
848*
** (3
.79)
6.
018*
** (3
.39)
0.
013
(0.7
8)
0.00
7 (0
.12)
Fact
or R
isk
prem
ium
Co
nsta
nt
λ WLD
λ RX
R λ W
LD∙W
DY
λ RXR∙
WDY
With
S. A
fric
a 0.
004*
** (4
.26)
-0
.021
*** (
-3.1
2)
-0.0
41**
* (-3
.31)
-0
.083
(-1.
09)
-0.0
00 (-
0.00
)W
ithou
t S. A
fric
a 0.
004*
** (4
.27)
-0
.028
*** (
-3.7
6)
-0.0
46**
* (-3
.47)
-0
.040
(-0.
52)
0.01
9 (0
.51)
Mod
el te
sts
J-st
at
Wal
d1
Wal
d2
Sup-
LM
With
S. A
fric
a
13.6
5 [0
.55]
13
.89
[0.0
0]
14.0
6 [0
.00]
8.
07W
ithou
t S. A
fric
a
10.4
2 [0
.66]
11
.85
[0.0
0]
14.5
4 [0
.00]
14
.37
C. R
isk
fact
ors s
cale
d by
Eur
odol
lar d
epos
it ra
tes
Pric
ing
kern
el
Cons
tant
b W
LD
b RXR
b WLD
∙UDR
b RX
R∙U
DR
With
S. A
fric
a 0.
144*
** (5
.39)
-0
.130
(-0.
40)
2.45
2***
(2.6
8)
0.26
2***
(3.4
1)
0.97
0***
(3.7
1)W
ithou
t S. A
fric
a 0.
155*
** (5
.13)
-0
.223
(-0.
66)
1.88
3***
(2.2
4)
0.24
3***
(3.6
9)
0.74
2***
(3.7
5)
Fact
or R
isk
prem
ium
Co
nsta
nt
λ WLD
λ RX
R λ W
LD∙U
DR
λ RXR∙
UDR
With
S. A
fric
a 0.
003*
** (3
.93)
0.
015*
** (3
.44)
0.
005
(1.3
2)
0.46
8***
(4.2
9)
0.04
6** (
2.47
)W
ithou
t S. A
fric
a 0.
003*
** (3
.92)
0.
012*
** (2
.64)
0.
005
(1.3
6)
0.00
4***
(3.9
0)
0.04
8** (
2.53
)
cont
inue
d ne
xt p
age
Conditional PriCing of CurrenCy risk in afriCa's equity Market 17
tabl
e 7
con
tinu
ed
Mod
el te
sts
J-st
at
Wal
d1
Wal
d2
Sup-
LM
With
S. A
fric
a
12.3
2 [0
.65]
15
.59
[0.0
0]
6.42
[0.0
4]
14.4
9W
ithou
t S. A
fric
a
11.7
4 [0
.55]
17
.81
[0.0
0]
6.64
[0.0
4]
13.0
3
D. R
isk
fact
ors s
cale
d by
loca
l dep
osit
rate
s
Pric
ing
kern
el
Cons
tant
b W
LD
b RXR
b WLD
∙ADR
b RX
R∙AD
R
With
S. A
fric
a 0.
116*
** (6
.47)
0.
314
(1.4
8)
1.27
5* (1
.84)
0.
147*
(1.7
1)
0.05
1* (1
.83)
With
out S
. Afr
ica
0.15
6***
(5.4
3)
0.70
1** (
2.26
) 1.
771*
(1.7
7)
0.23
9** (
1.97
) 0.
076*
(1.8
0)
Fact
or R
isk
prem
ium
Co
nsta
nt
λ WLD
λ RX
R λ W
LD∙A
DR
λ RXR∙
ADR
With
S. A
fric
a 0.
003*
** (3
.44)
-0
.001
(-0.
28)
-0.0
11* (
-1.8
6)
-0.0
35**
* (-4
.25)
-0
.316
* (-1
.96)
With
out S
. Afr
ica
0.00
3***
(3.5
5)
-0.0
08* (
-1.7
5)
-0.0
12* (
-1.7
5)
-0.0
26**
* (-2
.96)
-0
.033
* (-1
.83)
Mod
el te
sts
J-
stat
W
ald1
W
ald2
Su
p-LM
With
S. A
fric
a
12.9
4 [0
.61]
3.
54 [0
.17]
3.
86 [0
.15]
26
.98*
With
out S
. Afr
ica
9.
83 [0
.71]
3.
30 [0
.19]
3.
35 [0
.19]
12
.41
E. R
isk
fact
ors s
cale
d by
loca
l inf
latio
n
Pric
ing
kern
el
Cons
tant
b W
LD
b RXR
b W
LD∙INF
b RXR∙INF
With
S. A
fric
a 0.
130*
** (5
.18)
0.
945(
0.89
) 8.
934*
* (2.
21)
0.12
7 (0
.80)
-0
.038
(-0.
072)
With
out S
. Afr
ica
0.16
4***
(4.2
6)
0.07
0(0.
04)
8.37
2* (1
.77)
0.
350*
** (1
.23)
-0
.020
(-0.
28)
Fact
or R
isk
prem
ium
Co
nsta
nt
λ WLD
λ RX
R λ W
LD∙IN
F λ RX
R∙IN
F
With
S. A
fric
a 0.
003*
** (2
.78)
0.
032*
**(2
.66)
0.
040*
** (4
.56)
-0
.002
*** (
-2.6
4)
-0.0
02**
* (-4
.19)
With
out S
. Afr
ica
0.00
3***
(2.9
0)
0.02
0 (1
.21)
0.
027*
* (2.
07)
-0.0
02 (-
1.32
) -0
.001
** (-
2.05
)
Mod
el te
sts
J-
stat
W
ald1
W
ald2
Su
p-LM
With
S. A
fric
a
16.0
5 [0
.38]
11
.21
[0.0
0]
20.7
6 [0
.00]
10
.59
With
out S
. Afr
ica
13
.66
[0.4
0]
9.75
[0.0
1]
4.35
[0.1
1]
4.23
F. R
isk
fact
ors s
cale
d by
Uni
ted
Stat
es te
rm p
rem
ium
Pric
ing
kern
el
Cons
tant
b W
LD
b RXR
b WLD
∙UTP
b RX
R∙U
TP
With
S. A
fric
a 0.
165*
** (4
.83)
0.
381
(0.9
3)
4.08
4** (
2.05
) 0.
086
(0.8
9)
1.19
3***
(3.0
0)W
ithou
t S. A
fric
a 0.
183*
** (5
.28)
-0
.311
(-0.
68)
0.61
9 (0
.63)
0.
215*
(1.6
9)
0.10
3***
(2.6
5)
cont
inue
d ne
xt p
age
18 researCh PaPer 354
tabl
e 7
con
tinu
ed
Fact
or R
isk
prem
ium
Co
nsta
nt
λ WLD
λ RX
R λ W
LD∙U
TP
λ RXR∙
UTP
With
S. A
fric
a 0.
003*
** (3
.94)
-0
.003
(-0.
52)
-0.0
19 (-
1.62
) -0
.030
(-1.
35)
-0.0
39**
* (-3
.89)
With
out S
. Afr
ica
0.00
4***
(4.2
4)
0.00
3 (0
.56)
-0
.005
(-0.
75)
-0.0
54**
(-2.
05)
-0.0
34**
* (-3
.30)
Mod
el te
sts
J-st
at
Wal
d1
Wal
d2
Sup-
LM
With
S. A
fric
a
9.80
[0.8
3]
11.2
1 [0
.00]
15
.25
[0.0
0]
6.52
With
out S
. Afr
ica
7.
99 [0
.84]
9.
75 [0
.01]
10
.92
[0.0
0]
8.10
The
tabl
e re
port
s GM
M e
stim
ates
of p
aram
eter
s of
the
stoc
hast
ic d
isco
unt f
acto
r mod
el (b
) and
fact
or ri
sk p
rem
ium
(λ).
The
repo
rted
t-st
atis
tics
(in b
rack
ets)
are
het
eros
keda
stic
ity a
nd
auto
corr
elat
ion
robu
st. J
-sta
tistic
is H
anse
n’s (
1982
) tes
t of o
ver-i
dent
ifyin
g re
stric
tions
; Wal
d1 a
nd W
ald2
are t
he jo
int t
ests
for t
he re
stric
tion
that
bot
h tim
e-in
varia
nt a
nd ti
me-
vary
ing
exch
ange
ris
k fa
ctor
coeff
icie
nts (
in th
e pr
icin
g ke
rnel
and
risk
prem
ium
, res
pect
ivel
y) e
qual
zero
; All
cond
ition
ing
varia
bles
are
lagg
ed o
ne p
erio
d an
d di
ffere
nced
if n
ot st
atio
nery
in le
vels
. Num
bers
in
squa
re b
rack
ets a
re p
-val
ues o
f the
test
stat
istic
s. C
ritic
al v
alue
s of s
up-L
M st
atis
tics a
re o
btai
ned
from
Tab
le 1
of A
ndre
ws (
2003
). Su
p-LM
is A
ndre
ws (
1993
) tes
t of s
truc
tura
l sta
bilit
y of
the
para
met
ers o
f the
SDF
mod
el. *
, ** a
nd **
* ind
icat
e st
atis
tical
sign
ifica
nce
at 1
0%, 5
%, a
nd 1
%, r
espe
ctiv
ely.
We
use
USD-
deno
min
ated
mon
thly
retu
rns f
or th
e pe
riod
from
199
9:1
to 2
013:
12.
Sour
ce: C
onst
ruct
ed b
y au
thor
s.
Conditional PriCing of CurrenCy risk in afriCa's equity Market 19
During the study period, the average monthly US lending rate was 0.433% – evidence that our estimated zero-beta rates are close to actual values. This finding satisfies one of the criteria prescribed by Lewellen et al. (2010) that conditional asset pricing models must be evaluated against their ability to estimate risk premium that are close to observed values. Findings for the real exchange risk factor risk premium clearly show that currency risk is priced in Africa’s equity markets with time-varying premium. Only in one of the specifications – the local deposit rates – does the Wald test fail to reject the hypothesis that the two exchange risk factors are jointly zero. Our pricing results contradict the unconditional pricing results in Kodongo and Ojah (2011) for some of these markets.
In three of our specifications, the weighted average foreign exchange (as well as world equity market) factor risk premium are negative. The negative sign of the factor risk premium deserves some attention. Under the ICAPM, tested here, equilibrium in the capital markets implies a positively sloping equity pricing plane with the zero-beta rate as the intercept. The assumption therefore is that priced factors have positive risk premium so that equity risk premium, in general, are positive. Our significant negative risk premium findings appear to violate this assumption, suggesting the possibility that equities are less risky than the zero-beta asset. First, it is important to point out that negative factor risk premium have been found in several empirical asset pricing tests, both unconditional and conditional, many of which also investigated currency risk pricing (Choi and Rajan, 1997; Choi et al, 1998; Lettau and Ludvigson, 2001; Carrieri and Majerbi, 2006; Zhang, 2006; Iqbal et al, 2010; Kodongo and Ojah, 2011). In this regard, the negative factor risk premium is neither novel nor unique to this study.
Second, tests of the positivity restriction in asset pricing models have provided evidence of negative equity risk premium in various markets. For example, Boudoukh and Richardson (1993) find evidence of negative equity risk premium, ex-post and ex-ante, respectively, for the US equity markets. Importantly, Ostdiek (1998) directly assesses the non-negativity restriction in international asset pricing models and finds evidence indicating that the ex-ante world market (proxied by the MSCI dollar-denominated world portfolio, which we have also used here) risk premium can be negative: the results are robust to market proxies that are hedged and unhedged with respect to currency risk. Theoretically, negative equity risk premium can be explained by high Treasury bills rates especially during times in which the term structure is downward-sloping (Boudoukh and Richardson, 1993). In this study, three-month US Treasury bills rates (our zero-beta proxy) were relatively high in the early parts of the period – an average monthly rate of return of 0.45% for the period 1999:1 through 2000:12. If the risk premium parameters are stable over time, the negativity may be observed throughout the study period. On this note, we next discuss results of parameter stability and other model diagnostics.
We use the sup-LM statistic of Andrews (1993) to check whether our parameter estimates were stable over time. Results suggest that parameters are generally stable. Parameter instability is, however, found when returns are scaled by lagged returns on the world market equity portfolio (panel A) and when returns are scaled by local deposit rates (with South Africa included, panel D). In the former case, instability could have been introduced by developments in the world markets (such as the 2008/9 global financial crisis) that adversely affected equity returns in major industrial countries, which form the bulk of the MSCI world market equity portfolio. Hansen’s (1982) J-statistic, the optimal GMM test for over-identifying restrictions, yields p-values greater than 10% for all the specifications – this indicates that the data do not reject the model specifications at usual significance levels.
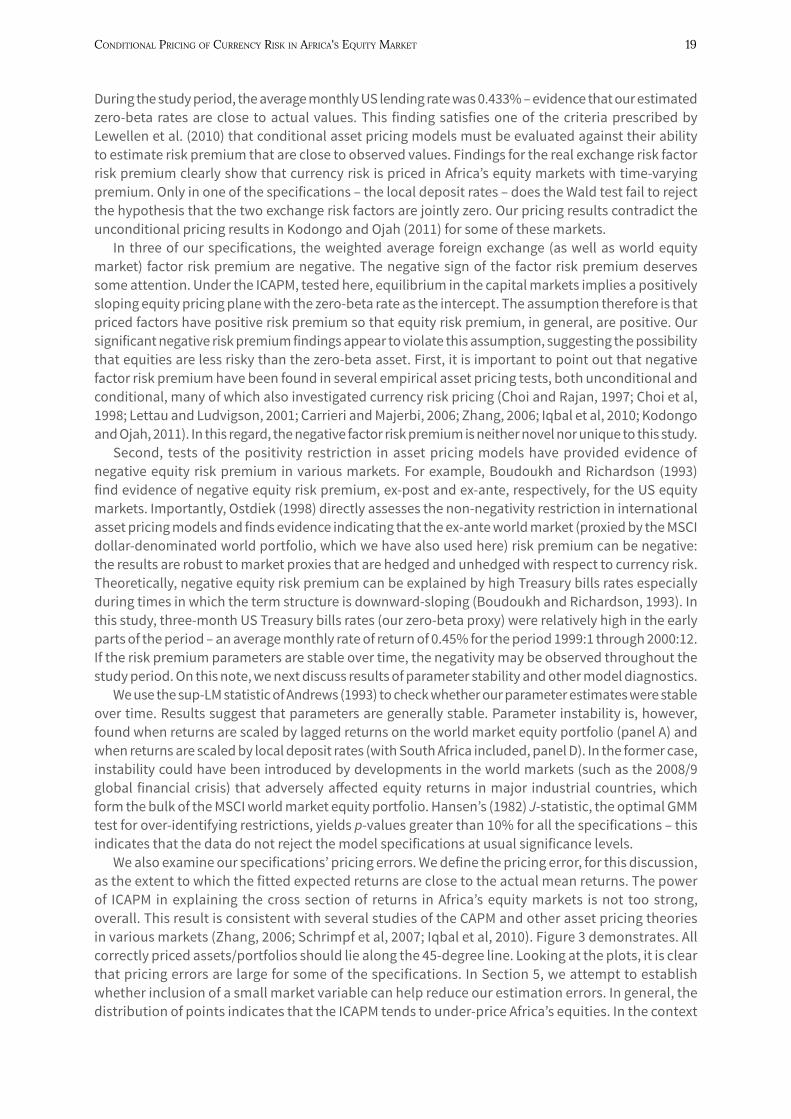
We also examine our specifications’ pricing errors. We define the pricing error, for this discussion, as the extent to which the fitted expected returns are close to the actual mean returns. The power of ICAPM in explaining the cross section of returns in Africa’s equity markets is not too strong, overall. This result is consistent with several studies of the CAPM and other asset pricing theories in various markets (Zhang, 2006; Schrimpf et al, 2007; Iqbal et al, 2010). Figure 3 demonstrates. All correctly priced assets/portfolios should lie along the 45-degree line. Looking at the plots, it is clear that pricing errors are large for some of the specifications. In Section 5, we attempt to establish whether inclusion of a small market variable can help reduce our estimation errors. In general, the distribution of points indicates that the ICAPM tends to under-price Africa’s equities. In the context
20 researCh PaPer 354
of pricing errors, the “best performing” conditioning variable is the local inflation, followed by local deposit rates. In this regard, our results appear to be in sync with others (e.g., Harvey, 1991; Garcia and Gysels, 1998) that have found local instrumental variables to have stronger equity returns predictive ability than international (and foreign) variables. Except for Nigeria (N), the US term premium also does very well, vindicating Harvey (1991), who finds that USA variables can explain equity returns in other countries.
Figure 3. Actual versus fitted returns for the ICAPM
The figure demonstrates the pricing errors for the various conditioning variables. If the ICAPM accurately explains stock returns, all the points in each figure should lie along the 45-degree line. Fitted expected returns for each country are obtained as E(R) = Iλ0 + β' λ
∧ ∧ ∧. The countries
are Botswana (B); Egypt (E); Ghana (G); Kenya (K); Mauritius (M); Morocco (R); Namibia (A); Nigeria (N); South Africa (Z); and Tunisia (T).Source: Constructed by authors.
The dynamic performance of conditional SDF model specifications
Thus far, our discussion has focused on the goodness-of-fit of the SDF model specifications from a cross-sectional perspective. The preceding discussions of pricing errors have also focused largely on risk factor pricing estimates and their associated covariance measure at the neglect of the SDF parameter estimates. In this section, we perform a diagnostic check, proposed by Farnsworth et al. (2002), that focuses on the economic magnitudes of pricing errors for particular assets (countries in this paper) from a time series perspective. The central idea behind the authors’ proposal is that if the model works well, then the SDF’s pricing errors, Mt (b )Rt−1, should not be predictable using any information available at the investors’ disposal at time t, proxied by the set of conditioning variables, Zt. Consistent with Equation 9, we define the estimated pricing kernel, Mt (b ), as:
Mt (b ) = b 0 + b WLD RWLD + b RXR RRXR + b WLD.CON RWLD.CON + b RXR.CON RRXR.CON (12)

Conditional PriCing of CurrenCy risk in afriCa's equity Market 21
where,WLD represents change in the returns on the world market equity portfolio; RXR denotes the change in the Afro real exchange rate; and CON is a conditioning variable, lagged one period; a circumflex denotes the GMM estimate of the coefficient. Farnsworth et al. (2002) argue that the standard deviations of the fitted values of a regression of the model pricing errors, Mt (b )Rt −1, on instrumental variables set, Zt−1, should explain how well a particular model specification accounts for predictable variation in returns. The smaller the sample standard deviation, the better is the model specification’s ability to “explain” return variation. The one strength of this diagnostic check is that standard deviation measure does not place any penalty on model specifications that get the average return wrong.
Table 8. The dynamic performance of the SDF model specifications
Risk factors scaled by Average standard deviation
WLR 1.375 WDY 0.986 UDR 2.979 ADR 0.689 INF 2.045 UTP 1.091
The table reports results of the tests for dynamic model specification performance following Farnsworth et al. (2002). The model pricing errors, Mt+1 (b )Rt+1 −1, for each model specification are regressed against the relevant conditioning variable. The standard deviations of the resulting fitted values are then obtained. The conditioning variables used are the gross returns on the MSCI world equity portfolio (WLR), dividend yields on the MSCI world equity portfolio (WDY); the Eurodollar deposit rates (UDR), local deposit rates (ADR); local inflation rates (INF) and the USA term premium (UTP). All conditioning variables are lagged one period. We use monthly returns, denominated in US dollars, for the period 1999:1 through 2013:12.Source: Constructed by authors.
We perform this test for each of the 10 countries in the sample; results are presented in Table 8. In terms of the average standard deviation, the table shows that the specification with ADR as the conditioning variable appears to perform the best in capturing the time series predictability of gross returns on national equity indexes under the ICAPM. It is worth noting that the specification with the best cross-sectional performance, local inflation (INF), turns out to be one of the “worst performers” from a time-series perspective. The latter observation confirms that the Farnsworth et al. (2002) methodology is not biased by the ability of a model specification to correctly capture average returns. In general, however, the standard deviations are large, consistent with Farnsworth et al. (2002), and thus indicating that conditional asset pricing models struggle to capture time-varying predictability of stock returns.
22 researCh PaPer 354
5. Additional testsmarket-size-augmented icAPm
Skeptics would reason that the ICAPM, developed and, so far, largely tested, with equity markets in industrial countries, might not be suitable to explain stock returns in the relatively small and illiquid stock markets in Africa. Indeed, in comparison to equity markets in more advanced economies, Africa’s equity markets generally exhibit very thin trading and low market capitalization and have very few listed stocks (Allen et al, 2011). We illustrate this with some facts: Data from World Development Indicators show that in 2012, the value of stocks traded as a proportion of GDP for South Africa, the largest equity market in the continent, was only 58.92% compared to, say, 84.04% for the UK and 131.58% for the USA; the average value of stocks traded as a percentage of GDP for the 10 countries in this study in 2012 was only 13.92%. Importantly, the total number of domestic firms listed in all the 10 markets, arguably Africa’s largest, was just 1,118 compared with 2,179 for the UK and 4,102 for the USA in 2012. Given these asymmetrical comparative statistics, one expects that international investors would be concerned about the low trading levels in these markets. That is, relatively low trading activity in Africa’s equity markets can be perceived as a form of market segmentation that can act as a disincentive to international investors. In this respect, international investors would probably build equity market size into their pricing calculus.
Thus, in this section, we try to understand whether small market size is a priced factor in Africa’s equity markets. We achieve this through a market-size -augmented ICAPM. We derive the new pricing kernel by extending Equation 9 into the following seven-factor constant-weights model:
Mt = a0 + b01 f1,t + b02 f2,t + b03 f3,t + b11 ( f1,t zt−1) + b12 ( f2,t zt−1) + b13 ( f3,t zt−1) (13)
We run regressions with the same conditioning variables as before. However, as Equation 13 shows, the new estimations make use of three risk factors: returns on the world equity portfolio, real exchange rate changes and a market size variable. As before, we use the GMM technique to evaluate the sample moment conditions in equations 10 and 11.
The results are reported in Table 9. Due to space considerations, we report only the Wald tests for joint significance. In all specifications, results show that the currency risk factor enters the equity pricing kernel in Africa. Similarly, currency risk factor remains priced even when market size is taken into consideration. That is, currency risk remains an important concern to international investors even if they incorporate Africa’s small markets (and potential relative illiquidity) into their pricing calculus.
Secondly, in three of the six specifications (i.e., when risk factors are scaled by lagged values of MSCI world dividend yield, Eurodollar deposit rates, and local deposit rates), the results show that the small market variable (SMV) enters the pricing kernel; similarly, SMV is priced in four specifications implying that it is an important factor considered by international investors. If we consider SMV as a segmentation variable, our results show, in general, that Africa’s equity markets are only partially integrated with equity markets in the rest of the world. This inference is consistent with that in Kodongo and Ojah (2011).
22

Conditional PriCing of CurrenCy risk in afriCa's equity Market 23
table 9. tests results for market-size-augmented icAPm
Pricing kernel Factor risk premium ___________________________________________________ ___________________________________________________
Risk WLD RXR SMV WLD RXR SMVfactors
Risk factors scaled by J-statistic
WLR 26.01 24.06 2.68 29.71 26.75 5.92 7.83 [0.00] [0.00] [0.26] [0.00] [0.00] [0.05] [0.85]
WDY 29.30 36.09 15.34 40.72 46.45 4.06 9.80 [0.00] [0.00] [0.00] [0.00] [0.00] [0.13] [0.71]
UDR 7.76 13.36 4.47 6.92 17.28 24.90 7.58 [0.02] [0.00] [0.09] [0.03] [0.00] [0.00] [0.87]
ADR 8.82 7.44 15.15 7.84 8.35 17.40 8.12 [0.01] [0.02] [0.00] [0.02] [0.02] [0.00] [0.84]
INF 19.06 20.61 0.97 17.61 25.16 1.18 7.96 [0.00] [0.00] [0.62] [0.00] [0.00] [0.55] [0.85]
UTP 18.20 14.25 3.90 34.69 11.85 17.02 10.03 [0.00] [0.00] [0.14] [0.00] [0.02] [0.00] [0.69]
The table reports the Wald tests results for the restrictions that both scaled and unscaled risk factors are zero in the iterated GMM regressions. The risk factors are, respectively, MSCI world market equity portfolio returns (WLD), returns on real exchange rates (RXR), and the small markets variable (SMV), constructed as the weighted average of equity markets capitalization of African countries relative to the US equity market capitalization. The conditioning (scaling) variables are lagged values of: gross returns on the world market equity portfolio returns (WLR), world market equity portfolio dividend yields (WDY), Eurodollar deposit rates (UDR), local deposit rates (ADR), local inflation (INF) and USA term premium (UTP). Data are for the period 2003:09 through 2013:12.Source: Constructed by authors.
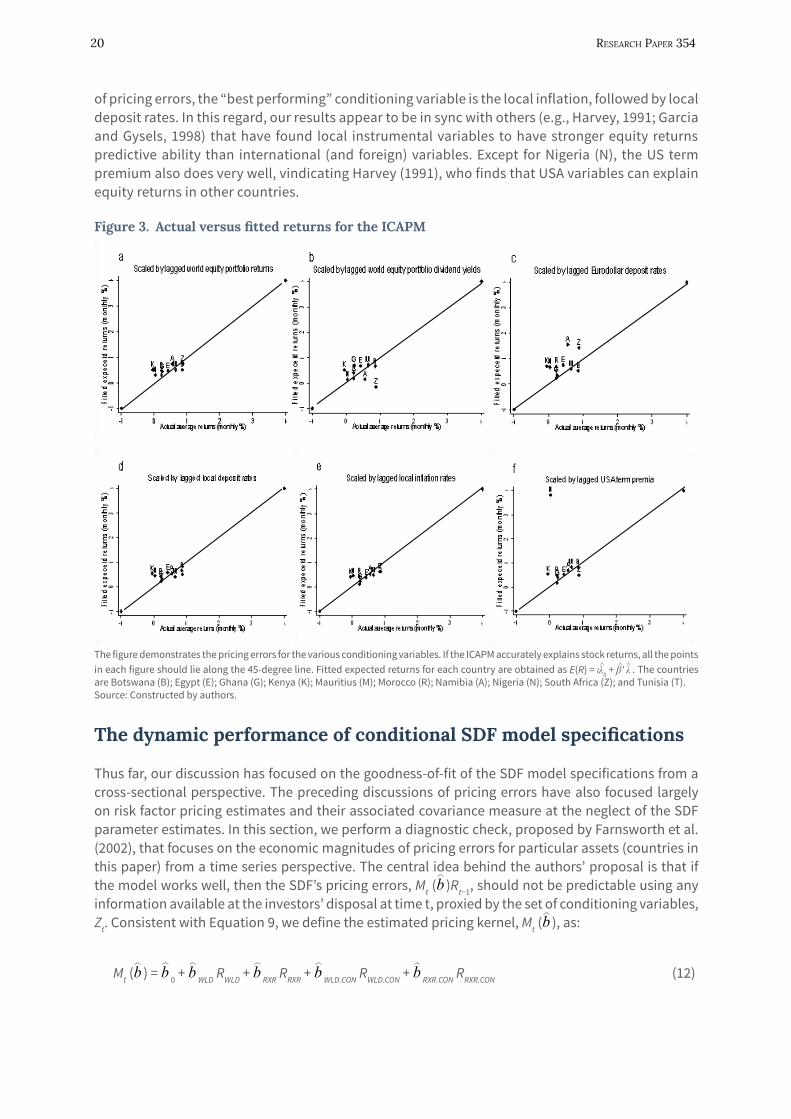
Is the market-size-augmented ICAPM suitable for Africa’s equity markets?
We next try to address the question as to whether the standard two-factor (world market and currency risk factors) ICAPM is suitable as a model for pricing Africa’s equities. The above discussion shows that investors are worried about small equity markets in Africa and actually attach a premium to it when evaluating Africa’s investments. But do we need to make adjustments for size and/or liquidity to work with the ICAPM in Africa’s equity markets? We use average pricing errors in an attempt to address this question. Pricing errors for the size-augmented ICAPM are plotted in Figure 4. The plots show that the model’s average pricing errors are quite large, especially when compared to the average pricing errors of the standard ICAPM, reported in Figure 3. One can easily confirm this by comparing the dispersion of plots around the 45-degree line.
To aid this comparison, we compute the average pricing errors for each model specification. The figures reported in the table are the averages of the differences between the actual mean rate of return and the fitted expected rate of return for each country’s equity market index. Results are presented in Table 10. The results show clearly that the monthly percentage deviations of fitted from actual returns are much smaller for the standard ICAPM than for the size-augmented ICAPM. We conclude that the standard ICAPM is more suitable for modelling Africa’s equity returns. A potential drawback of this inference is that the number of observations of returns used for the two models is different. However, the differences are so conspicuous that we do not anticipate a radical change in results even with a similar number of observations. It is also clear from Table 10 that both the standard ICAPM and the augmented ICAPM have the tendency to under-price equities in Africa.
24 researCh PaPer 354
figure 4. size-augmented icAPm pricing errors
The figure demonstrates the pricing errors for the various conditioning variables. If the size-augmented ICAPM accurately explains stock returns, all the points in each figure should lie along the 45-degree line. Fitted expected returns for each country are obtained as E(R) = Iλ0 + β' λ
∧ ∧ ∧. The countries are Botswana (B); Egypt (E) Ghana (G); Kenya (K); Mauritius (M); Morocco (R); Namibia (A); Nigeria (N); South
Africa (Z); and Tunisia (T).Source: Constructed by authors.
table 10. Average pricing errors
Conditioning variable WLR WDY UDR ADR INF UTPs
Standard ICAPM 0.095 0.001 0.347 0.066 0.020 0.477Size-augmented ICAPM 0.631 -0.257 0.511 0.245 0.214 0.208
The table reports average pricing errors (monthly percentage) for each of the SDF model specifications under the standard ICAPM and the size-augmented ICAPM. Pricing errors for each country are computed as the difference between the actual average returns and fitted expected returns, E(R) = Iλ0 + β' λ
∧ ∧ ∧. These are then averaged across countries. The conditioning variables are lagged values of: returns on the
MSCI world equity portfolio (WLR); MSCI world equity portfolio dividend yields (WDY); three-month Eurodollar deposit rates (UDR), local deposit rates (ADR); local inflation rates (INF) and United States term premium (UTP). Data are for the period 2009:1 through 2013:12 for the standard ICAPM and from 2003:9 to 2013:12 for the augmented ICAPM.Source: Constructed by authors.
the unconditional icAPm
Does the conditional asset specification perform better than the unconditional ICAPM? We start by noting that Kodongo and Ojah (2011) did not find currency risk priced in seven of the 10 equity markets we have studied in this paper. Their work used the GMM technique to estimate a multifactor asset pricing model in the Seemingly Unrelated Regression (SUR) framework.
In this paper, we use the SDF approach, not only to test the robustness of their result, but also to check whether the conditional specifications that we have employed in this paper provide ‘superior’ asset pricing results to those that can be obtained in the unconditional setting. Results for the unconditional specification are presented in Table 11. The results show that, (i) neither the currency
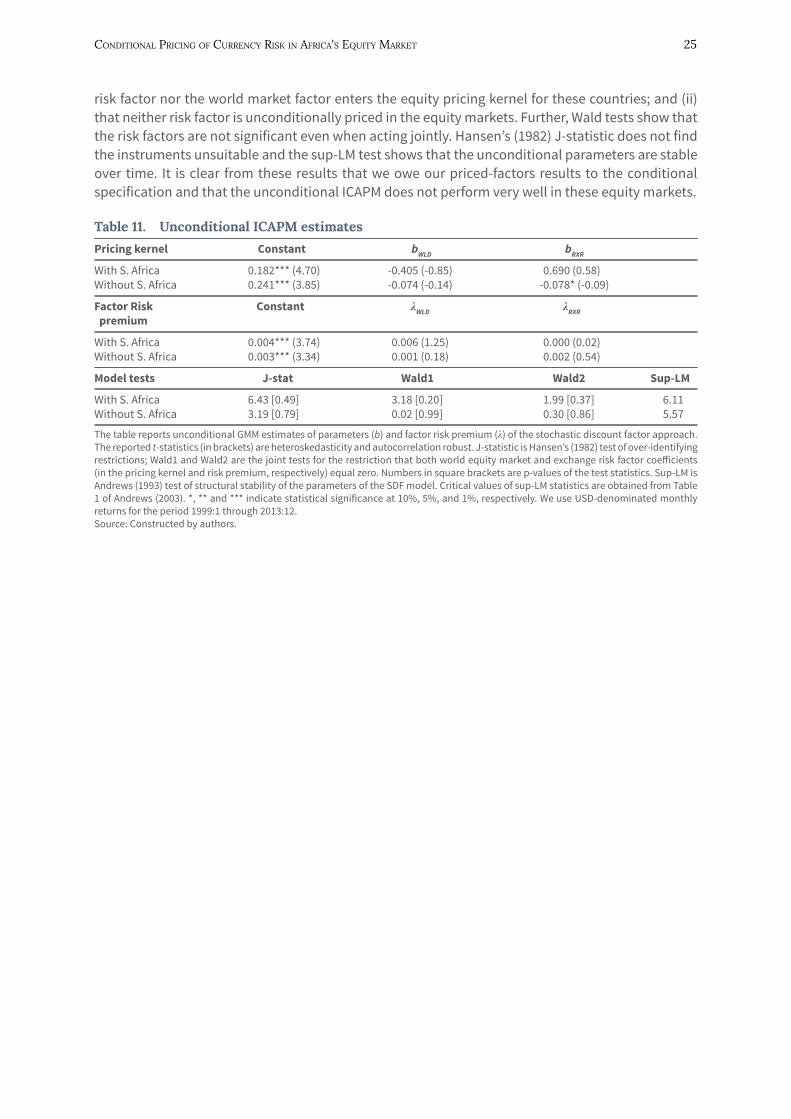
Conditional PriCing of CurrenCy risk in afriCa's equity Market 25
risk factor nor the world market factor enters the equity pricing kernel for these countries; and (ii) that neither risk factor is unconditionally priced in the equity markets. Further, Wald tests show that the risk factors are not significant even when acting jointly. Hansen’s (1982) J-statistic does not find the instruments unsuitable and the sup-LM test shows that the unconditional parameters are stable over time. It is clear from these results that we owe our priced-factors results to the conditional specification and that the unconditional ICAPM does not perform very well in these equity markets.
table 11. unconditional icAPm estimates
Pricing kernel Constant bWLD bRXR
With S. Africa 0.182*** (4.70) -0.405 (-0.85) 0.690 (0.58) Without S. Africa 0.241*** (3.85) -0.074 (-0.14) -0.078* (-0.09)
Factor Risk Constant λWLD λRXR premium
With S. Africa 0.004*** (3.74) 0.006 (1.25) 0.000 (0.02) Without S. Africa 0.003*** (3.34) 0.001 (0.18) 0.002 (0.54)
Model tests J-stat Wald1 Wald2 Sup-LM
With S. Africa 6.43 [0.49] 3.18 [0.20] 1.99 [0.37] 6.11Without S. Africa 3.19 [0.79] 0.02 [0.99] 0.30 [0.86] 5.57
The table reports unconditional GMM estimates of parameters (b) and factor risk premium (λ) of the stochastic discount factor approach. The reported t-statistics (in brackets) are heteroskedasticity and autocorrelation robust. J-statistic is Hansen’s (1982) test of over-identifying restrictions; Wald1 and Wald2 are the joint tests for the restriction that both world equity market and exchange risk factor coefficients (in the pricing kernel and risk premium, respectively) equal zero. Numbers in square brackets are p-values of the test statistics. Sup-LM is Andrews (1993) test of structural stability of the parameters of the SDF model. Critical values of sup-LM statistics are obtained from Table 1 of Andrews (2003). *, ** and *** indicate statistical significance at 10%, 5%, and 1%, respectively. We use USD-denominated monthly returns for the period 1999:1 through 2013:12.Source: Constructed by authors.
26 researCh PaPer 354
6. conclusionThis paper sought to establish whether Africa’s volatile currencies actually drive equity risk premium in the corresponding national equity markets. We use the SDF framework to test six conditional asset pricing specifications with the world market equity portfolio and real foreign exchange rate changes as risk factors. The risk factors are scaled by six conditioning variables, informed by past studies: the returns on the MSCI world equity portfolio, MSCI world equity portfolio dividend yields, monthly observations of the three-month Eurodollar deposit rates, local (African) deposit rates, local inflation rates, and the USA term premium. Scaling factors enable us to capture time variation. We find strong evidence suggesting that foreign exchange risk has significant conditional time-varying premium in equity returns and enters the equities’ pricing kernel.
Our findings suggest important implications. First, foreign investors keen to diversify their portfolios in the better performing African equity markets should understand that their returns are exposed to currency risk and would be wise to consider hedging against currency fluctuations. However, it is important to appreciate the pricing of currency risk within the context of the particular currency system in each country. Thus, for fixed peg regimes such as Namibia and Tunisia, international equity investors demand a currency premium to compensate for unexpected currency devaluations and revaluations in the destination market. The premium may also be justified on the grounds that restrictions on exchange rate fluctuations may prevent investors from realizing above average returns from favourable currency movements. For Botswana’s crawling peg regime, patterns of exchange rate movements are still unpredictable as they depend largely on movements in the South African rand and the US dollar, which float freely. However, for international investors whose domestic returns are denominated in the two currencies in the basket, investing in Botswana pula-denominated assets would be less risky and hedging may not be that necessary.
For the remaining countries in the sample, exchange rate regimes are sufficiently flexible such that their movements are largely random. Many of these countries also frequently suffer inadequate foreign currency reserves further exposing their currencies to irregular fluctuations which may be harmful to investors’ unhedged portfolio positions. Similarly, most of the countries, perhaps except South Africa, have very thin currency trading, relative to developed countries, which increase the possibility of relatively high currency volatility. As Bubula and Ötker-Robe (2002) explain, the depth and size of foreign exchange markets may affect exchange rate volatility. These observations point to a compelling need for portfolio hedging against currency fluctuations by international investors.
As a robustness check, we also run a three-factor model with the small equity markets variable (SMV) as an additional factor. We call this model the size-augmented ICAPM. Results suggest that international investors are equally worried about the size of Africa’s equity markets and impound this concern into their pricing calculus. Market size is also so important that it enters the equity pricing kernel. In this regard, our results therefore suggest that Africa’s equity markets are only partially integrated with equity markets in the rest of the world. To encourage a vibrant foreign investor participation and foster integration, therefore, it appears important for African countries to encourage the use of equity markets as a means to raising capital. This would increase the market size, encourage trading, improve liquidity and, therefore, reduce the size premium. Benefits would accrue to Africa’s economies in the form of lower cost of capital.
26

Conditional PriCing of CurrenCy risk in afriCa's equity Market 27
notes1. However, investors will still be concerned about unexpected currency devaluations/revaluations.
2. The resulting series has a correlation of 99.8% with the series constructed following Kodongo and Ojah (2011).
3. The countries whose currencies are included in each index are as follows: AFRO – Botswana, Egypt, Ghana, Kenya, Mauritius, Morocco, Namibia, Nigeria, South Africa, and Tunisia; OITP – Mexico, China, Taiwan, Korea, Singapore, Hong Kong, Malaysia, Brazil, Thailand, Philippines, Indonesia, India, Israel, Saudi Arabia, Russia, Argentina, Venezuela, Chile, and Colombia; MAJOR – Euro Area, Canada, Japan, United Kingdom, Switzerland, Australia, and Sweden; BROAD – all MAJOR and all OITP currencies. Monthly trade data are not available for Botswana and Namibia; we use annual data assuming that trade is evenly spread throughout each year.
4. Time variation in equity risk premium has been attributed to many factors. Jagannathan and Wang (1996) argue that during a recession, financial leverage of troubled firms increases, causing their systematic risk to increase. Brooks et al (1992) also point out that the maturity and growth of firms tend to change the riskiness of the firm over time. Zhang (2006) observes that the sensitivity to changes in macroeconomic conditions by financially constrained firms may cause their betas to vary over time. Therefore, the market risk premium should be higher at economic downturns to compensate for the adverse risk exposure.
5. See Kodongo (2011) for a detailed derivation of these conditions. Empirical tests of asset pricing models often work directly with Equation 3 plus the relevant definition Mt.Mt can be interpreted as a (benchmark) variable containing all systematic information that impact on the risk and hence price of financial assets in an economy.
6. Define the conditional covariance at time t: Covt-1 (Mt,Rit ) = Et−1 (MtRit ) − Et−1 (Mt )Et−1 (Rit). Thus, Equation 3
can be expressed as Et−1 (Rit ) = 1Et−1 (Mt )
− Covt−1 (Rit,Mt )
Et−1 (Mt ) . Multiplying and dividing through by Vart−1 (Mt) yields
Et−1 (Rit ) = 1Et−1 (Mt )
+ Covt−1 (Rit,Mt )
vart−1 (Mt ) − vart−1 (Mt )
Et (Mt ) .
7. The law states that, taking an expected value using less information of an expected value that is formed
on more information, gives the expected value using less information (Cochrane, 2000). For example, E[Et (X)] = E(X).
8. Accessed from http://connectnigeria.com/articles/2013/01/21/foreign-investments-in-the-nigerian-stock-exchange-was-56-at-n733-billion-in-2012/and Nairobi Securities Exchange website.
9. A part of Tunisia stock index data, missing on Bloomberg, is obtained from CEIC global database. Both Bloomberg and CEIC reported indexes are constructed by local exchanges so the data are exactly similar.
10. For Namibia, the CPI data are from http://www.tradingeconomics.com/namibia/consumer-price-index-cpi. A correlation analysis with the available series in IFS yields a coefficient of 98.7%.
27

28 researCh PaPer 354
11. Stock market data for Namibia are not reported in Bloomberg, so we work with only nine countries to develop the market size construct.
12. The USA term premium is the difference between monthly returns on 10-year US Treasury bonds and
monthly returns on three-month US Treasury bills. Inclusion of this variable is motivated by Harvey (1991) who reports that US variables have good ability to predict returns in markets outside the USA because US economic cycles typically coincide with or lead economic cycles of other countries.
Conditional PriCing of CurrenCy risk in afriCa's equity Market 29
referencesAfDB (African Development Bank). 2013. “Promoting structural transformation and better use of natural
resources”. African Economic Outlook, 2013. African Development Bank, Tunis.Alagidede, P., T. Panagiotidis and X. Zhang. 2011. “Why a diversified portfolio should include African assets”.
Applied Economics Letters, 18: 1333–40.Allen, F., I. Otchere and L.W. Senbet. 2011. “African financial systems: A review”. Review of Development Finance,
1: 79−113.Andrews, D.W.K. 1993. “Tests for parameter instability and structural change with unknown change point”.
Econometrica, 61: 821–56.Andrews, D.W.K., 2003. “Tests for parameter instability and structural change with unknown change point: A
corringedum”. Econometrica, 71: 395–97.Antell, J. and M. Vaihekoski. 2012. “Pricing currency risk in the stock market: Evidence from Finland and Sweden
1970–2009”. Journal of International Financial Markets, Institutions and Money, 22: 120−36. Aysun, U. and M. Guldi. 2011. “Exchange rate exposure: A nonparametric approach”. Emerging Markets Review,
12: 321−37.Boudoukh, J. and M. Richardson. 1993. “Is the ex ante risk premium always positive? A new approach to testing
conditional asset pricing models”. Journal of Financial Economics, 34: 387– 408.Brooks, R.D., R.W. Faff and J.H. Lee. 1992. “The form of time variation of systematic risk: Some Australian
evidence”. Applied Financial Economics, 2: 190–98.Buckberg, E. 1995. “Emerging stock markets and international asset pricing”. World Bank Economic Review, 9:
51–74.Bubula, A. and I. Ötker-Robe. 2002. “The evolution of exchange rate regimes since 1990: Evidence from de facto
Policies”. IMF Working Paper No. WP/02/155. International Monetary Fund, Washington, D.C.Cappiello, L. and N. Panigirtzoglou. 2008. “Estimates of foreign exchange risk premia: A pricing kernel approach”.
Empirical Economics, 35: 475–95.Carrieri, F., V. Errunza and B. Majerbi. 2006. “Local risk factors in emerging markets: Are they separately priced?”
Journal of Empirical Finance, 13: 444–61.Carrieri, F. and B. Majerbi. 2006. “The pricing of exchange risk in emerging stock markets”. Journal of International
Business Studies, 37: 372–91.Choi, J.J. and M. Rajan. 1997. “A joint test of market segmentation and exchange risk factor in international
capital markets”. Journal of International Business Studies, 28: 29–49.Choi, J.J., T. Hiraki and N. Takezawa. 1998. “Is foreign exchange risk priced in the international capital markets?”
Journal of Financial and Quantitative Analysis, 33: 361–82. Chowdhury, A. 1993. “Does exchange rate variability depress trade flows? Evidence from error correction models”.
Review of Economics and Statistics, 75: 700 – 706. Cochrane, J.H. 1996. “A cross-sectional test of an investment-based asset pricing model”. Journal of Political
Economy, 104: 572–621.Cochrane, J.H. 2000. “Asset pricing”. At http://www-gsb.uchicago.edu/fac/john.cochrane/research/papersDe Santis, G. and B. Gerard. 1998. “How big is the premium for currency risk?” Journal of Financial Economics,
49: 375–412.Dominguez, K.M.E. and L.L. Tesar. 2001. “A re-examination of exchange rate exposure”. American Economic
Review, 91: 396–99.
29

30 researCh PaPer 354
Doukas, J., H.H. Patricia and L.H.P. Lang. 1999. “The pricing of currency risk in Japan”. Journal of Banking and Finance, 23: 1–20.
Drobetz, W. S. Stürmer and H. Zimmermann. 2002. “Conditional asset pricing in emerging stock markets”. Swiss Journal of Economics and Statistics, 138:107–526.
Dumas, B. and B. Solnik. 1995. “The world price of foreign exchange risk”. Journal of Finance, 50: 445–70. Farnsworth, H., W. Ferson and S. Todd. 2002. “Performance evaluation with stochastic discount factors”. Journal
of Business, 75: 473–503.Ferson, W.E. 1995. “Theory and empirical testing of asset pricing models”. In R.A. Jarrow, V. Maksimovic and
W.T. Ziemba, eds., Handbooks in Operations Research and Management Science, Vol 9. Amsterdam: ElsevierGarcia, R. and E. Ghysels. 1998. “Structural change and asset pricing in emerging markets”. Journal of International
Money and Finance, 15: 455–73.Hall, A. 1993. “Some aspects of generalized method of moments estimation". In G.S. Maddala, C.R. Rao and H.D.
Vinod, eds., Handbook of Statistics, Vol. 11. Amsterdam: Elsevier Science Publishers.Hansen, L.P. 1982. “Large sample properties of the generalized method of moments estimators”. Econometrica,
50: 1029–54. Harvey, C.R. 1991. “The world price of covariance risk”. Journal of Finance, 46: 111–57.Harvey, C.R. 1995. “Predictable risk and return in emerging markets”. Review of Financial Studies, 8: 773−816. Harvey, C.R. and C.M. Kirby. 1995. “Analytical tests of factor pricing models”. Duke University Working Paper.
Durham, NC. Hodrick, R. and X. Zhang. 2001. “Evaluating the specification errors of asset pricing models”. Journal of Financial
Economics, 62: 327–76.IMF (International Monetary Fund). 2008. “De facto classification of exchange rate regimes and monetary policy
frameworks”. At http://www.imf.org/external/np/mfd/er/2008/eng/0408.htmIorio, A.D. and R. Faff. 2002. “The pricing of foreign exchange risk in the Australian equities market”. Pacific-Basin
Finance Journal, 10:77–95.Iqbal, J., R.D. Brooks and D.U.A. Galagedera. 2010. “Testing conditional asset pricing models: An emerging
market perspective”. Journal of International Money and Finance, 29: 897–918.Jagannathan, R. and Z. Wang. 1996. “The conditional CAPM and the cross-section of expected returns”. Journal
of Finance, 51: 3–53.Jorion, P. 1991. “The pricing of exchange rate risk in the stock market”. Journal of Financial and Quantitative
Analysis, 26: 363–76.Kodongo, O. 2011. “Foreign exchange risk and the flow of international portfolio capital: Evidence from Africa’s
capital markets”. PhD Thesis, University of the Witwatersrand. At http://hdl.handle.net/10539/11429Kodongo, O. and K. Ojah. 2011. “Foreign exchange risk pricing and equity markets segmentation in Africa”.
Journal of Banking and Finance, 35: 2295–2310. Kodongo, O. and K. Ojah. 2013. “Foreign exchange rates and stock prices: Evidence from major African markets”.
In M. Bahmani-Oskooee, ed., Exchange Rates in Developed and Emerging Markets: Practices, Challenges and Economic Implications. New York: Nova Scientific Publishers.
Kolari, J.W., T.C. Moorman and S.M. Sorescu. 2008. “Foreign exchange risk and the cross-section of stock returns”. Journal of International Money and Finance, 27: 1074–97.
Lettau, M. and S. Ludvigson. 2001. “Resurrecting the C-CAPM: A cross-sectional test when risk premia are time-varying”. Journal of Political Economy, 109: 1238–87.
Lewellen, J., S. Nagel and J. Shanken. 2010. “A skeptical appraisal of asset pricing tests”. Journal of Financial Economics, 96: 175–94.
Loudon, G.F. 1993. “Foreign exchange exposure and the pricing of currency risk in equity returns: Some Australian evidence”. Pacific-Basin Finance Journal, 1: 335–54.
MacDonald, R. 2000. “Is the foreign exchange market ‘risky’? Some new survey-based results”. Journal of Multinational Financial Management, 10: 1–14.
Ndako, U.B. 2013. “Dynamics of stock prices and exchange rates relationship: Evidence from five sub-Saharan African financial markets”. Journal of African Business, 14: 47–57.
Conditional PriCing of CurrenCy risk in afriCa's equity Market 31
Ogaki, M. 1993. “Generalized method of moments: Econometric applications”. In Maddala et al, eds., Handbook of Statistics, Vol. 11. Amsterdam: North-Holland
Ostdiek, B. 1998. “The world ex-ante risk premium: An empirical investigation”. Journal of International Money and Finance,17: 967–99.
Phylaktis, K. and F. Ravazzolo. 2004. “Currency risk in emerging equity markets”. Emerging Markets Review, 5: 317–39.
Poghosyan, T. 2010. “Determinants of the foreign exchange risk premium in the Gulf Cooperation Council countries”. IMF Working Paper No. WP/10/255. International Monetary Fund, Washington, D.C.
Poghosyan, T. and E. Kočenda. 2008. “Macroeconomic sources of foreign exchange risk in new EU members”. IPC Working Paper Series No. 62. University of Michigan.
Schrimpf, A., M. Schroder and R. Stehle. 2007. “Cross-sectional tests of conditional asset pricing models: Evidence from the German stock market”. European Financial Management, 13: 880–907.
Shanken, J. and Z. Zhou. 2007. “Estimating and testing beta pricing models: Alternative methods and their performance in simulations”. Journal of Financial Economics, 84: 40–86.
Sirr, G., J. Garvey and L. Gallagher. 2011. “Emerging markets and portfolio foreign exchange risk: An empirical investigation using a value-at-risk decomposition technique”. Journal of International Money and Finance, 30: 1749−72.
Sun, C., M. Kim, W. Koo, G. Cho and H. Jin. 2002. “The effect of exchange rate volatility on wheat trade worldwide”. Agribusiness and Applied Economics Report No. 488, Centre for Agricultural Policy and Trade Studies, North Dakota State University.
Tai, Chu-Sheng. 1999. “Time-varying risk premia in foreign exchange and equity markets: Evidence from Asia–Pacific countries”. Journal of Multinational Financial Management, 9:291–316.
Zhang, X. 2006. “Specification tests of international asset pricing models”. Journal of International Money and Finance, 25: 275–307.
32 researCh PaPer 354
Other recent publications in the AERC Research Papers Series:
Determinants of Private Investment Behaviour in Ghana, by Yaw Asante, Research Paper 100.An Analysis of the Implementation and Stability of Nigerian Agricultural Policies, 1970–1993, by P. Kassey
Garba, Research Paper 101.Poverty, Growth and Inequality in Nigeria: A Case Study, by Ben E. Aigbokhan, Research Paper 102.Effect of Export Earnings Fluctuations on Capital Formation, by Godwin Akpokodje, Research Paper 103.Nigeria: Towards an Optimal Macroeconomic Management of Public Capital, by Melvin D. Ayogu,
Research Paper 104.International Stock Market Linkages in South Africa, by K.R. Jefferis, C.C. Okeahalam and T.T. Matome,
Research Paper 105.An Empirical Analysis of Interest Rate Spread in Kenya, by Rose W. Ngugi, Research Paper 106.The Parallel Foreign Exchange Market and Macroeconomic Perfromance in Ethiopia, by Derrese Degefa,
Reseach Paper 107.Market Structure, Liberalization and Performance in the Malawi Banking Industry, by Ephraim W. Chirwa,
Research Paper 108.Liberalization of the Foreign Exchange Market in Kenya and the Short-Term Capital Flows Problem, by
Njuguna S. Ndung’u, Research Paper 109.External Aid Inflows and the Real Exchange Rate in Ghana, by Harry A. Sackey, Research Paper 110.Formal and Informal Intitutions’ Lending Policies and Access to Credit by Small-Scale Enterprises in
Kenya: An Empirical Assessment, by Rosemary Atieno, Research Paper 111.Financial Sector Reform, Macroeconomic Instability and the Order of Economic Liberalization: The
Evidence from Nigeria, by Sylvanus I. Ikhinda and Abayomi A. Alawode, Research Paper 112.The Second Economy and Tax Yield in Malawi, by C. Chipeta, Research Paper 113.Promoting Export Diversification in Cameroon: Toward Which Products? by Lydie T. Bamou, Research
Paper 114.Asset Pricing and Information Efficiency of the Ghana Stock Market, by Kofi A. Osei, Research Paper 115.An Examination of the Sources of Economic Growth in Cameroon, by Aloysius Ajab Amin, Research
Paper 116.Trade Liberalization and Technology Acquisition in the Manufacturing Sector: Evidence from Nigeria, by
Ayonrinde Folasade, Research Paper 117.Total Factor Productivity in Kenya: The Links with Trade Policy, by Joseph Onjala, Research Paper 118.Kenya Airways: A Case Study of Privatization, by Samuel Oyieke, Research Paper 119.Determinants of Agricultural Exports: The Case of Cameroon, by Daniel Gbetnkon and Sunday A. Khan,
Research Paper 120.Macroeconomic Modelling and Economic Policy Making: A Survey of Experiences in Africa, by Charles
Soludo, Research Paper 121.Determinants of Regional Poverty in Uganda, by Francis Okurut, Jonathan Odwee and AsafAdebua,
Research Paper 122.Exchange Rate Policy and the Parallel Market for Foreign Currency in Burundi, by Janvier D. Nkurunziza,
Research Paper 123.Structural Adjustment, Poverty and Economic Growth: An Analysis for Kenya, by Jane Kabubo-Mariara
and Tabitha W. Kiriti, Research Paper 124.Liberalization and Implicit Government Finances in Sierra Leone, by Victor A.B. Davis, Research Paper 125.Productivity, Market Structure and Trade Liberalization in Nigeria, by Adeola F. Adenikinju and Louis
N. Chete, Research Paper 126.Productivity Growth in Nigerian Manufacturing and Its Correlation to Trade Policy Regimes/
Indexes(1962–1985), by Louis N. Chete and Adeola F. Adenikinju, Research Paper 127.Financial Liberalization and Its Implications for the Domestic Financial System: The Case of Uganda, by
Louis A. Kasekende and Michael Atingi-Ego, Research Paper 128.
Conditional PriCing of CurrenCy risk in afriCa's equity Market 33
Public Enterprise Reform in Nigeria: Evidence from the Telecommunications Industry, by Afeikhena Jerome, Research Paper 129.
Food Security and Child Nutrition Status among Urban Poor Householdsin Uganda: Implications for Poverty Alleviation, by Sarah Nakabo-Sswanyana, Research Paper 130.
Tax Reforms and Revenue Mobilization in Kenya, by Moses Kinyanjui Muriithi and Eliud Dismas Moyi, Research Paper 131.
Wage Determination and the Gender Wage Gap in Kenya: Any Evidence of Gender Discrimination?by Jane Kabubo-Mariara, Research Paper 132.
Trade Reform and Efficiency in Cameroon’s Manufacturing Industries, by Ousmanou Njikam, Research Paper 133.
Efficiency of Microenterprises in the Nigerian Economy, by Igbekele A. Ajibefun and Adebiyi G. Daramola, Research Paper 134.
The Impact of Foreign Aid on Public Expenditure: The Case of Kenya, by James Njeru, Research Paper 135.The Effects of Trade Liberalization on Productive Efficiency: Electrical Industry in Cameroon, by Ousmanou
Njikam, Research Paper 136.How Tied Aid Affects the Cost of Aid-Funded Projects in Ghana, by Barfour Osei, Research Paper 137.Exchange Rate Regimes and Inflation in Tanzania, by Longinus Rutasitara, Research Paper 138.Private Returns to Higher Education in Nigeria, by O.B.Okuwa, Research Paper 139.Uganda’ s Equilibrium Real Exchange Rate and Its Implications for Non-Traditional Export Performance,
by Michael Atingi-Ego and Rachel Kaggwa Sebudde, Research Paper 140.Dynamic Inter-Links among the Exchange Rate, Price Level and Terms of Trade in a Managed Floating
Exchange Rate System: The Case of Ghana, by Vijay K. Bhasin, Research Paper 141.Financial Deepening, Economic Growth and Development: Evidence from Selected Sub-Saharan African
Countries, by John E. Udo Ndebbio, Research Paper 142.The Determinants of Inflation in South Africa: An Econometric Analysis, by Oludele A. Akinboade, Franz
K. Siebrits and Elizabeth W. Niedermeier, Research Paper 143.The Cost of Aid Tying to Ghana, by Barfour Osei, Research Paper 144.A Positive and Normative Analysis of Bank Supervision in Nigeria, by A. Soyibo, S.O. Alashi and M.K.
Ahmad, Research Paper 145.The Determinants of the Real Exchange Rate in Zambia, by Kombe O. Mungule, Research Paper 146.An Evaluation of the Viability of a Single Monetary Zone in ECOWAS, by OlawaleOgunkola, Research
Paper 147.Analysis of the Cost of Infrastructure Failures in a Developing Economy: The Case of Electricity Sector in
Nigeria, by Adeola Adenikinju, Research Paper 148.Corporate Governance Mechanisms and Firm Financial Performance in Nigeria, by Ahmadu Sanda,
Aminu S. Mikailu and Tukur Garba, Research Paper 149.Female Labour Force Participation in Ghana: The Effects of Education, by Harry A. Sackey, Research
Paper 150.The Integration of Nigeria's Rural and Urban Foodstuffs Market, by Rosemary Okoh and P.C. Egbon,
Research Paper 151.Determinants of Technical Efficiency Differentials amongst Small- and Medium-Scale Farmers in Uganda:
A Case of Tobacco Growers, by Marios Obwona, Research Paper 152.Land Conservation in Kenya: The Role of Property Rights, by Jane Kabubo-Mariara, Research Paper 153.Technical Efficiency Differentials in Rice Production Technologies in Nigeria, by Olorunfemi Ogundele,
and Victor Okoruwa, Research Paper 154.The Determinants of Health Care Demand in Uganda: The Case Study of Lira District, Northern Uganda,
by Jonathan Odwee, Francis Okurut and Asaf Adebua, Research Paper 155.Incidence and Determinants of Child Labour in Nigeria: Implications for Poverty Alleviation, by Benjamin
C. Okpukpara and Ngozi Odurukwe, Research Paper 156.
34 researCh PaPer 354
Female Participation in the Labour Market: The Case of the Informal Sector in Kenya, by Rosemary Atieno, Research Paper 157.
The Impact of Migrant Remittances on Household Welfare in Ghana, by Peter Quartey, Research Paper 158.
Food Production in Zambia: The Impact of Selected Structural Adjustments Policies, by Muacinga C.H. Simatele, Research Paper 159.
Poverty, Inequality and Welfare Effects of Trade Liberalization in Côte d'Ivoire: A Computable General Equilibrium Model Analysis, by Bédia F. Aka, Research Paper 160.
The Distribution of Expenditure Tax Burden before and after Tax Reform: The Case of Cameroon, by Tabi Atemnkeng Johennes, Atabongawung Joseph Nju and Afeani Azia Theresia, Research Paper 161.
Macroeconomic and Distributional Consequences of Energy Supply Shocks in Nigeria, by Adeola F. Adenikinju and Niyi Falobi, Research Paper 162.
Analysis of Factors Affecting the Technical Efficiency of Arabica Coffee Producers in Cameroon, by Amadou Nchare, Research Paper 163.
Fiscal Policy and Poverty Alleviation: Some Policy Options for Nigeria, by Benneth O. Obi, Research Paper 164.
FDI and Economic Growth: Evidence from Nigeria, by Adeolu B. Ayanwale, Research Paper 165.An Econometric Analysis of Capital Flight from Nigeria: A Portfolio Approach, by Akanni Lawanson,
Research Paper 166.Extent and Determinants of Child Labour in Uganda, by Tom Mwebaze, Research Paper 167.Oil Wealth and Economic Growth in Oil Exporting African Countries, by Olomola Philip Akanni, Research
Paper 168.Implications of Rainfall Shocks for Household Income and Consumption in Uganda, by John Bosco
Asiimwe, Research Paper 169.Relative Price Variability and Inflation: Evidence from the Agricultural Sector in Nigeria, by Obasi O.
Ukoha, Research Paper 170.A Modelling of Ghana's Inflation: 1960–2003, by Mathew Kofi Ocran, Research Paper 171.The Determinants of School and Attainment in Ghana: A Gender Perspective, by Harry A. Sackey, Research
Paper 172.Private Returns to Education in Ghana: Implications for Investments in Schooling and Migration, by Harry
A. Sackey, Research Paper 173.Oil Wealth and Economic Growth in Oil Exporting African Countries, by Olomola Philip Akanni, Research
Paper 174.Private Investment Behaviour and Trade Policy Practice in Nigeria, by Dipo T. Busari and Phillip C.
Omoke, Research Paper 175.Determinants of the Capital Structure of Ghanaian Firms, by Jochua Abor, Research Paper 176.Privatization and Enterprise Performance in Nigeria: Case Study of some Privatized Enterprises, by
Afeikhena Jerome, Research Paper 177.Sources of Technical Efficiency among Smallholder Maize Farmers in Southern Malawi, by Ephraim W.
Chirwa, Research Paper 178.Technical Efficiency of Farmers Growing Rice in Northern Ghana, by Seidu Al-hassan, Research Paper 179.Empirical Analysis of Tariff Line-Level Trade, Tariff Revenue and Welfare Effects of Reciprocity under an
Economic Partnership Agreement with the EU: Evidence from Malawi and Tanzania, by Evious K. Zgovu and Josaphat P. Kweka, Research Paper 180.
Effect of Import Liberalization on Tariff Revenue in Ghana, by William Gabriel Brafu-Insaidoo and Camara Kwasi Obeng, Research Paper 181.
Distribution Impact of Public Spending in Cameroon: The Case of Health Care, by Bernadette Dia Kamgnia, Research Paper 182.
Social Welfare and Demand for Health Care in the Urban Areas of Côte d'Ivoire, by Arsène Kouadio, Vincent Monsan and MamadouGbongue, Research Paper 183.
Conditional PriCing of CurrenCy risk in afriCa's equity Market 35
Modelling the Inflation Process in Nigeria, by Olusanya E. Olubusoye and Rasheed Oyaromade, Research Paper 184.
Determinants of Expected Poverty Among Rural Households in Nigeria, by O.A. Oni and S.A. Yusuf, Research Paper 185.
Exchange Rate Volatility and Non-Traditional Exports Performance: Zambia, 1965–1999, by Anthony Musonda, Research Paper 186.
Macroeconomic Fluctuations in the West African Monetary Union: A Dynamic Structural Factor Model Approach, by Romain Houssa, Research Paper 187.
Price Reactions to Dividend Announcements on the Nigerian Stock Market, by Olatundun Janet Adelegan, Research Paper 188.
Does Corporate Leadership Matter? Evidence from Nigeria, by Olatundun Janet Adelegan, Research Paper 189.
Determinants of Child Labour and Schooling in the Native Cocoa Households of Côte d'Ivoire, by Guy Blaise Nkamleu, Research Paper 190.
Poverty and the Anthropometric Status of Children: A Comparative Analysis of Rural and Urban Household in Togo, by Kodjo Abalo, Research Paper 191.
African Economic and Monetary Union (WAEMU), by Sandrine Kablan, Research Paper 192.Economic Liberalization, Monetary and Money Demand in Rwanda: 1980–2005, by Musoni J. Rutayisire,
Research Paper 193.Determinants of Employment in the Formal and Informal Sectors of the Urban Areas of Kenya, by Wambui
R. Wamuthenya, Research Paper 194.An Empirical Analysis of the Determinants of Food Imports in Congo, by Léonard Nkouka Safoulanitou
and Mathias Marie AdrienNdinga, Research Paper 195.Determinants of a Firm's Level of Exports: Evidence from Manufacturing Firms in Uganda, by Aggrey
Niringiye and Richard Tuyiragize, Research Paper 196. Supply Response, Risk and Institutional Change in Nigerian Agriculture, by Joshua Olusegun Ajetomobi,
Research Paper 197.Multidimensional Spatial Poverty Comparisons in Cameroon, by Aloysius Mom Njong, Research Paper
198.Earnings and Employment Sector Choice in Kenya, by Robert Kivuti Nyaga, Research Paper 199.Convergence and Economic Integration in Africa: the Case of the Franc Zone Countries, by Latif A.G.
Dramani, Research Paper 200.Analysis of Health Care Utilization in Côte d'Ivoire, by Alimatou Cissé, Research Paper 201.Financial Sector Liberalization and Productivity Change in Uganda's Commercial Banking Sector, by
Kenneth Alpha Egesa, Research Paper 202.Competition and Performance in Uganda’s Banking System by Adam Mugume, Research Paper 203Parallel Market Exchange Premiums and Customs Revenue in Nigeria, by Olumide S. Ayodele and Francis
N. Obafemi, Research Paper 204Fiscal Reforms and Income Inequality in Senegal and Burkina Faso: A Comparative Study, by Mbaye
Diene, Research Paper 205.Factors Influencing Technical Efficiencies among Selected Wheat Farmers in UasinGishu District, Kenya,
by James Njeru, Research Paper 206.Exact Configuration of Poverty, Inequality and Polarization Trends in the Distribution of well-being in
Cameroon, by Francis Menjo Baye, Research Paper 207.Child Labour and Poverty Linkages: A Micro Analysis from Rural Malawian Data, by Leviston S. Chiwaula,
Research Paper 208.The Determinants of Private Investment in Benin: A Panel Data Analysis, by Sosthène Ulrich Gnansounou,
Research Paper 209. Contingent Valuation in Community-Based Project Planning: The Case of Lake Bamendjim Fishery Re-
Stocking in Cameroon, by William M. Fonta, Hyacinth E. Ichoku and Emmanuel Nwosu, Research Paper 210.
36 researCh PaPer 354
Multidimensional Poverty in Cameroon: Determinants and Spatial Distribution, by Paul Ningaye, Laurent Ndjanyou and Guy Marcel Saakou, Research Paper 211.
What Drives Private Saving in Nigeria, by Tochukwu E. Nwachukwu and Peter Odigie, Research Paper 212.
Board Independence and Firm Financial Performance: Evidence from Nigeria, by Ahmadu U. Sanda, Tukur Garba and Aminu S. Mikailu, Research Paper 213.
Quality and Demand for Health Care in Rural Uganda: Evidence from 2002/03 Household Survey, by Darlison Kaija and Paul Okiira Okwi, Research Paper 214.
Capital Flight and its Determinants in the Franc Zone, by Ameth Saloum Ndiaye, Research Paper 215.The Efficacy of Foreign Exchange Market Intervention in Malawi, by Kisukyabo Simwaka and Leslie
Mkandawire, Research Paper 216.The Determinants of Child Schooling in Nigeria, by Olanrewaju Olaniyan, Research Paper 217.Influence of the Fiscal System on Income Distribution in Regions and Small Areas: Microsimulated CGE
Model for Côte d'Ivoire, by Bédia F. Aka and Souleymane S. Diallo, Research Paper 218.Asset Price Developments in an Emerging Stock Market: The Case Study of Mauritius by Sunil K. Bundoo,
Research Paper 219.IntrahouseholdResources Allocation in Kenya by Miriam Omolo, Research Paper 220.Volatility of Resources Inflows and Domestic Investment in Cameroon by Sunday A. Khan, Research
Paper 221.Efficiency Wage, Rent-Sharing Theories and Wage Determination in Manufacturing Sector in Nigeria by
Ben E. Aigbokhan, Research Paper 222.Government Wage Review Policy and Public-Private Sector Wage Differential in Nigeria by Alarudeen
Aminu, Research Paper 223.Rural Non-Farm Incomes and Poverty Reduction in Nigeria by Awoyemi Taiwo Timothy, Research Paper
224.After Fifteen Year Use of the Human Development Index (HDI) of the United Nations Development Program
(UNDP): What Shall We Know? by Jean Claude Saha, Research Paper 225.Uncertainty and Investment Behavior in the Democratic Republic of Congo by Xavier Bitemo Ndiwulu
and Jean-Papy Manika Manzongani, Research Paper 226.An Analysis of Stock Market Anomalies and Momentum Strategies on the Stock Exchange of Mauritius
by Sunil K. Bundoo, Research Paper 227.The Effect of Price Stability on Real Sector Performance in Ghana by Peter Quartey, Research Paper 228.The Impact of Property Land Rights on the Production of Paddy Rice in the Tillabéry, Niamey and Dosso
Regions in Niger by Maman Nafiou Malam Maman and Boubacar Soumana, Research Paper 229.An Econometric Analysis of the Monetary Policy Reaction Function in Nigeria by Chukwuma Agu, Research
Paper 230.Investment in Technology and Export Potential of Firms in Southwest Nigeria by John Olatunji Adeoti,
Research Paper 231.Analysis of Technical Efficiency Differentials among Maize Farmers in Nigeria by Luke OyesolaOlarinde,
Research Paper 232.Import Demand in Ghana: Structure, Behaviour and Stability by Simon Kwadzogah Harvey and Kordzo
Sedegah, Research Paper 233.Trade Liberalization Financing and Its Impact on Poverty and Income Distribution in Ghana by Vijay K.
Bhasin, Research Paper 234.An Empirical Evaluation of Trade Potential in Southern African Development Community by Kisukyabo
Simwaka, Research Paper 235.Government Capital Spending and Financing and Its Impact on Private Investment in Kenya: 1964-2006
by Samuel O. Oyieke, Research Paper 236.Determinants of Venture Capital in Africa: Cross Section Evidence by Jonathan Adongo, Research Paper
237.
Conditional PriCing of CurrenCy risk in afriCa's equity Market 37
Social Capital and Household Welfare in Cameroon: A Multidimensional Analysis by Tabi Atemnkeng Johannes, Research Paper 238.
Analysis of the Determinants of Foreign Direct Investment Flows to the West African and Economic Union Countries by Yélé Maweki Batana, Research Paper 239.
Urban Youth Labour Supply and the Employment Policy in Côte d’Ivoire by Clément Kouadio Kouakou, Research Paper 240.
Managerial Characteristics, Corporate Governance and Corporate Performance: The Case of Nigerian Quoted Companies by Adenikinju Olayinka, Research Paper 241.
Effects of Deforestation on Household Time Allocation among Rural Agricultural Activities: Evidence from Western Uganda by Paul Okiira Okwi and Tony Muhumuza, Research Paper 242.
The Determinants of Inflation in Sudan by Kabbashi M. Suliman, Research Paper 243.Monetary Policy Rules: Lessons Learned From ECOWAS Countries by Alain Siri, Research Paper 244.Zimbabwe’s Experience with Trade Liberalization by Makochekanwa Albert, Hurungo T. James and
Kambarami Prosper, Research Paper 245.Determinants in the Composition of Investment in Equipment and Structures in Uganda by Charles
Augustine Abuka, Research Paper 246.Corruption at Household Level in Cameroon: Assessing Major Determinants by Joseph-Pierre Timnou
and Dorine K. Feunou, Research Paper 247. Growth, Income Distribution and Poverty: The Experience of Côte d’Ivoire from 1985 to 2002 by Kouadio
Koffi Eric, Mamadou Gbongue and Ouattara Yaya, Research Paper 248.Does Bank Lending Channel Exist In Kenya? Bank Level Panel Data Analysis by Moses Muse Sichei and
Githinji Njenga, Research Paper 249.Governance and Economic Growth in Cameroon by Fondo Sikod and John NdeTeke, Research Paper 250.Analyzing Multidimensional Poverty in Guinea: A Fuzzy Set Approach by Fatoumata Lamarana Diallo,
Research Paper 251.The Effects of Monetary Policy on Prices in Malawi by Ronald Mangani, Research Paper 252.Total Factor Productivity of Agricultural Commodities in the Economic Community of West African States:
1961-2005 by Joshua Olusegun Ajetomobi, Research Paper 253.Public Spending and Poverty Reduction in Nigeria: A Benefit Incidence Analysis in Education and Health
by Uzochukwu Amakom, Research Paper 254.Supply Response of Rice Producers in Cameroon: Some Implications of Agricultural Trade on Rice Sub-
sector Dynamics by Ernest L. Moluaand Regina L. Ekonde, Research Paper 255.Effects of Trade Liberalization and Exchange Rate Changes on Prices of Carbohydrate Staples in Nigeria
by A. I. Achike, M. Mkpado and C. J. Arene, Research Paper 256.Underpricing of Initial Public Offerings on African Stock Markets: Ghana and Nigeria by Kofi A. Osei,
Charles K.D. Adjasiand Eme U. Fiawoyife, Research Paper 257.Trade Policies and Poverty in Uganda: A Computable General Equilibrium Micro Simulation Analysis by
Milton Ayoki, Research Paper 258.Interest Rate Pass-through and Monetary Policy Regimes in South Africa by Meshach Jesse Aziakpono
and Magdalene Kasyoka Wilson, Research Paper 259.Vertical Integration and Farm gate prices in the Coffee Industry in Côte d’Ivoire by Malan B. Benoit,
Research Paper 260.Patterns and Trends of Spatial Income Inequality and Income Polarization in Cameroon by Aloysius
Mom Njong and Rosy Pascale MeyetTchouapi, Research Paper 261.Private Sector Participation in the Provision of Quality Drinking Water in Urban Areas in Ghana: Are
the People Willing to Pay? By Francis Mensah Asenso-Boadi and Godwin K. Vondolia, Research Paper 262.
Private Sector Incentives and Bank Risk Taking: A Test of Market Discipline Hypothesis in Deposit Money Banks in Nigeria by Ezema Charles Chibundu, Research Paper 263.
38 researCh PaPer 354
A Comparative Analysis of the Determinants of Seeking Prenatal Health Care in Urban and Rural Areas of Togo by Ablamba Johnson, AlimaIssifouand EtsriHomevoh, Research Paper 264.
Predicting the Risk of Bank Deterioration: A Case Study of the Economic and Monetary Community of Central Africa by Barthélemy Kouezo, Mesmin Koulet-Vickot and Benjamin Yamb, Research Paper 265.
Analysis of LabourMarket Participation in Senegal by Abou Kane, Research Paper 266.What Influences Banks’ Lending in Sub-Saharan Africa?by Mohammed Amidu, Research Paper 267.Central Bank Intervention and Exchange Rate Volatility in Zambia by Jonathan Mpundu Chipili,Research
Paper 268.Capital Flight from the Franc Zone: Exploring the Impact on Economic Growth by Ameth Saloum Ndiaye,
Research Paper 269.Dropping Out of School in the Course of the Year in Benin: A Micro-econometric Analysis by Barthelemy
M. Senou, Research Paper 270.Determinants of Private Investment Behaviour in Ugandan Manufacturing Firms by Niringyiye Aggrey,
Research Paper 271.Determinants of Access to Education in Cameroon by Luc Nembot Ndeffo, Tagne Kuelah Jean Réné &
Makoudem Téné Marienne Research Paper 272.Current Account Sustainability in the West African Economic and Monetary Union Countries by Zakarya
Keita, Research Paper 273.An Empirical Assessment of Old Age Support in sub-Saharan Africa: Evidence from Ghana by Wumi
Olayiwola, Olusanjo Oyinyole& S.L. Akinrola, Research Paper 274.Characteristics and Determinants of Child Labour in Cameroon by Laurent Ndjanyou and Sébastien
Djiénouassi, Research Paper 275.Private Sector Investment in Sierra Leone: An Analysis of the Macroeconomic Determinants by Mohamed
Jalloh, Research Paper 276.Technical Efficiency and Productivity of Primary Schools in Uganda by Bruno L. Yawe, Research Paper 277.Comparisons of Urban and Rural Poverty Determinants in Cameroon by Samuel Fambon, Research
Paper 278.Impact of External Debt Accumulation and Capital Flight on Economic Growth of West African Countries,
by Akanni O. Lawanson, Research Paper 279.Female Education and Maternal Health Care Utilization in Uganda by Asumani Guloba & Edward Bbaale,
Research Paper 280.HIV/AIDS Sero-prevalence and Socio-economic Status: Evidence from Uganda by Ibrahim Kasirye,
Research Paper 281.Female Education, Labour Force Participation and Fertility: Evidence from Uganda by Edward Bbaale,
Research Paper 282. Estimating the Informal Cross-border Trade in Central Africa, by Robert Nkendah, Chantal Beatrice
Nzouessin and Njoupouognigni Moussa, Research Paper 283.Health and Economic Growth in Sub-Saharan African Countries by Eric Kehinde Ogunleye, Research
Paper 284.Effects of Collective Marketing by Farmers’ Organizations on Cocoa Farmers’ Price in Cameroon by
Kamden Cyrille Bergaly and Melachio Tameko Andre, Research Paper 285.Modelling Trade Flows between Three Southern and Eastern African Regional Trade Agreements: A Case
Study, by Sannassee R. Vinesh, Seetanah Boopen and TandrayenVerena, Research Paper 286.Analysis of Determinants of Public Hospitals Efficiency in Cameroon by Nguenda Anya Saturnin, Research
Paper 287.Threshold Effects in the Relationship between Inflation and Economic Growth: Evidence from Rwanda
by Musoni J. Rutayisire, Research Paper 288.Food Prices, Tariffs and Household Welfare in Tanzania: Empirical Evidence from Dar es Salaam by
Vincent Leyaro, Research Paper 289.

Conditional PriCing of CurrenCy risk in afriCa's equity Market 39
Households’ Incomes and Poverty Dynamics in Rural Kenya: A Panel Data Analysis, by Milu Muyanga and Phillip Musyoka, Research Paper 287.
The Impact of Economic Partnership Agreements between ECOWAS and the EU on Niger, by Amadou Ousmane, Research Paper 288.
A Re-examination of the Determinants of Child Labour in Côte d’Ivoire, by Edouard PokouAbou, Research Paper 289.
The Inflationary Effects of Fiscal Deficit in Sierra Leone: A Simulation Approach, by Robert Dauda Korsu, Research Paper 290.
Fiscal Decentralization and Social Services in Nigeria, by Eme A. Dada, Research Paper 291. An Analysis of Married Women’s Empowerment in Sub-Saharan Africa, by Yélé Maweki BATANA and
Pitaloumani GNAKOU ALI, Research Paper 292.Threshold Effects in the Relationship between Inflation and Economic Growth: Evidence from Rwanda,by
Musoni J. Rutayisire, Research Paper 293.Market Power in Nigerian Domestic Cocoa Supply Chain, by Joshua Olusegun Ajetomobi, Research
Paper 294.Bank Consolidation and Bank Risk Taking Behaviour: A Panel Study of Commercial Banks in Nigeria, by
Nwosu Emmanuel and Amadi Francis N, Research Paper 295.Mechanisms of Monetary Policy Transmission in the Countries of the West African Monetary Union: An
Empirical Study, by Yao Dossa TADENYO, Research Paper 296.Analysis of Determinants of Public Hospitals Efficiency in Cameroon, by Nguenda Anya and Saturnin
Bertrand, Research Paper 297. Explaining Pro-poor Growth in Cameroon, by Boniface Ngah Epo and Francis Menjo Baye, Research
Paper 298. Microfinance and Poverty in Cameroon: An Oaxaca-Blinder Decomposition Analysis, by Syrie Galex SOH,
Research Paper 299.Food Prices, Tariffs and Household Welfare in Tanzania: Empirical Evidence from Dar es Salaam, by
Vincent Leyaro, Research Paper 300.Out-of-pocket Payments for Health Care and Impoverishment in Nigeria, by Awoyemi Taiwo Timothy
and Adigun Grace Toyin, Research Paper 301.Extension of the Drinking Water Network in the District of Abidjan, by N’KONGON Y. Jeanne, Research
Paper 302.Analysis of Asymmetries in the Tax-Spending Nexus in Burundi: Evidence from Threshold Modelling, by
Arcade NDORICIMPA, Research Paper 303.The Bank Lending Channel of Monetary Policy Transmission: A Dynamic Bank-Level Panel Date Analysis
on Tanzania, by Wilfred Mbowe, Research Paper 304.The Determinants of Corruption in Cameroon, by Ngoa Tabi & Henri Ondoa, Research Paper 305.Optimal Monetary Policy Rule and Exchange Rate Volatility: A Case of Zambia, by Oswald Kombe
Mungule, Research Paper 306. Courts and Bribery for Infrastructure in East African Manufacturing Firms, by Sheshangai Kaniki and
Tendai Gwatidzo, Research Paper 307. Assessing the Links between Energy and the Macro Economy: A GCE Analysis for Ghana, by Emmanuel
Ekow Asmah, Research Paper 308.Analysis of Food Aid Distribution in Malawi and Ethiopia, by Alabi Reuben Adeolu and Adams Oshobugie
Ojor, Research Paper 309.Indirect Taxation, Income Distribution and Poverty in Cote d’Ivoire, by GBONGUE Mamadou and BEYERA
Isabelle, Research Paper 310.The Potential Impact on Trade of Setting up a Second Monetary Zone in West Africa, by Sékou Falil
DOUMBOUYA and Ousmane BAH, Research Paper 311. Macroeconomic Determinants of Primary Education in the Republic of the Congo: Analysis based on a
Simultaneous Equation Model, by Mathias Marie Adrien Ndinga and Marien Ngouabi, Research Paper 312.
40 researCh PaPer 354
Quality of Institutions and Foreign Direct Investment (FDI) in Sub-Saharan Africa: Dynamic Approach, by Komlan Fiodendji, Research Paper 313.
Corporate Governance and Dividend Payout Policy: Evidence from Selected African Countries, by Joshua Yindenaba Abor & Vera Fiador, Research Paper 314.
Communications Impact of ECOWAS/EU Economic Partnership Agreements on Intra-ECOWAS Trade: An Empirical Analysis of Trade, Revenue and Welfare Effects, by G.O. Onogwu & C.J. Arene, Research Paper 315.
Socioeconomic Determinants of Use of Reproductive Health Services in Ghana, by Patience Aseweh Abor & Gordon Abekah-Nkrumah, Research Paper 316.
Foreign Direct Investment and Growth: Evidence from the Economic Community of West African States, by Patricia A. Adamu & Dickson E. Oriakhi, Research Paper 317.
Are High Value Agri-food Supply Chains Participants Better Insulated from Shocks? Evidence from Senegal, by Sènakpon Fidele Ange Dedehouanou, Research Paper 318.
Multi-Asset Deprivation and Pro-Poor Growth in Cameroon, by Hans TinoAyamena Mpenya, Research Paper 319.

Conditional PriCing of CurrenCy risk in afriCa's equity Market 41
MissionTo strengthen local capacity for conducting independent,
rigorous inquiry into the problems facing the management of economies in sub-Saharan Africa.
The mission rests on two basic premises: that development is more likely to occur where there is sustained sound management of the economy, and that such management is more likely to
happen where there is an active, well-informed group of locally based professional economists to conduct policy-relevant research.
Contact UsAfrican Economic Research Consortium
Consortium pour la Recherche Economique en AfriqueMiddle East Bank Towers,
3rd Floor, Jakaya Kikwete RoadNairobi 00200, Kenya
Tel: +254 (0) 20 273 4150 [email protected]
www.facebook.com/aercafrica
twitter.com/aercafrica
www.instagram.com/aercafrica_official/
www.linkedin.com/school/aercafrica/
Learn More
www.aercafrica.org