condo report q3 2013
DESCRIPTION
HiTRANSCRIPT

Total TorontoMLS
Condo Apartment Sales1,6
Condominium Apartment Market Summary
Third Quarter 2013
Sales Average Price Sales Average Price
Total TREB 5,307 $340,069 4,498 $333,846
Halton Region 136 $339,204 89 $328,105
Peel Region 750 $252,921 710 $252,419
City of Toronto 3,816 $360,533 3,192 $356,677
York Region 469 $343,044 386 $329,314
Durham Region 125 $235,675 112 $228,093
Other Areas 11 $252,991 9 $227,222
2013 2012
TREB Member Inquiries: (416) 443-8152
Media/Public Inquiries:
(416) 443-8158
Condo Sales and Average Price Rebound in Q3 2013 Toronto, October 16, 2013 — Greater Toronto Area REALTORS® reported 5,307 condominium apartment transactions through the TorontoMLS system in the third quarter of 2013. This result was up by 18 per cent in comparison to 4,498 condominium apartment sales reported for the third quarter of 2012. In the City of Toronto, which accounted for 72 per cent of condominium apartment transactions, sales were up by 19.5 per cent.
“The Echo Generation wants to live close to where they work and play. It makes sense that they have turned to condominium apartments as they have moved into home ownership. Many condominium apartments in the GTA are characterized by their proximity to a diversity of employment, transportation and leisure alternatives,” said Toronto Real Estate Board President Dianne Usher.
“A growing number of buyers have restarted their search for a condominium apartment since the summer. Despite the onset of stricter lending guidelines, buyers have found that home ownership remains affordable,” continued Ms. Usher.
The average selling price for condominium apartments in the third quarter of 2013 was $340,069 – up almost two per cent in comparison to the average of $333,846 in the third quarter of 2012.
“We experienced a moderate annual rate of increase in the average condo price. However, while condo sales were up, listings were down in the third quarter. If this trend continues, it could point to increased competition between condo buyers and an uptick in the pace of price growth moving forward,” said Jason Mercer, TREB’s Senior Manager of Market Analysis.
Third Quarter 2013
Real GDP Growthi
Q2 2013 t 1.7%
Toronto Employment Growthi i
September 2013 t 4.2%
Toronto Unemployment Rate
September 2013 t 7.9%
Inflation (Yr./Yr. CPI Growth)i i
August 2013 u 1.1%
Bank of Canada Overnight Ratei i i
September 2013 q 1.0%
Prime Ratei v
September 2013 q 3.0%
Mortgage Rates (Sept. 2013)i v
Chartered Bank Fixed Rates
1 Year q 3.14%
3 Year q 3.95%
5 Year q 5.34%
Sources and Notes:
Economic Indicators
iStatistics Canada, Quarter-over-quarter
growth, annualized
iiStatistics Canada, Year-over-year growth
for the most recently reported month
iiiBank of Canada, Rate from most recent
Bank of Canada announcement
ivBank of Canada, rates for most recently
completed month
5,3074,498
Third Quarter 2013 Third Quarter 2012
$3
40
,06
9
$333,846
Third Quarter 2013 Third Quarter 2012
TorontoMLS Average
Condo Apartment Price1,6
2013 2012 % Chg.
Sales 5,307 4,498 18.0%
New Listings 11,345 11,458 -1.0%
Active Listings i 6,711 6,989 -4.0%
Average Price $340,069 $333,846 1.9%
Average DOM 36 34 3.9%iActive listings refer to last month of quarter.
Year-Over-Year Summary1,6

Condo Market Report, Third Quarter 2013
Industrial Leasing
Page 3
2
Toronto Real Estate Board
ALL TREB AREASTHIRD QUARTER 2013
Sales1 Dollar Volume1 Average Price1 Median Price1 New Listings2 Active Listings3 Avg. SP/LP4 Avg. DOM5
TREB Total 5,307 $1,804,746,325 $340,069 $311,000 11,345 6,711 97% 36- - - - - - - -
Halton Region 136 $46,131,724 $339,204 $296,750 270 182 97% 43
Burlington 44 $12,941,825 $294,132 $269,500 92 64 98% 37
Halton Hills 5 $1,409,500 $281,900 $287,500 9 5 102% 21
Milton 24 $6,778,400 $282,433 $293,200 43 22 97% 43
Oakville 63 $25,001,999 $396,857 $340,000 126 91 97% 50- - - - - - - -
Peel Region 750 $189,690,410 $252,921 $237,250 1,778 1,066 97% 37
Brampton 130 $27,595,308 $212,272 $215,001 265 159 97% 41
Caledon 3 $1,365,000 $455,000 $450,000 6 5 98% 20
Mississauga 617 $160,730,102 $260,503 $245,000 1,507 902 97% 36- - - - - - - -
City of Toronto 3,816 $1,375,794,144 $360,533 $330,000 8,003 4,645 97% 35
- - - - - - - -
York Region 469 $160,887,771 $343,044 $318,000 1,113 718 97% 38
Aurora 13 $5,478,800 $421,446 $357,000 24 32 99% 41
E. Gwillimbury 1 $215,500 $215,500 $215,500 - - 98% 73
Georgina 3 $589,500 $196,500 $207,500 4 3 98% 37
King 3 $1,173,000 $391,000 $395,000 8 18 97% 55
Markham 164 $58,689,026 $357,860 $311,500 431 270 97% 38
Newmarket 11 $2,700,300 $245,482 $252,500 18 9 98% 36
Richmond Hill 118 $36,924,000 $312,915 $300,000 287 172 97% 36
Vaughan 151 $52,865,245 $350,101 $333,000 330 203 97% 37
Whitchurch-Stouffville 5 $2,252,400 $450,480 $415,000 11 11 97% 68- - - - - - - -
Durham Region 125 $29,459,376 $235,675 $218,000 168 82 97% 36
Ajax 16 $3,193,800 $199,613 $196,000 28 14 98% 34
Brock 0 - - - 1 1 - -
Clarington 17 $3,144,000 $184,941 $180,000 23 15 97% 47
Oshawa 23 $4,921,200 $213,965 $177,500 34 18 97% 46
Pickering 37 $9,870,200 $266,762 $251,000 42 17 98% 29
Scugog 0 - - - 1 1 - -
Uxbridge 5 $1,370,400 $274,080 $267,000 2 4 96% 57
Whitby 27 $6,959,776 $257,769 $235,000 37 12 97% 29- - - - - - - -
Dufferin County 5 $1,559,000 $311,800 $366,000 5 6 96% 89
Orangeville 5 $1,559,000 $311,800 $366,000 5 6 96% 89- - - - - - - -
Simcoe County 6 $1,223,900 $203,983 $198,450 8 11 98% 67
Adjala-Tosorontio 0 - - - - - - -
Bradford West Gwillimbury 2 $460,000 $230,000 $230,000 1 - 98% 25
Essa 0 - - - - - - -
Innisfil 0 - - - - - - -
New Tecumseth 4 $763,900 $190,975 $177,450 7 11 98% 88
! TURN PAGE FOR CITY OF TORONTO
TABLES OR CLICK HERE:
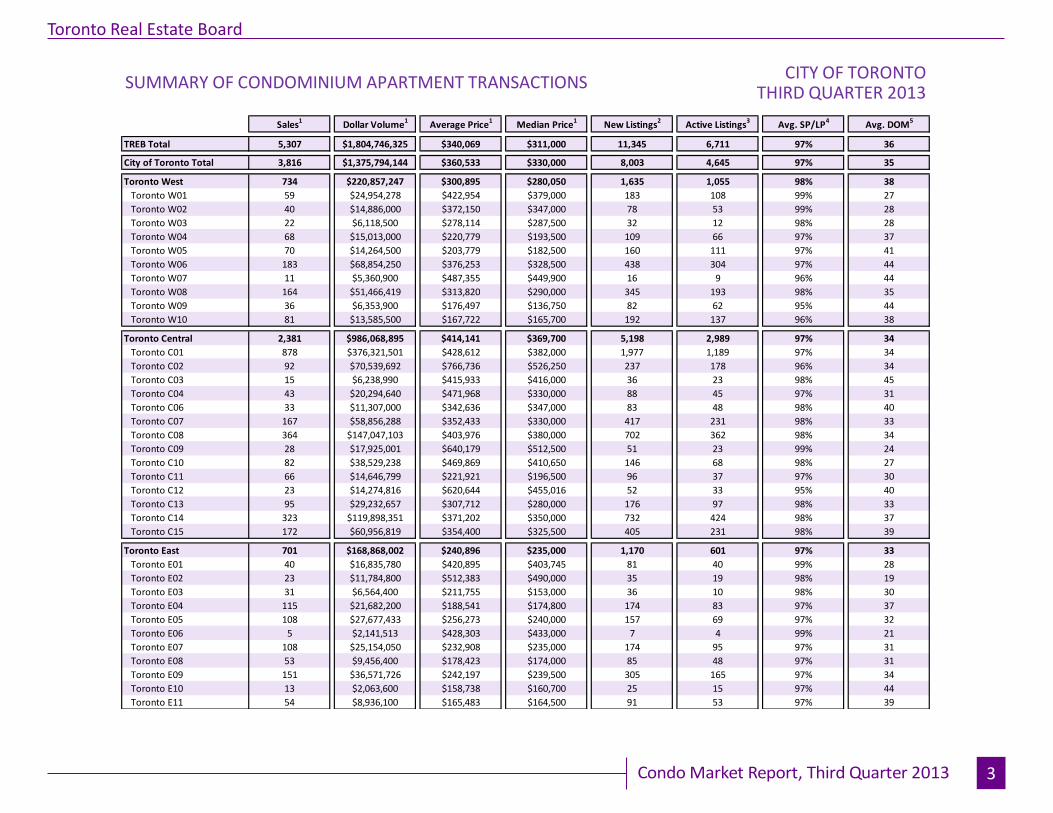
SUMMARY OF CONDOMINIUM APARTMENT TRANSACTIONS
Condo Market Report, Third Quarter 2013
Industrial Leasing
Page 3
3
Toronto Real Estate Board
CITY OF TORONTOTHIRD QUARTER 2013
Sales1
Dollar Volume1
Average Price1
Median Price1
New Listings2
Active Listings3
Avg. SP/LP4
Avg. DOM5
TREB Total 5,307 $1,804,746,325 $340,069 $311,000 11,345 6,711 97% 36
City of Toronto Total 3,816 $1,375,794,144 $360,533 $330,000 8,003 4,645 97% 35
Toronto West 734 $220,857,247 $300,895 $280,050 1,635 1,055 98% 38
Toronto W01 59 $24,954,278 $422,954 $379,000 183 108 99% 27
Toronto W02 40 $14,886,000 $372,150 $347,000 78 53 99% 28
Toronto W03 22 $6,118,500 $278,114 $287,500 32 12 98% 28
Toronto W04 68 $15,013,000 $220,779 $193,500 109 66 97% 37
Toronto W05 70 $14,264,500 $203,779 $182,500 160 111 97% 41
Toronto W06 183 $68,854,250 $376,253 $328,500 438 304 97% 44
Toronto W07 11 $5,360,900 $487,355 $449,900 16 9 96% 44
Toronto W08 164 $51,466,419 $313,820 $290,000 345 193 98% 35
Toronto W09 36 $6,353,900 $176,497 $136,750 82 62 95% 44
Toronto W10 81 $13,585,500 $167,722 $165,700 192 137 96% 38
Toronto Central 2,381 $986,068,895 $414,141 $369,700 5,198 2,989 97% 34
Toronto C01 878 $376,321,501 $428,612 $382,000 1,977 1,189 97% 34
Toronto C02 92 $70,539,692 $766,736 $526,250 237 178 96% 34
Toronto C03 15 $6,238,990 $415,933 $416,000 36 23 98% 45
Toronto C04 43 $20,294,640 $471,968 $330,000 88 45 97% 31
Toronto C06 33 $11,307,000 $342,636 $347,000 83 48 98% 40
Toronto C07 167 $58,856,288 $352,433 $330,000 417 231 98% 33
Toronto C08 364 $147,047,103 $403,976 $380,000 702 362 98% 34
Toronto C09 28 $17,925,001 $640,179 $512,500 51 23 99% 24
Toronto C10 82 $38,529,238 $469,869 $410,650 146 68 98% 27
Toronto C11 66 $14,646,799 $221,921 $196,500 96 37 97% 30
Toronto C12 23 $14,274,816 $620,644 $455,016 52 33 95% 40
Toronto C13 95 $29,232,657 $307,712 $280,000 176 97 98% 33
Toronto C14 323 $119,898,351 $371,202 $350,000 732 424 98% 37
Toronto C15 172 $60,956,819 $354,400 $325,500 405 231 98% 39
Toronto East 701 $168,868,002 $240,896 $235,000 1,170 601 97% 33
Toronto E01 40 $16,835,780 $420,895 $403,745 81 40 99% 28
Toronto E02 23 $11,784,800 $512,383 $490,000 35 19 98% 19
Toronto E03 31 $6,564,400 $211,755 $153,000 36 10 98% 30
Toronto E04 115 $21,682,200 $188,541 $174,800 174 83 97% 37
Toronto E05 108 $27,677,433 $256,273 $240,000 157 69 97% 32
Toronto E06 5 $2,141,513 $428,303 $433,000 7 4 99% 21
Toronto E07 108 $25,154,050 $232,908 $235,000 174 95 97% 31
Toronto E08 53 $9,456,400 $178,423 $174,000 85 48 97% 31
Toronto E09 151 $36,571,726 $242,197 $239,500 305 165 97% 34
Toronto E10 13 $2,063,600 $158,738 $160,700 25 15 97% 44
Toronto E11 54 $8,936,100 $165,483 $164,500 91 53 97% 39
SUMMARY OF CONDOMINIUM APARTMENT TRANSACTIONS
Condo Market Report, Third Quarter 2013Page 3
4
Toronto Real Estate Board
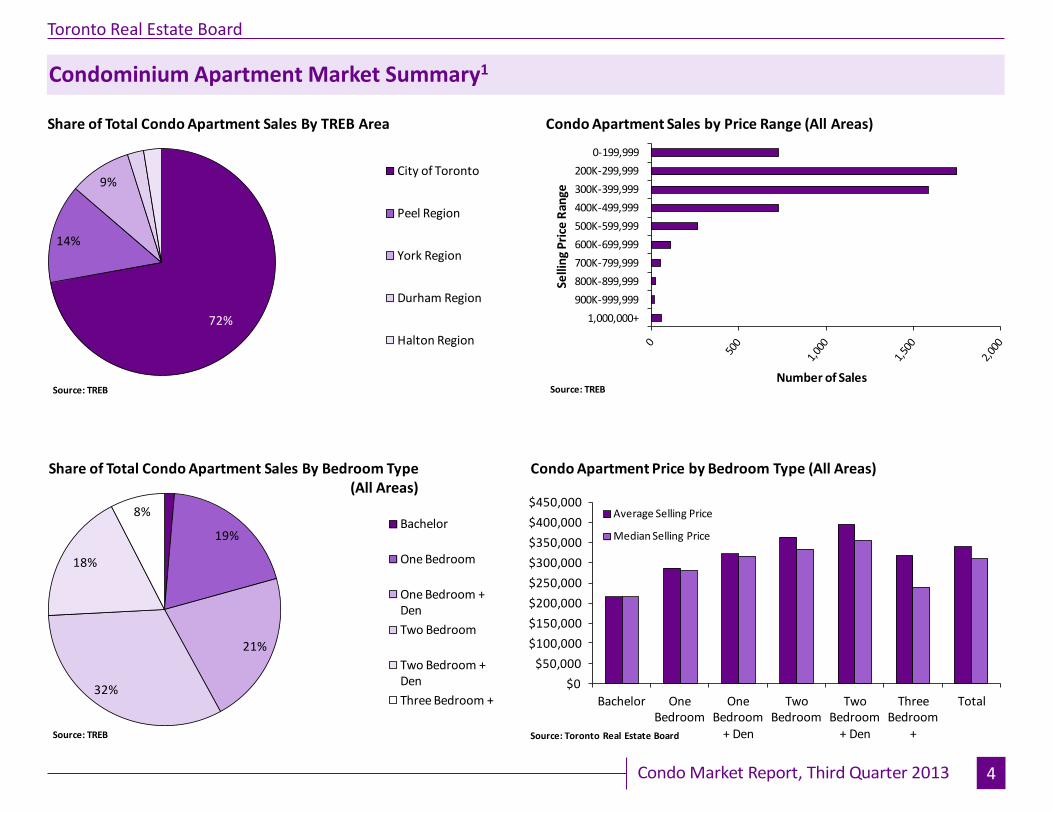
Condominium Apartment Market Summary1
72%
14%
9%
Share of Total Condo Apartment Sales By TREB Area
City of Toronto
Peel Region
York Region
Durham Region
Halton Region
Source: TREB
19%
21%
32%
18%
8%
Share of Total Condo Apartment Sales By Bedroom Type (All Areas)
Bachelor
One Bedroom
One Bedroom + Den
Two Bedroom
Two Bedroom + Den
Three Bedroom +
Source: TREB
1,000,000+
900K-999,999
800K-899,999
700K-799,999
600K-699,999
500K-599,999
400K-499,999
300K-399,999
200K-299,999
0-199,999
Number of Sales
Selli
ng
Pri
ce R
ange
Condo Apartment Sales by Price Range (All Areas)
Source: TREB
$0
$50,000
$100,000
$150,000
$200,000
$250,000
$300,000
$350,000
$400,000
$450,000
Bachelor One Bedroom
One Bedroom
+ Den
Two Bedroom
Two Bedroom
+ Den
Three Bedroom
+
Total
Source: Toronto Real Estate Board
Condo Apartment Price by Bedroom Type (All Areas)
Average Selling Price
Median Selling Price

Condo Market Report, Third Quarter 2013
Sub-Market Breakdown: Downtown Core1
Page 3
5
Toronto Real Estate Board
1,000,000+
900K-999,999
800K-899,999
700K-799,999
600K-699,999
500K-599,999
400K-499,999
300K-399,999
200K-299,999
0-199,999
Number of Sales
Selli
ng
Pri
ce R
ange
Condo Apartment Sales by Price Range (Downtown Core)
Source: TREB
$0
$100,000
$200,000
$300,000
$400,000
$500,000
$600,000
$700,000
$800,000
Bachelor One Bedroom
One Bedroom
+ Den
Two Bedroom
Two Bedroom
+ Den
Three Bedroom
+
Total
Source: Toronto Real Estate Board
Condo Apartment Price by Bedroom Type (Downtown Core)
Average Selling Price
Median Selling Price
16
144
281
377
375
49
0 100 200 300 400
Three Bedroom +
Two Bedroom +
Den
Two Bedroom
One Bedroom + Den
One Bedroom
Bachelor
Source: TREB
Condo Apartment Sales By Bedroom Type (Downtown Core)

Condo Market Report, Third Quarter 2013
Sub-Market Breakdown: North York City Centre1
Page 3
6
Toronto Real Estate Board
1,000,000+
900K-999,999
800K-899,999
700K-799,999
600K-699,999
500K-599,999
400K-499,999
300K-399,999
200K-299,999
0-199,999
Number of Sales
Selli
ng
Pri
ce R
ange
Condo Apartment Sales by Price Range (North York City Centre)
Source: TREB
$0
$50,000
$100,000
$150,000
$200,000
$250,000
$300,000
$350,000
$400,000
$450,000
$500,000
Bachelor One Bedroom
One Bedroom
+ Den
Two Bedroom
Two Bedroom
+ Den
Three Bedroom
+
Total
Source: Toronto Real Estate Board
Condo Apartment Price by Bedroom Type (North York City Centre)
Average Selling Price
Median Selling Price
26
93
155
106
104
6
0 50 100 150 200
Three Bedroom +
Two Bedroom +
Den
Two Bedroom
One Bedroom + Den
One Bedroom
Bachelor
Source: TREB
Condo Apartment Sales By Bedroom Type (North York City Centre)

Condo Market Report, Third Quarter 2013
Sub-Market Breakdown: Mississauga City Centre1
Page 3
7
Toronto Real Estate Board
1,000,000+
900K-999,999
800K-899,999
700K-799,999
600K-699,999
500K-599,999
400K-499,999
300K-399,999
200K-299,999
0-199,999
Number of Sales
Selli
ng
Pri
ce R
ange
Condo Apartment Sales by Price Range (Mississauga City Centre)
Source: TREB
$0
$50,000
$100,000
$150,000
$200,000
$250,000
$300,000
$350,000
$400,000
Bachelor One Bedroom
One Bedroom
+ Den
Two Bedroom
Two Bedroom
+ Den
Three Bedroom
+
Total
Source: Toronto Real Estate Board
Condo Apartment Price by Bedroom Type (Mississauga City Centre)
Average Selling Price
Median Selling Price
7
81
68
69
26
1
0 20 40 60 80 100
Three Bedroom +
Two Bedroom +
Den
Two Bedroom
One Bedroom + Den
One Bedroom
Bachelor
Source: TREB
Condo Apartment Sales By Bedroom Type (Mississauga City Centre)

Condo Market Report, Third Quarter 2013
New Home Market
Page 3
8
Toronto Real Estate Board
Condominium Apartment Price Growth Rebounded in Q3
• The trend for active condominium apartment listings generally follows the trend for condominium apartment completions (bottom left chart).
• The trend for condominium apartment completions has been more or less flat in 2013. With this in mind, it follows that the active listings trend for condominium apartments has also been flat. On a year-over-year basis, active listings were down in the third quarter of 2013.
• After two consecutive quarters of moderate year-over-year declines in the median condominium apartment price, the annual rate of price growth rebounded into positive territory in the third quarter of 2013. The reason for this was the fact that sales were up compared to the third quarter of 2012, while listings were down. More competition between buyers led to upward pressure on selling prices.
02,0004,0006,0008,000
10,00012,00014,00016,00018,00020,000
Source: CMHC; TREB Adjustment
Toronto CMA Condominium Apartment Completions(Annualized, 12-Month Moving Average)
0
5,000
10,000
15,000
20,000
25,000
30,000
Source: Toronto Real Estate Board; CMHC
Condominium Apartment Completions and
MLS® Active Listings (Annualized Trends)
Completions Active Listings
-10%
-5%
0%
5%
10%
15%
20%
25%
0%
10%
20%
30%
40%
50%
60%
70%
An
nu
al Me
dian
Price
Gro
wth
Sale
s-to
-Act
ive
Lis
tin
gs R
atio
Source: Toronto Real Estate Board
Condominium Apartment Sales-to-Active Listings Ratio and
Median Price Growth (All Areas)Annual Median Price Change (Right Scale)
Sales-to-Active Listings Ratio (Left Scale)

Condo Market Report, Third Quarter 2013
Rental Market Summary
Page 3
9
Toronto Real Estate Board
Rental Market Remained Tight in the Third Quarter of 2013
• The condominium apartment rental market continued to tighten in the third quarter of 2013, with condominium apartment rental transactions increasing on a year-over-year basis by a greater rate than the number of units listed for rent.
• Tight rental market conditions resulted in continued growth in average rents for one-bedroom and two-bedroom condominium apartments.
• Condominium apartments remain a popular option for renter households looking for rental accommodations with modern finishes and amenities.
0
500
1,000
1,500
2,000
2,500
3,000
3,500
4,000
4,500
5,000
Downtown Core North York City Centre Mississauga
Source: TREB
Number of Units ListedQ3 2013 vs. Q3 2012
2013 2011
0
500
1,000
1,500
2,000
2,500
3,000
Downtown Core North York City Centre Mississauga
Source: TREB
Number of Units RentedQ3 2013 vs. Q3 2012
2013 2011
$0
$400
$800
$1,200
$1,600
$2,000
$2,400
$2,800
All TREB Downtown Core North York City Centre
Mississauga
Source: TREB
Average Two-Bedroom RentsQ3 2013 vs. Q3 2012
2013 2011

Condo Market Report, Third Quarter 2013
Industrial Leasing
Page 3
Toronto Real Estate Board
10
NOTES
6Past monthly and year-to-date figures are revised monthly.
1Sales, dollar volume, average sale prices and median sale prices are based on firm transactions entered into the TorontoMLS system between the first
and last day of the quarter being reported.2New listings entered into the TorontoMLS system between the first and last day of the quarter being reported.
3Active listings as of the end of the last day of the quarter being reported.
4Ratio of the average selling price to the average listing price for firm transactions entered into the TorontoMLS system between the first and last day of
the quarter being reported.5Average number of days on the market for firm transactions entered into the TorontoMLS system between the first and last day of the quarter being
reported.
13
.7%
22
.7%
23
.6%
18
.5%
8.7
%
Halton Peel Toronto York Durham
Source: CMHC, 2012 Fall Rental Market Survey
Share of GTA Condo
Apartments In Rental
0.5% 0.6%
1.4%
0.7%
0.0%
Halton Peel Toronto York Durham
Source: CMHC, 2012 Fall Rental Market Survey
GTA Condo Apartment
Vacancy Rate