condor manual 2 - ickn
TRANSCRIPT

Condor Manual 2.2Part II: Content Analysis
Semantic Social Network Analysis for Windows, Mac, and Linux
Send feedback to [email protected]
©April 3, 2007, Galaxyadvisors

Table of Contents
INTRODUCTION...............................................................................................................................................................3GETTING STARTED: ..........................................................................................................................................................3CREATE DATABASE ..........................................................................................................................................................4CREATE DATASET ............................................................................................................................................................7CONTENT PROCESSING..................................................................................................................................................12DEFINE STOP TERMS ......................................................................................................................................................15VISUALIZING DATA WITH CONDOR.............................................................................................................................17
Static View of Terms .................................................................................................................................................17Dynamic View of Terms............................................................................................................................................33Static View of Documents.........................................................................................................................................34Dynamic View of Documents ...................................................................................................................................37

galaxyadvisors 3
Introduction
Condor software employs text mining, auto-categorization and social network mappingtechnologies in a unique visual way to discover hidden relationships and the “unknownunknowns” by mining unstructured data such as the Web, e-mail logs, file servers,phone archives, RSS feeds and Intranets. Condor paints a graphic picture in real time ofthe relationships of people, ideas, and organizations. It provides one-click analysis ofcomplex facts and relationships that previously were extremely expensive and time-consuming to obtain.
textfiles
WebHTMLpageslinks
E-mailOutlook
converter
Condor
WebCollector
Blogposts
RSSCollector
Onlineconverter
MailingLists
forums
Database
Fileloader
Struc-tured(csv)files
text parser
Eudora parser
Dynamic View of Communications
Dynamic View of Concepts
Dynamic View of Network Statistics
Condor System Architecture
Getting Started:
Start the Condor application by double-clicking at Condor.bat.

galaxyadvisors 4
Open a Mac terminal window and type “java -Xmx1G -jar Condor.jar”in the directory where Condor.jar is located.
Execute “java -Xmx1G -jar Condor.jar” command from the shell.
The following window will open:
Create Database
To create new document database Click on File->New->Document Database…

galaxyadvisors 5
Log into the MySQL database, by providing your username & password and defineyour database name. Once you filled all the information click on Register.
Alternatively, to open an existing database click on File->Open Database…

galaxyadvisors 6
Login to the MySql and choose the desired database

galaxyadvisors 7
Create Dataset
Dataset is a group of data inside a database. One database can have one or moredatasets. In order to load your data, you are required to have at least one dataset.To create a new dataset Click on Edit->New Dataset…
Specify a name of your dataset and click OK, to create a dataset.
Once you have created a dataset, Condor will prompt you for processing the files intothe dataset.

galaxyadvisors 8
Click on Yes to process the file
Select the desired directory by clicking the Browse button

galaxyadvisors 9
After selecting the directory, Click on Process button.
The dialog box prompts you to define the document format for parsing. If no specialformat instructions are required, you can choose No otherwise choose Yes to define thedocument format.
The dialog box to define your custom parser and date stamp format will appear.

galaxyadvisors 10
Alternatively, you can also load the custom parser setting from the file by clicking onthe Load Setting button. The sample file will look like:
[DOCUMENT_ID=, DOCST=][<SOURCE>, </SOURCE>][<DOR>, </DOR>][<COUNTRY>, </COUNTRY>, <TITLE>, ]
Document Name: Define your tag to use the document name from the file instead ofusing file name.
Document Source: Define your tag to identify the source of the document instead ofusing path name of the file.
Document Timestamp: Define your tag to pick the date field or you can use lastmodified time. This information is used to define the time constraints duringprocessing & visualization.
In order to save the setting of your custom parser, click on Save Setting button to beable to load in future. Once done click on Next button, the following dialog box will
Click on Addbutton to addmore fields, youwant to parse
Click on Next button,once done defining file-format.
Define yourtags to parse
This will ignoretags and parsethe wholedocument

galaxyadvisors 11
appear to set the order of tags in the document. Make sure the order matches with thedocument, in order to parse them correctly.
You can move the tags by using Move Up, Move Down buttons. Click on Start buttonto begin processing.
Once the processing is done, you will see a message in the dialog box. At this point,you can close the Process files dialog box.

galaxyadvisors 12
Content Processing
Once the files are parsed and loaded into the database, you are ready for contentprocessing for data visualization and analysis.
Click on View->Term->Content Process
You will get the following dialog box:
In this dialog box, you can define:

galaxyadvisors 13
The desired top # of terms you want to visualize later
Specify your list of terms (term file needs to contain one term per line). If you leave thisfield blank, the software will pick the top terms based on Condor’s algorithm.
You can select this radio box to have a combination of your terms & terms picked up bythe Condor algorithm.
Choosing this check box will ignore the terms, which are common among all thedocuments in your dataset.

galaxyadvisors 14
Choosing this check box will weight terms lower which are common in the Englishlanguage (BNC = British National Corpus, a directory of the most common words).
Once you made your selections, click on the Start button to start content processing.The next dialog box will let you define the time constraints. After specifying your timeselection click on the Set button. You will see a confirming dialog box, click on Yes.
At this point, you have completed Content Processing for term visualization.

galaxyadvisors 15
Define Stop Terms
Once the Term Processing is finished, you can define your Stop Terms list. Click on Yesbutton to see complete list of Stop terms.
Stop Terms selection window list all the terms found in the set of documents and withthe word in which term is used and the # of documents that term occurred.

galaxyadvisors 16
After making a selection of stop terms, click on Set button to take effect.
Export button will export the complete comma separated list in a text file that can beloaded into Spotfire or MS-Excel for further report generation.

galaxyadvisors 17
Visualizing Data with Condor
Once the data is loaded, parsed, and processed you are ready to visualize theinformation.
Static View of TermsCondor permits to visualize relationships between terms. In the view of terms, eachnode is a term. Links between terms are common documents. The more two terms sharecommon documents, that is, the more two keywords occur in the same documents, thestronger the link between them will be, and the closer they will be drawn together.
Click on View->Term->Static View of Terms to visualize static view of termrelationship

galaxyadvisors 18
In this Static Term View window, you are looking at top 50 terms (the number of termsyou chose during the processing) and their relationship (i.e., connecting documents)with each other.
An individual node can be dragged around with the mouse to change its location.Dragging the mouse over a node displays the name of the node.
Clicking on a node brings up the links coming and originating from a particular node.
Similarly, clicking on a link (i.e. an edge) brings up all the documents linking two terms.

galaxyadvisors 19
Selecting the documents from the scrolling document list and clicking Show Contentbutton displays the contents of the documents, which can be searched for keywords byadding the text string into the search box and clicking the Search button.
Right clicking on a node brings up a pop-up menu to set single node attributes.
Selecting Show Infor on the term ‘terror’ will give all the words found out of the termin the set of documents.
Selecting Show Messages on the term ‘terror’ will display the following dialog box withscrolling document list and the term frequency.

galaxyadvisors 20
In order to get the labels for the nodes, click on Static Term View window menu View->Show Labels->name
I. Removing TermsClick on Control->Remove Term->Remove…
Displays theselected documents
Highlights all theoccurrence ofsearch term
Export button will exportall the information in atext file for reporting.

galaxyadvisors 21
You will see the following Remove StopWords dialog box; make selection to choose theterms you would like to remove from the current visualization.
The software will recalculate the term weights and relationship, and redraw the screenbased on remaining terms. Software chooses new colors each time it redraws foreffective visualization.

galaxyadvisors 22
The removed terms can be viewed any time by clicking on Control->Remove Term->Show Removed Terms…
All the removed terms from the current visualization will be listed in a dialog box.

galaxyadvisors 23
II. Adding TermsClick on Control->Add New Terms-Add New Terms
galaxyadvisors 24
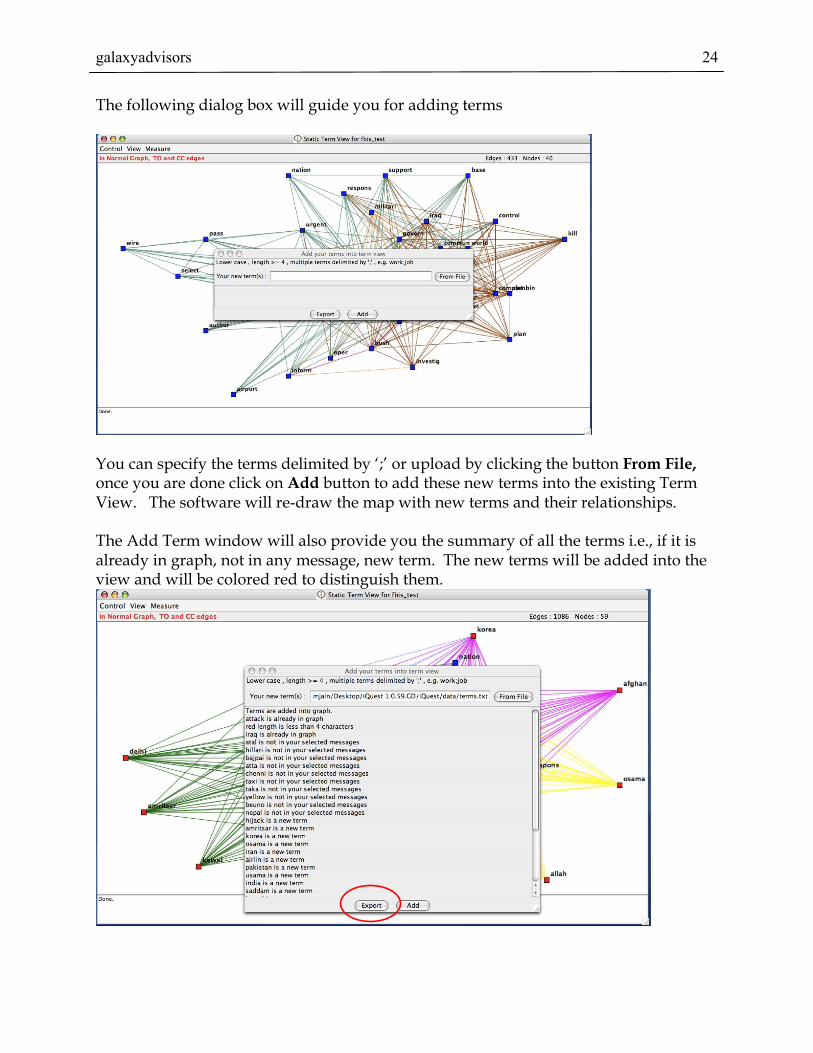
The following dialog box will guide you for adding terms
You can specify the terms delimited by ‘;’ or upload by clicking the button From File,once you are done click on Add button to add these new terms into the existing TermView. The software will re-draw the map with new terms and their relationships.
The Add Term window will also provide you the summary of all the terms i.e., if it isalready in graph, not in any message, new term. The new terms will be added into theview and will be colored red to distinguish them.

galaxyadvisors 25
The Export button will create a text file for your reports.
III. Control->Filter by Term Rank…This will provide you the visualization of top # of specified terms.
IV. Control->Layout By MonthsLayout by months let you choose the individual terms you are interested in by date, thisfeature will provide different visuals by month if you have a datestamp field in adocument and you have specified the date format during the parsing of document.

galaxyadvisors 26
V. Control->Layout By NodesLayout by nodes let you choose the individual terms you are interested in without anybias of ranking or weight.
You can choose certain terms either with all their relationships or exclusively byselecting Exclusive button with no other relationships.

galaxyadvisors 27
VI. Load Taxonomy Static view of terms also permits you to load a user defined taxonomy file to clusterdocuments into predefined bins. To load your taxonomy file click on Control->LoadTaxonomy the dialog box will prompt you to load your taxonomy file.

galaxyadvisors 28
Syntax
<level#>word[synonym1;synonym2]
The top word is <level0>
There are no white space delimiters. Each word should be delimited by Line Break.
All the words are in lower case.
Each word after a <leveln> keyword will be a bin. Documents including the particularkeyword will be put into this bin. The words in brackets are synonyms. If they occur,they will also be put into the same bin.
The sample taxonomy file looks like:
<level0>world<level1>government<level2>economy<level2>politics<level3>election<level2>leaders[president;saddam;bush;musharraf;clinton;leader;osama;usama;commander;minister;tony;blair]<level3>president[saddam;bush;musharraf;clinton]<level4>saddam<level4>bush<level4>musharraf<level4>clinton<level3>leader[osama;usama]<level3>commander<level3>minister[tony;blair]<level1>location<level2>regions[arab;america;asia;europe]<level3>arab

galaxyadvisors 29
<level3>america<level3>asia<level3>europe<level2>countries[iraq;afghanistan;pakistan]<level3>iraq<level3>afghanistan<level3>pakistan<level1>infrastructure<level2>utilities<level2>transportation[land;water;air;plane;jet;helicopter]<level3>land<level3>water<level3>air[plane;jet;helicopter]<level4>plane<level4>jet<level4>helicopter
The size of the node reflects the relative number of documents in the particular bin.

galaxyadvisors 30
Expand will expand the particular node, while Collapse will contract the particularnode visually.Clicking on Show Messages will open a window displaying all the documents of theparticular bin.
VII. View->Color By->NodePermits to change node color of individual term by selecting them in a scrolling list ofterms. (Highlight the term, and then click on Choose Color button to set the color)
Displays theselected documents
Highlights all the occurrenceof search term
Export button will exportall the information in atext file for reporting.

galaxyadvisors 31
VIII. View->Zoom…This is a linear zoom function. The zoom controller permits to set the zoom level, thelight blue rectangle in the snapshot window can be dragged around with the mouse toset the viewing area.
IX. View->Proximity SearchWill search the documents for particular terms, and display the most significant termscontaining the most significant documents linked to that term. NOTE: the term(s) doesnot have to occur in the relevant documents.

galaxyadvisors 32
The largest & brightest node has the most relevant messages, you can display themessage(s) by right clicking on the node and selecting Show Messages
X. Export Term Statistics
User can export the term statistics from any View at any stage by selecting Measure->Export Term Statistics

galaxyadvisors 33
Dynamic View of TermsClick on View->Term->Dynamic View of Terms to visualize dynamic view of termrelationship
Selecting menu brings up a dialog box to set the options to create the interactive movie.
Window size permits to specify the active time window, ranging from 1 to 50 days.For most memory efficient calculation, select large time window size. This might lead tojerkier, less informative displays, but loads significantly faster. After preprocessing, aframe like the one below will come up.

galaxyadvisors 34
Clicking on the red “Run” button will start the animation, which can be stopped at anytime by clicking on the “Stop” button (“Run” changes to “Stop”). Alternatively, userscan also drag the slider directly along the time axis, to jump to a chosen day. Anindividual node can be dragged around with the mouse to change its location. It willthen stay “glued” to this location for the remainder of the animation. This function canbe reset by menu (View->Reset Layout).
Static View of DocumentsClick on View->Documents->Static View of Documents to visualize dynamic view ofdocument relationship.
A dialog box will appear, if you have not generated the documented view before clickon Yes.
galaxyadvisors 35
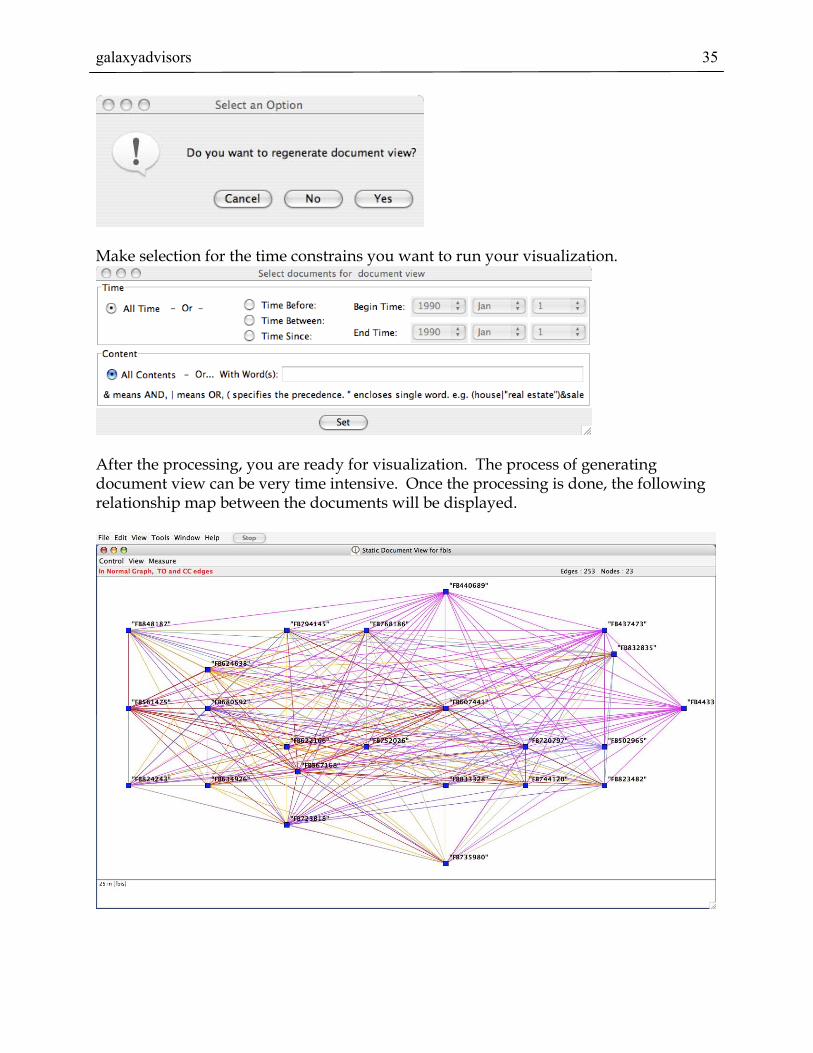
Make selection for the time constrains you want to run your visualization.
After the processing, you are ready for visualization. The process of generatingdocument view can be very time intensive. Once the processing is done, the followingrelationship map between the documents will be displayed.

galaxyadvisors 36
In this display, nodes are the documents and the edges are the terms linking the twodocuments.
Right clicking on the node will pop up a menu, selecting Show Infor will give you thecontent of the document.
While selecting Show Terms, will provide you the list of all the terms in the particulardocument along with their weight.

galaxyadvisors 37
Clicking on any edge will give you the list of top terms linking two documents alongwith their weight.
Dynamic View of DocumentsClick on View->Term->Dynamic View of Terms to visualize the dynamic view ofdocument relationship
Selecting menu brings up a dialog box to set the options to create the interactive movie.
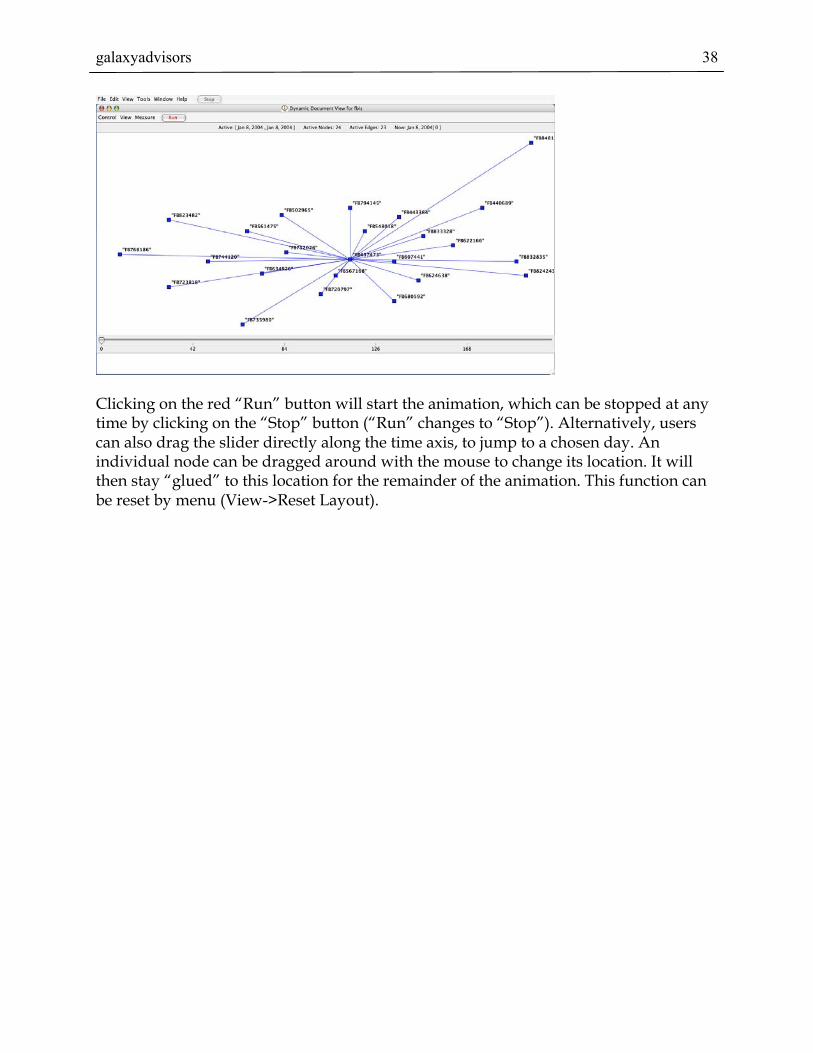
Window size permits to specify the active time window, ranging from 1 to 50 days.For most memory efficient calculation, select large time window size. This might lead tojerkier, less informative displays, but loads significantly faster. After preprocessing, aframe like the one below will come up.
galaxyadvisors 38
Clicking on the red “Run” button will start the animation, which can be stopped at anytime by clicking on the “Stop” button (“Run” changes to “Stop”). Alternatively, userscan also drag the slider directly along the time axis, to jump to a chosen day. Anindividual node can be dragged around with the mouse to change its location. It willthen stay “glued” to this location for the remainder of the animation. This function canbe reset by menu (View->Reset Layout).