conducting effective community health assessments and ... · conducting effective community health...
TRANSCRIPT

Conducting Effective Community
Health Assessments and Health Improvement Plan
Mass League of Community Health Centers
Annual Community Health Institute May 7, 2014

Community
Transformation

What is a Community Health Assessment?
Regularly and systematically collecting, analyzing, and making available information on the health of a community, including statistics on health status and community health needs…. Increasingly, moving beyond problems and deficits toward an analysis of community strengths and resources …as a critical part of understanding a community's health.
-- Public Health Accreditation Board

Federally Qualified Health Centers
• Federally Qualified Health Centers are also required to conduct an assessment as one of 19 requirements by HRSA
• “Needs Assessment: Health Center demonstrates and documents the needs of its target population, updating its service area, when appropriate. (Section 330(k)(2) and Section 330(k)(3)(J) of the PHS Act)”
(Health Resources and Services Administration, http://bphc.hrsa.gov/about/requirements/index.html)
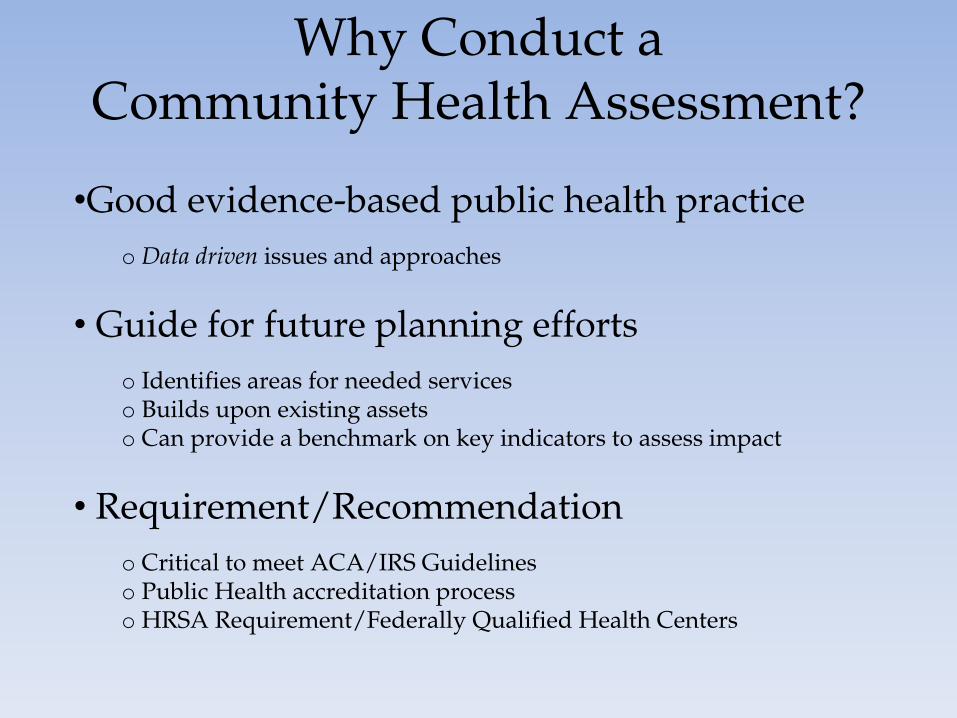
Why Conduct a Community Health Assessment?
•Good evidence-based public health practice
o Data driven issues and approaches
• Guide for future planning efforts
o Identifies areas for needed services o Builds upon existing assets o Can provide a benchmark on key indicators to assess impact
• Requirement/Recommendation
o Critical to meet ACA/IRS Guidelines o Public Health accreditation process o HRSA Requirement/Federally Qualified Health Centers

Guiding Principles
• Inclusive
• Participatory
• Collaboration
• Innovation
• Transparency

Process
• Form an Advisory Committee
• Select a Framework/Model
• Collect/compile data
• Analyze data
• Create a plan
• Develop report
• Disseminate findings

Tra
nspo
rtat
ion
Multi-Sector
Partnerships

Determine framework &
model Define purpose & scope of
work Build capacity Timetable and budget Determine data collection
methods Collect primary and
secondary data Analyze & interpret data Determine community
priorities Create implementation plan Create a report Disseminate findings
Role of the Advisory Committee

Assessment Committee Member Data
Vision: What are the characteristics of a healthy community?

Select a Framework/Model
World Health Organization, Commission on the Social Determinants of Health, Towards a Conceptual Framework for Analysis and Action on the Social Determinants of Health, 2005.

• Phase 1& 2: Organize, Partner, Create a vision
• Phase 3: Collect data using a broad definition of health
– Public Health Data – Themes & Strengths – Forces of Changes – Local Public Health System
• Phase 4, 5 & 6: Prioritize & Plan
Assessment Framework: Mobilizing for Action
through Planning and Partnerships (MAPP)

Visibility
Collaboration
Engagement
Ownership
Increased capacity
Prevention
Anticipate and manage change
Quality of life
Public Health MAPP
Build local health department leadership
Builds leadership, but also promotes
community responsibility for the
health of the public
Assess capacity for delivering
public health services
Assess capacity of entire local public
health system
Operational planning Strategic planning
Focus on health status
Focus on health status, community
perceptions, forces of change, and local public health system
capacities
Develop plans to address needs
Strategically match needs, resources, ideas, and actions
Benefits of MAPP Process

Data Compilation – Key Topics
• Social and economic context
– Demographics, income, education, housing, transportation, crime, etc.
– Physical and built environment
• Health factors
– Risk factors (smoking, obesity, physical activity, etc.)
– Health care utilization and access
• Health outcomes – Prevalence and hospitalizations (chronic and communicable disease)
– Mortality
• Community Assets and Resources

Data Compilation
• Quantitative data – “numbers”
– Demographic characteristics, % smokers, diabetes prevalence, etc.
• Collected through surveys, U.S. Census, vital records, etc.
• Qualitative data – “stories”
– Perceptions of community health issues and current services, challenges residents face in accessing services
• Collected through focus groups, interviews, etc.

Data Collection Methods
Cultural Competency
Important to keep in mind the
different cultures and socio-economic
backgrounds of residents when collecting data

Captures: • Perceptions of quality of
life & health issues • Behaviors and attitudes
of residents Things to consider:
• Language • Web and paper versions • Communication plan
Quality of Life Survey

Healthy behaviors and lifestyles Low crime/safe neighborhoods Low death and disease rates Low infant deaths Low level of child abuse Parks and recreation Religious or spiritual values Strong family life Strong leadership Strong sense of community Other (please specify)
Think about your ideal community...From the following list, what do you think are the THREE MOST IMPORTANT factors that define a “Healthy Community"? (Only check three)
Access to health care Access to healthy food Accessible public transportation Affordable housing Arts and cultural events Clean environment Good jobs and a healthy economy Good roads/infrastructure Good schools
Quality of Life Survey Questions
Vision: Healthy Community
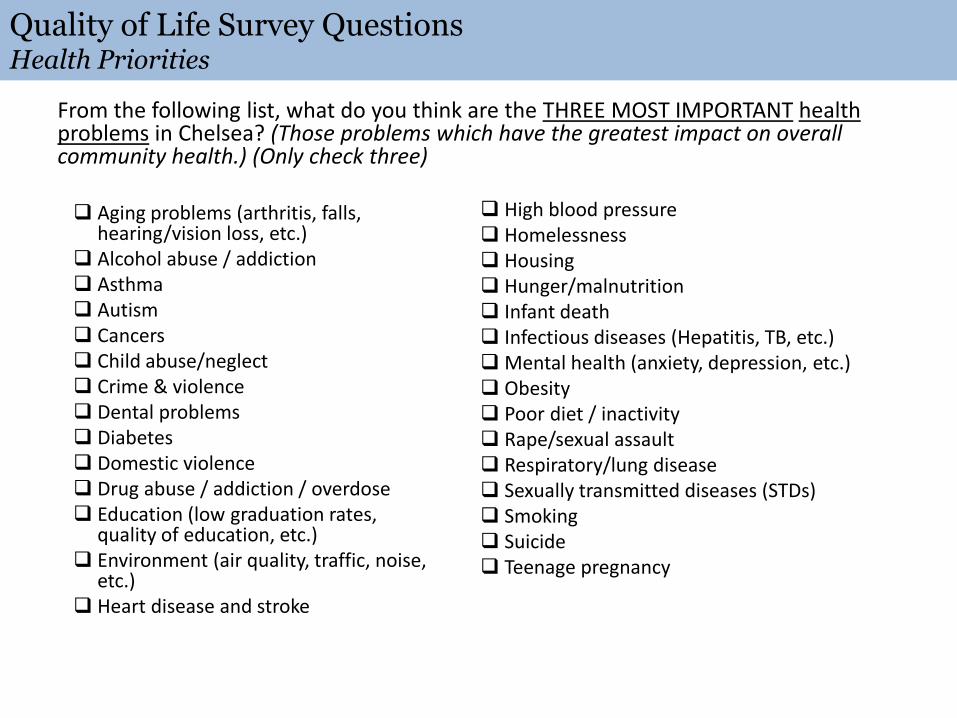
Aging problems (arthritis, falls, hearing/vision loss, etc.)
Alcohol abuse / addiction Asthma Autism Cancers Child abuse/neglect Crime & violence Dental problems Diabetes Domestic violence Drug abuse / addiction / overdose Education (low graduation rates,
quality of education, etc.) Environment (air quality, traffic, noise,
etc.) Heart disease and stroke
From the following list, what do you think are the THREE MOST IMPORTANT health problems in Chelsea? (Those problems which have the greatest impact on overall community health.) (Only check three)
High blood pressure Homelessness Housing Hunger/malnutrition Infant death Infectious diseases (Hepatitis, TB, etc.) Mental health (anxiety, depression, etc.) Obesity Poor diet / inactivity Rape/sexual assault Respiratory/lung disease Sexually transmitted diseases (STDs) Smoking Suicide Teenage pregnancy
Quality of Life Survey Questions
Health Priorities

1. Chelsea is a good place to raise children
2. Chelsea is a good place to grow old
3. There is economic opportunity in Chelsea. (Consider locally owned businesses, jobs
with career growth, job training, higher education, etc.)
4. Chelsea is a safe place to live
5. There are networks of support for individuals and families in Chelsea during times of
stress and need
6. I feel connected to my neighbors and my community
7. The businesses, agencies and organizations in Chelsea contribute to making the
community a better place to live
8. All residents have the opportunity to contribute to and participate in making Chelsea a
better place to live. (Consider minority populations, new residents, etc.)
9. I believe I can contribute to and participate in making Chelsea a better place to live
10. Overall, I am satisfied with the quality of life in Chelsea
Using a scale of 1-5 (as shown below), please rate how much you agree or disagree with the following statements: Strongly Disagree (1) Strongly Agree (5) Don't know / Unsure
Quality of Life Survey Questions
Perception of health, connectedness & social capital

Focus Group & Interviews

Community Forum
Gallery Walk Table Discussions
Community Presentation


Overall Mortality
2000-2010*
City of Boston
Chelsea
Everett Winthrop Revere
MA Total
Per Capita Income
$33,158 $20,214 $24,575 $36,624 $25,085 $35,051
Persons Below Poverty Level
21.4% 23.3% 11.6% 8.6% 16.2% 10.7%
High School Grad or Higher
84.2% 65.3% 80.1% 91.9% 78.8% 88.9%
Speak language other than English at home
36.1% 67.8% 45.7% 13.8% 42.8% 21.4%
Foreign born 27.1% 44.1% 36.0% 11.1% 30.5% 14.7%
Asian
1.2%
Other
2.9%
American
Indian and
Alaska Native
0.2%
Black or
African
American, 2%
White
91.8% Multiracial
1.9%
0
200
400
600
800
1000
Ag
e A
dju
sted
Ra
te p
er 1
00
,00
0 Winthrop
MA
Winthrop 760.2 732.09 816.57 837.1 837.06 718.36 864.56 759.79 718.25 728.72 649.41
MA 809.4 799.87 790.1 768.47 735.26 715.01 713.57 699.74 699.06 670.68 667.77
2000 2001 2002 2003 2004 2005 2006 2007 2008 2009 2010
Public Health Data Census Total Population in 2010: 17,497
Older Population – 16.5% of residents age 65+ (13.8% statewide)
Socio-Demographic Indicators Cities in Boston Region and Massachusetts
Source: 2007-2011 American Communities Survey (5-year Estimate), US Census Bureau

Priority Ranking of Health Issues
Key Health Issues (listed below):
SELECTION CRITERIA
Total
Rating
RELEVANCE
How important
is it?
APPROPRIATENESS
Should we do it?
IMPACT
Can we make a
difference?
ACHIEVABLE/
FEASIBILITY
Can we do It?
•Burden
(magnitude
and severity;
economic
cost;
urgency) of the problem
•Community concern
•Focus on
equity and accessibility
•People and passion
•Ethical and moral
issues
•Human rights issues
•Legal aspects
•Political and social
acceptability
•Public attitudes and
values
•Move the needle
with measureable
outcomes
•Builds on or
enhances current
work
•Evidence-
based/informed
strategies
•Community
capacity
•Technical capacity
•Economic capacity
•Political
capacity/will
•Socio-cultural
aspects
•Ethical aspects
•Can identify easy
short-term wins
a.
b.
c.
d.
e.
f.
g.
h.
i.
j.
Instructions: Rate each issue based on how well it meets each of the criteria provided
1=low, 2=medium, 3=high, 4=very high
Add your four ratings for each health issue and enter the total in the Total Column.
Referring to your Total Rating
numbers, rank order each of the
Heath Issues with “1” being the
Health Issue with the highest total
score, “2” being the Health Issue
with the second highest total
score, etc.
In the case of identical totals,
use your best judgment to assign
a unique rank number to each
health issue to break the tie.
Rank Order of Health Issues (use each number only once):
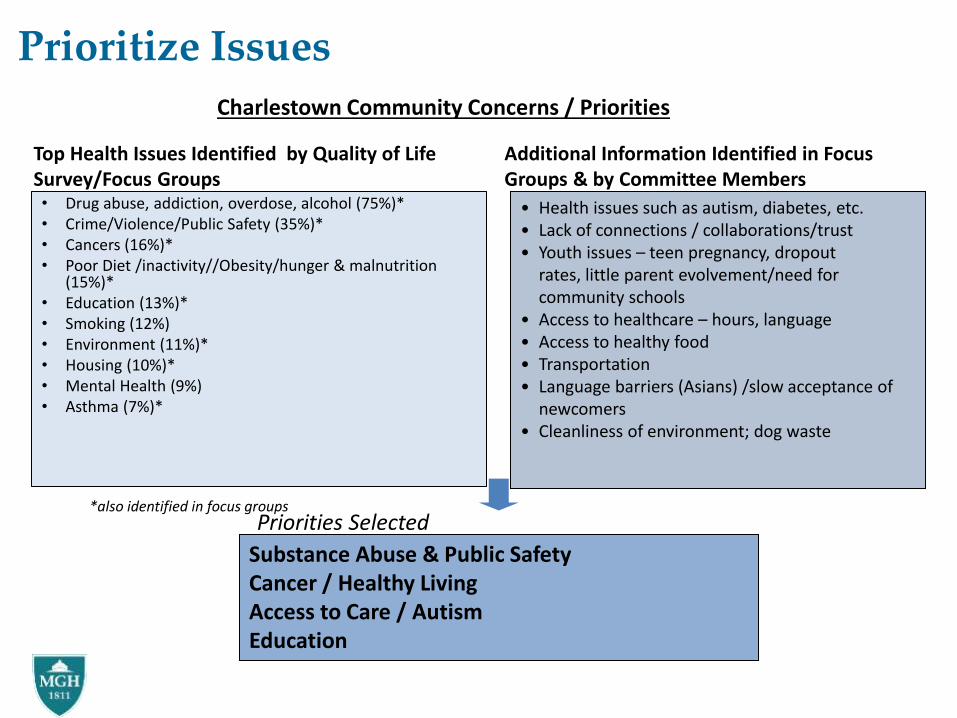
• Drug abuse, addiction, overdose, alcohol (75%)* • Crime/Violence/Public Safety (35%)* • Cancers (16%)* • Poor Diet /inactivity//Obesity/hunger & malnutrition
(15%)* • Education (13%)* • Smoking (12%) • Environment (11%)* • Housing (10%)* • Mental Health (9%) • Asthma (7%)*
Substance Abuse & Public Safety Cancer / Healthy Living Access to Care / Autism Education
Prioritize Issues
• Health issues such as autism, diabetes, etc. • Lack of connections / collaborations/trust • Youth issues – teen pregnancy, dropout
rates, little parent evolvement/need for community schools
• Access to healthcare – hours, language • Access to healthy food • Transportation • Language barriers (Asians) /slow acceptance of
newcomers • Cleanliness of environment; dog waste
Priorities Selected
Top Health Issues Identified by Quality of Life Survey/Focus Groups
Additional Information Identified in Focus Groups & by Committee Members
*also identified in focus groups
Charlestown Community Concerns / Priorities

Prioritization

Report Development
• Assessment Questions
• Background Information
• Framework/Model
• Data Presentation
oQuantitative and Qualitative
• Discussion/Implications
• Recommendations

Strategic Planning Elements
30
VISION—MISSION—VALUES
GOALS
OBJECTIVES
Strategies
Metrics
31
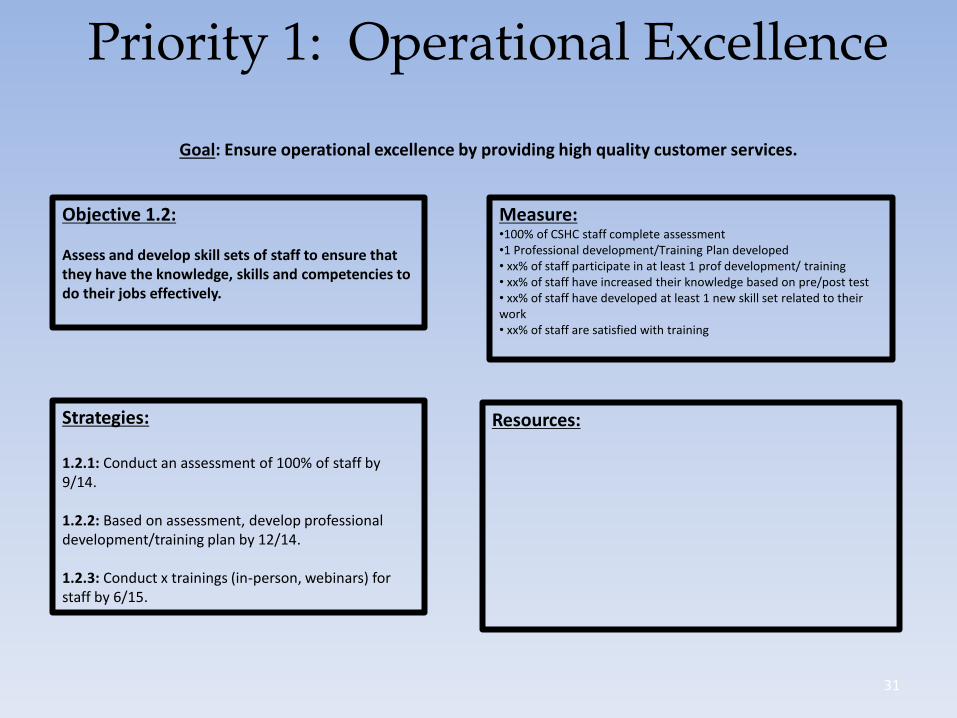
Priority 1: Operational Excellence
Goal: Ensure operational excellence by providing high quality customer services.
Strategies: 1.2.1: Conduct an assessment of 100% of staff by 9/14. 1.2.2: Based on assessment, develop professional development/training plan by 12/14. 1.2.3: Conduct x trainings (in-person, webinars) for staff by 6/15.
Resources:
Objective 1.2: Assess and develop skill sets of staff to ensure that they have the knowledge, skills and competencies to do their jobs effectively.
Measure: •100% of CSHC staff complete assessment •1 Professional development/Training Plan developed • xx% of staff participate in at least 1 prof development/ training • xx% of staff have increased their knowledge based on pre/post test • xx% of staff have developed at least 1 new skill set related to their work • xx% of staff are satisfied with training

PRIORITY AREA:
GOAL:
PERFORMANCE MEASURES
How We Will Know We are Making a Difference
Short Term Indicators Source Frequency
Long Term Indicators Source Frequency
OBJECTIVE #1:
BACKGROUND ON STRATEGY
Source:
Evidence Base:
Policy Change (Y/N):
ACTION PLAN
Activity Target
Date
Resources
Required
Lead Person/
Organization
Anticipated
Product or Result
Progress
Notes
Action Plan

Dissemination of Findings
• Who is the audience?
• Why share this data?
• What are the key messages?
• When and Where will you share the data?
• How will you share data?
o Stakeholder Meetings
o Community Meetings
o Internet/Website
o Media Outlets: Radio/Newspaper, TV

Lessons Learned
• Understand community culture - understand the issues “below the surface” - what people care about and why, and what motivates people to form partnerships to take action
• Readiness – assess both internal and external readiness • Clear Communication • Trust • Leadership and Vision • Time • Accountability • Sustainability • Community clinical work

MGH Chelsea HealthCare Center

MGH Operates Three Licensed Community
Health Centers:
MGH Affiliated: North End Waterfront Health

•Chelsea is an inner urban suburb of Boston the capital city of Massachusetts with a diverse population
•A charter change in 1995 designed an efficient council-manager form of government, which has focused on improving the quality of service the city provides to its residents and businesses, while establishing financial policies that have significantly improved the city's financial condition.
City of Chelsea

The People of Chelsea
• Population: 36,828
• Diverse population: Growing Latino Population up from 28% in 2000 to 62% in 2010
• 1 in 4 living in poverty
• Per-capita income $18,630
• 36% have less than a high school education
• Higher unemployment rates than the state
24.2%
10.4%10.5%
7.5%
0%
5%
10%
15%
20%
25%
30%
Percent Living in Poverty
2006-2010
Unemployment Rate Feb.
2012
Chelsea
State
Black
6.7%
Latino
62.2%
Asian
3.0%
Multiracial
1.6%
White
25.3%
Other
1.2%

MGH Chelsea Patient Data
We provide care to 32,251 patients
41% (13,223) of our patients’ first
language is Spanish 69% (22,253) of our patients’
first language is English. Based on information asked at
time of registration
Medicare: 11% Medicaid: 44% Private: 35% HCSN/Uninsured: 10%
Payor Mix

Revised MGH Mission Statement in 2007
Guided by the needs of our patients and their families, we deliver the very best health care in a safe, compassionate environment, we advance that care through innovative research and education, and we improve the health and well-being of the diverse communities we serve.

Chelsea Community Health Improvement The Early Years
Assessment: First Community Health Assessment completed in 1996
Challenge: Despite MGH’s presence there was distrust
Community Identified Priority: Youth, community and family violence Response: 1998 PACT (Police Action Counseling Team) was formed - A partnership between MGH Chelsea and the Chelsea Police to reduce trauma among children who witness violence.

Collaborations
• Large influx of immigrant and refugee children from Bosnia and Somalia in the late 1990s
• Chelsea superintendent sought help from MGH
• MGH opened a clinic within Roca, Inc.
• Clinicians advocated for a team of community health workers and navigators to help immigrant & refugee patients with their social needs.
• Today over 40 staff involved with close to 20 programs and initiatives exist

Community Health Improvement Programs
• Refugee • Community Health Workers • Interpreters (In-house)
– Arabic – Dari – Russian – Bosnian – French – French Creole – Portuguese – Somali – Farsi – Pashtu – Spanish
• HIV/AIDS • Maternal & Child Health
• Woman’s Health • Cervical Health • Diabetes • Visiting Mom’s • Colon Cancer • Food for Families • Pediatric Asthma • LINK • OB Outreach • Community Initiatives/Healthy
Living • HAVEN • Avon Breast Cancer

Strong Community Relationships and Connections
Many of our staff are members of community task forces
The health center has collaborated and partnered with community agencies, city government and schools
25% of our staff live in Chelsea
Chelsea
Hunger
Network
Chelsea Emergency Preparedness
Community Roundtable

Community Events

Chelsea Community Health Assessment
MGH
Commitment & Collaboration
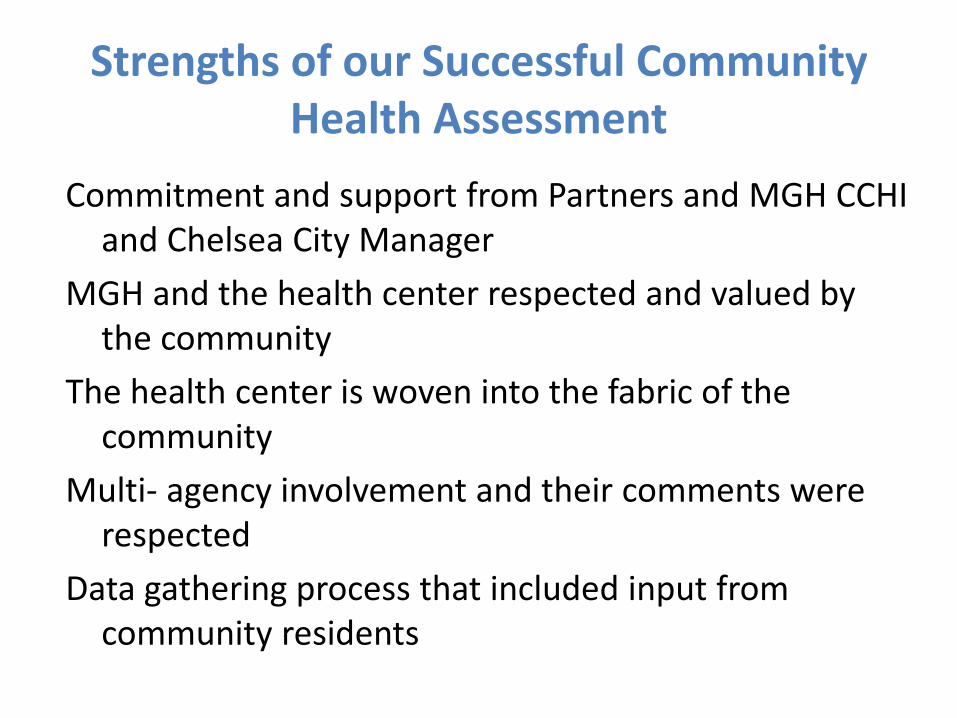
Strengths of our Successful Community Health Assessment
Commitment and support from Partners and MGH CCHI and Chelsea City Manager
MGH and the health center respected and valued by the community
The health center is woven into the fabric of the community
Multi- agency involvement and their comments were respected
Data gathering process that included input from community residents

Challenges
Managing expectations of such a large group with their own agendas
Drilling down list of potential areas of focus

Timing is Everything
Community Health Assessment
MGH Strategic Planning
Health Center Strategic Planning
Development and Changes in the city

“Without a sense of caring, there can be no sense of community.”
Anthony D’Angelo Funder of the Collegiate Empowerment Company

Community Needs Assessment: A collaborative approach
Edward M. Kennedy Community
Health Center- Framingham and the
MetroWest Experience

Collaborative CHA Process
• EMKCHC is a multi-site federally qualified community health center (Worcester, Framingham, Milford, Clinton)
• Framingham site opened in 2004 due to influx of patients to Worcester site and community need
• Moved to new Framingham site in September 2012
• Population served by Framingham site:
– FY 2013 4919 medical only unduplicated users
– 74% Latin American/Caribbean (of which 76 % or 61% of all patients is Brazilian)
– % of patients are Framingham residents (other top 5 communities are Marlborough, Milford, Ashland, Natick and Hudson)
– 60% of patients are uninsured or covered by HSNO; 4% commercial insurance; 36% MassHealth or other public subsidized insurance
– Patients speak over 35 languages- largest number are Portuguese 63% and Spanish 22%
EMKCHC- Background

Collaborative CHA Process
• MetroWest regions includes 22 communities in 3 counties (Middlesex, Norfolk and Worcester) from Stow to Foxborough (total population ~386,000)
• MetroWest Health Foundation convened several community partners including EMKCHC , MWMC, Marlborough Hospital and CHNA 7 and other leaders
• An advisory team was established which directed the process • Partners (including EMKCHC and the two hospitals) invested to hire a consultant • Contracted HRiA as consultant to pull together and analyze data • Survey- Each partner and collaborator sent surveys to their contacts. There were
673 respondents who live or work in MW • Focus Groups- Collaborators all chipped in time to conduct 18 focus groups
including seniors, youth, parents, homeless residents, Spanish and Portuguese-speaking residents, African American and Asian residents (~ 100 participants in focus groups)
• Use of existing data- both qualitative and quantitative, including MWHF interviews from their strategic planning (~50 interviews) and health data (much of which was collected by MWHF)

Ingredients for Success
• Strong and respected leadership to pull partners together
• A committed advisory team
• Active existing collaborations and strong partnerships, that is, a history of working together- CHNA
• Invested partners offering time, resources and financial support which reduced the individual burden
• An experienced evaluation team
• Models from other regions to build upon

What we learned
• The region is large with considerable differences across communities in terms of age distribution, racial and ethnic diversity, income, poverty and employment, environmental factors. (Results described by sub-region)
• While some facilities and resources in region help contribute to being healthy, issues around transportation (accessibility and affordability) , built environment and prevalence of fast food challenge community health
• Priority areas (differed in order of priority by sub-region) – Overweight/obesity, aging problems (Alzheimer's arthritis, dementia,
etc.), mental health (anxiety, depression, etc.) drug/alcohol abuse, heart disease (stroke, hypertension, etc.) , cancer
• Engagement in process & issues across the board from provider organizations to community groups to members of the public

Aftermath: Using the CHA
• Breakfast presentation releasing CHA to community (November 2013)
• Individual partners
– EMKCHC informs strategic planning
– CHNA 7 used data to strategize on future efforts
• Speed Collaboration
• Advisory Committee and collaborative partners used data to work on CHIP

Benefits of Collaborative Approach
• Community good will
• Financial investment goes further
• Can build on the resources or expertise of partners
• Offers a wider reach both geographically and to sub-populations
• HRSA Surveyors impressed by both number of CHAs for EMKCHC but also the fact that conducted collaboratively with community partners (March 2014)

Quote from the HRSA Operational Site Visit Report (Released 4/23/2014)
• Compliance Review Findings: Edward M. Kennedy Community Health Center, Inc. (EMKCHC) has participated in the development of several regional and well-documented Needs Assessments, essentially covering and assessing all of Central Massachusetts. All were/are developed collaboratively by multiple community organizations using national, state, and county population and health data, various surveys and focus groups, and resident feedback. The needs assessments include Clinton Hospital Service Area Needs Assessment, Healthy Diversity Project, MetroWest Community Health Needs Assessment (2013), Milford Survey Report (May 2013), Worcester Medicine Magazine (2013) and the Worcester CHIP Report (December 2012).
• Taken together, the assessments include a remarkably complete and comprehensive review of the population, socioeconomic characteristics, health care providers, health indicators, health disparities and health care needs of the residents of Central Massachusetts. It also considered the changing marketplace on state, regional, and national levels since there is a need to review, adapt, cease, and commence various health care programs and services in a changing marketplace as both the population and the health care environment continue to evolve.