conducting fieldwork and survey design
TRANSCRIPT

Conducting Fieldwork andSurvey Design
(Prepared for Young Scholars Participating in SARNET Labour Economics Training)
Dr. G. C. Manna
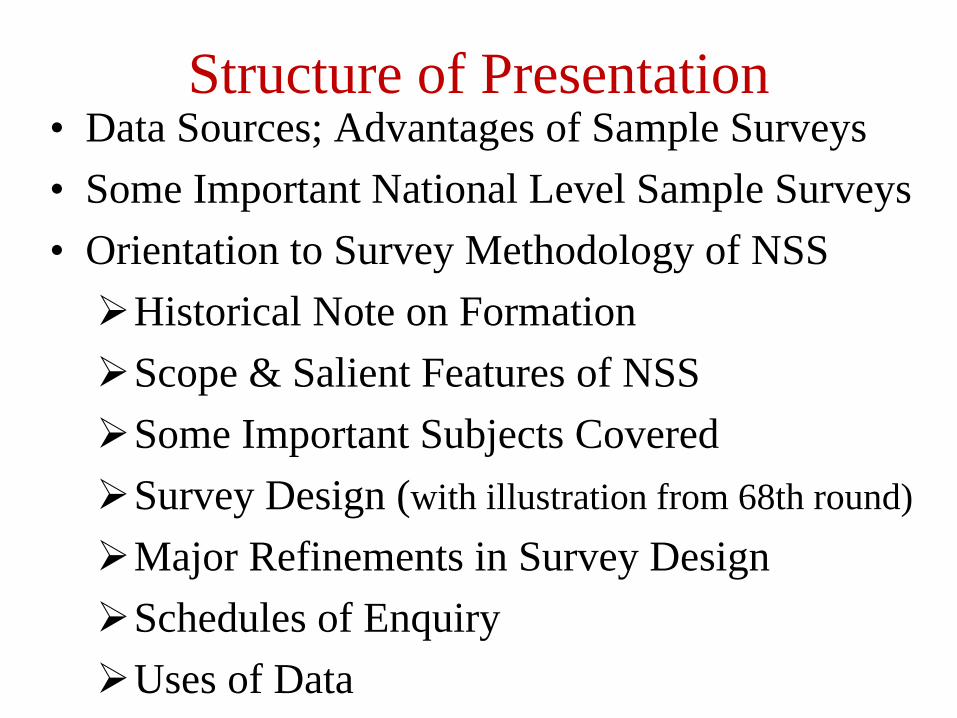
Structure of Presentation• Data Sources; Advantages of Sample Surveys• Some Important National Level Sample Surveys • Orientation to Survey Methodology of NSS Historical Note on Formation Scope & Salient Features of NSSSome Important Subjects CoveredSurvey Design (with illustration from 68th round)
Major Refinements in Survey DesignSchedules of EnquiryUses of Data
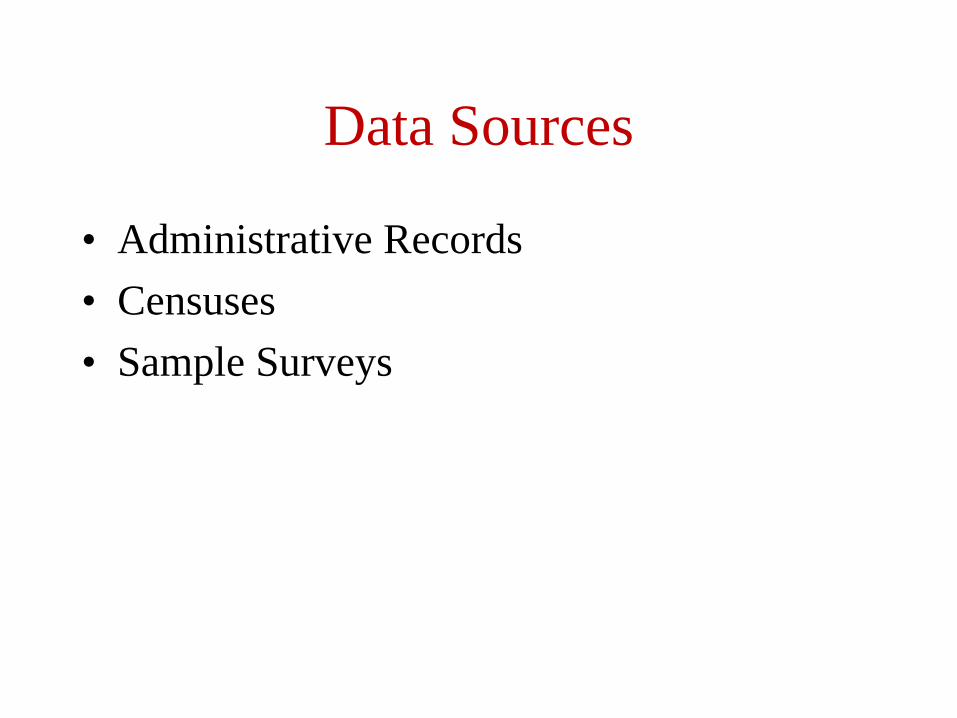
Data Sources
• Administrative Records• Censuses• Sample Surveys
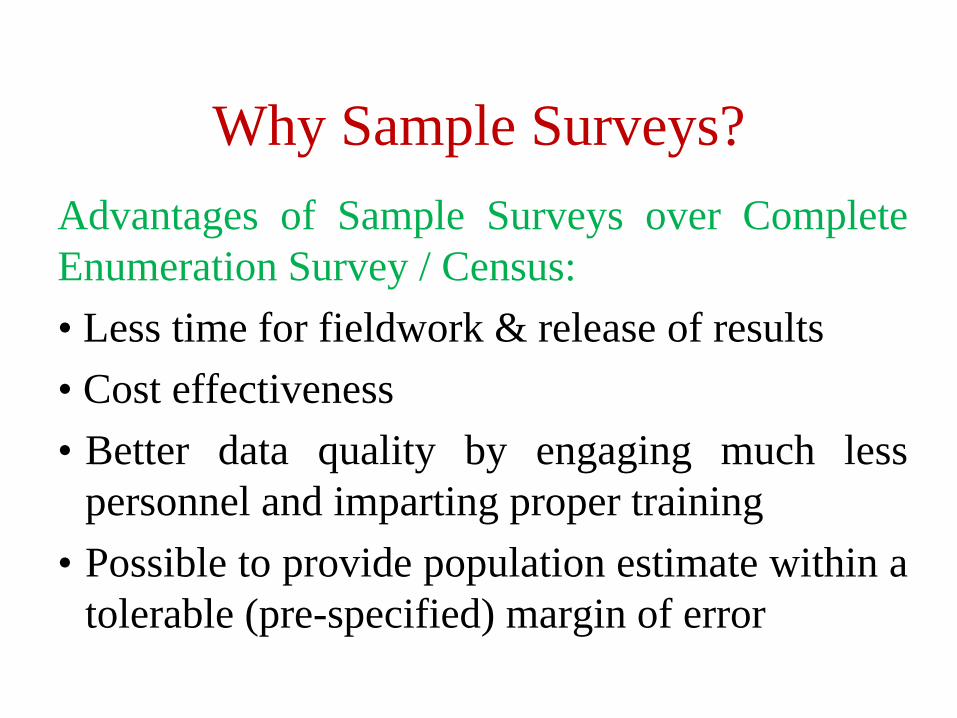
Why Sample Surveys?Advantages of Sample Surveys over CompleteEnumeration Survey / Census:• Less time for fieldwork & release of results• Cost effectiveness• Better data quality by engaging much less
personnel and imparting proper training• Possible to provide population estimate within a
tolerable (pre-specified) margin of error

Some Important National Level Sample Surveys
• Household & Establishment Surveys by NSSO• Annual Survey of Industries by CSO• National Family Health Surveys, M/o HFW• Recent Employment-Unemployment Surveys
being conducted annually by Labour Bureau• Census cum Surveys of Micro, Small &
Medium Enterprises by DC (MSME)• Income & Expenditure Surveys, India Human
Development Survey (2005) by NCAER

Orientation to Survey Methodology of NSS
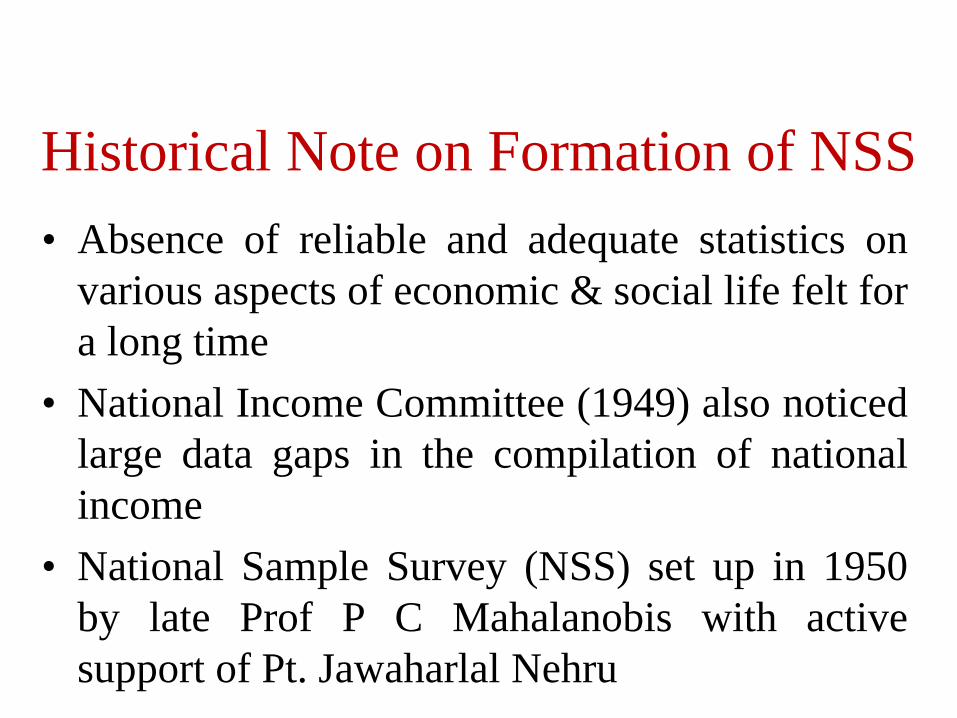
Historical Note on Formation of NSS• Absence of reliable and adequate statistics on
various aspects of economic & social life felt fora long time
• National Income Committee (1949) also noticedlarge data gaps in the compilation of nationalincome
• National Sample Survey (NSS) set up in 1950by late Prof P C Mahalanobis with activesupport of Pt. Jawaharlal Nehru
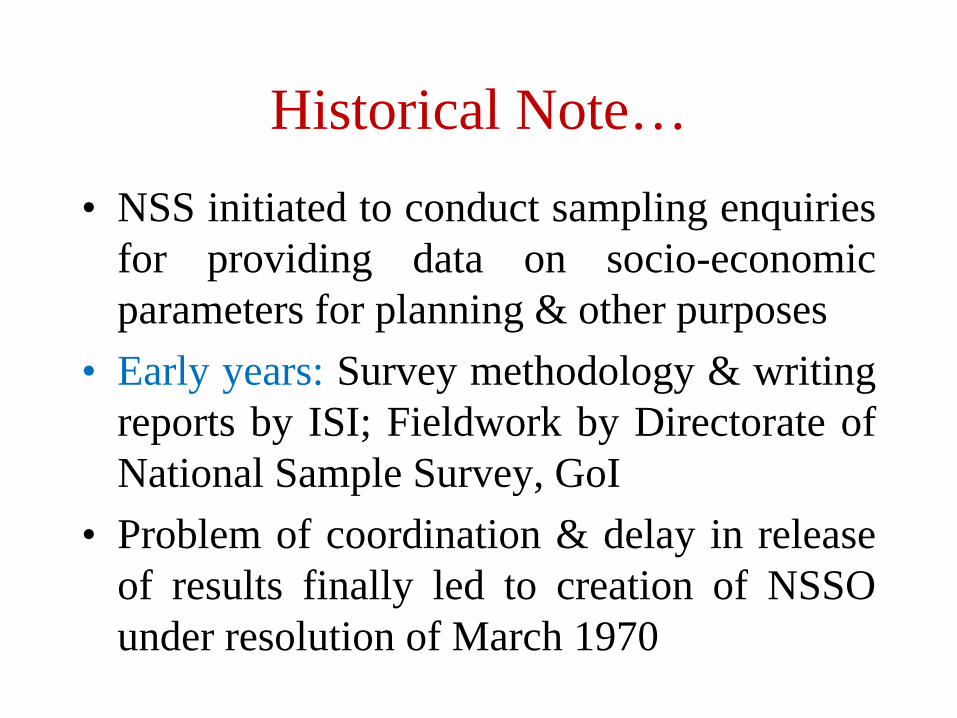
Historical Note…• NSS initiated to conduct sampling enquiries
for providing data on socio-economicparameters for planning & other purposes
• Early years: Survey methodology & writingreports by ISI; Fieldwork by Directorate ofNational Sample Survey, GoI
• Problem of coordination & delay in releaseof results finally led to creation of NSSOunder resolution of March 1970
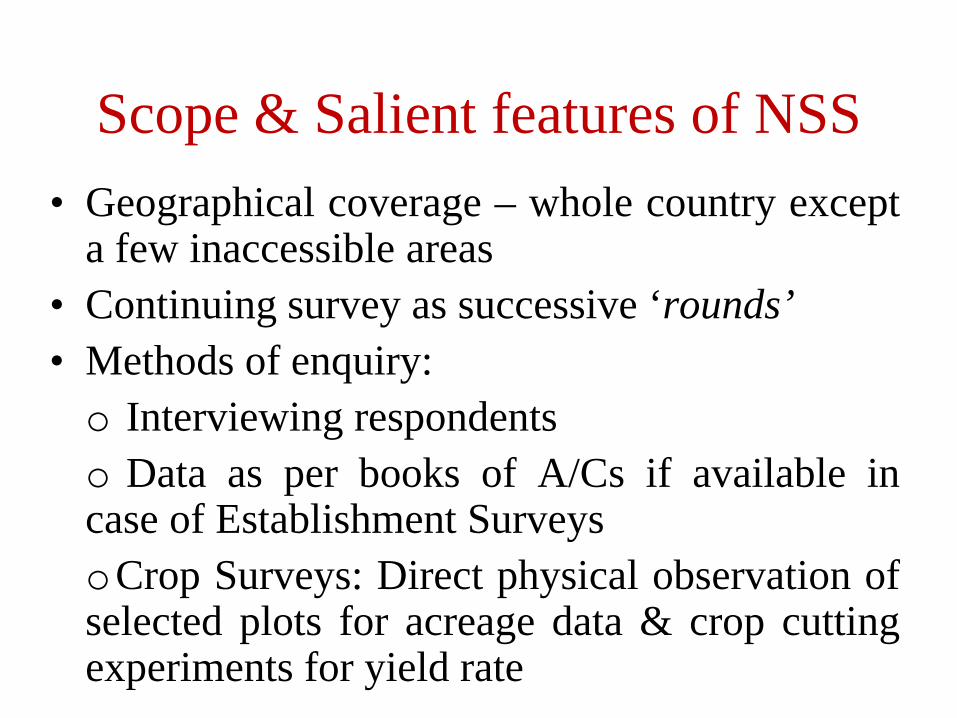
Scope & Salient features of NSS• Geographical coverage – whole country except
a few inaccessible areas• Continuing survey as successive ‘rounds’• Methods of enquiry:o Interviewing respondentso Data as per books of A/Cs if available incase of Establishment SurveysoCrop Surveys: Direct physical observation ofselected plots for acreage data & crop cuttingexperiments for yield rate

Scope & Salient features…
• Multiplicity of subjects in a round ratherthan uni-subject surveys => Advantages:oBetter utilization of resources consideringtime of journey, camp setting,...o Increased sample size of PSUs withimproved precision of estimates
(Precautions taken: Not so many subjects in a roundthat would complicate sample design & overburden theinvestigators)

Scope & Salient features…• Moving reference period (day/week/month/
year) – To reduce recall error and eliminate the effect ofseasonality
• Survey duration mostly of one year / sixmonths – Samples drawn in the form of sub-rounds;uniform spread of fieldwork within the sub-round
• Participation by States at least on an equalmatching sample basis – Independent estimate asper ‘state sample’ as cross-check; Advantage of pooling
• Independent sub-samples – Easy computation ofstandard errors of estimates even in a complex design
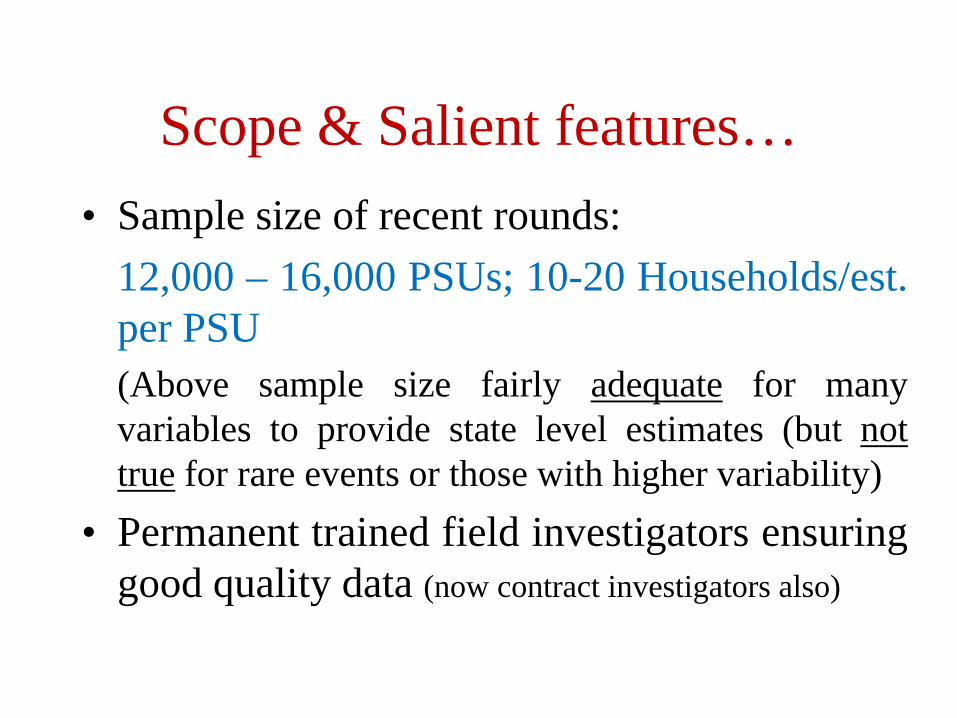
Scope & Salient features…• Sample size of recent rounds:
12,000 – 16,000 PSUs; 10-20 Households/est.per PSU(Above sample size fairly adequate for manyvariables to provide state level estimates (but nottrue for rare events or those with higher variability)
• Permanent trained field investigators ensuringgood quality data (now contract investigators also)
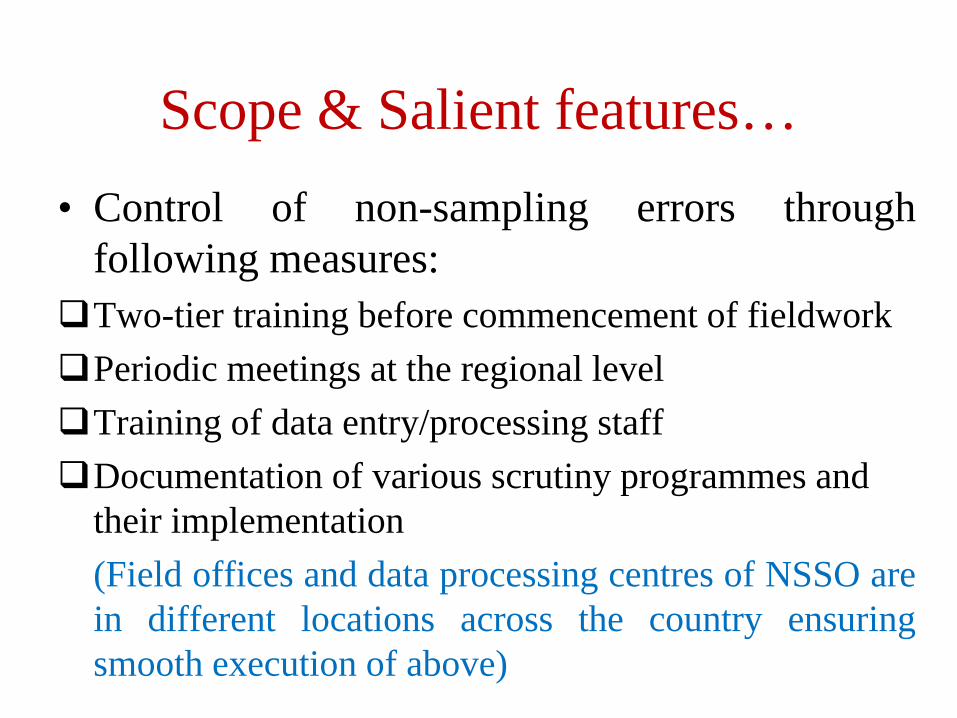
Scope & Salient features…• Control of non-sampling errors through
following measures:Two-tier training before commencement of fieldworkPeriodic meetings at the regional levelTraining of data entry/processing staffDocumentation of various scrutiny programmes and
their implementation(Field offices and data processing centres of NSSO arein different locations across the country ensuringsmooth execution of above)

Scope & Salient features…• Field offices at various locations (HQ /
Regional Offices / Sub-regional Offices)• Senior officials involved in centralized
training to discuss concepts, definitions andschedules of enquiry as in detailedInstructions Manual
• Followed by regional level trainings onsurvey methodology & data validation rules
• Field inspection• Feedback sessions
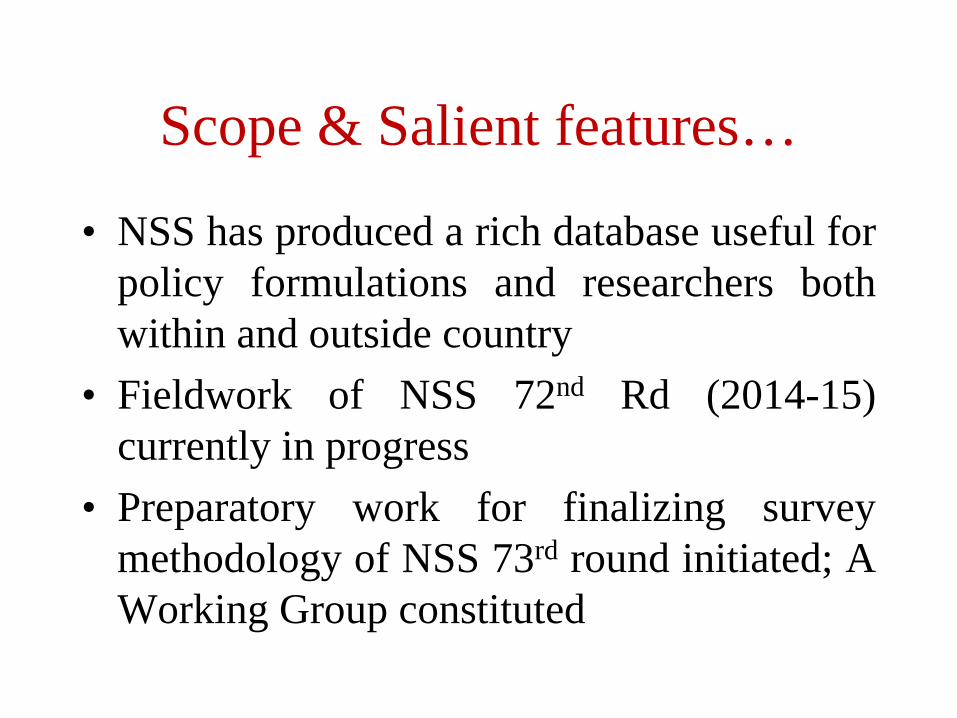
Scope & Salient features…
• NSS has produced a rich database useful forpolicy formulations and researchers bothwithin and outside country
• Fieldwork of NSS 72nd Rd (2014-15)currently in progress
• Preparatory work for finalizing surveymethodology of NSS 73rd round initiated; AWorking Group constituted
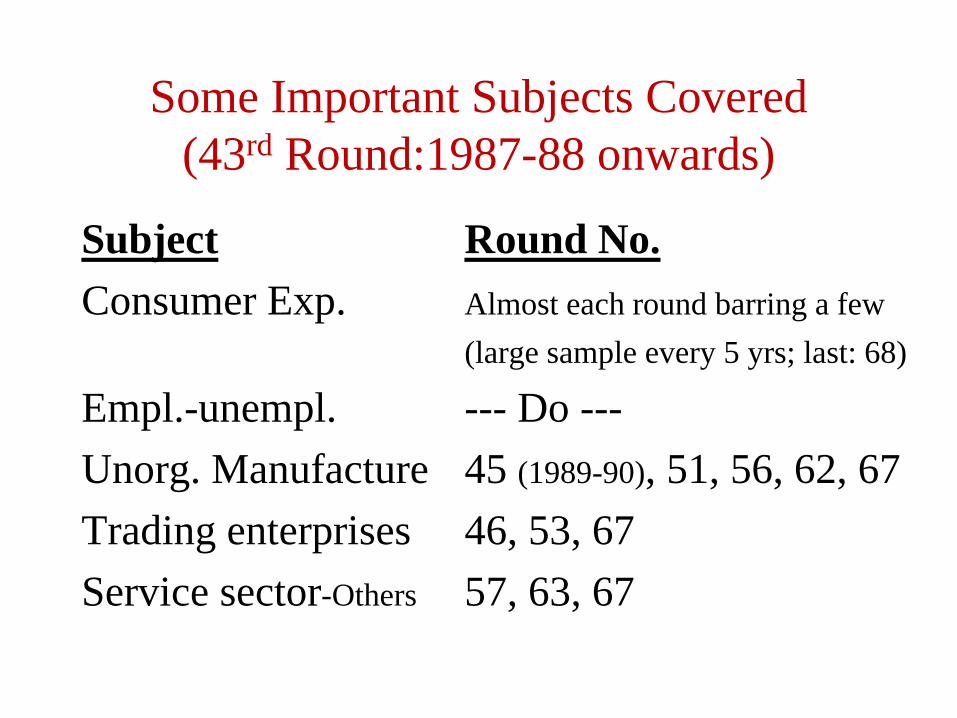
Some Important Subjects Covered (43rd Round:1987-88 onwards)
Subject Round No.Consumer Exp. Almost each round barring a few
(large sample every 5 yrs; last: 68)
Empl.-unempl. --- Do ---Unorg. Manufacture 45 (1989-90), 51, 56, 62, 67Trading enterprises 46, 53, 67Service sector-Others 57, 63, 67
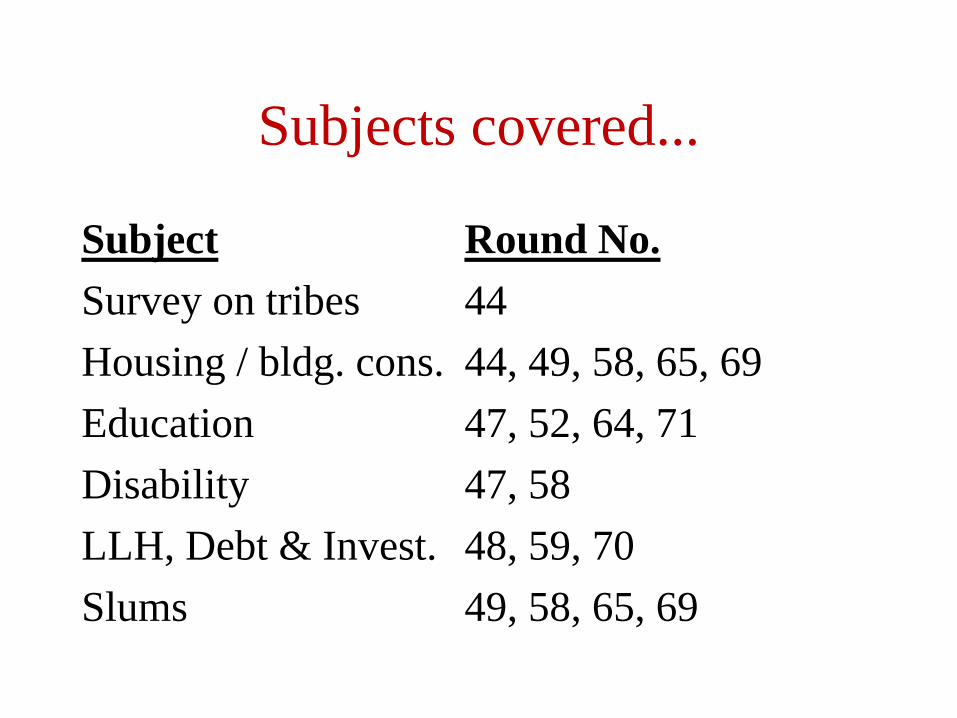
Subjects covered...
Subject Round No.Survey on tribes 44Housing / bldg. cons. 44, 49, 58, 65, 69Education 47, 52, 64, 71Disability 47, 58LLH, Debt & Invest. 48, 59, 70 Slums 49, 58, 65, 69

Subjects covered...
Subject Round No.Health care 52, 60, 71CPR 54Travel habit 43, 54, 65, 72Migration 43, 49, 55, 64Aged persons 42, 52, 58, 60Indian farmers 59, 70

Other important subjects covered earlier
• Vital statistics (9, 12)• Population, births & deaths (14-23, 28, 38, 39)
• Agriculture & animal husbandry (1-7, 11)• Crop cutting experiments (10-26)• Village statistics (Frequently covered earlier but now
with less frequency)
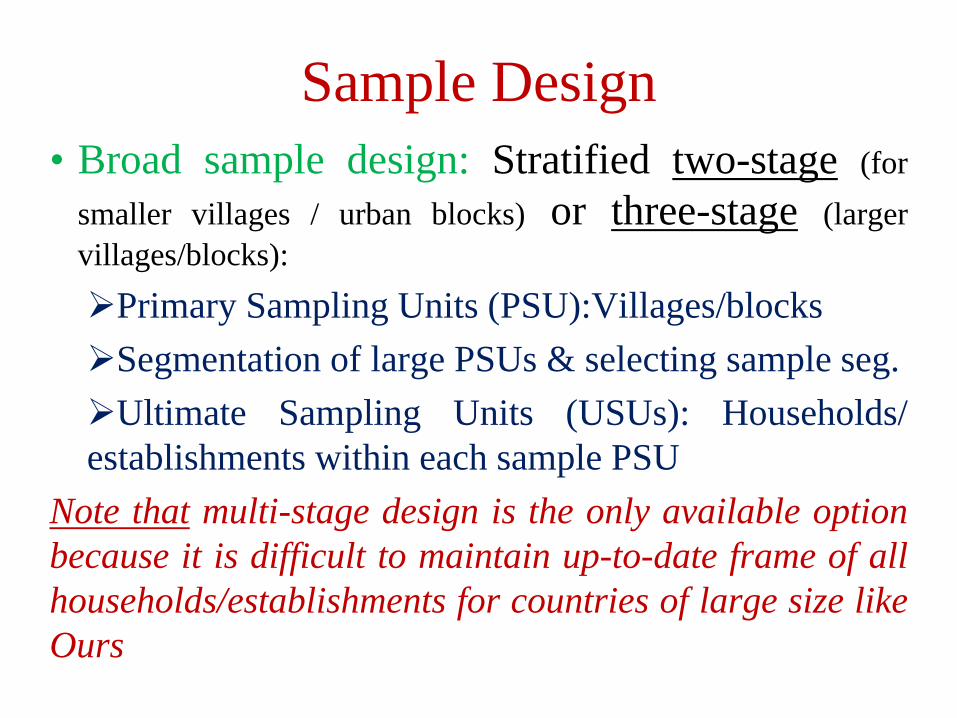
Sample Design• Broad sample design: Stratified two-stage (for
smaller villages / urban blocks) or three-stage (largervillages/blocks):Primary Sampling Units (PSU):Villages/blocksSegmentation of large PSUs & selecting sample seg.Ultimate Sampling Units (USUs): Households/establishments within each sample PSU
Note that multi-stage design is the only available optionbecause it is difficult to maintain up-to-date frame of allhouseholds/establishments for countries of large size likeOurs
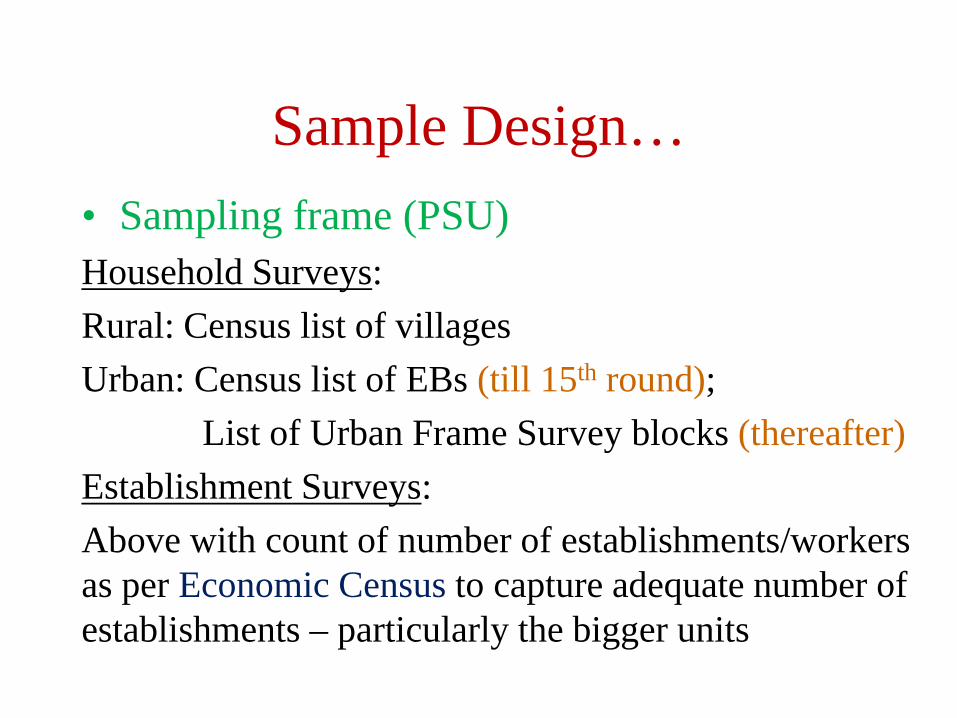
Sample Design…• Sampling frame (PSU)Household Surveys:Rural: Census list of villages Urban: Census list of EBs (till 15th round);
List of Urban Frame Survey blocks (thereafter)Establishment Surveys:Above with count of number of establishments/workers as per Economic Census to capture adequate number of establishments – particularly the bigger units
Sample Design…
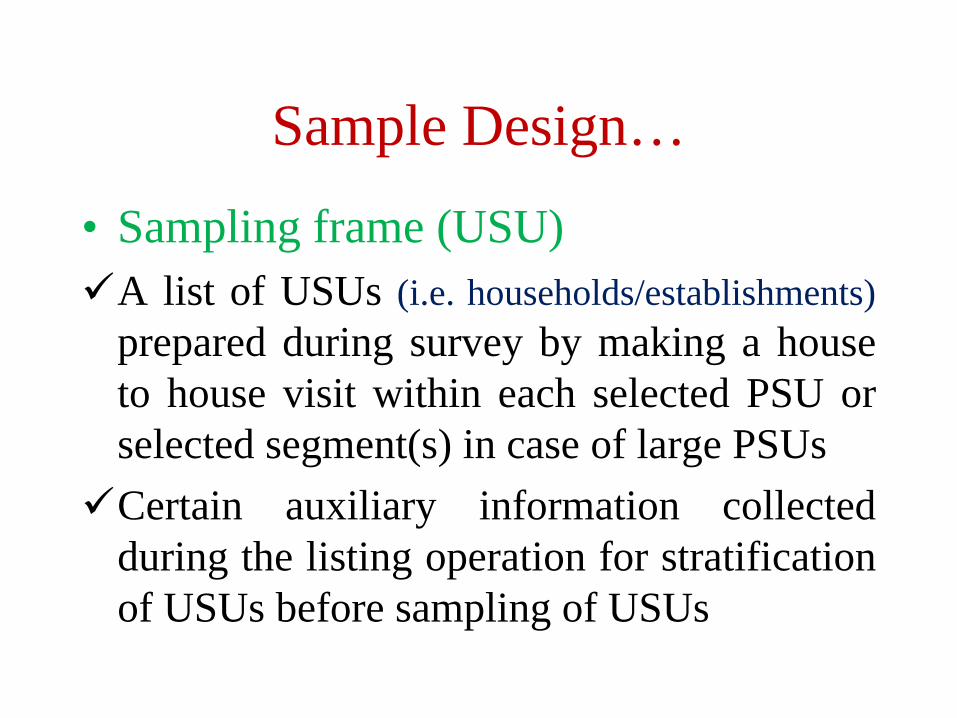
• Sampling frame (USU)A list of USUs (i.e. households/establishments)
prepared during survey by making a houseto house visit within each selected PSU orselected segment(s) in case of large PSUsCertain auxiliary information collected
during the listing operation for stratificationof USUs before sampling of USUs
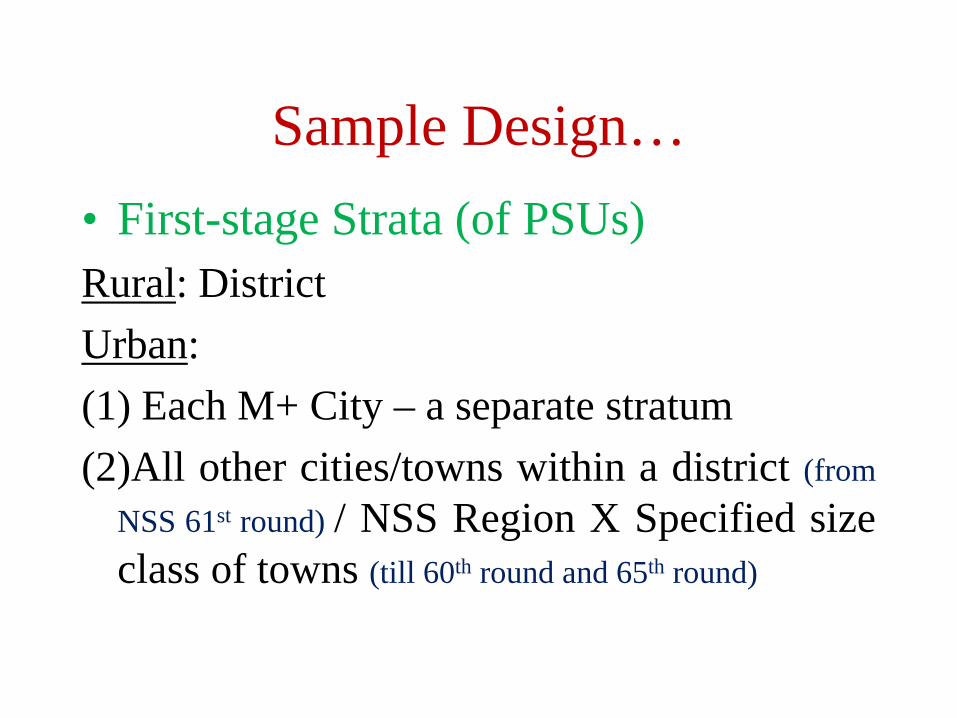
Sample Design…• First-stage Strata (of PSUs)Rural: DistrictUrban:(1) Each M+ City – a separate stratum(2)All other cities/towns within a district (from
NSS 61st round) / NSS Region X Specified sizeclass of towns (till 60th round and 65th round)

Sample Design…• Sampling ProcedurePSUs:Rural – Probability proportional to size (PPS)Urban – Equal probability (PPS in
Establishment Surveys with use of EC frame)[Size measure in case of PPS: Population in HH Survey; No. of workers as
per EC in Establishment Survey]
USUs:Equal probability after appropriate stratification ofhouseholds/establishments into a certain number ofhomogeneous groups i.e. strata

A Few Examples of Stratification of HHSubject Round StratificationDomestic Tourism
65 Rural: Structure type (Pucca / No pucca) x At least one member with overnight trip / Same day trip during last 30 daysUrban: MPCE class in place of structure
Housing Condition
65 Rural: Pucca/Semi-P/OthersUrban: MPCE Class
A Few Examples of Stratification of HH
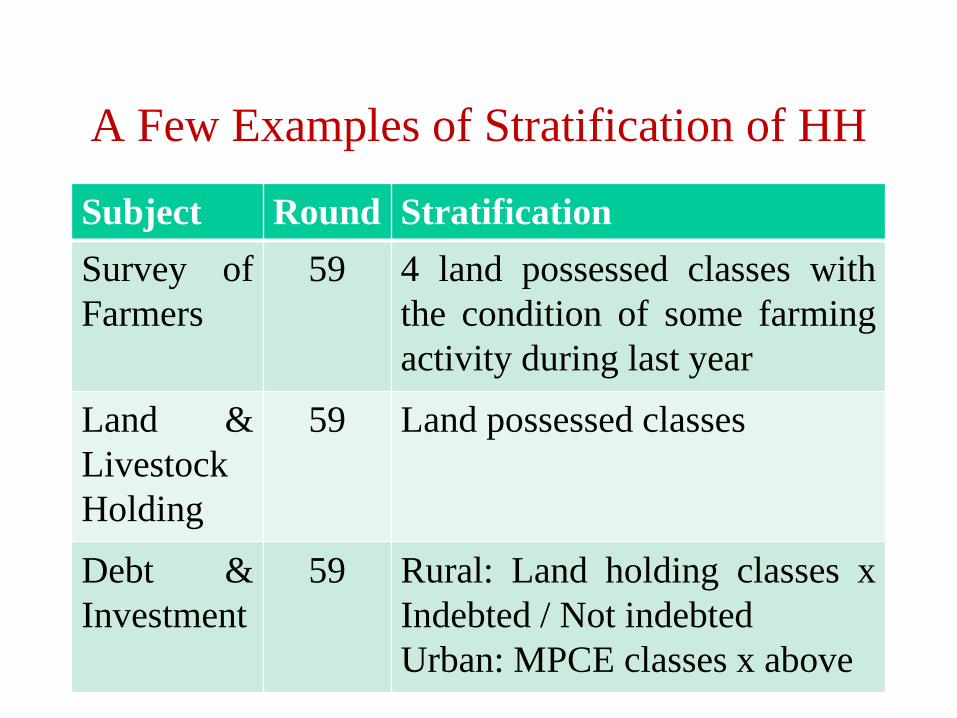
Subject Round StratificationSurvey ofFarmers
59 4 land possessed classes withthe condition of some farmingactivity during last year
Land &LivestockHolding
59 Land possessed classes
Debt &Investment
59 Rural: Land holding classes xIndebted / Not indebtedUrban: MPCE classes x above

A Few Examples of Stratification of HH
Subject Round StratificationDisability 58 Mental disability (1);
Speech/Hearing/Visual (2);Locomotor (3)
Morbidity, Health Care & Condition of the Aged
60 A member hospitalizedduring last 365 days (1);One child of age < 5 yrs (2);One member og age 60+ (3);Remaining HHs
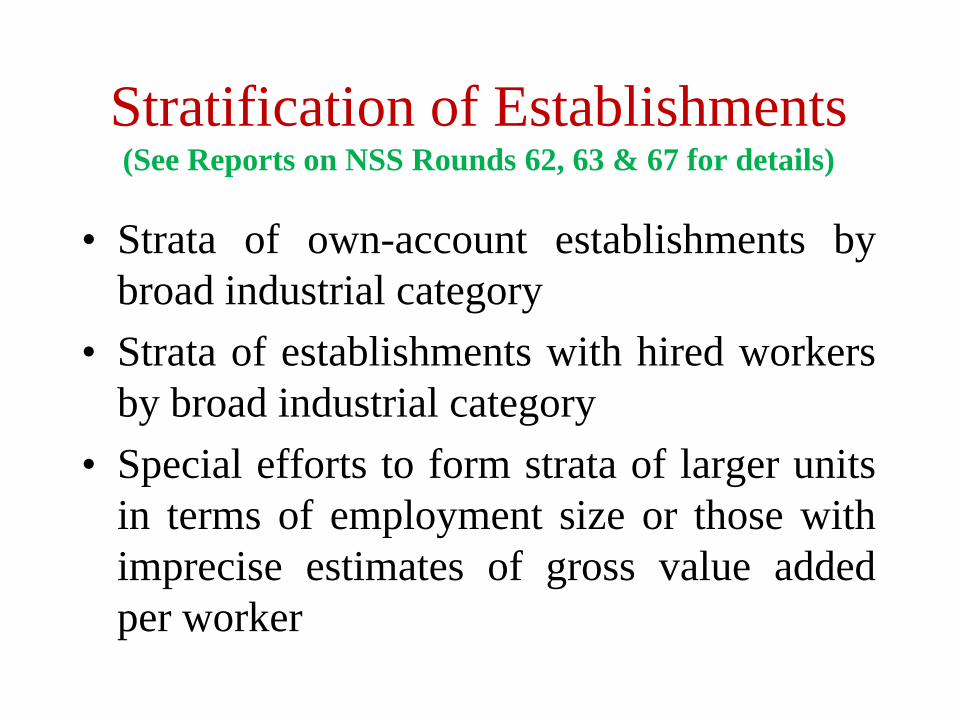
Stratification of Establishments(See Reports on NSS Rounds 62, 63 & 67 for details)
• Strata of own-account establishments bybroad industrial category
• Strata of establishments with hired workersby broad industrial category
• Special efforts to form strata of larger unitsin terms of employment size or those withimprecise estimates of gross value addedper worker

Stratification in Annual Survey of Industries
• ASI covers registered manufacturing sector• Units in frame grouped into 2 categories:
Census sector (bigger units; W: 100+)Sample sector (other units)
• Sample sector units stratified by State/DistrictX Industry groups
• Sample units selected from each stratum bycircular systematic sampling after arrangingthem by number of workers
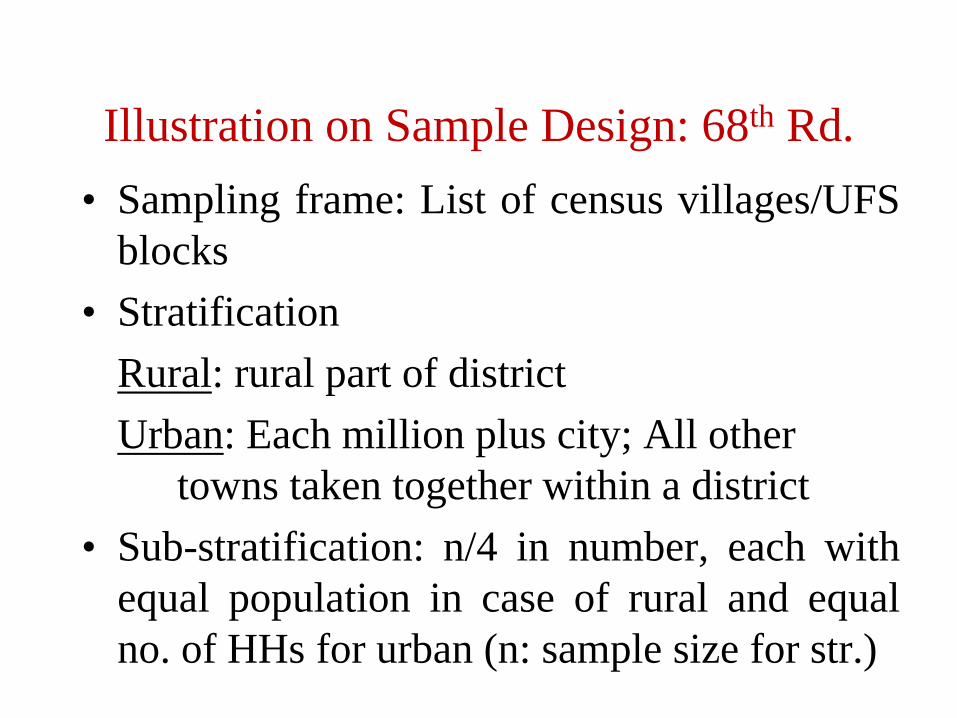
Illustration on Sample Design: 68th Rd. • Sampling frame: List of census villages/UFS
blocks• Stratification
Rural: rural part of districtUrban: Each million plus city; All other
towns taken together within a district• Sub-stratification: n/4 in number, each with
equal population in case of rural and equalno. of HHs for urban (n: sample size for str.)
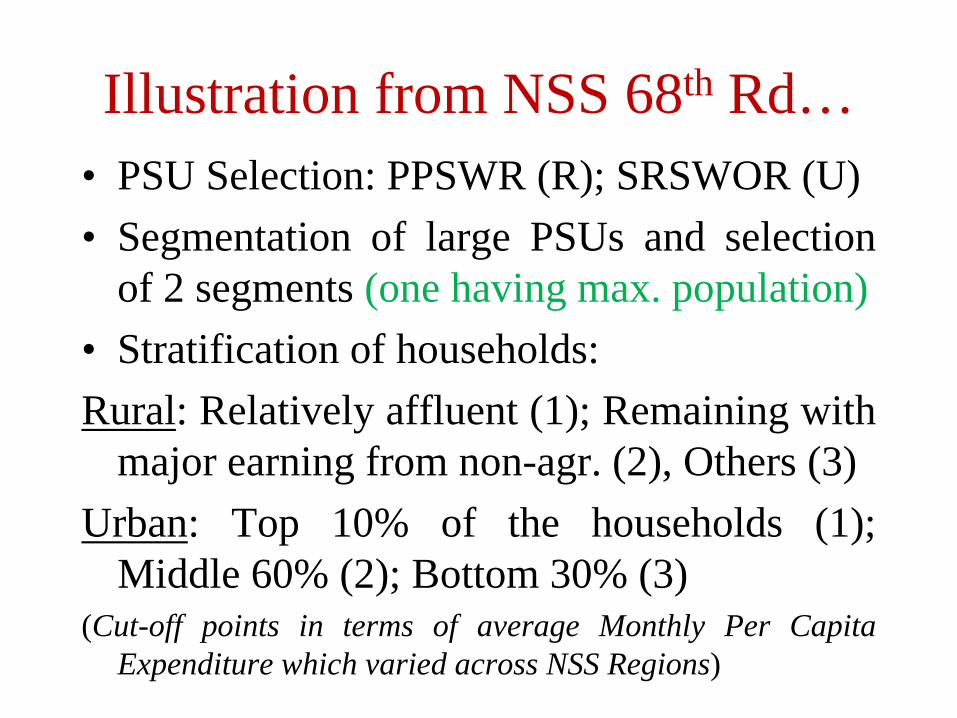
Illustration from NSS 68th Rd…• PSU Selection: PPSWR (R); SRSWOR (U)• Segmentation of large PSUs and selection
of 2 segments (one having max. population)• Stratification of households:Rural: Relatively affluent (1); Remaining with
major earning from non-agr. (2), Others (3)Urban: Top 10% of the households (1);
Middle 60% (2); Bottom 30% (3)(Cut-off points in terms of average Monthly Per Capita
Expenditure which varied across NSS Regions)
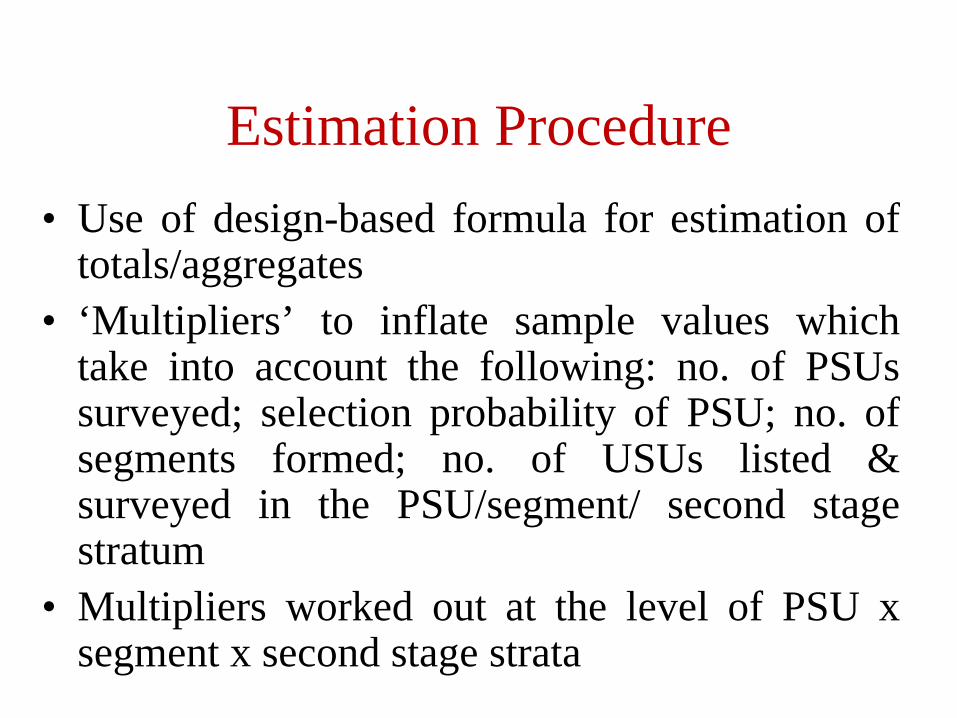
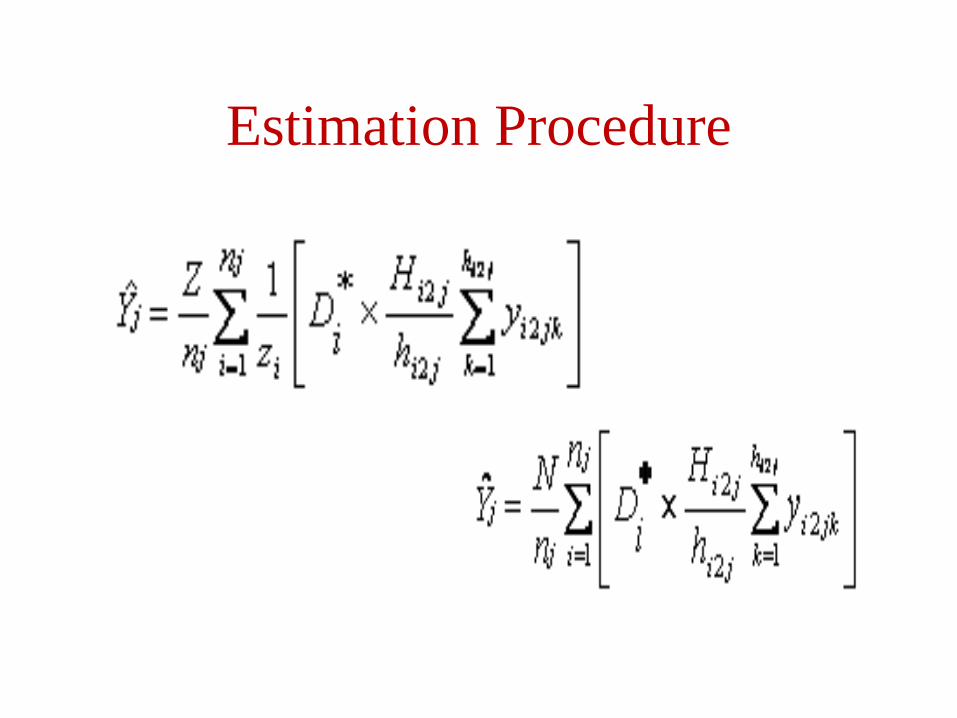
Estimation Procedure• Use of design-based formula for estimation of
totals/aggregates• ‘Multipliers’ to inflate sample values which
take into account the following: no. of PSUssurveyed; selection probability of PSU; no. ofsegments formed; no. of USUs listed &surveyed in the PSU/segment/ second stagestratum
• Multipliers worked out at the level of PSU xsegment x second stage strata
Estimation Procedure
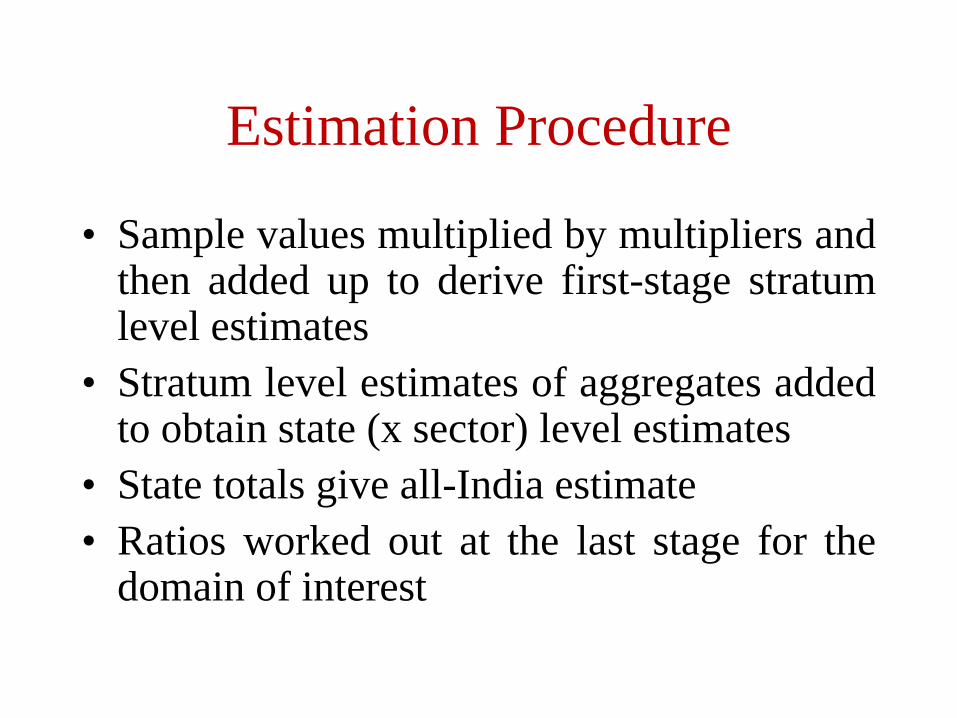
• Sample values multiplied by multipliers andthen added up to derive first-stage stratumlevel estimates
• Stratum level estimates of aggregates addedto obtain state (x sector) level estimates
• State totals give all-India estimate• Ratios worked out at the last stage for the
domain of interest
Estimation Procedure
Major Refinements in Sample Design
Overall sampling strategy broadly remainedthe same over NSS Rounds but certainrefinements incorporated at different points oftime
Some major ones are described in subsequentslides

Major Refinements…• Sample size of PSUs increased manifold over
time (from 1,000 plus in the initial rounds to around 12,000– 14,000 now)
• Urban sampling frame of PSUs switched overfrom Census EBs till 15th round to NSSO’slist of UFS blocks due to some shortcomings of EBs
• Economic Census initiated in 1977 to providesampling frame for selecting PSUs in theEstablishment Surveys to ensure adequate no.of units in the sample
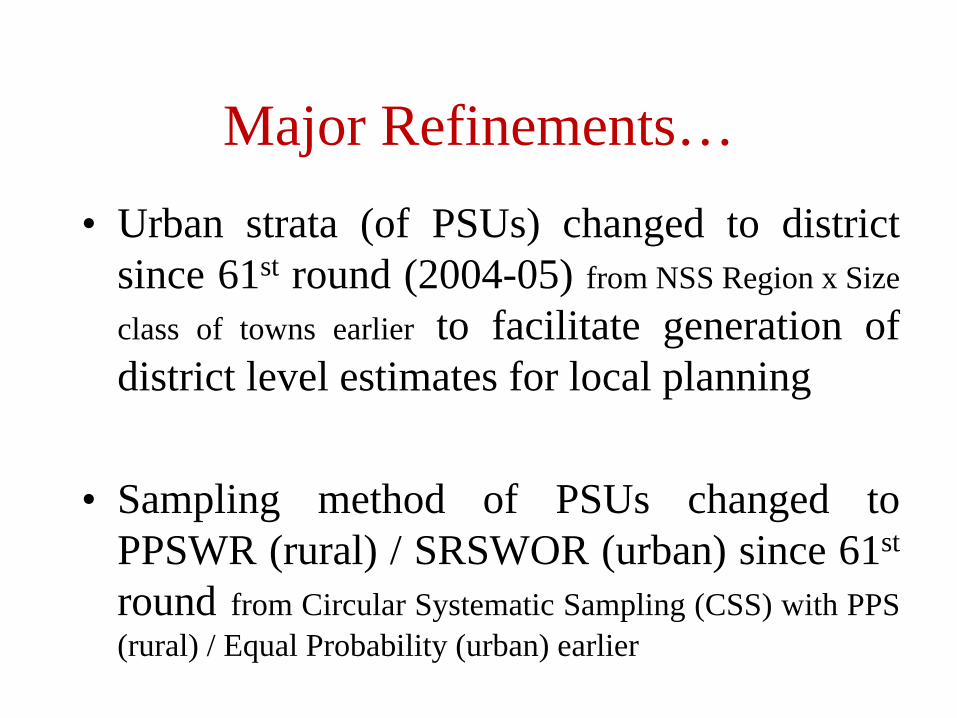
Major Refinements…• Urban strata (of PSUs) changed to district
since 61st round (2004-05) from NSS Region x Sizeclass of towns earlier to facilitate generation ofdistrict level estimates for local planning
• Sampling method of PSUs changed toPPSWR (rural) / SRSWOR (urban) since 61st
round from Circular Systematic Sampling (CSS) with PPS(rural) / Equal Probability (urban) earlier
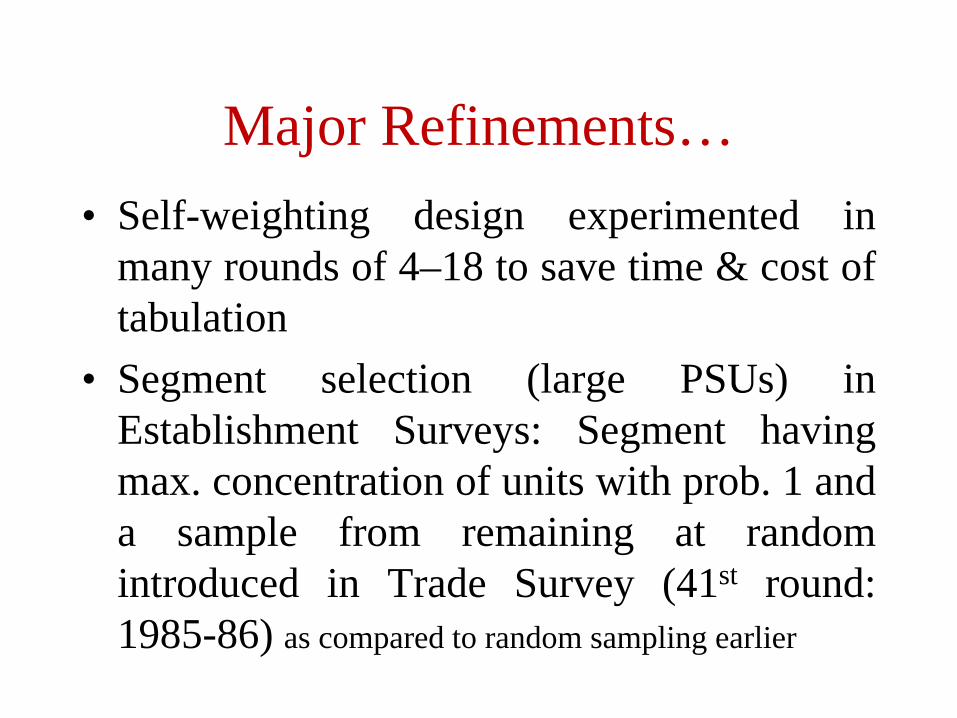
Major Refinements…• Self-weighting design experimented in
many rounds of 4–18 to save time & cost oftabulation
• Segment selection (large PSUs) inEstablishment Surveys: Segment havingmax. concentration of units with prob. 1 anda sample from remaining at randomintroduced in Trade Survey (41st round:1985-86) as compared to random sampling earlier
Major Refinements…
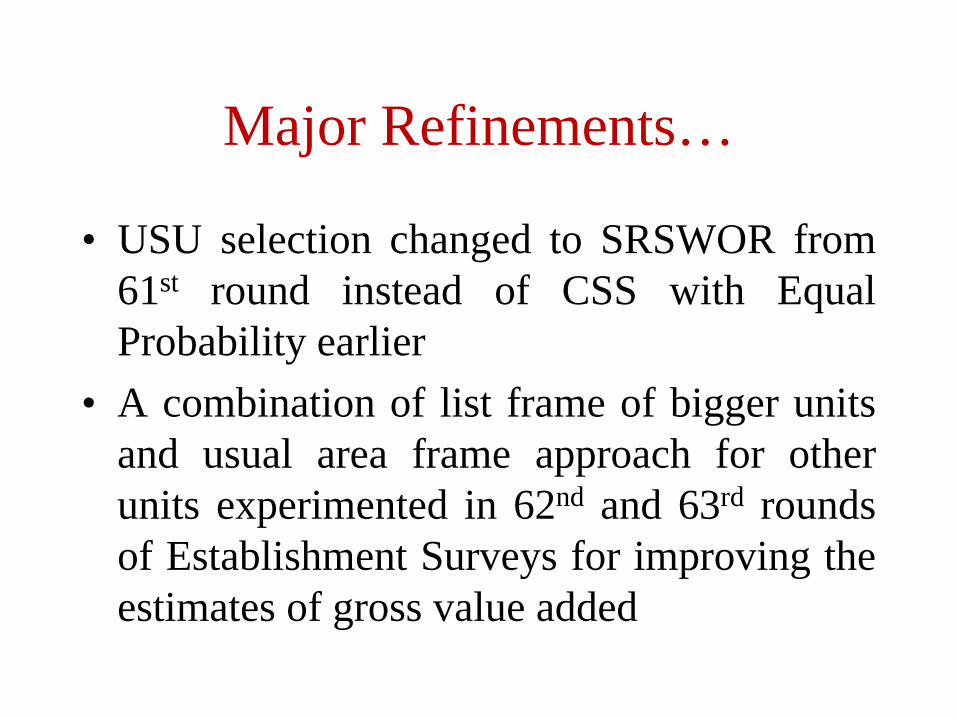
• USU selection changed to SRSWOR from61st round instead of CSS with EqualProbability earlier
• A combination of list frame of bigger unitsand usual area frame approach for otherunits experimented in 62nd and 63rd roundsof Establishment Surveys for improving theestimates of gross value added

Schedules of Enquiry• Listing Schedule [for (a) listing of all USUs i.e.
households or establishments, as the case may be,in the selected PSU/Segment through a house-to-house visit; (b) collecting some auxiliaryinformation at the household level forstratification; (c) grouping the USUs into a certainno. of strata; and (d) sampling of USUs]
• Detailed Schedule of Enquiry to collectinformation at the household or establishmentlevel
Structure of Detailed Schedule
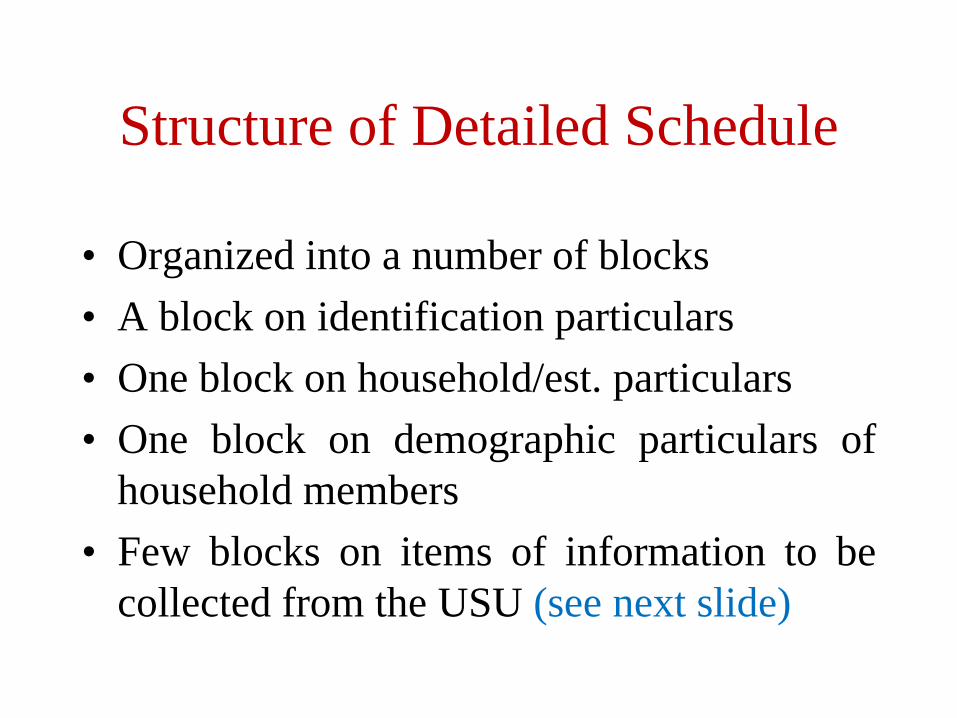
• Organized into a number of blocks• A block on identification particulars• One block on household/est. particulars• One block on demographic particulars of
household members• Few blocks on items of information to be
collected from the USU (see next slide)

Structure of Detailed Schedule…Examples:A. Household Consumer expenditure:Blocks on: Food; Non-food: Clothing &
bedding, Footwear, Durables, … (withappropriate reference periods)
B. Establishment Surveys:Blocks on Fixed assets, Employment &
compensation, Expenses, Receipts, Loan,…(with appropriate reference periods)
[See for details: Survey Reports/ NSSO/www.mospi.gov.in]
Uses of Data
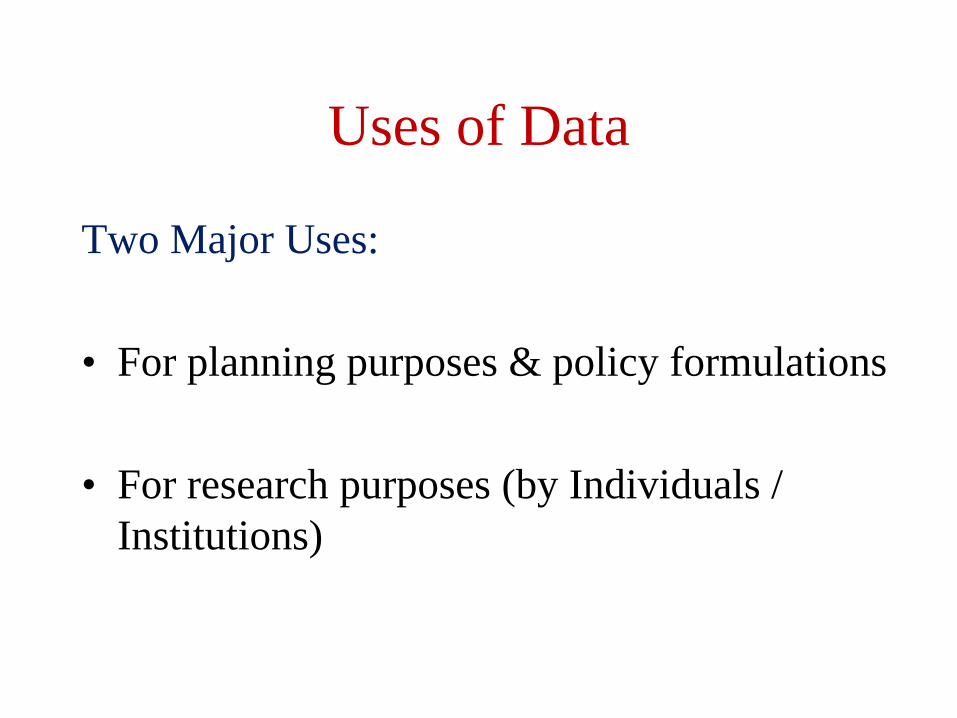
Two Major Uses:
• For planning purposes & policy formulations
• For research purposes (by Individuals / Institutions)
Uses of Data…NSS Survey on Household Consumer Expenditure:• Percentage distribution of persons by average
monthly per capita expenditure (MPCE) class asper the survey used to arrive at Head CountRatio (HCR) i.e. proportion of persons below thepoverty line (poor) for different states/UTs
[This survey collects information on quantity (for certain items) andvalue of household consumption of different items of consumptionas per certain reference periods; It is used to derive aggregate andper capita consumption]
Uses of Data…NSS Survey on Household Consumer Expenditure:• Provides per capita intake of calorie, protein and
fat by Indian people (after appropriately convertingquantities of consumption into calorie, etc.)
• Aggregate consumption figures at the item levelprovides a crosscheck the with the correspondingestimates of private final consumption expenditure(PFCE) alternatively available as per the NationalAccounts of Statistics, to take remedial measures forbridging this divergence

Uses of Data…NSS Survey on Employment-Unemployment• Provides important indicators like Worker
Population Ratio (WPR), Unemployment Rate(UR), Proportion out of Labour Force, etc. inthe country and in its States/UTs
• Size of workforce by industry and occupation,Employment in informal sector and inMGNRGEA, Extent of job creation, Wagerate, Extent of child labor & participation inhazardous activities, etc.

Uses of Data…NSS Survey on Employment-Unemployment..• Worker population ratios (WPR) as per
principal and subsidiary statuses by industryused to derive Labor Input for estimation ofGDP
• Time series data reveal changes in the labormarket situation
Uses of Data…
Annual Survey of Industries (by CSO)• Covers organized manufacturing sector
comprising units having 10 or more workerswith power or 20 or more workers withoutpower (Frame based on list by CIF)
• Estimated gross value added used to assessthe share of organized mfg. sector in GDP
• Time series data => Structural changes

Uses of Data…Establishment Surveys by NSSO• Relative importance of states/UTs in terms of
number of establishments/workers engaged inthe unorganized sector
• Estimates of gross valued added (GVA) perworker used in the estimation of GDP
• Estd. no. of ‘unorganized’ mfg. sector unitswith at least 10 workers give an indication ofthe extent of weakness of ASI frame
Uses of Data…Census-cum-surveys of MSME Units• A useful source to assess the size of MSME
sector and its composition by industry• Gross value of output (GVO) by the mfg.
units in the MSME sector coupled with GVAto GVO ratio from NSSO’s EstablishmentSurvey on Unorganized Manufacture beingused in the National Accounts to arrive atGDP by MSME component of Unorg. Mfg.

Uses of Data…Other Important Household Survey of NSS having uses for planning purposes• Situation Assessment Survey of Farmers • Housing Condition• Social Consumption (Healthcare, Education)• Disability• Aged Persons & Their Living Conditions• Land & livestock holdings, Debt & investment

Thank You