conduit hydropower potential in city’s wds p1-1 gds 2055 workshop conduit hydropower potential in...
TRANSCRIPT

Conduit Hydropower Potential in City’s WDS
P1-1
GDS 2055 workshop
Conduit Hydropower Potential in City’s Water Distribution System

Conduit Hydropower Potential in City’s WDS
P1-2
Intro
CHP in City’s WDS
Title: Energy generation from distribution systems
Period: 2 years
Funding: Water Research Commission with a number of collaborating organisations

Conduit Hydropower Potential in City’s WDS
P1-3
• What is conduit hydropower?• Description• Identifying potential sites• Potential sites in Tshwane • PvRCHP• Feasibility• Way forward
Layout of the presentation
CHP in City’s WDS

Conduit Hydropower Potential in City’s WDS
• Conduit hydropower is where excess energy available in pressurised conduits (pumping or gravity) is transformed into clean, renewable hydroelectric energy by means of a turbine.
• The excess energy is normally dissipated by means of pressure control valves but by conveying it through a parallel dissipating system, the water turbine, the pressure head and flow is utilized to generate hydroelectric power.
What is conduit hydropower?
P1-4CHP in City’s WDS
Conduit Hydropower Potential in City’s WDS
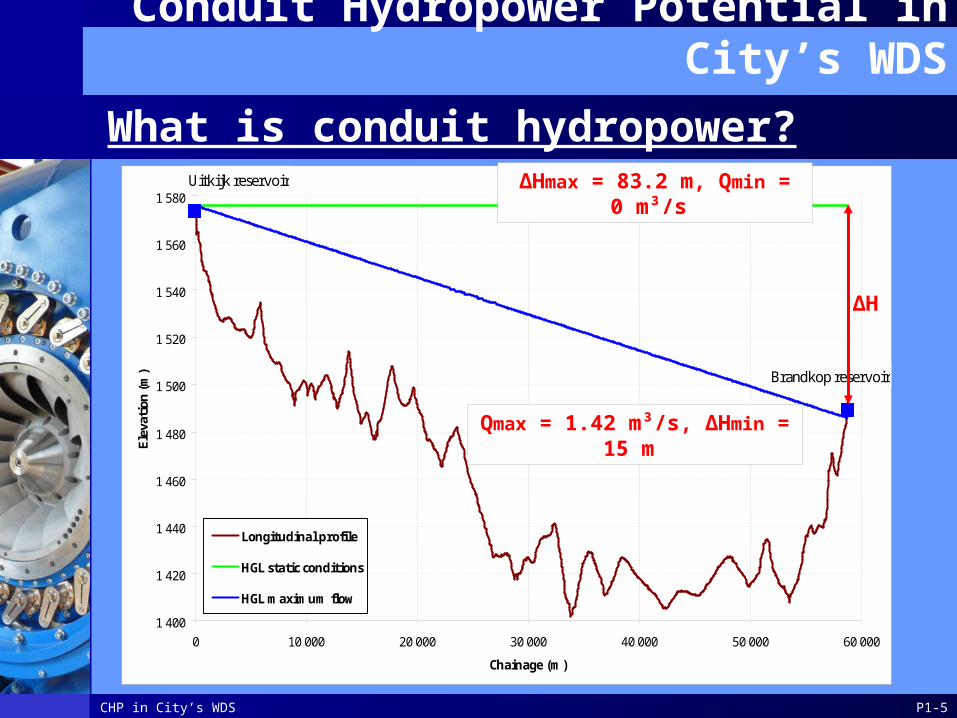
What is conduit hydropower?
P1-5
Uitkijk reservoir
Brandkop reservoir
1 400
1 420
1 440
1 460
1 480
1 500
1 520
1 540
1 560
1 580
0 10 000 20 000 30 000 40 000 50 000 60 000
Chainage (m)
Ele
vati
on (
m)
Longitudinal profile
HGL static conditions
HGL maximum flow
ΔHmax = 83.2 m, Qmin = 0 m³/s
Qmax = 1.42 m³/s, ΔHmin = 15 m
ΔH
CHP in City’s WDS

Conduit Hydropower Potential in City’s WDS
What is conduit hydropower?
P1-6
Uitkijk reservoir
Brandkop reservoir
1 400
1 420
1 440
1 460
1 480
1 500
1 520
1 540
1 560
1 580
0 10 000 20 000 30 000 40 000 50 000 60 000
Chainage (m)
Ele
vati
on (
m)
Longitudinal profile
HGL static conditions
HGL maximum flow
When flowing at 70% of design capacity ΔH70% = 47.1 m, Q70% = 1.0 m³/s
CHP in City’s WDS

Conduit Hydropower Potential in City’s WDS
“Conduit hydropower” – energy generated from pressurised conduits
Description
P1-7CHP in City’s WDS

Conduit Hydropower Potential in City’s WDS
Drivers for a municipality to consider “conduit hydropower”:
– Renewable energy source– Rising energy costs– Reduced revenues– Financial incentives– Public perception– Job creation– Extending the operational life of control valves– Remote power (alarms, communications etc.)
Description
P1-8CHP in City’s WDS

Conduit Hydropower Potential in City’s WDS
P1-9
• Q, H, generation time and assurance of supply
• Accessible?• Reservoir storage to accommodate
fluctuating demands• Generated electricity consumption?• Bypass alternative• Safety mechanisms• Feasibility
Identifying potential sites
CHP in City’s WDS

Conduit Hydropower Potential in City’s WDS
P1-10
Potential sites in Tshwane
Geographically speaking the City of Tshwane has a lower elevation then the bulk service Reservoirs of Rand Water which is the main water supply.
Water is then distributed through a large water system that includes 160 reservoirs, 42 water towers, 10677 km of pipes and more than 260 pressure reducing installations (PRV’s) that operates at pressures of up to 250 m.
CHP in City’s WDS

Conduit Hydropower Potential in City’s WDS
P1-11
Potential sites in Tshwane
CHP in City’s WDS

Conduit Hydropower Potential in City’s WDS
P1-12
Potential sites in Tshwane
Reservoirs
TWL(m.asl)
Capacity(kl)
Pressure(m)
Flow(l/s)
YearlyPotential power
generation (kWh) #
Garsfontein 1 508.4 60 000 165 1850 3 278 980
Wonderboom 1 351.8 22 750 256 470 1 292 471
Heights LL 1 469.6 55 050 154 510 843 673
Heights HL 1 506.9 92 000 204 340 745 062
Soshanguve DD 1 249.5 40 000 168 400 721 859
Waverley HL 1 383.2 4 550 133 505 721 483
Akasia 1 413.8 15 000 190 340 693 930
Clifton 1 506.4 27 866 196 315 663 208
Magalies 1 438.0 51 700 166 350 624 107
Montana 1 387.6 28 000 82 463 407 829
Total calculated yearly power generation in Tshwane from 10 reservoirs - (Nearest 10 000 kWh)
10 000 000
CHP in City’s WDS