confidence interval -...
TRANSCRIPT

Confidence Interval
In practice, the population mean (µ) is hardly ever known. We normally estimate it with a point estimate or an interval estimate. A point estimate is a statistic that estimates a parameter. For example, a sample mean is a point estimate of the parameter population mean (µ). An interval estimate is an interval of values that is believed to contain the population mean. An interval estimate of the population mean (µ) is called a confidence interval. Let's look at an example. Suppose we randomly select 40 SAT math scores and the sample data are as follows: 300 320 350 370 380 380 390 390 400 400 420 430 430 440 450 460 470 470 480 500 540 550 570 590 600 620 650 650 660 670 680 690 700 710 710 720 720 730 730 750 The sample average is 536.75 and sample standard deviation is 140. A point estimate for the population of SAT math scores mean would be 536.75. An interval estimate of the population could be (536.75 - 20, 536.75 + 20) = (516.75, 556.75). Question: Can we an interval that is wider that (516.75, 556.75) so that I can more confident about coming up with an interval estimate that contains the population mean? We can make the interval as wide as you want. For example other possible interval estimates might be: a) (536.75 - 30, 536.75 + 30) = (506.75, 566.75) b) (536.75 - 40, 536.75 + 40) = (496.75, 576.75) c) (536.75 - 50, 536.75 + 50) = (486.75, 586.75) Hence, the wider the interval estimate, the more confident you can be about the population mean lying inside the interval. But note that the wider the interval estimate, the less we can be precise about estimating the population mean. Consequently, when constructing an interval estimate, we have to decide which is more important: level of confidence or precision? To understand the logic behind constructing a confidence interval, we will examine the relationship between sampling distribution and confidence interval.

Sampling Distribution and Confidence Interval
Illustration of 95% Confidence Interval
1 2 3 4 5 kx x x x x x
Underlying Population
mean = and standard deviation =
Sample 1 Sample 2 Sample 3 Sample 4 Sample 5 ...
Sample k ... ...
Calculate
sample
mean for
each sample
Population of Sample Means
1 2 3 4 5 kx x x x x x
mean = = and standard deviation = xn

Confidence interval is defined as follows:
/ 2 / 2Confidence Interval = ,
where sample mean;
= underlying population standard deviation;
= s
x z x zn n
x
n
/ 2
/ 2
ample size;
= z-score corresponding to the percentage of
confidence intervals containing population mean.
z
z
margin of error.n
Hence, confidence interval = sample mean ± margin of error.
For each sample mean x in the sampling population, we can construct a confidence intervals. For 95%
confidence interval, we set / 2z to 1.96. Later on we will see how to figure out the value of
/ 2z for any confidence
interval.
1 1 / 2 1 / 2 1 1
2
Sample Mean Confidence Interval
, = 1.96 , 1.96
x x z x z x xn n n n
x
2 / 2 2 / 2 2 2
3 3 / 2 3 / 2 3 3
, = 1.96 , 1.96
, = 1.96 , 1.96
x z x z x xn n n n
x x z x z x xn n n n
4 4 / 2 4 / 2 4 4
5 5 / 2 5 / 2
, = 1.96 , 1.96
,
x x z x z x xn n n n
x x z x zn n
5 5= 1.96 , 1.96
k
x xn n
x
/ 2 / 2 , = 1.96 , 1.96
k k k kx z x z x xn n n n
We can see that the number of confidence intervals is very large. Some of these confidence intervals contain
the population mean (µ) and some do not. When we construct a confidence interval, we would hope that our
confidence interval contains the population mean.
In practice we do not know if our constructed confidence interval contains the population mean (µ) or not.
We only know what percentage of all possible confidence intervals containing the population mean. The
percentage of confidence intervals that contains the population mean is dictated by the quantity / 2.z
When calculating the value of / 2z , we will assume that the sampling population is approximately normal. In
other words, the sample size is at least 30 or the underlying population is normal.
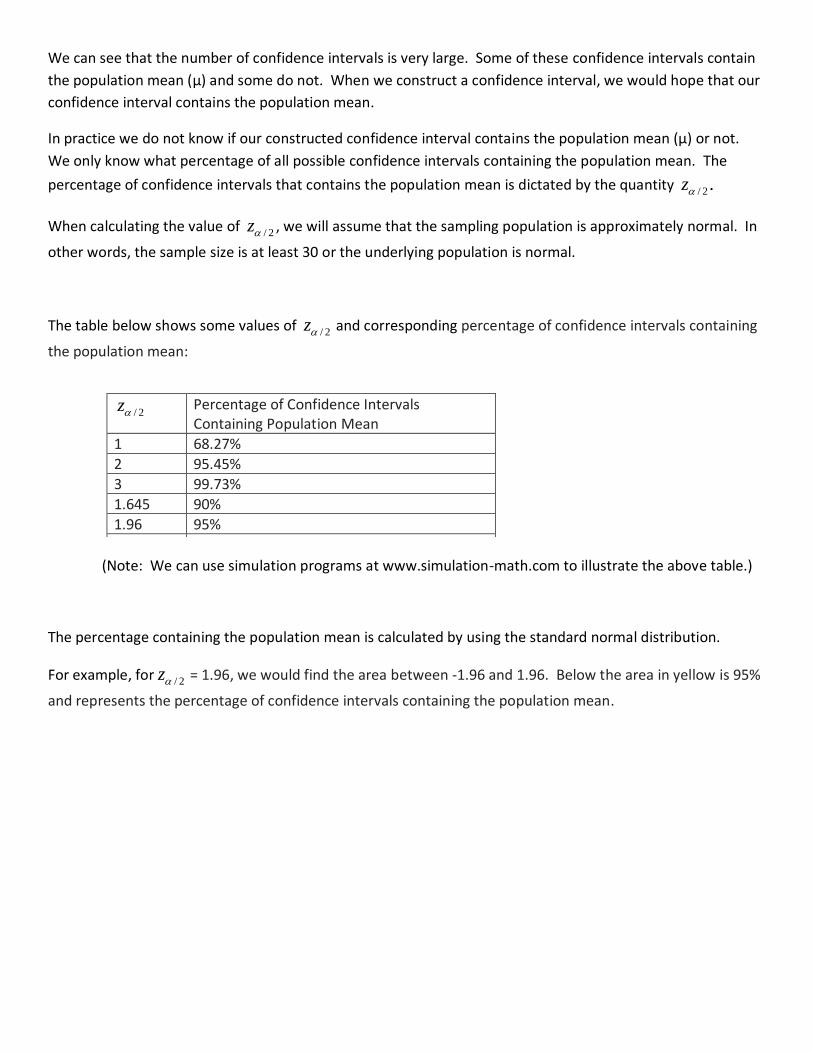
The table below shows some values of / 2z and corresponding percentage of confidence intervals containing
the population mean:
(Note: We can use simulation programs at www.simulation-math.com to illustrate the above table.)
The percentage containing the population mean is calculated by using the standard normal distribution.
For example, for / 2z = 1.96, we would find the area between -1.96 and 1.96. Below the area in yellow is 95%
and represents the percentage of confidence intervals containing the population mean.
/ 2z Percentage of Confidence Intervals Containing Population Mean
1 68.27%
2 95.45%
3 99.73%
1.645 90%
1.96 95%
2.57 99%

We can find the area between -1.96 and 1.96 by using one of the computational tools
at www.simulation-math.com.
Question: What would be an appropriate value for / 2z ?
95%
As / 2z increases, the width of the confidence intervals also increases. That's the reason why, we see that as
/ 2z increases, the percentage of the confidence intervals containing the population mean also increases.
Thus, if we want to have higher percentage of confidence intervals containing the population mean, then we
would choose a large value for / 2z . But note that large value for
/ 2z will lead to wider confidence intervals;
and hence less precision about the estimation of the population mean.
In practice, when we want to do an interval estimate of the population mean, we would specify the what
percentage of the confidence intervals do we want to contain the population mean. Then we have to figure
out the corresponding / 2z .
Suppose we want the percentage containing the population mean to be 95%. Normally we would say we
want to construct a confidence interval with a level of confidence of 95%.
/2
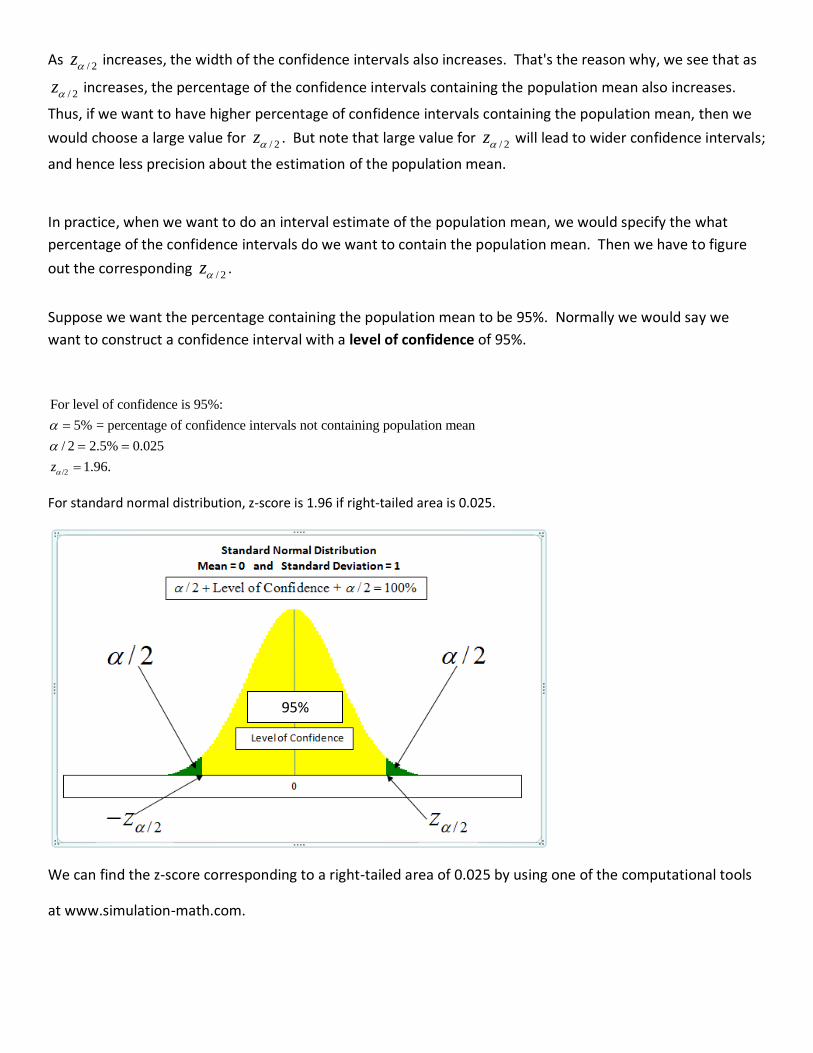
For level of confidence is 95%:
5% = percentage of confidence intervals not containing population mean
/ 2 2.5% 0.025
1.96.z
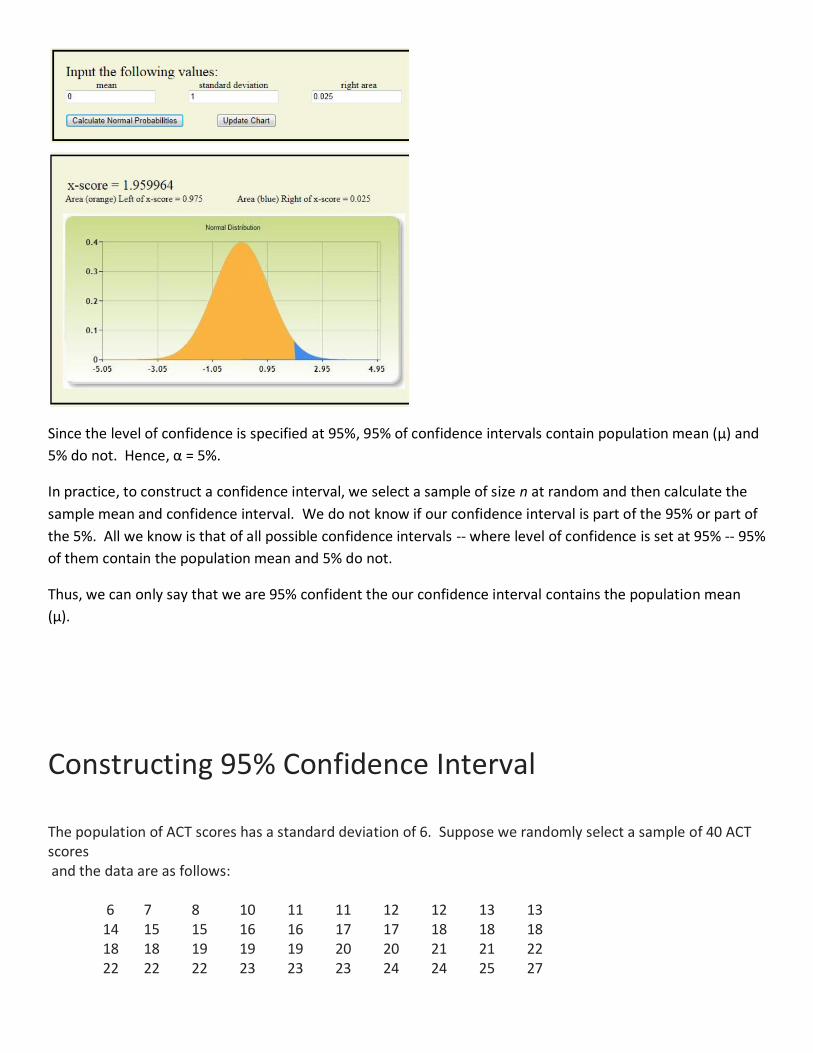
For standard normal distribution, z-score is 1.96 if right-tailed area is 0.025.
We can find the z-score corresponding to a right-tailed area of 0.025 by using one of the computational tools
at www.simulation-math.com.
95%
Since the level of confidence is specified at 95%, 95% of confidence intervals contain population mean (µ) and
5% do not. Hence, α = 5%.
In practice, to construct a confidence interval, we select a sample of size n at random and then calculate the
sample mean and confidence interval. We do not know if our confidence interval is part of the 95% or part of
the 5%. All we know is that of all possible confidence intervals -- where level of confidence is set at 95% -- 95%
of them contain the population mean and 5% do not.
Thus, we can only say that we are 95% confident the our confidence interval contains the population mean
(µ).
Constructing 95% Confidence Interval
The population of ACT scores has a standard deviation of 6. Suppose we randomly select a sample of 40 ACT scores and the data are as follows: 6 7 8 10 11 11 12 12 13 13 14 15 15 16 16 17 17 18 18 18 18 18 19 19 19 20 20 21 21 22 22 22 22 23 23 23 24 24 25 27
Find a confidence interval with a level of confidence of 95%.
Solution:
From the population of ACT scores we can form many, many samples of size 40. One these many, many
samples is:
6 7 8 10 11 11 12 12 13 13 14 15 15 16 16 17 17 18 18 18 18 18 19 19 19 20 20 21 21 22 22 22 22 23 23 23 24 24 25 27
Note: Sample mean = x = 17.48.
For each sample of size 40, a sample mean can be calculated. Hence there are many, many sample means.
For each sample
mean a confidence interval can be formed. Consequently, there are many, many confidence intervals.
Since our level of confidence is set 95%, 95% of all confidence intervals will contain the population mean and
5% of the confidence intervals do not contain the population mean.
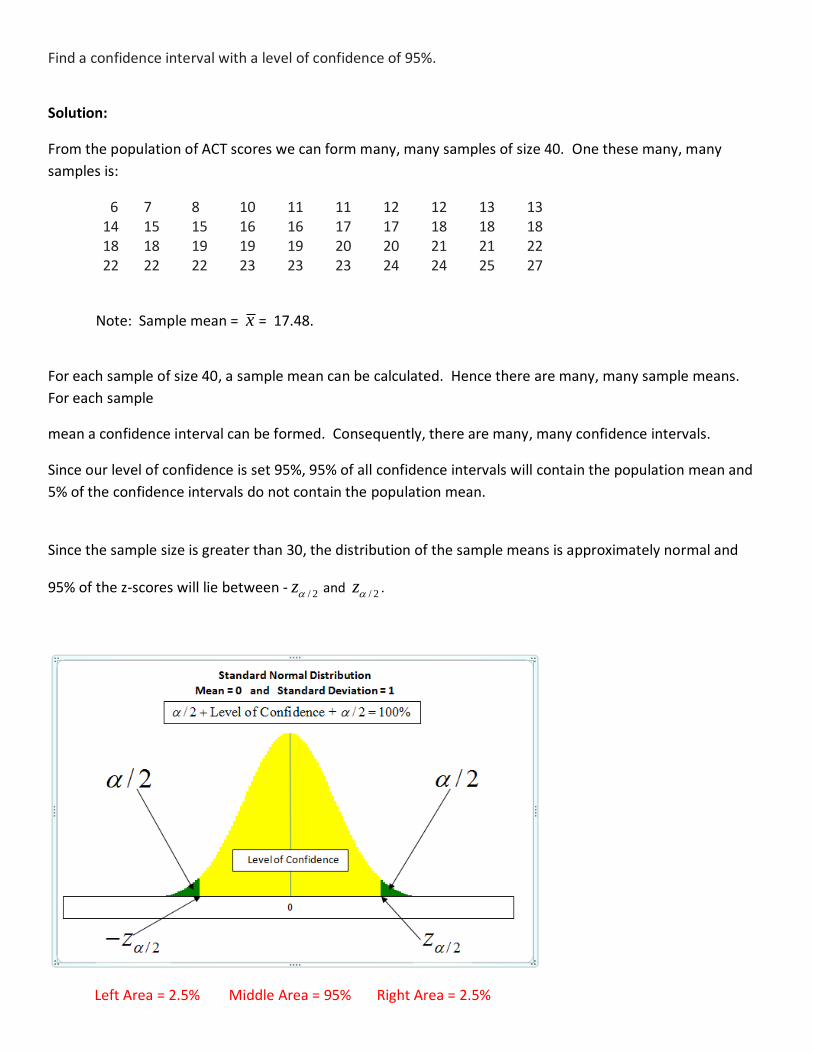
Since the sample size is greater than 30, the distribution of the sample means is approximately normal and
95% of the z-scores will lie between -/ 2z and
/ 2z .
Left Area = 2.5% Middle Area = 95% Right Area = 2.5%

/ 2z is the z-score corresponding to a right area of 0.025. Hence, / 2z = 1.96.
From earlier discussion, a confidence interval has the form:
/ 2 / 2, x z x zn n
where x is the sample mean;
/ 2z is the number of standard error from the population mean;
is the standard deviation of the population of ACT scores;
n is the sample size

Standard Error = n
= 6 0.948640
.
/ 2 / 2Confidence Interval = ,
= 17.48 1.96 0.9486 , 17.48 + 1.96 0.9486
= 15.62, 19.33
x z x zn n
Comments:
We do not know if 15.62, 19.33 contains the population mean or not since this interval is one of many,
many confidence intervals. However, since we know that 95% of the confidence intervals do contain the
population mean, we can be 95% confident that the interval 15.62, 19.33 does contain the population
mean.
Also, the interval 15.62, 19.33 is an interval estimate of the population mean.

Illustration of 99% Confidence Interval
1 2 3 4 5 kx x x x x x
Underlying Population
mean = and standard deviation =
Sample 1 Sample 2 Sample 3 Sample 4 Sample 5 ...
Sample k ... ...
Calculate
sample
mean for
each sample
Population of Sample Means
1 2 3 4 5 kx x x x x x
mean = = and standard deviation = xn

/ 2 / 2Confidence Interval = , x z x zn n
1 1 / 2 1 / 2 1 1
2
Sample Mean Confidence Interval
, = 2.57 , 2.57
x x z x z x xn n n n
x
2 / 2 2 / 2 2 2
3 3 / 2 3 / 2 3 3
, = 2.57 , 2.57
, = 2.57 , 2.57
x z x z x xn n n n
x x z x z x xn n n n
4 4 / 2 4 / 2 4 4
5 5 / 2 5 / 2
, = 2.57 , 2.57
,
x x z x z x xn n n n
x x z x zn n
5 5= 2.57 , 2.57
k
x xn n
x
/ 2 / 2 , = 2.57 , 2.57
k k k kx z x z x xn n n n
/2
For level of confidence of 99%:
1%
/ 2 0.5% 0.005
2.57.z
For standard normal distribution, z-score is 2.57 if right-tailed area is 0.005.
99%
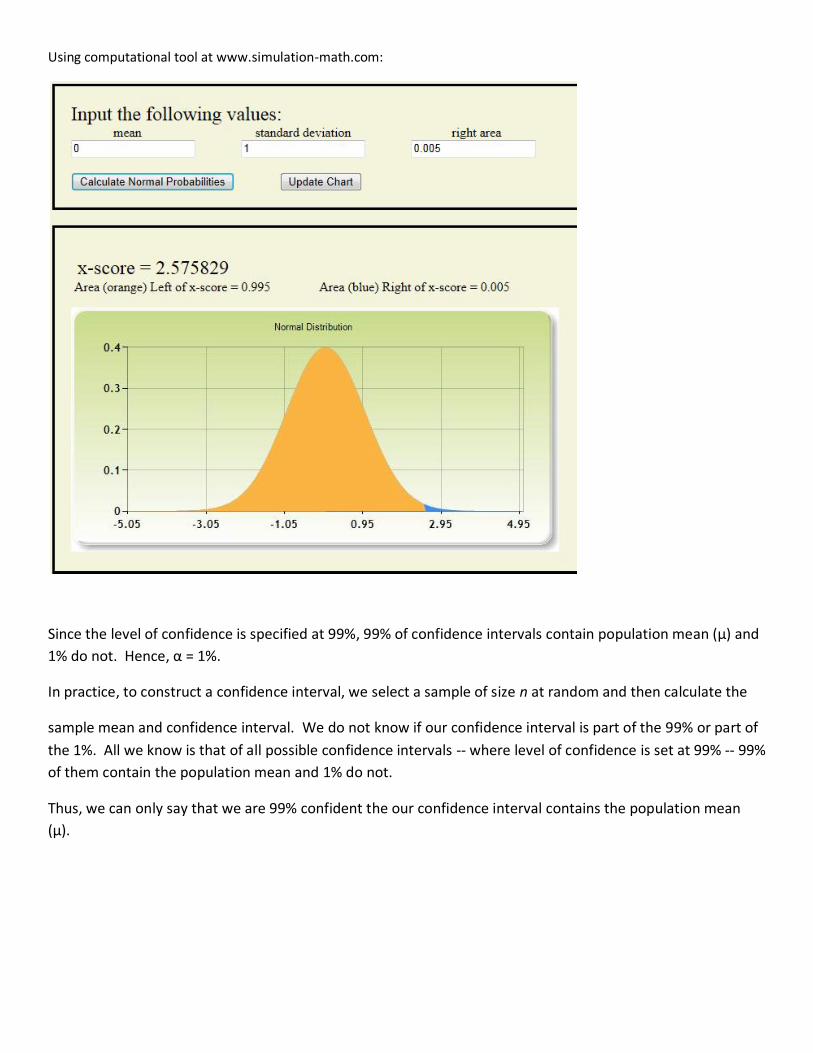
Using computational tool at www.simulation-math.com:
Since the level of confidence is specified at 99%, 99% of confidence intervals contain population mean (µ) and
1% do not. Hence, α = 1%.
In practice, to construct a confidence interval, we select a sample of size n at random and then calculate the
sample mean and confidence interval. We do not know if our confidence interval is part of the 99% or part of
the 1%. All we know is that of all possible confidence intervals -- where level of confidence is set at 99% -- 99%
of them contain the population mean and 1% do not.
Thus, we can only say that we are 99% confident the our confidence interval contains the population mean
(µ).
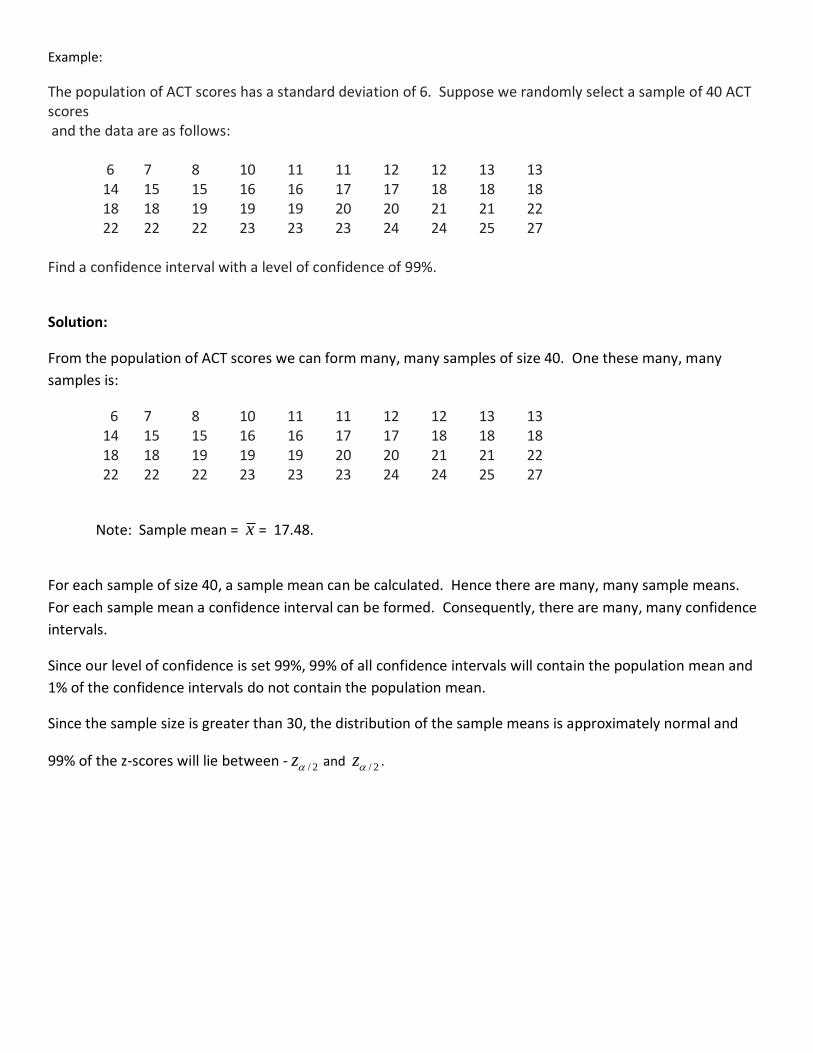
Example:
The population of ACT scores has a standard deviation of 6. Suppose we randomly select a sample of 40 ACT scores and the data are as follows: 6 7 8 10 11 11 12 12 13 13 14 15 15 16 16 17 17 18 18 18 18 18 19 19 19 20 20 21 21 22 22 22 22 23 23 23 24 24 25 27 Find a confidence interval with a level of confidence of 99%.
Solution:
From the population of ACT scores we can form many, many samples of size 40. One these many, many
samples is:
6 7 8 10 11 11 12 12 13 13 14 15 15 16 16 17 17 18 18 18 18 18 19 19 19 20 20 21 21 22 22 22 22 23 23 23 24 24 25 27
Note: Sample mean = x = 17.48.
For each sample of size 40, a sample mean can be calculated. Hence there are many, many sample means.
For each sample mean a confidence interval can be formed. Consequently, there are many, many confidence
intervals.
Since our level of confidence is set 99%, 99% of all confidence intervals will contain the population mean and
1% of the confidence intervals do not contain the population mean.
Since the sample size is greater than 30, the distribution of the sample means is approximately normal and
99% of the z-scores will lie between - / 2z and / 2z .

Left Area = 0.5% Middle Area = 99% Right Area = 0.5%
/ 2z is the z-score corresponding to a right area of 0.005. Hence, / 2z = 2.57.
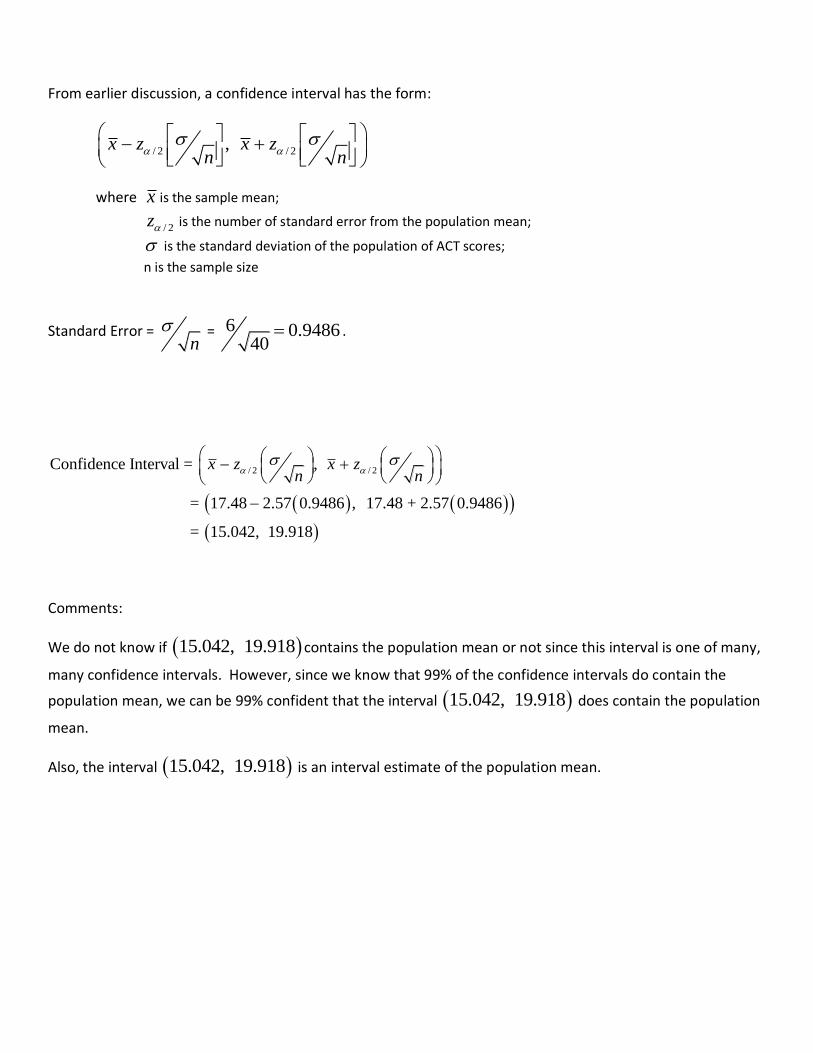
From earlier discussion, a confidence interval has the form:
/ 2 / 2, x z x z
n n
where x is the sample mean;
/ 2z is the number of standard error from the population mean;
is the standard deviation of the population of ACT scores;
n is the sample size
Standard Error = n
= 6 0.948640
.
/ 2 / 2Confidence Interval = ,
= 17.48 2.57 0.9486 , 17.48 + 2.57 0.9486
= 15.042, 19.918
x z x zn n
Comments:
We do not know if 15.042, 19.918 contains the population mean or not since this interval is one of many,
many confidence intervals. However, since we know that 99% of the confidence intervals do contain the
population mean, we can be 99% confident that the interval 15.042, 19.918 does contain the population
mean.
Also, the interval 15.042, 19.918 is an interval estimate of the population mean.

Illustration of 90% Confidence Interval
1 2 3 4 5 kx x x x x x
/ 2 / 2Confidence Interval = , x z x zn n
Underlying Population
mean = and standard deviation =
Sample 1 Sample 2 Sample 3 Sample 4 Sample 5 ...
Sample k ... ...
Calculate
sample
mean for
each sample
Population of Sample Means
1 2 3 4 5 kx x x x x x
mean = = and standard deviation = xn
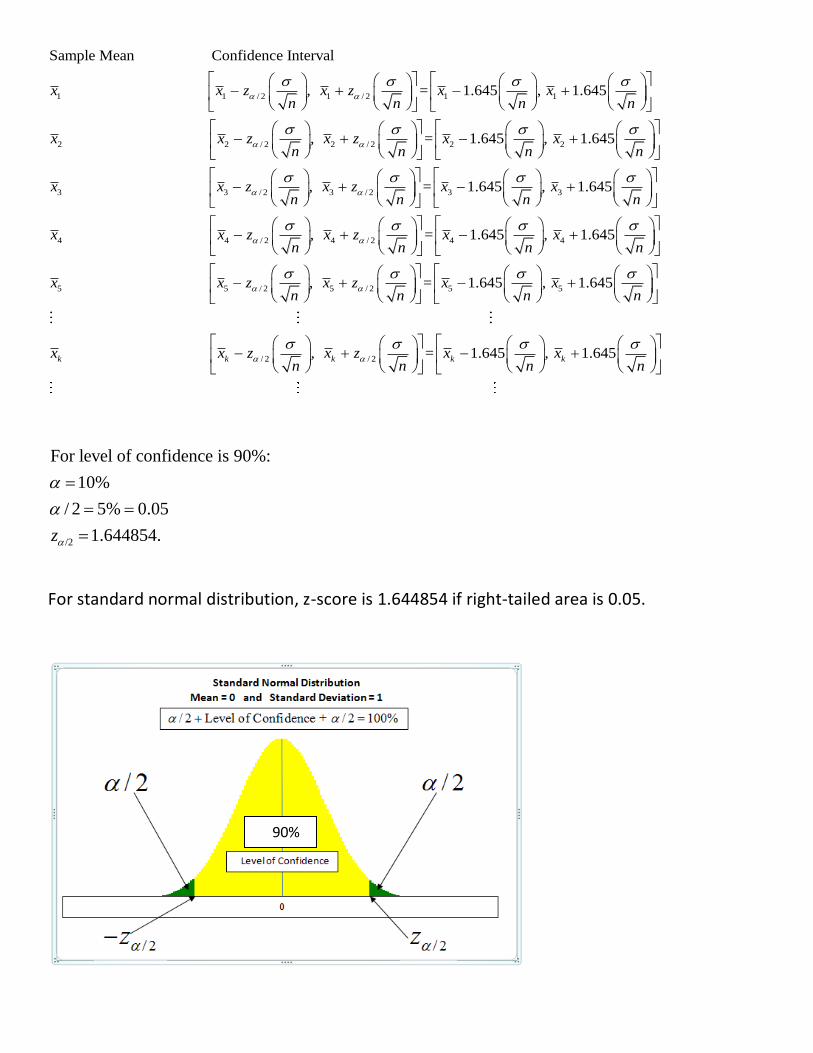
1 1 / 2 1 / 2 1 1
2
Sample Mean Confidence Interval
, = 1.645 , 1.645
x x z x z x xn n n n
x
2 / 2 2 / 2 2 2
3 3 / 2 3 / 2 3 3
, = 1.645 , 1.645
, = 1.645 , 1.645
x z x z x xn n n n
x x z x z x xn n n
4 4 / 2 4 / 2 4 4
5 5 / 2
, = 1.645 , 1.645
,
n
x x z x z x xn n n n
x x z xn
5 / 2 5 5= 1.645 , 1.645
k
z x xn n n
x
/ 2 / 2 , = 1.645 , 1.645
k k k kx z x z x xn n n n
/2
For level of confidence is 90%:
10%
/ 2 5% 0.05
1.644854.
z
For standard normal distribution, z-score is 1.644854 if right-tailed area is 0.05.
90%

Since the level of confidence is specified at 90%, 90% of confidence intervals contain population mean (µ) and
10% do not.
Hence, α = 10%.
In practice, to construct a confidence interval, we select a sample of size n at random and then calculate the
sample mean and confidence interval. We do not know if our confidence interval is part of the 90% or part of
the 10%. All we know is that of all possible confidence intervals -- where level of confidence is set at 90% --
90% of them contain the population mean and 10% do not.
Thus, we can only say that we are 90% confident the our confidence interval contains the population mean
(µ).

Example:
The population of ACT scores has a standard deviation of 6. Suppose we randomly select a sample of 40 ACT scores and the data are as follows: 6 7 8 10 11 11 12 12 13 13 14 15 15 16 16 17 17 18 18 18 18 18 19 19 19 20 20 21 21 22 22 22 22 23 23 23 24 24 25 27 Find a confidence interval with a level of confidence of 90%.
Solution:
From the population of ACT scores we can form many, many samples of size 40. One these many, many
samples is:
6 7 8 10 11 11 12 12 13 13 14 15 15 16 16 17 17 18 18 18 18 18 19 19 19 20 20 21 21 22 22 22 22 23 23 23 24 24 25 27
Note: Sample mean = x = 17.48.
For each sample of size 40, a sample mean can be calculated. Hence there are many, many sample means.
For each sample mean a confidence interval can be formed. Consequently, there are many, many confidence
intervals.
Since our level of confidence is set 90%, 90% of all confidence intervals will contain the population mean and
10% of the confidence intervals do not contain the population mean.
Since the sample size is greater than 30, the distribution of the sample means is approximately normal and
90% of the z-scores will lie between - / 2z and / 2z .
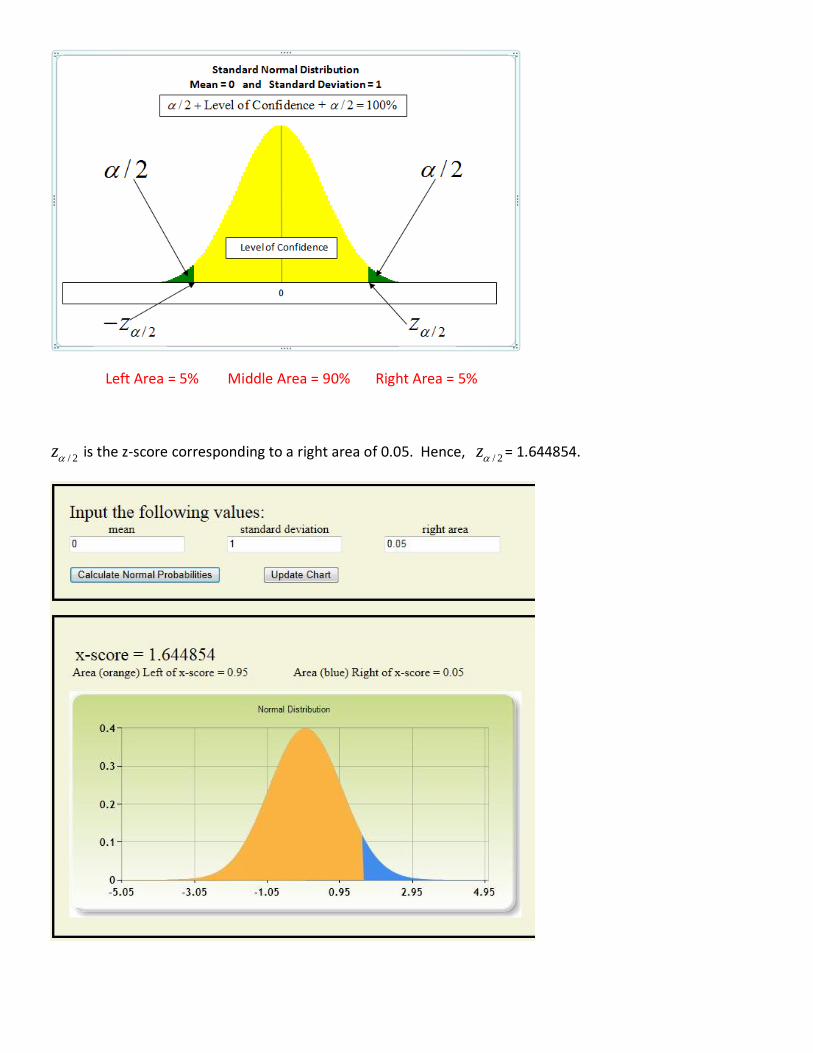
Left Area = 5% Middle Area = 90% Right Area = 5%
/ 2z is the z-score corresponding to a right area of 0.05. Hence, / 2z = 1.644854.
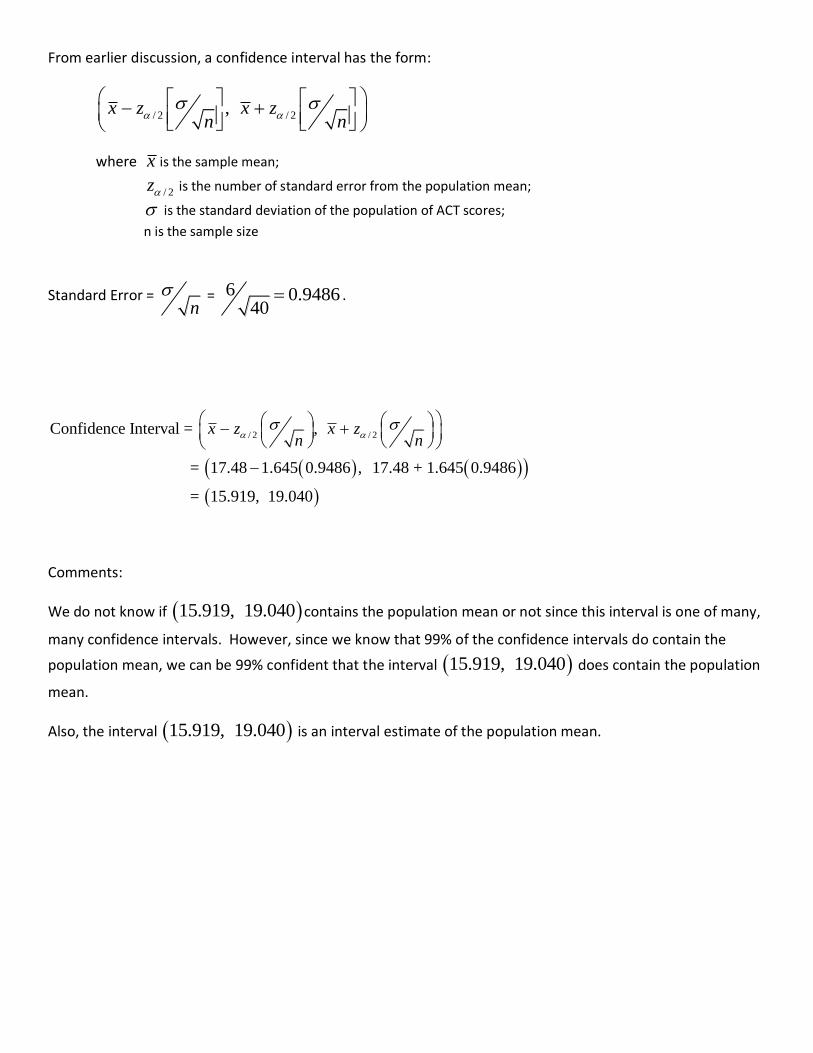
From earlier discussion, a confidence interval has the form:
/ 2 / 2, x z x z
n n
where x is the sample mean;
/ 2z is the number of standard error from the population mean;
is the standard deviation of the population of ACT scores;
n is the sample size
Standard Error = n
= 6 0.948640
.
/ 2 / 2Confidence Interval = ,
= 17.48 1.645 0.9486 , 17.48 + 1.645 0.9486
= 15.919, 19.040
x z x zn n
Comments:
We do not know if 15.919, 19.040 contains the population mean or not since this interval is one of many,
many confidence intervals. However, since we know that 99% of the confidence intervals do contain the
population mean, we can be 99% confident that the interval 15.919, 19.040 does contain the population
mean.
Also, the interval 15.919, 19.040 is an interval estimate of the population mean.