confidential biomass fuel procurement plan...
TRANSCRIPT

CONFIDENTIAL BIOMASS FUEL PROCUREMENT PLAN
FOR A WOOD WASTE FIRED GENERATION FACILITY SITED WITHIN FOREST LAND
May 31, 2009
Fuel delivery weigh-in at Mt Lassen Power, Westwood, CA
Prepared For:
Southern California Edison, Project Development Division 2244 Walnut Grove Avenue
Rosemead, CA 91770
Prepared By: TSS Consultants
2724 Kilgore Road Rancho Cordova, CA 95670

Fuel Procurement Plan for Biopower in the Central Sierras TSS Consultants
i
ACKNOWLEDGMENTS The authors wish to thank individuals and organizations for their efforts and data that helped us execute this fuel procurement plan. These include, but are not limited to: Sierra National Forest:
• Mark Smith, Ecosystem Staff • Geographic Information Analysis Staff • Paul Miller, Timber Sale Contracting Officer • Patrick Gallegos, Acquisition Team Leader
Southern California Edison Forestry:
• John R. Mount, Manager, Forest Resources • Patrick Emmert, Chief Forester • Ryan Stewart, Forester • Julianne Stewart, Forester
This fuel procurement plan is sponsored by the SCE Project Development Division:
• Tedi Duree, Project Manager

Fuel Procurement Plan for Biopower in the Central Sierras TSS Consultants
ii
EXECUTIVE SUMMARY In the State of California there is a favorable political window for renewable power, including wood waste fired generation. Earlier work by Southern California Edison determined the consistency of fuel supply as a notable constraint against facility siting. In August 2008, TSS Consultants completed a fuel availability study for a prospective commercial-scale biopower project that confirmed sufficient biomass fuel to sustain a project scaled at 10 to 12 MW of generation. That fuel availability study focused on a core fuel supply area situated geographically within a 30-mile radius of Shaver Lake which consisted of forest-sourced fuel from both privately-held and public forested lands. As such, it includes a potential for stewardship contract awards (with an estimate of five years for contracts to be proposed, negotiated, and finalized). Given the current political landscape, such is increasingly possible, but not guaranteed. This fuel procurement plan assessed opportunities to access fuel within a tributary fuel supply area that ranges from 30 to 50 miles radius. The additional fuel available from that area provides enough wood fuel to support a biopower project scaled at 12 MW using approximately 96,000 bone dry tons of wood annually. This document identifies an alternate procurement strategy for making the best use of the existing resources tributary to a prospective project site, including company-owned forest, privately-held forest land, public forests, agricultural waste, and urban wood waste. This strategy is structured to support fuel procurement efforts for a 10 to 12 MW biopower facility sited near Shaver Lake assuming commercial service commencing third quarter 2011. This report separately identifies cost of the fuel from ancillary costs to get the fuel to the conceptual fence-line of a prospective facility. Cost estimates for such fuel procurement range from $38 to $50 per Bone Dry Ton1 per year ($2.26 to $2.95 per MMBtu) as five-year projection for fuels sourced from the region that is tributary to the core fuel supply area (i.e., 30 to 50 mile radius of the prospective target site) and using 40% forestry wood waste from within the core fuel supply area.
1Tonnage figures in this fuel plan are in bone dry tons (BDT), the common unit of measure utilized by commercial-scale biopower facilities to procure fuel. It is the industry standard upon which all biomass fuel procurement is based and is defined as 2,000 pounds of biomass at nominal zero percent moisture content,

Fuel Procurement Plan for Biopower in the Central Sierras TSS Consultants
iii
Table of Contents ACKNOWLEDGMENTS ................................................................................................... i
EXECUTIVE SUMMARY ................................................................................................ ii
ABBREVIATIONS/ACRONYMS .................................................................................. vii
STUDY OBJECTIVES ....................................................................................................... 1
INTRODUCTION .............................................................................................................. 1 Target Fuel Supply Area ............................................................................................................. 1 Tributary Fuel Supply Area ........................................................................................................ 2
DEMAND FOR BIOMASS FUEL .................................................................................... 2 Rio Bravo - Fresno .................................................................................................................. 4 Madera Power ......................................................................................................................... 5 Dinuba Energy ........................................................................................................................ 5 Chowchilla II .......................................................................................................................... 5 El Nido .................................................................................................................................... 5 San Joaquin Solar I + II .......................................................................................................... 6
FUEL AVAILABILITY WITHIN THE TFSA .................................................................. 6 Agricultural Sources ................................................................................................................... 7
Nut Crop Orchard Removals .................................................................................................. 8 Stone Fruit Orchard Removals ............................................................................................... 9 Citrus Orchard Removals ....................................................................................................... 9 Orchard Prunings .................................................................................................................... 9
Urban Sources ........................................................................................................................... 10 Urban Wood Waste Within the TFSA .................................................................................. 11 Tree Trimmings Within the TFSA ........................................................................................ 11
Wildland Urban Interface Residuals ......................................................................................... 12 Summary of Biomass Fuel Available Within the TFSA ........................................................... 14
FUEL AVAILABILITY WITHIN THE CFSA ................................................................ 14 Biomass Fuel Availability – Sierra National Forest .................................................................. 16
American Recovery and Restoration Act of 2009 ................................................................ 17 Stewardship Contracts .......................................................................................................... 18 Risk Associated with Forest-Sourced Fuel ........................................................................... 19
FUEL SUPPLY SOURCES AND RISKS ........................................................................ 20 Orchard Removals and Prunings per SB-705 ........................................................................... 20 Alternative Daily Cover Policy ................................................................................................. 21 Cost of Transport ...................................................................................................................... 21
BIOMASS FUEL PRICING ............................................................................................. 22 Costs To Harvest, Collect, Process, and Transport ................................................................... 22
Transport Opportunities ........................................................................................................ 24 Service Fees from Public Forests .......................................................................................... 24 Service Fees from Orchard Owners ...................................................................................... 25 Tip Fees for Urban Wood Collection ................................................................................... 25
Current Market Pricing ............................................................................................................. 25 Biomass Fuel Practically Available Within the CFSA and TFSA ............................................ 26 Optimized Fuel Blend Forecast ................................................................................................. 27 Biomass Fuel Physical Characteristics ...................................................................................... 28

Fuel Procurement Plan for Biopower in the Central Sierras TSS Consultants
iv
Five-Year Fuel Price Forecast ................................................................................................... 29
OBSERVATIONS AND RECOMMENDATIONS ......................................................... 30 Strategic Targeting of Fuel Types and Suppliers ...................................................................... 31 Fuel Storage .............................................................................................................................. 32 Fuel Procurement Agreements .................................................................................................. 32 Fuel Procurement Organization ................................................................................................ 33 Implementation Task List and Timeline ................................................................................... 33
CONCLUSION ................................................................................................................. 34
Appendix A. CA Senate Bill No. 705 ............................................................................ 35
Appendix B. Biomass Fuel Specifications .................................................................... 40
Appendix C. Urban Wood Waste/WUI Material Guidelines ........................................ 42
Appendix D. Non-Binding Letter of Intent ................................................................... 43
Appendix E. Biomass Fuel Conversion Factors ............................................................ 46
Appendix F. Fuel Procurement Manager Job Description ............................................ 47

Fuel Procurement Plan for Biopower in the Central Sierras TSS Consultants
v
List of Figures
Figure 1 – Shaver Lake Target Fuel Supply Area .............................................................. 2
Figure 2 – Location of Existing Fuel Competition Within the TFSA ................................ 3
Figure 3 – Existing and Potential Fuel Competition Within the TFSA .............................. 3
Figure 4 – Fire Safe Councils Active in the Shaver Lake Region .................................... 13
Figure 5 – Summary of Biomass Fuel Available Within the TFSA Year 1 to 5 .............. 15
Figure 6 – Summary of Biomass Fuel Available Within the CFSA Years 1 to 5 ............ 15
Figure 7 – U.S. and West Coast Diesel Fuel Prices .......................................................... 22
Figure 8 – Summary of Practically Available Fuel .......................................................... 27
Figure 9 – Optimized Fuel Blend Forecast Years 1 to 5................................................... 28

Fuel Procurement Plan for Biopower in the Central Sierras TSS Consultants
vi
List of Tables
Table 1 – Operating Biopower Facilities Sourcing Fuel from the TFSA ........................... 4
Table 2 – Potential Biopower Facilities that may source from the TFSA .......................... 4
Table 3 – Orchard Acreage Estimate for the TFSA by Orchard Crop .............................. 10
Table 4 – Agriculture-Sourced Biomass Material Available Within the TFSA ............... 10
Table 5 – Urban Wood Material Available Within the TFSA .......................................... 11
Table 6 – Tree Trimming Material Available Within the TFSA ...................................... 12
Table 7 – Forest Fuels Reduction Residuals Potentially Available Within the TFSA from Fire Safe Council Sponsored Activities ........................................................... 14
Table 8 – Summary of Biomass Fuel Available Within the TFSA Years 1 to 5 .............. 14
Table 9 – Forecasted Fuel Practically Available Within the CFSA Years 1 to 5 ............. 15
Table 10 – Biomass Fuel Practically Available Years 1 to 5 – SCE Controlled .............. 16
Table 11 – Biomass Fuel Practically Available Years 1 to 5 – Sierra National Forest .... 16
Table 12 – Costs to Harvest, Collect, Process and Transport Biomass Fuel .................... 23
Table 13 – Summary of Biomass Fuel Pricing for ........................................................... 26
Table 14 – Summary of Biomass Fuel Practically Available from the CFSA and the TFSA ............................................................................................................... 27
Table 15 – Optimized Fuel Forecast Years 1 to 5 ............................................................ 28
Table 16 – Characteristics of Biomass Fuel Practically Available ................................... 29
Table 17 – Biomass Fuel Pricing for the CFSA and TFSA .............................................. 29
Table 18 – Blended Fuel Price 5 Year Forecast Summary 2011-2015 ............................. 30
Table 19 – Procurement Plan Task List ............................................................................ 34

Fuel Procurement Plan for Biopower in the Central Sierras TSS Consultants
vii
ABBREVIATIONS/ACRONYMS A range of abbreviations and acronyms were utilized in this report. Organizations SCE Southern California Edison SNF Sierra National Forest TSS TSS Consultants USFS USDA Forest Service Other Terms ADC Alternative Daily Cover ARRA American Recovery and Reinvestment Act of 2009 BDT Bone Dry Ton(s) BTU British Thermal Unit CEQA California Environmental Quality Act CVFM Central Valley Fuels Management CFSA Core Fuel Supply Area DBH Diameter at Breast Height FSC Fire Safe Council FSA Fuel Supply Area GT Green Ton(s) HFRA Healthy Forest Restoration Act LMP Land Management Plan MW Megawatt (electric) MBF Thousand Board Feet (log scale) MMBTU Million British Thermal Units NEPA National Environmental Policy Act REC Renewable Energy Credit or Certificate RPS Renewable Portfolio Standard TFSA Tributary Fuel Supply Area WUI Wildland Urban Interface

Fuel Procurement Plan for Biopower in the Central Sierra TSS Consultants
1 of 49
STUDY OBJECTIVES
This fuel procurement plan utilizes findings from the TSS wood fuel availability study (August 2008) along with current biomass fuel market conditions data (February 2009) to provide clear strategies to facilitate efficient and cost-effective biomass fuel procurement activities to support a 10 to 12 MW biopower facility near Shaver Lake, California. Primary objectives of this fuel procurement plan include:
• Generating delivered biomass fuel cost estimates, utilizing current market data for wood fuel, transportation and delivery cost, and competing uses.
• Reporting on current costs associated with the harvest, collection, processing and transport of biomass fuel of the type proposed to be used.
• Reviewing strategies to engage public land management agencies in activities that support healthy forest ecosystems within the Shaver Lake target fuel supply area.
• Developing a fuel procurement plan with specific timeline and task list. • Providing a five-year fuel cost projection forecast.
INTRODUCTION
The TSS fuel availability study confirmed there is sufficient biomass fuel to sustain a prospective commercial biopower project scaled at 10 to 12 MW of generation. It focused on a core fuel supply area situated geographically within a 30-mile radius of Shaver Lake consisting of forest-sourced fuel from both privately-held and public forests. It includes a potential for stewardship contract awards (with a significant ramping up of residual harvesting on company lands during the time such contracts are proposed, negotiated, and finalized, i.e., the first five years). Where such was posed as a possibility, and was in no way firm, this procurement plan was undertaken to ascertain whether the surrounding area could support such a facility (i.e., within a 50-mile radius). Additionally, the political landscape developed since the fuel availability study was issued has changed, wherein biomass and forest maintenance are explicitly addressed in the approved stimulus recovery plans for the country (American Recovery Reinvestment Act). Both factors have potential to support further development of a prospective biopower facility. While biomass fuel availability is important, so, too, is fuel pricing, which would include those costs to harvest, collect, process, and transport.
Target Fuel Supply Area The target fuel supply area (FSA) is defined as that region from which economical and sustainable biomass fuel resources can be sourced. Figure 1 below provides an overview. For the purposes of this fuel procurement plan, the core fuel supply area (CFSA) is defined as that region located within a 30-mile radius of Shaver Lake (defined with red boundary in Figure 1). In addition, the region located between a 30-mile and 50-mile radius (defined with blue boundary) is defined as the tributary fuel supply area (TFSA). The authors are not aware of any biopower facilities sourcing fuel from the CFSA.

Fuel Procurement Plan for Biopower in the Central Sierra TSS Consultants
2 of 49
Tributary Fuel Supply Area The TFSA is important to the fuel procurement strategy, as there will be opportunities to procure cost effective woody biomass fuel from this region. Opportunity fuel purchases from the tributary fuel supply area would typically be spot purchases from short term or seasonal fuel sources such as agricultural residuals (e.g., orchard removal material) or possibly more consistent, year round long-term sources such as urban wood waste recovery operations. This type of urban wood and agricultural residuals can be very cost effective fuel sources. Prospective biopower sites were fairly remote, and there was no other fuel use projected within the CFSA. Expanding consideration to TFSA increases possibility for competitive uses (e.g., existing biopower facilities, soil amendment).
Figure 1 – Shaver Lake Target Fuel Supply Area (Core Fuel Supply Area in Red, Tributary Fuel Supply Area in Blue)
DEMAND FOR BIOMASS FUEL
Biomass power generation facilities have been operating within California since the early 1980’s. With the passage of the federal Public Utility Regulatory Policy Act of 1978 (PURPA), numerous renewable energy generation facilities were developed as a result of PURPA-authorized incentives and power sales agreements (known as standard offers). Today, there are 31 commercial-scale biomass power generation facilities operating in California. Several facilities source biomass fuel from suppliers within the TFSA. There are currently four commercial-scale biopower projects operating within the central California region that are accessing biomass fuel from the TFSA (see Table 1). Figure 2 shows the locations of these four facilities.

Fuel Procurement Plan for Biopower in the Central Sierra TSS Consultants
3 of 49
Figure 2 – Location of Existing Fuel Competition Within the TFSA
Figure 3 – Existing and Potential Fuel Competition Within the TFSA
There are two biopower facilities located adjacent to the TFSA that may enter commercial service in the next five years. One is an idle biopower facility (El Nido) that is in the process of being refurbished, while the second is a new (greenfield) biopower

Fuel Procurement Plan for Biopower in the Central Sierra TSS Consultants
4 of 49
project, San Joaquin Solar I + II (see Table 2). Figure 3 shows the locations of these six facilities that could potentially compete for biomass fuel sourced from within the TFSA. A description follows of the four operating and two potential facilities, including each operation’s direct impact on potential competition for fuel sourcing within the TFSA. The conclusion about availability of fuel in the TFSA is that there is likely sufficient fuel to support the seven prospective facilities even though fuel would be sourced from at least part of the same area for all seven projects (two are potential projects). From past experience, it is clear that competition for acquiring the fuel at the best price will occur. Thus, addition of a seventh biopower facility in this region of California will not cause undue strain or serve to represent merely a change in providing woody biomass fuel from one user to another. It instead represents increased use of biomass for power generation (especially forest sourced biomass), which is a stated aim of the project concept. This conclusion is possible because industry standard uses blended fuel, and each of the fuel procurement managers will want to acquire a mix of fuel types (see section on Fuel Availability within the TFSA).
Table 1 – Operating Biopower Facilities Sourcing Fuel from the TFSA
Facility Combustion Technology2
Generation MW (Net)
Total Fuel Usage (BDT/Year)
Chowchilla II BFB 10 96,000 Madera Power BFB 23 190,000 Rio Bravo Fresno CFB 23 200,000 Dinuba Energy Stoker 10 96,000
Totals 167 582,000
Table 2 – Potential Biopower Facilities that may source from the TFSA
Facility Combustion Technology3
Generation MW (Net)
Total Fuel Usage (BDT/Year)
El Nido BFB 10 96,000 San Joaquin I + II BFB 100 500,000
Totals 110 596,000
Rio Bravo - Fresno Originally developed by Ultrasystems, Inc., this 23 MW (net) facility is now owned by Malaga Power Investors and Constellation Energy. This plant began commercial operations in 1989 and has recently undergone a major overhaul, with much of the combustor being rebuilt. For the last three years, Rio Bravo Fresno (and its sister facility Rio Bravo Rocklin, located outside the TFSA) utilized the services of Central Valley Fuel Management (CVFM) to procure fuel. Recently both facilities hired fuel procurement managers and are no longer affiliated with CVFM. If their previous procurement is any indication of their going-forward plans, they may tend to concentrate heavily on sourcing a blend of urban wood and agricultural residuals, given their proximity to urban centers and orchards.
2Combustor technologies include Bubbling Fluidized Bed (BFB), Circulating Fluidized Bed (CFB) and Stoker (fixed grate). 3Combustor technologies include Bubbling Fluidized Bed (BFB) and Circulating Fluidized Bed (CFB).

Fuel Procurement Plan for Biopower in the Central Sierra TSS Consultants
5 of 49
Madera Power Originally developed by Energy Products of Idaho, the Madera Power 23 MW (net) facility was designed to utilize agricultural residuals as a primary fuel source. The plant was brought into commercial service in 1989. In 2007, the facility suffered a catastrophic turbine failure and was out of service for over one year. Now owned by Community Recycling (also the owners of Dinuba Energy), this facility is currently utilizing a blend of urban wood waste and agricultural residuals. As a commercial-scale compost/mulch processor, Community Recycling is able to divert excess urban wood waste to its Madera and Dinuba operations. The apparent focus of this facility is to reduce waste generated as a byproduct of Community Recycling’s primary business (soil amendment products), where energy is a byproduct. A blend of urban wood and agricultural residuals are utilized as fuel due to the plant’s proximity to orchards.
Dinuba Energy This facility was originally developed by Yanke Energy and began commercial operations in 1986. Currently owned and operated by Community Renewable Energy Services (CRES), this facility is located on a former sawmill site and produces about 10 MW (net) of generation. Community Recycling, a major urban wood processing enterprise, is the parent company of CRES and manages both the Dinuba and Madera facilities. Much of the urban wood processed at its Bakersfield area yard and Sun Valley facility is transported to the Dinuba and Madera facilities, respectively. Such delivery occurs over approximately 185 to 225 road miles (one way), which could be deemed high, particularly if diesel fuel prices exceed certain thresholds (see section on Biomass Fuel Pricing). However, it is a firm supply, so such cost triggers might be irrelevant or insignificant. The Dinuba facility utilizes some agricultural residuals, in addition to the urban wood waste, due to the plant’s proximity to orchards. Like Rio Bravo, CVFM had been procuring fuel for this facility. Dinuba and Madera are currently purchasing their own fuel. Fuel procurement activities by the independent biopower facilities (as opposed to CVFM) may cause fuel prices to increase slightly due to market dynamics.
Chowchilla II Originally developed by CAPCO Energy, the Chowchilla II facility began commercial operation in 1988. The recently refurbished 10 MW (net) facility is now owned by a partnership known as Ampersand/Global, which has experienced significant operational challenges due to unexpected and costly facility refurbishment expenses. Ampersand/Global is now attempting to sell both the Chowchilla II and El Nido plants. Fuel suppliers have complained that payment for fuel delivered to both plants has been delayed. This has reduced the number of fuel suppliers willing to deliver fuel to either facility. North American Energy Services (NAES) is contracted to provide operating and maintenance services (which does not include fuel procurement). A blend of urban wood agricultural residuals is utilized as fuel due to the plant’s proximity to orchards.
El Nido Originally developed by CAPCO Energy, the El Nido 10 MW (net) facility began commercial operation in 1988. Currently in the process of being refurbished, and still in operations start-up mode, the El Nido facility is now owned by the same partnership that

Fuel Procurement Plan for Biopower in the Central Sierra TSS Consultants
6 of 49
owns the Chowchilla II facility, Ampersand/Global. Current plans are to bring the El Nido facility back into commercial service mid 2009. If that occurs, it could provide insight into how operations at this plant compare to Chowchilla II. But the partnership has experienced significant challenges due to unexpected and costly facility refurbishment expenses, and Ampersand/Global is now attempting to sell both the Chowchilla II and El Nido plants. NAES is contracted to provide operating and maintenance services. It is possible a blend of urban wood agricultural residuals could be utilized as fuel due to the plant’s proximity to orchards.
San Joaquin Solar I + II Now in development, the San Joaquin Solar I + II projects are designed as a solar/biomass hybrid, the first of its kind in California. Martifer, a Portuguese renewable energy company, is well versed in solar technologies and hopes to provide baseload power utilizing biomass as an auxiliary fuel when solar resources are not available. When both phases are fully built out, this facility is expected to generate about 100 MW (net) and utilize up to 500,000 BDT of biomass fuel, thus doubling the current demand for woody biomass in the TFSA. The primary fuel source will likely be agricultural residuals in the form of orchard removals augmented by urban wood waste. Commercial operation is expected in late 2011 or early 2012. With the time-coincident online date, it could affect a strong impact on start-up fuel acquisition costs and practices for a prospective facility near Shaver Lake, particularly where agricultural fuel sources comprise 33% of a prospective project fuel supply (see section on Optimized Fuel Blend Forecast), but such are expected to level-out over time, to align to the forecast in this report (see Biomass Fuel Pricing).
FUEL AVAILABILITY WITHIN THE TFSA
Procuring biomass fuel from a region within 30 miles of a prospective biopower site allows SCE to meet strategic land management goals, e.g., forest fuels treatment (to mitigate wildfire behavior), protection/enhancement of wildlife habitat, and protection of watershed attributes. However, the need to meet cost-effective fuel procurement objectives along with a reproducible biopower project development plan requires expanding fuel sourcing activities to the 50-mile radius (TFSA). Most commercial-scale biopower facilities in California access biomass fuel from at least a 50-mile radius of the operating facility. Variations in fuel availability, economies of transport, and a strategic objective to diversify fuel source drives most biomass fuel procurement managers to extend sourcing activities whenever possible. A prospective Shaver Lake biopower project is no exception. Advantages of sourcing additional fuel from the TFSA include:
• More diverse fuel supply mitigates fuel supply risk. • Fuels sourced from the TFSA offer year round fuel availability, thus
supplementing seasonal fuel deliveries from the CFSA.

Fuel Procurement Plan for Biopower in the Central Sierra TSS Consultants
7 of 49
• Cost competitive fuel sources are available within the TFSA that will likely drive down the blended fuel price.
• Economies of transport (backhaul opportunities) can be facilitated, assuring efficient and cost effective movement of commodities (lumber and biomass fuel) from and to the Shaver Lake facility.
While forest-sourced biomass fuel represents the key biomass fuel procurement opportunity in the CFSA, this is not the case within the TFSA. The forested landscape included in the region which is within a 30 to 50 mile radius of Shaver Lake has large federal land management designations that prevent active forest management, including timber harvest or fuels treatment (see Figure 1). Federal lands with restrictive forest management practices that do not allow recovery of forest biomass are located primarily to the north and east of Shaver Lake. Listed below are the federal administrative units that preclude active vegetation management which might otherwise produce woody biomass fuel:
• Yosemite National Park • John Muir Wilderness • Dinkey Lakes Wilderness • Kings Canyon National Park
While there could be some timber harvest and fuels reduction activities on private forest lands within the TFSA, costs associated with transport of biomass fuel preclude economic delivery of fuel to a biopower facility located at Shaver Lake. More biomass fuel sourced from agricultural operations, urban wood waste material recovery, and wildland urban interface residuals within the TFSA offer significant opportunity, and at better cost, particularly if there is opportunity for economic use of backhaul (trucks are loaded both directions). These sources are predominately on non-forested landscape and within population centers to the south and west of Shaver Lake. Identifying a 50-mile radius of a prospective facility does not account for whether roads exist in a direct path, or if roads are in a condition to support the weight or turning radius of biomass fuel trailers. It might be that development of roads or improvement of existing roads could pose a barrier to fuel recovery. This report assumes existing paved roads are sufficiently developed to access woody biomass within the TFSA.
Agricultural Sources In the greater Fresno area, significant acreage is dedicated to the pursuit of commercial agriculture as a very active part of the community which helps anchor the local economy. Some crops such as nut, stone fruit, and citrus orchards regularly provide residuals from prunings (generated annually as orchards are trimmed) and whole trees (generated as mature stems when orchards are replaced, on an established rotation). Estimates are provided of residuals recoverable from various agricultural sources in the TFSA, based upon the type of crop and the acreage dedicated for those crops (see Table 3).

Fuel Procurement Plan for Biopower in the Central Sierra TSS Consultants
8 of 49
To estimate the volume of orchard removal material and orchard prunings generated, the authors interviewed local orchard removal contractors as well as University of California agricultural extension agents. These experts were able to provide specific estimates regarding yield per acre (tonnage of orchard material removed) by orchard species, perspectives on crop rotation, and location of orchards based on years of work and knowledge in their respective fields. In addition, annual crop reports4 from each of the counties included in the TFSA were used to track the number of acres in orchard production by commercial species. County Agriculture Commissioners produce crop reports annually, and these typically track the acreage of commercial crops in production. Other reference documents5 were utilized when crop reports provided were out of date or not helpful. Where no reference documents were available that provided specific locations of orchards by species, the authors relied on local knowledge (UC agricultural extension agents)6 to provide an appropriate perspective. This same perspective was utilized to estimate removal rates for orchards, as orchardists will occasionally time the removal of orchards based on market conditions. For example, the value of almonds in 2006 increased to a level that tended to reduce almond orchard removals so that high levels of almond nut harvests could be maintained. Almond nut values have dropped in recent years (due partly to worldwide economic conditions), and the backlogs of over-mature almond orchards are now being removed and replaced. This is based upon the traditional and accepted horticultural observation that older trees are less productive, so are removed and replaced before they reach a level of reduced productivity.
Nut Crop Orchard Removals Within the TFSA, the authors estimate that 57,446 acres of almonds and walnuts are harvested annually. These nut crops have traditionally7 had a replacement/removal rate of approximately 4% of total acres in cultivation per year. The typical removal volume for a mature almond or walnut orchard is around 36 BDT per acre. Based on these estimates, TSS has calculated that approximately 2,298 acres of nut orchards are available for removal on an annual basis. This results in approximately 82,722 BDT of nut orchard removals available each year within the TFSA. Note that woody biomass from nut crops, particularly almond, is some of the most desirable material for agricultural air emissions offset fuel and as such, may be in high demand for purchase by other biomass power plants (e.g., Rio Bravo Fresno) attempting to meet agricultural offset fuel procurement requirements. In addition, almond wood tends to be hard and generally produces a good quality fuel when processed, whereas walnut wood tends to produce fuel with some process handling challenges, i.e., a more stringy and generally dusty fuel.
42007 Fresno County Crop Report, 2006 and 2007 Merced County Crop Report, 2007 Tulare County Crop Report. 52005 California Energy Commission Biomass in California Report. 6Brendt Holt, Agricultural Extension Agent, Madera County. 7Per interviews with commercial-scale orchard removal contractors.

Fuel Procurement Plan for Biopower in the Central Sierra TSS Consultants
9 of 49
Stone Fruit Orchard Removals Within the TFSA, the authors estimate approximately 9,722 acres of stone fruit orchards (cherry, apricot, and peaches) are currently in production within the TFSA. Removal and replacement of the stone fruit orchards tend to be every eight to ten years due to changes in varieties (as consumer preferences change) and superior genetic stock for new orchards is developed. Fruit orchards tend to generate less volume of usable biomass fuel than the nut orchard removal, as fruit trees tend to be smaller. The authors estimate removal rates at 10% of cultivated crop per year, where approximately 18 BDT per acre are produced from fruit orchard removals with approximately 17,500 BDT of fruit orchard removals available each year. Unlike nut orchards, fruit trees tend to be softer and provide slightly stringier fuel, but with the appropriate equipment can be processed into quality fuel.
Citrus Orchard Removals There are currently approximately 42,078 acres of citrus fruit in cultivation within the TFSA. Citrus fruit orchard removals traditionally generated less desirable fuel due to past challenges associated with processing and have not been targeted as a biomass fuel source. However, with the implementation of Senate Bill 705 (see Appendix A) burn ban for citrus orchards, there is much material available, and orchard owners are motivated to have it removed rather than pile and burn on site. In addition, agricultural biomass processing contractors have found that allowing the citrus orchard removal material to dry for six to eight weeks after extraction from the ground facilitates processing of a superior grade fuel that is less stringy (easier to manage at the biopower facility), hence improving handling characteristics. Citrus orchards are being removed at an accelerated rate as orchards mature or dated varieties (e.g., Valencia, Navel) are being replaced with more valued varieties. Current removal rates for citrus orchards are about 4% of the total acres in cultivation per year. Average volume of biomass fuel recovered is 18 BDT per acre. Thus, approximately 30,296 BDT of biomass fuel from citrus orchard removals are generated per year within the TFSA.
Orchard Prunings In addition to orchard removals, orchard prunings are also available annually from commercial orchard processing operations. While the average volume of prunings varies by type of orchard, TSS has estimated that on average, approximately 0.5 BDT per acre in cultivation are generated as orchards are pruned each year. County crop reports8 indicate approximately 109,246 acres of orchards are now in cultivation within the TFSA. Table 3 summarizes orchard acreage in cultivation by orchard crop for the TFSA. Annual pruning activities on these orchards could produce approximately 54,623 BDT of pruning material per year. At present, there are a limited number of operators actively engaged in orchard pruning collection and processing. The low volumes per acre and the specialized processing equipment required tend to make this fuel relatively expensive to produce. In addition, because of the physical characteristic of the prunings, this fuel tends to be stringy and can be difficult to process. Nonetheless, it is a viable fuel source, not to be overlooked. TSS estimates 50% of this volume, approximately 27,550 BDT per
8Ibid, page 7.

Fuel Procurement Plan for Biopower in the Central Sierra TSS Consultants
10 of 49
year, could be reasonably available as fuel within the TFSA. Table 4 provides a summary of agriculture-sourced biomass material potentially available within the TFSA.
Table 3 – Orchard Acreage Estimate for the TFSA by Orchard Crop
Orchard Crop Total Acres in TFSA Nut Crop Orchard 57,446 Stone Fruit Orchard 9,722 Citrus Orchard 42,078
Total 109,246
Table 4 – Agriculture-Sourced Biomass Material Available Within the TFSA
Agriculture Source Total BDT Agricultural Residuals – Orchard Removals 130,517 Agricultural Residuals – Orchard Prunings 27,550
Total 158,067
Urban Sources There are at least two supplies of urban waste that could be utilized in a prospective biopower facility. This includes urban wood waste and urban tree trimmings. Due to state regulatory policy, increased consumer awareness, and market competition, such wood waste has become increasingly available. During the last 15+ years, there has been a concerted effort to reduce the volume of waste material deposited in California landfills. Primary motivation for state legislation was the diversion of waste away from landfills. In 1989, Assembly Bill 939 (AB 939), known as the Integrated Waste Management Act, was passed into law due to concerns regarding the amount of waste destined for landfills. By increasing the volume of material diverted from traditional deposition in landfills, and instead recycled, recovered, or reused, the service life of landfills could be extended and the need for new landfills reduced. As a result of AB 939, the current California Integrated Waste Management Board (CIWMB) was established. A disposal reporting system with CIWMB oversight was established, and facility and program planning was required. AB 939 mandates a reduction of waste being disposed: jurisdictions were required to meet annual diversion goals of 25% by 1995 and 50% by 2000. AB 939 established an integrated framework for program implementation, solid waste planning, and solid waste facility and landfill compliance. Compliance efforts have brought about a significant shift in diversion from landfills of urban wood waste in the form of pallets, construction wood debris, industrial wood (e.g., cabinet shop refuse) and clean demolition wood. This waste material is now being recovered and processed into value-added products, including soil amendment (mulch, compost), landscape cover (colorized wood), and biomass fuel. This report assumes the available supply is split about evenly among the three competing markets.
Fuel Procurement Plan for Biopower in the Central Sierra TSS Consultants
11 of 49
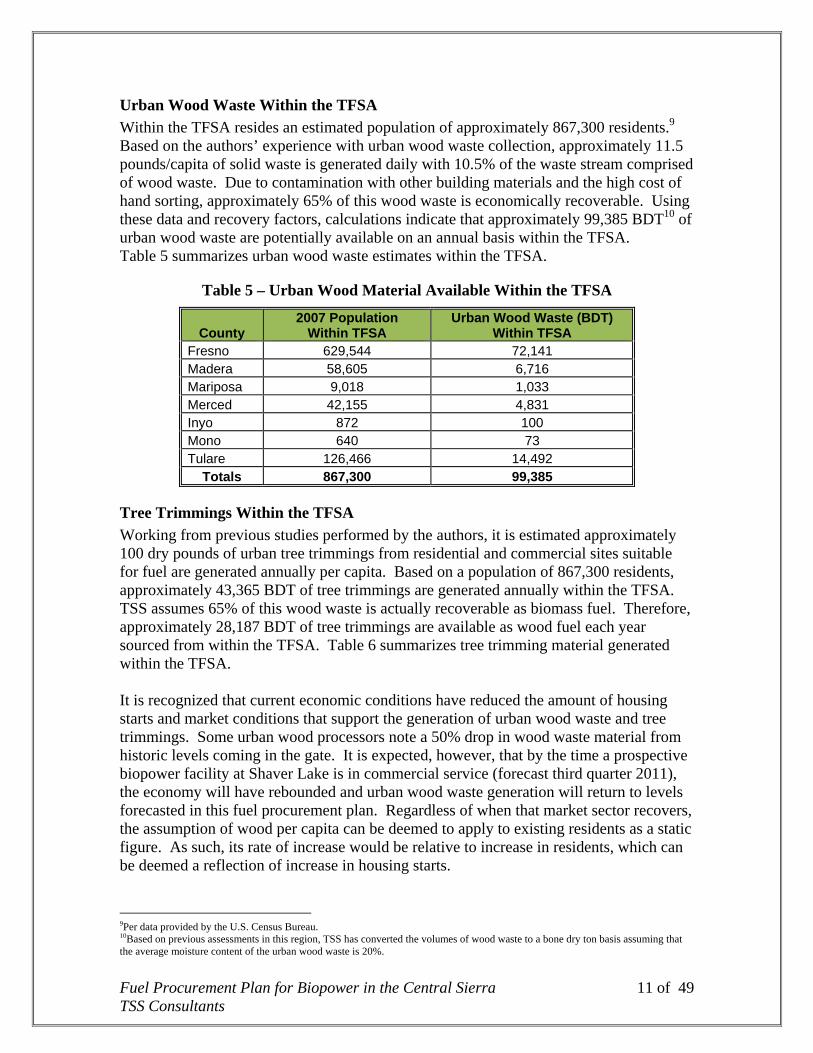
Urban Wood Waste Within the TFSA Within the TFSA resides an estimated population of approximately 867,300 residents.9 Based on the authors’ experience with urban wood waste collection, approximately 11.5 pounds/capita of solid waste is generated daily with 10.5% of the waste stream comprised of wood waste. Due to contamination with other building materials and the high cost of hand sorting, approximately 65% of this wood waste is economically recoverable. Using these data and recovery factors, calculations indicate that approximately 99,385 BDT10 of urban wood waste are potentially available on an annual basis within the TFSA. Table 5 summarizes urban wood waste estimates within the TFSA.
Table 5 – Urban Wood Material Available Within the TFSA
County 2007 Population
Within TFSA Urban Wood Waste (BDT)
Within TFSA Fresno 629,544 72,141 Madera 58,605 6,716 Mariposa 9,018 1,033 Merced 42,155 4,831 Inyo 872 100 Mono 640 73 Tulare 126,466 14,492
Totals 867,300 99,385
Tree Trimmings Within the TFSA Working from previous studies performed by the authors, it is estimated approximately 100 dry pounds of urban tree trimmings from residential and commercial sites suitable for fuel are generated annually per capita. Based on a population of 867,300 residents, approximately 43,365 BDT of tree trimmings are generated annually within the TFSA. TSS assumes 65% of this wood waste is actually recoverable as biomass fuel. Therefore, approximately 28,187 BDT of tree trimmings are available as wood fuel each year sourced from within the TFSA. Table 6 summarizes tree trimming material generated within the TFSA. It is recognized that current economic conditions have reduced the amount of housing starts and market conditions that support the generation of urban wood waste and tree trimmings. Some urban wood processors note a 50% drop in wood waste material from historic levels coming in the gate. It is expected, however, that by the time a prospective biopower facility at Shaver Lake is in commercial service (forecast third quarter 2011), the economy will have rebounded and urban wood waste generation will return to levels forecasted in this fuel procurement plan. Regardless of when that market sector recovers, the assumption of wood per capita can be deemed to apply to existing residents as a static figure. As such, its rate of increase would be relative to increase in residents, which can be deemed a reflection of increase in housing starts.
9Per data provided by the U.S. Census Bureau. 10Based on previous assessments in this region, TSS has converted the volumes of wood waste to a bone dry ton basis assuming that the average moisture content of the urban wood waste is 20%.

Fuel Procurement Plan for Biopower in the Central Sierra TSS Consultants
12 of 49
Table 6 – Tree Trimming Material Available Within the TFSA
County 2007 Population
Within TFSA Tree Trimming Material (BDT)
Within TFSA Fresno 629,544 20,460 Madera 58,605 1,905 Mariposa 9,018 293 Merced 42,155 1,370 Inyo 872 28 Mono 640 21 Tulare 126,466 4,110
Totals 867,300 28,187
Wildland Urban Interface Residuals National forests are implementing fuels treatment projects in direct response to the current high fire hazard situation in the West. On private forest lands, the State of California has facilitated the creation of numerous Fire Safe Councils (FSC). Today, over 150 FSC11 exist statewide. Three are now active within the TFSA:
• Highway 168 Fire Safe Council • Oak to Timberline Fire Safe Council • Eastern Madera County Fire Safe Council
Figure 4 highlights where these FSC are currently active. The Highway 168 FSC operates predominantly within the CFSA with the other two FSC active within the TFSA. The bulk of wildland urban interface (WUI) material forecast is primarily a result of Highway 168 Fire Safe Council and SCE working with residents of Shaver Lake to remove hazardous fuels to create more fire defensible communities. In the past, the FSC and SCE have coordinated use of a collection yard for gathering woody debris. Known as the Pine Needle Disposal Program, interviews with FSC leadership12 confirm that woody debris collection activities are likely to continue. This is especially true in light of recent discussions between the FSC and the lead enforcement agency regulating issuance of burn permits. The San Joaquin Unified Air Pollution Control District is strongly discouraging the piling and burning of pine needles, limbs, and other debris removed to reduce hazardous woody fuels. Primary concern is the impact of open burning activities to air quality. Additional woody material will likely become available for use as biomass fuel as a direct result of the air district’s reluctance to issue burn permits. Foresters and fire agency personnel13 interviewed by the authors indicated that historically, 200 acres of private forestland are treated annually within the TFSA. From both TSS’ experience in the region and interviews with forest managers, it can be assumed that an average of 10 BDT per acre are potentially available as biomass fuel
11Per the California Fire Safe Council. 12Richard Bagley, President, Highway 168 Fire Safe Council. 13Richard Bagley, President, Highway 168 Fire Safe Council, Jim Huffman, Chair, Oak to Timberline Fire Safe Council, Bob Buckles, Chair, Eastern Madera County Fire Safe Council.

Fuel Procurement Plan for Biopower in the Central Sierra TSS Consultants
13 of 49
from the fuels reduction activities on small private land parcels. In addition to the fuel reduction residuals generated from acres treated, the public chipper programs targeting homeowners, as sponsored by the FSC, net approximately 1,000 BDT annually.
Figure 4 – Fire Safe Councils Active in the Shaver Lake Region
Note that not all fuels treatment activities are located on road systems that will support chip trucks (for biomass fuel transport) or on topography that will allow economical removal of hazardous fuels. Thus, this assessment assumes approximately one-half of the acres treated and one-half of the chipper programs will produce wood waste as a potential fuel source. Table 7 summarizes these findings. The American Recovery and Reinvestment Act of 2009 authorizes significant expenditures in support of fuels reduction activities on both public and private lands. Much of this funding is expected to be allocated to the FSC to support community-based efforts to reduce hazardous fuels. Thus, biomass from FSC activities is likely to continue to be available as fuel for a prospective biopower generation facility, possibly even on an increased level due to this funding.

Fuel Procurement Plan for Biopower in the Central Sierra TSS Consultants
14 of 49
Table 7 – Forest Fuels Reduction Residuals Potentially Available Within the TFSA from Fire Safe Council Sponsored Activities
Fuels Reduction Residuals Potentially Available – FSC
(BDT)
Total Available (BDT)
3,000
1,500
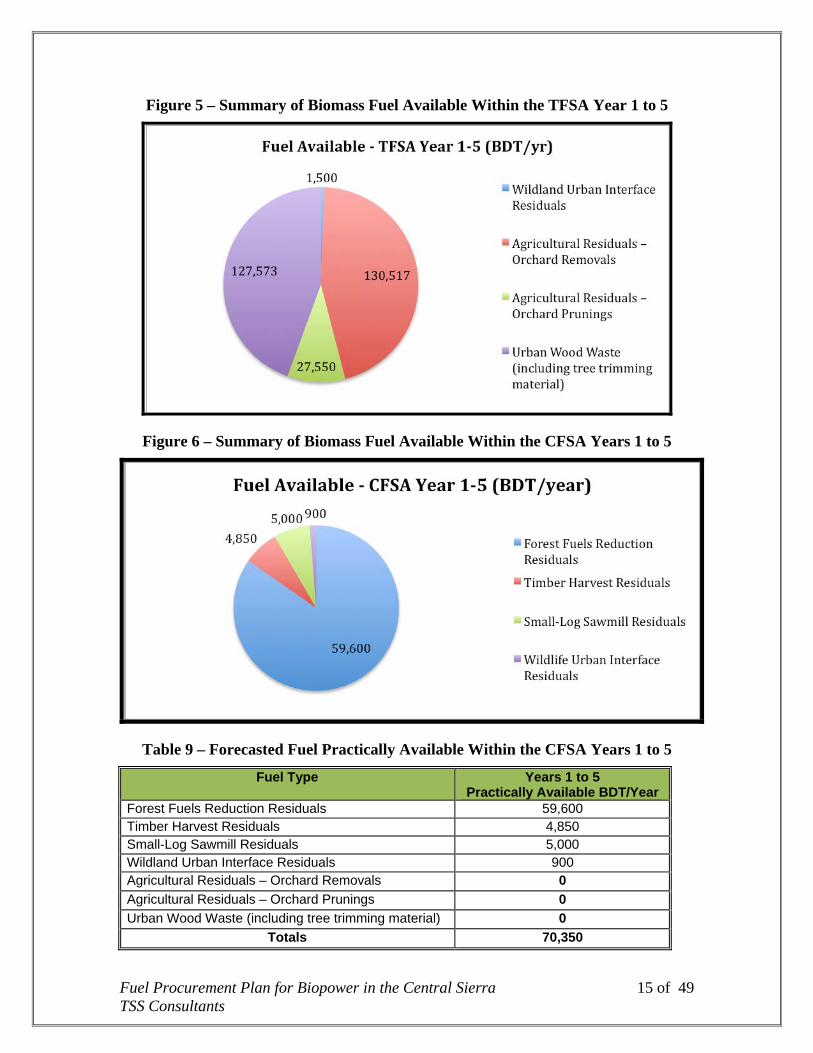
Summary of Biomass Fuel Available Within the TFSA Summarized in Table 8 is the forecast of biomass fuel available annually within the TFSA for years 1 to 5. Note that tree trimmings and urban wood waste are reported as one number. This is due to the fact that urban wood processors blend both of these fuel types and market them to biopower facilities as urban wood waste. Also note that zero is potentially acquired from forest fuels reduction residuals, timber harvest residuals, and small-log sawmill residuals. These are more apt to be sourced from the CFSA, as was addressed in detail in the August, 2008 TSS fuel availability study. This information is also shown graphically in Figure 5.
Table 8 – Summary of Biomass Fuel Available Within the TFSA Years 1 to 5
Fuel Type Years 1 to 5
Available BDT/Year Forest Fuels Reduction Residuals 0 Timber Harvest Residuals 0 Small-Log Sawmill Residuals 0 Wildland Urban Interface Residuals 1,500 Agricultural Residuals – Orchard Removals 130,517 Agricultural Residuals – Orchard Prunings 27,550 Urban Wood Waste (including tree trimming material) 127,573
Total 287,140
FUEL AVAILABILITY WITHIN THE CFSA
To the estimated amount of fuel available in the TFSA is added the fuel from the CFSA, per the TSS fuel availability study. That study assumed an accelerated management of SCE-controlled lands for years 1-5 which could be offset in reducing maintenance activities on those lands for years 6-20 as other lands became available. No update to that assumption is made with this Procurement Plan. Where an objective of this paper is to provide a 5-year fuel cost forecast, assumptions for years 6-20 are not considered. Note how the two areas complement each other in terms of what one offers and what the other does not, providing a more diverse fuel mix (see Figure 6 and Table 9).
Fuel Procurement Plan for Biopower in the Central Sierra TSS Consultants
15 of 49
Figure 5 – Summary of Biomass Fuel Available Within the TFSA Year 1 to 5
Figure 6 – Summary of Biomass Fuel Available Within the CFSA Years 1 to 5
Table 9 – Forecasted Fuel Practically Available Within the CFSA Years 1 to 5
Fuel Type Years 1 to 5 Practically Available BDT/Year
Forest Fuels Reduction Residuals 59,600 Timber Harvest Residuals 4,850 Small-Log Sawmill Residuals 5,000 Wildland Urban Interface Residuals 900 Agricultural Residuals – Orchard Removals 0 Agricultural Residuals – Orchard Prunings 0 Urban Wood Waste (including tree trimming material) 0
Totals 70,350

Fuel Procurement Plan for Biopower in the Central Sierra TSS Consultants
16 of 49
The TSS fuel availability study separately identifies the fuel practically available from SCE-controlled forest and from nearby USDA Forest Service (USFS) lands. These two entities manage 95% of the landbase located in the CFSA. This segregation is due to uncertainty in successfully attaining stewardship contract awards for conducting forest fuels reduction and forest restoration activities on USFS lands (see Table 10 and Table 11 for the potential supply from each area). As shown in the TSS Fuel Availability study, there is sufficient fuel available in the CFSA to support a 7 to 9 MW facility. Nonetheless, the seasonal fluctuation in such forest-sourced fuel availability and expenses associated with collection, processing and transport add up to a relatively expensive fuel source (see discussion under Risk Associated with Forest-Sourced Fuel). As such, these factors provide a primary rationale for diversifying the fuel mix.
Table 10 – Biomass Fuel Practically Available Years 1 to 5 – SCE Controlled
Fuel Type
Practically Available BDT/Year
Comments Forest Fuels Reduction Residuals Private - SCE lands
42,350
SCE lands - Years 1-5, then taper off.
Forest Fuels Reduction Residuals Private - Other
3,850 Other private lands - SCE manages operations at 200 acres treated per year.
Timber Harvest Residuals 3,400 Per 2002-2006 historic timber harvests. Small Log Sawmill Residuals 5,000 5,000 MBF converts to 5,000 BDT. Wildland Urban Interface Residuals
900
Highway 168 FSC/SCE-sponsored collection yards.
Total 55,500
Table 11 – Biomass Fuel Practically Available Years 1 to 5 – Sierra National Forest
Fuel Type
Practically Available BDT/Year
Comments Forest Fuels Reduction Residuals 13,400 Years 1-5, then ramp up starting year 6. Timber Harvest Residuals 1,450 Per 2002-2006 historic timber harvests.
Total 14,850
Biomass Fuel Availability – Sierra National Forest As with most of the Sierra Nevada Range, a significant portion of the CFSA is managed by the USFS. Shaver Lake is situated in the middle of the Sierra National Forest (SNF). Historic forest practices as well as fire suppression on the SNF have led to the unnatural accumulation of significant volume of small stems <18” (diameter at breast height, DBH) on national forest lands within the CFSA, unlike management practices on SCE forests that proactively treat significant numbers of acres.

Fuel Procurement Plan for Biopower in the Central Sierra TSS Consultants
17 of 49
Discussions with SNF staff14 indicate that past reductions in USFS funding available for fuels treatment activities, downsizing of forest staff, and reduced timber harvests due to ongoing litigation had severely limited the SNF in accomplishing forest fuels reduction work. Litigation has caused fuels treatment and timber harvest activities to come to a virtual standstill in the past ten years, causing a significant backlog of forest fuels reduction projects to accumulate. Inability of SNF to effectively address the growing accumulations of brush and small stems poses a significant threat to SCE lands, national forest lands, national park lands, and local communities due to the high probability of catastrophic wildfires. Stepped up fuels treatment activities on the SNF are required to reduce this threat, create open grown forest settings, enhance wildlife habitat, and meet management goals as set by various legislative initiatives and directives15 for these public lands. Due to this apparent need, the TSS fuel availability study found and recommends that a large component of the future fuel supply in the CFSA be sourced directly from SNF lands as a byproduct of forest fuels treatment and restoration activities. Broad-scale landscape-level treatments on the SNF will generate a sustainable flow of biomass fuel in addition to the SCE-sourced biomass fuel. Conversations with USFS staff16 indicated a high level of interest to significantly ramp up acreage treated using stewardship contracts (addressed below). The forest restoration work needed to be done on the SNF can support a step up of stewardship contracts over time such that by years 6 to 20, approximately 5,000 acres per year of fuels treatments will be accomplished (as was identified in the TSS fuel availability study). This minimum scale of treatment will be required if the SNF is to treat the backlog of hazardous fuels now accumulated on lands under its jurisdiction.
American Recovery and Restoration Act of 2009 A recent federal initiative will provide sorely needed funding to support fuels treatment activities on public and private lands. Passage of the American Recovery and Restoration Act of 2009 (ARRA) in February 2009 will facilitate significant investment in forest fuels treatment on both public and private land. Text from the ARRA spells out specific funding levels:
DIVISION A. APPROPRIATIONS PROVISIONS TITLE VII DEPARTMENT OF AGRICULTURE FOREST SERVICE WILDLAND FIRE MANAGEMENT - For an additional amount for ‘‘Wildland Fire Management’’, $500,000,000, of which $250,000,000 is for hazardous fuels reduction, forest health protection, rehabilitation and hazard mitigation activities on Federal lands and of which $250,000,000 is for State and private forestry activities including hazardous
14Mark Smith, Ecosystem Staff, Sierra National Forest. 15Healthy Forests Restoration Act of 2003 and the Sierra Nevada Forest Management Plan Record of Decisions – 2004. For latest information on the 2004 Record of Decision, see http://www.fs.fed.us/r5/snfpa/ 16Patrick Gallegos, Acquisition Team Leader, Southern Sierra Province and Paul Miller, Timber Sale Contracting Officer, Sierra National Forest.

Fuel Procurement Plan for Biopower in the Central Sierra TSS Consultants
18 of 49
fuels reduction, forest health and ecosystem improvement activities on State and private lands using all authorities available to the Forest Service.
Discussions with key USFS staff17 indicate that the ARRA appropriated funding levels are likely to boost fuels treatment activities at least in the short term. Results of additional and targeted fuels treatment across the landscape will highlight (hopefully) the positive societal benefits (e.g., healthy forests, protection of wildlife habitat) and elicit additional dedication of public funds to invest in the long term.
Stewardship Contracts During interviews with USFS staff, the authors confirmed the agency’s commitment to treat significant amounts of forested landscape. In addition, there is an increased emphasis on long-term (3 to 10 year) stewardship contracts that provide opportunities for SCE to negotiate land management agreements directly with the USFS. Two types of stewardship contracts are currently awarded by the USFS:
• Integrated Resource Service Contract – Typically implemented to facilitate landscape-level treatments that are conducted over 3 to 10 years. Allows “goods for services” arrangement, where the value of the timber removed can be allocated to reimburse the contractor for services rendered. Typical services rendered include fuels treatment and watershed enhancement projects. Because timber values will not be enough to cover all of the costs for services rendered, appropriated dollars are required to implement these types of agreements.
• Integrated Resource Timber Contract – Identical to the Integrated Resource Service Contract arrangement except timber values exceed the cost of services rendered. No appropriated dollars are required to facilitate implementation.
Stewardship contracts in the form of integrated resource management contracts are currently being implemented on Stanislaus National Forest (located just north of SNF). The Stanislaus National Forest is implementing two of the largest stewardship contracts in California, ranging in scale from 1,200 acres (Granite Basin Stewardship Contract) to 1,400 acres (Bear Mountain Stewardship Contract). At the present time, there are no stewardship contracts being implemented on the SNF. However, a recent initiative by SNF staff indicates significant movement towards development of two landscape-level stewardship projects. In an effort to mitigate potential litigation from concerned stakeholders, the SNF has convened a committee to review two upcoming forest fuels treatment projects that are located in the CFSA:
• Dinkey North (approximately 3,000 acres) • Dinkey South (approximately 1,500 acres)
The committee is tasked with a review of forest fuels treatment activities that are being considered for each project. Made up of individuals representing several stakeholder 17Ibid.
Fuel Procurement Plan for Biopower in the Central Sierra TSS Consultants
19 of 49
groups (including SCE as represented by John Mount), the SNF has formed this committee to provide collaborative input into the project development process. This collaborative input provided by the range of stakeholders will hopefully minimize the potential for litigation. Entities such as the Sierra Forest Legacy have been active litigants targeting forest management projects in the Sierra Nevada range. A representative18 for the Legacy is a member of the review committee. SCE staff19 have experience implementing stewardship contracts on the SNF. The Power One Thin Stewardship Contract was implemented in 2006 with Sierra Forest Products (SFP) as the successful contractor. Included in the Power One Thin project were approximately 340 acres of ponderosa pine plantations that were thinned with about 1,300 thousand board feet (MBF) of sawlogs removed and transported to the SFP facility at Terra Bella. In addition, interviews with the SNF High Sierra Ranger District timber staff20 indicate work has begun on the Dawn Meadow Stewardship Project, located within the CFSA. A total of 393 acres of plantations and natural forest are slated for treatment. Plans are to thin and remove both sawlogs and woody biomass material (that meet fuel specifications). This work is undertaken as part of the SNF’s plan to ramp up the number of integrated resource contracts being implemented on the Forest. This increased emphasis on use of stewardship contracts by the SNF bodes well for a prospective biopower project near Shaver Lake.
Risk Associated with Forest-Sourced Fuel Although it appears that the CFSA would provide a sufficient volume of high quality, cost effective fuel, this conclusion would be reached only without full consideration of relevant factors. For instance, fuel sourced from the CFSA is typically available during the six months that the snow level does not preclude gathering forest-sourced fuel. And while it might be possible to extend the collection season a few months at either end of that seasonal impact (depending on weather), there would still be up to six months when fuel deliveries would be curtailed. For year-round operation, it is prudent to access additional fuel from sources that provide year-round supply. A key tenant of this fuel procurement plan is a diverse fuel blend – not solely fuel accessed from forest-based operations. Not only is it industry standard, but by accessing a diverse supply, a more cost effective fuel blend can be sourced and delivered year round (see Biomass Fuel Pricing section). Fuel suppliers are less likely to be in a position to leverage their fuel pricing with the understanding that a diverse and year- round fuel supply was available and planned for use at a prospective Shaver Lake facility. Forest-sourced fuel will consistently be the most expensive fuel procured as addressed in Biomass Fuel Pricing section.
18Craig Thomas, Executive Director, Sierra Forest Legacy. 19Patrick Emmert, SCE Chief Forester formerly with SFP. 20Diane Savin-Dukleth, Timber Staff, High Sierra Ranger District.

Fuel Procurement Plan for Biopower in the Central Sierra TSS Consultants
20 of 49
FUEL SUPPLY SOURCES AND RISKS
Like forest-sourced fuel, biomass fuel from the TFSA represents a supply of sustainable, high-quality fuel. Accessing biomass fuel from the TFSA will also facilitate procurement of a more diverse fuel blend. A more diverse fuel blend provides opportunities to source a more cost-effective year-round fuel supply, unlike the seasonally available forest fuels that are primarily available at higher elevations in the snow zone and thus only available six to eight months per year. If biomass fuel resources such as urban wood waste can be sourced year round, then a required fuel storage area at a prospective biopower facility can be downsized, thus minimizing the fuel storage area footprint and associated costs. The biomass fuel marketplace is exceedingly dynamic. Variables such as diesel fuel prices, land management policies, air emissions regulations, and waste reduction policies will have a profound impact on fuel supply availability and pricing. Outlined below are pressing future fuel supply source opportunities and risks that should be considered.
Orchard Removals and Prunings per SB-705 Much speculation has revolved around the ban on agricultural burning as a result of California Senate Bill 705 (see Appendix A). This bill amends the California Health and Safety Code (CH&SC) and requires the San Joaquin Valley Unified Air Pollution Control District to ban open burning of waste produced by commercial agricultural operations. Under terms of the ban, all orchard removal materials are banned from open burning commencing June 1, 2007 and other materials by June 1, 2010 (such as vineyard removals and pruning from surface-harvested crops, e.g., almond and walnut). Although a burn ban might seem to imply a benefit to biopower facilities, making such material available for fuel, it comes with its problems. CH&SC allows the Air Districts to postpone burn prohibition commencement dates under certain conditions. One such condition is determination by the District that there is no economically feasible alternative for eliminating the waste, which goes directly counter to its use as a fuel. Case in point was an amendment proposed by the District to postpone the June 1, 2007, commencement date of burn prohibition for citrus orchard removals until June 1, 2010. While this amendment did not materialize, it does provide an indication that Air Districts will seriously consider issuing burn ban amendments or extensions if economical alternatives are not available to the growers. If growers could change their perspective and see that providing their waste to another user is beneficial, then both parties could benefit from the ban on burning. However, it typically does not come without some cost. Growers might have to retain on their property their removed orchard material for a period of time before it was deemed collectable as fuel, thus preventing timely replanting of the area. After discussions with industry experts, air quality engineers, and others familiar with this ruling, the authors believe that any attempt by biomass power plants to leverage use of SB 705 to increase service acre fees of orchard removals to the growers (resulting in cheaper biomass fuel) will be met with similar postponement actions. This paper makes assumptions based on historical information, including burn bans already in play. Thus, if changes to those regulations occur, it could impact the cost forecasts,

Fuel Procurement Plan for Biopower in the Central Sierra TSS Consultants
21 of 49
namely with a potential increase in costs due to unanticipated unavailability of orchard-sourced fuel.
Alternative Daily Cover Policy Large volumes of urban wood and green waste are used as alternative daily cover (ADC) in California landfills. This is primarily because the State of California allows counties to count 100% of ADC as diversion credit for meeting State-mandated recycling levels. Therefore, every ton of wood waste which is used for ADC is considered “diverted” and the counties receive diversion credits. Considering the quality control requirements necessary to produce biomass fuel versus the production of ADC, it is not surprising that significant amounts of wood wastes are currently disposed of as ADC. From such a perspective of the provider of waste, it could simply be deemed a matter of choice of the lower cost option. Thus, if the cost to dispose of wood waste as fuel reaped more benefits or less cost, the urban wood waste provider might be persuaded by good business decision to consider or pursue that option. There have been various legislative efforts in the past to ban the use of wood waste and green waste for ADC. However, none of the state legislative initiatives have proven successful. The authors believe that within the next three to five years, there is a strong possibility that legislation reducing the use of wood waste and green waste for ADC will be enacted in California. Such legislation would lead to increased amounts of wood waste and green waste entering the marketplace. TSS estimates that only about 30% of this ADC volume would be suitable for biomass fuel with the bulk going into compost and mulch markets. However, legislation as noted could substantially increase the amount of biomass fuel available within the State of California. This would likely have the effect of decreasing the forecasted biomass fuel price noted in this report.
Cost of Transport The cost of transporting biomass represents the single most significant expense when procuring biomass. Factors that greatly impact the cost to transport commodities such as biomass fuel are diesel fuel cost (currently $2.35/gallon), workers compensation expense, and maintaining a workforce (finding drivers). At this time, diesel fuel costs are the most significant variable impacting transport costs. Diesel fuel pricing volatility is primarily driven by the cost of crude oil. Figure 7 shows the rise and fall in diesel prices from September 2006 to March 2009. As it clearly demonstrates, only recently (August 2008) have diesel fuel prices begun to decline, as crude oil prices have fallen due to declining demand related to current economic conditions. Should diesel fuel prices return to the high of June-September 2008, it would practically double the diesel fuel estimate assumed in the fuel pricing forecast (see Biomass Fuel Pricing). The overall effect would raise the delivered cost by 5% to 10%.

Fuel Procurement Plan for Biopower in the Central Sierra TSS Consultants
22 of 49
Figure 7 – U.S. and West Coast Diesel Fuel Prices21 (September 2006 to March 2009)
BIOMASS FUEL PRICING
While biomass fuel availability is important, without economical biomass fuel, a biopower facility cannot operate efficiently no matter how much fuel is available. A variety of factors impact the delivered cost of biomass fuel, including costs associated with harvest, collection, processing, transport, and potential competition.
Costs To Harvest, Collect, Process, and Transport Based on interviews conducted with biomass fuel processors and the authors’ collective experience with activities in support of the harvest, collection, processing and transport of biomass fuel, a cost summary matrix was generated. Costs are presented as an average based on actual experience. Table 12 provides the cost estimates in a matrix format.
21Energy Information Administration, http://tonto.eia.doe.gov/

Fuel Procurement Plan for Biopower in the Central Sierra TSS Consultants
23 of 49
Table 12 – Costs to Harvest, Collect, Process and Transport Biomass Fuel by Fuel Type (Expressed as $/BDT)
Fuel Type
Harvest
Collect
Process
Transport
Totals
Comments
Forest Fuels Reduction Residuals
$12
$6
$13
$14
$45
For harvest & collect, reflects costs mitigated by cost share of service contracting by USFS.
Timber Harvest Residuals
$3
$18
$14
$35
For harvest & collect, costs are mitigated due to revenue generated through sawlog sales.
Small-Log Sawmill Residuals
$0
Assumes that residuals are conveyed directly to the fuel storage yard.
Wildland Urban Interface Residuals – CFSA
$15
$14
$29
Assumes that residuals are conveyed directly to central collection yard.
Wildland Urban Interface Residuals – TFSA
$15
$32
$47
Assumes that residuals are conveyed directly to central collection yard.
Agricultural Residuals – Orchard Removals
$8
$6
$12
$16.50
$42.50
For harvest & collect, assumes that orchard owners pay a service fee of $250 - $350/acre.
Agricultural Residuals – Orchard Prunings
$12
$6
$13
$16.50
$47.50
For harvest & collect, assumes that orchard owners pay a service fee of $100 - $150/acre.
Urban Wood Waste
$14
$12.50
$26.50
For harvest & collect, assumes continuation of tip fees charged for material provided to urban wood processors.
Note that this matrix has the following assumptions:
• Transport costs assume that the average haul distances are: o 20 miles for fuels sourced within the CFSA o 45 miles for fuels sourced within the TFSA
• Average BDT per truckload varies by fuel type: o 14 BDT for forest-sourced fuel o 15 BDT for agricultural residuals o 18 BDT for urban wood waste
• Transport is calculated at the following rates with no backhaul available: o $5.00/mile for forest-sourced fuel22 o $2.75/mile for agricultural residuals
22Cost to transport forest-sourced wood waste is relatively high due to transporting biomass fuel over unpaved or unimproved roads, where trucks operate at low speed (using higher fuel/mile) and have higher maintenance costs due to rough travel surfaces.

Fuel Procurement Plan for Biopower in the Central Sierra TSS Consultants
24 of 49
o $2.50/mile for urban wood waste • Diesel fuel cost is constant at around $2.50 per gallon. • Labor costs are stable at today’s rates.
Transport Opportunities While transport costs posted above assume that trucks transporting biomass fuel are on a dedicated haul (no backhaul), there may be ample opportunities to arrange transport of commodities (e.g., lumber products) as a fronthaul and biomass fuel (e.g., urban wood waste) as a backhaul. This could be accommodated with a co-located small-log sawmill. Specially equipped trailers (known as curtain-sided vans) are able to transport both lumber and wood fuel. From 1990 to 1992, the Sequoia Forest Products sawmills at Auberry and Dinuba utilized curtain-sided vans to facilitate transport of lumber products into Southern California and Mexico and backhauled biomass fuel. Interviews with former employees23 of Sequoia Forest Products indicate that this transport opportunity significantly mitigated haul costs of both finished lumber and biomass fuel.
Service Fees from Public Forests The USFS contracts with private sector enterprises to accomplish fuels reduction, forest restoration, and timber stand improvement objectives. As discussed earlier in this report, their cost of services can be partially paid for with a goods-for-services arrangement whereby the value of the sawlogs completely or partially offsets the costs of services rendered. The service fees quoted here assume that there are no sawlogs available to offset the costs of services rendered. This assumption is based on the industry practice of placing value on sawlogs larger than 18” diameter; however, most fuels reduction and forest restoration activities would focus on collection and removal of smaller diameter trees. Thus, the value of the material proposed to be removed would effectively have zero or negative value. A negative value would mean one would be paid for taking it. The issue is the USFS, in most cases, would need to budget for providing a service fee to contractors for removing the smaller stems, undergrowth and slash. Interviews with USFS personnel24 indicate that service contracts currently being implemented on local national forests are compensating private contractors at rates ranging from $550 per acre (natural forest thinning services) to $745 per acre (plantation thinning services). As noted in TSS fuel availability study report, average volume recovered from fuels treatment and forest restoration activities on the SNF is 25 GT per acre. Assuming 45% moisture content brings the volume recovered to 13 BDT per acre. If service fees are deemed available at $550 per acre to offset the costs associated with fuels treatment and forest restoration, and biomass fuel recovery is 13 BDT per acre, then service fees can offset costs at about $42 per BDT. Due to historically inconsistent funding availability for implementing service contracts on public lands, this procurement plan assumes service fees are only available to discount biomass fuel costs at $21 per BDT.
23Patrick Emmert, former log procurement forester, Sequoia Forest Products. 24Patrick Gallegos, Acquisition Team Leader, Southern Sierra Province, Paul Miller, Timber Sale Contracting Officer, Sierra and Sequoia National Forests.

Fuel Procurement Plan for Biopower in the Central Sierra TSS Consultants
25 of 49
Service Fees from Orchard Owners In order to facilitate timely and complete removal of orchards, an orchard removal service fee is paid by the orchard owner to compensate orchard removal contractors. This service fee can range from $200 to $350 per acre depending on the types of services rendered, size of the orchard, and distance to the biopower facility. As mentioned earlier, SB 705 provides specific mandates prohibiting the open burning of orchard material. Orchard managers work closely with contractors to time operations for orchard removal and prunings removal to address variables such as availability of new orchard stock, weather, and ready markets for biomass material generated. These fees can net to an equivalent value of $8 to $12 per BDT for orchard removal services.
Tip Fees for Urban Wood Collection Most urban wood waste in the form of pallets, construction wood, demolition wood and tree trimmings are currently collected at wood recycling facilities and/or transfer stations. These facilities charge a service fee (also known as a tip fee) for customers to deliver wood waste. This fee is charged for the right to dispose of wood waste as an alternative to disposal at a landfill. Typically, transfer stations and wood recycling facilities will offer discounted tip fees as compared with landfill tip fees to provide economic incentive for receipt of material. Tip fees in the greater Fresno area for clean wood waste and tree trimmings delivered by wood waste generators (e.g., homeowners, tree service companies, construction companies) to wood recycling facilities are summarized below.
• $15 to $30 per GT – Clean wood waste • $25 to $30 per GT – Tree trimmings • $50 to $67 per GT – Mixed construction and demolition wood
Tip fees collected are typically utilized to address cost items associated with operating a facility and the expense to sort, process, and transport soil amendment, landscape cover, and biomass fuel to customers. The tip fees charged for receipt of biomass is why the harvest and collection fees currently show as zero (see Table 12). For the next phase of their operations, many wood recycling yards prepare and sell products at the facility for customers to purchase and transport in bulk. These wood recycling yards will sort and process material for targeted uses (soil amendment, landscape cover, and biomass fuel) based on optimized market opportunities and values for the products generated, with costs as reflected as processing (see Table 12).
Current Market Pricing Interviews with fuel procurement managers, orchard removal contractors, and urban wood processors provided current biomass fuel market pricing for fuel sourced from the TFSA. Table 13 summarizes biomass fuel pricing trends.

Fuel Procurement Plan for Biopower in the Central Sierra TSS Consultants
26 of 49
Table 13 – Summary of Biomass Fuel Pricing for Material Sourced from Within the TFSA
($/BDT for fuel delivered to biopower facilities)
Fuel Type
Low $/BDT
High $/BDT
Comments
Forest Fuels Reduction Residuals Not currently purchased Timber Harvest Residuals Not currently purchasedSmall-Log Sawmill Residuals Not currently purchasedWildland Urban Interface Residuals Not currently purchasedAgricultural Residuals – Orchard Removals $24 $32 Agricultural Residuals – Orchard Prunings $30 $36 Urban Wood Waste (including tree trimming material) $18 $26
Pricing figures in Table 13 are for biomass material delivered to the biopower facility. Fuel pricing is presented in a low/high range, as fuel procurement managers typically set pricing based on fuel quality (heating value, ash content). This can be variable depending on the methods suppliers use to collect and process the biomass material.
Biomass Fuel Practically Available Within the CFSA and TFSA Taking into account key factors such as fuel market pricing, current fuel market conditions, current soil amendment markets, economies of transport and the following assumptions, a forecast regarding practically available biomass fuel can be generated. Assumptions include:
• All four biopower facilities sourcing fuel from the TFSA continue to operate (current competition does not diminish).
• The El Nido biopower facility is re-started in 2009 (potential competition). • Local economy returns to pre-2008 levels by first quarter 2011. • The three noted Fire Safe Councils in the CFSA and TFSA are able to secure
state/federal funding to support fuels treatment efforts. • USFS-SNF is able to maintain fuels treatment funding to facilitate landscape-level
fuels treatment activities for increased integrated resource contracting. • SCE continues to conduct forest management activities.
Table 14 summarizes biomass fuel considered practically available within the CFSA and the TFSA. Figure 8 below provides a graphic representation of the practically available biomass fuel sourced from the CFSA and TFSA. This shows there is sufficient practically available biomass fuel in the TFSA to support an 8 MW25 biopower facility supplanting, if need be, the CFSA fuel supply. As noted in the TSS Fuel Availability study, utilizing forest-sourced fuel from company lands with progressive fuel reduction, and supplanted by fuel sourced from nearby federal lands, supports a biopower facility at 10 to 12 MW.
25As a general rule of thumb, a commercial-scale biopower facility consumes approximately 8,000 BDT of fuel per year per MW.

Fuel Procurement Plan for Biopower in the Central Sierra TSS Consultants
27 of 49
Table 14 – Summary of Biomass Fuel Practically Available from the CFSA and the TFSA
Years 1 to 5
Fuel Type
CFSA BDT/Year
TFSA BDT/Year
Forest Fuels Reduction Residuals 59,600 Timber Harvest Residuals 4,850 Small-Log Sawmill Residuals 5,000 Wildland Urban Interface Residuals 900 1,500 Agricultural Residuals – Orchard Removals 31,217 Agricultural Residuals – Orchard Prunings 17,550 Urban Wood Waste (including tree trimming material) 18,273
Totals 70,350 68,540
Figure 8 – Summary of Practically Available Fuel
Optimized Fuel Blend Forecast A primary objective of this fuel procurement plan is to assess the practical availability of biomass fuel resources to sustain a 12 MW biopower facility with an annual fuel usage of 96,000 BDT. Table 15 suggests that the total practically available volume for both the CFSA and TFSA amounts to 138,890 BDT per year. However, this may seem to give an overly optimistic estimate of available fuel, where the different fuel components may not align well to the optimum fuel blend. In order to more accurately forecast fuel pricing, an optimized fuel blend must be calculated. Factors considered when generating this fuel blend include fuel quality, market demand (competition), and pricing. Presented in Table 15 is a fuel blend forecast optimized for the Shaver Lake biopower facility. Figure 9 provides a graphic representation of the optimized fuel blend forecast.

Fuel Procurement Plan for Biopower in the Central Sierra TSS Consultants
28 of 49
Table 15 – Optimized Fuel Forecast Years 1 to 5
Fuel Type
BDT/Year
Percent of Total
Forest Fuels Reduction Residuals 40,000 41% Timber Harvest Residuals 3,000 3% Small-Log Sawmill Residuals 5,000 5% Wildland Urban Interface Residuals 1,500 2% Agricultural Residuals – Orchard Removals 25,000 26% Agricultural Residuals – Orchard Prunings 7,000 7% Urban Wood Waste (including Tree Trimming material) 15,000 16%
Totals 96,500 100%
Figure 9 – Optimized Fuel Blend Forecast Years 1 to 5
Biomass Fuel Physical Characteristics Suitability of a potential fuel for use in a biopower application is typically a function of physical characteristics such as heating value and ash content. Traditionally, these characteristics are determined using defined laboratory testing procedures. Utilizing data obtained from interviews with fuel procurement managers, a matrix of heating values, ash content, and moisture content data by fuel type was generated. Table 16 summarizes these physical characteristics for biomass fuel considered for this fuel procurement plan. This table shows the criteria a fuel procurement manager would use to qualify whether potential fuel targeted for procurement meets performance criteria for the facility. This helps to assure the optimized fuel blend as required for efficient and cost effective boiler operation.

Fuel Procurement Plan for Biopower in the Central Sierra TSS Consultants
29 of 49
Table 16 – Characteristics of Biomass Fuel Practically Available Within the CFSA and TFSA
Fuel Type
High Heating Value
(BTU/dry pound)
% Ash (by
weight)
Moisture Content
Forest Fuels Reduction Residuals 8,500 – 8,800 2-3% 35 – 55%Timber Harvest Residuals 8,500 – 8,600 5-7% 35 – 50%Small-Log Sawmill Residuals 8,300 – 9,900 1–3% 35 – 45%Wildland Urban Interface Residuals 8,500 – 8,800 3-7% 35 – 50%Agricultural Residuals – Orchard Removals 8,000 – 8,200 2-3% 25 – 35%Agricultural Residuals – Orchard Prunings 7,900 – 8,200 2-5% 25 – 35%Urban Wood Waste (including tree trimming material) 7,900 – 8,200 3-6% 20 – 30%
Five-Year Fuel Price Forecast There clearly exists a robust and dynamic market for biomass fuel sourced from the TFSA. Any fuel sourced from the TFSA must be priced competitively at the source and the haul cost must be allocated. An important consideration for fuel price forecasting is the economics of fuel transport for fuel sourced from the TFSA using current market conditions. This forecast assumed that no backhaul opportunities exist. Thus, if they are realized and added to the price forecast, the net overall impact would be a reduction in the delivered cost of fuel. Fuel sourced from the CFSA is relatively distant from other operating biopower projects and as such does not have the same competitive pricing pressure. In consideration of these factors, the authors have developed the following fuel price estimates. Table 17 provides fuel pricing estimates in a low and high range to account for differences in haul costs and potential cost share (e.g., service fees potentially available from USFS).
Table 17 – Biomass Fuel Pricing for the CFSA and TFSA
Fuel Type
Low Estimate
$/BDT
High Estimate
$/BDT Forest Fuels Reduction Residuals 42.50 48.00 Timber Harvest Residuals 32.00 37.00 Small-Log Sawmill Residuals 0.00 0.00 Wildland Urban Interface Residuals 25.00 35.00 Agricultural Residuals – Orchard Removals 40.00 45.00 Agricultural Residuals – Orchard Prunings 42.00 47.00 Urban Wood Waste (including tree trimming material) 35.00 40.00
Note that sawmill residuals are valued at a discounted rate, as it is anticipated that steam sales from the biopower facility will generate enough revenue to procure (or trade) sawmill residuals at $0 cost to the biopower facility. Breadth of a market for buyers of steam was not assessed as part of this report. Depending which of the three prospective sites is chosen, a biopower facility could be sited near an industrial facility.

Fuel Procurement Plan for Biopower in the Central Sierra TSS Consultants
30 of 49
Utilizing an optimized fuel blend as presented in Table 15 and the fuel pricing projection as presented in Table 17, a blended fuel pricing forecast was generated. Table 18 provides the best case and base case outcomes assuming a 3% annual price escalation for the 2011-2015 time period. The price escalation factor is used here to reflect potential increases in labor and diesel fuel costs over time.
Table 18 – Blended Fuel Price 5 Year Forecast Summary 2011-2015 Fuel
Forecast Scenario
Annual Fuel Price ($/BDT) ($/MMBtu)
2011 2012 2013 2014 2015 Best Case
$37.92 ($2.26/MMBtu)
$40.18 ($2.40/MMBtu)
$41.39 ($2.47/MMBtu)
$42.63 ($2.54/MMBtu)
$43.91 ($2.62/MMBtu)
Base Case
$44.01 ($2.62/MMBtu)
$45.33 ($2.70/MMBtu)
$46.69 ($2.78/MMBtu)
$48.09 ($2.87/MMBtu)
$49.53 ($2.95/MMBtu)
OBSERVATIONS AND RECOMMENDATIONS
Having now conducted a fuel availability and fuel pricing analysis, the authors offer the following observations and recommendations.
• Infrastructure for processing and delivery—agriculture and urban sources. Due to the highly-developed markets currently utilizing urban wood waste material and orchard removals as biomass fuel in Central and Northern California, there is robust wood waste processing and transport infrastructure already in place. The infrastructure to collect, process, and transport orchard prunings is not well developed. This is partly due to the fact that SB 705 prohibition on the open burning of prunings will not be implemented until June 2010.
• Infrastructure for processing and delivery—forest sources. Currently very little forest-sourced fuel is utilized by Central California biopower facilities. Development of the infrastructure to source forest fuels will be key, as almost 50% of the optimized fuel blend is sourced directly from forest-based operations.
• Forest management objectives and policies—private forestland. Unlike many other forested states, California has taken a proactive approach to set forest management guidelines that are now being applied across all private forest ownerships. This indicates strong public interest and sensitivity to forest management activities.
• Forest management objectives and policies—public forestland. The public lands located within the CFSA are a very significant component of the landscape and are a key resource for the long-term availability of biomass fuel. Close coordination and timely communication in advance with the USFS to optimize locations and timing of fuels treatment and forest restoration projects is critical.

Fuel Procurement Plan for Biopower in the Central Sierra TSS Consultants
31 of 49
• Current competition for the wood fuel resource. Well-developed competition for biomass fuel which currently exists in Central and Northern California is significant and has set pricing and procurement trends.
• Diversity of fuel types and suppliers. The development of a diverse range of fuel types and a financially stable set of fuel suppliers is critical to mitigate adverse economic and volumetric constraints, thus providing cost-efficient renewable power for the consumer. It is a primary tenet of this fuel procurement strategy that developing and maintaining a diverse range of fuel types and fuel suppliers is key to the establishment of a successful fuel procurement program. Maintaining fuel diversity will optimize fuel pricing and mitigate potential market impacts affecting fuel availability (e.g., current downturn in housing starts is impacting availability of urban wood waste).
• Transport opportunities. Due to the expense associated with the transport of wood fuel from the TFSA, certain economies of transport would significantly reduce the delivered cost of wood fuel from this region. A potential opportunity to mitigate transport costs would be a fronthaul/backhaul arrangement such that truck/trailer combinations moving lumber product from Shaver Lake to markets in Fresno or Visalia could backhaul wood fuel on the return trip to Shaver Lake. The use of curtain van trailers could facilitate this lumber/wood fuel transport. In the late 1980’s, the Sequoia Forest Products facility at Auberry utilized this transport strategy to move lumber products into northern Mexico and backhaul wood fuel to the Auberry biopower facility.26 While there may be opportunities to backhaul wood fuel from more distant sources (depending on fronthaul destinations), for the purposes of this fuel procurement plan only the core (30 mile radius) and tributary (50 mile radius) regions were considered for analysis.
Strategic Targeting of Fuel Types and Suppliers The authors suggest that a disciplined fuel procurement plan include a strategic set of criteria to rank fuel quality and pricing. Important factors which should be considered in the quantification of the fuel resource adequacy and pricing strategies include:
• Fuel Characteristics. Fuel must meet minimum specifications as determined by the combustion technology employed at a prospective biopower facility near Shaver Lake. Key fuel characteristics include:27
o High heating value – target ______ BTU/pound (as delivered basis)
o Moisture content – average __% (wet basis)
o Size – assume __ inch minus
o Ash content – __ to __%
An example of a fuel specification sheet suitable as an exhibit in a fuel procurement agreement is included in Appendix B
26Per discussions with Patrick Emmert, Chief Forester, Southern California Edison. 27To be completed with combustion technology vendor input.
Fuel Procurement Plan for Biopower in the Central Sierra TSS Consultants
32 of 49
• Pricing. Economic and cost effective fuel is a major driver in the financial performance of a biomass power plant.
• Time of year delivery. Some fuel types such as those sourced from forest operations are only available on a seasonal basis. For example, forest-sourced fuel such as that generated as a result of timber harvest activities or forest fuels reduction are typically available only from June through November, depending upon weather conditions.
• Competition. Certain fuel types, such as timber harvest residues and forest fuels reduction residuals, are more readily available to the Shaver Lake facility (due to its location) than to competing facilities such as Rio Bravo Fresno. Alternatively, the competing plants are located more tributary to agricultural and urban wood fuel sources.
• Fuel Collection Yards. The three operating Fire Safe Councils located within the CFSA and TFSA represent volunteer-based efforts to facilitate fire defensible communities. While these efforts do not generally result in significant volumes of woody biomass fuel, they do represent key opportunities for SCE to engage local communities. Guidelines (stating what material is acceptable as raw material for biomass fuel) need to be issued for use at biomass collection yards managed by the FSC to facilitate and assure their use as biomass fuel. Appendix C (Urban Wood Waste/WUI Material Guidelines) provides sample guidelines.
Fuel Storage Accumulation of fuel for winter storage is critical, as a prospective biopower facility is planned for baseload year-round operation. Forest-sourced fuel will be delivered from June through November (weather permitting), while agricultural residuals will be available from November through March, with urban wood and sawmill residuals potentially available year round. The authors estimate a prospective Shaver Lake facility will need to allocate approximately 3.5 to 4 acres for fuel storage, which allows for storage of enough material to support approximately four months of baseload operation for a 10 to 12 MW facility. This estimate assumes a fuel pile height of 25 feet and a fuel pile density of 1.5 BDT per cubic unit.28 Actual fuel storage acreage will vary depending on fuel handling system design. A fuel storage facility was included in the capital cost estimate (prepared by TSS, April 2009), though it did not provide details regarding the fuel handling system design.
Fuel Procurement Agreements A variety of fuel procurement agreements should be utilized to secure fuel for the Shaver Lake facility. Summarized below is a brief description of fuel procurement agreements that can be utilized.
28Cubic unit equates to 200 cubic feet.

Fuel Procurement Plan for Biopower in the Central Sierra TSS Consultants
33 of 49
• Letter of Intent. A non-binding agreement to formally begin discussions regarding fuel availability and pricing. This is typically the initial agreement, one that brings the parties to the table.
• Binding Letter of Intent. Similar to the letter of intent but with language that “binds” the parties to a commitment for fuel volume and pricing. This is commonly used by project developers seeking project financing. It demonstrates to the private financial markets that binding commitments for fuel are available.
• Short-Term Purchase Agreement. Fuel procurement agreement with a duration of less than one year. Defines delivery schedule, fuel specifications, volume committed, and pricing. May have defined monetary incentives for delivery of quality fuel (low ash, high BTU) and/or for pro-rated volumes of fuel (higher fuel delivery volumes equal higher delivered prices).
• Long-Term Purchase Agreement. Similar to short-term purchase agreement, but the contract term is two to five years in length. Fuel pricing may be indexed to account for increases in labor and diesel fuel costs. Typically, the Consumer Price Index and New York Mercantile Exchange diesel price index are utilized if fuel price indexing is considered.
Included in the Appendix are examples of a fuel specification sheet (Appendix B) and a non-binding letter of intent (Appendix D). Also attached (Appendix E) is a table of commonly used forest products conversion factors that may be helpful when negotiating with potential fuel suppliers.
Fuel Procurement Organization If a prospective Shaver Lake biopower facility were to be commissioned during the third quarter 2011, then fuel deliveries should commence mid second quarter 2011. This facilitates testing of the fuel handling system and allows accumulation of fuel inventory for boiler testing and commercial start-up operations. In order to support the long-term fuel procurement program, a fuel procurement manager should be retained as a permanent employee. The authors recommend that the fuel procurement manager be well versed in forest management policy and techniques due to the relatively high volume of forest-sourced fuel (50+ %) that will make up the fuel blend. Appendix F provides a sample job description for a fuel procurement manager.
Implementation Task List and Timeline A fuel procurement plan should incorporate a task list and timeline for implementation. Below is a draft list of tasks with timeline to initiate fuel procurement activities (see Table 19). This assumes a prospective Shaver Lake biopower project is in commercial service third quarter 2011 and that fuel deliveries commence May 2011.

Fuel Procurement Plan for Biopower in the Central Sierra TSS Consultants
34 of 49
Table 19 – Procurement Plan Task List
Task List
Target
Completion Date Draft communications plan. August 2009 Finalize and implement communications plan targeting various stakeholder groups and potential fuel suppliers.
September 2009
Conduct forest thinning and biomass recovery operations on SCE lands. Primary objective is to confirm yields (BDT/acre) of biomass fuel and to provide stakeholders with opportunity to view fuels treatment and forest restoration activities first hand.
August 2009 Meet with USFS to discuss stewardship contracting opportunities. August 2009 Define fuel specifications (for fuel procurement agreements) by fuel type. Fuel specifications to be provided by boiler manufacturer.
September 2009
Draft fuel procurement agreement templates sent to SCE legal counsel for review. Agreement templates to include non-binding letters of intent, short- term fuel purchase agreement and long-term fuel purchase agreements.
October 2009 Finalize fuel procurement agreement templates and fuel specifications. December 2009 Generate ranked list of potential fuel suppliers to begin securing non-binding letters of intent. Fuel quality and pricing are key factors.
January 2010
Initiate use of long-term procurement agreements to secure preferred fuel suppliers. Preferred fuel suppliers are selected based on results of fuel quality testing and competitive pricing.
March 2010 Generate job description for Fuel Procurement Manager. February 2010 Advertise for Fuel Procurement Manager. March 2010 Draft fuel quality and moisture content monitoring procedures and protocols. March 2010 Interview and hire Fuel Procurement Manager. May 2010 Start negotiations with select logging contractors for long-term fuel procurement agreements.
June 2010
Generate job description for fuel quality technician. January 2011 Advertise for fuel quality technician. February 2011 Interview and hire fuel quality technician. April 2011 Commence fuel deliveries. May 2011
CONCLUSION
It is reasonable to conclude that a biopower generation facility co-located with or without a small log sawmill would be able to source sustainable and cost effective fuel long term. This conclusion is based upon current market conditions, the availability of woody biomass fuel in adjacent and tributary areas, using assumptions outlined in this report as well as the fuel procurement criteria outlined herein.