confidential - the ellen macarthur foundation · jacob lau holst chief operating o!cer ... siemens...
TRANSCRIPT

DRAFT VERSION (June 12, 2015) • CONFIDENTIAL • PLEASE DO NOT DISTRIBUTE
DELIVERING THE CIRCULAR ECONOMYA toolkit for policymakers
DELIVERING THECIRCULAR ECONOMYA TOOLKITFOR POLICYMAKERS

DELIVERING THE CIRCULAR ECONOMY – A TOOLKIT FOR POLICYMAKERS • 3
FOREWORD
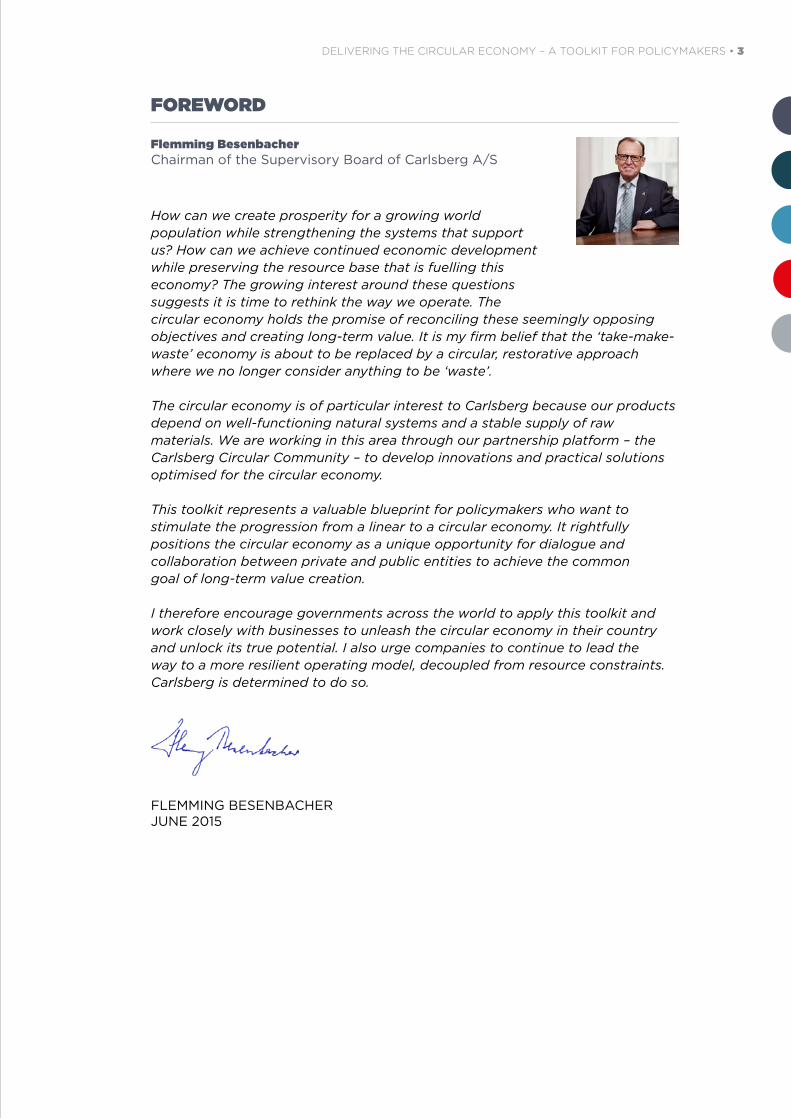
Flemming BesenbacherChairman of the Supervisory Board of Carlsberg A/S
How can we create prosperity for a growing world population while strengthening the systems that support us? How can we achieve continued economic development while preserving the resource base that is fuelling this economy? The growing interest around these questions suggests it is time to rethink the way we operate. The circular economy holds the promise of reconciling these seemingly opposing objectives and creating long-term value. It is my firm belief that the ‘take-make-waste’ economy is about to be replaced by a circular, restorative approach where we no longer consider anything to be ‘waste’.
The circular economy is of particular interest to Carlsberg because our products depend on well-functioning natural systems and a stable supply of raw materials. We are working in this area through our partnership platform – the Carlsberg Circular Community – to develop innovations and practical solutions optimised for the circular economy.
This toolkit represents a valuable blueprint for policymakers who want to stimulate the progression from a linear to a circular economy. It rightfully positions the circular economy as a unique opportunity for dialogue and collaboration between private and public entities to achieve the common goal of long-term value creation.
I therefore encourage governments across the world to apply this toolkit and work closely with businesses to unleash the circular economy in their country and unlock its true potential. I also urge companies to continue to lead the way to a more resilient operating model, decoupled from resource constraints. Carlsberg is determined to do so.
FLEMMING BESENBACHER JUNE 2015

4 • DELIVERING THE CIRCULAR ECONOMY – A TOOLKIT FOR POLICYMAKERS
“There is a new movement within cities, regions and governments to accelerate the move towards a circular economy. This toolkit is a key resource for policymakers to enable them to get to grips with the complexity of this emerging area and develop route maps that will help the transition from linear to circular.”
Wayne Hubbard Chief Operating Officer
LONDON WASTE AND RECYCLING BOARD (LWARB)
“The methodology and insight provided in this toolkit will be invaluable to help mobilise stakeholders in Northern France to develop a shared circular economy strategy. Most importantly, it provides structure to go beyond a ‘nice idea’ and move towards implementation.”
Christian Traisnel Director
CD2E RESPONSIBLE FOR DEVELOPING THE CIRCULAR ECONOMY IN NORTHERN FRANCE
“This inspiring report is very helpful to us – I am sure we will apply some of the tools and insights from the Denmark pilot in our program to accelerate the transition to a circular economy.”
Kees Veerman Policy Coordinator
DUTCH MINISTRY OF INFRASTRUCTURE AND THE ENVIRONMENT
“This report provides a useful methodology that will help move all stakeholders involved in a circular economy transition into action.”
Pere Torres Grau Secretary for Business and Competitiveness
MINISTRY FOR BUSINESS AND LABOUR, GOVERNMENT OF CATALONIA
“A well-structured guide to practical policy development for transitioning to a circular economy.”
Steve Creed Director Business Growth
WRAP
“We are delighted that this report is dedicated to the role of policymakers in the circular economy. We would like to, together with businesses and knowledge institutes, contribute to the transition to a circular economy.”
John NederstigtDeputy Mayor
HAARLEMMERMEER
“The Ellen MacArthur Foundation has once again shown the way forward in how to move to a circular economy. This toolkit is an excellent starting point for policymakers.”
Caroline Ankarcrona
Project Manager for “Resource efficient business models – increased competitiveness”ROYAL SWEDISH ACADEMY OF ENGINEERING SCIENCES (IVA)
DELIVERING THE CIRCULAR ECONOMY – A TOOLKIT FOR POLICYMAKERS • 5
“This report, exploring the policy tools to help deliver a circular economy, provides lots of food for thought. Creating a circular economy is an economic, environmental and moral necessity – it will create jobs in our communities, improve quality of life, and just makes good sense. As the Scottish Government prepares to publish its own circular economy strategy, we are proud to be working with international partners such as the Ellen MacArthur Foundation and the Danish Government towards a more circular economy.”
Richard Lochhead Cabinet Secretary for Rural Affairs, Food and Environment
SCOTTISH GOVERNMENT
“This toolkit is a much needed and relevant aid to policymakers globally to assist them in the transition towards a circular economy. The pilot has been very helpful for Denmark by clearly outlining effective options for Danish policymakers to accelerate the shift towards a circular economy.”
Ida AukenMember of the World Economic Forum Meta-Council
on the Circular Economy 2014-2016; MEMBER OF DANISH PARLIAMENT
“Pinpointing economic opportunities through the combination of company-level analysis, macro-economic modelling and barrier assessment provides a very powerful starting point for our future work on the circular economy.”
Anders Hoffmann Deputy Director General
DANISH BUSINESS AUTHORITY
“This project has been a fruitful experience for us. The systematic approach offered by the toolkit has given us valuable new insights into the potential of, and barriers to, further transitioning towards a circular economy.”
Claus Torp Deputy Director General
DANISH ENVIRONMENTAL PROTECTION AGENCY
“The toolkit offers additional evidence on the circular economy opportunity and provides an important key to help the EBRD to focus on investments increasing resilience and competitiveness in the Bank’s region. It provides us with pragmatic arguments and case studies to use in our engagement with commercial clients and governments.”
Dr. Nigel Jollands Senior Policy Manager
EUROPEAN BANK FOR RECONSTRUCTION AND DEVELOPMENT (EBRD)

6 • DELIVERING THE CIRCULAR ECONOMY – A TOOLKIT FOR POLICYMAKERS
GLOBAL PARTNERS OF THE ELLEN MACARTHUR FOUNDATION

DELIVERING THE CIRCULAR ECONOMY – A TOOLKIT FOR POLICYMAKERS • 7
DISCLAIMER
This report has been produced by a team from the Ellen MacArthur Foundation, which takes full responsibility for the report’s contents and conclusions. While the key contributors and contributors listed in the acknowledgements provided significant input to the development of this report, their participation does not necessarily equate to endorsement of the report’s contents or conclusions. The McKinsey Center for Business and Environment provided analytical support. NERA Economic Consulting provided support for the macroeconomic and policy analysis for Parts 2 and 3 of this report.
This report describes a methodology for circular economy policymaking. It also explores a range of policy options that Denmark – the country of the report’s pilot study – could choose to pursue. The report does not recommend any specific policy intervention to Denmark or to any other country.

8 • DELIVERING THE CIRCULAR ECONOMY – A TOOLKIT FOR POLICYMAKERS
ELLEN MACARTHUR FOUNDATION PROJECT TEAM
Andrew Morlet Chief Executive
Jocelyn Blériot Executive Officer, Lead, Communications and Policy
Stephanie Hubold Lead, Gov. & Cities Programme
Rob Opsomer Project Manager
Dr. Mats Linder Analyst
Ian Banks Analyst
KEY CONTRIBUTORS
DANISH BUSINESS AUTHORITY
Anders Hoffmann Deputy Director General
Dorte Vigsø Chief Advisor
Jes Lind Bejer Special Advisor
Markus Bjerre Head of Section
Stine Nynne Larsen Special Advisor
DANISH ENVIRONMENTAL PROTECTION AGENCY
Claus Torp Deputy Director General
Mikkel Stenbæk Hansen Deputy Head of Department
Lisbet Poll Hansen Deputy Head of Department
Birgitte Kjær Technical Advisor
ACKNOWLEDGEMENTS
PROJECT FUNDER
DELIVERING THE CIRCULAR ECONOMY – A TOOLKIT FOR POLICYMAKERS • 9
CONTRIBUTORS
3GF, DANISH MINISTRY OF FOREIGN AFFAIRS Eva Grambye Special Envoy, Head of Department
AARHUS UNIVERSITY HOSPITAL Thomas Møller Environmental Manager
AALBORG UNIVERSITY
Lene Lange Professor
ACCIÓ GOVERNMENT OF CATALONIA
AXIOMA SOLUCIONES
Ignacio Canal Assistant Manager
CARLSBERG GROUP
Simon Boas Director Corporate Communications and CSR
CONFEDERATION OF DANISH INDUSTRY
Karin Klitgaard Director, Environmental Policy
Nina Leth-Espensen Advisor
DANISH AGRICULTURE AND FOOD COUNCIL
Mads Helleberg Dorff Christiansen Chief Policy Advisor
DANISH CHAMBER OF COMMERCE
Jakob Zeuthen Head of Environmental Policy
DANISH CROWN A/S
Charlotte Thy Environmental Manager
DANISH METALWORKERS’ UNION
Rasmus Holm-Nielsen Consultant
DANISH REGIONS
Morten Rasmussen Team Leader Procurement and Health Innovation
DANISH WIND INDUSTRIES ASSOCIATION
Jacob Lau Holst Chief Operating Officer
DC INGREDIENTS
Jens Fabricius VP Business Development
DE FORENEDE DAMPVASKERIER A/S
Nynne Jordal Dujardin Environmental Manager
DUTCH MINISTRY OF INFRASTRUCTURE AND THE ENVIRONMENT
Kees Veerman Policy Coordinator
EUROPEAN BANK FOR RECONSTRUCTION AND DEVELOPMENT
Dr. Nigel Jollands Senior Policy Manager
ELLEN MACARTHUR FOUNDATION
Ella Jamsin Research Manager
Ken Webster Head of Innovation
ECOXPAC
Martin Pedersen Chief Executive Officer
Michael Michelsen Global Business Manager
Kristian Søllner Chief Technical Officer

10 • DELIVERING THE CIRCULAR ECONOMY – A TOOLKIT FOR POLICYMAKERS
GRUNDFOS
Pernille Blach Hansen Group Vice President
Jørgen Bjelskou Group Public Affairs Director
Anna Pattis Lead Sustainable Product Specialist
Nils Thorup Chief Technical Advisor
Peter Meulengracht Jensen Environmental Project Manager
HANSEN AGENDA
Ditte Lysgaard Vind Senior Consultant
Ida Auken Member of the World Economic Forum Meta-Council on the Circular Economy 2014-2016; Member of Danish Parliament
Søren Gade Former Member of Danish Parliament, The Liberal Party
LONDON WASTE AND RECYCLING BOARD (LWARB)
Wayne Hubbard Chief Operating Officer
MARKS & SPENCER
Kevin Vyse Primary Foods Packaging Technologist & Packaging Innovation Lead
MATACHANA GROUP
Marino Alonso Marketing Director
NCC CONSTRUCTION
Vibeke Grupe Larsen Senior manager, Sustainability
NOVOZYMES A/S
Anders Lyngaa Kristoffersen Head of Public Affairs Denmark
OUROBOROS AS
Jasper Steinhausen Business Developer & Owner
PHILIPS NORDIC
Jens Ole Pedersen Business to Government Manager Philips Healthcare Nordics
RAGN-SELLS
Johan Börje Market Director
SCOTTISH GOVERNMENT
Callum Blackburn Policy Manager – Circular Economy
SIEMENS WINDPOWER
Karin Borg Division EHS Manager
Jonas Pagh Jensen Division EHS Specialist
SUEZ ENVIRONMENT
Henry Saint-Bris Senior VP Marketing & Institutional relations
Christophe Scius European Affairs Manager
Frederic Grivel VP Marketing
TEKNOLOGISK INSTITUT/GENVIND PROJECT
Mads Kogsgaard Hansen Head of Section, Centre for Plastics Technology
THE ECONOMIC MODEL DREAM
Dr. Peter Stephensen Research Director
THE ROYAL SWEDISH ACADEMY OF ENGINEERING SCIENCES
Caroline Ankarcrona Project Manager for “Resource efficient business models – increased competitiveness”
UNITED FEDERATION OF DANISH WORKERS
Jesper Lund-Larsen Political Advisor
DELIVERING THE CIRCULAR ECONOMY – A TOOLKIT FOR POLICYMAKERS • 11
UNITED NATIONS DEVELOPMENT PROGRAMME, INFORMAL INTERAGENCY TASK TEAM ON SUSTAINABLE PROCUREMENT IN THE HEALTH SECTOR (IIATT-SPHS).
Dr. Christoph Hamelmann Coordinator
Mirjana Milic Associate Coordinator
UNIVERSITY COLLEGE LONDON (UCL) INSTITUTE FOR SUSTAINABLE RESOURCES
Professor Paul Ekins OBE, Director; Professor of Resources and Environmental Policy
UNIVERSITY OF COPENHAGEN
Professor Peter Birch Sørensen, Department of Economics
UNIVERSITY OF SHEFFIELD
Professor SC Lenny Koh Director of Advanced Resource Efficiency Centre (AREC)
VESTAS WIND SYSTEMS A/S
Klaus Rønde Senior Manager, Management Systems & HSE Analysis
Pia Christoffersen HSE Specialist, QSE EMEA Region
Peter Garrett Life Cycle Assessment Specialist, Management Systems & HSE Analysis
WRAP
Steve Creed Director Business Growth
PRODUCTION
Ruth Sheppard Editor
ELLEN MACARTHUR FOUNDATION
Sarah Churchill-Slough Design
12 • DELIVERING THE CIRCULAR ECONOMY – A TOOLKIT FOR POLICYMAKERS
TABLE OF CONTENTS
Foreword 3
Disclaimer 7
Acknowledgements 8
Executive summary 13
Reader’s guide 16
1 Why the circular economy matters 19
1.1 From linear to circular – Accelerating a proven concept 19
1.2 A favourable alignment of factors makes the transition possible 28
1.3 The role of policymakers and this toolkit 32
2 Methodology for policymakers to accelerate the transition 39
2.1 Align on starting point, ambition and focus 39
2.2 Assess sector opportunities 52
2.3 Analyse economy-wide implications 73
2.4 How regional differences could impact the methodology 85
3 Case study – Denmark 91
3.1 National perspective 91
3.2 Food & Beverage 102
3.3 Construction & Real Estate 111
3.4 Machinery 123
3.5 Packaging 129
3.6 Hospitals 140
List of figures and boxes 174
About the Ellen MacArthur Foundation 176

DELIVERING THE CIRCULAR ECONOMY – A TOOLKIT FOR POLICYMAKERS • 13
EXECUTIVE SUMMARY
Business leaders and governments alike are acknowledging that continued long-term value creation requires a new economic model that is less dependent on cheap, easily accessible materials and energy, and that is able to restore and regenerate natural capital. In its research to date, the Ellen MacArthur Foundation has demonstrated that the circular economy is a clear value creation opportunity. As many policymakers become interested in this promising model, they envisage the important role they can play in creating the right enabling conditions and, as appropriate, setting direction to unlock it. This report looks at the circular economy opportunity from a country and policymaker perspective, and aims to provide policymakers with an actionable toolkit to help accelerate the transition towards the circular economy.
Delivering the circular economy – a toolkit for policymakers is the result of a collaboration led by the Ellen MacArthur Foundation, with the Danish Business Authority and the Danish Environmental Protection Agency as key contributors, especially in the Denmark pilot phase. The toolkit was developed in cooperation with Danish and international stakeholders, including leading policymakers, businesses and academics. The McKinsey Center for Business and Environment (“MCBE”) provided analytical support. NERA Economic Consulting provided support for the macroeconomic and policy analysis for Parts 2 and 3 of this report. The MAVA Foundation funded the project.
Eight key insights emerged from developing the toolkit and testing it in the Denmark pilot:
1
2
A transition towards the circular economy can bring about the lasting benefits of a more innovative, resilient and productive economy. Modelling conducted in this study suggests that it could lead, in Denmark, to 0.8–1.4% additional GDP growth, the creation of 7,000–13,000 job equivalents, 3–7% reduction in carbon footprint, and 5–50% reduction in virgin resource consumption for selected materials.
These estimates are for 2035 and only consider producing sectors and hospitals, covering 25% of the Danish economy. They do not take into account a further shift towards renewable energy. While such estimates rely by necessity on a number of assumptions and are associated with uncertainty, they confirm the findings from a growing body of research that the impact of a transition to the circular economy on economic growth, job creation and the environment is likely to be positive.
Many circular economy opportunities have a sound underlying profitability, but there are often non-financial barriers limiting further scale-up or holding back development pace. Policymakers can play an important role in helping businesses overcome these barriers.
Barriers include unintended consequences of existing regulations (e.g. definitions of waste that hinder trade and transport of products for remanufacturing), social factors such as a lack of experience among companies and policymakers to detect and capture circular economy opportunities, and market failures such as imperfect information (e.g. for businesses to repair, disassemble and remanufacture products) and unaccounted externalities (e.g. carbon emissions). In addition to creating enabling conditions, policymakers can, as appropriate, set direction for a transition to the circular economy.

14 • DELIVERING THE CIRCULAR ECONOMY – A TOOLKIT FOR POLICYMAKERS
Sector-by-sector analysis can be a valuable approach to address the variety of opportunities and challenges involved in transitioning towards the circular economy. Within each sector, effective circular economy policymaking requires the combination of many policy interventions, and does not rely on a ‘silver bullet’ or blanket solutions.
Policymakers can address market and regulatory failures to create the right enabling conditions for circular economy initiatives to reach scale. They can also more actively steer and stimulate market activity by setting targets, implementing circular and total cost of ownership-oriented public procurement, and investing in innovative pilots and R&D.
Broader changes to the existing fiscal system and the measurement of economic performance could help enable a systemic transition towards the circular economy.
While many circular economy opportunities already have a sound underlying profitability, a number of international organisations, such as the European Commission, the OECD, the International Monetary Fund (IMF), and the International Labour Organization, have suggested further opportunities could be unlocked by shifting fiscal incentives towards labour from resources. However, any such shift is a sensitive matter and needs to be seen in the light of international competitiveness, administrative issues, tax revenue stability and distributional effects. Complementing today’s flow-based metrics such as GDP as a measure of economic success with measures of a country’s stock of assets could be an instrument for policymakers to account for the restoration and regeneration of natural capital.
Industry involvement and cross-government department collaboration are crucial. As the Denmark pilot has shown, involving businesses intensively throughout the process is especially important, for three reasons: (i) get insights and knowledge to identify the most relevant circular economy opportunities and barriers in each focus sector; (ii) create early alignment on common direction for the country and the focus sectors; (iii) further demonstrate circular economy benefits to businesses and build skills as well as capacity.
As businesses are already starting the transition, the circular economy offers an opportunity for policymakers to collaborate with businesses. Furthermore, there is a need for cooperation between different government departments (including business/industry, finance and environment) so that no new unintended policy barriers are created and – like the business solution – the policy response is designed to maximise system effectiveness. Other society stakeholders, including citizens and consumers, labour unions and environmental organisations, should also be engaged.
3
4
5
DELIVERING THE CIRCULAR ECONOMY – A TOOLKIT FOR POLICYMAKERS • 15
Even in a country with a starting position as advanced as Denmark, there are significant opportunities to scale up the transition towards the circular economy, and policymakers can play an important enabling role. Opportunities were investigated in five focus sectors, and the economic potential appears to be the largest in Construction & Real Estate and in Food & Beverage.
In Construction & Real Estate, building sharing, switching from low-value recycling to reuse and high-value recycling, and industrial production and 3D printing of building modules could unlock significant value. In Food & Beverage, maximising value from organic by-products and waste streams through cascaded value extraction in bio-refineries could be an important opportunity. The potential identified in Denmark could, with the right enabling conditions and direction, mostly be captured within the next 20 years.
In European Union member states, EU-level policy interventions would need to complement national policies, as the value chains of many products extend across borders.
Product policy and promoting the market for secondary raw materials are just two examples that could be coordinated at the European level so as to simplify and reduce the cost of doing (circular) business.
The outcomes of applying this toolkit will differ for each country depending on economic and policy starting positions. The process to get to these answers will be similar, with adaptations to local circumstances.
In a first assessment, three factors seem to be the most likely to influence the process itself: (i) level of circularity already achieved and support for circularity; (ii) institutional set-up; and (iii) available resources. While more basic starting positions allow a country to leapfrog to high-performing circular systems, strong starting points provide confidence that circular economy is a viable option to create economic value, and allow a country to move from strength to strength.
7
8
6
These insights are further elaborated in the upcoming sections of this report, which is structured as follows. Part 1 introduces the core concepts of the circular economy and discusses the role of policy within that framework. Part 2 lays out a how-to guide for policymakers who want to design a strategy to accelerate the transition towards the circular economy. Part 3 covers the core findings of the pilot study in Denmark.

16 • DELIVERING THE CIRCULAR ECONOMY – A TOOLKIT FOR POLICYMAKERS
READER’S GUIDE
This report is structured in three parts:
Part 1. Why the circular economy matters This part introduces the core concepts of the circular economy, which provides a positive and viable alternative to the linear ‘take, make, dispose’ economic model that is pervasive at global scale. It discusses how the circular economy might contribute to important policy objectives such as generating economic growth, creating jobs, reducing virgin resource consumption, and reducing carbon emissions, and why it is important for countries to consider transitioning to the circular economy now. There is also a discussion of the potential role of policymakers in the circular economy, and an overview of selected previous work on circular economy policy.
Part 2. Methodology for policymakers to accelerate the transition This part is a how-to guide for policymakers who want to design a strategy to accelerate the transition towards the circular economy. It offers a detailed step-by-step methodology to explore and prioritise circular economy opportunities; quantify their impact; identify the barriers limiting these opportunities; and map and prioritise the policy interventions to overcome these barriers. There is also a discussion of when and how to engage relevant stakeholders, and a final section for policymakers considering how to tailor this methodology to their specific circumstances.
Part 3. Case study – Denmark This part covers the core findings of a pilot study in Denmark. The pilot study was undertaken in order to make this toolkit as concrete and actionable as possible. This part explores circular economy opportunities, barriers and potential policy options for five focus sectors. The findings may be of interest to Danish stakeholders. While they cannot be directly transposed to other countries, they might serve as a source of inspiration for the identification of opportunities, barriers and policy options.

DELIVERING THE CIRCULAR ECONOMY – A TOOLKIT FOR POLICYMAKERS • 17
WHY THE CIRCULAR ECONOMY MATTERS

18 • DELIVERING THE CIRCULAR ECONOMY – A TOOLKIT FOR POLICYMAKERS

DELIVERING THE CIRCULAR ECONOMY – A TOOLKIT FOR POLICYMAKERS • 19
1 WHY THE CIRCULAR ECONOMY MATTERS
The linear ‘take, make, dispose’ economic model relies on large quantities of cheap, easily accessible materials and energy and is reaching its physical limits. The circular economy is an attractive and viable alternative that businesses are already exploring today.
The circular economy is one that is restorative and regenerative by design and aims to keep products, components, and materials at their highest utility and value at all times, distinguishing between technical and biological cycles. This new economic model seeks to ultimately decouple global economic development from finite resource consumption. It enables key policy objectives such as generating economic growth, creating jobs, and reducing environmental impacts, including carbon emissions.
A favourable alignment of factors makes the transition possible. Resource-related challenges to businesses and economies are mounting. An unprecedented favourable alignment of technological and social factors enables the transition to the circular economy.
As many circular economy opportunities have a sound underlying profitability, businesses are driving the shift towards the circular economy. Yet there are often non-financial barriers limiting further scale-up or holding back pace. Policymakers therefore can play an important role to help overcome these barriers and to create the right enabling conditions and, as appropriate, set direction for a transition to the circular economy. This toolkit aims to complement existing literature by offering policymakers an actionable step-by-step methodology to design a strategy to accelerate the transition towards the circular economy.
1.1 From linear to circular – Accelerating a proven concept
CIRCULAR ECONOMY – AN INDUSTRIAL SYSTEM THAT IS RESTORATIVE AND REGENERATIVE BY DESIGN
The linear ‘take, make, dispose’ model, the dominant economic model of our time, relies on large quantities of easily accessible resources and energy, and as such is increasingly unfit for the reality in which it operates. Working towards efficiency – a reduction of resources and fossil energy consumed per unit of economic output – will not alter the finite nature of their stocks but can only delay the inevitable. A deeper change of the operating system is necessary.
The notion of the circular economy has attracted attention in recent years. The concept is characterised, more than defined, as an economy that is restorative and regenerative by design and aims to keep products, components, and materials at their highest utility and value at all times, distinguishing between technical and biological cycles. It is conceived as a continuous positive development cycle that preserves and enhances natural capital, optimises resource yields, and minimises system risks by managing finite stocks and renewable flows. It works effectively at every scale.

20 • DELIVERING THE CIRCULAR ECONOMY – A TOOLKIT FOR POLICYMAKERS
1 Principle
Preserve and enhance natural capital by controlling finite stocks and balancing renew
able resource flows
ReSOLVE levers: regenerate,
virtualise, exchange
Op:m
ise resource yields by circula:ng products, com
ponents and materials
in use at the highest u:lity at all :m
es in both technical and biological cycles ReSO
LVE levers: regenerate, share, op;m
ise, loop Foster system
effec:veness by revealing and designing out nega:ve externali:es
2 Principle
3 Principle
Farm
ing/collection
1
Biochem
ical feed
stock
Reg
eneration
Extraction of
biochem
ical feed
stock2
Cascad
es
Collection
Parts m
anufacturer
Prod
uct manufacturer
Service provid
er
Collection
User
Biosphere
Recycle
Refurb
ish/rem
anufacture
Reuse/red
istribute
Maintain/p
rolong
6 2803 0006 9
Consum
er
MIN
IMISE
SYSTE
MIC
LEA
KA
GE
A
ND
NE
GA
TIVE
EX
TER
NA
LITIES
FIN
ITE M
ATE
RIA
LSR
EN
EW
AB
LES
Biog
as
Reg
enerateSub
stitute materials
Virtualise
Restore
Renew
ables flow
manag
ement
Stock manag
ement
Share
Preserve and enhance natural capital by controlling fi
nite stocks and balancing renew
able resource flow
sReSO
LVE levers: regenerate, virtualise,
exchange
Optim
ise resource yields by circulating products, com
ponents and m
aterials in use at the highest utility at all tim
es in both technical and biological cyclesReSO
LVE levers:
regenerate, share, optim
ise, loop
Foster system eff
ectiveness by revealing and designing out negative externalitiesA
ll ReSOLV
E levers
Figure 1: Circular economy – an industrial system
that is restorative and regenerative by design
flowStock
PRIN
CIPLE 2
PRIN
CIPLE 1
PRIN
CIPLE 3
1 Hunting
and fishing
2 C
an take both p
ost-harvest and p
ost-consumer w
aste as an input
SOU
RC
E: E
llen MacA
rthur Foundation, SU
N and
McK
insey Center for B
usiness and E
nvironment, G
rowth W
ithin: A C
ircular Economy V
ision for a Com
petitive E
urope (20
15). D
rawing
from B
raungart &
McD
onough, C
radle to C
radle (C
2C).

DELIVERING THE CIRCULAR ECONOMY – A TOOLKIT FOR POLICYMAKERS • 21
• Shift to renewable energy and materials
• Reclaim, retain, and restore health of ecosys-tems
• Return recovered biological resources to the biosphere
• Share assets (e.g. cars, rooms, appliances)
• Reuse/secondhand
• Prolong life through maintenance, design for durability, upgradability, etc.
• Increase performance/efficiency of product
• Remove waste in production and supply chain
• Leverage big data, automation, remote sens-ing and steering
• Remanufacture products or components
• Recycle materials
• Digest anaerobically
• Extract biochemicals from organic waste
• Dematerialise directly (e.g. books, CDs, DVDs, travel)
• Dematerialise indirectly (e.g. online shop-ping)
• Replace old with advanced non-renewable ma-terials
• Apply new technologies (e.g. 3D printing)
• Choose new product/service (e.g. multimodal transport)
Figure 2: The ReSOLVE framework: six action areas for businesses and countries wanting to move towards the circular economy
SOURCE: Ellen MacArthur Foundation, SUN and McKinsey Center for Business and Environment, Growth Within: A Circular Economy Vision for a Competitive Europe (2015). Based on S. Heck, M. Rogers, P. Carroll, Resource Revolution (2015).
XCHANGE
22 • DELIVERING THE CIRCULAR ECONOMY – A TOOLKIT FOR POLICYMAKERS
The circular economy provides multiple value creation mechanisms that are decoupled from the consumption of finite resources. Consumption should in a true circular economy only happen in effective bio-cycles; elsewhere use replaces consumption. Resources are regenerated in the bio-cycle or recovered and restored in the technical cycle. In the bio-cycle, life processes regenerate disordered materials, despite or without human intervention. In the technical cycle, circular economy technologies and business models aim to maximise the value extracted from finite stocks of technical assets and materials, and thereby address much of the structural waste in industrial sectors. In the biological cycle, a circular economy encourages flows of biological nutrients to be managed so as not to exceed the carrying capacity of natural systems, and aims to enhance the stock of natural capital by creating the conditions for regeneration of, for example, soil.
In a diverse, vibrant, multi-scale system, restoration increases long-term resilience and innovation.1 The systems emphasis in circular economy matters, as it can create a series of business and economic opportunities, while generating environmental and social benefits. The circular economy does not just reduce the systemic harm engendered by a linear economy; it creates a positive reinforcing development cycle.
The circular economy rests on three key principles, shown in Figure 1.
• Preserve and enhance natural capital by controlling finite stocks and balancing renewable resource flows—for example, replacing fossil fuels with renewable en-ergy or using the maximum sustainable yield method to preserve fish stocks.
• Optimise resource yields by circulating products, components, and materials at the highest utility at all times in both technical and biological cycles – for exam-ple, sharing or looping products and extending product lifetimes.
• Foster system effectiveness by revealing and designing out negative external-ities, such as water, air, soil, and noise pollution; climate change; toxins; conges-tion; and negative health effects related to resource use.
These three principles of the circular economy can be translated into a set of six business actions: Regenerate, Share, Optimise, Loop, Virtualise, and Exchange – together, the ReSOLVE framework (see Figure 2). For each action, there are examples of leading companies that are already implementing them.
Each of the six actions represents a major circular business opportunity that, enabled by the technology revolution, looks quite different from what it would have 15 years ago or what it would look like in a framework for growth in the linear economy. In different ways, these actions all increase the utilisation of physical assets, prolong their life, and shift resource use from finite to renewable sources. Each action reinforces and accelerates the performance of the other actions.
The ReSOLVE framework offers businesses and countries a tool for generating circular strategies and growth initiatives. Many global leaders have built their success on innovation in just one of these areas. Most industries already have profitable opportunities in each area.
A short description of these levers, and examples of businesses that are implementing them, follows below.
REgenerate. Shift to renewable energy and materials; reclaim, retain, and regenerate health of ecosystems and return recovered biological resources to the biosphere. Cumulative new investments in European renewable energy represented USD 650 billion over the 2004–13 period.2 The Savory Institute has influenced the regeneration of more than 2.5 million hectares of lands worldwide.
1 John Fullerton, (Capital Institute) Regenerative Capitalism: How Universal Principles and Patterns Will Shape Our New Economy, (2015).
2 Angus McCrone, Global Trends in Renewable Energy Investment 2014 (Frankfurt School-UNEP Collaborating Centre for Climate & Sustainable Energy Finance, the United Nations Environment Programme (UNEP) and Bloomberg New Energy Finance, 2014).

DELIVERING THE CIRCULAR ECONOMY – A TOOLKIT FOR POLICYMAKERS • 23
Share. Keep product loop speed low and maximise utilisation of products, by sharing them among different users (peer-to-peer sharing of privately owned products or public sharing of a pool of products), by reusing them through their entire technical lifetime (second hand), and by prolonging their lifetime through maintenance, repair, and design for durability. BlaBlaCar is one famous car example growing at 200% per annum with 20 million registered users in 19 countries. BMW and Sixt’s Drive Now offer by-the-minute rental of cars that can be collected and dropped anywhere in a city centre. Lyft matches passengers needing a lift with drivers of their own cars willing to provide one through a smartphone app. In housing, Airbnb has more than one million spaces listed in more than 34,000 cities across more than 190 countries.
Optimise. Increase performance/efficiency of a product; remove waste in production and supply chain (from sourcing and logistics, to production, use phase, end-of-use collection etc.); leverage big data, automation, remote sensing and steering. All these actions are implemented without changes to the actual product or technology. A well-known illustration of this lever is the lean philosophy made famous by Toyota.
Loop. Keep components and materials in closed loops and prioritise inner loops. For finite materials, it means remanufacturing products or components and recycling materials. Caterpillar, Michelin, Rolls Royce, Philips or Renault are just a few companies exploring this direction. For renewable materials, it means anaerobic digestion and extracting biochemicals from organic waste. The Plant is an example of closed loop, zero-waste food production located in Chicago.
Virtualise. Dematerialise resource use by delivering utility virtually: directly, e.g. books or music; or indirectly, e.g. online shopping, autonomous vehicles, virtual offices. Google, Apple, and most OEMs plan to release driverless cars on the market in the next decade.
Exchange. Replace old with advanced non-renewable materials, apply new technologies (e.g. 3D printing or electric engines) and choose new products/services (e.g. multimodal transport). For instance, in 2014 Chinese company WinSun 3D-printed ten houses, each about 195 square metres, in 24 hours.
BENEFITS OF THE CIRCULAR ECONOMY
The transition towards the circular economy can bring about the lasting benefits of a more innovative, resilient and productive economy. The principal benefits to moving to the circular economy are as follows:
• Substantial net material savings and reduced exposure to price volatility: based on detailed product-level modelling, the Ellen MacArthur Foundation has estimated that, in the medium-lived complex products industries, the circular economy represents net material cost savings at an EU level for an ‘advanced’ scenario of up to USD 630 billion annually; in fast-moving consumer goods (FCMG) at the global level net materials savings could reach USD 700 billion annually – see Figure 3.
• Increased innovation and job creation potential: circularity as a ‘rethinking device’ has proved to be a powerful new frame, capable of sparking creative solutions and stimulating innovation. The effects of a more circular industrial model on the structure and vitality of labour markets still need to be further explored, but initial evidence suggests that the impact will be positive (see below).
• Increased resilience in living systems and in the economy: land degradation costs an estimated USD 40 billion annually worldwide, without taking into account the hidden costs of increased fertiliser use, loss of biodiversity and loss of unique landscapes. Higher land productivity, less waste in the food value chain and the return of nutrients to the soil will enhance the value of land and soil as assets. The circular economy, by moving much more biological material through

24 • DELIVERING THE CIRCULAR ECONOMY – A TOOLKIT FOR POLICYMAKERS
the anaerobic digestion or composting process and back into the soil, will reduce the need for replenishment with additional nutrients. This is the principle of regeneration at work.
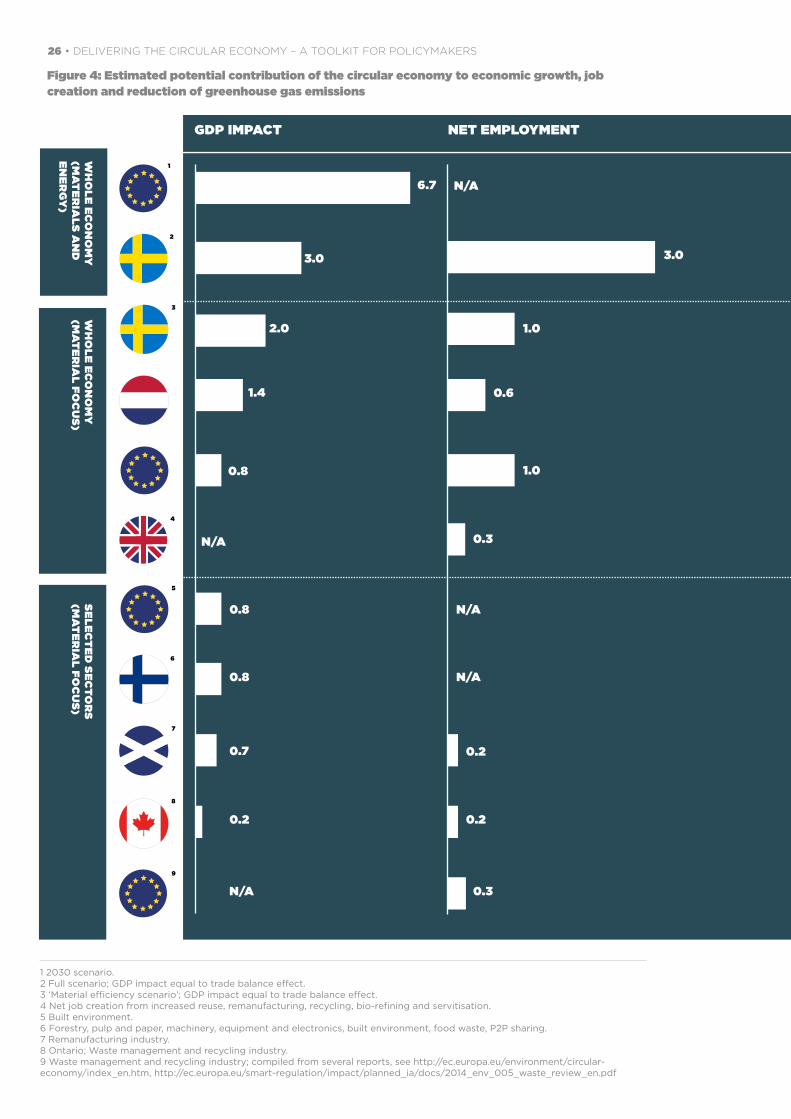
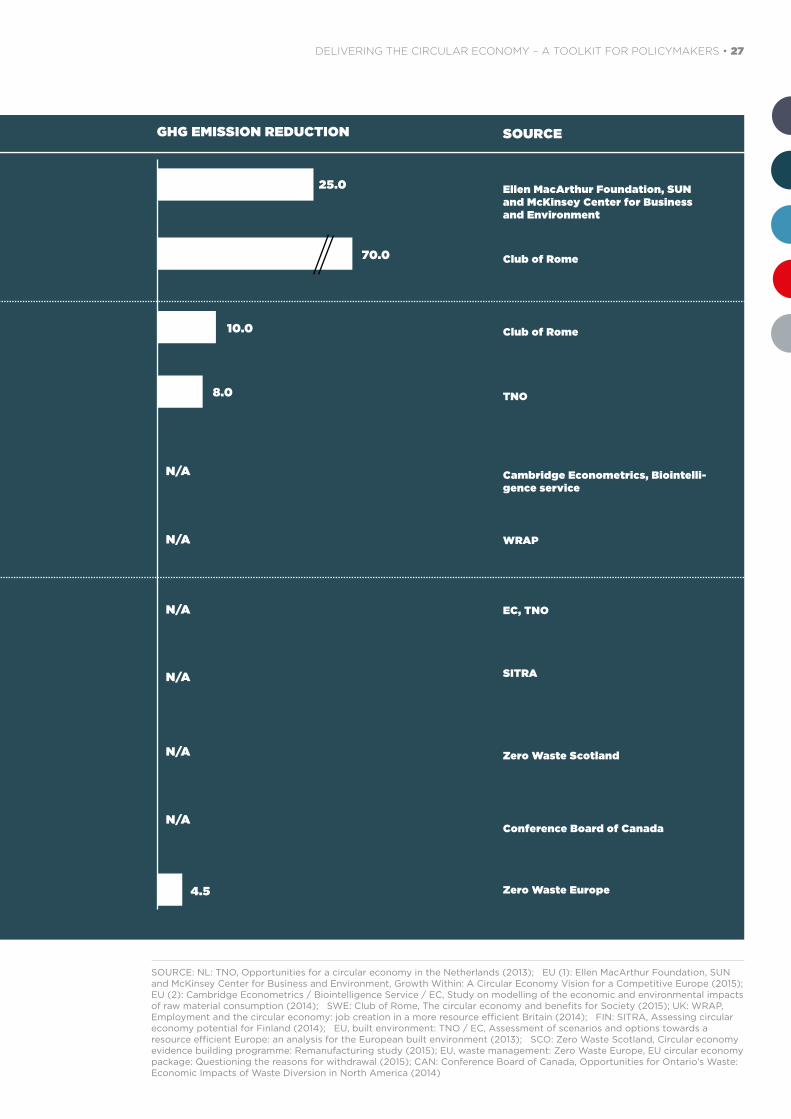
The circular economy can be an important lever to achieve key policy objectives such as generating economic growth, creating jobs, and reducing environmental impact. Multiple studies have already demonstrated how the circular economy can contribute at a national, regional and supranational level to objectives such as generating economic growth, creating jobs, and reducing environmental impact. While using different methodologies and performed on different sectoral and geographical scopes, these studies have consistently demonstrated the positive impacts of the circular economy: growing GDP by 0.8–7%, adding 0.2–3.0% jobs, and reducing carbon emissions by 8–70% (see Figure 4 and Table 1).
Table 1: Selected literature on the macroeconomic impact of the circular economy
TNO – The Netherlands Organisation for Applied Scientific Research, Opportunities for a Circular Economy in the Netherlands (2013)3
This report analyses the opportunities and obstacles that will present themselves as the Netherlands moves towards a more circular economy and makes policy proposals to accelerate the process. It finds that the overall impact of the circular economy in the Netherlands is estimated at EUR 7.3 billion annually, creating 54,000 jobs. The current value of the circular economy for 17 product categories from the metal and electrical sectors is EUR 3.3 billion and that an additional market value of EUR 573 million per year could be achieved. The use of the 34 most important waste streams already represents a value of EUR 3.5 billion. An estimated investment of EUR 4–8 billion in new technologies could create added value of EUR 1 billion per year for the circular economy in the areas of bio-refining, biogas extraction and sorting household waste.
Club of Rome, The Circular Economy and Benefits for Society: Swedish case study shows jobs and climate as clear winners (2015)4
The central theme of this report is how greatly enhanced resource efficiency is a prerequisite for the global economy to stay within the planetary boundaries. It finds that, if applied in conjunction with efforts to increase energy efficiency and the use of renewable energy, organising manufacturing along the lines of a materially efficient circular/performance-based economy in Sweden would lead to an increase in employment of 100,000 (2–3% of the labour force), an improvement in the trade balance of >3% of GDP and a reduction in CO2 emissions of 70%. Similar studies for the Netherlands and Spain are underway, but were not published in time to be included in this report.
Ellen MacArthur Foundation, Stiftungsfonds für Umweltökonomie und Nachhaltigkeit (SUN) and McKinsey Center for Business and Environment, Growth Within: A Circular Economy Vision for a Competitive Europe (2015)
This report aims to contribute to the fact base for the discussion around the circular economy from a European perspective. The report paints a vision of what the circular economy could look like in three of the largest and most resource-intensive European value chains: mobility, food systems and the built environment. It compares its attractiveness with the current linear development path, and models European economic and environmental outcomes in both scenarios. The report finds that the circular economy could bring, by 2030, an increase in GDP by 6.7%, and a reduction in CO2 emissions by 25%.
Cambridge Econometrics / Biointelligence Service / European Commission, Study on modelling of the economic and environmental impacts of raw material consumption (2014)5
This technical report provides a quantitative analysis of different resource productivity targets
3 http://www.government.nl/documents-and-publications/reports/2013/10/04/opportunities-for-a-circu-lar-economy-in-the-netherlands.html
4 www.clubofrome.org/cms/wp-content/uploads/2015/04/Final-version-Swedish-Study-13-04-15-till-tryck-ny.pdf
5 http://ec.europa.eu/environment/enveco/resource_efficiency/pdf/RMC.pdf

DELIVERING THE CIRCULAR ECONOMY – A TOOLKIT FOR POLICYMAKERS • 25
for the EU using GDP per unit of raw material consumption. The targets range from 1–3% per annum improvement in resource productivity (cumulative 15–30% to 2030). The modelling results suggest that resource productivity improvements of around 2–2.5% per annum can have net positive impacts on EU28 GDP. They also show that with 2% per annum resource productivity improvement around two million additional jobs are created.
WRAP and Green Alliance, Employment and the circular economy: Job creation in a more resource efficient Britain (2015)6
This report looks at how to address the UK’s economic challenges in its use of labour and scarce natural resources. It indicates that in the UK the circular economy could create ~200,000–500,000 gross jobs, reduce unemployment by ~50,000–100,000 and offset ~7–22% of the expected decline in skilled employment to 2022, depending on whether the development of the circular economy follows its current trajectory or takes a more transformative path.
Figure 3: The economic opportunity of the circular economy
Complex durables with medium lifespans, EU
Consumer industries, global
USD billion per year, net material cost savings based on current total input costs per sector
USD billion per year, net material cost savings based on total material savings from consumer categories
630706
Motor vehicles
Machinery and equipment
Electrical machinery and apparatus
Other transport
Furniture
Radio, TV and communication
Office machinery and computers
Other
Packaged food
Apparel
Beverages
Fresh food
Beauty and personal care
Tissue and hygiene
NOTE: Rough estimates from advanced scenario SOURCE: Towards the Circular Economy 1, 2 by the Ellen MacArthur Foundation
CIRCULAR ECONOMY LITERATURE
The circular economy concept has deep-rooted origins and cannot be traced back to one single date or author. Its practical applications to modern economic systems and industrial processes, however, have gained momentum since the late 1970s as a result of the efforts of a small number of academics, thought-leaders, and businesses. The general concept has been refined and developed by the following schools of thought, which all treat the economy as a complex adaptive system and draw on insights from living systems especially:
• Regenerative design (Prof. John T. Lyle);
• Performance economy (Prof. Walter Stahel);
• Cradle to Cradle (Prof. Michael Braungart and William McDonough);
6 www.wrap.org.uk/sites/files/wrap/Employment%20and%20the%20circular%20economy%20summary.pdf
26 • DELIVERING THE CIRCULAR ECONOMY – A TOOLKIT FOR POLICYMAKERS
1 2030 scenario. 2 Full scenario; GDP impact equal to trade balance effect. 3 ‘Material efficiency scenario’; GDP impact equal to trade balance effect. 4 Net job creation from increased reuse, remanufacturing, recycling, bio-refining and servitisation. 5 Built environment. 6 Forestry, pulp and paper, machinery, equipment and electronics, built environment, food waste, P2P sharing. 7 Remanufacturing industry. 8 Ontario; Waste management and recycling industry. 9 Waste management and recycling industry; compiled from several reports, see http://ec.europa.eu/environment/circular-economy/index_en.htm, http://ec.europa.eu/smart-regulation/impact/planned_ia/docs/2014_env_005_waste_review_en.pdf
Figure 4: Estimated potential contribution of the circular economy to economic growth, job creation and reduction of greenhouse gas emissions
6.7
3.0
2.0
1.4
0.8
N/A
0.8
0.8
0.7
0.2
N/A
N/A
3.0
1.0
0.6
1.0
0.3
N/A
N/A
0.2
0.2
0.3
WH
OLE ECO
NO
MY
(MATER
IALS A
ND
EN
ERG
Y)
WH
OLE ECO
NO
MY
(MATER
IAL FO
CU
S)SELEC
TED SEC
TOR
S (M
ATERIA
L FOC
US)
GDP IMPACT NET EMPLOYMENT
1
2
3
4
5
6
7
8
9
DELIVERING THE CIRCULAR ECONOMY – A TOOLKIT FOR POLICYMAKERS • 27
SOURCE: NL: TNO, Opportunities for a circular economy in the Netherlands (2013); EU (1): Ellen MacArthur Foundation, SUN and McKinsey Center for Business and Environment, Growth Within: A Circular Economy Vision for a Competitive Europe (2015); EU (2): Cambridge Econometrics / Biointelligence Service / EC, Study on modelling of the economic and environmental impacts of raw material consumption (2014); SWE: Club of Rome, The circular economy and benefits for Society (2015); UK: WRAP, Employment and the circular economy: job creation in a more resource efficient Britain (2014); FIN: SITRA, Assessing circular economy potential for Finland (2014); EU, built environment: TNO / EC, Assessment of scenarios and options towards a resource efficient Europe: an analysis for the European built environment (2013); SCO: Zero Waste Scotland, Circular economy evidence building programme: Remanufacturing study (2015); EU, waste management: Zero Waste Europe, EU circular economy package: Questioning the reasons for withdrawal (2015); CAN: Conference Board of Canada, Opportunities for Ontario’s Waste: Economic Impacts of Waste Diversion in North America (2014)
Ellen MacArthur Foundation, SUN and McKinsey Center for Business and Environment
Club of Rome
Club of Rome
TNO
Cambridge Econometrics, Biointelli-gence service
WRAP
EC, TNO
SITRA
Zero Waste Scotland
Conference Board of Canada
Zero Waste Europe
25.0
70.0
10.0
8.0
N/A
N/A
N/A
N/A
N/A
N/A
4.5
GHG EMISSION REDUCTION SOURCE

28 • DELIVERING THE CIRCULAR ECONOMY – A TOOLKIT FOR POLICYMAKERS
• Industrial ecology (Prof. Roland Clift, Thomas E. Graedel);
• Biomimicry (Janine Benyus);
• Natural capitalism (Amory Lovins);
• Blue Economy (Gunter Pauli).
To learn more about the concepts that lie behind the circular economy framework, a good starting point is Chapter 2 of Towards the Circular Economy I by the Ellen MacArthur Foundation (2012). For a broader discussion of the three principles and the ReSOLVE framework, see the report Growth Within: A Circular Economy Vision for a Competitive Europe.7 For a more general discussion of the interplay between the circular economy, employment, education, money and finance, public policy and taxation, see the book The Circular Economy – A Wealth of Flows by Ken Webster, Head of Innovation at the Ellen MacArthur Foundation.
1.2 A favourable alignment of factors makes the transition possible
The economic system over the past 200 years has relied on getting cheaply accessible resources out of the ground. This model has its limits, given the finite nature of these resources, the related price volatility and supply risks, and the negative externalities resulting from the use of these resources. In recent years several factors have combined to offer significant opportunities to overcome this impasse. New technologies such as smartphones are enabling the development of, for example, sharing business models. These are finding a ready market among consumers and are being made easier by the urbanisation of the global population. At the same time there is an increasing amount of capital available to support businesses that not only deliver sound financial returns, but also create social and environmental value.
CURRENT CHALLENGES IN THE LINEAR MODEL
The reliance of many current business models on a ready supply of cheap non-renewable resources exposes businesses and economies to price risks, supply risks, and environmental degradation. Such risks pose a fundamental challenge to long-term economic development. They can also be translated into short-term challenges to businesses if their licence for certain resource-intensive or environmentally damaging operations is revoked or externalities are priced in.
Price risk. The last decade has seen higher price volatility for metals and agricultural output than in any single decade in the 20th century. According to the think tank Chatham House, “[v]olatility of resource prices is the new normal, hitting both consumers and producers”.8 The steep rise in commodity prices between 2002 and 2010 – although partially reversed since then – erased the entire 20th century’s worth of real price declines and was a wake-up call to many businesses and economies, forcing them to rethink their buy-process-sell model and come up with value-retaining material management strategies. Higher resource price volatility can dampen economic growth by increasing uncertainty, discouraging businesses from investing and increasing the cost of hedging against resource-related risks.
7 Ellen MacArthur Foundation, Stiftungsfonds für Umweltökonomie und Nachhaltigkeit (SUN) and McKinsey Center for Business and Environment, Growth Within: A Circular Economy Vision for a Competitive Europe (2015).
8 Press release for Chatham House report Volatile Resource Prices a Menace to Global Stability (2012).

DELIVERING THE CIRCULAR ECONOMY – A TOOLKIT FOR POLICYMAKERS • 29
Supply risk. Many areas of the world possess few natural deposits of non-renewable resources of their own and so must rely on imports. The European Union imports six times as much materials and natural resources as it exports.9 Japan imports almost all its petroleum and other liquid fuels and its natural gas, and India imports around 80% and 40% respectively.10 As well as risks to the supply of raw materials themselves, the risk to supply security and safety associated with long, elaborately optimised global supply chains appears to be increasing.11
Natural systems degradation. A fundamental challenge to long-term global wealth creation is the set of negative environmental consequences related to the linear model, described in Box 1. While these negative environmental externalities are not new, in recent years businesses have witnessed an increased effort on the part of regulators to curtail and price them. Since 2009, the number of climate change laws has increased by 66%, from 300 to 500. These climate laws account for almost 90% of global greenhouse gas (GHG) emissions.12 Carbon pricing, in the form of an emissions trading scheme or a carbon tax, has been implemented or is scheduled to commence in almost 40 countries and over 20 cities, states and regions, covering in total around 12% of global GHG emissions.13 By 2011 there were globally 205 active watershed payment programmes (incentive or market-based mechanisms used to protect watersheds, including e.g. payments for ecosystem services and water quality trading markets), with transactions worth USD 8 billion a year14 and a further 76 in development. The price for water itself is rising in some areas: farmers in California’s Central Valley, the world’s most productive agricultural region, are paying as much as 10 times more for water than they did before supply was cut due to a record-breaking drought – in one district, for example, prices rose to USD 1,100 per acre-foot in 2014 from about USD 140 in 2013.15 In Europe 20 countries levy landfill taxes, which together raised revenues of EUR 2.1 billion in 2009/2010. Some of these taxes have risen steeply over the last years: in the UK for instance the standard landfill tax rate per tonne increased 260% between 2007 and 2012.16 According to KPMG ‘… companies in all sectors are finding that their externalities have increasing implications for their corporate value creation. The disconnect between corporate value and societal value is disappearing’.17
The three challenges outlined above are increasingly recognised by capital markets. Several large institutional investors have started to divest from companies with high exposure to fossil fuels, including electrical utilities highly dependent on coal. In May 2015, Norway’s USD 900 billion sovereign wealth fund – the largest in the world, holding 1% of the global equities – moved to divest from both coal producers and coal-burning power utilities.18 In the same month, Axa Group, the largest insurance company in the world,19 said it would remove EUR 500 million of coal investments from its portfolio and provide investors with more information on the risk to its investments from climate change.
9 Frans Timmermans, Jyrki Katainen, Karmenu Vella and Elżbieta Bieńkowska in Die Zeit ‘Weg mit der Weg-werfmentalität’ (28 May 2015).
10 US Energy Information Administration, Oil and natural gas import reliance of major economies projected to change rapidly (22 January 2014).
11 Ellen MacArthur Foundation, Towards a Circular Economy III (2014).
12 M. Nachmany, S. Fankhauser, T. Townshend, M. Collins, T. Landesman, A. Matthews, C. Pavese, K. Rietig, P. Schleifer and J. Setzer, The GLOBE Climate Legislation Study: A Review of Climate Change Legislation in 66 Countries. Fourth Edition (London: GLOBE International and the Grantham Research Institute, London School of Economics, 2014).
13 World Bank and Ecofys, Carbon pricing watch 2015 (May 2015).
14 Ecosystem Marketplace (Forest Trends), Charting New Waters: State of Watershed Payments (2012).
15 Bloomberg, California Water Prices Soar for Farmers as Drought Grows (24 July 2014).
16 European Environmental Agency (EEA), Overview of the use of landfill taxes in Europe (2012).
17 KPMG, A New Vision of Value: Connecting corporate and societal value creation (2014).
18 David Crouch and Pilita Clark in the Financial Times, ‘Norway oil fund plans to withdraw from coal-burning utilities’ (27 May 2015).
19 www.investopedia.com/articles/personal-finance/010715/worlds-top-10-insurance-companies.asp

30 • DELIVERING THE CIRCULAR ECONOMY – A TOOLKIT FOR POLICYMAKERS
Box 1: Natural systems degradation
According to the United Nations Environment Programme (UNEP): “The currently observed changes to the Earth System are unprecedented in human history. Efforts to slow the rate or extent of change – including enhanced resource efficiency and mitigation measures – have resulted in moderate successes but have not succeeded in reversing adverse environmental changes. As human pressures on the Earth System accelerate, several critical global, regional and local thresholds are close or have been exceeded. Once these have been passed, abrupt and possibly irreversible changes to the life-support functions of the planet are likely to occur, with significant adverse implications for human well-being”.20 A selection of four elements contributing to this environmental pressure are:
• Climate change: GHG emission reduction plans to 2030 released by the G7 and the EU would leave the world on track for warming of 3–4°C by 2100 compared to pre-industrial levels, well above the 2°C limit agreed by the UNFCCC.21 Risks of climate change to human livelihoods and health, agricultural productivity, access to freshwater and ecosystems include: increased storm surges, coastal flooding and sea level rise; inland flooding; extreme weather events; extreme heat; and the loss of marine, coastal, terrestrial and inland water ecosystems.22 The economic cost of these effects could potentially by a reduction in GDP of 20% per annum in 2050.23
• Loss of biodiversity and natural capital: At a global scale, without any additional policy action, losses in the value of ecosystem services due to biodiversity decline are estimated to reach EUR 14 trillion by 2050, 7% of projected global GDP.24
• Land degradation: the productivity of over 20% of land globally – on which 1.5 billion people reside – has declined persistently between 1981 and 2003.25 Land degradation costs an estimated USD 40 billion annually worldwide, without taking into account the hidden costs of increased fertiliser use, loss of biodiversity and loss of unique landscapes. Agricultural productivity growth has been steadily declining, from 2.2% per annum in the 1960s to 0.9% per annum in the 2010s, despite increases in the use of fertilisers, chemicals, fuels and other inputs. Today, more nitrogen is fixed synthetically in fertilisers than naturally in all terrestrial ecosystems combined.26
• Ocean pollution: An estimated 8 million tonnes (Mt) of plastic waste enter the oceans every year, a figure predicted to rise to 17.5 Mt per annum by 2025. Since they are so long lived in the environment (it is estimated, for example, that PET takes 450 years to decay into unrecognisable fragments in the ocean), the stock is also rising – it is forecast to increase from 130–150 Mt in 2013 to 250 Mt by 202527. While some of these plastics sink, others degrade into micro-particles that are absorbed into marine food chains.
20 United Nations Environment Programme (UNEP), Global Environment Outlook 5 (2012).
21 Climate Action Tracker, G7+EU INDCs: some improvement, but a large emissions gap remains (June 2015).
22 Intergovernmental Panel on Climate Change (IPCC), Climate Change 2014: Impacts, Adaptation and Vulnera-bility, Working Group II contribution to the fifth assessment report of the IPCC (2014).
23 N. Stern, The Economics of Climate Change: The Stern Review (Cambridge University Press, 2006). It should be noted that integrating into economic models an appropriate assessment of the impacts of climate risks presents challenges that include continued uncertainty regarding the magnitude and probability of such impacts and difficulties converting them into monetary values. For more detail see The Global Commission on the Economy and Climate, The New Climate Economy Report (2014).
24 European Commission, The Cost of Policy Inaction (COPI): The case of not meeting the 2010 biodiversity target (2008).
25 Bai, Z., Dent, D., Olsson L., and Schaepman, M. E., Soil Use and Management 24, pp.223–243, ‘Proxy global assessment of land degradation’, (September 2008).
26 European Environment Agency The European environment – state and outlook 2015: synthesis report (2015).
27 Jambeck et al, Science, Vol. 347 no. 6223, Plastic waste inputs from land into the ocean, (13 February 2015).

DELIVERING THE CIRCULAR ECONOMY – A TOOLKIT FOR POLICYMAKERS • 31
For example, 66% of seabirds and 100% of sea turtles are affected in some way by marine debris28. As well as biodiversity loss, this waste reduces the viability of fisheries, impacts tourism and is a fundamental loss of valuable materials.
OPPORTUNITIES TO GO CIRCULAR
Advances in technology create ever greater opportunities to support circular economy business models. Information and industrial technologies are now coming online or being deployed at scale, which allow the creation of circular economy business approaches which were previously not possible. These advances allow more efficient collaboration and knowledge sharing, better tracking of materials, improved forward and reverse logistics set-ups, i.e. initial product design and material innovation seamlessly joined up with subsequent processing of secondary material streams, and increased use of renewable energy. Examples of emergent technologies in this area are:
• Smartphones: mobile smartphone subscriptions have increased globally from 0.5 billion in 2009 to 2.6 billion in 2014 (500% increase), and are expected to more than double again by 2020.29 This technology has been critical in some on-demand sharing services like Uber and product logging and re-sale platforms like Stuffstr.
• The ‘Internet of things’: ABI Research says there are already more ‘things’ connected to the Internet than people – over 16 billion devices in 2014, a 20% increase from 2013.30 According to the same source, this number is expected to grow to more than 40 billion by 2020. Connections today come in the form of home and office IT devices such as PCs and laptops, mobile smart devices and new connected business and manufacturing devices. In the future, everything is likely to be connected, from container ships and buildings to needles, books, cows, pens, trees and shoes. This interconnectedness enables tracking efficiency and predictive maintenance that was previously inconceivable.
• Advanced manufacturing and processing technologies: these technologies open up completely new paradigms for adopting circular operations at lower cost. For example, 3D printing substantially reduces waste in the manufacturing process itself, allows the reduction of product inventory by moving to ‘make-to-order’ systems from what are often ‘make-to-stock’ systems, and is widely used in the reworking of spare parts.
• Decreasing costs of renewable energy. Solar panel costs have fallen 80% since 2008 and wind turbine prices are down nearly a third. This is driving so much clean energy generation that more new renewable capacity has been added each year since 2013 than coal, natural gas and oil combined, according to the Bloomberg New Energy Finance research group.31
Consumer acceptance of alternative business models has in some markets been demonstrated. Circular economy business models enabled by new technologies are finding ready customers. For instance Uber, the on-demand taxi service where drivers use their own cars, forecasts net revenue of more than USD 2 billion in 2015, five times as much as in 2014, which was itself about four times as much as in 2013, according to the Wall Street Journal.32 This creates a level of certainty for new businesses extending these models, such as sharing, into other markets. This is important because young consumers’ lifestyle choices in this decade have the power to shift the economic model away from
28 Secretariat of the Convention on Biological Diversity, Impacts of Marine Debris on Biodiversity (2012).
29 Ericsson, Mobility Report (November 2013 and June 2015).
30 ABI Research, The Internet of Things Will Drive Wireless Connected Devices to 40.9 Billion in 2020 (2014).
31 Pilita Clark in the Financial Times, ‘Climate campaign wins over more senior executives’ (27 May 2015).
32 WSJ Technology, ‘Uber Expands Funding Round as Revenue Growth Accelerates’ (18 February 2015).

32 • DELIVERING THE CIRCULAR ECONOMY – A TOOLKIT FOR POLICYMAKERS
the linear system. How pervasive the shift will become remains to be seen, but a new model of consumption could be emerging, in which consumers embrace services that enable them to access products on demand rather than owning them, thus becoming users.
There is a rapidly growing amount of capital available for businesses that not only deliver sound financial returns, but also create social and environmental value. Sustainable and Responsible Investment (SRI) overall has increased from just over USD 3 trillion in 2010 to well over USD 6 trillion in 2014 (doubling in four years). Issuance of green bonds has increased from under USD 5 billion in 2010 to nearly USD 40 billion in 2014 (an eight-fold increase in four years). Leading institutional investors are joining the field: AXA Group has committed EUR 150 million of internal capital to an impact investment project; Zurich Insurance Group is developing an impact investment strategy, and hopes to encourage the adoption of responsible investment in the mainstream.
Socio-demographic trends make the benefits easier to capture. For the first time in history, over half of the world’s population resides in urban areas. Continued urbanisation and overall population growth is projected to add another 2.5 billion people to the urban population by 2050, bringing the proportion of people living in cities to 66%.33 With this steady increase in urbanisation, the associated costs of many of the asset-sharing services and the costs for collecting and treating end-of-use materials will all be able to benefit from much higher drop-off and pick-up density, simpler logistics, and greater appeal and scale for service providers. Centralised use should mean that reverse logistics – like the logistics of new product delivery – become more efficient and more cost-effective.
1.3 The role of policymakers and this toolkitAs many circular economy opportunities have a sound underlying profitability, businesses are driving the shift towards the circular economy. Yet there are often non-financial barriers limiting further scale-up or holding back development pace. Policymakers therefore can play an important role in enabling and, as appropriate, setting the direction for a transition to the circular economy.
Policymakers around the globe have already started to provide positive stimulus for the adoption of circular business practices. The Dutch government’s Green Deal (see Box 3 for more details) offers a responsive service to companies that ask for help in realising circular economy opportunities and face implementation barriers. Some governments have set up taskforces to remove regulatory barriers, for example the Taskforce on Resource Efficiency in Denmark (see Box 5 in Part 2 for more details), which aims to identify barriers to circular economy practices in existing regulations, and to propose options to overcome them. Until recently, London’s housing legislation made the practice of residents letting their homes on a short-term basis through sharing websites such as Airbnb illegal. The legislation was amended in 2015 to legalise the practice. The Scottish Government, in setting up the Scottish Material Brokerage Service, aims to aggregate contracts for the 3 million tonnes of secondary materials collected annually across 200+ public bodies into a robust and cost-effective supply chain. China has chosen to stimulate the use of secondary materials in production processes by reducing by 50–100% the VAT on goods produced from them.
There are two broad, complementary policymaking strategies that can help accelerate the circular economy. The first is to focus on fixing market and regulatory failures. The second is to actively stimulate market activity by, for example, setting targets, changing public procurement policy, creating collaboration platforms and providing financial or technical support to businesses. These approaches are complementary and policymakers can determine where to put the emphasis, taking inspiration from the most applicable aspects of both approaches. Moving towards the circular economy offers a unique chance for businesses and policymakers collaboratively to accelerate specific business opportunities while at the same time helping to achieve wider societal goals.
33 United Nations, World Urbanization Prospects – The 2014 Revision (2014).

DELIVERING THE CIRCULAR ECONOMY – A TOOLKIT FOR POLICYMAKERS • 33
Policy options to support the circular economy have been investigated in a number of studies. Table 2 below lists selected literature on this topic.
Table 2: Selected literature on circular economy policymaking
European Commission, Scoping study to identify potential circular economy actions, priority sectors, material flows and value chains (2014)34
A study identifying 13 barriers to a transition to the circular economy, ranging from insufficient skills and investment in circular product design to weaknesses in policy coherence. It suggests three types of policy intervention are needed to help overcome the barriers: (i) regulatory instruments, including better implementation and enforcement of related existing legislation, revisions to relevant legislation, and new measures or regulations; (ii) other instruments and approaches, including voluntary agreements, fiscal incentives including taxes, charges and levies, information and advisory services and awareness raising campaigns; and (iii) public investment in e.g. R&D, skills and training and infrastructure, industrial symbiosis and clusters, and green public procurement.
EREP – European Resource Efficiency Platform, Manifesto & Policy Recommendations (2012)35
A call for a circular, resource-efficient and resilient economy in the EU to be achieved by taking the following actions: encouraging innovation and accelerating public and private investment in resource-efficient technologies, systems and skills; implementing, using and adopting smart regulation, standards and codes of conduct; abolishing environmentally harmful subsidies and tax breaks; creating better market conditions for products and services that have lower impacts across their life cycles, and that are durable, repairable and recyclable; integrating current and future resource scarcities and vulnerabilities more coherently into wider policy areas, at national, European and global level; providing clear signals to all economic actors by adopting policy goals to achieve a resource-efficient economy and society by 2020, setting targets that give a clear direction and indicators to measure progress relating to the use of land, material, water and greenhouse gas emissions, as well as biodiversity.
UK House of Commons Environmental Audit Committee, Growing a circular economy: Ending the throwaway society (2014)36
A parliamentary enquiry into the circular economy that consulted businesses trying to exploit circular economy business models. The committee recommends that the UK government: (i) reform taxation and producer responsibility regulations to reward companies that design more circular products; (ii) improve information about the location of materials; (iii) give direct guidance to local authorities on what materials are collected and recycled, including separate food waste collections and banning sending food waste to landfill; (iv) set longer warranty periods for consumer products; (v) set new standards for eco-design; (vi) stop businesses using materials that cannot be recycled when better alternatives exist; (vii) use government procurement standards to promote a more circular economy; and (viii) encourage the Green Investment Bank to finance innovative circular economy technologies.
University College London, ‘Policy Options for a Resource Efficient Economy’ (POLFREE)37
A University College London (UCL)-led research effort to support European Commission policy efforts and initiatives on resource efficiency. It will propose new policy mixes, business models and mechanisms of global governance through which resource-efficient economies may be promoted. Its work areas are: (i) Why resources have been used inefficiently; (ii) New concepts and paradigms for policies for resource efficiency; (iii) Scenarios and modelling of policy implementation for resource efficiency; (iv) Support, dissemination and policy insights. Collaborating institutions are the Wuppertal Institute, TNO, ICIS Maastricht University, Gesellschaft für Wirtschaftliche Strukturforschung (Osnabrück), Sustainable Europe Research Institute (Vienna), Potsdam Institute for Climate Impact Research, and International Synergies (UK). The project receives funding from the EU’s 7th programme of research, 2007–2013.
34 www.ieep.eu/assets/1410/Circular_economy_scoping_study_-_Final_report.pdf
35 http://ec.europa.eu/environment/resource_efficiency/documents/ erep_manifesto_and_policy_recommendations_31-03-2014.pdf
36 www.publications.parliament.uk/pa/cm201415/cmselect/cmenvaud/214/214.pdf
37 https://www.ucl.ac.uk/polfree

34 • DELIVERING THE CIRCULAR ECONOMY – A TOOLKIT FOR POLICYMAKERS
European Environment Agency, Resource efficiency in Europe — Policies and approaches in 31 EEA member and cooperating countries (2011)38
An overview of resource efficiency policies and instruments in 31 European countries aiming to analyse national experiences in developing and implementing resource efficiency policies, The country submissions indicate that: (i) there is neither a clear definition nor a common understanding of ‘resource efficiency’ across countries; (ii) only Austria and Germany (as well as the Flanders Region in Belgium) report having a dedicated strategic policy document for resource efficiency; (iii) the priority resources most commonly reported by countries were energy carriers (22 mentions), waste (18), minerals and raw materials (16) and water (14); (iv) strategic objectives for resource efficiency tend to be fairly general in nature, most often referring to ensuring more efficient use of resources, increasing recycling, increasing the share of renewables, and preventing waste or decoupling its generation from economic growth.
German Federal Ministry for the Environment, Nature Conservation, Building and Nuclear Safety (BMUB), German Resource Efficiency Programme (ProgRess) (2012)39
The goal of the German Resource Efficiency Programme (ProgRess) is to make the extraction and use of natural resources more sustainable in the belief that improving resource efficiency can limit environmental damage, strengthen the competitiveness of the German economy, create new jobs and secure long-term employment. In 2002, the German government set the goal of doubling raw material productivity by 2020 compared with 1994. ProgRess aims to contribute to reaching it. Strategic approaches are identified and underpinned with measures such as strengthening efficiency advice for SMEs, supporting environmental management systems, taking greater account of resource aspects in standardisation processes, placing greater focus on the use of resource-efficient products and services in public procurement, strengthening voluntary product labelling and certification schemes and enhancing closed-cycle management. Examples of material flows and technologies particularly relevant for the strategic approaches are bulk metals, rare and strategic metals, photovoltaics and electric mobility, sustainable construction, and the closed-cycle management of plastic waste. The government will report every four years on progress.
The Ex’Tax Project, in cooperation with Deloitte, EY, KPMG Meijburg and PwC, New Era. New Plan: Fiscal reforms for an inclusive, circular economy (2014)40
Identifies viable options for a fundamental shift in taxation from labour to natural resource use and consumption. A case study looks at a (mid- to long-term) tax shift worth more than EUR 30 billion in the Netherlands alone. The report suggests that in the case of international coordination, such a tax shift could potentially create hundreds of thousands of jobs.
This report aims to complement existing circular economy policy literature by:
• Providing an actionable methodology. Rather than providing general answers, this toolkit offers a methodology for policymakers to identify policy options, based on country- and sector-specific circumstances. It covers the selection of focus sectors, the identification of sector-specific circular economy opportunities, the impact quantification of these opportunities, the assessment of the barriers preventing the opportunities, and ultimately the analysis of the policy options to overcome the barriers. This process is described in detail in Part 2.
• Providing insights from the Denmark pilot. Part 3 of this report shares insights gathered through a six-month pilot study conducted in close collaboration with Danish policymakers and businesses.
This report complements previous research from the Ellen MacArthur Foundation by looking at the circular economy opportunity from a national, policymaker perspective. The toolkit complements the report Growth Within: A Circular Economy Vision for a
38 www.eea.europa.eu/publications/resource-efficiency-in-europe
39 www.bmub.bund.de/en/service/publications/downloads/details/artikel/german-resource-efficiency-pro-gramme-progress/?tx_ttnews%5BbackPid%5D=1742
40 www.ex-tax.com/files/4314/1693/7138/The_Extax_Project_New_Era_New_Plan_report.pdf

DELIVERING THE CIRCULAR ECONOMY – A TOOLKIT FOR POLICYMAKERS • 35
Competitive Europe,41 by offering an actionable ‘how-to’ guide for policymakers inspired by the vision of what the circular economy could look like as laid out in the Growth Within report. It is an initial exploration of circular economy policymaking by the Ellen MacArthur Foundation, and does not aim to bring the final word on the subject.
Policymakers at all government levels – municipal, regional, national, and supranational can play an important role in the circular economy. The toolkit is aimed primarily at national policymakers, but could be – according to initial conversations with various actors – largely applicable also to municipal, regional and supranational policymakers.
Cities in particular, though not the focus of this report, have a key role to play in the transition to the circular economy, with an excess of both the challenges and opportunities. A high density of businesses (especially retailers) and consumers makes cities concentrators of flows. This requires and allows the creation of reverse operations at scale. As within city boundaries consumption is often higher than the production of goods, setting up local loops and increasing self-sufficiency can be of interest. Cities are also a hotbed of innovation: incubator spaces, maker labs and urban farming are just three examples. City governments can in certain instances move faster than their national counterparts, especially when united in city networks.
41 Ellen MacArthur Foundation, Stiftungsfonds für Umweltökonomie und Nachhaltigkeit (SUN) and McKinsey Center for Business and Environment, Growth Within: A Circular Economy Vision for a Competitive Europe (2015).

36 • DELIVERING THE CIRCULAR ECONOMY – A TOOLKIT FOR POLICYMAKERS

DELIVERING THE CIRCULAR ECONOMY – A TOOLKIT FOR POLICYMAKERS • 37
METHODOLOGY FORPOLICYMAKERS TO ACCELERATE THE TRANSITION


DELIVERING THE CIRCULAR ECONOMY – A TOOLKIT FOR POLICYMAKERS • 39
2 METHODOLOGY FOR POLICYMAKERS TO ACCELERATE THE TRANSITION
This toolkit aims to support policymakers who have decided to transition to a circular economy in designing a strategy to accelerate this process. It offers a step-by-step methodology to explore and prioritise circular economy opportunities; quantify their impact; identify the barriers preventing these opportunities; map and prioritise the policy interventions to overcome these barriers; and to engage relevant stakeholders.
The methodology is laid out in Figure 5, and detailed below.
Align on starting point, ambition and focus (Chapter 2.1). As in any strategic project, relevant stakeholders need to be mapped and engaged early on in the process. Based on an understanding of the national circularity and policy context (Section 2.1.1), a realistic ambition level (Section 2.1.2) and sector scope (Section 2.1.3) needs to be defined.
Assess sector circular economy opportunities (Chapter 2.2). Once the focus sectors have been selected, the sector-specific assessment can begin. This step can be conducted in parallel sector working groups, and heavily relies on the involvement of businesses. The most relevant circular economy opportunities need to be mapped (Section 2.2.1) and prioritised (Section 2.2.2). For the prioritised opportunities, sector-specific economic impact needs to be assessed (Section 2.2.3), barriers limiting their realisation identified (Section 2.2.4) and policy options to overcome these barriers mapped (Section 2.2.5).
Analyse economy-wide implications (Chapter 2.3). Once the sector-specific circular economy opportunities have been assessed, they can be aggregated and the economy-wide implications analysed. This step will typically be driven by a core group of policymakers, policy and economics experts and with the participation of multiple government agencies. The sector-specific impact assessments could be aggregated in one overarching whole-economy impact assessment to support the mandate for policy intervention (Section 2.3.1). Sector-specific policy options could be complemented by economy-wide policy options (Section 2.3.2). The set of sector-specific and economy-wide policy options needs to be prioritised and assembled into coherent policy packages (Section 2.3.3).
The steps outlined in the methodology have been designed to be implemented consecutively; but policymakers could also pick one or a few of the tools and use them – to a certain extent – standalone or in a different order. Each of the tool sections below contains a ‘standalone’ description of the tool’s context and objectives, a tool description, and a how-to-use guide.
The methodology has been designed to be applicable in any country or region, with different nuances and focal points to accommodate for local circumstances. Chapter 2.4 outlines some of these potential adaptations.
2.1 Align on starting point, ambition and focusAs in any strategic project, relevant stakeholders need to be mapped and engaged early on in the process. Based on an understanding of the national circularity and policy context (Section 2.1.1), a realistic ambition level (Section 2.1.2) and sector scope (Section 2.1.3) needs to be defined.
In this first step, the core team should have at their disposal strong business analysis skills and expertise in the circular economy, including the ability to benchmark circularity metrics, facilitate first discussions with project stakeholders, and make an assessment of the role in the national economy and circularity potential in the sector selection.
1
2
3

40 • DELIVERING THE CIRCULAR ECONOMY – A TOOLKIT FOR POLICYMAKERS
Select focus sectors
Map circular econom
y opportunities in each focus sector
Prioritise and detail circular economy
opportunities
Quantify sector Im
pact
Identify barriers
Map sector-specifi
c policy options
Quantify econom
y-wide im
pact
Map econom
y-wide policy options
Prioritise, package and sequence policy options
2.3.1
2.3.2
2.3.3
Engage stakeholders
ALIG
N O
N STA
RTIN
G PO
INT,
AM
BITION
AN
D FO
CU
SA
SSESS SECTO
R O
PPOR
TUN
ITIESA
NA
LYSE ECON
OM
Y-WID
E IM
PLICATION
S
Baseline circularity level and policy landscape
Set ambition level
2.12.2
2.3
2.1.1
2.1.2
2.1.3
2.2.1
2.2.2
2.2.3
2.2.4
2.2.5
Figure 5: Step-by-step methodology

DELIVERING THE CIRCULAR ECONOMY – A TOOLKIT FOR POLICYMAKERS • 41
Especially the assessment of the circularity potential in the sector selection would benefit from prior experience in the circular economy. The core project team ideally contains members from different government departments (including business/industry and environment), to ensure broad expertise as well as early buy-in from these key departments. In the Denmark pilot, in total, around five man-months were dedicated to this step.
In the Danish pilot, both the Danish Business Authority (part of the Ministry of Business and Growth) and the Danish Environmental Protection Agency (part of the Ministry of Environment) provided key contributions to the core project team; this resulted in a very strong mix of expertise and access to data and contacts.
As in any strategic project, key stakeholders should be engaged from the very start. Three broad types of stakeholders need to be engaged in the project: businesses, policymakers and other society stakeholders.
Businesses. It is crucial to involve businesses throughout the project in order to: (i) get insights and knowledge to identify the most relevant circular economy opportunities and barriers in each focus sector; (ii) create early alignment on common direction for the country and the focus sectors; (iii) further demonstrate circular economy benefits to businesses and build capabilities. As the circular economy is a new notion to both policymakers and (certain) companies in many countries, business involvement is even more important than in other policy areas. Different from some other policy areas, it is crucial to engage individual businesses and not just industry associations, as the assessment of opportunities and barriers requires a deep technical understanding of specific products and business lines that individual businesses can typically provide better than industry associations. Of course, involving industry associations is important as well to provide a well-rounded picture of opportunities and barriers in the focus sectors. Businesses would need to be involved primarily in the second phase of the project – i.e. to identify the circular economy opportunities and barriers once the focus sectors have been identified. In the Denmark pilot, 25-plus businesses were involved. Most of these companies were Danish, but selected businesses outside Denmark were also interviewed in order to incorporate international best practices.
Policymakers. Aside from a core group of policymakers leading the project, it is important to engage a wider group of policymakers, including representatives from different government departments (for example Finance, Business/Industry, Environment, Food/Agriculture, Energy). They should be involved intensively throughout the project, to leverage their expertise and ensure alignment with the project direction. In the Denmark pilot, senior representatives from six ministries (the Ministry of Business and Growth, the Ministry of Environment, the Ministry of Finance, the Ministry of Foreign Affairs, the Ministry of Climate, Energy and Building, and the Ministry of Food, Agriculture and Fisheries) and policy and economic experts from the Danish Climate Council, Statistics Denmark and DREAM (a macroeconomic modelling organisation) were involved in an ‘Observer Group’ from the beginning of the project. This ‘Observer Group’ convened three times over the course of it, and provided crucial input in each step.
Other society stakeholders. These include citizens and consumers, labour and environmental organisations, researchers and academics. They should be involved throughout the project to ensure a rounded picture of national circumstances and ambitions. In the Denmark pilot, a multi-stakeholder ‘Danish Society Stakeholder Group’ consisted of representatives from, amongst others, different political parties, industry associations, and unions.

42 • DELIVERING THE CIRCULAR ECONOMY – A TOOLKIT FOR POLICYMAKERS
2.1.1 Baseline circularity level and policy landscape
Objective: Understand country starting point before deciding where to go.
End product: Assessment of the country’s level of circularity compared to other countries. A broad understanding of the landscape of existing circular economy related policies.
Level of circularityAssessing the current level of circularity provides useful guidance to set an appropriate national ambition level. The circularity baselining gives a first indication of the areas in which a country is more or less advanced compared to its peers, which provides useful input for setting the ambition level. It also provides initial high-level direction on the solution space. If a country performs very well on a certain metric, significant attention has probably been spent on it in the past, and it can be useful to consider whether significant progress is still possible on top of the expected impact from existing initiatives. An example from the Denmark pilot is energy efficiency and the adoption of renewable energy. Denmark is already one of the world leaders in these domains, and has even more ambitious targets in place. Therefore, these areas were deprioritised when assessing circular economy opportunities.
If a country performs below average on a metric, it could be fruitful to use existing success formulas to quickly advance in that area, or to leapfrog the potentially suboptimal solutions that other countries have developed (e.g. a large incineration infrastructure to avoid landfilling).
Existing metrics do not fully cover the circular economy. Some important metrics such as the level of sharing and the level of remanufacturing are simply not yet available at a national level, beyond anecdotal evidence in specific sectors or applications.
To baseline a country’s level of circularity within reasonable limits of time and effort, using existing metrics is often however the only option. Figure 6 shows a set of such metrics for Denmark and the European Union. 42 Although this set is neither comprehensive nor a firm recommendation, it covers four key circularity areas, and balances completeness with more pragmatic objectives such as data availability and comparability over time and across countries. The four key areas and corresponding metrics are:
• Resource productivity. The resource productivity metric is the lead indicator of the European Commission’s Resource Efficiency scoreboard, and consequently has high-quality data availability and transparency. A drawback is that domestic material consumption in the denominator is highly influenced by the industrial structure in each country, and that weight does not necessarily reflect environ-mental costs.
• Circular activities. Ideally, a complete set of indicators including the adoption of remanufacturing and sharing would be measured. As this data is not readily available, recycling rate and eco-innovation indexes were selected as proxy indi-cators.
• Waste generation. The two metrics shown have been selected to reflect that overall waste generation, often driven by industries, could be quite different from waste generated by consumers (a large contributor to municipal waste). As with resource productivity, there are caveats such as the influence of industrial struc-ture on overall waste generation.
• Energy and greenhouse gas emissions. Two straightforward metrics of renew-able energy use and greenhouse gas emissions per GDP output were selected, recognising that again, industrial structure influences the outcome.
42 The level of circularity in the Denmark pilot primarily used the EU as the benchmark. While this was the nat-ural choice due to data availability and similarities in legal framework, a more comprehensive comparison to international best performers could lead to interesting insights as well.

DELIVERING THE CIRCULAR ECONOMY – A TOOLKIT FOR POLICYMAKERS • 43
As part of a strategic circular economy initiative, a wider transparency and circularity measurement effort can be launched. To ensure comparability with other countries, such an effort would ideally happen in an international context, involving, for example the OECD, Eurostat, or the United Nations.
There are currently a number of initiatives in progress to increase data transparency and/or further develop adequate metrics, to give just a few examples:
• In Scotland, a carbon metric was developed to quantify the carbon impact of waste, assessing the emissions generated by producing and recycling materials as well as the emissions from the disposal process itself.43
• In Europe, the EU Resource Efficiency scoreboard and the Raw Material Con-sumption (RMC) indicator illustrate the progress towards increased resource effi-ciency of individual member states and the European Union as a whole.44
• In the UK, Sankey diagrams were developed to visualise and analyse material flows and circularity of the economy.45
• In Denmark, Statistics Denmark is implementing a system of physical supply-use tables and physical input-output tables. The system aims at complementing the monetary supply-use and input-output tables with information on the quantities of materials (natural resources, products and residuals) flowing into, through and out of the economy.
• The Ellen MacArthur Foundation and Granta with EU LIFE Funding, have devel-oped Circularity Indicators for companies to assess how well a product or com-pany performs in the context of the circular economy. The main indicator, the Material Circularity Indicator, measures how restorative the material flows of a product or company are, and complementary indicators measure additional im-pacts and risks46.
• The German government’s goal to double raw material productivity by 2020 compared with 1994 (see Table 2 for more detail) is expressed using the ratio of GDP to Direct Material Input in tonnes of abiotic raw materials. The indicator Do-mestic Material Consumption in raw material equivalents is also used as it takes into account material flows caused by the production of imports. A third indica-tor, Total Material Consumption, will also be used in future – if data quality can be sufficiently increased – to cover extracted resources that are unused, such as mining spoils.47
For a more detailed discussion of measuring national economic performance taking into account the three principles of the circular economy as laid out in Chapter 1.1, see Section 2.1.2.
Standard setting organisations also have a role to play in providing measurement frameworks. Some examples of work in this area include:
• The Association of German Engineers (VDI) provides a set of technical product standards on resource efficiency and on recycling, including on disposal logistics. It also provides services such as resource checks and regional events for a re-source efficiency network to help link entrepreneurs and information and funding providers.48
43 www.zerowastescotland.org.uk/category/subject/carbon-metric
44 http://ec.europa.eu/environment/resource_efficiency/targets_indicators/scoreboard/index_en.htm
45 www.wrap.org.uk/content/material-flows-uk
46 For more information see: www.ellenmacarthurfoundation.org/circular-economy/research-initiatives
47 German Federal Ministry for the Environment, Nature Conservation, Building and Nuclear Safety (BMUB), German Resource Efficiency Programme (ProgRess) (2012).
48 See for example VDI Annual Report 2013/2014.

+8%
-42%
+55%
+14%
+84%
-34%
+36%
2.11.9
4069
747481
60%
53%
26%14%
225343
13610
0
44 • DELIVERING THE CIRCULAR ECONOMY – A TOOLKIT FOR POLICYMAKERS
Figure 6: Circularity baselining in the Denm
ark pilot
SCOPE
IND
ICATOR
RESO
UR
CE
PRO
DU
CTIV
ITY
CIR
CU
LAR
AC
TIVITIES
WA
STE G
ENERATIO
N
ENER
GY
AN
D
GR
EENH
OU
SE G
AS EM
ISSION
S
Resource productivity G
DP
EU
R / kg
do
mestic m
aterial co
nsump
tion
Recycling rate, excluding major m
ineral w
aste & adjusted for trade2
tonnes recycled
/tonnes treated
(percent)
Eco-innovation index Ind
ex with 16
indicato
rs (e.g. g
reen investm
ents, emp
loyment, p
atents)
Waste generated per G
DP output,
excluding major m
ineral waste
tonnes / E
UR
millio
n
Municipal w
aste generated per capita
3 to
nnes / capita
GH
G em
issions per GD
P output to
nnes CO
2e/EU
R m
illion
Share of renewable energy
Percent o
f gro
ss final energ
y co
nsump
tion
1 2012 values if not stated
otherwise
2 Recycling
of dom
estically generated
waste (incl. exp
orted w
aste, excl. imp
orted w
aste) 3 20
13 data
SOU
RC
E: R
esource Effi
ciency Scoreboard
2014
Hig
hlights, E
uropean com
mission (20
14); E
urostat; Statistics Denm
ark, Danish E
PA
DEN
MA
RK
1EU
-281

DELIVERING THE CIRCULAR ECONOMY – A TOOLKIT FOR POLICYMAKERS • 45
Figure 7: Six policy intervention types with examples
POLICY INTERVENTION TYPES
EXAMPLES
EDUCATION, INFORMATION & AWARENESS
Integration of circular economy/systems thinking into school and university curricula
Public communication and information campaigns
COLLABORATION PLATFORMS
Public-private partnerships with businesses at national, regional and city level
Encouragement of voluntary industry collaboration platforms, encouraging value-chain and cross-sectoral initiatives and information sharing
R&D programmes in the fields of, for example, material sciences and biosystems
BUSINESS SUPPORT SCHEMES
Financial support to business, for example direct subsidies, provision of capital, financial guarantees
Technical support, advisory, training and demonstration of best practices to business
PUBLIC PROCUREMENT & INFRASTRUCTURE
Public procurement
Public investment in infrastructure
REGULATORY FRAMEWORKS
Government (sector) strategy and associated targets on resource productivity and circular economy
Product regulations, including design, extended warranties and product passports
Waste regulations, including collection and treatment standards and targets, the definition of waste, extended producer responsibility and take-back systems
Industry, consumer, competition and trade regulations, for example on food safety
Accounting, reporting and financial regulations including accounting for natural capital and resources, and the fiduciary duty of investors and managers
FISCAL FRAMEWORKS
VAT or excise duty reductions for circular products and services
Tax shift from labour to resources

46 • DELIVERING THE CIRCULAR ECONOMY – A TOOLKIT FOR POLICYMAKERS
Figure 8: Policy landscape in the Denm
ark pilot
POLICY
INTERV
ENTIO
N TY
PESEX
AM
PLES OF EX
ISTING
INTERV
ENTIO
NS
EXAM
PLES OF PO
SSIBLE AD
DITIO
NA
L IN
TERVEN
TION
S (AS O
BSERVED
AT STAR
T OF
PRO
JECT A
ND
NO
T TAK
ING
INTO
ACCO
UN
T SU
BSEQU
ENT A
NA
LYSIS)
EDU
CATION
, IN
FOR
MATIO
N &
AWA
REN
ESS
• C
onsumer inform
ation camp
aigns, e.g
. ‘Use m
ore, waste less’ and
‘Stop W
asting Food
’•
Systems thinking
integrated
in curricula•
Further pilot p
rojects to dem
onstrate circular economy
potential to b
usinesses
COLLA
BORATIO
N
PLATFOR
MS
• G
reen Industrial Sym
biosis p
rogram
me
• Four new
partnership
s (food, textile, construction and
packag
ing) as p
art of the D
anish Waste Prevention Strateg
y•
Rethink R
esources, an innovation centre to supp
ort resource efficiency in
comp
anies •
‘Genbyg
Skive’ pilot p
roject to re-use build
ing m
aterials to create business
opp
ortunities and red
uce waste
-
BUSIN
ESS SUPPO
RT
SCH
EMES
• Fund
for Green B
usiness Develop
ment (E
UR
27m 20
13–2018) to sup
port
innovation and new
business m
odels
• M
aabjerg
Energ
y Concep
t (ME
C) b
io-refinery p
art funded
by Innovation Fund
Denm
ark (EU
R 4
0m
)
• D
utch ‘Green D
eal’ inspired
prog
ramm
e to provid
e on-dem
and sup
port to com
panies in im
plem
enting circular econom
y op
portunities
PUBLIC
PRO
CU
REM
ENT &
INFRA
STRU
CTU
RE
• G
overnment Strateg
y on Intelligent Pub
lic Procurement contains
initiatives to supp
ort circular procurem
ent practices
• Strateg
y on waste p
revention also contains an initiative to develop
guid
elines for circular pub
lic procurem
ent
• G
uidelines on the circularity of m
aterials and p
roducts
integrated
into pub
lic procurem
ent policy
REG
ULATO
RY FRA
MEW
OR
KS
• A
mb
itious energy effi
ciency and G
HG
emissions targ
ets, e.g. 4
0%
GH
G
reduction by 20
20 vs. 20
% at E
U level,
• A
mb
itious targets for recycling
/incineration/landfi
ll, upd
ated every 6
years, e.g. recycle 50
% of household
waste by 20
22•
Taskforce for increased resource effi
ciency to review existing
regulations
affecting
circular economy p
ractices
• N
ew m
etrics introduced
to measure econom
ic perform
ance, e.g.
comp
lements to G
DP such as natural cap
ital•
Eng
agem
ent at EU
level to adap
t existing or introd
uce new
regulations relevant to the circular econom
y, e.g. p
roduct p
olicy
FISCAL FRA
MEW
OR
KS
• Taxes on extraction and
imp
ort of raw m
aterials, vehicle registration and
water sup
ply
• H
igh and
incrementally increased
taxes on incineration / landfi
ll to p
romote recycling
and w
aste prevention
• H
ighest energ
y taxes in Europ
e (70%
above E
U27) and
CO
2 taxes•
Tax cuts desig
ned to p
romote use of low
-carbon energ
y
• Investig
ation into effects of tax shift from
labour to resources
SOU
RC
E: E
uropean C
omm
ission, Tax reforms in E
U M
emb
er States 2013; IE
A, E
nergy P
olicies of Denm
ark: 2011 review
; Nord
ic Council of M
inisters, The use of economic instrum
ents in N
ordic environm
ental policy 20
10-20
13; Danish leg
islative council, Waste m
anagem
ent policy in D
enmark, 20
14; The E
x’Tax project, N
ew era. N
ew p
lan. Fiscal reform
s for an inclusive, circular econom
y, 2014
.

DELIVERING THE CIRCULAR ECONOMY – A TOOLKIT FOR POLICYMAKERS • 47
• In the UK, the British Standards Institute (BSI) has developed a number of stan-dards that support waste prevention, resource efficiency, eco-design and reman-ufacturing, for example on design for manufacture, assembly, disassembly and end-of-use processing. It is also working on a framework standard for the circular economy, detailing the core principles an organisation should embed to realise its full benefits49.
• The Cradle to Cradle Institute administers the publicly available Cradle to Cradle Certified Product Standard and is developing an open database of ‘preferred’ alternative chemicals, materials and processes to help companies reformulate products to make them more circular.
Policy landscape Understanding, at a high level, the strengths and possible development areas of the current policy landscape allows for more targeted identification of relevant policy interventions later in the project, and to engage stakeholders early on in a discussion on which broad types of policy interventions could make sense for the country. This discussion will of course be refined once specific circular economy opportunities and related barriers have been identified; yet getting a reflection started with key stakeholders as soon as possible is a valuable end in itself. Such a discussion could reveal potential upcoming policy revisions, which are highly relevant to consider when new policy interventions are developed.
An understanding of the policy landscape can be established within six key categories illustrated with examples in Figure 7: education, information and awareness; collaboration platforms; business support schemes; public procurement and infrastructure; regulatory frameworks; and fiscal frameworks. These categories are explained in more detail in Section 2.2.5.
Figure 8 shows the outcome of this analysis for the Denmark pilot. For the ‘examples of existing interventions’ column the exercise involved consulting government reports and other information sources with assistance from multiple Danish government departments. The ‘examples of possible additional interventions’ column involved research on circular economy policies other countries are pursuing and on interventions that have been discussed in literature, for example those studies listed in Table 2.
2.1.2 Set ambition level
Objective: Align stakeholders on overall direction and focus of later sector deep dives to work towards a common direction.
End product: Clear, quantified ambition level.
Setting a national ambition level can be a powerful lever to align project stakeholders on the overall direction. An ambition level can for example influence the sector selection (e.g. focus on employment vs. environmental challenges when selecting focus sectors), as well as the prioritisation of circular economy opportunities within the focus sectors.
If adopted (even if non-binding), national targets can send important signals to businesses and investors. Famous examples include the carbon reduction targets adopted by the European Union (20% reduction by 2020 and 80% by 2050, vs 1990 levels), the US (26–28% by 2025, vs. 2005 levels50), and China (peaking of CO2 emissions around 2030 and increasing the share of non-fossil fuels in primary energy consumption to around 20% by 2030).51
Below is a brief outline of three themes that could, individually or in combination, inspire countries in setting their ambition level:
49 See for example BSI, Waste prevention and the circular economy: Due diligence research report (2014).
50 European Commission, Roadmap for moving to a competitive low-carbon economy in 2050 (2011).
51 The White House, US-China Joint Announcement on Climate Change (12 November 2014).

48 • DELIVERING THE CIRCULAR ECONOMY – A TOOLKIT FOR POLICYMAKERS
Direct eff
ectIndirect eff
ect
EU STRATEG
IC PO
LICY O
BJECTIV
ES FOR
2020
POTEN
TIAL CO
NTR
IBUTIO
N O
F THE C
IRC
ULA
R ECO
NO
MY
EMPLO
YM
ENT
• 75%
of the 20–64 year olds to be em
ployed
RESEA
RC
H A
ND
DEV
ELOPM
ENT
• 3%
of the EU’s G
DP to be invested in R
&D
CLIM
ATE CH
AN
GE A
ND
ENER
GY
• G
HG
emissions 20
–30%
below 1990
• 20
% of energy from
renewables
• 20
% increase in energy effi
ciency
EDU
CATION
• Reduce rate of early school leaving below
10%
• A
t least 40%
of 30–34 year olds com
pleting third-level education
FIGH
TING
POV
ERTY
AN
D SO
CIA
L EXCLU
SION
• A
t least 20m
fewer people in or at risk of poverty
and social exclusion
• C
ould create growth
1 and employm
ent2
• Potential increase in labour-intensive activities such as rem
anufacturing and regenerative agriculture
• C
ould uncover innovative business opportunities that need new
technologies
• Likely higher dem
and for breakthroughs in for instance the m
aterials sciences and bio-sciences
• Shift to renew
able energy
• Reduced industrial G
HG
emissions due to low
er levels of virgin m
aterial extraction, reduced energy intensity (e.g. rem
anufacturing, increased asset utilisation)
• N
o demonstrated direct eff
ect on this specific target
• System
s thinking could make education m
ore appealing and can prepare students for labour m
arkets that prize creativity
• N
o demonstrated direct eff
ect on this specific target
• Potential to increase household disposable incom
e1
• Potential for m
ore local comm
unity-based enterprises and increased levels of sharing
1 The Grow
th Within rep
ort finds that in the E
U a circular econom
y scenario in 2030
leads to a red
uction in GH
G em
issions of 25% com
pared
to the baseline, w
hile increasing G
DP
by 6.7% and
household
disp
osable incom
e by 10%
. Ellen M
acArthur Found
ation, SUN
and M
cKinsey C
enter for Business and
Environm
ent, Grow
th Within: A
Circular Econom
y Vision for a C
omp
etitive Europ
e (2015).
2 The Study on m
odelling
of the economic and
environmental im
pacts of raw
material consum
ption by C
amb
ridg
e Econom
etrics / Biointellig
ence Service / EC
(2014
) finds that in the E
U resource p
roductivity
could g
enerate 2 million job
s by 2030
.
Figure 9: Potential contribution of the circular economy to ‘com
mon’ policym
aker ambitions

DELIVERING THE CIRCULAR ECONOMY – A TOOLKIT FOR POLICYMAKERS • 49
1. Quantitative circularity targets. The targets can be set using existing indicators (such as in Figure 6) or by developing new metrics. Targets could also be linked more directly to the three principles of the circular economy as laid out in Part 1. The report Growth Within52 lays out initial ideas of what such metrics could look by providing one primary metric and a set of secondary metrics for each of the three principles (see Figure 9 and the Growth Within report for more details).
2. Quantitative ‘common’ national policy targets. Circular economy can contribute to many ‘common’ policy objectives, such as, for example, the targets related to the EU 2020 agenda (see Figure 10).
3. Qualitative circular ambitions. This could mean setting a qualitative goal of being the ‘best in Europe’ in waste prevention or recycling, or becoming a ‘world leader’ in remanufacturing.
52 Ellen MacArthur Foundation, Stiftungsfonds für Umweltökonomie und Nachhaltigkeit (SUN) and McKinsey Center for Business and Environment, Growth Within: A Circular Economy Vision for a Competitive Europe (2015).
PRIMARY METRIC SECONDARY METRICS
Preserve and enhance natural capital by controlling finite stocks and balancing renewable resource flows
Degradation-adjusted net value add (NVA)1
• Annual monetary benefit of ecosystem services, e.g. from biodiversity and soils
• Annual degradation
• Overall remaining stock
Optimise resource yields by circulating products, components and materials at the highest utility at all times in both technical and biological cycles
GDP generated per unit of net virgin finite material input2
• Product utilisation
• Product depreciation/lifetime
• Material value retention ratio (energy recovery, recycling and remain industry)/value of virgin materials (rolling net average last five years)
Foster system effectiveness by revealing and designing out negative externalities
Total cost of externalities and opportunity cost
• Cost of land, air, water, and noise pollution
• Toxic substances in food systems
• Climate change, congestion, and health impacts
Figure 10: Measuring the circular economy – initial suggestions from ‘Growth Within’
1 The System of Environmental-Economic Accounting, 2012. 2 Adapted based on the EU’s Resource Efficiency Scoreboard (Eurostat, 2014). The adaptation is to deduct recovered materials and only include finite materials. SOURCE: Ellen MacArthur Foundation, SUN and McKinsey Center for Business and Environment, Growth Within: A Circular Economy Vision for a Competitive Europe (2015).

50 • DELIVERING THE CIRCULAR ECONOMY – A TOOLKIT FOR POLICYMAKERS
2.1.3 Select focus sectors
Objective: Focus assessment of sector opportunities (Chapter 2.2) on the most relevant parts of the economy.
End product: Set of focus sectors based on a prioritisation matrix that maps sectors on ‘role in national economy’ and ‘circularity potential’.
The sector selection is a key tool in the methodology, as it determines the focus for the rest of the project, not only in terms of analysis but also in terms of stakeholder engagement. A large part of the analysis is sector-specific, as opportunities, barriers and policy options typically differ significantly by sector. Stakeholders from the selected sectors (and their broader value chains) need to be engaged extensively in the sector-specific analysis, as detailed in Chapter 2.2.
To select focus sectors in a circular economy initiative, both the role in the national economy and the circularity potential can be assessed. Below, a framework to analytically assess both dimensions is laid out. This analytical framework is not an end in itself, but can serve as a facilitator for a structured debate with key stakeholders and experts.
The two natural dimensions to prioritise sectors in a circular economy initiative are the sectors’ role in the national economy and their resource profile. These can be divided in a number of sub-dimensions, for example53:
i. Role in the national economy: size (and growth) measured by share of GVA (gross value added), contribution to employment (and growth), international competitiveness.
ii. Circularity potential: material and energy intensity, volume of waste generated, share of waste landfilled/incinerated, high-level estimate of scope for improved circularity.
This list does not aim to be exhaustive, and can be adapted based on, among others, data availability and national priorities. Other sub-dimensions, such as the environmental impact of resource extraction and use, or the scarcity of required resources, could be taken into account. An additional, pragmatic dimension could be the sectors’ relative receptiveness to the circular economy.
A semi-quantitative approach to score these sub-dimensions and aggregate them into overall scores for sectors’ role in the national economy and circularity potential was used in the Denmark pilot, and can be useful for other countries. As the availability of quantitative data for sub-dimensions may vary and it might be desired to use sub-dimensions that cannot be evaluated quantitatively, it can be useful to express each dimension as an aggregate, semi-quantitative ‘score’ of normalised scores from each sub-dimension. Each sub-dimension is thus evaluated quantitatively or semi-quantitatively,54 based on the nature of the underlying data. The final result of the sector evaluation for the Denmark pilot is visualised in Figure 11 where the top-right quadrant guides the final selection.
A good starting point to conduct the sector selection is to consider the producing sectors55, as they typically have the largest direct material footprint. This already narrows down the scope of the exercise – the producing sectors in Denmark, for example, represent 24% of the Danish economy.56 It can also be useful to look at non-producing
53 More details on the sub-dimension and exact quantification methodology can be found in Appendix A.
54 This could for example be a numerical, ‘traffic-light’-based ranking, or a product of several numerical rank-ings.
55 Producing sectors include agriculture, forestry and fishing; mining and quarrying; construction; electricity and gas; manufacturing.
56 Statistics Denmark, based on gross value added 2011.
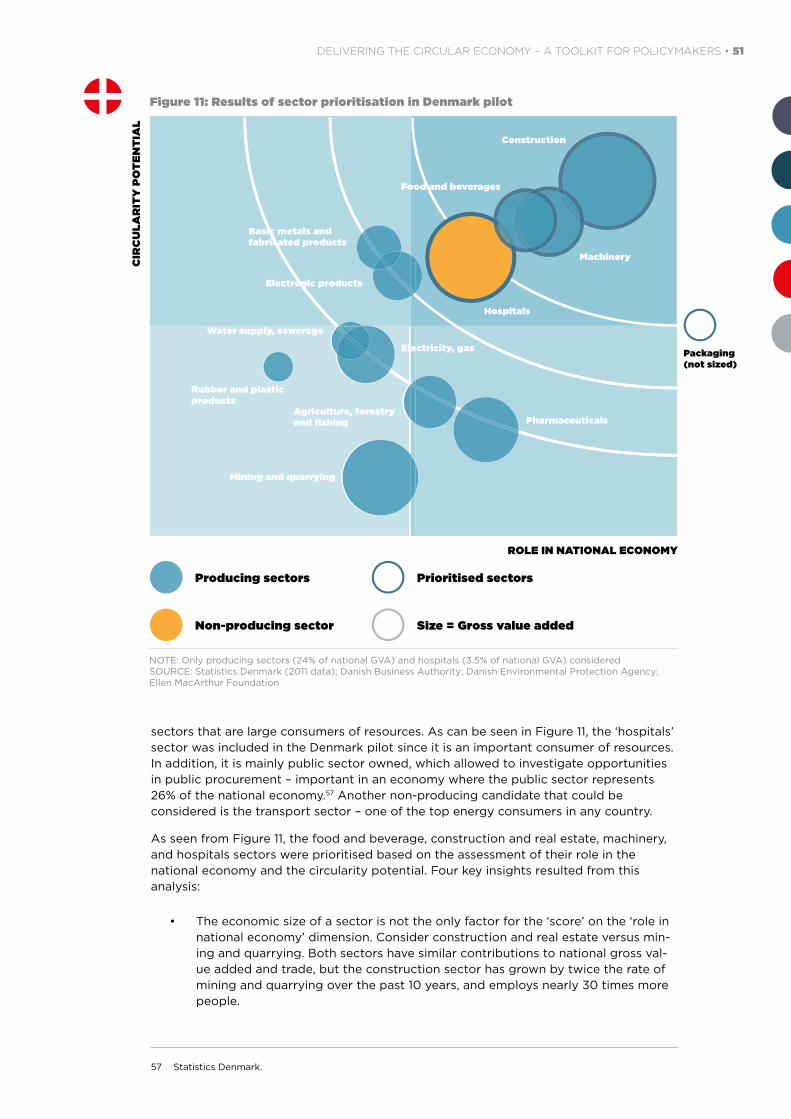
DELIVERING THE CIRCULAR ECONOMY – A TOOLKIT FOR POLICYMAKERS • 51
sectors that are large consumers of resources. As can be seen in Figure 11, the ‘hospitals’ sector was included in the Denmark pilot since it is an important consumer of resources. In addition, it is mainly public sector owned, which allowed to investigate opportunities in public procurement – important in an economy where the public sector represents 26% of the national economy.57 Another non-producing candidate that could be considered is the transport sector – one of the top energy consumers in any country.
As seen from Figure 11, the food and beverage, construction and real estate, machinery, and hospitals sectors were prioritised based on the assessment of their role in the national economy and the circularity potential. Four key insights resulted from this analysis:
• The economic size of a sector is not the only factor for the ‘score’ on the ‘role in national economy’ dimension. Consider construction and real estate versus min-ing and quarrying. Both sectors have similar contributions to national gross val-ue added and trade, but the construction sector has grown by twice the rate of mining and quarrying over the past 10 years, and employs nearly 30 times more people.
57 Statistics Denmark.
Figure 11: Results of sector prioritisation in Denmark pilot
NOTE: Only producing sectors (24% of national GVA) and hospitals (3.5% of national GVA) considered SOURCE: Statistics Denmark (2011 data); Danish Business Authority; Danish Environmental Protection Agency; Ellen MacArthur Foundation
Producing sectors
Non-producing sector
Prioritised sectors
Size = Gross value added
Food and beverages
Construction
Machinery
Hospitals
Basic metals andfabricated products
Electronic products
Water supply, sewerage
Rubber and plastic products
Electricity, gas
Agriculture, forestry and fishing Pharmaceuticals
Mining and quarrying
ROLE IN NATIONAL ECONOMY
CIR
CU
LAR
ITY
PO
TEN
TIA
L
Packaging(not sized)

52 • DELIVERING THE CIRCULAR ECONOMY – A TOOLKIT FOR POLICYMAKERS
• The ‘circularity potential’ dimension takes into account not only total resource consumption and waste generation, but also the potential to avoid and/or val-orise that waste. For example, mining and quarrying has the lowest score since initial analysis indicated that there is little dependence on other raw materials, little intrinsic value of the materials handled (since mining is generally the first stage in a value chain), limited avoidable waste generated, and a small potential value to valorise the waste. In contrast, the construction sector has a high raw material dependence and handles materials with high intrinsic value, while gen-erating significant volumes of waste that are deemed feasible to further valorise through circular activities.
• The resulting matrix is only a guide to the sector prioritisation – there is always a judgement call involved in the final selection.
• In addition to sectors, it is also possible to consider other important contributors to resource consumption and waste in the economy, especially from a consumer point of view. Packaging was included as a fifth focus sector58 in the Denmark pilot since it represents a formidable challenge in terms of reducing the resource footprint of consumer and other goods.
While most data needed to assess the role in the national economy can be found in national statistical databases, assessing the ‘circularity potential’ relies more heavily on expert opinion and judgement. Assessing the ‘circularity potential’ will require a first round of interviews with sector experts and consultation of previous reports (such as the Denmark findings in this report, and the reports mentioned in Table 1 in Part 1). To structure the assessment of the scope for improved circularity, inspiration can also be taken from the ReSOLVE framework laid out in Chapter 1.1. Figure 12 in Section 2.2.2 provides an indicative overview of which ReSOLVE circularity action areas could be worth further investigation in different sectors.
It is useful to consider the sectors as ‘anchor sectors’ for their respective value chains. This means that subsequent opportunity analysis would also look at a focus sector’s supply chain and customers.59 For example, in the Denmark pilot, the selection of the anchor sector ‘Food & Beverage processing’, also involved an analysis of the consumer side to address the issue of avoidable food waste. An alternative to the selection of ‘anchor sectors’ is the direct selection of full value chains. The Netherlands Organisation for Applied Scientific Research (TNO), Circle Economy and MVO Nederland developed an approach for such a value-chain selection mechanism, and is currently applying it to the Dutch economy.
2.2 Assess sector opportunitiesOnce the focus sectors have been selected, the sector-specific assessment can begin. This step can be conducted in parallel sector working groups, and heavily relies on the involvement of businesses. The most relevant circular economy opportunities need to be mapped (Section 2.2.1) and prioritised (Section 2.2.2). For the prioritised opportunities, sector-specific economic impact needs to be assessed (Section 2.2.3), barriers limiting their realisation identified (Section 2.2.4) and policy options to overcome these barriers mapped (Section 2.2.5).
The different sector deep dives can be conducted in parallel by one central project team, or managed by individual project managers or small teams. The project team(s) in this step should have disposal of strong business analysis skills and circular economy expertise, including the ability to understand value chains, facilitate discussions with businesses and perform sector-specific quantification of economic impact. Prior experience in circular economy is an important success factor especially for the mapping
58 While not technically a sector, ‘packaging’ is referred to as a focus sector throughout the rest of the docu-ment.
59 This perspective also allows the evaluation of opportunities within ‘non-producing’ sectors, as part of the anchoring sector’s value chain.

DELIVERING THE CIRCULAR ECONOMY – A TOOLKIT FOR POLICYMAKERS • 53
and prioritisation of circular economy opportunities described in Sections 2.2.1 and 2.2.2. Policy analysis skills are required for the mapping of policy options. In the Denmark pilot, in total, around 25 man-months (5 to 10 persons over a period of 4 months) were dedicated to this step.
For this step, it is crucial to intensively engage businesses from the focus sectors and their value chains, in order to:
• Get insights and knowledge to identify the most relevant circular economy op-portunities and barriers in each focus sector.
• Create early alignment on a common direction for the country and the focus sec-tors.
• Further demonstrate circular economy benefits to businesses and build capabili-ties.
It can be helpful to engage a diverse group of businesses, as perspectives on opportunities and perception of barriers may differ between businesses even within one sector based on the business size, business model, product focus and prior experience with circular business initiatives. Engaging selected businesses from other countries where relevant in addition to the focus domestic businesses can help capture international best practices. Industry associations, academics, consumers and other society stakeholders are also relevant to involve at this point.
Practically, a mix of individual interviews and sector working sessions is likely to be helpful. Individual interviews work well to capture detailed input on opportunities and barriers. Bringing businesses together in sector and value chain (and, to a lesser extent, cross-value chain) working sessions can complement individual interviews by providing a forum to jointly align on the way forward, and to create a strong network of businesses dedicated to accelerate the transition towards the circular economy. Ideally this network does not simply help to identify opportunities and barriers in the project itself, but continues to exist as a standalone network where circular economy frontrunners can exchange best practices and find partners for circular business opportunities.
The Denmark pilot included a series of 90-minute phone interviews with over 25 individual businesses, complemented with an in-person joint working session format that built upon the existing Danish circular economy network ‘Cirkulær økonomi’, led by Ida Auken, Member of Danish Parliament, member of the World Economic Forum Meta-Council on the Circular Economy 2014-2016, and former Danish Minister for the Environment.
2.2.1 Map circular economy opportunities in each focus sector
Objective: Create exhaustive overview of possible circular economy opportunities, to be prioritised in Section 2.2.2.
End product: Structured map of potential circular economy opportunities for each focus sector, identified along the ReSOLVE framework.
The circular economy covers many types of opportunities that can differ significantly by sector and country. It can therefore be helpful to systematically map potential opportunities in each sector before proceeding to prioritise among these opportunities.
The ReSOLVE framework laid out in Chapter 1.1, offers a structure for such a systematic screening of opportunities.60 Using the ReSOLVE framework to identify and map opportunities involves an iterative exercise that begins with a high-level mapping for each focus sector derived from existing circular economy literature, including the reports
60 Ellen MacArthur Foundation, Stiftungsfonds für Umweltökonomie und Nachhaltigkeit (SUN) and McKinsey Center for Business and Environment, Growth Within: A Circular Economy Vision for a Competitive Europe (2015).

54 • DELIVERING THE CIRCULAR ECONOMY – A TOOLKIT FOR POLICYMAKERS
listed in Table 1 (in Part 1) and the findings for Denmark listed in Part 3. Thereafter it can be helpful to reach out to sector stakeholders and experts to refine this overview to ensure that the mapping covers all relevant opportunities.
As the purpose of the mapping exercise is to create an overview of opportunities by sector, not to fully detail all these opportunities, the exercise can be conducted relatively quickly.
2.2.2 Prioritise and detail circular economy opportunities
Objective: Prioritise and detail opportunities in each focus sector based on potential impact
End product: Set of (one to three) prioritised and detailed opportunities per sector.
The systematic screening of opportunities described above can result in a large number of possible opportunities for each focus sector. To guide further analysis, these opportunities need to be prioritised. The prioritised opportunities can then in turn be detailed and assessed in terms of sector-specific impact (Section 2.2.3), barriers (Section 2.2.4) and policy options (Section 2.2.5).
Prioritising and detailing the opportunities is, together with the two following analyses (quantifying the value and identifying the barriers in Sections 2.2.3 and 2.2.4), the part of the methodology that probably entails most involvement of businesses. While the project team can make proposals based on literature review and international best practices, only businesses can provide input grounded in local business reality on what the opportunities could exactly look like.
PRIORITISATION
The expected impact is likely the best guide for an initial prioritisation of opportunities. A classical impact-feasibility prioritisation approach could also be used, but it can be easier to only assess potential impact (and not feasibility) at the start of the process, when the understanding of the opportunities is least advanced. In the Denmark pilot, for example, it quickly became clear that 3D printing of building modules could have a significant impact in the construction sector (see Chapter 3.3 for more details). It was however much harder to assess its feasibility without more detailed analysis.
A simple, qualitative scoring mechanism to rank the circular economy opportunities can be used. Figure 12 shows an indicative prioritisation based on economic and resource impact of the different action areas in the ReSOLVE framework for 20 major sectors in Europe. While this table should not be regarded as the final say on where potential can be found, it can give a first indication to guide the effort. The Denmark pilot used a qualitative, five-tiered ranking to prioritise up to three opportunities per sector. Figure 13 shows an example mapping for the Construction & Real Estate sector in the Denmark pilot.
When ranking the opportunities, it is important to not only consider the action areas as individual, decoupled parts, but also to keep in mind their systemic effects. In packaging, for example, focusing on objectives such as light weighting (‘optimise’) using composite/multi-layered polymer/fibre/metal materials without consideration of the full life-cycle of the packaging (explicitly at the end of use) can lead to a significantly reduced potential for recyclability (‘loop’). Impacts can even extend across sectors – for example, wrapping cucumbers in a plastic film increases the amount of plastic waste, but can increase the cucumbers’ shelf life from three to 14 days,61 which is an important lever in avoiding food waste.
61 According to the Cucumber Growers Association, this requires 1.5 g of packaging. Other studies have found that shrink-wrapped apple trays reduce wastage by 27%, with similar results for potatoes and grapes. See, for example, Levitt, S. D. & Dubner, S. J., When to Rob a Bank: A Rogue Economist’s Guide to the World (2015).

DELIVERING THE CIRCULAR ECONOMY – A TOOLKIT FOR POLICYMAKERS • 55
ECO
NO
MIC
AC
TIV
ITIE
SRE
GEN
ERAT
ESH
ARE
OPT
IMIS
ELO
OP
VIR
TUA
LISE
EXC
HA
NG
E
Info
rmat
ion
& c
omm
unic
atio
n se
rvic
es, m
edia
and
tel
ecom
mun
icat
ions
Scie
ntifi
c R
&D
, oth
er p
rofe
ssio
nal,
scie
ntifi
c &
tec
hnic
al a
ctiv
itie
s
Educ
atio
n
Hum
an h
ealt
h an
d so
cial
wor
k ac
tivi
ties
Adm
inis
trat
ive
& s
uppo
rt s
ervi
ces
Art
s, e
nter
tain
men
t an
d re
crea
tion
Fina
ncia
l and
insu
ranc
e ac
tivi
ties
Lega
l & a
ccou
ntin
g he
ad offi
ces,
con
sult
ing,
arc
hite
ctur
e &
eng
inee
ring
, TIC
Dis
trib
utiv
e tr
ades
(in
cl. w
hole
sale
and
ret
ail t
rade
)
Man
ufac
ture
of
woo
d an
d pa
per
prod
ucts
, and
pri
ntin
g
Publ
ic a
dmin
istr
atio
n an
d de
fenc
e; c
ompu
lsor
y so
cial
sec
urit
y
Rea
l est
ate
acti
viti
es
Man
ufac
turi
ng o
f te
xtile
s, a
ppar
el, l
eath
er a
nd r
elat
ed p
rodu
cts
Con
stru
ctio
n
Man
ufac
turi
ng o
f tr
ansp
ort
equi
pmen
t
Man
ufac
turi
ng o
f fu
rnit
ure
Wat
er s
uppl
y, w
aste
& r
emed
iati
on
Man
ufac
turi
ng o
f el
ec. e
quip
men
t, c
ompu
ter,
elec
tron
ic a
nd o
ptic
al p
rodu
cts
Man
ufac
turi
ng o
f m
achi
nery
and
equ
ipm
ent
Man
ufac
turi
ng o
f ru
bber
, pla
stic
s, b
asic
and
fabr
icat
ed m
etal
pro
duct
s
Tran
spor
tati
on a
nd s
tora
ge
Agr
icul
ture
, for
estr
y an
d fi
shin
g
Man
ufac
turi
ng o
f fo
od, b
ever
ages
and
tob
acco
pro
duct
s
Min
ing
and
quar
ryin
g
Elec
tric
ity,
gas
, ste
am a
nd a
ir-c
ondi
tion
ing
supp
ly
Man
ufac
turi
ng o
f co
ke, r
efine
d pe
trol
eum
, che
mic
als
prod
ucts
Man
ufac
turi
ng o
f ph
arm
aceu
tica
ls, m
edic
inal
che
mic
al, b
otan
ical
pro
duct
s
Acc
omm
odat
ion
and
food
ser
vice
act
ivit
ies
SOU
RC
E: A
dap
ted
fro
m E
llen
Mac
Art
hur
Foun
dat
ion,
SU
N a
nd M
cKin
sey
Cen
ter
for
Bus
ines
s an
d E
nviro
nmen
t, G
row
th W
ithi
n: A
Cir
cula
r Ec
onom
y V
isio
n fo
r a
Com
pet
itiv
e E
urop
e (2
015
).
Figu
re 12
: In
dica
tive
pri
orit
isat
ion
of R
eSO
LVE
acti
on a
reas
for 2
0 s
ecto
rs in
Eur
ope
Hig
hM
iddl
eLo
w

56 • DELIVERING THE CIRCULAR ECONOMY – A TOOLKIT FOR POLICYMAKERS
•
Use of biological elem
ents in architecture (e.g. ‘living roofs’ that purify water)
• Return of organic construction m
aterial to biosphere
• Sharing of fl
oor space reducing demand for new
buildings •
Shared residential floor space (e.g. A
irbnb, Couchsurfi
ng, Hoffi
ce)•
Shared office space (e.g. Liquidspace) and increase of desk sharing policies
• Increased use of under-utilised buildings
• M
ulti-purposing of offices and public buildings for better utilisation
• Re-purposing of building interiors to increase lifetim
e of existing buildings
• C
oordination of all stakeholders along value chain to reduce structural waste
• Energy use optim
isation through low-energy houses and sm
art homes
• Increased reuse and high-value recycling of building com
ponents and materials, enabled by
• D
esigning buildings for disassembly
• N
ew business m
odels (e.g. other owner of m
aterials than property owner)
• Building passports/signatures and reverse logistics ecosystem
s
Increased teleworking to reduce need for offi
ce floor space
Modular production off
-site for rapid assembly on-site
3D printing of building com
ponents
Figure 13: Qualitative assessm
ent of potential of opportunities for the Construction &
Real Estate sector in the Denm
ark pilot
SOU
RC
E: E
llen MacA
rthur Foundation
QU
ALITATIV
E ASSESSM
ENT O
F POTEN
TIAL
Low potential
High potential
Prioritised for further assess-m
ent
Indirectly included as enabler of key sector opportunities
XCH
AN
GE
DELIVERING THE CIRCULAR ECONOMY – A TOOLKIT FOR POLICYMAKERS • 57
DETAILING THE OPPORTUNITIES
Prioritising and detailing the opportunities happens in an iterative process – understanding the opportunities to a certain extent is required to rank, but prioritisation is required to determine which opportunities need to be fully detailed.
To make the opportunities concrete and tangible, it can be helpful to zoom in on a specific part or a few specific products within a value chain. For example, in the Denmark pilot, analysis in the machinery sector was focused on two of its key products: pumps and wind turbines. It can also be helpful to assess how they can be implemented using the four building blocks of the circular economy, described in the first Towards the Circular Economy report and briefly summarised below:
• Circular design, i.e. improvements in materials selection and product design (standardisation/ modularisation of components, purer materials flows, and de-sign for easier disassembly), which lie at the heart of the circular economy.
• Innovative business models, especially changing from ownership to perfor-mance- based payment models, which are instrumental in translating products designed for reuse into attractive value propositions.
• Core competencies along reverse cycles and cascades, which involve estab-lishing cost-effective, better-quality collection and treatment systems (either by producers themselves or by third parties).
• Enablers for improving cross-cycle and cross-sector performance which are factors that support the required changes at a systems level and include higher transparency for materials flows, alignment of incentives, and the establishment of industry standards for better cross-chain and cross-sector collaboration. Other aspects are access to financing and risk management tools and infrastructure development.
As an example, consider the remanufacturing opportunity identified in the machinery sector in the Denmark pilot. It belongs to the ‘Loop’ action area of ReSOLVE. It involves at least three circular economy building blocks: design for disassembly and remanufacturing, performance business models that allow the manufacturer to retain ownership over the products, and reverse cycles to return and remanufacture the products.
DEFINING SCENARIOS
To ensure a consistent ambition level when detailing the opportunities, it can be helpful to define the time horizon and the overall scenarios in which these opportunities are assessed. A short-term and long-term time horizon can be defined to identify tangible near-term opportunities as well as more ambitious, longer-term potential. Ideally, the selected time horizons align with other strategic national or international targets and initiatives. The scenarios can include a view on how society is expected to have evolved, at the selected time horizons, in terms of technology, customer behaviour, and other frame conditions.
In the Denmark pilot, a short-term scenario of five years (2020) and a long-term scenario of 20 years (2035) were selected. The year 2035 was selected to illustrate as much of the full potential of circular activities as possible, without going so far out that businesses and other stakeholders would find it hard to assess concrete opportunities. The related circular economy scenarios were defined relatively conservatively – for example, only relying on technologies that are today already at late R&D or early commercial stage. See Appendix B for additional details.
58 • DELIVERING THE CIRCULAR ECONOMY – A TOOLKIT FOR POLICYMAKERS
2.2.3 Quantify sector impact
Objective: Understand the economic (and resource) impact of circular economy opportunities, either as input to an economy-wide assessment (see Section 2.3.1) or as a standalone result.
End product: Quantified impact for each opportunity and circular economy scenario (where applicable).
To build the case for business action and potential policy interventions, the economic impact of each prioritised circular economy opportunity needs to be assessed. This section describes a tool to conduct this impact quantification for individual opportunities. The ambition level for the quantification exercise needs consideration before the exercise is initiated – while understanding the impact is important to help mobilise business and build the case for policy intervention, the related (potentially high) resource demands needs to be balanced with that of the other steps from the toolkit.
This sector-specific quantification can be a goal in itself, or serve (as was the case in the Denmark pilot) as further input for the economy-wide impact quantification described in Section 2.3.1. In the latter case, calculations should be performed with a sufficient level of detail to be able to convert to the input-output tables needed in the CGE or other type of economy-wide impact assessment model (see Section 2.3.1 for further details).
While economic impact is a natural first choice of metrics to make the case for the circular economy, other metrics such as resource savings and greenhouse gas emissions can also be taken into account. In the Denmark pilot, resource savings were estimated for two key materials (steel and plastics) and the change in CO2 footprint was modelled in the economy-wide modelling step (see Section 2.3.1).
Figure 14 shows an overview of a possible quantification methodology, illustrated in the form of a driver tree. While the details typically need to be adjusted for each opportunity, the driver tree offers a useful structure for the quantification. The core of this approach is to zoom in on specific sub-sectors or even products (branch A of the driver tree), and consequently scaling up the impact found in these sub-sectors or products to the full sector and adjacent sectors (branch B of the driver tree). The advantage of this approach is that it makes the analysis tangible, and allows businesses to provide specific input. Other approaches are possible as well.
Branch A. Net value created in deep dive sub-sector. The net value creation is defined as a product of the overall adoption rate of the circular economy opportunity, the number of ‘units’ addressed, and the net value created per unit.
• Adoption rate. The adoption rate is a quantitative answer to the question ‘How widely will this opportunity have been adopted in a circular scenario?’ where 100% means full realisation of the potential. In the Denmark pilot, the adoption rates were always expressed as a difference between the circular scenario (2035 and 2020 horizons) and a ‘business as usual’ scenario (where some adoption rate is typically also greater than zero). This allows the model to take into account that circular economy opportunities will probably be adopted to some extent even in a non-circular scenario.
• Number of units in deep dive sub-sector. The number of units is used to de-note any quantity used as the basis of the quantification in the subsector. The unit could be (an estimated) number of products, or a volume of material flow (such as tonnes of organic waste). It could also be a monetary unit, such as ‘val-ue of purchased goods’ or ‘output of new buildings’.
• Net value created per unit. Circular activities bring two kinds of direct financial benefits to businesses: (i) cost savings from materials, components or labour (for example due to parts recovery or virtualisation), and (ii) increased revenues (from additional sales and/or a higher unit price). Additional costs include in-creased labour costs, increased material/component costs (for example to de-

DELIVERING THE CIRCULAR ECONOMY – A TOOLKIT FOR POLICYMAKERS • 59
sign more robust products), and increased energy and capital expenditure, for example to set up bio-refineries or remanufacturing plants. These elements can all be assessed separately (as was done in the Denmark pilot), or, alternatively, for a high-level estimate, in one value (e.g. 5% net cost savings per unit). They can also be assessed for consumers rather than businesses (as in, for example, the reduction of avoidable food waste).
Branch B. Scale-up factor. The scale-up factor is used to bring the net impact estimated for the deep-dive sub-sector to the full sector (and adjacent sectors). The calculation is driven by the relative size of the adjacent sub-sectors compared to the deep dive sub-sector, and a ‘scalability’ factor introduced to reflect the relative applicability of the circular economy opportunity in different sub-sectors. The final scale-up factor is the sum of each individual scale-up factor for all sub-sectors present.
• Relative size of sub-sector. This calculation is based on the relative economic size of the individual sub-sectors, for example calculated by comparing output or gross value added.
• Scalability factor. This value, set between 0 and 1, is introduced to adjust the scaling based on how applicable an opportunity is to an adjacent sub-sector compared to the deep-dive subsector. For example, a scalability factor of 0.2 means that the impact is estimated to be 20% of the impact estimated for the deep-dive sub-sector. 62
As in any modelling exercise, the hardest part is not to define the structure of the model, but to find good data to feed into the model. Here it is crucial to engage businesses to provide input on the key quantification assumptions. Practically, in the Denmark pilot, the key quantification assumptions were tested with businesses while detailing out the circular economic opportunities (see previous section). Existing reports such as the reports listed in Part 1 and the results from the Denmark pilot in Part 3 of this report can also be a useful source of information. Industry associations, public bodies and statistical authorities can help complete the picture. Finally, no matter how diligently the data gathering and impact quantification is carried out, predicting the impact of circular economy opportunities on multi-year time frames will always at best be a well-informed estimate that relies on important assumptions.
62 Technically, it is of course possible to set scalability factors to more than 1, if it is assumed that the circular economy opportunities are in fact larger in an adjacent sector. This was not done in the Denmark pilot.

60 • DELIVERING THE CIRCULAR ECONOMY – A TOOLKIT FOR POLICYMAKERS
Figure 14: Schematic overview of sector-specific impact quantification
Circular scenario adoption rate, %
Business as usual scenario adoption rate, %
Net value created in sector
EUR million
Net value created in deep-dive sub-sector
EUR million
Scale up factor to full sector
%
Size of sector vs. deep-dive sub-sector
%
Scalability factor
(between 0 and 1)
Additional costs per activity
EUR per unit
Additional revenues and cost savings per activity
EUR per unit
Adoption rate%
Number of units in deep-dive sub-sector
Net value created per unit in deep-dive sub-sector
EUR per unit
SOURCE: Ellen MacArthur Foundation
Additional sales
Price / value increase
Material / labour savings
Labour
Services
Materials / components
Energy
CapitalSector size
Deep-dive sub-sector size
A
B
2.2.4 Identify barriers
Objective: Understand the barriers standing in the way of the identified circular economy opportunities, in order to render policy options (Section 2.2.5) more targeted.
End product: Importance and description of barriers for each opportunity, structured by 15 types of barriers in four categories (economic, market failures, regulatory failures, social factors).
Once the circular economy opportunities have been prioritised, it is time to look at the barriers that stand in their way. The toolkit provides a framework to categorise these barriers and analyse their severity. Careful analysis of barriers forms the basis for the next step of arriving at targeted policy options.
The approach in this toolkit is to combine a standard analysis of market failures and regulatory failures with social factors and the economic concerns of business. The methodology refers to 15 types of barrier in four categories. It starts with the economic concerns of businesses that are assessing these opportunities: profitability, capital and technology. It includes the two ‘classic’ barrier categories from economic theory, market failures and regulatory failures, split into ten types, drawing heavily on the EU Impact Assessment Guidelines.63 Finally, even in the absence of the first three barrier categories, social factors – the fourth barrier category – can stand in the way, particularly in the case of circular economy opportunities that involve new business models or other far-reaching changes to established practices. The barriers are explained below and an example of the framework in use in the pilot study in Denmark is given in Figure 15.
63 European Commission, Impact Assessment Guidelines (and Annexes), (2009).

DELIVERING THE CIRCULAR ECONOMY – A TOOLKIT FOR POLICYMAKERS • 61
BAR
RIE
RIM
POR
TAN
CE
DES
CR
IPTI
ON
/ C
OM
MEN
TS
Not
pro
fita
ble
for b
usin
esse
s1 eve
n if
oth
er b
arri
ers
are
over
com
eN
/A
Cap
ital
inte
nsiv
e an
d/or
unc
erta
in p
ayba
ck t
imes
N/A
Tech
nolo
gy n
ot y
et a
vaila
ble
at s
cale
at
a co
st eff
ecti
ve le
vel
N/A
Exte
rnal
itie
s (t
rue
cost
s) n
ot fu
lly re
flec
ted
in m
arke
t pr
ices
N
/A
Insu
ffici
ent
publ
ic g
oods
/ in
fras
truc
ture
2 pro
vide
d by
the
mar
ket
or t
he s
tate
N/A
Insu
ffici
ent
com
peti
tion
/ m
arke
ts le
adin
g to
low
er q
uant
ity
and
high
er p
rice
s th
an is
soc
ially
des
irab
leN
/A
Impe
rfec
t in
form
atio
n, fo
r exa
mpl
e as
ymm
etri
c or
hig
h co
st in
form
atio
n, t
hat
nega
tive
ly aff
ects
mar
ket
deci
sion
sN
ot a
lway
s cl
ear t
o bu
ildin
g ow
ners
and
tena
nts
whe
ther
sha
ring
is
profi
tabl
e ne
t of
cos
ts (e
.g. r
elat
ed to
saf
ety)
Split
ince
ntiv
es (
agen
cy p
robl
em)
whe
n tw
o pa
rtie
s to
a t
rans
acti
on h
ave
diff
eren
t go
als
and
leve
ls o
f in
form
atio
nN
/A
Tran
sact
ion
cost
s su
ch a
s th
e co
sts
of fi
ndin
g an
d b
arga
inin
g w
ith
cust
omer
s or
sup
plie
rsIt
is c
ostl
y (i
nclu
ding
in t
ime)
for b
uild
ing
owne
rs a
nd te
nant
s to
find
ot
her i
ndiv
idua
ls o
r org
anis
atio
ns to
sha
re t
heir
bui
ldin
g w
ith
Inad
equa
tely
defi
ned
lega
l fra
mew
orks
tha
t go
vern
are
as s
uch
as t
he u
se o
f new
tech
nolo
gies
Unc
lear
rule
s an
d re
gula
tion
s re
late
d to
e.g
. tax
atio
n, c
reat
ing
unce
rtai
nty
for p
arti
es t
hat
wan
t to
eng
age
in s
hari
ng
Poor
ly d
efine
d ta
rget
s an
d ob
ject
ives
whi
ch p
rovi
de e
ithe
r ins
uffici
ent
or s
kew
ed d
irec
tion
to in
dust
ryN
/A
Impl
emen
tati
on a
nd e
nfor
cem
ent
failu
res
lead
ing
to t
he eff
ects
of r
egul
atio
ns b
eing
dilu
ted
or a
lter
edN
/A
Uni
nten
ded
cons
eque
nces
of e
xist
ing
regu
lati
ons
that
ham
per c
ircu
lar p
ract
ices
Con
trac
tual
rest
rict
ions
exi
st o
n te
nant
s su
b-le
ttin
g th
eir h
ouse
s or
fl
ats
for l
ess
than
a y
ear a
nd t
here
is c
once
rn t
hat
com
pani
es s
uch
as
Air
bnb
can
star
t to
tur
n re
side
ntia
l are
as in
to ‘h
otel
are
as’
Cap
abili
ties
and
ski
lls la
ckin
g ei
ther
in-h
ouse
or i
n th
e m
arke
t at
reas
onab
le c
ost
N/A
Cus
tom
and
hab
it: i
ngra
ined
pat
tern
s of
beh
avio
ur b
y co
nsum
ers
and
busi
ness
esTh
ere
is a
n in
here
nt re
sist
ance
to c
hang
e ha
bits
aro
und
hous
ing,
suc
h as
sha
ring
/ren
ting
out
, and
the
re a
re a
lso
deep
ly ro
oted
nor
ms
and
trad
itio
ns a
roun
d th
e us
e of
offi
ces
Cri
tica
l bar
rier
(‘m
ake
or
brea
k’)
Very
impo
rtan
t ba
rrie
r (t
o sc
ale-
up /
acc
eler
a-ti
on o
f lev
er)
ECO
NO
MIC
S
MA
RK
ET
FAIL
UR
ES
REG
ULA
-TO
RY
FAIL
UR
ES
SOC
IAL
FAC
TOR
S
1 A
t m
arke
t p
rice
s ex
clud
ing
the
ful
l pri
cing
of
exte
rnal
itie
s su
ch a
s g
reen
hous
e g
as
emis
sion
s, e
cosy
stem
deg
rad
atio
n an
d r
esou
rce
dep
leti
on
2 In
fras
truc
ture
defi
ned
as
fund
amen
tal p
hysi
cal a
nd o
rgan
izat
iona
l str
uctu
res
and
fa
cilit
ies,
suc
h as
tra
nsp
orta
tion
, com
mun
icat
ion,
wat
er a
nd e
nerg
y su
pp
lies
and
was
te
trea
tmen
t
Impo
rtan
t ba
rrie
r (to
sc
ale-
up /
acc
eler
atio
n of
leve
r)
Lim
ited
or n
o ba
rrie
r
Figu
re 15
: Exa
mpl
e of
bar
rier
ana
lysi
s fo
r opp
ortu
nity
‘sha
ring
and
mul
ti-p
urpo
sing
of b
uild
ings
’ in
Den
mar
k pi
lot

62 • DELIVERING THE CIRCULAR ECONOMY – A TOOLKIT FOR POLICYMAKERS
BARRIERS Publ
ic
com
mun
icat
ion
cam
paig
ns
Publ
ic- p
riva
te
part
ners
hips
Indu
stry
col
labo
-ra
tion
pla
tfor
ms
R&D
pro
gr-
amm
es
Fina
ncia
l sup
port
to
bus
ines
s
Tech
nica
l su
ppor
t to
bu
sine
ss
Publ
ic p
rocu
re-
men
t ru
les
Publ
ic in
vest
-m
ent
in
infr
astr
uctu
re
Gov
ern-
men
t st
rate
gy a
nd
targ
ets
Prod
uct
regu
lati
ons
Was
te re
gu-
lati
ons
Indu
stry
, co
nsum
er,
com
peti
tion
and
tr
ade
regu
lati
ons
Acc
ount
ing,
re
port
ing
fina
ncia
l re
gula
tion
s
VAT
or e
xcis
e du
ty re
duct
ions
Not profitable1
Capital
Technology
Externalities
Insufficient public goods / infrastructure2
Insufficient competition / markets
Imperfect information
Split incentives (agency problem)
Transaction costs
Inadequately defined legal frameworks
Poorly defined targets and objectives
Implementation and enforcement failures
Unintended consequences
Capabilities and skills
Custom and habit
1 At market prices excluding the full pricing of externalities such as greenhouse gas emissions, ecosystem degradation and resource depletion 2 Infrastructure defined as fundamental physical and organizational structures and facilities, such as transportation, communication, water and energy supplies and waste treatment
Figure 16: Mapping policy interventions to barriers
High relevance
Medium relevance
Low relevance
Informa-tion & aware-ness
Collaboration platforms
ECON
OM
ICS
MA
RK
ET FAILU
RES
REG
ULATO
RY FA
ILUR
ESSO
CIA
L FA
CTO
RS

DELIVERING THE CIRCULAR ECONOMY – A TOOLKIT FOR POLICYMAKERS • 63
Business support schemes
Public procurement & infrastructure
Regulatory frameworks
Fiscal frame-works
BARRIERS Publ
ic
com
mun
icat
ion
cam
paig
ns
Publ
ic- p
riva
te
part
ners
hips
Indu
stry
col
labo
-ra
tion
pla
tfor
ms
R&D
pro
gr-
amm
es
Fina
ncia
l sup
port
to
bus
ines
s
Tech
nica
l su
ppor
t to
bu
sine
ss
Publ
ic p
rocu
re-
men
t ru
les
Publ
ic in
vest
-m
ent
in
infr
astr
uctu
re
Gov
ern-
men
t st
rate
gy a
nd
targ
ets
Prod
uct
regu
lati
ons
Was
te re
gu-
lati
ons
Indu
stry
, co
nsum
er,
com
peti
tion
and
tr
ade
regu
lati
ons
Acc
ount
ing,
re
port
ing
fina
ncia
l re
gula
tion
s
VAT
or e
xcis
e du
ty re
duct
ions
Not profitable1
Capital
Technology
Externalities
Insufficient public goods / infrastructure2
Insufficient competition / markets
Imperfect information
Split incentives (agency problem)
Transaction costs
Inadequately defined legal frameworks
Poorly defined targets and objectives
Implementation and enforcement failures
Unintended consequences
Capabilities and skills
Custom and habit

64 • DELIVERING THE CIRCULAR ECONOMY – A TOOLKIT FOR POLICYMAKERS
Economic
• Not profitable for businesses even if other barriers are overcome.
• Capital intensive and/or uncertain payback times.
• Technology not yet available at scale.
Market failures
• Externalities (full costs to society) not fully reflected in market prices.
• Insufficient public goods/infrastructure64 provided by the market or the state.
• Insufficient competition/markets leading to lower quantity and higher prices than is socially desirable.
• Imperfect information that negatively affects quality of market decisions, such as asymmetric information.
• Split incentives (agency problem) when two parties to a transaction have dif-ferent goals.
• Transaction costs such as the costs of finding and bargaining with customers or suppliers.
Regulatory failures
• Inadequately defined legal frameworks that govern areas such as the use of new technologies.
• Poorly defined targets and objectives which provide either insufficient or skewed direction to industry.
• Implementation and enforcement failures leading to the effects of regulations being diluted or altered.
• Unintended consequences of existing regulations that hamper circular practic-es.
Social factors
• Capabilities and skills lacking either in-house or in the market at reasonable cost.
• Custom and habit: ingrained patterns of behaviour displayed by consumers and businesses.
Though many of these barriers can be attributed to individual opportunities, some can apply across opportunities in one sector or even across several sectors. An example of such a cross-cutting barrier is unpriced negative externalities, e.g. carbon emissions, that applies to most circular economy opportunities regardless of sector – albeit to a different extent. The regulatory failure of inadequately defined targets also applies across the economy, which is measured primarily by flow metrics such as GDP without taking into account, for example, stocks of natural capital.
Making an assessment such as that illustrated in Figure 15 ideally entails discussions with a wide range of relevant businesses and their representative associations, along with think tanks and academics. Each business will perceive the barriers particular to its
64 Infrastructure defined as fundamental physical and organisational structures and facilities, such as transpor-tation, communication, water and energy supplies and waste treatment.

DELIVERING THE CIRCULAR ECONOMY – A TOOLKIT FOR POLICYMAKERS • 65
line of business, product focus and position in the value chain. To get a rounded picture it is advisable to consult multiple businesses for the focus sector as well as selected businesses along the focus sector’s value chains. Industry associations are also important to consult as they have a higher-level perspective on the general barriers and pressures reported by firms across the sector. Barriers relating to the unintended consequence of existing regulations will likely require the most detailed work – the devil is in the details here.
In undertaking the exercise for Denmark it became clear that while many circular economy opportunities have sound underlying profitability, there are often non-financial barriers limiting further scale-up or holding back their development pace. An overview of the barriers to each of the opportunities in the Denmark pilot is provided in Chapter 3.1.
2.2.5 Map sector-specific policy options
Objective: Lay out all relevant available policy options to address the barriers identified in Section 2.2.4.
End product: List of policy options for each barrier to each opportunity.
Once the barriers have been identified for each circular economy opportunity, policymakers can systematically map policy options to overcome them. The sector-specific policy options that are the focus of this Section can be complemented by economy-wide interventions (discussed in Section 2.3.2). Mapping policy options is just a first step and needs to be followed by cost-benefit analysis and prioritisation, packaging and sequencing (detailed in Section 2.3.3), and building the necessary political consensus and momentum for change.
Six types of policy can be useful to enable the circular economy. An overview of these types, with examples of each, is shown in Figure 7. Figure 16 gives a broad, illustrative indication of how these policy interventions could address the barriers – though variations will exist depending on regional and sector specifics.
A first source of inspiration for mapping sector-specific policy options can be found in existing reports about circular economy policy, such as those listed in Table 2 in Part 1, or the policy options listed for the different opportunities for Denmark in Part 3 of this report. Interviewing policymakers who have already implemented circular economy policy in other countries would also be a valuable exercise at this stage, as would another round of interviews with industry stakeholders to gauge their perspective on different policy approaches for specific opportunities. Inspiration could also come from experience in other policy areas: for instance the innovative public-sector-supported financing mechanisms applied to overcome the split incentives barrier to increasing energy efficiency might be applicable. The application of behavioural economics techniques could be useful in taking an experimental, iterative route to finding the right interventions.
While national policymakers have a broad set of policy instruments at their disposal, some interventions require international coordination, especially in a European context. The regional and municipal level can also play an important role. Figure 17 gives an example indication for the Denmark pilot of how the relevance of the six policy intervention types is broadly distributed among the different government levels.

66 • DELIVERING THE CIRCULAR ECONOMY – A TOOLKIT FOR POLICYMAKERS
Figure 17: Policy intervention relevance by level of government in Denmark
High relevance
Medium relevance
Low relevance
LEVEL OF GOVERNMENT
POLICY INTERVENTION TYPES Municipal Regional National European
Information and awareness
Collaboration platforms
Business support schemes
Public procurement and infrastructure
Regulatory frameworks
Fiscal frameworks
DESCRIPTION OF POLICY INTERVENTION TYPESInformation and awarenessSince the concept of the circular economy is still not widely known among the public or in the business community, policy interventions aimed at increasing information and awareness play an important role. These policies aim to change ingrained patterns of behaviour and ways of thinking that companies and individuals have developed over long periods of time. They also seek to plug gaps in information that prevent or restrict circular economy opportunities.
A related barrier is that of imperfect information. Since the circular economy requires business to cooperate across traditional sectoral and functional silos, an understanding of the economic potential and the practicalities is important, and often lacking. An example of targeted information delivery by the public sector is Denmark’s Esbjerg municipality where officials inform farmers about agricultural plastics waste during farm inspections as part of the municipal waste management plan.65 Information and awareness campaigns can be broadcast to the general public, for example the food waste prevention campaign in Catalonia, or provided to consumers through product labelling: South Korea’s Eco-label indicates not only the emissions of pollutants associated with the product, but also the conservation of resources through the product’s life cycle relative to other products of the same category.66
Collaboration platformsWhen pursuing circular economy opportunities, businesses incur transaction costs finding, and interacting with, suitable collaboration partners along and across value chains. Similarly, circular economy opportunities can be held back by a lack of commercially viable technology. In both cases there is a case for policy support to facilitate partnerships either between businesses or across business and academia. Collaboration platforms can take various forms, including industrial symbiosis, public-
65 Nordic Council, Economic Policy Instruments for Plastic Waste (2014).
66 Korea Environmental Industry and Technology Institute (KEITI), Policy Handbook for Sustainable Consump-tion and Production of Korea (2014).
DELIVERING THE CIRCULAR ECONOMY – A TOOLKIT FOR POLICYMAKERS • 67
private agreements, R&D clusters and voluntary industry initiatives.
Companies that look for collaboration partners for circular business ventures, but are challenged by a lack of information or find the transaction costs involved high, can benefit from industry collaboration platforms. These include industrial symbiosis programmes, examples of which include the Green Industrial Symbiosis programme in Denmark, the UK’s National Industrial Symbiosis Programme,67 the Western Cape Industrial Symbiosis Programme (WISP) in South Africa68 and eco-industrial parks in China.69 Similar platforms include the Textiles Recycling Valley initiative in Northern France, where the local government is directly fostering collaboration around textiles flows in four clusters to develop innovation in recycled textiles. Cooperation can be centred on an association or an institution with government involvement, for example the Chinese Circular Economy Association (CCEA) and the Circular Economy Institute in France. Voluntary industry initiatives can work where a circular economy opportunity requires change along the value chain: the Australian Packaging Covenant (APC) is an agreement between government, industry and community groups to improve packaging sustainability; and EcoProFabrics is a joint project, part-funded by the EU Eco-Innovation Initiative, of six companies in the Netherlands that closes a clothing production loop.70
When the barrier to the viability of a circular economy opportunity is a lack of cost-effective technology, R&D collaboration can be effective. Rethink Resources71 is an innovation centre in Denmark for resource-efficient production and product design. It is a partnership between universities, technology centres, manufacturing companies and the Danish Ministry of Environment and aims to support resource efficiency in companies. It provides new knowledge about product design, manufacturing processes, closed-loop, life-extension and new business models. The German government has provided funding to foster a leading-edge cluster for lignocellulose bio-refining, and the UK government is funding research clubs on integrated bio-refineries and bio-based processing.72 In Scotland there is a public-private partnership arrangement funding the Institute for Remanufacture at Strathclyde University (see Box 2).
Box 2: Policy case example – The Scottish Institute for Remanufacture
‘As an SME business, we need to keep up with innovation in the design and manufacture of transmissions and the technologies involved in their assessment and repair. The creation of the Scottish Institute for Remanufacture will enable us to utilise the sizeable expertise in academic institutions to address issues and to network with other remanufacturers to share information and transfer best practice.’ - John Mackie, Managing Director, Mackie Automatic & Manual Transmissions
The Scottish Institute for Remanufacture was launched in 2015 to engage in remanufacturing research and private sector collaboration. The institute is hosted by the University of Strathclyde in Glasgow and supported by Heriot-Watt University in Edinburgh. It will receive GBP 1.3 million government funding over three years, GBP 1 million from the Scottish Funding Council and GBP 0.3 million from Zero Waste Scotland. Companies based in Scotland have already pledged GBP 0.8 million of funding or in-kind support for potential research projects for the institute, which it offers to PhD students and researchers on secondment to companies in Scotland through a bidding process. Companies are starting to benefit from their involvement with the institute by meeting other companies to
67 For further details see www.nispnetwork.com
68 For further details see greencape.co.za/what-we-do/projects/wisp/
69 See Europe’s World, China’s policies and instruments for developing the circular economy (15 June 2014).
70 De Groene Zaak, Governments going circular (2015).
71 For further details see rethinkresources.dk
72 German Bioeconomy Council, Bioeconomy Policy: Synopsis and Analysis of Strategies in the G7 (2012).

68 • DELIVERING THE CIRCULAR ECONOMY – A TOOLKIT FOR POLICYMAKERS
learn from and collaborate with. The centre has identified 60 companies active in remanufacture and continues to find others, including those not yet active but interested in the potential.
The idea for the institute stemmed from the Scottish Government’s consultation process on ‘Safeguarding Scotland’s Resources – Blueprint for a More Resource Efficient and Circular Economy’; which also meets its Waste Prevention obligations under the EU Waste Framework Directive. Strathclyde University identified the need for increased capabilities and skills in industry regarding remanufacturing, an issue which could be addressed by a centre of expertise on the subject, and approached the Scottish Government with a proposal. A benefit of the discussions involved in setting up the institute was to uncover potential barriers to remanufacturing, which the institute can help address, including the lack of clear standards to distinguish true remanufactured products from those that have been refurbished or repaired; the difficulty that third-party remanufacturers experience when trying to access technical information from original equipment manufacturers; and the need for more R&D in the sector.
Remanufacturing is now part of Scotland’s Economy Strategy published in 2015.73
Business support schemesIn seeking out circular economy opportunities, companies can face economic barriers such as lack of access to technology, capital and in some cases challenges to profitability, and market failures such as insufficient competition, split incentives and transaction costs. Policy interventions in this area can take the form of financial support, such as grants and subsidies, and capital injections and financial guarantees, but also importantly technical support, advice, training, demonstration of best practices and development of new business models. A particular focus of these support schemes will likely be SMEs, which can lack the internal capacity, capabilities and financial resources to take advantage of these new opportunities.
Examples on the ground are often instruments that offer a mixture of both financial and non-financial support. Denmark’s Fund for Green Business Development is an example that provides grants, advice, support for partnerships and pilot projects, and an acceleration programme for new green business models.74 In South Korea the ‘Green Up’ offers environmental management consultations with SMEs aimed at enhancing competitiveness, reducing resource costs and improving environmental performance; and the Eco-Design programme provides technical and financial assistance to SMEs commercialising eco-innovation initiatives for their products and services.75 REBus, an EU Life+ funded collaborative project in the UK and Netherlands, provides technical expertise to businesses to develop resource-efficient business models in textiles and electricals (in the UK the focus is on building the financial case for a transition to a circular business model; in the Netherlands it is through public procurement).76 Finally, an example of tailored, on-demand business support around circular economy opportunities is the Green Deal in The Netherlands (see Box 3).
Box 3: Policy case example – Dutch Green Deal
‘These initiatives are driven by those who say they want to do something and as a government we try to support it’ - Kees Veerman, Ministry for Infrastructure and the Environment
73 The Scottish Government, Scotland’s Economic Strategy (2015).
74 For further details see groenomstilling.erhvervsstyrelsen.dk/greenbusinessfund
75 Korea Environmental Industry and Technology Institute (KEITI), Policy Handbook for Sustainable Consump-tion and Production of Korea (2014).
76 See www.rebus.eu.com
DELIVERING THE CIRCULAR ECONOMY – A TOOLKIT FOR POLICYMAKERS • 69
The Green Deal programme was launched in October 2011 by the Netherlands Ministry of Economic Affairs with the joint aims of saving energy, materials and water and stimulating economic activity from the ground up. It gives a different role to government — providing a responsive service to organisations that ask for help to realise (circular economy) opportunities that align with those aims and that face implementation barriers.
Process and governance
The applicant outlines their (circular economy business) idea, the barriers that stand in its way and potential solutions to them. The proposed initiative must be in line with the mentioned aims, profitable or have the potential to become profitable, be able to demonstrate results preferably within three years, should lead to new economic activity or generate costs savings for business and individuals. Once the government selects an idea it enters into a voluntary agreement (Green Deal) with the initiating organisations to work with them for two to three years. Barriers can include lack of clarity on obtaining relevant permits or navigating applicable regulations or problems finding business partners. The government can take action by sharing knowledge on relevant legislation; modifying legislation; providing access to relevant networks; or supporting the market for a new product or service. No specific financial incentives are provided; rather the government can point out existing relevant subsidy schemes. The Green Deal Board is responsible for monitoring and evaluating progress and results of the Green Deals in place and stimulating new initiatives. Its nine members are drawn from business, non-governmental organisations (NGOs), and government. By June 2015, more than 160 Green Deals have been concluded.
Policymaker experience
Policymakers involved in the development and execution of the Green Deal programme report a surprising level of appetite to sign deals both on the part of the companies that drive the process and also from the government. They also note that one of the unexpected benefits of the programme has been to give companies certainty about their business model, in having been selected by the government as being promising and received guaranteed support for two to three years. Companies have reported finding beneficial the simple act of opening up a line of communication with the government, and with other companies.
The government for its part has become comfortable with the evolutionary approach of reviewing each deal after two to three years and stopping those that are not running as successfully as hoped. It has also found that the help needed by companies is often not financial and also not in the area of fixing the unexpected consequences of existing regulations. When discussions go deeper it becomes clear that even if a regulatory hurdle has already been knocked down, the perception that it still stands remains in people’s minds for a long time; therefore simply clarifying relevant legislation is useful.
Successful example project – Dutch Phosphate Value Chain Agreement
In 2011, the government brought together 20 water, chemical and food industry and agricultural stakeholders through the ‘Nutrient Platform’ to sign the ‘Phosphate Value Chain Agreement’. This was a Green Deal that aimed to turn the Netherlands into a net exporter of secondary phosphate. The Ministry of Infrastructure and Environment appointed a full-time value-chain director as director of the network for two years to work closely with the Nutrient Platform to execute the agreement.
The deal brought together stakeholders in the value chain that do not normally work together and generated trust even when certain parties stood to benefit more than others. The government set new rules for the use of recovered phosphates as fertiliser in the Netherlands, to overcome the barrier of legislation

70 • DELIVERING THE CIRCULAR ECONOMY – A TOOLKIT FOR POLICYMAKERS
hindering the use of recovered materials, in particular if they contain heavy metals or other pollutants. The Nutrient Platform also involved the financial sector to make a closer connection between innovative companies and financial institutions to accelerate sustainable secondary phosphate innovations being brought to market. This action was needed to overcome the barrier of high price volatility in the secondary phosphate market discouraging investment.77 No government incentives such as subsidies needed to be offered.
Public procurement and infrastructure When businesses face the barrier of entrenched customs and habits or a lack of markets for a circular economy opportunity, the public sector can step in to provide purchasing power. A circular public procurement approach is achieved when public organisations meet their needs for goods and services in a way that achieves value for money throughout the life cycle, for the organisation and for wider society, while minimising materials losses and environmental impacts. To this end circular economy standards can be incorporated into procurement law or guidelines, lists of preferred suppliers or materials can be drawn up, and capabilities and skills in concepts such as total cost of ownership (TCO) and measures of material circularity can be built in procuring departments. Examples include Denmark’s Government Strategy on Intelligent Public Procurement, which contains initiatives to support circular procurement practices and puts in place dissemination activities and partnerships on green public procurement.78 In Flanders the government has created a market for high-quality recycled aggregates through their own procurement.79 Box 4 shows how the US has integrated circular economy thinking into several levels of its public procurement policy.
If the barrier holding back circular business practices is insufficient public infrastructure – such as waste collection systems and treatment facilities – public sector budgets can provide investment that enables private sector circular economy activity and potentially investment. An example is the South Korean government’s construction of secondary infrastructure in order to boost car sharing as part of the Seoul Sharing City programme. Governments can also help by opening up access to the sharing of their own assets such as buildings and vehicles on platforms to be used by individuals or organisations such as in Flanders where the government is considering expanding a programme to share with the public its cars when they are not in use, for example at weekends.80
Box 4: Policy case example – Circular public procurement in the US
Federal level
The US EPA (Environmental Protection Agency) implemented its Comprehensive Procurement Guidelines (CPG) programme in 1995. It designates products that are or can be made with recovered materials, and recommends practices for procuring them. Once a product is designated, state and federal procuring agencies are required to purchase it with the highest recovered material content level practicable. In 2004, the EPA designated seven additional products, including remanufactured vehicular parts.81
Covering the repair and maintenance of vehicles, the ‘Federal Vehicle Repair Cost Savings Act’, introduced in the House in February 2015 and now on the Senate legislative calendar, aims to reduce the bill for repair and maintenance of government vehicles, which approaches USD 1 billion a year. If it passes it
77 For example, the price of phosphate rock rose from USD 50 to USD 450 in 2007/2008 as a result of supply issues in China and then fell to USD 100 in late 2009.
78 See www.ellenmacarthurfoundation.org/case_studies/public-procurement-in-denmark
79 De Groene Zaak, Governments going circular (2015).
80 See www.flanderstoday.eu/politics/government-flanders-looks-car-sharing-public
81 See www.epa.gov/epawaste/conserve/tools/cpg/index.htm

DELIVERING THE CIRCULAR ECONOMY – A TOOLKIT FOR POLICYMAKERS • 71
would require the head of each federal agency to encourage the purchase of remanufactured vehicle components, such as engines, transmissions, alternators, and starters, if they reduce the cost of vehicle maintenance while not lowering its quality.82
State level
In 1998 New York State passed a remanufacturing law mandating that purchase requests from the commissioner and state agencies for durable equipment consider remanufactured goods first. The law also provides that ‘products purchased by the commissioner or other state agencies shall be recycled or remanufactured products ... provided the cost ... does not exceed a cost premium of 10%’. The law also prohibits state agencies from purchasing commodities from OEMs that place restrictions on remanufacturing. Texas, Connecticut and California have subsequently passed similar laws.83
Regulatory frameworks
Regulatory policy interventions can address barriers of several types, including profitability and split incentives, and are of course critical to address regulatory failures. In cases where circular economy activity is hampered by the unintended consequences of existing regulations, it can be helpful to form a taskforce on circular economy or resource efficiency. Examples include Denmark’s Taskforce on Resource Efficiency (see Box 5), Finland’s working group on National Material Efficiency Programme84 and the UK’s Circular Economy Task Force.85
Where the barrier is that of inadequately defined legal frameworks, new or adapted product, waste, industry, consumer, competition and trade regulations may be needed. These could come in the form of restrictions on, or requirements relating to, existing activities. Examples include New York City’s ban of Styrofoam cups;86 France’s requirements for manufacturers to display on product labels for how long spare parts will be available and to offer free repair or replacement for the first two years after purchase;87 California’s amendments to its rigid plastic packaging container regulations to more effectively require plastic resin manufacturers to use at least 25% of recycled resins in their products;88 and France’s proposal to ban large supermarkets from throwing away unsold food, instead either donating it to charity or sending it for composting or for use as animal feed.89
Such interventions can equally come in the form of lifting existing restrictions or setting a positive legal framework for circular economy activities. Examples include Japan’s policy to give food waste to pigs under highly sanitary conditions; Nevada’s legislation to permit the licensing and operation of autonomous vehicles;90 the US’s Good Samaritan Law that limits the liability of food companies and retailers for products they donate to charities; and the Basel Convention’s new guidelines that could also allow countries to classify products and parts as destined for reuse or extended use, or for repair and refurbishment, to exempt them from the convention’s requirements on the export of hazardous waste. 91
82 US Congress, S.565 - Federal Vehicle Repair Cost Savings Act of 2015.
83 EEF, Materials for Manufacturing: Safeguarding Supply (2014).
84 Finnish Ministry of Employment and the Economy, Working group proposal for a National material efficiency programme, (2014).
85 See www.green-alliance.org.uk/CETF.php
86 Scientific American, NYC Bans Expanded Polystyrene Food Containers, Opens Market to Alternatives (2015).
87 Fast Company, This New French Law Is Designed To Make Products Easier To Repair, So They Stay Out Of The Trash (March 2015).
88 See www.calrecycle.ca.gov/laws/regulations/title14/ch4a3a.htm
89 Süddeutsche Zeitung, Supermärkte müssen nicht verkaufte Lebensmittel spenden (22 May 2015).
90 See www.dmvnv.com/autonomous.htm
91 Basel Convention of the United Nations Environment Programme on the Control of Transboundary Move-ments of Hazardous Wastes and their Disposal.

72 • DELIVERING THE CIRCULAR ECONOMY – A TOOLKIT FOR POLICYMAKERS
Box 5: Policy case example – Danish Taskforce for Resource Efficiency
‘The Taskforce will identify regulatory barriers and underlying conflicting interests that prevent businesses from utilising their input of materials and water more efficiently. The work of the Taskforce is an iterative process that alternates between business studies, other analysis, and development of solutions in dialogue with companies and relevant authorities.’ – Anders Hoffmann, Danish Business Authority
The Danish Taskforce for Resource Efficiency was set up with aim of increasing the competitiveness of the Danish economy and was part of the national growth strategy of the Danish Government, published by the Ministry of Finance in 2014. Its aim is to review existing regulations affecting resource productivity and circular economy practices, identify barriers and work to find solutions. It will use explorative studies of the experiences and daily work of companies to understand how barriers appear and affect the behaviour of the companies, covering the rules themselves, how they are administered and the help businesses receive to navigate them. In 2015 the taskforce will identify barriers blocking potential increases in resource efficiency. In its second and third years (2016–2017) it will establish solution teams for each selected barrier to find the most effective way to overcome them.
Though in its early stages of work, the taskforce has made some preliminary findings of potential regulatory barriers reported from companies, consultants and business associations in Denmark and abroad. However it should be stressed that the full mapping and analysis of barriers will be undertaken during the rest of 2015 and these are only initial leads on where the focus might lie:
• Import/export of waste: high barriers to start trading secondary raw materials
• Take-back of products: regulation is onerous when more than one product is collected
• Definition of waste: identical products can be subject to two different regulations if one is made from virgin materials and the other is made from recycled materials
• Product design: eco-design regulations do not sufficiently address resource efficiency and circular economy ambitions
Fiscal frameworksThe main barriers to circular economy opportunities that fiscal instruments could address are those of profitability for companies and unpriced externalities. Similar to regulations, fiscal instruments can be applied either to discourage non-circular activities on the one hand or explicitly support circular economy opportunities on the other. An example of a fiscal instrument applied to a product difficult to incorporate into a circular system is Ireland’s levy on disposable plastic carrier bags.92 Examples of pricing more fully the negative externalities of waste (management) through fiscal interventions are Denmark’s high and incrementally increasing taxes on landfilled or incinerated waste and Finland’s levy and deposit system on disposable drink containers. Examples of tax breaks for circular economy products and processes include New York’s tax credit in favour of remanufacturing firms and China’s reduced or eliminated VAT on goods produced from recycled materials.93
92 See www.environ.ie/en/Environment/Waste/PlasticBags/
93 See www.china-briefing.com/news/2011/11/28/china-expands-tax-incentives-to-promote-circular-economy.html

DELIVERING THE CIRCULAR ECONOMY – A TOOLKIT FOR POLICYMAKERS • 73
2.3 Analyse economy-wide implicationsOnce the sector-specific circular economy opportunities have been assessed, they can all be put together and the national implications analysed. This step will typically be driven by a core group of policymakers, policy and economics experts and with the participation of multiple government agencies. The sector-specific impact assessments could be put together in one overarching whole-economy impact assessment to support the mandate for policy intervention (Section 2.3.1). Sector-specific policy options could be complemented by economy-wide policy options (Section 2.3.2). The set of sector-specific and economy-wide policy options needs to be prioritised and assembled into coherent policy packages (Section 2.3.3).
Demonstrating the economic potential of the circular economy compared to alternative pathways is in many cases required in order to advance the circular economy. Assessing the direct economic impacts within the focus sectors, as presented in the previous section, is a fundamental component of that process. However, some stakeholders, such as finance ministries, might also want to appraise the broader economic impacts of such transformations, requiring the use of tools and methodologies that can quantify the potential macroeconomic, economy-wide impacts of delivering the circular economy opportunities.
Once the economic and broader societal rationale for policy intervention has been developed, and a set of potential policy options has been identified in each of the focus sectors, policymakers might reflect on complementing these with economy-wide policy options. They can conduct a structured cost-benefit assessment process to prioritise the different policy options and put these together in structured policy packages, including the development of provisions to address any important distributional consequences that could otherwise hinder societal acceptance of the overall policy change.
This step will typically be driven by a core group of policymakers, policy and economics experts and with the participation of multiple government agencies. The project team needs to have at its disposal strong macroeconomic modelling skills (if a macroeconomic modelling effort as laid out in Section 2.3.1 is performed) and policy analysis expertise. In the Denmark pilot, in total, around ten man-months were dedicated to this step.
2.3.1 Quantify economy-wide impact
Objective: Support the case for economy-wide and broad sectoral policy interventions.
End product: Estimate of expected impact of circular economy opportunities on national macroeconomic indicators such as GDP, employment, net exports, and carbon emissions.
There is – to the best of our knowledge – no methodological approach available that fully captures the impact of transitioning towards the circular economy. The main underlying issue is that current economic models are built relying heavily (although not necessarily exclusively) on historic correlations (in a linear economy) between different sectors. This approach has inherent limitations when modelling the circular economy with – by nature – very different relationships between sectors.
There are however several ‘standard’ approaches available to quantify macroeconomic impact. Among these, while there is no ‘one size fits all’ approach, computable general equilibrium (CGE) models might be a good choice as they have multiple desirable attributes. The diversity and specificity of circular economy opportunities means that hybrid CGE approaches – which combine the strengths of high granularity sector-specific impact modelling with the aggregated economy-wide impact assessment capability of a CGE framework – are among the best suited, existing impact modelling approaches for this task.

74 • DELIVERING THE CIRCULAR ECONOMY – A TOOLKIT FOR POLICYMAKERS
APPROACHES FOR MODELLING ECONOMY-WIDE IMPACTS OF THE CIRCULAR ECONOMY
Multiple methodological options are available to quantify the economy-wide impact of a circular economy transition, each with its own advantages and limitations. Of course, any approach needs to follow applicable impact assessment guidelines and requirements.94 The choice of the most appropriate economy-wide modelling approach will depend, among other things, on the desired attributes of the economic model and the availability of resources. Figure 18 below presents a high-level description and comparison of some of the most widely used methodological approaches for economic impact quantification.
Computable general equilibrium (CGE) models are among the most widely used types of models for assessing economy-wide impacts of structural changes in the economy and are a strong option to model the expected effects of a transition towards the circular economy. A dynamic CGE model was selected in the Denmark pilot study, and the rationale for selecting a CGE framework might be applicable to other policymakers looking to conduct economy-wide impact assessments of the circular economy.
Whether it is with CGEs or other modelling approaches, economic impact assessment of the circular economy is in its early stages and, as will be discussed later in this section, multiple areas for methodological development remain.
‘HYBRID’ CGE APPROACHES FOR MODELLING CIRCULAR ECONOMY IMPACT
To assess the economy-wide impact of greater circularity in certain economic sectors as accurately as possible, it is necessary to simultaneously model a large number of products, technologies, and/or sectoral detail, as well as their interaction with the broader economy. For such cases, ‘hybrid’ modelling approaches can be adopted. These approaches combine the detail of product and sector-specific economic impact modelling (e.g. the cost savings in the machinery sector as a result of increased remanufacturing), with the aggregated, inter-sectoral features of an economy-wide modelling framework (e.g. to assess the effects of greater productivity in the machinery sector on growth and employment in the broader economy). CGE frameworks are well suited to be used in conjunction with sector-specific models. Such ‘hybrid’ CGEs have been used for impact assessment in many economic sectors and activities including energy, transport or postal services and, recently, resource productivity.95
A hybrid approach was developed and applied in the Denmark pilot, and might be useful in other countries as well. The approach consists of a five-step process, as illustrated in Figure 19.
1. Identify circular economy opportunities in each focus sector: as laid out in Sections 2.2.1 and 2.2.2.
2. Perform ‘bottom-up’ sector-specific impact quantification: as laid out in Section 2.2.3. Define the ‘business as usual’ or reference scenario, as well as the circularity scenarios and sensitivities.
3. Conversion and scaling: this is a crucial ‘interface’ between sector-specific impact quantification and economy-wide CGE. Departing from a reference input-output (I/O) table, distribute sector-specific revenue and cost impacts over the relevant supplying and consuming sectors. The end product of this step is a ‘delta’ (meaning change from the baseline) input-output (I/O) table that is balanced.96 The delta I/O tables are then used as inputs to the CGE model.
4. Implementation in the CGE: The balanced delta I/O tables for the selected
94 See for example European Commission, Impact Assessment Guidelines (2009).
95 A hybrid bottom-up CGE approach was recently used in a European Commission study that quantified the economic impacts of greater resource productivity in the built environment in the EU. See European Commis-sion, Assessment of Scenarios and Options towards a Resource Efficient Europe (2014).
96 A ‘balanced’ I/O table means one where the total changes (i.e. ‘delta’) in inputs or supply in the circularity scenario equal the total demand or output delta.

DELIVERING THE CIRCULAR ECONOMY – A TOOLKIT FOR POLICYMAKERS • 75
PAR
TIA
L EQ
UIL
IBR
IUM
M
OD
ELLI
NG
MA
CR
O-E
CON
OM
ETR
IC
MO
DEL
LIN
G
INPU
T-O
UTP
UT
(SO
CIA
L A
CCO
UN
TIN
G M
ATR
IX)
MO
DEL
LIN
GST
ATIC
AN
D D
YN
AM
IC
CGE
MO
DEL
LIN
GA
GEN
T-BA
SED
M
OD
ELLI
NG
DES
CR
IPTI
ON
OF
MO
DEL
LIN
G A
PPR
OA
CH
Supp
ly-a
nd-d
eman
d m
odel
s re
pres
enti
ng
in h
igh
deta
il a
spec
ific
sect
or, m
arke
t or
gro
ups
of
mar
kets
Stat
isti
cal m
odel
re
pres
enti
ng e
volu
tion
of
a s
ecto
r or g
roup
s of
se
ctor
s ba
sed
on h
isto
rica
l re
lati
onsh
ips
Stat
ic re
pres
enta
tion
of a
ll in
puts
and
out
puts
for a
ll ag
ents
in t
he e
cono
my
Stat
ic o
r dyn
amic
ally
op
tim
ised
repr
esen
tati
on
of e
cono
mic
flow
s ac
ross
all
agen
ts in
the
eco
nom
y
Inte
grat
ed a
nd d
ynam
ic
repr
esen
tati
on o
f dec
isio
n m
akin
g of
all
econ
omic
ag
ents
REP
RES
ENTS
TH
E W
HO
LE
ECO
NO
MY
INC
LUD
ES E
CON
OM
Y-W
IDE
PRIC
E EF
FEC
TS
CAN
SIM
ULA
TE
STR
UC
TURA
L C
HA
NG
E
MO
DEL
ING
AN
D A
NA
LYSI
S CO
MPL
EXIT
YLo
w to
Hig
hM
ediu
m to
Hig
hLo
w to
Med
ium
Med
ium
to H
igh
Med
ium
to H
igh
WH
EN T
O U
SE T
HIS
A
PPR
OA
CH
FO
R C
IRC
ULA
RIT
Y IM
PAC
T A
SSES
SMEN
TS
Whe
n as
sess
men
t is
for
a si
ngle
sec
tor o
r a lo
w
num
ber o
f sec
tors
and
w
hole
eco
nom
y an
d/or
ind
irec
t im
pact
is
not
requ
ired
Whe
n an
eco
nom
y-w
ide
view
is re
quir
ed, w
ith
a fo
cus
on s
hort
-ter
m
fore
cast
ing
(sce
nari
o ch
ange
s ar
e w
ithi
n hi
stor
ical
var
iati
ons)
Whe
n a
quic
k as
sess
men
t of
eco
nom
y-w
ide
impa
ct
is re
quir
ed (e
xclu
ding
ti
me,
pri
ce a
nd a
ssoc
iate
d in
dire
ct eff
ects
)
Whe
n a
com
preh
ensi
ve
asse
ssm
ent
of e
cono
my-
wid
e im
pact
s is
requ
ired
, (i
nclu
ding
tim
e, p
rice
and
as
soci
ated
indi
rect
eff
ects
)
Whe
n an
eco
nom
y-w
ide
view
is re
quir
ed,
and
it is
impo
rtan
t to
ex
plic
itly
mod
el (
irra
tion
al
and
othe
r) b
ehav
iora
l as
pect
s of
age
nts
such
as
cons
umer
s, p
rodu
cers
, and
go
vern
men
ts
APP
LICA
TIO
N IN
R
ECEN
T C
IRC
ULA
R EC
ON
OM
Y/R
ESO
UR
CE
PRO
DU
CTI
VIT
Y IM
PAC
T A
SSES
SMEN
T ST
UD
IES
Empl
oym
ent
and
the
Cir
cula
r Eco
nom
y –
Job
cr
eati
on in
a m
ore
reso
urce
effi
cien
t Br
itai
n (2
015)
Opp
ortu
niti
es fo
r a
circ
ular
eco
nom
y in
the
N
ethe
rlan
ds (
2013
)
Non
e id
enti
fied
The
Cir
cula
r Eco
nom
y an
d Be
nefi
ts fo
r Soc
iety
: Sw
edis
h C
ase
Stud
y (2
015)
Ass
essm
ent
of S
cena
rios
an
d O
ptio
ns to
war
ds a
Re
sour
ce Effi
cien
t Eu
rope
(2
014)
Gro
wth
Wit
hin:
A C
ircu
lar
Econ
omy
Vis
ion
for a
C
ompe
titi
ve E
urop
e (2
015)
Non
e id
enti
fied
SOU
RC
E: N
ER
A E
cono
mic
Con
sult
ing
, Elle
n M
acA
rthu
r Fo
und
atio
n
Figu
re 18
: M
etho
dolo
gica
l op
tion
s fo
r eco
nom
ic
impa
ct a
sses
smen
t m
odel
ling
Sele
cted
for t
he D
enm
ark
pilo
t st
udy
(Dyn
amic
CG
E)

76 • DELIVERING THE CIRCULAR ECONOMY – A TOOLKIT FOR POLICYMAKERS
IDEN
TIFY SEC
TOR
OPPO
RTU
NITIES
QU
AN
TIFY D
IREC
T IMPA
CT
BY SCA
LING
UP FR
OM
PR
OD
UC
TS AN
D SEC
TOR
S
CON
VER
SION
OF
DIR
ECT IM
PAC
TS INTO
CG
E MO
DEL IN
PUT
REPR
ESENTATIO
N O
F C
IRC
ULA
RITY
IN CG
E M
OD
EL
RU
N SC
ENA
RIO
S IN
CGE A
ND
AN
ALYSE
RESU
LTS
12
34
5
FOO
D A
ND
BEV
ERAG
E
CON
STRU
CTIO
N
MA
CH
INERY
Product/sub-sector technical poteantial
Sector economic
potentialD
istribution of direct im
pacts as CGE
model input
Implem
entation of direct im
pacts in CG
E
Economy-w
ide and inter-sectoral im
pacts
Goods and servicesEnergy + Value added
EnergyValue added
Fossil fuels
Materials
δ = 0C
apitalLabour
δ = 0
δ = 0
δ = 0
δ = 0
δ = 0
SOU
RC
E: N
ER
A E
conomic C
onsulting, E
llen MacA
rthur Foundation
AC
TIVITIES
OU
TPUT
Figure 19: Overview
of a ‘hybrid’ CGE approach
GD
P
EMPLO
YM
ENT
CO2
EMISSIO
NS
TOTA
L EFFEC
TS
DELIVERING THE CIRCULAR ECONOMY – A TOOLKIT FOR POLICYMAKERS • 77
circularity scenarios are ‘implemented’ into the CGE model. There are several options to do this and these are discussed in greater detail in Appendix C.
5. Model runs and output: Scenario impacts are compared to the ‘business as usual’ levels to quantify the changes in key macroeconomic indicators such as GDP, employment, industrial output, trade and CO2 emissions.
Hybrid approaches are relatively time and resource intensive processes. Not all policymakers may therefore opt for an economy-wide impact quantification on top of the detailed sector-specific impact quantification.
AREAS FOR FUTURE METHODOLOGICAL DEVELOPMENT
While hybrid CGE models are among the best suited methodological options today, they still have important shortcomings in terms of fully representing the circular economy. As yet, many of the CGE models that have been used to assess structural change, and including the one applied in the Denmark pilot study, are unable to fully represent the economic structure, relationships between agents, materials and economic flows, and other details of the circular economy. CGEs (and other economy-wide impact models) have significant scope for development across several areas including:
• Comprehensive representation of materials and products flows: Many impact assessment models represent energy, emissions, water or any other focus com-modity, but seldom represent together a broad spectrum of materials and prod-ucts flows (e.g. raw commodities; intermediate products; reusable by-products; unusable waste, emissions and effluents; final goods). Explicit and comprehen-sive representation of material and product flows would enable a much more precise quantification of supply, demand, price and externality impacts from the circular economy.
• Representation of new or expanding circularity sectors and economic relations: The representation of such activities is often highly aggregated or lacking alto-gether. These often include emerging or new value-adding activities that will play an increasingly important role in the circular economy. An explicit representation of emerging circularity activities would allow a precise quantification of the size, price impacts, and added-value creation of circularity within the economy. Exam-ples of future developments in this area could include:
o New production methods: the representation of production technologies that can substitute raw or virginal materials with usable waste or by-products from other sectors as production inputs, and technologies that reduce the intensity of materials inputs in production. The alternative potential production inputs will need to be incorporated into the data for the social accounting matrix.
o Expanded natural resource representation: Representation of natural resources as inputs to production is often limited to important depletable resource supplies in current models. To better capture the value of reuse, representation of renewable natural capital stocks and how those stocks are affected over time by alternative production processes may be a valuable future development.
o Product services vs. products: As consumers move towards greater ‘share, use and return’ behaviors, representation of consumer welfare will require more emphasis on consumption of product services than of the products themselves. For example, consumption of transportation services will become more important to represent than numbers of vehicles purchased.
• Representation of investment and finance: in most CGEs, capital is accumulated through savings and investment. Capital stock in any time period is the sum of depreciated capital from the prior period plus new net investment. The inter-

78 • DELIVERING THE CIRCULAR ECONOMY – A TOOLKIT FOR POLICYMAKERS
action of capital accumulation and future capital requirements determines the investment pathway. A more granular representation, allowing for the distinction between old (fixed use) and new (malleable use) capital along with sector-spe-cific depreciation rates would allow for better representation of the cost of tran-sition.
• More comprehensive and integrated representation of flow and stock external-ities: economic impact assessment models are typically used to represent the impact of certain negative flow externalities such as greenhouse gas emissions or other types of harmful effluents; or to represent the impact of consumption of certain materials on their supply and availability. However, impact assessment models seldom have a comprehensive representation of flow and stock externali-ties, nor are they jointly assessed. In order to measure the true economic value of circularity, impact assessment models need to be able to core comprehensively capture flow and stock externalities generated from resource consumption and depletion in an integrated manner, and how the aggregate effect impacts pro-duction and consumption choices.
Interpretation and presentation of resultsFor CGE models, given their complexity, it can be helpful to complement a classical overview of results on key macroeconomic indicators with a description of the direct and indirect effects that underlie them. An example of such a ‘narrative’ of the modelling results from the Denmark pilot study is presented in Figure 20.
Figure 20: Overview of direct and indirect effects in pilot CGE modelling
SECTOR-SPECIFIC QUANTIFICATION
ECONOMY-WIDE QUANTIFICATION
Cost savings and growth in revenue at sector level
Cost savings and growth in revenue at product level
Circular economy opportunities
Total Imports
Total Exports
Households’ income and consumption
Net government tax receipts
Denmark GDP
Denmark job equivalents
Denmark net exports
Global emissions
Denmark energy / emissions intensity
Denmark resource intensity
Labour intensity
Impact in focus sectors
Economy-wide effects (from CGE modelling)
Key macroeconomic impacts (net)
SOURCE: NERA Economic Consulting, Ellen MacArthur Foundation
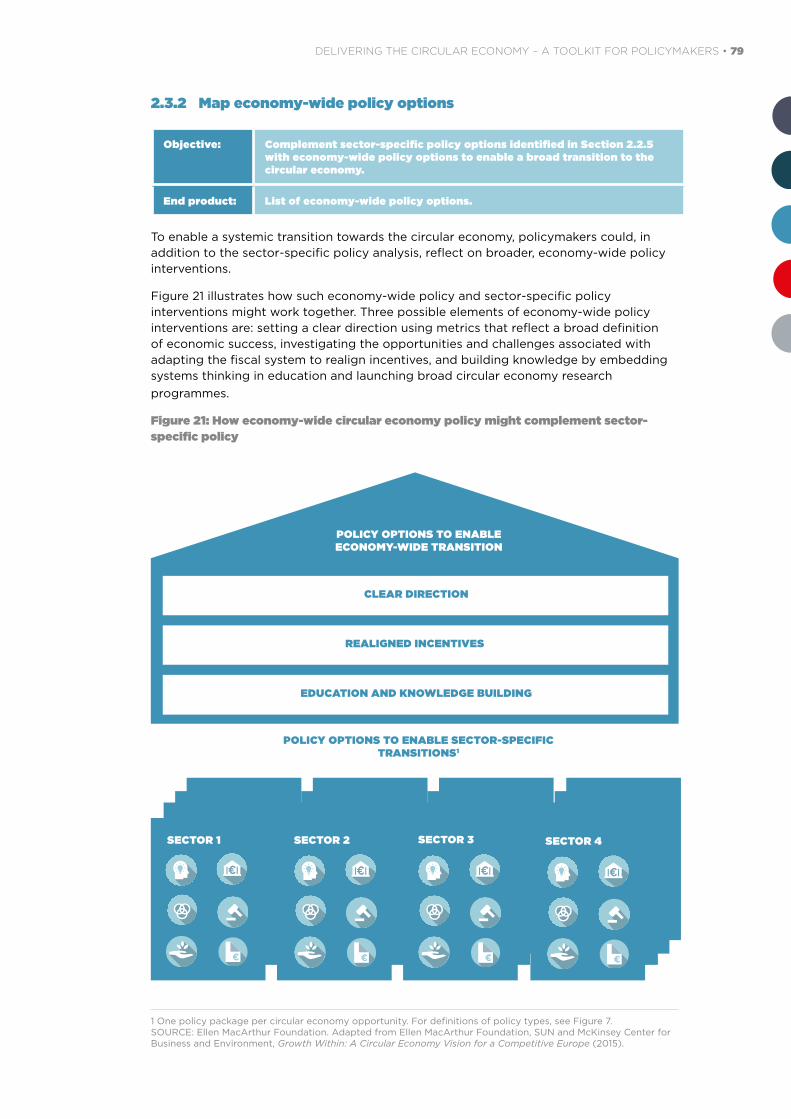
DELIVERING THE CIRCULAR ECONOMY – A TOOLKIT FOR POLICYMAKERS • 79
2.3.2 Map economy-wide policy options
Objective: Complement sector-specific policy options identified in Section 2.2.5 with economy-wide policy options to enable a broad transition to the circular economy.
End product: List of economy-wide policy options.
To enable a systemic transition towards the circular economy, policymakers could, in addition to the sector-specific policy analysis, reflect on broader, economy-wide policy interventions.
Figure 21 illustrates how such economy-wide policy and sector-specific policy interventions might work together. Three possible elements of economy-wide policy interventions are: setting a clear direction using metrics that reflect a broad definition of economic success, investigating the opportunities and challenges associated with adapting the fiscal system to realign incentives, and building knowledge by embedding systems thinking in education and launching broad circular economy research programmes.
Figure 21: How economy-wide circular economy policy might complement sector-specific policy
POLICY OPTIONS TO ENABLE ECONOMY-WIDE TRANSITION
CLEAR DIRECTION
REALIGNED INCENTIVES
EDUCATION AND KNOWLEDGE BUILDING
SECTOR 1 SECTOR 2 SECTOR 3 SECTOR 4
POLICY OPTIONS TO ENABLE SECTOR-SPECIFIC TRANSITIONS1
1 One policy package per circular economy opportunity. For definitions of policy types, see Figure 7. SOURCE: Ellen MacArthur Foundation. Adapted from Ellen MacArthur Foundation, SUN and McKinsey Center for Business and Environment, Growth Within: A Circular Economy Vision for a Competitive Europe (2015).

80 • DELIVERING THE CIRCULAR ECONOMY – A TOOLKIT FOR POLICYMAKERS
Setting clear directionAs set out in Section 2.1.2, adopting a national ambition level using appropriate targets – based on, for example, the three circular economy principles, as described in Section 2.1.2 – might send a powerful signal to businesses and investors. Setting out a clear economy-wide strategy on circular economy and resource productivity might do so as well, and governments have already begun to do so. Existing national circular economy or resource productivity strategies include China’s Circular Economy Promotion Law, Japan’s Law for the Promotion of Effective Utilization of Resources, the UK Resource Security Action Plan: Making the most of valuable materials, Germany’s Resource Efficiency Programme (ProgRess) – see Table 2 for details – and the Netherlands’ Waste to Resource strategy. In Scotland’s Economic Strategy 2015 remanufacturing was identified as a strategically important innovation sector.
Realigned incentivesWhile many circular economy opportunities already have a sound underlying profitability, realigning incentives from resources to labour could potentially unlock further opportunities. Such shifts are sensitive and need to be seen in the light of issues such as international competitiveness, stability of tax revenues, administrative complexity and potential distributional effects. They are, however, an option to explore since there is some evidence that they could bring economic and societal benefits (see below).
A number of international organisations, such as the European Commission, the OECD, the IMF, and the International Labour Organization, have suggested shifting taxation from labour to resources. 97 They propose that such a shift could increase incentives to minimise waste, maximise resource productivity and increase the feasibility of more labour-intensive circular business practices. Ex’Tax has done detailed analysis on the practicalities and implications of such a shift. Its report presents a case study that finds that a (mid- to long-term) tax shift could shift more than EUR 30 billion in tax revenues from labour to resources and consumption in the Netherlands alone and, if internationally coordinated, could potentially create hundreds of thousands of jobs98. As, in Europe, 6% of total tax revenues originate from environmental taxes (including taxes levied on energy, transport, pollution and resource extraction), and 51% from labour taxes and social contributions99, there might be – at least in theory – significant scope to shift taxes from labour to resources.
The IEA, the World Bank and the IMF, among others, have studied fossil fuel subsidies and their economic and environmental implications100. An IMF working paper from May 2015101 estimates global fossil fuel subsidies in 2014 to have been USD 5.6 trillion (7% of global GDP). The report states that “[eliminating] post-tax subsidies in 2015 could raise government revenue by USD 2.9 trillion (3.6% of global GDP), cut global CO2 emissions by more than 20%, and cut premature air pollution deaths by more than half. After allowing for the higher energy costs faced by consumers, this action would raise global economic welfare by USD 1.8 trillion (2.2% of global GDP).”
There are however significant concerns about shifting taxation, most notably about distributional effects, the volatility of the tax base after the transformation and the potential for weakened competitiveness of primary materials and heavy industry. Policymakers that are considering tax shifts would need to investigate avenues to alleviate such concerns, which might include but are not limited to: mitigating distributional effects by increasing personal tax-free allowances and providing compensatory subsidies to those on fixed incomes and/or outside the labour market. To implement such a shift, policymakers would have to find widespread consensus on what
97 Stahel, W. R., Palgrave Macmillan, The Performance Economy (2006).
98 The Ex’Tax Project, in cooperation with Deloitte, EY, KPMG Meijburg and PwC, New Era. New Plan: Fiscal reforms for an inclusive, circular economy (2014).
99 Eurostat, Taxation Trends in the EU (2014).
100 See for example www.worldbank.org/en/news/feature/2012/05/09/real-costs-fossil-fuel-subsidies and www.worldenergyoutlook.org/resources/energysubsidies/
101 IMF Working Paper, How Large Are Global Energy Subsidies (2014).

DELIVERING THE CIRCULAR ECONOMY – A TOOLKIT FOR POLICYMAKERS • 81
would be a fundamental change in the approach to taxation among citizens, political parties, employers, unions and industry, and would need to address the significant concerns mentioned above.
Finally, bringing transparency on full costs, and enabling asset managers and corporate executives to maximise long-term value could also help realign incentives. Accounting and reporting standards could bring transparency on externalities. Rethinking the fiduciary duty of asset managers and corporate executives might enable them to maximise long-term value creation for all stakeholders over short-term shareholder value. In the US, and increasingly in other countries, companies can establish themselves as so-called B-Corps and in doing so specify that they ‘give legal protection to directors and officers to consider the interests of all stakeholders, not just shareholders, when making decisions’.102 Some of these changes – such as changes to international accounting standards regarding natural capital and resources – would need broad international agreement. Others might be introduced by national governments.
Education and knowledge building
While the circular economy can have broad appeal as a value creation opportunity, knowledge of what the circular model would mean for companies, industries, cities, and countries in the short and medium term is still relatively limited. This knowledge might be helpful to making policy and business decisions. Also important are potential changes to the way the education system teaches children and students, and engages in academic research. This would involve re-imagining curricula and ways of teaching, and conducting research across traditional subject silos to develop new technologies and business practices that work at the systems level. Action areas could include:
• Education curricula could inspire new generations of creative problem solv-ers used to thinking in systems and well-versed in the principles of the circular economy. At primary and secondary level this could be achieved by re-imagining curricula, breaking down subject silos and changing the manner of teaching to emphasise systems thinking and creative education. Students at all levels, school and university, could develop agility between the micro and the macro, i.e. be able to apply content knowledge at a systems level. The education system could respond to the pull demand from circular economy businesses for systems think-ing school leavers and graduates. An early example of transformation in both the curriculum and manner of teaching is the International Baccalaureate, which of-fers to 3-19 year olds programmes of interdisciplinary learning – from several ed-ucational frameworks and curricula – that encourage critical thinking, intercultur-al understanding and environmental awareness. A few examples of the changing landscape at higher education are Bradford University’s circular economy MBA, Cranfield University’s inter-disciplinary MSc on circular economy, and Stanford University’s electives in circular economy in its engineering faculty. Professional training programmes on the circular economy could ensure continued learning throughout a professional career. The extent to which national policymakers can influence these different aspects of education differs by country.
• Academic research on for example materials, bio-sciences, economics and policy could be important to generate the fundamental scientific knowledge on which to build circular economic practices. Applying the science is of course critical. Rochester University’s Golisano Institute for Sustainability, a centre of excellence in remanufacturing, engages in applied research with industry, as does the newly formed Scottish Institute of Remanufacturing at Strathclyde University (see Box 2 in section 2.2.5). University College London’s research lab in its De-sign Centre demonstrates examples of circular design, and the RECODE project at Cranfield University explores the ‘internet of things’ and asset tracking. Anoth-er strand of research is on circular economics, where many crucial topics about how circularity would change the way the economy works, for example trade patterns, resource flows, employment, GDP generation, and sector composition,
102 B Lab. www.bcorporation.net

82 • DELIVERING THE CIRCULAR ECONOMY – A TOOLKIT FOR POLICYMAKERS
could be further investigated. Academics might develop ways to model and mea-sure the circular economy and perspectives on the competitive implications and transition challenges facing different sectors.
• Sector working groups could be set up to locate circular opportunities for businesses and consumers. Industry associations could contribute greatly by in-vestigating profitable opportunities and sharing knowledge of circular business models in their industry. They could also explore opportunities to collaborate on things like material specifications and recycling systems to improve volume, qual-ity and cost in secondary resource markets. Government might play a facilitating role.
2.3.3 Prioritise, package and sequence policy options
Objective: Prioritise the sector-specific policy options identified in Section 2.2.5; bring them together as required in coherent policy packages; and sequence over time the potential implementation of these policy packages as well as the economy-wide policy options identified in Section 2.3.2
End product: A set of policy packages (typically one per circular economy opportunity); an implementation roadmap for both potential sector-specific policy packages and economy-wide policy options
The outcome a policymaker can expect by working through the steps of this toolkit is a set of potential policy options to address the barriers in the identified sector-specific circular economy opportunities, as well as a set of potential economy-wide policy options. This section aims to provide overarching thoughts on next steps regarding prioritisation, packaging and sequencing of policy options. It does not attempt to provide a detailed overview, as these next steps are already laid out in other publications such as, for example, the European Commission’s impact assessment guidelines.103
Prioritising An initial mapping of policy interventions to barriers (see Section 2.2.5) can result in a large number of policy options. It can be useful as a first step to apply a high-level policy impact and cost assessment. Other factors such as time to implementation, time to achieve outcome, and distributional effects can also be taken into account. Such a high-level qualitative prioritisation can provide input for the subsequent due diligence and impact assessment/cost-benefit analysis in the policymaking process.
An example of such a prioritisation exercise for the ‘Value capture in cascading bio-refineries’ opportunity in the Danish pilot is found in Figure 22. Such a matrix can be the result of an analytical exercise or can be made more directly based on expert input. To structure this initial prioritisation, it is worthwhile breaking down impact and cost into their component parts:
• The impact of a policy option
o Importance of the barrier it aims to overcome (as assessed in Section 2.2.4), assigning a weight to each of the barrier ‘colours’ (critical/very important/important)
o Effectiveness of the identified policy options at overcoming the barriers
• The cost of a policy option
o Administrative and transaction costs
o Wider economic costs
103 European Commission, Impact Assessment Guidelines (and Annexes) (2009).

DELIVERING THE CIRCULAR ECONOMY – A TOOLKIT FOR POLICYMAKERS • 83
Form
pub
lic p
riva
te
part
ners
hips
to fi
nanc
e th
e de
ploy
men
t of m
atur
e bi
o-re
finin
g te
chno
logi
es
Redu
ce V
AT o
n hi
gh v
alue
ch
emic
als
deri
ved
from
was
te
feed
stoc
k
Stim
ulat
e th
e de
velo
pmen
t of
adv
ance
d, h
igh-
valu
e bi
o-re
finin
g te
chno
logi
es b
y fu
ndin
g cr
oss-
inst
itut
iona
l R&
D c
lust
ers
Requ
ire m
unic
ipal
itie
s to
col
lect
org
anic
was
te
sepa
rate
ly
Prop
ose
a m
inim
um p
ropo
rtio
n of
2nd
gen
erat
ion
biof
uels
in th
e EU
bio
fuel
targ
et
Prov
ide
a bu
sine
ss
advi
ce s
ervi
ce
Iden
tify
and
com
mun
icat
e ne
cess
ary
chan
ges
to
EU p
olic
y (o
r its
nat
iona
l im
plem
enta
tion
) to
addr
ess
unin
tend
ed c
onse
quen
ce
Inco
rpor
ate
bio-
refin
ing
into
th
e go
vern
men
t’s
long
-ter
m
stra
tegi
c pl
ans
Prov
ide
low
-cos
t loa
ns o
r lo
an g
uara
ntee
s fo
r the
de
ploy
men
t of m
atur
e bi
o-re
finin
g te
chno
logi
es
IMPACT LOWHIGH
HIG
HCO
STLO
W
Requ
ire m
unic
ipal
itie
s to
sen
d or
gani
c w
aste
for o
ne ro
und
of p
roce
ssin
g to
ext
ract
hig
h va
lue
com
poun
ds b
efor
e it
co
uld
be in
cine
rate
d /
used
as
fert
ilise
r
Figu
re 2
2: P
rior
itis
atio
n of
pol
icy
opti
ons
– ‘V
alue
cap
ture
in c
asca
ding
bio
-refi
neri
es’
SOU
RC
E: E
llen
Mac
Art
hur
Foun
dat
ion;
NE
RA
Eco
nom
ic C
onsu
ltin
g

84 • DELIVERING THE CIRCULAR ECONOMY – A TOOLKIT FOR POLICYMAKERS
The value potential of the opportunity can also play a role in assessing and ranking the impact of a policy option (see Section 2.2.3).
Policy packagingOnce a prioritised set of potential policy options is determined, the next step is to structure them into potential packages. When creating a policy package, a policymaker will naturally consider, in addition to the individual cost-effectiveness and distributional effects of the policy options, their interrelationships and coherence. The interplay of their effects needs to be taken into account.
A national ‘programme’ could consist of a coordinated set of such packages to enable sector-specific opportunities alongside economy-wide initiatives (see Section 2.3.2). A similar balance needs to be stuck here between policies that enable quick wins and those that lay the foundations for long term, systemic transition.
Sequencing Figure 23 shows an illustrative way to sequence policy options and packages. While this is just one possible way of sequencing policy options, a few general principles stand out:
• Starting with quick wins can help create momentum for some of the more far-reaching and long-term policy interventions
• It needs to be considered if some policy options serve as the foundation for oth-er options – for example, regulatory issues related to real estate sharing need to be addressed before promoting it through, for example, pilots or partnerships
• In the policy design, sufficient flexibility in policy and policymaking process needs to be built in to be able to re-steer if needed (e.g. if unintended conse-quences or disruptive technology developments arise)
• Sufficient effort should be dedicated to tracking implementation progress over time and tweaking the policy interventions to ensure initial objectives are met
Figure 23: Example roadmap
• Prepare implementation of policy packages to support 1-2 ‘quick win’ sector opportunities:
- Conduct further consultation with businesses and other stakeholders
- Conduct detailed policy cost-benefit and feasibility analysis
- Gather political support for policy intervention
• Investigate which economy-wide policy options and potential sector packages could be implemented at a later stage
• Implement selected ‘quick win’ opportunities; track progress and adapt implementation as needed
• Building on momentum of ‘quick wins’, prepare implementation of (and start implementing) 2-3 economy-wide policy options and potential sector packages
• Continue implementation, track progress and adapt implementation as needed
• Assess overall program success and determine next steps
SHORT TERM
MEDIUM TERM
LONG TERM

DELIVERING THE CIRCULAR ECONOMY – A TOOLKIT FOR POLICYMAKERS • 85
2.4 How regional differences could impact the methodology
The step-by-step methodology in this report has been designed to be applicable in countries around the world. While the outcomes will be different depending on macroeconomic and circularity starting positions, the process will be similar – albeit with some variations. Below are some considerations that may be of use to policymakers while tailoring the proposed methodology to fit the situation in their country.
Any country going through the process of moving towards a more circular economy could use the step-by-step methodology outlined in this report as a tool and it is our hope that all governments can extract useful guidance from it. Policymakers will likely have considered how the methodology might be adapted to work in their country while reading the earlier sections of Part 2 but, acknowledging the wide variety of circumstances policymakers face, below are some thoughts and observations on how the different aspects of an economy, a society, and the bodies that govern them, might influence the use and adaptation of this methodology.
2.4.1 Level of circularity already achieved and support for circularity
When an enthusiastic team is about to start developing a circular economy vision and road map for the country, it is crucial to have knowledge of the level of political support it is likely to receive. Ideally the effort would receive broad and high-level support, but given that the circular economy framing is relatively new and it too often is still seen as belonging solely to the realm of the environmental agenda, support might be lacking in depth or breadth. In this case building alliances, narrowing the scope, and gathering early evidence are a few strategies that could help to improve the viability of the effort as well as its strength.
Where initial interest from certain departments is lacking, collaborating with the corresponding agencies on specific data requests or subsets of the analytics could offer an opportunity to gradually scale up the attention within the ministries themselves. Understanding how the circular economy could help meet the specific needs and agendas of these potential allies would not only be useful in building alliances, but should also strengthen the recommendations.
Narrowing the scope of the exercise and developing a reference pilot project for one specific product or sector could be a helpful initial stage. The starting point could be informed by different characteristics, such as the sector with the biggest need, one with demonstrated openness towards innovation and disruption, or a sector that has already achieved a certain degree of circularity (albeit with sufficient potential left). The key is to select a sector that brings a high chance of success for the effort (and even better, its subsequent implementation), without compromising too much on its relevance to the economy – marginal or niche success stories may well not prove an influential example with most businesses. There is some disadvantage to a sector-by-sector approach in that system-level or cross-sectoral challenges and opportunities may be missed, e.g. broad public awareness building, capacity building among public procurement officers, or creating attractive investment conditions. This can be mitigated by making a conscious effort to think across sector borders during sector-specific analysis and solution development, e.g. by engaging a diverse group of stakeholders and experts.
In a situation where broad and deep support is lacking, the earliest results – the findings of the baselining exercise – could be leveraged to garner further support. Keep in mind that positive evidence, such as working business models and proven business cases developed by local companies, are as important as assembling the evidence of the necessity for change, such as evidence of certain industries’ exposure to commodity risk because of high material imports.
Certain sectors might already have obtained a certain level of circularity – it is important to take this into account as the solution space is defined and explored. Conversely, a less advanced starting point means improvement potential might be identified in additional

86 • DELIVERING THE CIRCULAR ECONOMY – A TOOLKIT FOR POLICYMAKERS
places. In the food supply chain for example, countries with less efficient agricultural production could adopt a stronger focus on food wasted between field and customer. Overall, lower levels of circularity not only offer the opportunity to ‘copy-paste’ solutions adopted by countries farther ahead on the curve, but in addition enables leapfrogging – skipping a lot of the trial and error experienced by other countries and potentially avoiding transitional solutions that can lock countries in a suboptimal state (e.g. investments in incineration to avoid landfill).
There is one more point of relevance to understanding the degree of circularity in the country. In an economy already moving towards circularity, local businesses can play an important role in providing expert input in the early stages of the process. But in countries at the beginning of their circular journey, local businesses are less likely to contribute substantially to this debate. The dialogue with the local business community could instead focus on creating understanding of and buy-in for the potential of the circular economy in their respective sectors. The expertise on identifying circular economy opportunities and previous experience with barriers will come to a larger extent from formal (existing) studies and international businesses. It may that both situations occur within a single country, for example if one sector is already more advanced on the circular pathway than another.
2.4.2 Institutional set-up
The strength of institutions should be taken into account when considering solutions: approaches that rely heavily on actions toward public procurement or investment, or complicated administrative policy interventions such as extended producer responsibility schemes at the core of the policy package, are not likely to be successful when institutions in a country are weak. Alternative approaches could include a steer towards voluntary agreements in, for example, the packaging industry or food retailing, potentially working up the value chain, and educating the private sector on alternative models such as performance models for durable goods.
In addition, a note regarding the prevalence of grey markets in a country. A strong informal market does not preclude a rigorous analytical effort to establish circular policies, although more creativity might be required to gather workable data. From an implementation perspective such a workforce could be a strength for labour-intense secondary markets. Rather than risk destroying the livelihood of such workers, proposed policies could leverage this workforce – which usually has a ‘granular’ access to waste streams that can only be envied by formalised waste management systems. In addition to stimulating local authorities to improve their efficiency (better tools, better coordination with city services etc.) national policies could seek to develop higher effectiveness: grow repair and reuse markets for existing secondary product flows, create such markets for new types of products and services, and potentially improve informal labour participation by equipping them with the right type of information.
2.4.3 Available resources
The Denmark pilot was characterised by a very intense analytical effort with significant data requirements. The analysis relied heavily on data from various government agencies, including the Danish Statistical Agency, the Danish Business Authority and the Danish Environmental Agency, along with qualitative insights from interviews with 25+ businesses, industry bodies and other relevant organisations. In term of manpower, it took a commitment of approximately five to ten full-time employees (FTE) over six months, for a total of about 40 man-months: about 5 for Step 1 (Chapter 2.1), about 25 for Step 2 (Chapter 2.2), and about 10 for Step 3 (Chapter 2.3). This included full- and part-time contributions from a team of analysts from several organisations. The skills of the personnel involved in the project included:
• Business analytics, including ability to understand value chains, facilitate discus-sions with companies and perform sector-specific quantification of economic impact
• Macroeconomic modelling, for the economy-wide impact quantification

DELIVERING THE CIRCULAR ECONOMY – A TOOLKIT FOR POLICYMAKERS • 87
• Policy analysis
• Circular economy
• Environmental and resource issues
• Country-specific understanding of policy and circularity context
There might be other reasons for policymakers to limit analytical effort or organise it differently at one or more stages of the process, such as a lack of relevant data, time and/or resource constraints, lack of political buy-in to the idea of the circular economy, or different, previously established policy analysis methods. At each stage of the methodology it is possible to limit the analytical effort to match available expertise and local constraints:
• Step 1: Align on starting point, ambition and focus
o A simplified baselining exercise could eliminate quantitative benchmarking of resource efficiency and/or circularity metrics. It could also limit the policy surveying effort – especially where very few policies are known or suspected to be in place.
o Sector selection could be achieved without quantitative economic analysis, instead taking the country’s priority sectors, regardless of their resource and/or GDP impact – it being unlikely that the GDP impact of a priority sector would be negligible. A review of the circularity potential might focus on a qualitative assessment and forgo quantitative analysis of the resource material and energy intensity, volume of waste generated, and share of waste landfilled/incinerated.
• Step 2: Assess sector opportunities
o Mapping and prioritising circular economy opportunities in each sector could be simplified by referring to existing inventories and reports (such as this report or the reports mentioned in Table 1 in Part 1) to get a quick overview of relevant possibilities.
o One of the biggest analytical tasks, assessing the various impacts of the selected levers, could be reduced by relying more on standard impact assessment figures taken from other studies (again such as this one or other studies mentioned in Table 1 in Part 1). At least a minimum of localisation is necessary, i.e. to consider whether the inventoried levers would be similarly attractive and feasible in the country under study. Local factors to take into account when considering the inventoried levers include different starting points (e.g. organics recovery may be an important part of an otherwise underdeveloped waste management system), different industry structures and different access to (export) markets.
• Step 3: Analyse economy-wide implications
o Instead of quantifying national economy-wide impact through macroeconomic computational general equilibrium modelling, policymakers could choose to use partial equilibrium sector-level modelling and/or rely on existing studies assessing the national economy-wide impact.
o Policymakers could decide to rely on informal assessments of policy impact, cost and political feasibility, such as stakeholder consulting methods – or use assessment methods more commonly deployed in their territory.

88 • DELIVERING THE CIRCULAR ECONOMY – A TOOLKIT FOR POLICYMAKERS

DELIVERING THE CIRCULAR ECONOMY – A TOOLKIT FOR POLICYMAKERS • 89
CASE STUDYDENMARK


DELIVERING THE CIRCULAR ECONOMY – A TOOLKIT FOR POLICYMAKERS • 91
3 CASE STUDY – DENMARK
To make this toolkit as concrete and actionable as possible, it was tested in a pilot country – Denmark. The pilot focused on five sectors: construction & real estate, machinery, plastic packaging and hospitals. This part covers the core findings for these sectors, as well as an integrated national perspective. While these findings cannot be directly transposed to other countries, they might serve as a source of inspiration for the identification of opportunities, barriers and policy options.
The findings for Denmark resulted from an intense analytical phase, going through all steps of the methodology as laid out in Part 2, and including consultations with more than 25 businesses, a group of senior policymakers, and a series of international experts. The findings therefore give a good directional view on circular economy opportunities for Denmark. However, being the result of a pilot phase covering five major sectors in just a few months, the findings below do not aim to be as detailed as a typical impact assessment for one opportunity or policy. Similarly, the set of identified barriers would likely need to be analysed further. The set of opportunities is not exhaustive – significant opportunities may exist in addition to those identified here.
Each of the deep dives below covers the current state of the circular economy, the key circular economy opportunities and related barriers, and potential policy options to overcome these barriers.
3.1 National perspectiveEven in a country with a starting position as advanced as Denmark, there are significant opportunities to further transition towards the circular economy. Ten circular economy opportunities in five focus sectors were identified as most promising for Denmark. Modelling conducted in this study suggests that, by 2035, these could unlock, relative to a ‘business as usual’ scenario:
• an increase in GDP by 0.8–1.4%;
• between 7,000 and 13,000 additional job equivalents;104
• a reduction of the country’s carbon footprint by 3–7%;105
• a reduction of consumption of selected resources106 by 5–50%;
• an increase in net exports by 3–6%.
Each of these opportunities is limited, to varying degrees, by a number of barriers. Potential policy options to overcome these barriers have been identified. To enable a systemic transition towards the circular economy, Danish policymakers might also consider setting economy-wide direction for the circular economy, broader changes to the fiscal system, and a wider knowledge-building and education effort. These potential policy options should not be considered as recommendations; Danish policymakers would need to assess in the necessary detail their expected costs, benefits and feasibility.
104 Employment impact modelled through conversion of labour bill to job equivalents via a wage curve approach (elasticity = 0.2). Percentage change is computed vs. 2013 total full-time employment.
105 Measured as change in global carbon emissions divided by ‘business as usual’ Denmark carbon emissions.
106 For steel and plastic, in selected sectors in Denmark. Includes resources embedded in imported products/components.

92 • DELIVERING THE CIRCULAR ECONOMY – A TOOLKIT FOR POLICYMAKERS
DENMARK TODAY
Leading Danish companies, including large multinationals as well as SMEs, are pioneering circular economy solutions. Shipping company Maersk has introduced product passports for their container ships, actively working with the Korean shipyard DSME and approximately 75 suppliers of parts. The passport, which will be updated throughout the life of the ship, is a database listing the material composition of the main parts of the ship, and documents approximately 95% (by weight) of the materials used to build the ships. It will enable better recovery of parts and materials used in the construction and maintenance of the vessels.107 Brewing company Carlsberg is using the Cradle-to-Cradle® (C2C) design framework108 to develop C2C-certified packaging, and has set up the Carlsberg Circular Community, aiming to rethink the design and production of traditional packaging material and develop materials which can be recycled and reused indefinitely while keeping quality and value.109 Baby clothing company Vigga offers a circular subscription model for baby clothes. The baby clothes, made from organic fabrics, are returned to Vigga once outgrown, where they are dry cleaned in an environmentally friendly way and made ready for another baby to optimise the use during the lifetime of the baby clothes.110 These are just three out of many inspiring examples.
Denmark has a long and rich tradition of innovating policies that stimulate the circular economy. It introduced the very first deposit-refund scheme for beverage containers in the 1980s. It has incrementally increased landfill taxes since they were introduced in 1987.111 In 2011, it set the target to be fully independent from fossil fuels by 2050. More recently, Denmark has laid out a comprehensive waste management strategy in ‘Denmark Without Waste I/II’, focused on moving from incineration to recycling and waste prevention, respectively. It has established the Task Force for Resource Efficiency, the National Bioeconomy Panel, the Green Industrial Symbiosis programme, and the Rethink Resources innovation centre. Denmark participates in international initiatives such as the Ellen MacArthur Foundation’s CE100 programme.
Selected KPIs reveal that Denmark has indeed an advanced starting position compared to other European countries:
• Waste generated per unit GDP: 40 tonnes/EUR million vs. 69 for EU28.
• Waste diverted from landfill: 93% vs. 59% for EU28.
• Recycling rate112: 60% vs. 53% for EU28.
• GHG emission per unit of GDP: 225 tonnes CO2e per EUR million vs. 343 for EU28.
• Share of renewable energy: 26% of gross final energy consumption vs. 14% for EU28.
Denmark is internationally recognised as a front runner in the circular economy. A case in point is the Danish Business Authority winning the 2015 ‘Ecolab Award for Circular Economy Cities/Regions’ at the World Economic Forum in Davos.113
Yet even Denmark has significant opportunities to further transition towards the circular economy. Across the economy, significant material value is left on the table as most
107 Maersk. www.maersk.com/en/hardware/triple-e/the-hard-facts/cradle-to-cradle
108 Created by William McDonough and Professor Michael Braungart. www.c2ccertified.org
109 Carlsberg. www.carlsberggroup.com/csr/ReportingonProgress/SustainablePackaging/Pages/default.aspx
110 www.vigga.us
111 Danish Environmental Protection Agency, From land filling to recovery – Danish waste management from the 1970s until today (2013).
112 Excluding major mineral waste. Scope: recycling of domestically generated waste (including exported waste, excluding imported waste).
113 https://thecirculars.org
DELIVERING THE CIRCULAR ECONOMY – A TOOLKIT FOR POLICYMAKERS • 93
waste streams and by-products are used for relatively low-value applications. Of the 93% waste diverted from landfill, only two thirds is recycled – the rest is incinerated.114 In the construction sector, 87% of materials is recycled, but mainly for low-quality applications,115 and there is only an estimated <1% reuse of building components and materials. In the machinery sector, >95% of its most important material (steel) is recycled, yet there is an estimated <1% remanufacturing.116 Nearly 100% of industrial organic waste is being valorised, but mainly in low-value applications such as incineration, direct fertilisation, or animal feed, while only ~3% of waste is used in biogas production and there is <1% cascading bio-refining.117
In addition, the headline figures quoted above hide pockets of opportunities. Municipal waste per capita is the highest in the EU (~750 kg/capita vs. ~480 kg/capita EU28 average).118 There is an estimated 80-90 kg annual avoidable food waste per household.119 Only ~15% plastic packaging is collected for recycling from households, of which only half actually gets recycled in new resin.120
CIRCULAR ECONOMY OPPORTUNITIES AND THEIR POTENTIAL IMPACT
Five focus sectors were selected for the Denmark pilot, using the approach described in Section 2.1.3. The focus sectors are:
• Food & beverage, a producing sector. The analysis in this sector focused on the pork and dairy processing industry, but also included a deep dive on the con-sumer side.
• Construction & real estate, a producing sector. The analysis in this sector focused on the construction and renovation of buildings, but also included a deep dive on real estate utilisation (sharing).
• Machinery, a producing sector. The analysis in this sector focused on pumps and wind turbines.
• Plastic packaging, a cross-cutting sector spanning consumer goods companies, wholesalers, retailers, and consumers.
• Hospitals, a consuming sector. The analysis in this sector focused on public pro-curement.
The energy sector, while critical for the transition to the circular economy, has not been selected as a focus sector in this study, as Denmark is already working towards a target to base all energy consumption, including the transport sector, on renewables by 2050.121
Using the approach described in Chapter 2.2, ten circular economy opportunities were identified across these five focus sectors. These opportunities are shown in Figure 24, and are detailed in Chapters 3.2–3.6, which each cover one sector.
114 Eurostat.
115 Statistics Denmark; interviews with the Danish Environmental Protection Agency and sector experts.
116 Statistics Denmark; interviews with sector experts.
117 L. Lange, A. Remmen, Bioeconomy scoping analysis (Aalborg University, 2014); interviews with sector ex-perts; Danish Government, Denmark Without Waste I. Recycle more – incinerate less (2013); Danish Energy Agency, Biogas i Danmark – status, barrierer og perspektiver (2014).
118 Eurostat. There are some discrepancies in how this metric is calculated in different member states.
119 Danish Environmental Protection Agency, Kortlægning af dagsrenovation i Danmark – Med fokus på etage-boliger og madspild (2014).
120 Danish EPA; Statistics Denmark.
121 The Danish Government, The Danish Climate Policy Plan (2013).

94 • DELIVERING THE CIRCULAR ECONOMY – A TOOLKIT FOR POLICYMAKERS
Figure 24: Ten circular economy opportunities in five focus sectors
SOURCE: Ellen MacArthur Foundation
Value capture in cascading bio-refineries
Industrialised production and 3D printing of building modules
Increased recycling of plastic packaging
Bio-based packaging where beneficial
Performance models in procurement
Reduction of avoidable food waste
Reuse and high-value recycling of components and materials
Sharing and multi-purposing of buildings
Remanufacturing and new business models
Waste reduction and recycling
1
2
3
4
5
6
7
8
9
10
FOOD AND BEVERAGE
CONSTRUCTION AND REAL ESTATE
MACHINERY
PLASTIC PACKAGING
HOSPITALS
These ten identified opportunities are already being pursued to some extent today, inside or outside Denmark. There is however significant potential to scale up. Doing so could bring Denmark from the – dependent on the sector – early or advanced transitioning economy it is today to an advanced transitioning and in some areas almost fully circular economy by 2035 (see Figure 25 on the next double page spread).
For the impact assessment, two scenarios were defined – ‘conservative’ and ‘ambitious’ – to differentiate assumptions on the scalability of the focus products to the wider focus sectors, and of the five focus sectors to adjacent producing sectors. The impact estimated for pumps and windmills, for example, is scaled up to the full machinery sector. The impact for the machinery sector is then, in turn, scaled up to the adjacent electronics sector. In the conservative scenario, such scale-up is heavily discounted – for example, when scaling up the results from the construction of buildings to infrastructure construction, these results are reduced by 80%. In the ambitious scenario, higher scale-up rates are used. A detailed overview of the scale-up used in the two scenarios can be found in Appendix B.
Overall, the underlying assumptions for both scenarios can be considered relatively conservative. The scenarios rely, for example, only on technologies currently at commercial stage or late R&D. In addition, the analysis focused on the producing

DELIVERING THE CIRCULAR ECONOMY – A TOOLKIT FOR POLICYMAKERS • 95
sectors and hospitals only, representing, in total, 25% of the Danish economy122. No direct circularity effects have been modelled for the service sector (except hospitals), which represents (excluding hospitals) over 70% of the Danish economy. The Danish energy mix was assumed to be the same in the ‘business as usual’ and circular economy scenarios – which limits the size of the potential CO2 reduction. More details on key model assumptions and data sources can be found in Appendix C.
Relative to a ‘business as usual’ scenario, the identified circular economy opportunities, along with their potential knock-on effects on other sectors of the Danish economy, could produce significantly positive economic and environmental results (see Figure 26). While such estimates by necessity rely on a number of assumptions and recognising that the methodology used to estimate them will continue to be developed, these findings support conclusions from a growing body of research (see Figure 4 in Chapter 1.1) that the impact of a circular economy transition on economic growth, job creation and carbon emissions is likely positive.
Figure 26: Estimated potential impact of further transitioning to the circular economy in Denmark
Economy-wide impact by 2035. Absolute and percentage change relative to the ‘business as usual’ scenario.
1 Employment impact modelled through conversion of labour bill to job equivalents via a wage curve approach (elasticity = 0.2). Percentage change is vs. 2013 total full-time employment (Source: Statistics Denmark) 2 Change in Global CO2 emissions vs. Denmark baseline 2035 emissions; other GHG emissions are not included. SOURCE: Ellen MacArthur Foundation; NERA Economic Consulting
0.8%
1.4% 0.6%
0.4% -2.5%
-6.9%-2.3
-0.87,300
13,3006.2
3.6
GDP EUR billion (2015 prices)
Employment1 Job equivalents
CO2 footprint2 Million tonnes of CO2
CON
SERVATIVE
AM
BITIOU
S
x% Percentage change 2035 vs. ‘business as usual’ scenario
The economy-wide impact assessment of the conservative and ambitious scenarios of circular economy opportunities produced positive results for Denmark. Positive changes relative to the ‘business as usual’ scenario were identified in five key areas:
Economic growth (measured as change in Gross Domestic Product): Economic modelling suggests that the identified circular economy opportunities could expand
122 Based on 2011 gross value added provided by Statistics Denmark.
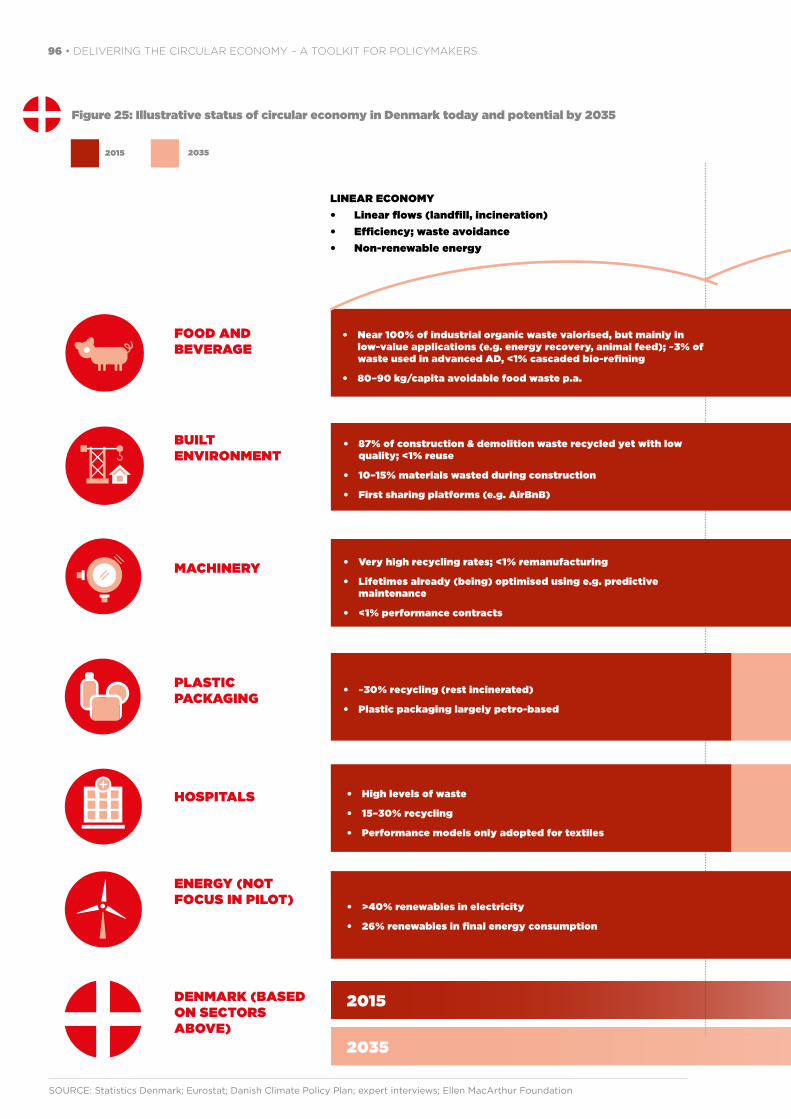
96 • DELIVERING THE CIRCULAR ECONOMY – A TOOLKIT FOR POLICYMAKERS
Figure 25: Illustrative status of circular economy in Denmark today and potential by 2035
FOOD AND BEVERAGE
BUILT ENVIRONMENT
MACHINERY
PLASTIC PACKAGING
HOSPITALS
ENERGY (NOT FOCUS IN PILOT)
DENMARK (BASED ON SECTORS ABOVE)
• Near 100% of industrial organic waste valorised, but mainly in low-value applications (e.g. energy recovery, animal feed); ~3% of waste used in advanced AD, <1% cascaded bio-refining
• 80–90 kg/capita avoidable food waste p.a.
• 87% of construction & demolition waste recycled yet with low quality; <1% reuse
• 10–15% materials wasted during construction
• First sharing platforms (e.g. AirBnB)
• Very high recycling rates; <1% remanufacturing
• Lifetimes already (being) optimised using e.g. predictive maintenance
• <1% performance contracts
• ~30% recycling (rest incinerated)
• Plastic packaging largely petro-based
• High levels of waste
• 15–30% recycling
• Performance models only adopted for textiles
• >40% renewables in electricity
• 26% renewables in final energy consumption
2015
2035
SOURCE: Statistics Denmark; Eurostat; Danish Climate Policy Plan; expert interviews; Ellen MacArthur Foundation
LINEAR ECONOMY• Linear flows (landfill, incineration)• Efficiency; waste avoidance• Non-renewable energy
2015 2035
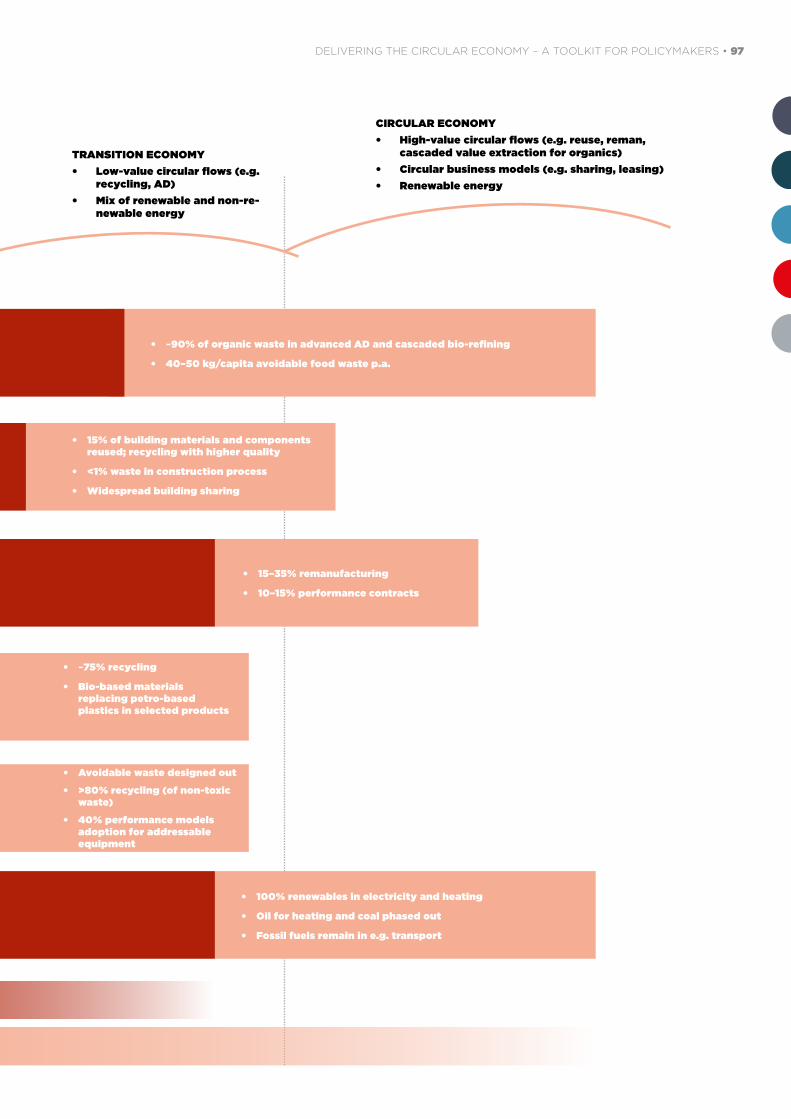
DELIVERING THE CIRCULAR ECONOMY – A TOOLKIT FOR POLICYMAKERS • 97
• ~90% of organic waste in advanced AD and cascaded bio-refining
• 40–50 kg/capita avoidable food waste p.a.
• 15% of building materials and components reused; recycling with higher quality
• <1% waste in construction process
• Widespread building sharing
• 15–35% remanufacturing
• 10–15% performance contracts
• ~75% recycling
• Bio-based materials replacing petro-based plastics in selected products
• Avoidable waste designed out• >80% recycling (of non-toxic
waste)• 40% performance models
adoption for addressable equipment
• 100% renewables in electricity and heating
• Oil for heating and coal phased out
• Fossil fuels remain in e.g. transport
TRANSITION ECONOMY• Low-value circular flows (e.g.
recycling, AD)• Mix of renewable and non-re-
newable energy
CIRCULAR ECONOMY• High-value circular flows (e.g. reuse, reman,
cascaded value extraction for organics)• Circular business models (e.g. sharing, leasing)• Renewable energy

98 • DELIVERING THE CIRCULAR ECONOMY – A TOOLKIT FOR POLICYMAKERS
Denmark’s GDP by between +0.8% (in the conservative scenario) and +1.4% (in the ambitious scenario) by 2035. This increase in national economic growth would be achieved mainly through a combination of increased revenues from emerging circular activities and lower cost of production through more productive utilisation of inputs. These changes in input and output of economic production activities affect economy-wide supply, demand and prices, rippling through the other sectors of the Danish economy and resulting in a series of indirect effects that add to the overall growth. Such effects include changed activity levels in the supply chains, and greater consumption and savings resulting from an increase in household income, in turn resulting from greater remuneration to labour. Together, these effects add up to a positive change in GDP (and contribute to other macro impacts described below).
Employment (measured as job equivalents estimated via a wage curve approach): Total remuneration to labour increases both as a result of general expansion of economic activity, and as a result of the increased labour intensity resulting from certain circular economy opportunities (e.g. remanufacturing). Although the impact assessment model used in the Denmark pilot does not explicitly calculate how this higher remuneration is distributed between wage increases and new jobs, it is possible to estimate this distribution using a ‘wage curve’ approach and an assumption on long-run labour supply elasticity (elasticity = 0.2). Through such a calculation, it is estimated that the direct and indirect effects of circularity could bring positive impacts to employment by adding between 7,000 (in the conservative scenario) and 13,000 (in the ambitious scenario) full-time job equivalents to the economy by 2035.123
Carbon footprint (measured as change in global emissions as a result of Denmark’s more circular economy): Increased circularity and the associated reduction in resource consumption would lower the carbon intensity of Denmark’s own producing sectors, reduce Denmark’s imports of high-carbon-embodied goods, and increase Denmark’s exports of lower-carbon-embodied goods. These changes would directly affect the carbon emissions of Denmark and its trading partners, and indirectly also those of its non-trading partners. This could reduce global carbon emissions in a magnitude equal to between 3% (in the conservative scenario) and 7% (in the ambitious scenario) of Denmark’s ‘business as usual’ carbon emissions by 2035. This reduction excludes the effects resulting from a shift to renewable energy.
Resource use: By 2035, increased remanufacturing in the machinery sector could reduce demand for 60,000–90,000 tons of iron/steel annually (6–10% of total consumption in that sector).124 In plastic packaging, demand for virgin plastic could be reduced by 80,000–100,000 tons annually due to increased recycling (40–50% of total in that sector125).
International trade balance: In a circular economy, Denmark’s use of goods and services would be more productive than it would be otherwise. That is, Denmark would be able to produce goods and services, primarily those in the focus sectors, at a lower cost. This cost advantage from greater circularity would improve cost-competitiveness internationally, which would result in higher exports and erode the attractiveness of imports, reducing their volume. Such trade effects could ripple across to other countries, resulting in a shift in Denmark’s trading patterns with the rest of the world. By 2035, net exports (i.e. exports minus imports) could expand, relative to the ‘business as usual’ scenario, by 3% (in the conservative scenario) and 6% (in the ambitious scenario).
For a detailed description of the impact assessment methodology, see Sections 2.2.3 and 2.3.1, and Appendix B.
123 Employment impacts are computed assuming a wage curve and a long-run labour supply elasticity of 0.2. This methodology is similar to the approach adopted by the Danish Economic Council (DØRS) when inter-preting employment impacts within a CGE with full employment assumption. The chosen elasticity value is an average for European countries.
124 Total steel demand provided by Statistics Denmark. Steel savings estimated based on the adoption rate of component remanufacturing in the machinery sector (Chapter 3.4), informed by material composition pro-vided by industry reports and sector experts.
125 Measured by annual plastic packaging waste generated. Danish Environmental Protection Agency, Statistik for emballageforsyning og indsamling af emballageaffald 2012 (2015 rev.).

DELIVERING THE CIRCULAR ECONOMY – A TOOLKIT FOR POLICYMAKERS • 99
Figure 27 shows a breakdown of these results along the seven quantified circular economy opportunities. Three circular economy opportunities have not been quantified. The economic impacts of the two packaging opportunities and the opportunity related to waste reduction and recycling in hospitals have not been quantified as it is expected that their magnitude would be limited when compared to the full Danish economy.
Figure 27: Breakdown of potential economic impact by quantified opportunity
1 Average between conservative and ambitious scenario. This sector-specific impact does not include indirect effects, e.g. on supply chains, that are captured in the economy-wide CGE modelling. 2 Including scaling from machinery sector (including pumps, wind turbines and other machinery products) to adjacent manufacturing sectors (electronic products, basic metals and fabricated products, other manufacturing, mining and quarrying) SOURCE: Ellen MacArthur Foundation
CIRCULAR ECONOMY OPPORTUNITY
ESTIMATED ANNUAL VALUE CREATED BY 20351
Industrialised production and 3D printing of building modules
Value capture in cascading bio-refineries
Remanufacturing and new business models2
Sharing and multi-purposing of buildings
Reuse and high-value recycling of components and materials
Reduction of avoidable food waste
Performance models in procurement
Total
33%
17%
17%
16%
7%
7%
3%
100%
BARRIERS AND POTENTIAL POLICY OPTIONS
While most circular economy opportunities identified in Denmark have sound underlying profitability, there are often non-financial barriers limiting further scale-up or reducing their pace. An overview of the barriers to each of the opportunities in the Denmark pilot is provided in Figure 28.
The social factor barriers of capabilities and skills and custom and habit are widespread, as the behavioural changes needed to realise many of the opportunities go against ingrained patterns of behaviour and skill-sets on the part both of consumers and businesses. Imperfect information was also often found to be a barrier: businesses can be unaware of potentially profitable new opportunities, or the information necessary to realise them is unevenly distributed.
Technology can be a critical barrier as well, especially for the more technology-

100 • DELIVERING THE CIRCULAR ECONOMY – A TOOLKIT FOR POLICYMAKERS
BARRIERS
Value capture in cascading bio-refineries
Reduction of avoidable food waste
Industrialised production and 3D printing of building modules
Reuse and high value recycling of components and materials
Sharing and multi-purposing of buildings
Remanufac-turing and new business models
Increased recycling of plastic packaging
Bio-based packaging where beneficial
Performance models in procurement
Waste reduction and recycling in hospitals
Not profitable for businesses1 even if other barriers are overcome
Capital intensive and/or uncertain payback times
Technology not yet fully available at scale
Externalities (true costs) not fully refletcted in market prices
Insufficient public goods / infrastructure2 provided by the market or the state
Insufficient competition / markets leading to lower quantity and higher prices than is socially desirable
Imperfect information that negatively affects market decisions, such as asymmetric information
Split incentives (agency problem) when two parties to a transaction have different goals
Transaction costs such as the costs of finding and bargaining with customers or suppliers
Inadequately defined legal frameworks that govern areas such as the use of new technologies
Poorly defined targets and objectives which provide either insufficient or skewed direction to industry
Implementation and enforcement failures leading to the effects of regulations being diluted or altered
Unintended consequences of existing regulations that hamper circular practices
Capabilities and skills lacking either in-house or in the market at reasonable cost
Custom and habit: ingrained patterns of behaviour by consumers and businesses
1 At market prices excluding the full pricing of externalities such as greenhouse gas emissions, ecosystem degradation and resource depletion 2 Infrastructure defined as fundamental physical and organisational structures and facilities, such as transportation, communication, water and energy supplies and waste treatment
Figure 28: Barrier matrix for the ten prioritised opportunities in Denmark
Critical barrier (‘make or break’)
Very important barrier (to scale-up / acceleration of lever)
Important barrier (to scale-up / acceleration of lever)
Limited or no barrier
CIRCULAR ECONOMY OPPORTUNITIES
ECON
OM
ICS
MA
RK
ET FAILU
RES
REG
ULATO
RY FA
ILUR
ESSO
CIA
L FA
CTO
RS

DELIVERING THE CIRCULAR ECONOMY – A TOOLKIT FOR POLICYMAKERS • 101
BARRIERS
Value capture in cascading bio-refineries
Reduction of avoidable food waste
Industrialised production and 3D printing of building modules
Reuse and high value recycling of components and materials
Sharing and multi-purposing of buildings
Remanufac-turing and new business models
Increased recycling of plastic packaging
Bio-based packaging where beneficial
Performance models in procurement
Waste reduction and recycling in hospitals
Not profitable for businesses1 even if other barriers are overcome
Capital intensive and/or uncertain payback times
Technology not yet fully available at scale
Externalities (true costs) not fully refletcted in market prices
Insufficient public goods / infrastructure2 provided by the market or the state
Insufficient competition / markets leading to lower quantity and higher prices than is socially desirable
Imperfect information that negatively affects market decisions, such as asymmetric information
Split incentives (agency problem) when two parties to a transaction have different goals
Transaction costs such as the costs of finding and bargaining with customers or suppliers
Inadequately defined legal frameworks that govern areas such as the use of new technologies
Poorly defined targets and objectives which provide either insufficient or skewed direction to industry
Implementation and enforcement failures leading to the effects of regulations being diluted or altered
Unintended consequences of existing regulations that hamper circular practices
Capabilities and skills lacking either in-house or in the market at reasonable cost
Custom and habit: ingrained patterns of behaviour by consumers and businesses

102 • DELIVERING THE CIRCULAR ECONOMY – A TOOLKIT FOR POLICYMAKERS
dependent opportunities such as cascading bio-refineries, 3D printing of building components, and bio-based packaging.
Externalities feature as a barrier to many opportunities, though they do not threaten the fundamental profitability of most, with the exception of packaging. In this sector, without the additional factoring in of externalities, the profitability of both recycling and bio-based packaging is highly dependent on the price of the alternative – petro-based plastic, which is in turn determined by global oil prices. A similar reasoning applies to bio-refineries, although cascading bio-refineries could alleviate this concern by diversifying revenue streams beyond alternatives to petro-based fuels, chemicals and plastics.
The barrier of unintended consequences from existing legislation limiting circular economy opportunities is present for example in bio-refining where food safety regulations prevent the use of certain animal products as feedstock. Such barriers can be in the complexity and cost of adhering to regulations as well as in actual prohibition of certain activities. The devil is in the detail here, and more detailed analysis of unintended consequences would be required to determine the exact magnitude of this barrier for the different opportunities in Denmark.
Potential policy options that could overcome the barriers for each of these opportunities have been identified. These options cover a broad range of policy intervention types, and are detailed in the sector deep dive chapters below. They should not be considered as recommendations, rather as an input to Danish policymakers’ discussions about if and how to shift to a circular economy. Policymakers would need to assess in detail their expected costs, benefits and feasibility.
To enable a systemic transition towards the circular economy, Danish policymakers could also reflect on setting an economy-wide direction for the circular economy, broader changes to the fiscal system, and a wider knowledge-building and education effort. While many circular economy opportunities already have a sound underlying profitability, a number of international organisations, such as the European Commission, the OECD, the IMF, and the International Labour Organization, have suggested further opportunities could be unlocked by shifting fiscal incentives towards labour from resources. However, the effects of such a shift would need to be carefully analysed, especially considering Denmark is a small and export-oriented country. Complementing today’s flow-based metrics such as GDP as a measure of economic success with measures of a country’s stock of assets could be an instrument for policymakers to account for the restoration and regeneration of natural capital.
3.2 Food & BeverageThe Danish food and beverage industry has developed a track record of minimising processing waste and finding productive use for its by-products and remaining waste streams – but mostly in relatively low-value applications. It therefore has a significant opportunity to increase the value extraction from its by-products and waste streams by using cascading bio-refineries. While anaerobic digestion and other basic bio-refining technologies exist today, the technology to derive – in cascaded applications – high-value compounds is still an estimated five years away. If technological development continues and plant capacity is built up, modelling suggest that these cascading bio-refineries could yield, by 2035, a potential net value of EUR 300–500 million annually. In parallel, reducing the levels of avoidable food waste from 80–90 kg/capita to 40–50 kg/capita, enabled through building awareness and capabilities among households and businesses and improving technologies across the value chain, could save Danish households and businesses an estimated EUR 150–250 million annually by 2035.
Operating in a highly competitive international context, the Danish food and beverage industry has developed a track record of minimising processing waste and finding productive use for its by-products and remaining waste streams. However, most of these

DELIVERING THE CIRCULAR ECONOMY – A TOOLKIT FOR POLICYMAKERS • 103
applications are relatively low-value, such as the production of animal feed or energy extraction. The Danish food and beverage processing industry therefore has a significant opportunity to increase the value extraction from its by-products and waste streams in cascading bio-refineries.
The retail and hospitality sectors and households, on the other hand, generate large quantities of avoidable food waste. Considering that Danish households spent over EUR 23 billion on food and beverages in 2013, or 20% of their total consumption,126 significant value could be captured by reducing avoidable food waste.
3.2.1 Value capture in cascading bio-refineries
Opportunity: Develop cascading bio-refineries that capture the full value of by-product and waste streams by extracting several different products.
2035 economic potential:
EUR 300–500 million p.a.
Key barriers: Capital to build and scale up capacity; technology; unintended consequences of existing regulation.
Sample policy options:
Long-term strategic targets for bio-refineries; support capacity for current technologies and create markets; support technological development.
Home to international players such as Carlsberg, Danish Crown, and Arla, the Danish food and beverage sector is a cornerstone of Danish industry, representing 25% of the total product exports, and 7.7% of the gross value added by the Danish producing sectors.127
The Danish food-processing industry is already a leader in resource productivity, both in terms of minimising waste and valorising by-products:
• At Carlsberg, ~95% of brewery by-products are sold as fodder supplements, and the company is currently looking into biogas generation for additional value ex-traction.
• Danish Crown ‘does not think in terms of waste at all’ according to environmental manager Charlotte Thy. ‘It’s in our DNA to find applications for all our by-prod-ucts’. Slaughterhouses today have a multitude of ways to valorise all parts of the animal. For example, bones, trotters and excess blood can be sold as animal feed, and even manure left in the intestines is collected and used for biogas genera-tion.
• Arla has used whey, a by-product of cheese making, to produce high-protein products since the 1980s.
Other organic waste, such as wastewater from industries and households, and food waste, is used to extract energy using anaerobic digestion (biogas), combined heat and power, or direct district heating. Denmark had an estimated 1.2 GWh biogas capacity in 2012. The biogas plants treat 3% of Denmark’s organic waste as well as wastewater and manure. Most of the capacity was built before 2000, but in 2012 Denmark adopted a new support model and subsidy scheme for the production and use of biogas. The Danish Energy Agency now estimates that biogas capacity will increase to 2.8 GWh by 2020.128
126 Eurostat, Final consumption expenditure of households by consumption purpose (2013).
127 Based on gross value added in 2011, reported by Statistics Denmark. Producing sectors include agriculture, forestry and fishing; mining and quarrying; construction; electricity and gas; manufacturing.
128 Danish Energy Agency, Biogas i Danmark – status, barrierer og perspektiver (2014).

104 • DELIVERING THE CIRCULAR ECONOMY – A TOOLKIT FOR POLICYMAKERS
THE OPPORTUNITY FOR DENMARK
There is still a large opportunity to capture as most of the abovementioned applications extract only a fraction of the value residing in the various organic by-products and waste streams. According to an Aalborg University report, Denmark has a strong position in bioeconomy R&D, but it is insufficiently leveraged since new valorisation technologies have not yet been piloted to the extent required to accelerate them to commercial scale.129
It has been argued for some years that advanced, cascading ‘bio-refineries’130 could unlock this value by deriving valuable products from organic waste and by-products, in many ways emulating the conventional petroleum refinery.131 The core principle is to cascade waste/by-product streams through a series of value-creating steps. The cascade could consecutively produce, for example, high-value biochemicals and nutraceuticals, followed by bulk biochemicals, and still be able to produce biofuels and/or biogas with the remaining biomass. The extraction of nitrogen, phosphorus and potassium (NPK)132 and the return of digestate to soils (restoration) ensures that the process also helps preserve natural capital.
To ensure viability of full value capture through a set of cascaded operations, development of the more advanced technologies that extract complementary products from the by-products or waste needs to accelerate. There are many promising examples of this group of technologies developed today. The following are selected examples; see also Notes 129 and 131):
• Use newly engineered enzymes to convert keratin-rich parts such as hairs, bris-tles or feathers to high-protein feed ingredients.
• Extract proteins and other food ingredients from under-utilised residues from plants (press cake from oil seed, potato peelings, brewers’ spent grain) or ani-mals (by-catch and side streams from fisheries).
• Extract or synthesise nutraceuticals from pig blood and similar chemically rich by-products.
• Use microbes to synthesise bioplastics from sewage sludge or wastewater, such as in the Danish multi-stakeholder project at special ingredient manufacturer KMC’s water treatment plant.133
Aside from developing the technologies needed, it is challenging to make them all come together in an integrated way, and also make them work in concert with more basic technologies like anaerobic digestion. One of the few plants today operating in line with the definition of an advanced, cascading bio-refinery (see Note 130) is the Borregaard plant in Norway.134 The plant, which used to make paper and cellulose, now produces a variety of fine chemicals for both food and chemical industries, cellulose-derived materials and biofuels, mostly based on feedstock from the forest industry. While Borregaard is not directly comparable to a bio-refinery based on organic waste, such developments are underway: for example, Veolia has launched a project in collaboration with UK-based Bakkavor Group to transform a wastewater treatment plant in Belgium to a fully cascading bio-refinery that produces pharma-grade chemicals, bioplastics, fertilisers, energy and clean water.135
129 Lange, L., Remmen, A., Aalborg University, Bioeconomy scoping analysis (2014).
130 A bio-refinery can be defined as a plant that is designed to convert an organic feedstock into several value streams by cascading the material through a series of extraction and/or conversion operations. This is not to be confused with pure-play biofuel or combined heat and power plants that also use an organic feedstock.
131 For more details, please see Ellen MacArthur Foundation, Towards the Circular Economy I (2012), p.52.
132 For example, the EU-led P-REX project seeks to demonstrate phosphorous recovery from municipal waste-water at scale. www.p-rex.eu
133 State of Green, Producing more with less. Danish strongholds in bioeconomy & resource-efficient production (2015).
134 www.borregaard.com
135 Veolia and Bakkavor presentation at The Water Event, 2013. www.thewaterevent.com/files/collaboration_and_partnership_delivering_sustainable_solutions_to_water.pdf

DELIVERING THE CIRCULAR ECONOMY – A TOOLKIT FOR POLICYMAKERS • 105
With the necessary investments in technology and capacity available, Denmark could become a leader in cascading bio-refining:
• By 2020, Danish businesses could have set up the first new bio-refineries to max-imise the valorisation of existing waste streams using mature technologies (e.g. enzymatic protein extraction from animal by-products and chemical extraction from wastewater). Continuing extension of biogas and biofuel capacity could serve as platforms for emerging, more advanced technologies. Recognising that such technologies take time to develop at scale, it is estimated that 20% of the organic waste and by-products are available for additional value creation in the short term, and that 60% of the added value would come from extending and improving biofuel and biogas production with 40% provided by extracting bio(chemicals).
• By 2035, Danish businesses could become technology frontrunners in by-prod-uct (waste) valorisation in cascading bio-refineries, using by then mature ad-vanced technologies for high-value extraction of biochemicals and nutraceuti-cals. By this time an estimated 90% of the waste streams could be processed in new applications, and 60% of the total value added could come from extracting bio(chemicals), with 40% coming from producing biofuel and biogas (either di-rectly or by the cascading of material streams from higher-value applications).
By assuming a relatively conservative estimate of additional value extraction from existing waste and by-product streams, the impact assessment suggests that cascading bio-refineries could create an annual value of EUR 300–500 million136 in Denmark by 2035. This estimate builds on the work of The Netherlands Organisation for Applied Scientific Research (TNO), which has mapped the potential value increase of 34 organic waste and by-product streams that could be achieved by up-cycling to higher-value applications, and estimated that up to 25–30% additional value. 137 These estimates have been applied to the Danish context with input from industry experts and Denmark-specific data. The findings give a directional view of the magnitude of this opportunity for Denmark. They rely by necessity on a number of assumptions, the most important of which are detailed in Appendix B.
DENMARK IS WELL POSITIONED TO CAPTURE THE OPPORTUNITY
Denmark would be well positioned to develop and expand to such next-generation cascading bio-refineries. With a large agriculture and food processing industry, it has significant access to feedstock. Denmark has a leading position in biotechnological research and innovation, both in academia and in companies such as Novozymes, Chr. Hansen and Daka. It was pointed out in interviews with academics and industry representatives that the biochemical technologies needed to unlock significantly larger value are only about five years from maturity, but investments are needed to take them from the lab to the market: numerous technologies are also already available, but due to a fragmented market nobody has yet connected the dots to create more integrated bio-refining systems.
There is already a focus on this new ‘bioeconomy’ in Denmark, and the government has appointed The National Bioeconomy Panel, which consists of experts from academia, industry and public bodies, to evaluate strategic options. In March 2015, the panel published a recommendation to support second-generation biofuel generation by introducing a 2.5% mixing requirement in petrol, and to support the use of yellow biomass138 to produce biochemicals, biomaterials and biofuels through public
136 This sector-specific impact does not include indirect effects, e.g. on supply chains, captured in the econo-my-wide CGE modelling.
137 The Netherlands Organisation for Applied Research, Opportunities for a circular economy in the Netherlands (2013). It was estimated that new valorisation technologies could generate an additional EUR 1 billion annual-ly in the Netherlands, compared to the current value of waste streams of EUR 3.5 billion.
138 Yellow biomass includes straw, haulm and dry crop residues.

106 • DELIVERING THE CIRCULAR ECONOMY – A TOOLKIT FOR POLICYMAKERS
procurement, increased research funding or other economic support.139 The construction of a second-generation bioethanol plant in Maabjerg (The ‘Maabjerg Energy Concept’ or MEC plant), projected to come online in January 2016, further illustrates that there is a willingness to invest from both private and public stakeholders.140
While the increased valorisation of existing waste and by-products is the focus of this analysis, there are several other ways to derive additional value in the bioeconomy. As highlighted during an interview by Mads Helleberg Dorff Christiansen from the Danish Agriculture & Food Council, there is large potential to continue the optimisation of input factors, such as crops with higher resilience and yield, improved livestock breeding, elimination of fertiliser leakage, and better feed. Another option is to deliberately modify plants to produce more auxiliary biomass to be used in bio-refineries. According to a study from the University of Copenhagen, it would be possible to produce an additional 10 million tonnes of biomass without significantly altering regular land use or output from agriculture and forestry sectors.141 The report claims that products worth between EUR 1.9 and 3.5 billion could be generated from processing this biomass (mainly for fuel), while generating 12,000 to 21,000 new jobs.
BARRIERS AND POTENTIAL POLICY OPTIONS
The following paragraphs provide an initial perspective on the barriers limiting the ‘value capture in cascading bio-refineries’ opportunity (see Section 2.2.4 for the barriers framework). Although there were some variations in emphasis from the sector experts interviewed in the course of this study, the central message was clear: the largest barriers preventing an acceleration of next-generation bio-refineries are technology and capital. The full value of organic waste and by-products cannot be extracted unless emerging technologies are supported to reach beyond R&D stage to commercial deployment. This study did not encounter any bio-refineries that use microbial or enzymatic processes to produce bio-based materials such as plastics at industrial scale, indicating that such technology is still at the development stage. Building an efficient bio-refinery operation is also capital intensive. The financing of the MEC plant at EUR 300 million would – if they were to take it on alone – represent 9–12% of the balance sheet of leading companies in the sector. Payback depends partially on the ability to use current technologies (such as bioethanol and biogas) as platforms, and then add to the biochemical cascade more advanced technologies when they become commercially viable. While the revenue streams from the high-value, low-volume products such as nutraceuticals combined with bulk biofuels or other chemicals could ensure profitability, the competitiveness of the products would be increased if the prices of alternatives derived from petro-based resources reflected their true costs (externalities).
Unintended consequences of existing regulations also stand in the way of the bio-refinery opportunity. It is important to keep in mind the complex and internationalised regulatory landscape for the food & beverage sector. Denmark, like other European member states, has only limited control over legislation governing raw material and product handling, as well as waste treatment, which is set at EU level. The most prominent example is the more extensive restrictions on animal by-products being rendered into animal feed, following the breakout of bovine spongiform encephalopathy (BSE) in the 1990s. This animal by-product legislation restricts some animal parts from being used in bio-refining. Several sector experts indicate that sometimes Denmark has chosen to implement this legislation more strictly than its peers.
While parts of the legislation governing food safety and waste treatment may have the unintended consequence of preventing advancement of new bio-refining operations, interviews indicate that in many cases it is more the complexity of the regulatory
139 The National Bioeconomy Panel, Anbefalinger: Det gule guld – halmressourcens uudnyttede potentiale (2015).
140 Adding to the existing 800,000–900,000 tonnes capacity to convert biomass into biogas, the new plant is expected to convert 300,000 tonnes of yellow biomass to 80 million litres of bioethanol. The total invest-ment of ~EUR 300 million comes from key industrial stakeholders such as DONG and Novozymes, but also from the EU (EUR 39 million) and Innovation Fund Denmark (EUR 40 million).
141 Gylling, M. et al., Department of Food and Resource Economics, University of Copenhagen, The + 10 million tonnes study: increasing the sustainable production of biomass for biorefineries (2013). The potential also includes better collection of biomass from farmland, road verges, waterweed and cover crops.

DELIVERING THE CIRCULAR ECONOMY – A TOOLKIT FOR POLICYMAKERS • 107
framework than the restrictions themselves that act as a barrier. The complexity creates uncertainty and imposes the significant administrative costs of understanding how to comply and going through the process of acquiring the required permits. It should therefore be noted that the regulatory situation in the case of each potential bio-refining value-generation opportunity needs to be investigated closely.
To address these barriers, the following policy options could be further investigated. They are the result of an initial assessment of how cost-effectively different policy options might overcome the identified barriers (see Section 2.3.3):
• As a starting point, including bio-refineries in the government’s long term strategic plans. This could guide and reassure investors—even more so if ac-companied by a policy package to deliver the strategy.142
• In the short term, providing capital to deploy commercial-scale versions of mature bio-refinery technologies. Promising policies include providing low-cost loans or loan guarantees for the deployment of mature bio-refining technologies for example through existing Danish business support schemes, and financing at market rates that is better tailored to investors’ needs (as provided for example by the UK Green Investment Bank in municipal energy efficiency). Public-private partnerships to finance the deployment of mature bio-refining technologies also hold promise. An interesting example is the Closed Looped Fund NY that pro-vides zero- or low-interest loans to municipalities or companies, albeit more ac-tive in developing recycling infrastructure.143
• In addition, creating markets for bio-refinery output. Pricing externalities, set-ting targets (e.g. a minimum target for second-generation fuels within the EU’s biofuels target) could contribute to such market development.
• In the longer term, stimulating development of advanced, high-value bio-re-fining technologies. The government could set up or fund cross-institutional R&D clusters to accelerate the move into high-value chemicals, nutraceuticals, pharmaceuticals etc. These could take on various forms, like the UK Catapults, a powerful example of public private partnerships in R&D, or the German Fraun-hofer Institute, which plays an important role in European innovation with its long-term perspective and clearly defined mission to support application orient-ed research 144
• Complementing these measures with a business advice service. The primary goal would be to help bio-refinery entrepreneurs navigate a relatively complex regulatory and policy environment, but it might also help the bio-refinery com-munity shape this environment.
• Identifying and communicating necessary changes to EU policy (or its na-tional implementation) to address the unintended consequences of some safe-ty-focused regulations that unnecessarily restrict the trade in bio-refinery feed-stock or products.
142 In the G7 Germany, the USA and Japan have specific national bioeconomy strategies with targets. While France, the UK, Italy and Canada do not have a dedicated strategies they provide support for the biobased economy on the ground. Though some of these strategies and other programmes provide specific support to biorefineries, none places cascading bio-refining at their core. For more detail, see German Bioeconomy Council, Bioeconomy Policy: Synopsis and Analysis of Strategies in the G7 (2012).
143 www.closedloopfund.com/about/
144 UK Catapults: See e.g. www.catapult.org.uk/; Fraunhofer Institute: See e.g. www.fraunhofer.de/en/publica-tions/fraunhofer-annual-report.html

108 • DELIVERING THE CIRCULAR ECONOMY – A TOOLKIT FOR POLICYMAKERS
3.2.2 Reduction of avoidable food waste
Opportunity: Reduce avoidable food waste by building awareness and knowledge for consumers, leveraging technology and best practices for businesses, and creating markets for second-tier (refused) food.
2035 economic potential:
EUR 150-250 million p.a.
Key barriers: Consumer custom and habit; business capabilities and skills; imperfect information; split incentives.
Sample policy options:
Consumer information and education; quantitative food waste targets; capability building; fiscal incentives.
A significant opportunity lies in preventing the very generation of organic waste.145 On average, 35% of food output is wasted along the value chain, and while developed economies like Denmark are comparatively good at reducing waste in food processing, there is a high waste volume generated by end consumers (see Figure 29). Denmark generates an estimated 80–90 kg/capita of avoidable food waste per year.146
Figure 29: Main sources of food waste in global food value chain – production and consumption
SOURCE: FAO ‘Global Food Losses and Food Waste – Extent, causes and prevention’, Rome 2011; adapted from Ellen MacArthur Foundation, Towards the circular economy II (2013)
Focus of Denmark Pilot Material waste
Per cent of total productionDeveloped countries
Agriculture
Processing
Retail
9
9
4
126 2803 0006 9
Consumer
91
73
68
91
82
78
For this reason, the opportunity assessment for avoiding waste in the food and beverage sector focuses on the end-consumer-facing part of the value chain (including retail
145 Known as the ‘Lansink’s ladder’, the principle – to avoid waste over reuse, reuse over recycle, recycle over energy recovery, and energy recovery over disposal – has been part of the European Waste Framework Di-rective since 2008.
146 Danish Environmental Protection Agency, Kortlægning af dagsrenovation i Danmark – Med fokus på etage-boliger og madspild (2014).

DELIVERING THE CIRCULAR ECONOMY – A TOOLKIT FOR POLICYMAKERS • 109
and hospitality).147 The awareness of this issue has increased rapidly over the past five years, and waste minimisation is now an integral part of the government’s ‘Denmark Without Waste’ strategy.148 There have already been multiple information and awareness campaigns to reduce food waste among consumers, but much remains to be done.
The Danish EPA has estimated that 56% of the food waste generated by households, and 79% on average in the retail and hospitality sectors, is avoidable.149 Danish households generate approximately 55% of the avoidable food waste,150 and even if the value lost from discarded food is significant,151 customers have a tendency to choose convenient solutions. While businesses have spent a long time minimising food waste, there is still large potential for improvement.
THE OPPORTUNITY FOR DENMARK
Consumers and businesses could save significant value by minimising avoidable food waste. A study by SITRA in Finland found that the savings from reducing food waste would be in the range of EUR 150–200 million annually.152 Translated to the size of the Danish economy, this corresponds to a prevention of roughly 30–50% (30–40 kg/capita) of total avoidable food waste,153 and an estimated saving of EUR 150–250 million annually by 2035.154 These findings give a directional view of the magnitude of this opportunity for Denmark. They rely by necessity on a number of assumptions, the most important of which are detailed in Appendix B. The savings would be achieved by a number of activities, including:
• Right-sizing the shopping basket. Consumers could prevent waste by pur-chasing less unnecessary ‘big packs’ or ‘3 for 2’ deals, which would seem to save money upfront but could create more waste. A related issue is the practice of paying per unit for fresh produce (the current practice in Denmark, as opposed to paying by weight), which incentivises the consumer to buy the largest item – generating waste both on the consumer side (consumers buy a larger item than they need), and further back in the value chain, as smaller items could get deselected or even wasted without being sold155. Restaurants could avoid excess purchases by relentless data tracking and planning, which would require invest-ing in capability building but would not necessarily make procurement more time consuming.
• Better knowledge about food preservation. Despite not seeing themselves as ‘food wasters’156, consumers often throw away useful food, either because they prepare too much for a meal, or because they believe the food is spoiled. Date labelling is required on packaged food to protect consumers, but many people throw away food that has passed the date even though it has been well refriger-ated or appropriately stored and remains fresh, due to lack of knowledge of what the labelling actually means. This behaviour also affects food retailers, as they
147 While Danish food processing companies are generally regarded as proficient in preventing waste, the Danish Environmental Protection Agency notes that there are still losses from agriculture. Waste prevention in the agricultural sector was not however in the scope of the Denmark pilot.
148 Danish Government, Danmark uden affald II. Strategi for affaldsforebygglese (2015).
149 Danish Environmental Protection Agency, Kortlægning af dagsrenovation i Danmark – Med fokus på etage-bol- iger og madspild (2014); Danish Environmental Protection Agency, Kortlægning af madaffald i servicese-ktor- en: Detaljhandel, restauranter og storkøkkener (2014).
150 Around 25% is generated by the retail sector and around 20% from the hospitality sector, based on data from Note 149.
151 A UK study estimated that the value of unconsumed food and drink amounted to USD 770 per household a year. WRAP, Waste arising in the supply of food and drink to households (2011).
152 SITRA, Assessing the circular economy potential for Finland (2015).
153 In comparison, WRAP has estimated that directed efforts in the UK have reduced consumer food waste by 15–80%. WRAP, Strategies to achieve economic and environmental gains by reducing food waste (2015).
154 This sector-specific impact does not include indirect effects, e.g. on supply chains, that are captured in the economy-wide CGE modelling.
155 Halloran, A. et al., Food Policy 49, Addressing food waste reduction in Denmark (2014).
156 Beck C. et al., FDB, Vallensbæk, Forbrugere: Vi smider ikke mad ud! (2011).

110 • DELIVERING THE CIRCULAR ECONOMY – A TOOLKIT FOR POLICYMAKERS
are forced to remove products approaching the ‘best before’ date. The EU has encouraged the discounted sale of such products since 2012 but market accep-tance is low. Better knowledge about the preservation of food and when it can be safely used could lead to significant waste volumes being avoided.
• Leveraging best practices. A range of methods exists to reduce the significant volume of food waste occurring in the grocery store and along the value chain. Best practices include using data-driven optimisation of ordering and pricing,157 and increasing shelf life by improving packaging techniques.158 In the hospitality sector, preventing leftover waste could be achieved by using data to optimise the size of servings and avoiding unnecessary volumes on buffets.
• Smart technology. ‘Intelligent packaging’, able to transmit information about the food contained within, is a packaging improvement that has been anticipat-ed for some time, and is now beginning to enter the market. In 2012 TetraPak launched a milk carton able to record the time spent at room temperature and change colour when too much exposure has been recorded. While indicators of time and temperature are only a proxy for real identification of changes in the content, packaging manufacturers are increasing by using chemical indicators for oxygen or carbon dioxide levels, as well as microbial activity.159
• Create markets for second-tier food. Grocers in developed economies such as Denmark are expected to present produce that is always fresh, plentiful and at-tractive, when in reality the size and appearance of produce always varies within a production batch. Although it is only a second-tier solution, supporting a mar-ket for this food, rather than discarding it, could significantly reduce waste pro-duced along the value chain. In addition, products going off the shelf when they approach their ‘best before’ date could be sold at a discount, donated, or used to produce cheap, ready-made meals.
BARRIERS AND POTENTIAL POLICY OPTIONS
The following paragraphs provide an initial perspective on the barriers limiting the ‘reduction in avoidable food waste’ opportunity (see Section 2.2.4 for the barriers framework). Custom and habit is the largest barrier limiting the reduction of avoidable food waste in Denmark. Interviews with retail store managers confirm that consumers often reject food in stores with shorter use dates if longer dates are available, often reject ‘odd-looking’ produce, and are usually unaware of the level and impact/consequences of the food waste they generate. Food waste experts at the Danish Environmental Protection Agency indicate that a lack of capabilities and skills is also very important; there is insufficient knowledge and experience among the general public about how to buy, store, evaluate the freshness of, and prepare food in such a way that minimise waste and left-overs.
There are also market failures: consumers face imperfect information on the true freshness of food since they are often unaware of the difference between ‘best before’ and ‘use by’ dates and also underestimate the tolerances that producers/retailers put around these dates. There are also split incentives: retailers have an incentive to sell more food and use, for example, ‘3 for 2’ offers on fresh produce. Producers have an incentive to shorten ‘best before’ dates to reduce liability and encourage the consumption or disposal of their product as early as possible to increase turnover. The final market failure is of externalities: if the full environmental cost of agriculture and food production was reflected in food prices, the incentive to reduce waste would
157 International retailers like Tesco and CO-OP are already using big data to forecast local demand and adapt replenishment of fresh food. Planet Retail, The Challenge of Food Waste: Retailers step up to the next level of inventory management (September 2011).
158 For a more extensive analysis of waste prevention technologies in the food value chain, see Ellen MacArthur Foundation, Towards the Circular Economy II (2013). These activities have not been central to the circular economy opportunities assessed for Denmark as they are already advanced and assumed to continue devel-oping even without policy interventions.
159 Swedish National Food Agency, www.livsmedelsverket.se

DELIVERING THE CIRCULAR ECONOMY – A TOOLKIT FOR POLICYMAKERS • 111
increase.160 Any potential solution to this barrier would of course need to take into account distributional effects. There is finally the regulatory failure of poorly defined targets and objectives; for example, the ‘Denmark Without Waste’ strategy covers avoidable food waste, but does not contain quantified targets to reduce it.161
To address these barriers, the following policy options could be further investigated. These options are the result of an initial assessment of how cost-effectively different policy options might overcome the identified barriers (see Section 2.3.3):
• Informing and educating consumers using information campaigns on the im-portance of avoiding food waste; a communication campaign to educate con-sumers about best-before and use-by labelling; and augmenting the national school curriculum with knowledge about nutrition, food preservation, judging the freshness of food, seasonality, and appropriate ingredient and portion sizing.
• Creating the right framing conditions to avoid food waste in retail. This could include adjusting regulations so as not to discourage the donation of food due to liability concerns; encouraging such donations, as was recently voted into law in France or by setting up brokering platforms to facilitate matching donors and beneficiaries, and clarifying the information on best before dates for food and beverages to further facilitate such donations (as has happened in Bel-gium162)
• Stimulating the capability building through training programmes to ensure that procurement, retail and kitchen staff possesses the necessary skills and tools to minimize food waste.
• Introducing fiscal incentives such as variable charging schemes for house-hold waste. A small number of small- and mid-size Danish municipalities have implemented weight-based charging. Experiences in other countries show that fee-differentiated collection schemes are also feasible in larger cities with more multi-family buildings, and Switzerland has made such schemes mandatory in all municipalities.163
• Setting national or EU-level quantitative food waste targets. This would pro-vide overarching guidance to consumers and businesses on the government’s objectives, and would likely be a very useful complement to some of the other policies.
• Influencing other levels of policy-making, such as
o Informing and shaping EU marketing standards to avoid food waste arising as an unintended consequence of such regulations.
o Motivating supermarkets to reduce waste (e.g. shifting more fresh produce sales to weight-based models). League tables at local authority level have proven their value in shifting practices regarding other environmental/social challenges and could work here as long as it does not require sharing confidential data.
3.3 Construction & Real EstateIdentified as one of the sectors with the highest potential for circular
160 See for example, Nordic Council, Initiatives on prevention of food waste in the retail and wholesale trades (2011).
161 Danish Government, Denmark Without Waste I. Recycle more – incinerate less (2013), p.12.
162 Agence fédérale pour la Sécurité de la Chaîne alimentaire, Circulaire relative aux dispositions applicables aux banques alimentaires et associations caritatives (2013).
163 Ecotec, Financing and Incentive Schemes for Municipal Waste Management Case Studies – Final Report to Directorate General Environment, European Commission (2002).

112 • DELIVERING THE CIRCULAR ECONOMY – A TOOLKIT FOR POLICYMAKERS
economy at an early stage of the Denmark pilot, there are three main opportunities for the construction and real estate sector to become more circular. Industrialised production processes, modularisation and 3D printing could reduce both building times and structural waste if technology development continues and traditional industry habits are overcome. Reuse and high-quality recycling of building components and materials could reduce the need for new materials and decrease construction and demolition waste, if the split incentives created by a fragmented market are addressed. Sharing, multi-purposing and repurposing of buildings furthermore could reduce the demand for new buildings through better utilisation of existing floor space. Modelling suggests that the annual potential value unlocked by 2035 if these three opportunities are realised could amount to EUR 450–600 million, 100–150 million, and 300–450 million, respectively.
The European construction sector is fragmented, with many small firms, low labour productivity, and limited vertical integration along the value chain – especially in Denmark. There are different incentive structures for different players, and no systematic application of operational best practices, significant material waste and limited reuse of building components and materials.164 In addition, utilisation of existing floor space is low; only 35–40% of office space is utilised during working hours in Europe.165 The Danish construction sector has experienced slower productivity growth than leading peers (1% p.a. vs. 2% p.a. for e.g. Belgium and Austria between 1993 and 2007), and is also very fragmented.166 The Danish Productivity Commission has pointed out that there is a need to increase productivity, especially in the construction sector, in order to maintain competitiveness.167 The Danish government highlighted similar points in their building policy strategy, announced in November 2014.168
While none of these issues can be fixed with one silver bullet, the Danish construction and real estate industries could apply a few different approaches that together could transform the built environment:169
• Applying industrial production processes to reduce waste during construction and renovation, including modular construction of building components or, go-ing even one step further, 3D printing building modules.
• Expanding the reuse and high-quality recycling of building components and materials by applying design for disassembly techniques, material passports, innovative business models, and setting up a reverse logistics ecosystem.
• Increasing the utility of existing assets by unleashing the sharing economy (peer-to-peer renting, better urban planning), multi-purposing buildings such as schools, and repurposing buildings through the modular design of interior building components.
There are several other circular economy opportunities that could both unlock value and save resources in the construction sector. They were deprioritised in the present study primarily because in Denmark they are already the way to being realised (as for energy use optimisation), or because the level of detail required for a meaningful analysis was
164 Josephson, P.-E. & Saukkoriipi, L., Chalmers University of Technology, Waste in construction projects: call for a new approach (2007)
165 Josephson, P.-E. & Saukkoriipi, L., Chalmers University of Technology, Waste in construction projects: call for a new approach (2007).
166 According to Statistics Denmark, there were more than 2,000 enterprises with <50 employees in the con-struction sector in 2012, and fewer than 200 enterprises with 50+ employees.
167 Danish Productivity Commission, Slutrapport: Det handler om velstand og velfærd (2014).
168 Danish Ministry of Climate, Energy and Building, Towards a stronger construction sector in Denmark (2014).
169 The opportunity assessment builds on the ‘built environment’ deep dive in Ellen MacArthur Foundation, Stiftungsfonds für Umweltökonomie und Nachhaltigkeit (SUN) and McKinsey Center for Business and Envi-ronment, Growth Within: A Circular Economy Vision for a Competitive Europe (2015).
DELIVERING THE CIRCULAR ECONOMY – A TOOLKIT FOR POLICYMAKERS • 113
beyond the scope of this study (as for substitution of materials170). Below follows a (non-exhaustive) overview:
• Energy use optimisation. New buildings could be designed and constructed as low-energy houses that consume up to 90% less energy than existing building stock.171 Retrofitting old buildings could reduce their energy consumption by 20–30%.172 This opportunity has gained high priority in the EU: the European Energy Performance of Buildings Directive (EPBD) requires new buildings to be ‘nearly zero-energy’ by 2020. In Denmark this requirement is implemented through the building class 2020 in the building regulation. The class will be mandatory by 2020 at the latest.173 The Danish Energy Agency recently released a tool to calculate the total cost of buildings including their energy use, creating transparency and a clearer incentive for construction companies to build for optimisation of total cost of ownership (TCO) across the whole life cycle, not only construction costs.174
• Substituting materials, or facilitated separation of hazardous components. Substituting materials that are difficult to reuse and recycle, or make it difficult to reuse or recycle other materials, with non-toxic, renewable alternatives is an important part of making buildings more circular. Buildings traditionally contain a complex mixture of compounds that are often difficult to separate, making material reuse and recycling difficult. Working to reduce hazardous materials or additives, for example toxic additives in PVC175 – or at least making them easier to separate – is therefore crucial to enable better material recovery at a building’s end of use. Furthermore it would improve indoor air quality with improved pro-ductivity and health benefits for the users of the building.
3.3.1 Industrialised production and 3D printing of building modules
Opportunity: Use industrial manufacturing methods, modularisation and 3D printing to reduce time and cost of construction and renovation.
2035 economic potential:
EUR 450-600 million p.a.
Key barriers: Inadequately defined legal frameworks; immature technology; custom and habit and capabilities and skills in the industry.
Sample policy options:
Augmented building codes; support for module production facilities; legal framework for 3D printing materials.
170 Countries with high-performing material science or engineering programs may of course choose to draw upon relevant insights around material substitution into its visioning or assessment work.
171 The houses are low energy consumers because they use, for example, natural air circulation, better exposi-tion, and reinforced insulation to reduce energy requirements for space heating or cooling. Note that, from an LCA perspective, so called ‘passive houses’ could be more energy intense than conventional low-energy houses, and that the total embedded energy should be taken into account when optimising the energy use during construction and usage. See for example www.passivehouseacademy.com/index.php/news-blogs/what-is-passive-house; www.ecobuildingpulse.com/awards/ehda-grand-award-volkshouse_o
172 A case that has received much attention is the retrofit of the Empire State Building in New York. The project, guided by the Rocky Mountain Institute, saved the Empire State Building USD 17.3 million and reduced energy consumption by 38%. See www.rmi.org/retrofit_depot_get_connected_true_retrofit_stories##empire
173 Danish Government, Strategy for energy renovation of buildings: The route to energy-efficient buildings in tomorrow’s Denmark (2014).
174 Ulrik Andersen, Ingeniøren, Ny vejledning kan dræbe den faste anlægspris (14 April 2015).
175 See for example www.vinylplus.eu/; www.naturalstep.org/en/pvc#PVC:_An_Evaluation_using_The_Natu-ral_Step_Framework
114 • DELIVERING THE CIRCULAR ECONOMY – A TOOLKIT FOR POLICYMAKERS
THE OPPORTUNITY FOR DENMARK
Almost 75% of the average cost of a new house comes from the construction process.176 Importantly from a circular economy perspective, fragmented construction, maintenance and renovation processes – with multiple stakeholders, lack of full project oversight, and use of traditional on-site techniques – also lead to two sizable types of resource inefficiency:
• Large reliance on virgin, finite materials that are assembled manually on-site.
• 10–15% of materials are wasted on-site177 (through e.g. over-ordering, inadequate storage, theft and poor coordination between stakeholders).
There is an increasing number of cases to show that industrial, off-site production of modules for on-site assembly, coupled with increased coordination of all stakeholders in the construction value chain, might greatly reduce today’s construction waste and speed up the construction process considerably. As an example of this new approach, the Chinese builder Broad Group took only 6.5 months to build a 30-story hotel, of which only 15 days were spent actually erecting the building on-site. This was enabled by building each floor in 16x4 m modules, which were then assembled by ~200 workers. Total savings amounted to 10–30% vs. conventional construction.178 Building interiors could also be modularised at high net savings, as shown by Canadian manufacturer DIRTT (‘Doing It Right This Time’). DIRTT provides customisable, modular architectural interiors with standardised dimensions, which can be fitted in new buildings or within the envelopes of old buildings.179 Players with similar offerings in Europe are Alho, Huf Haus, Baühu, and Caledonian Modular.
A more extreme, but according to many industry experts viable, approach to industrialising and modularising building component manufacturing is 3D printing. Given its exponential technological growth curve over the past years, it is likely that 3D printing of building components will be technically and economically feasible in the near future. Chinese construction company WinSun has demonstrated the revolution 3D printing could bring to the construction sector by building full-size houses made out of only 3D-printed components. WinSun has claimed 80% labour savings and 30–60% material savings.180 Obviously, the material choice for 3D printing needs to be managed well to ensure positive environmental impact. WinSun has taken a promising approach by using a mixture of dry cement and construction waste, but it still needs to be verified that the long-term indoor quality of using this mixture can be secured, and that the construction waste does not contain hazardous materials that could leak into the environment. Before 3D printing of entire buildings is feasible at scale, the viability of producing smaller 3D construction modules for interior and exterior use is rapidly increasing. In a similar vein, Danish innovator Eentileen’s automated process cuts sustainably sourced plywood based on a digital blueprint and significantly reduces waste and emissions.181
By being an early adopter of these new building practices and techniques, Denmark could become a leader in making a step change in construction material productivity:
• By 2020, the construction sector could have adopted industrialised production processes for up to 5% of new buildings and major renovations, reducing waste
176 Josephson, P.-E. & Saukkoriipi, L., Chalmers University of Technology, Waste in construction projects: call for a new approach (2007).
177 Estimate, compiled from interviews with sector experts.
178 Ellen MacArthur Foundation, Stiftungsfonds für Umweltökonomie und Nachhaltigkeit (SUN) and McKinsey Center for Business and Environment, Growth Within: A Circular Economy Vision for a Competitive Europe (2015). See also www.archdaily.com/289496/
179 www.dirtt.net/
180 Ellen MacArthur Foundation, Stiftungsfonds für Umweltökonomie und Nachhaltigkeit (SUN) and McKinsey Center for Business and Environment, Growth Within: A Circular Economy Vision for a Competitive Europe (2015). See also www.yhbm.com/index.php?m=content&c=index&a=lists&catid=67
181 eentileen.dk/print

DELIVERING THE CIRCULAR ECONOMY – A TOOLKIT FOR POLICYMAKERS • 115
and generating up to 10% net material savings. While 3D printing is likely to re-main at a conceptual stage, it is reasonable to assume that approximately 2% of new building components could be 3D printed, for which around 25% material and 40% labour savings could be achieved.182
• By 2035, industrialised (non-3D printing) production of modular building com-ponents could have taken as much as 50% of the total market, leading to 15% material savings. 3D printing could grow to a sizable share of the market, ad-dressing up to 25% of all building components.
If these opportunities are captured, modelling suggests that industrialised production and 3D printing of modules could create an estimated annual value of EUR 450–600 (40–60) million by 2035 (2020).183 These findings give a directional view of the magnitude of this opportunity for Denmark. They rely by necessity on a number of assumptions, the most important of which are detailed in Appendix B.
BARRIERS AND POTENTIAL POLICY OPTIONS
The following paragraphs provide an initial perspective on the barriers limiting the ‘industrialised production and 3D printing of building modules’ opportunity (see Section 2.2.4 for the barriers framework). The critical barriers to unlocking this opportunity lie in the technology and legal framework around 3D printing. As discussed above, while the application of 3D-printing technology in construction has progressed significantly in recent years, it is still at the early commercial stage and would need further development to be economic at large scale, able to compete with more standard methods. The WinSun 3D-printed houses referred to above were completed in spring 2014 (ten individual houses) and in early 2015 (a five-storey house and a villa).184 Equally important is the lack of a strong legal framework to ensure that the technology has a positive impact, both in terms of environmental and technical performance and the health of occupants. According to industry and policy experts, it cannot become a widely trusted approach while it is still open to the use of any material, however non-circular or hazardous to the health of building occupants.
Experts in the industry were also of the opinion that important social barriers exist for both industrial production of modules and 3D printing. Many players in the construction industry are unwilling to change long-established operational practices, such as rigid business models and extensive subcontracting, resulting in fragmented (over-specialised) knowledge and capabilities. While this factor will to some extent be relevant in any industry, consultation with experts indicated that the construction industry is particularly bound by more traditional practices. On the consumer side homebuyers may also be unwilling to trust non-traditional building approaches. The capital intensity of the industrial facilities in which to produce modules would be a challenge for the industry in Denmark, as it is made up by a large number of SMEs.
To address these barriers, the following policy options could be further investigated. These options are the result of an initial assessment of how cost-effectively different policy options might overcome the identified barriers (see Section 2.3.3):
• Complementing building codes with circularity ratings and targets:
o Ratings indicating the circularity potential of materials and construction techniques.
o Circular economy targets that set minimum requirements using a scoring mechanism. Denmark and the UK have already introduced
182 Estimated by taking half of WinSun’s reported savings, since there is still very little data to exemplify cost savings. Actual savings will vary on a case-by-case basis and be dependent on the size and complexity of components being 3D printed.
183 This sector-specific impact does not include indirect effects, e.g. on supply chains, that are captured in the economy-wide CGE modelling.
184 Michelle Starr in CNET, World’s first 3D-printed apartment building constructed in China (20 January 2015).

116 • DELIVERING THE CIRCULAR ECONOMY – A TOOLKIT FOR POLICYMAKERS
energy efficiency and carbon ratings. This could be deployed to stimulate circularity, for example with energy standards that incorporate carbon/kWh scores for both the energy embedded in the materials and that used during operations—with recycled materials scoring considerably better than virgin ones.
o If targets are set, it is important that technology neutrality is maintained and the government is not prescribing the technologies, materials, or techniques to be used. In general, interventions along these lines would be expected to be most effective if introduced gradually, for example with gradually increasing standards as has been the case for energy efficiency within the Danish building regulations. In addition, these interventions would likely have impact across the three circular economy opportunities in the sector.
• Supporting module production facilities. The government might choose to play a role in motivating the financial industry to move into this area as such pro-duction facilities can yield good returns. If this is not an option or does not yield results at the desired scale or speed, low-cost government loans could also start addressing the access to capital barrier. If concessionary financing is undesirable, government agencies might provide loans at market rates that have been de-signed to meet the complex financing needs of nascent industries. For example, the UK Green Investment Bank has recently developed innovative loan products that are tailored to the specific needs of companies and local authorities wishing to make investment in energy efficiency improvements, which is a similarly im-mature market.
• Creating legal framework for 3D printing materials. Regulating input materi-als for 3D printing is necessary to realise the full potential of the technology. The timing is right to work on this, as the 3D printing industry is still young and sup-ply chains are not yet mature and locked in. Given its complexity, developing this internationally—at the EU level or beyond—would make most sense. Along with material policies there is also a need for safety, quality, and environmental stan-dards for the processes and technologies themselves.
• Bringing together all stakeholders in the construction value chain to work on systemic solutions to address the lack of skills and established norms that stand in the way of industrialising production. This could take the form of an indus-try-wide partnership focused on knowledge sharing and collaboration, a project with specific short-term objectives, or a private public partnership.
• Supporting R&D. Funding programmes to develop and bring to commercial scale new techniques in the 3D printing of building components and explore technological synergies between component printing and the on-going digitisa-tion of construction. A technology challenge prize (as for example promoted by Nesta in the UK185) could also be considered.
• Launching public procurement pilots. Such pilots could serve a triple purpose: demonstrate the viability and benefits of existing circular materials and construc-tion techniques, stimulate the development of new materials and techniques (design competitions offer an alternative), and develop the necessary guidance and procedures for procurement teams to be able to accommodate such new or unfamiliar elements (e.g. adjustments to the typical pre-construction dialogues).
• Funding for industry training programmes tailored to the various actors along the construction value chain (architects, engineers, entrepreneurs, construction workers, etc.) covering off-site production and on-site assembly of components as well as 3D printing techniques.
185 www.nesta.org.uk/project/big-green-challenge

DELIVERING THE CIRCULAR ECONOMY – A TOOLKIT FOR POLICYMAKERS • 117
3.3.2 Reuse and high-value recycling of components and materials
Opportunity: Tighter ‘looping’ of building components through either reuse or high-quality recycling, enabled by, e.g. design for disassembly and new business models.
2035 economic potential:
EUR 100-150 million p.a.
Key barriers: Split incentives and lack of information across the construction value chain; custom and habit; capabilities and skills.
Sample policy options:
Augmented building codes; industry-wide training programmes; support for material inventory software.
THE OPPORTUNITY FOR DENMARK
As in other Danish industrial sectors, the construction industry has achieved very high industrial recycling rates, especially of valuable materials such as steel and other metals. The overall recycling rate is 87%, but like in most markets the reuse of building components (such as wall or floor segments) and lower-value materials (such as bricks) is very limited. Three characteristics of the construction sector could help explain this situation:
• Strong safety concerns and a tightly regulated sector, leading to uncertainties about both performance and health issues of reused or recycled materials and components.
• A fragmented value chain, with different incentives for initial investors, archi-tects/engineers, (sub)contractors, owners and tenants, leading to limited uptake of circular design. The fragmentation also makes it hard for new practices to gain traction, such as deconstruction rather than demolition, which would salvage more useful components and materials for reuse and high-value recycling.
• Long-lived construction objects, meaning that those facing demolition or renova-tion today were not designed with reuse of materials or components in mind.
Fortunately, there are a number of innovative design and operations examples on how to enable increased looping of components:
• Design for disassembly and reuse of components and materials. The ‘tight-est’ loop for building components would be to design for non-destructive dis-assembly and full reuse of building components in new projects.186 Although not a new idea – the British Pavilion in the 1992 Seville Expo being one example187 – there are still few buildings designed for disassembly (and reuse). Turntoo, the Dutch company founded by architect Thomas Rau, has led the work of retrofit-ting the Brummen Town Hall in the Netherlands, where the architects worked together with the material suppliers to establish performance contracts where the suppliers retained ownership of the materials.188 The renovated town hall, completed in 2013, is designed for disassembly and has an attached materi-als passport to fully track the building’s material assets. In the same vein, the C2C-designed Park 20/20 office complex, developed in the Netherlands by Delta Development, is being built for disassembly and incorporates asset tracking for future reuse.189 Design for disassembly could also include design regular review
186 Cl:aire, Subr:im Bulletin 05, Avoiding Future Brownfield Sites through Design for Deconstruction and the Reuse of Building Components (November 2007).
187 www.steelconstruction.info/Recycling_and_reuse#What_is_recycling_and_reuse.3F
188 turntoo.com/en/projecten/town-hall-brummen/
189 See www.park2020.com/; urbanland.uli.org/sustainability/park-2020-amsterdam-born-recycled/. The office park is expected to be completed by 2017.

118 • DELIVERING THE CIRCULAR ECONOMY – A TOOLKIT FOR POLICYMAKERS
and upgrade, which would enable the use of some materials with a lower envi-ronmental footprint, e.g. glulam beams as load-bearing construction elements.
• Use of recycled materials. Even though few buildings today have been con-structed with deconstruction and reuse in mind, it is possible to recover signif-icant quantities construction materials and use them for new buildings. The US EPA’s buildings One and Two Potomac Yard in Arlington, VA, were built using 27% recycled content – including slag concrete aggregate, fly ash, and gypsum wallboard.190 Examples of companies including recycled industrial materials in their products are insulation manufacturer Rockwool191 as well as DIRTT192 (see above). A relevant case example from Denmark is the ‘Upcycle house’, built us-ing processed recycled materials and reducing the overall CO2 emissions by 86% compared to the building of a benchmark house.193 As the reuse of components and recycling of materials proliferates and a new reverse cycle ecosystem emerg-es, a market will emerge for material ‘brokers’ connecting suppliers with buyers, as with the Scottish Material Brokearge Service194. There are two challenges to be overcome when reusing/recycling materials from existing buildings: the chal-lenge of hazardous chemicals (including those no longer permitted in building materials today); and the technical performance of components/materials not designed for reuse/recycling.195
• New business models. The examples above introduce the concept of perfor-mance contracts in the real estate sector: the property owner does not neces-sarily own all materials and systems in the building and might instead buy utility (e.g. lux-hours instead of light fixtures).
• Deconstruction. In Japan, Taisei Corporation has demonstrated that deconstruc-tion is possible even for tall buildings such as The Grand Prince Hotel Akasaka. A Taisei-developed approach deconstructed the 141-meter building from the top down, reducing carbon emissions of the deconstruction process by 85%.196
Employing these best practices in the construction and real estate sector, Denmark could increasingly use recovered building components and materials in more valuable cycles than downgrading recycling. Examples of value retention already exist; Skive municipality runs a project to improve the reuse of old construction components by incorporating new targets in the municipality’s 2015–24 waste management strategy and creating an environment for new business models centred on material looping,197 and The Fund for Green Business Development has funded a partnership where innovative public procurement is used to increase the reuse of building components and materials in new public building projects.198 In addition, the Danish Eco-Innovation Program funds a number of project around, among others, using more reusable and recyclable materials in buildings.199
190 US Environmental Protection Agency, Using Recycled Industrial Materials in Buildings (2008).
191 sustainability.rockwool.com/environment/recycling/
192 www.dirtt.net/leed/_docs/DIRTT-MaterialsAndProduction_v1-2.pdf. DIRTT pledges to add more recycled content into their materials every year.
193 The Upcycle House was built In collaboration between Realdania Byg and Lendager Architects. www.archdai-ly.com/458245/upcycle-house-lendager-arkitekter/
194 The Scottish Material Brokerage Service began operating in January 2015. Its aims are twofold: (i) to deliver collaborative contracts for waste and recyclable materials from Scottish local authorities and other public bodies of sufficient scale to help them achieve better value for money, and reduce risk from price volatility; (ii) to create the business conditions for investment in domestic reprocessing by providing certainty in the volume and duration of supply of valuable materials. See www.zerowastescotland.org.uk/brokerage
195 These challenges are currently investigated under the Danish Government’s strategy for construction. Danish Ministry of Climate, Energy and Building, Towards a stronger construction sector in Denmark (2014).
196 See for example www.wired.co.uk/news/archive/2013-01/15/japan-eco-demolition; www.taisei.co.jp/english/ csr/hinsitu/jirei_hinsitu.html. No information was found on the potential for reuse of the deconstructed build-ing components.
197 Skive municipality, Afslutningsrapport Projekt Genbyg Skive (2015).
198 groenomstilling.erhvervsstyrelsen.dk/cases/962460
199 ecoinnovation.dk/mudp-indsats-og-tilskud/miljoetemaer-udfordringer-og-teknologiske-muligheder/%C3%B-8kologisk-og-baeredygtigt-byggeri/tilskudsprojekter/

DELIVERING THE CIRCULAR ECONOMY – A TOOLKIT FOR POLICYMAKERS • 119
Designing for disassembly could be enabled by better coordination and alignment of incentives across the value chain. Digital material passports (already introduced in Denmark by Maersk as described in Section 3.1) and leasing could become the new norm, driven by a change in business models and emergence of material brokers who link material supply and demand in the reverse supply chain. By 2035 (2020), looping of materials could be increased to 15% (5%) by weight, resulting in 30% material cost savings (adding 5% additional labour cost). At this adoption rate, modelling suggests the construction sector could save EUR 100–150 million annually.200 These findings give a directional view of the magnitude of this opportunity for Denmark. They rely by necessity on a number of assumptions, the most important of which are detailed in Appendix B.
BARRIERS AND POTENTIAL POLICY OPTIONS
The following paragraphs provide an initial perspective on the barriers limiting the ‘re-use and high-value recycling of components and materials’ opportunity (see Section 2.2.4 for the barriers framework). A wide range of barriers prevent increasing rates of component and material reuse in the construction sector. Chief among them is the structure of the industry itself, which leads to split incentives along the value chain. There is limited vertical integration and each player – including the investor, architect, developer, engineer, (sub)contractor, owner and tenant – naturally maximizes their own profits at the expense of the others. Since designing for circularity requires some alignment of incentives to close the loop in the value chain, not having such incentives makes the economic case for reuse difficult to make. The fragmentation of the industry also leads to the barriers of transaction costs and imperfect information: the flow of information and resources necessary to provide a system of design for disassembly and reverse logistics is difficult to achieve. Digital information on the materials used in component production that would be very helpful at the point of refurbishment or demolition is lacking or unevenly distributed: while Building Information Modelling approaches are developing, they are not yet in widespread use.201
While buildings can already be designed for disassembly, additional technological progress in the production of circular, separable materials and components could accelerate the concept’s applicability. Acceptance of such technological advances in the industry could be aided by demonstration that new materials/components meet required technical specifications and are as practical to work with as those that they replace. It would also be helpful if the true environmental costs of using virgin, finite materials were reflected in their market prices. Finally there are inertia factors – pointed out by a range of industry experts – in the construction industry in the form of customs and habits and a lack of the requisite capabilities and skills that make reuse difficult to implement.
To address these barriers, the following policy options could be further investigated. These options are the result of an initial assessment of how cost-effectively different policy options might overcome the identified barriers (see Section 2.3.3):
• Complementing building codes with ratings and targets as laid out in Section 3.3.1.
• Funding industry-wide training programmes how to develop loops in con-struction, such as minimising and sorting construction waste targeting actors along the entire value chain (i.e. everybody from architects to sub-contractors working on the ground).
• Supporting the creation of material inventory software to keep track of the materials used in construction, maintenance, and renovation projects from start to finish and provide information on their lifetime impacts and opportunities for
200 This sector-specific impact does not include indirect effects, e.g. on supply chains, that are captured in the economy-wide CGE modelling.
201 UK Government, Building Information Modelling (2012).

120 • DELIVERING THE CIRCULAR ECONOMY – A TOOLKIT FOR POLICYMAKERS
looping. Such support could come in the form of a publicly funded design com-petition.
• Creating a ‘positive materials list’. A comprehensive database of construction materials that are favourable for circular design could help inform, educate, and inspire developers, architects, and clients alike. The initiative could define the criteria a material has to meet to get on the list and create an initial set of ma-terials. It could also be expanded with commercially available branded products – it would require the initiative to define a simple application process through which companies can submit their products, and set up a review board. Such a list could then be taken over at the EU level, so as to inform other member states and create more consistency for companies in the industry.
• Adjusting public procurement practices. This would allow for more public con-struction projects with higher resource efficiency by encouraging technological standards that facilitate later repair, remanufacturing, or reuse (e.g. in lighting or heating, ventilation and air conditioning); use of recycled or reused materials and components; procurement of decommissioning services that focus on value preservation; or mandating the inclusion of performance models or Total Cost of Ownership (TCO) metrics. As a first step, an advisory mechanism on circular public procurement practices could be set up. This could be complemented with training programmes for public procurement teams. At a later stage the actual procurement rules themselves might be adjusted.
3.3.3 Sharing and multi-purposing of buildings
Opportunity: Increase utility of existing buildings through sharing, multi-purposing and repurposing.
2035 economic potential:
EUR 300-450 million p.a.
Key barriers: Inadequately defined legal frameworks; unintended consequences of existing regulations.
Sample policy options:
Clarifying the legislation; financial incentives or support; municipal access portals.
THE OPPORTUNITY FOR DENMARK
There is an increasing awareness that most buildings are under-utilised – 60–65% of European office space is under-utilised even during working hours. Similarly, roughly half of owner-occupied homes are ‘under-occupied’, with at least two bedrooms more than needed.202 These figures suggest a massive structural waste that could be reduced by increasing the ‘utility’ of the floor space.
Airbnb has done just that. Launching its peer-to-peer platform for housing space in 2008, Airbnb’s booking rates has grown by 80–90% in the last few years and is expected to overtake worldwide hotel listings in four to five years.203 In May 2015, Airbnb had approximately 15,000 listings in Denmark. Meanwhile, a number of not-for-profit communities for sharing living space are growing rapidly, such as Hoffice204 and Couchsurfing.205
202 No data available for Denmark; UK survey taken as proxy. UK Department for Communities and Local Gov-ernments, English Housing study. Headline report 2012–13 (2014).
203 www.airbnb.com; www.venturebeat.com
204 www.bloomberg.com/news/articles/2015-02-19/hoffice-co-working-puts-freelancers-in-each-other-s-homes; hoffice.nu/en/. The concept can be seen as a hybrid in floor-space sharing, where higher utilisation of living space leads to a reduced demand for office space.
205 www.couchsurfing.com/.
DELIVERING THE CIRCULAR ECONOMY – A TOOLKIT FOR POLICYMAKERS • 121
In a time of rapid digitisation, it is not difficult to imagine a more virtualised and shared office environment. Since office spaces are already under-utilised, business could rethink the role of the office as central but temporary place for colleagues to meet while spending a significant share of their time working remotely. This would entail increased desk sharing and reduced need for floor space. Another option is to temporarily rent out unused space, an idea Liquidspace capitalises on by connecting people in need of desks or conference rooms with nearby suppliers, much like an Airbnb for office space.206
Businesses are very aware of the potential cost savings from reducing office space. In a 2012 survey, over 70% of 500 corporate executives indicated that the gross square foot per person in their organisations would drop to a point that is more than 55% below the current industry average.207 Two major technology companies, IBM and Cisco, have gradually increased the staff-to-desk ratio by encouraging teleworking, saving EUR 100–250 million a year.208 A Scandinavian example is Microsoft Sweden, who reduced their office space by 27%, while still adding 1,500 additional seats.209
Increased repurposing of existing floor space would make it possible to better utilise old buildings and change the use of freed-up office space to, e.g. residential housing, in a cost-efficient way and reduce the need for demolition and renovation. This is particularly relevant since ~80% of Europeans live in buildings that are at least 30 years old, which risk slipping into costly obsolescence as changing lifestyles and shifting demographics and age distribution drive construction of new buildings.210 The repurposing concept of companies like DIRTT – with interior building components that are modular and standardised – allows for maximum efficiency in changing the use of a building.
Complementary to repurposing, which changes the sequential use of a building, public buildings could be multi-purposed for parallel use of the floor space, meaning that different activities can take place during a short and repetitive time cycle. Making better use of schools or libraries for evening activities (e.g. classes and cultural events) is probably the most accessible example – such multi-purposing is indeed extensively implemented in Denmark. A more advanced practice would be to design more multi-purposed buildings. This is already common practice for sports, cultural and conference venues, but could in principle be implemented for smaller buildings as well. Public spaces could be designed for both multi-purpose use and gradual repurposing to optimise their economic value; an interesting example is the Boston Convention & Exhibition Center whose parking structure has been designed to be gradually transformed into retail and residential space.211 So could office spaces; an example is the Park 20/20 mentioned in Section 3.3.2, designed with shared and multi-purposed spaces for meetings, videoconference and other functions.
By 2035, Danish companies could be expected to reduce their need for office space due to shared desk policies and increased teleworking, which together with multi-purposing of public buildings, repurposing of old buildings and freed-up office space, and the accelerating sharing of residential floor space could increase the overall utilisation of buildings by 60% (20%) by 2035 (2020). This could lead to a reduced demand for new buildings by 9–10% (3–4%) by 2035 (2020), saving the Danish economy an estimated EUR 300–450 million.212 These findings give a directional view of the magnitude of this opportunity for Denmark. They rely by necessity on a number of assumptions, the most important of which are detailed in Appendix B.
206 liquidspace.com/. Liquidspace has also partnered with Marriott to provide conference rooms and other func-tions, thereby increasing traffic to the hotels.
207 Cushman & Wakefield, Office space across the world (2013).
208 GSA Office of Government-wide Policy, Workspace utilisation and allocation benchmark (2011).
209 vasakronan.se/artikel/det-digitala-arbetslivet-ar-har
210 architecturemps.com/seville
211 Franconi, E. & Bridgeland, B. Rocky Mountain Institute, presentation at Re:Thinking progress conference, Circular Business Opportunities for the Built Environment (14 April 2015).
212 This sector-specific impact does not include indirect effects, e.g. on supply chains, that are captured in the economy-wide CGE modelling.

122 • DELIVERING THE CIRCULAR ECONOMY – A TOOLKIT FOR POLICYMAKERS
BARRIERS AND POTENTIAL POLICY OPTIONS
The following paragraphs provide an initial perspective on the barriers limiting the ‘sharing and multi-purposing of buildings’ opportunity (see Section 2.2.4 for the barriers framework). The principal barriers to increasing the sharing and multi-purposing of buildings are regulatory. There are the inadequately defined legal frameworks, as well as unintended consequences of existing regulations, for example:
• Contractual restrictions on tenants/owners to their sub-letting of houses or flats for short periods; for example in New York State it is illegal to rent out an apart-ment for a period shorter than 30 days if a permanent resident of the apartment is not present.213
• Uncertain compliance with other regulations; for example in Chicago, Airbnb has begun to collect city hotel taxes from its hosts, but hotel associations still claim they are not paying all taxes that hotels are obliged to pay.214
• When sharing is allowed it might be under-regulated; there is for example con-cern in Los Angeles that Airbnb is starting to turn residential areas into ‘hotel areas’, potentially competing with local residents for accommodation.215
Denmark has partially addressed the lack of clear legal frameworks – it is currently possible to sub-let apartments on Airbnb or similar sites for six weeks per year before asking the local municipality for a permit. There are however several uncertainties to address; a sector expert notes that the housing and office rental sector is highly regulated, but that this existing legislation has not yet been fully adapted to account for the concepts of sharing.
When it comes to market failures it is often not cost effective for building owners and tenants to spend the time finding other individuals or organisations with which to share their buildings. Factors exacerbating these transaction costs are the efforts and costs involved in changing building insurance, handling security issues and the need for changes to the building (e.g. locks). Furthermore, while some sharing platforms have been successful, there might still be an inherent resistance in the public to changing habits around the sharing of their own homes, and some businesses have deeply rooted norms and traditions around the use of offices. Recent research216 has confirmed the results of a study made by The Industrial Society’s research from 2002217: that there are limits to the attractiveness of shared office space to employees and that individual space such as a desk or a workstation is still highly valued.
To address these barriers, the following policy options could be further investigated. These options are the result of an initial assessment of how cost-effectively different policy options might overcome the identified barriers (see Section 2.3.3):
• Clarifying the legislation governing (participants in) sub-letting residential and office space, and sharing business platforms (like Airbnb and Liquidspace) by de-fining unambiguously who is entitled to practice it (private tenants, commercial players) and which regulation they need to follow. Doing so could lower the risks perceived by individuals and companies wanting to engage in such transactions.
• Creating financial incentives or financial support to local, regional and na-tional public-sector entities such as schools and other public infrastructure could help overcome hesitance towards renting out their properties when not in use (without distorting competition), and possibly remove some practical barriers such as locks that need to be added or changed. This could also have demon-
213 James Surowiecki in The New Yorker, Airbnb’s New York Problem (8 October 2013).
214 Crain’s Chicago Business, Hotels to Airbnb hosts: Pay up (14 February 2015).
215 LA Times, Airbnb and other short-term rentals worsen housing shortage, critics say (11 March 2015)
216 Naomi Shragai, Financial Times, Why building psychological walls has become a key skill at work, (29 April 2015).
217 The Industrial Society, The state of the office: The politics and geography of working space (2002).

DELIVERING THE CIRCULAR ECONOMY – A TOOLKIT FOR POLICYMAKERS • 123
stration effects for private owners, facility managers in industrial and commercial real estate, and landlords.
• Setting up municipal access portals that provide information on public build-ing availability and matches users with providers. This could start out with public buildings; private spaces could be added later, for instance in case a territory is too small or not sufficiently densely populated to warrant a commercial interme-diary.
3.4 MachineryThe potential for Danish businesses to engage in remanufacturing and refurbishment is significant. Since this opportunity requires the development of new capabilities, business models and technologies, capturing it could take time, but by 2035, modelling suggests these practices could create an estimated potential net value of EUR 150–250 million annually.
Opportunity: Remanufacturing of components and new business models based on performance contracts and reverse logistics.
2035 economic potential:
EUR 150-250 million p.a. (plus additional potential in adjacent sectors).
Key barriers: Lack of capabilities and skills; imperfect information of existing opportunities; unintended consequences of existing regulations
Sample policy options:
Remanufacturing pilots and information campaigns; amendment of existing regulatory frameworks; adoption of an overarching government strategy.
The Danish machinery sector is characterised by the presence of several large manufacturers of long-lived industrial products, such as Grundfos (pumps), Vestas (wind turbines), and Danfoss (thermostats, heating and power solutions) and >1,000 parts manufacturers and service providers supporting these industries.218 Across the board, these companies have adopted the most common efficiency measures, such as waste reduction in production processes, light-weighting components and products, and waste reduction and energy efficiency in production processes.
Danish machine manufacturers are also proficient in recycling and are increasingly looking into designing for recyclability. Grundfos, for example, notes that around 90% of the components inside pumps are recyclable. In the wind turbine industry, almost all parts are recycled. The last remaining challenge is the rotor blades, which consist of epoxy-covered composites. A number of possible uses for old blades are currently being pursued, guided for example by the Genvind project.219
By contrast, discussions with sector experts revealed that there is only a limited number of remanufacturing or refurbishment activities. Remanufacturing and refurbishment (Box 6) leads to higher value retention than materials recycling since a large part of the added value of a product or component is maintained, and more steps along the value chain are bypassed (c.f. Figure 1 in Part 1). Danish companies could thus exploit the largely untapped potential in remanufacturing and refurbishment. In parallel, recycling and efficiency optimisation is likely to continue to improve in the sector, as part of the trajectory Denmark is already on.
218 According to Statistics Denmark, there were 26 companies with 250-plus employees in the machinery sector in 2012, and just over 1,000 with fewer than 250 employees, of which half had 0–9 employees.
219 www.genvind.net

124 • DELIVERING THE CIRCULAR ECONOMY – A TOOLKIT FOR POLICYMAKERS
Box 6: Remanufacturing and refurbishment220
Component remanufacturing is defined as a process of disassembly and recovery at the subassembly or component level. Functioning, reusable parts are taken out of a used product and rebuilt into another. This process includes quality assurance and potential enhancements or changes to the components. By definition, the performance of the remanufactured component is equal to or better than ‘as new’. 221
Product refurbishment involves returning a product to good working condition by replacing or repairing major components that are faulty or close to failure – and making ‘cosmetic changes’ to update the appearance of a product. The replacement components could themselves be remanufactured. Any subsequent warranty is generally less than issued for a new or remanufactured product, but the warranty is likely to cover the whole product. Accordingly, the performance may be less than ‘as new’.
REMANUFACTURING IS ALREADY A VIABLE BUSINESS CASE
There are numerous examples to show that there is a strong business case for remanufacturing. The consultancy Levery-Pennell has calculated that for a case with remanufactured items selling for 20% less than new items, and increased labour costs for the remanufacturing process, the gross profit could still be up to 50% higher due to the large reduction in input costs, and that the earnings could be even higher with a performance-based business model.222 Indeed, several large companies have already run successful remanufacturing operations for quite some time:
• Renault’s remanufacturing plant in Choisy-le-Roi, France, re-engineers different mechanical sub-assemblies, from water pumps to engines, to be sold at 50% to 70% of their original price with a one-year warranty. The remanufacturing opera-tion generates revenues of USD 270 million annually. Renault also redesigns com-ponents (such as gearboxes) to increase the reuse ratio and make sorting easier by standardising components. While more labour is required for remanufacturing than making new parts, there is still a net profit because no capital expenses are required for machinery, and much less cutting and machining to remanufacture the components, resulting in waste minimisation and a better materials yield. Renault has achieved reductions of 80% for energy, 88% for water and 77% for waste from remanufacturing rather than making new components.223
• Caterpillar founded its CatReman business line in 1973. It now has global op-erations with over 4,200 employees, and fully remanufactures a large range of heavy-duty equipment to as-new state, including long-term warranties. Caterpil-lar has reported that remanufactured components reduce resource consumption by 60–85%.224
• Ricoh’s ‘comet circle’ is a well-known and established business model, including remanufacturing and refurbishment of components, and recycling of materials.225
220 For more details, see for example Ellen MacArthur Foundation, Towards the circular economy I (2012).
221 Nasr, N., Rochester Institute of Technology, presentation at Re:Thinking progress conference, Circular Econo-my and Remanufacturing (14 April 2015).
222 Lavery, G., Pennell, N., Brown, S., Evans, S., The Next Manufacturing Revolution: Non-Labour Resource Produc-tivity and its Potential for UK Manufacturing (2013).
223 Ellen MacArthur Foundation, The Circular Economy Applied to the Automotive Industry (2013); group.renault.com/en/commitments/environment/competitive-circular-economy/
224 Caterpillar Sustainability Report (2006).
225 https://www.ricoh.com/environment/management/concept.html
DELIVERING THE CIRCULAR ECONOMY – A TOOLKIT FOR POLICYMAKERS • 125
As ~70% of components in a printer or copier can be remanufactured,226 these products are well placed to be provided on an access-based contract. Ricoh al-ready sells 60% of their products through service contracts, and remanufacturing is an important lever to reach its ambitious target of reducing resource consump-tion by 2050 to 12.5% of the 2000 levels.
Remanufacturing and refurbishment have been predicted to have a net positive effect on GDP and employment, as well as boosting innovation.227 The UK All-Party Parliamentary Sustainable Resource Group has reported that remanufacturing could contribute GBP 2.4 billion to the UK economy and create thousands of skilled jobs.228 Zero Waste Scotland estimates that increased remanufacturing alone could add 0.1–0.4% to Scotland’s GDP and provide up to 5,700 new jobs by 2020.229 However, remanufacturing does pose a significant challenge to product design and is especially difficult for manufacturers of long-lived products and/or in industries where the largest efficiency gains are still driven by hardware improvements. Manufacturers often design for optimised in-use efficiency rather than designing for remanufacturing.230 Products from companies like Grundfos and Vestas have anticipated lifetimes of 20 years or more, during which time hardware technology can improve significantly. Few would want to remanufacture equipment put on the market 20 years ago, as performance of the hardware has increased manifold since then, and in the case of wind turbines the size has increased significantly. Another consideration is that the content of hazardous substances that have been phased out in new products could make a component or product unwanted for remanufacturing.
But even when the hardware development is still significant, remanufactured or refurbished equipment could be sold to secondary markets. There is already a growing market for used and refurbished wind turbines,231 and pump manufacturer KSB is looking at selling refurbished products to secondary markets. As hardware technology matures and efficiency improvements become increasingly driven by software it will become increasingly viable to integrate remanufactured components into the next generation of products. An industry expert notes that efforts to increase pump efficiency are likely to shift gradually towards software upgrades over the next five years.
THE OPPORTUNITY FOR DENMARK
In brief, this analysis suggests a large potential for Danish businesses. Even if not all machinery components are addressable for remanufacturing or refurbishment today, applying these practices to a selection of durable components becomes increasingly feasible but requires adaptations in the business model, product design, and the reverse supply chain. Done right, remanufacturing or refurbishment could unlock significant value.
As described in Section 2.2.1 there are four principal building blocks that a business can adopt to pursue a circular economy opportunity: product design (and technology), business models, reverse cycle skills, and cross-sectoral collaborations.232 Figure 30 summarises the main transitions in the first three dimensions to enable remanufacturing for liquid pumps, a hallmark product in the Danish machinery sector. In the same vein as
226 N. Nasr, Rochester Institute of Technology, Circular Economy and Remanufacturing, presentation at Re:Think-ing progress conference (14 April 2015).
227 See Ellen MacArthur Foundation, Towards the Circular Economy I–III.
228 All-Party Parliamentary Sustainable Resource Group, Remanufacturing. Towards a resource efficient economy (2015).
229 Zero Waste Scotland, Circular Economy Evidence Building Programme: Remanufacturing study (2015).
230 It could indeed be more rational to design primarily to increase in-use energy efficiency. At the same time, a life cycle assessment report by PE International on a Vestas V112 3.0 MW turbine showed that the ma-jor life-cycle impact comes from the manufacturing stage, indicating significant potential to capture value through remanufacturing. PE International, Life Cycle Assessment of Electricity Production from a V112 Tur-bine Wind Plant (2011).
231 See for example hitwind.com/; www.windforprosperity.com/
232 Ellen MacArthur Foundation Towards a Circular Economy I (2012); p.61. Note that the need for cross-sectoral collaborations, such as a focus on the circular economy in education and R&D, and wider acceptance for alternative ownership models, is also highly relevant to capture the remanufacturing opportunity.
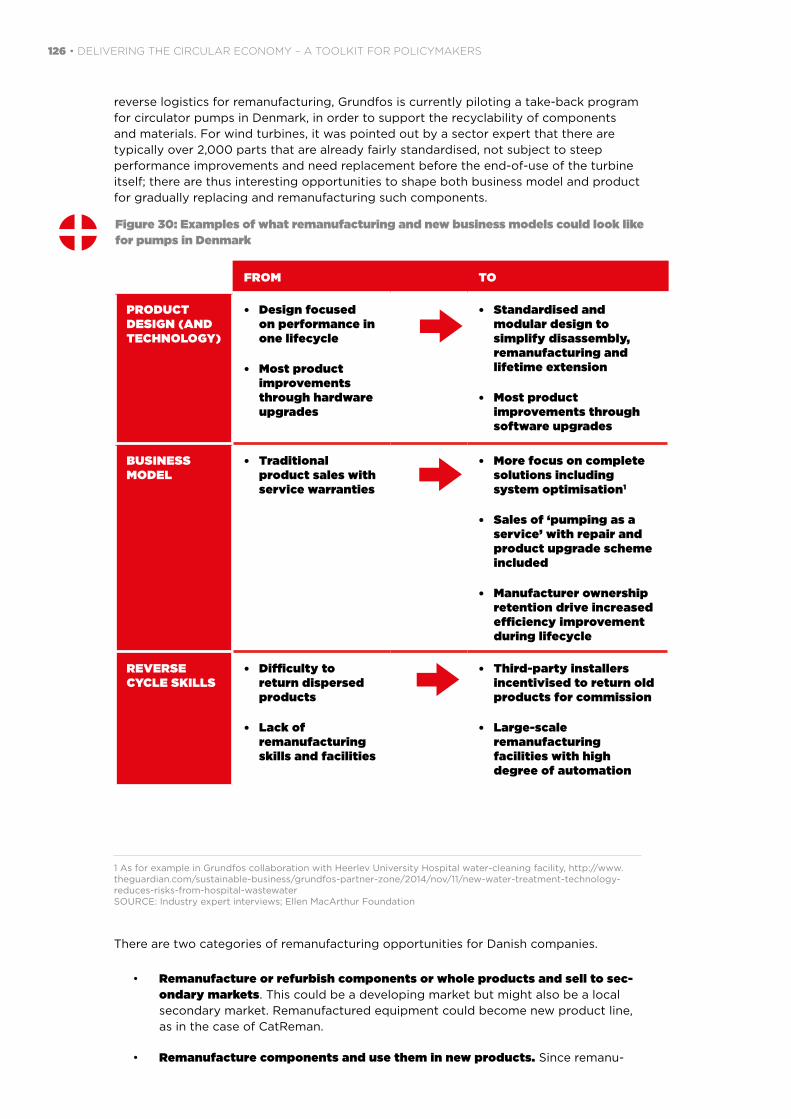
126 • DELIVERING THE CIRCULAR ECONOMY – A TOOLKIT FOR POLICYMAKERS
reverse logistics for remanufacturing, Grundfos is currently piloting a take-back program for circulator pumps in Denmark, in order to support the recyclability of components and materials. For wind turbines, it was pointed out by a sector expert that there are typically over 2,000 parts that are already fairly standardised, not subject to steep performance improvements and need replacement before the end-of-use of the turbine itself; there are thus interesting opportunities to shape both business model and product for gradually replacing and remanufacturing such components.
Figure 30: Examples of what remanufacturing and new business models could look like for pumps in Denmark
FROM TO
PRODUCT DESIGN (AND TECHNOLOGY)
• Design focused on performance in one lifecycle
• Most product improvements through hardware upgrades
• • Standardised and modular design to simplify disassembly, remanufacturing and lifetime extension
• Most product improvements through software upgrades
BUSINESS MODEL
• Traditional product sales with service warranties
• • More focus on complete solutions including system optimisation1
• Sales of ‘pumping as a service’ with repair and product upgrade scheme included
• Manufacturer ownership retention drive increased efficiency improvement during lifecycle
REVERSE CYCLE SKILLS
• Difficulty to return dispersed products
• Lack of remanufacturing skills and facilities
•
• Third-party installers incentivised to return old products for commission
• Large-scale remanufacturing facilities with high degree of automation
1 As for example in Grundfos collaboration with Heerlev University Hospital water-cleaning facility, http://www.theguardian.com/sustainable-business/grundfos-partner-zone/2014/nov/11/new-water-treatment-technology-reduces-risks-from-hospital-wastewater SOURCE: Industry expert interviews; Ellen MacArthur Foundation
There are two categories of remanufacturing opportunities for Danish companies.
• Remanufacture or refurbish components or whole products and sell to sec-ondary markets. This could be a developing market but might also be a local secondary market. Remanufactured equipment could become new product line, as in the case of CatReman.
• Remanufacture components and use them in new products. Since remanu-

DELIVERING THE CIRCULAR ECONOMY – A TOOLKIT FOR POLICYMAKERS • 127
facturing by definition restores a component to an ‘as new’ condition, it would be viable to use components again in new products, provided the dimensionality and design is consistent over product generations. This would save significant costs as both the raw material value and most value added from manufacturing the components are retained. This opportunity resembles Ricoh’s business model for office printers.
By leveraging the circular economy building blocks and utilising both these opportunities, the Danish machinery sector could gradually adopt remanufacturing and refurbishment. A conservative estimate is that half of all product components could be addressed for remanufacturing. Until 2020, they would likely focus on sales to secondary markets, while by 2035, 15–50% of remanufactured components could be used in new products rather than sold to a secondary market. Figure 31 gives an overview of the estimated potential adoption rates and value creation estimated on a component level for two machinery products, wind turbines and pumps. Overall, this would contribute to net value creations of 1–3% as share of overall product costs by 2020, increasing to 4–9% by 2035. These findings give a directional view of the magnitude of this opportunity for Denmark. They rely by necessity on a number of assumptions, the most important of which are detailed in Appendix B. It should be emphasised that the estimates take into account the significant challenges of remanufacturing and refurbishment of long-lived equipment, such as liquid pumps and wind turbines.
Figure 31: Estimated potential adoption rates and value creation in wind turbines and pumps in the Denmark pilot
Ranges, adoption rates and value estimated on a per component basis
2020 2035
Adoption rate per addressable component1
2-15% (0%) 10-70% (2-15%)
Additional value created per component
20-50% 25-50%
Net value created per component
1-7% 2-25%
Adopotion rate per addressable component1
5-10% (0%) 30-50% (10-15%)
Additional value created per component
15-35% 25-40%
Net value created per component
1-4% 5-15%
64% of components addressable for remanufacturing (by value)
65% of components addressable for remanufacturing (by value)
1 Adoption rates in brackets indicate ‘business as usual’ scenario
SOURCE: Expert interviews; Ellen MacArthur Foundation
Scaling up this value creation to the full machinery sector including pumps, wind turbine and other machinery, it is estimated that businesses could create a net value of EUR 150–

128 • DELIVERING THE CIRCULAR ECONOMY – A TOOLKIT FOR POLICYMAKERS
250 million annually233 by increased adoption of remanufacturing and/or refurbishment and new business models. But they need to be prepared to challenge their perception of both their business models and design to capture the opportunity. For example, the product design requires taking into account resource use and costs over several life cycles, and identifying sub-components that could be more standardised and modularised. There are also large logistical challenges to bring widely dispersed, large products back to a remanufacturing facility, and to bring heavily worn parts back to an ‘as new’ state.
Finding solutions to overcome all these challenges will require further investigation, but it can be noted that there are a number of methods to restore worn metal components to ‘as new’ condition, for example cold spraying and other additive processes.234 The US defence industry performs significant remanufacturing of aircraft, ships and ground systems, of which many have been over 20 years in operation. It is also widely anticipated that increased digitisation is an important enabler, both to drive the continued efficiency improvement and to automate the remanufacturing process, for example through fault detection software.
BARRIERS AND POTENTIAL POLICY OPTIONS
The following paragraphs provide an initial perspective on the barriers limiting the ‘remanufacturing and new business models’ opportunity (see Section 2.2.4 for the barriers framework). The critical barrier limiting the industry from taking the remanufacturing opportunity is a lack of capabilities and skills: industrial designers and engineers in the machinery sector often lack the knowledge and experience necessary to run successful remanufacturing operations, which require the ability to design for disassembly and set up reverse logistics systems. An industry player highlighted the challenge to establish efficient and effective partnerships along the value chain in order to ensure a reversed flow of products and components. While getting the products into the market is a capability that has been developed for decades, the capabilities for getting the products back are still in an immature state and also highly dependent on the national market conditions.
The most important market failures are the transaction costs related to finding and negotiating with new suppliers, since remanufacturing could significantly disrupt material flows across the value chain; and the uneven distribution of knowledge among manufacturers about the economic potential of remanufacturing and new business models.
There is a steep technological development of hardware in many machinery categories, which makes remanufacturing unfeasible in the short term, e.g. the size of wind turbines is increasing rapidly, making the remanufacture of old parts for use in new products unfeasible.
Even when they are fundamentally economic, some international remanufacturing operations face a high administrative burden to comply with the regulations relevant to being able to move remanufactured components across borders. The exact impact in Denmark of such regulatory barriers would need to be further investigated for each product type.
To address these barriers, the following policy options could be further investigated. These options are the result of an initial assessment of how cost-effectively different policy options might overcome the identified barriers (see Section 2.3.3):
• Stimulating remanufacturing pilots that allow businesses (in particular SMEs) to gain experience with remanufacturing and make the benefits more tangible to them. In this context, it is worth investigating the scope for funding such pilots through the Danish Fund for Green Business Development.
233 This sector-specific impact does not include indirect effects, e.g. on supply chains, that are captured in the economy-wide CGE modelling.
234 For example, the Golisano Institute for Sustainability at the Rochester Institute of Technology develops meth-ods such as cold spraying and collaborates with companies to improve these technologies.

DELIVERING THE CIRCULAR ECONOMY – A TOOLKIT FOR POLICYMAKERS • 129
• Using these pilots in industry information campaigns that highlight best practices in remanufacturing and refurbishing and also draw on international case studies (such as Caterpillar’s CatReman business unit). The aim would be to build business awareness of the benefits of remanufacturing (especially among SMEs) and to accelerate the transition to performance models.
• Encouraging the establishment of a training programme to ensure that man-ufacturing and procurement staff in key industries possesses the necessary skills for businesses to fully benefit from the potential of remanufacturing.
• Create a level playing field between remanufactured and new products by identifying unintended consequences of national, European and international regulation that put remanufactured products at a disadvantage.235 Potential ex-amples are health and safety regulations and regulation prohibiting the sale of remanufactured products as ‘new’.
• In addition to reviewing existing regulation, informing the development of new tools at the EU level that help to provide detailed information on the compo-sition of products and how to dismantle them. Examples include guidance on how to develop product passports and bills of material, product standards (e.g. expansion of existing eco-design rules), or quality-standards and labels on the reliability of remanufactured products.
• Adopting an overarching government strategy for remanufacturing and by giving it a clear space in the overall industry/manufacturing strategy (and hence with associated targets and milestones), to galvanise the industry and give it clarity on the direction of future policy development.
• Supporting the development of remanufacturing technology and design through strategic funding and investigate the scope for further leveraging the Eco-Innovation Program administered by the Danish Ministry of the Environment for this purpose. The new Scottish Institute of Remanufacture is an example, which is funded by the Scottish Funding Council, Zero Waste Scotland and a range of business interests. Its focus is on delivering industry led research and development projects in collaboration with academia.
3.5 PackagingPlastic packaging is a central challenge to the circular economy. Although some of the potential solutions require multi-stakeholder alignment at international level, two opportunities stand out in Denmark at the national level: increased recycling and introduction of bio-based materials. By addressing the need for improved collection systems and working together with stakeholders on ways to increase standardisation, Denmark could increase the recycling of packaging to 75% by 2035, saving both embedded energy and carbon. In addition, Danish companies could develop a competitive advantage in bio-based materials, if the need for accelerated technological development and creating functional end-of-use pathways is addressed.
In terms of value, consumer packaging is forecasted to have an annual growth of ~3–5% globally for the next few years.236 The use of plastics for packaging applications is forecasted to continue to grow at the expense of other materials.237 Because of their
235 In May 2015, the Basel convention adopted new technical guidelines on an interim basis to amend its regu-lation on transboundary shipment of hazardous waste. While the main focus is on EEE, formulations such as exempting materials ‘destined for failure analysis, and for repair and refurbishment’ from being classified as waste signals an ambition to address unintended consequences.
236 Annual growth over the 2013–2018 period, with constant 2012 prices and exchange rates. Forecast compiled from Freedonia, Euromonitor, and Smithers PIRA.
237 Smithers PIRA (2014).
130 • DELIVERING THE CIRCULAR ECONOMY – A TOOLKIT FOR POLICYMAKERS
short period of use, packaging materials become waste relatively quickly after they have entered the market. Recirculating plastic packaging is particularly challenging since it is not only very dispersed and therefore relatively hard to collect – which is generally the case for consumer packaging – but it also has a diverse make-up in comparison to, for instance, board-based packaging; plastics also have low material value compared with aluminium or tin-plated steel.
The plastic packaging value chain comprises firstly the design and production of plastic material and packaging, and secondly the after-use phase of collection, waste segregation, and reprocessing. The challenge with influencing the production elements is that they are typically international, so potential regulations or standardisations concerning materials or additives must be decided on an international level. The after-use phase is more localised, and so is an easier area of direct influence for an individual national policymaker. But after-use measures cannot be optimised in isolation; they need to be made in concert with design and production standards. While the outcome of applying this toolkit provides a set of options for national or regional policymakers, another project - the Global Plastic Packaging Roadmap (GPPR, see Box 7) addresses the systemic issues of the current linear plastics economy at a global level, by bringing together international stakeholders involved in plastics and packaging design as well as national stakeholders responsible for collection and recovery systems.
Thus, the Denmark pilot takes a national perspective on opportunities to increase recycling by focusing on improving the after-use treatment (Section 3.5.1). The opportunity to develop bio-based packaging (Section 3.5.2) should meanwhile be seen in the context of driving technology and innovation rather than setting national regulations for bio-based materials.
Box 7: The Global Plastic Packaging Roadmap
Mobilized in 2014, as part of the MainStream Project, the Global Plastic Packaging Roadmap (GPPR) initiative leverages the convening power of the World Economic Forum, the analytical capabilities of McKinsey & Company, and the circular economy innovation capabilities of the Ellen MacArthur Foundation. The vision of the Global Plastic Packaging Roadmap (GPPR) is of an economy where plastic packaging never becomes waste but re-enters the economy as defined, valuable, biological or technical nutrients – a ‘new plastics economy’.
The GPPR provides an action plan towards this new plastics economy as an economically and environmentally attractive alternative to the linear model. The project is driven by a steering committee composed of nine global leading company CEOs and more than 30 participant organizations across the entire plastics value chain ranging from plastics manufacturers to brand owners and retailers in FMCG to municipal waste collection and after-use treatment systems. This integrative project setup allows for accelerating systemic change through innovation and collaboration. The GPPR works collaboratively with a number of existing initiatives focused on ocean plastics waste including the Global Oceans Commission, Ocean Conservancy, the Prince’s Trust International Sustainability Unit, governmental institutions and policymakers. The project’s unique focus on systemic change will complement and inform these other initiatives.
Besides fostering innovation and collaboration across the value chain, the GPPR project will also inform and influence policy on a corporate and governmental level, by highlighting interventions that either hinder or accelerate the transition towards the new plastics economy. First results from the GPPR will be published in January 2016 at the World Economic Forum in Davos.

DELIVERING THE CIRCULAR ECONOMY – A TOOLKIT FOR POLICYMAKERS • 131
3.5.1 Increased recycling of plastic packaging
Opportunity: Increased recycling of plastic packaging driven by better packaging design, higher collection rates, and improved separation technology.
2035 economic potential:
Not quantified.
Key barriers: Profitability, driven by unpriced externalities and price volatility; collection and separation technology; split incentives.
Sample policy options:
Mandated improvement of collection infrastructure; increased national recycling targets; standardised collection / separation systems; increased incineration taxes.
In Denmark, the volume of plastic packaging waste grew 2% p.a. over 10 years, to 184,000 tonnes in 2012, while the volume of other packaging waste, such as glass and paper, declined at a rate of 1.3% p.a. over the same period.238 While Denmark has spearheaded many recycling initiatives, such as one of the first successful deposit-refund systems for bottles, recycling rates are still low for plastic packaging (Figure 32). One root cause may be the large waste incineration capacity in Denmark, using combined heat and power plants to generate electricity and provide district heating. Since low utilisation undermines incinerator economics, the incentive to switch packaging volumes over to recycling has been limited. In the ‘Denmark Without Waste’ resource strategy, the Danish government expresses a goal to gradually move from incinerating valuable materials – such as plastics – to recycling. Consequently, the estimated projected incinerator capacity is flat.239
Figure 32: Share of plastic packaging collected for recycling in Denmark
Percent, 20121
GLASS
PAPER AND CARDBOARD
METAL2
WOOD3
PLASTICS4
1 Indicates share of waste collected for recycling – actual recycling rates vary depending on material quality. 2 Danish EPA estimates that this is on the low side. Volumes are based on sales of beer and soft drinks, and main uncertainty comes from extensive border trade with Germany. Main leakage point from households is mixed garbage, which gets incinerated. Metal salvaged from incineration ashes is not included in this number. 3 Large share of wood incinerated in incinerators and some parts in household stoves. 4 Including PET bottle recycling in deposit-refund scheme. SOURCE: Danish EPA; Statistics Denmark; Ellen MacArthur Foundation
29.4
97.7
76.5
51.8
40.4
Businesses: 40-45%
Households: 14-15%3
238 By tonne. Danish Environmental Protection Agency, Statistik for emballageforsyning og indsamling af embal-lageaffald 2012 (2015 rev.).
239 Danish Government, Denmark Without Waste I. Recycle more – incinerate less (2013); Danish Environmental Protection Agency, Danmark uden affald. Vejledning fra Miljøstyrelsen nr. 4 (2014).

132 • DELIVERING THE CIRCULAR ECONOMY – A TOOLKIT FOR POLICYMAKERS
THE OPPORTUNITY FOR DENMARK
Given this starting point, there is significant potential for Denmark to increase recycling of plastic packaging.
• By 2020, Denmark could increase the amount of plastic packaging collected for recycling to up to 40% (20% for households and 60% for businesses). This means an overall improvement with 10 percentage points compared to current recycling rate (5 percentage points for households and 20 percentage points for business-es).
• By 2035, a ~75% recycling rate (65% for households and 85% for businesses) and improved valorisation of the collected plastic waste could become feasible.
A transition towards increased recycling would centre on three key levers – design, collection and sorting – each with a few different enabling mechanisms:
• Higher collection rates for recycling. This could mean more convenient collec-tion schemes such as the kerbside collection of plastics or mixed recycling in-stead of requiring drop-off at recycling centres, or finding better ways to collect plastics that have been in contact with food.240 Much could be achieved through better incentives for households to sort recyclables from mixed waste. Depos-it schemes could be applied for a larger number of container types – if made cost-efficient and associated with carefully implemented reverse vending supply chains. On a regional level, higher collection rates could be achieved through standardised collection systems that provide scale effects.
• Improved sorting technology. Better combinations of existing technologies (mid- and near-range IR, colour, x-rays, electrostatic, and visual spectrometry) lead to larger resin volumes extracted from the mixed waste or mixed recyclables stream, at higher qualities.241 In the absence of such equipment the burden rests fully on households and businesses to deliver such volume and quality through their own choices and actions (for example, carefully separating resins).
• Design for recycling. Plastics and packaging manufacturers could use purer materials, for example without unnecessary coloration, to enable production of recycled plastics with qualities comparable to those of virgin sources.242 Well-considered chemical compositions may also facilitate the sorting of materi-als. For example, black-coloured trays, popular for ready-made meals and other food applications, have been difficult to sort: the carbon black typically used to provide the black colour cannot be detected by commonly used near-range IR sensors.243 A multi-stakeholder effort led by WRAP and including Danish Faerch Plast has now identified alternative, detectable colorants for PET and polypropyl-ene food trays. In a wider perspective, standardisation is instrumental for being able to create broad alignment on elimination of structural plastic waste (such as too many compounds or contamination of additives; also see Note 242).
By 2020, increased recycling could reduce demand of virgin plastic material by 20,000—25,000 tonnes; by 2035 this could be 70,000–100,000 tonnes.244 Compared to using the same amount of virgin plastic material, recycled plastics require approximately 70% less
240 One waste management expert notes that consumers typically dispose of plastic packaging that is ‘sticky’ from contact with food since there is no convenient, hygienic way of storing it with recyclables, and that collecting this ‘sticky’ packaging is essential to increase collection rates significantly above current levels.
241 See for example the pilot study conducted by the Plastic ZERO project. Plastic ZERO. Public private collabo-rations for avoiding plastic as a waste (2014). www.plastic-zero.com/publications/publications-of-plastic-ze-ro-(1).aspx
242 As noted above, this enabler is difficult to drive solely on a national level, and is best addressed through an integrative approach engaging stakeholders at a multi-national level and across the entire value chain, such as in the GPPR project.
243 WRAP, Development of NIR Detectable Black Plastic Packaging (2011).
244 Acknowledging that the recycling business is international, this assumes that the corresponding volume of recycled plastic material replaces virgin plastic material in Denmark.

DELIVERING THE CIRCULAR ECONOMY – A TOOLKIT FOR POLICYMAKERS • 133
energy to produce: One tonne of recycled plastics saves roughly 10,000–12,000 kWh of energy. By 2035, Denmark could therefore also save as much as 700–1,200 GWh of energy p.a.245 These findings give a directional view of the magnitude of this opportunity for Denmark. They rely by necessity on a number of assumptions, of the most important of which are detailed in Appendix B. In addition to energy savings, Denmark’s carbon footprint would be reduced – but by how much would depend on what source of energy is used to replace the heat and electricity generated from incineration.
BARRIERS AND POTENTIAL POLICY OPTIONS
The following paragraphs provide an initial perspective on the barriers limiting the ‘increased recycling of plastics packaging’ opportunity (see Section 2.2.4 for the barriers framework). The main barrier to increased plastic packaging recycling is the price pressure the relatively small plastics recycling industry faces from producers of virgin or primary plastics whose large market share grants them bargaining power. While the barrier at its core is one of unpriced negative externalities of petro-based packaging, this market failure manifests itself in a lack of profitability and capital. Plastics recyclers face volatile profit margins due to a largely fixed cost structure and revenues that are highly dependent on oil prices. This makes raising capital more difficult due to uncertain payback periods. A recent example of this economic pressure is Closed Loop Recycling, Britain’s biggest recycler of plastic milk bottles with 80% market share, which in March 2015 warned of potential bankruptcy citing the slump in global oil prices as a major reason. Since the price of recycled plastics shadows that of petro-based plastics, the slump has caused prices for recycled plastics to fall nearly 40% in the second half of 2014 and first quarter of 2015 (another contributing factor is that milk is one of the main battlegrounds in the price war currently being fought between major supermarkets, leaving no margin to pay slightly more for recycled plastics).246
Compounding these economic challenges is the lack of rollout in Denmark of two types of technology: packaging designs that reduce the cost of recycling, and plastics separation technologies at the recycling plant. Improving design (such as the detectable colorant mentioned above) and deploying more advanced separation technology would allow recyclers to separate plastics fractions more cost efficiently. Split incentives are also present: producers of plastics lack the incentive to design for recycling since third parties capture the value; and there is a well-documented overcapacity of municipal incinerators in Denmark that reduces municipalities’ incentive to recycle plastics.
To address these barriers, the following policy options could be further investigated. These options are the result of an initial assessment of how cost-effectively different policy options might overcome the identified barriers (see Section 2.3.3):
• Mandating the improvement of the collection infrastructure for household plastic waste in municipalities. Nordic country experience suggests that kerb-side collection generates less contamination than the ‘bring’ approach.
• Increasing the national target for the plastics recycling rate from 22.5% to up to 60%. This would move Denmark from the minimum level under current EU law to the levels envisaged in the 2014 EC review of waste policy and legislation presented as part of the EC’s circular economy proposals. This could also help insure targets and objectives are well defined.
• Standardising collection and separation systems across municipalities to pave the way for economies of scale and stronger sorting and treatment capa-bilities at the national level. This could lead to a higher profitability of domestic recycling operations.
• Reviewing fiscal incentives around incineration of plastics. This could both tackle the externality barrier and accelerate the shift towards the complete recy-
245 www.factsonpet.com/
246 The Guardian, UK’s biggest plastic milk bottle recycler on brink of collapse, (26 March 2015).
134 • DELIVERING THE CIRCULAR ECONOMY – A TOOLKIT FOR POLICYMAKERS
cling of plastic waste. In Denmark the taxation rate is already high in comparison with other European countries,247 so policymakers might consider differentiating the tax rate based on whether or not plastics are separated out before incinera-tion. Catalonia has such a differentiated incineration tax rate for organics collec-tion programmes.248
• Bringing together all stakeholders in the plastics supply chain to work on sys-temic solutions to address split incentives that affect plastic recycling. This could take the form of a project with specific short term objectives, or a network, or a private public partnership.
• Working towards EU-wide rules and standards
o on the plastics used in retail packaging solutions to better ensure recyclability. Ultimately this could result in a EU-wide positive list of material/format combinations for which recycling performance is superior.
o for waste recovery and management procedures so as to create more standardized outputs and allow better trade opportunities for the waste processors.
o on minimum shares of recycled material in plastic products (as in California) in order to increase and stabilise market revenues for plastic recycling.
• Setting up league tables ranking neighbourhoods based on their recycling performance. In the UK for example the Department for Environment, Food and Rural Affairs maintains such a league table and provides information to house-holds on how their communities’ recycling rates compare to others. A study made by the University of Guildford concluded that this type of feedback en-couraged households to recycle more.249
3.5.2 Bio-based packaging where beneficial
Opportunity: Innovation-driven shift to bio-based alternatives for selected plastic packaging applications.
2035 economic potential:
Not quantified.
Key barriers: Technology; profitability driven by unpriced externalities; inadequately defined legal frameworks.
Sample policy options:
Funding of innovation and B2B collaboration; investment in improved end-of-use pathways; working to clarify the EU regulatory framework.
Bioplastics could potentially replace many applications of petroleum-based plastics. Broadly they may meet one or both of the following definitions: (i) bio-based250 materials, which have a biological source (in a renewable and sustainable form) and (ii) biodegradable251 materials, which have a biological fate, returning to the biosphere as
247 D. Hogg, DG Environment , European Commission, Incineration taxes : Green certificates—Seminar on use of economic instruments and waste management (2011).
248 Ibid.
249 See, for example www.letsrecycle.com/news/latest-news/localised-feedback-boosts-recycling-participation/
250 ‘Bio-based’ is defined here as any fibre or polymeric material derived from organic feedstock, e.g. paper or polymers from cellulose, plastics such as PHBV, polyesters or PLA.
251 According to the EU packaging directive it is only allowed to market/state that a packaging is biodegradable if it complies with the CEN-standard EN 13432. For the purposes of this report, it is assumed that the material can be readily decomposed under composting or anaerobic digester conditions in a short, defined period of time.

DELIVERING THE CIRCULAR ECONOMY – A TOOLKIT FOR POLICYMAKERS • 135
nutrients. In the context of the Denmark pilot, discussion centres mainly on bio-based materials that could replace petro-based plastics. If they are used in applications most likely to end up as uncontrolled waste in the environment – such as films, bags, or closures – these materials should preferably be biodegradable.
The prevalence of bio-based plastics is still limited,252 but growing. Nova-Institute determined the tonnage-based share of bio-based structural polymers at 2% in 2013, up from 1.5% a year earlier.253 European Bioplastics, a trade association, even expects global capacity to quadruple by 2018, mainly driven by rigid packaging applications.254
There are two principal pathways for companies and regions to shift from a petro-based plastic to a bio-based material, both facing a set of critical challenges.
• Using a bio-based feedstock to make ‘drop-in’ monomers to produce the same polymers as from a petroleum source, using the existing plastic value chain – this is the market segment that is globally seeing the strongest growth, spearheaded by partly bio-based PET which is forecasted to grow from ~600 000 tonnes in 2013 to ~7 million tonnes in 2020.255 Drop-in bio-based resins or resin-precursors (for example ethylene glycol monomers for PET) are functionally indistinguish-able from their petro-based counterpart, but are difficult to produce cost-com-petitively compared to petro-based counterparts at current prices (similar to the challenges for biofuels).
• Replacing the material altogether, either with a new plastic or an alternative material with the same or similar properties. These materials face difficulties matching the performance of petro-based plastics and have been largely limited to very specific applications where new characteristics are desired, such as with Ecovative’s mycelium-based and compostable packaging materials,256 or dispos-able tableware (which can both be composted or anaerobically digested).
Another challenge for bio-based alternatives is the considerable apparatus that is already in place to produce and use petroleum-based plastic packaging. Accelerating a switchover beyond the conventional investment cycle is therefore expensive and complex. Consider, for example, one large fast-moving consumer goods (FMCG) company that noted that it might take five to eight years to get a new product from concept to shelf – a large share of which is packaging design.
There are nevertheless two strong arguments for making the shift towards bio-based materials.
• Responding to increasing material demand and price volatility. The antici-pated addition of 1.8 billion more middle-class consumers worldwide between 2010 and 2025 would lead to a 47% increase in demand for packaging. As long as the plastic is sourced from a fossil feedstock, there will eventually be issues of supply and cost unless resource extraction increases at the same pace – leading to increasing risk from price volatility.257 Bio-based materials would be less sen-sitive to price volatility and contribute to securing the rising demand from con-sumers.
• Ensuring unavoidable leakage is bio-sourced. The highly dispersed nature of plastic packaging means that leakage to the biosphere is always likely – even with excellent recycling – and leakage of petro-based plastic creates either a
252 According to analysis based on SRI, FO Licht, Frost and Sullivan, and press clippings (2011), in 2010-11 less than 2% of the chemical industry’s sales worldwide consisted of biopolymers and other bulk biomaterials such as natural rubber and bio-based polyols.
253 Nova-Institute, Bio-based Building Blocks and Polymers in the World (2015).
254 European Bioplastics, Bioplastics – facts and figures (2013).
255 Nova-Institute, Bio-based Building Blocks and Polymers in the World (2015).
256 www.ecovativedesign.com/mushroom-materials/. Also see Ellen MacArthur Foundation, Towards the Circular Economy II (2013), p.71.
257 World Bank; Ellen MacArthur Foundation, Towards the Circular Economy III (2014), p.25.
136 • DELIVERING THE CIRCULAR ECONOMY – A TOOLKIT FOR POLICYMAKERS
net addition of CO2 to the atmosphere or slow degrading waste in the landfill or oceans. In Denmark, 10-11% of plastic bottles do not end up in the deposit-refund system, while this number is 0–2% for refillable glass bottles.258 But even low leakage rates are problematic for a high turnover item like food and beverage packaging.259 Another example is the large variety of plastic packaging that is disposed of as mixed garbage, thus having near 100% leakage. If there is (un-avoidable) leakage, it is preferable that this material comes from a bio-based feedstock so that the net carbon addition to the atmosphere is minimised upon incineration, or is biodegradable if it is likely to leak into the biosphere without incineration.
THE OPPORTUNITY FOR DENMARK
Denmark businesses could leverage both the drop-in and replacement pathways described above to shift from petro-based plastics to bio-based materials. Some international companies have shown that there are business cases for both options:
• The Coca Cola Company launched its PlantBottle™ concept in 2012, where up to 30% of the plastic is made from drop-in, bio-based chemicals. Coca Cola now also collaborates with, among others, renewable chemicals producer Gevo, which intends to supply bio-based paraxylene for making PET. Going further, Coca Cola aims at producing bottles from 100% residual biomass.260
• DSM has a number of bio-based plastics for non-packaging applications on the market, for example Arnitel®, partially made using rapeseed oil and used for mak-ing temperature-resistant pan liners; and EcoPaXX®, an engineering plastic made from 70% biological feedstock, used for engine covers in cars.261
• In Denmark, ecoXpac is developing a cellulose fibre-based material that can be moulded like plastics and is biodegradable. In a partnership with Carlsberg, Innovation Fund Denmark and the Technical University of Denmark, they are using the Cradle-2-Cradle® design principles, in the development of the first bio-based, biodegradable beer bottle.262
Bio-based materials have been controversial because of their potential impact on land use and waste recovery systems, and indeed should be introduced where they are beneficial from a system perspective, and aligned with design criteria that include:
1. Minimise overall waste: New materials should not increase other waste streams (i.e. reduced gas/liquid barriers of bio-based materials may lead to higher food spillage, biodegradable materials may cause reduced recycling rates and be too slow to decompose).
2. Do not increase land use: bio-based packaging materials should, where possible, be derived from secondary organic material streams (e.g. fibre from residual biomass, microorganisms growing on organic waste) in order not to compete with food supply or further increase land use (although the biomass need for plastics substitution is small – currently at 0.01% of the area globally under agricultural cultivation;263 given the current share of biopolymer at ~2% of total polymer volume (see above), even a fully bio-sourced supply would occupy around 2%).
3. Do not leak nutrients from the bio-cycle to the technical cycle. Since bio-based
258 Danish Return System.
259 Take aluminium beverage cans for example, which have a 60-day life from can to (recycled) can. Even at a 70% recycling rate, all the original material would disappear from the economy after only one year.
260 www.coca-cola.com/content-store/en_US/SC/PlantBottle/; www.gevo.com/?post_type=casestudy
261 www.dsm.com/products/arnitel/en_US/home.html; www.dsm.com/products/ecopaxx/en_US/home.html
262 www.ecoxpac.com
263 Food and Agriculture Organization of the United Nations (FAO); Institute for Bioplastics and Biocomposites (IfBB), University of Applied Sciences and Arts, Hannover.

DELIVERING THE CIRCULAR ECONOMY – A TOOLKIT FOR POLICYMAKERS • 137
materials are essentially taken from the bio-cycle to be used in the technical cycle, it is important to avoid leakage of essential biological nutrients. This is typically avoided by ensuring that produced materials are pure,264 and that they are returned to the biosphere either directly through composting or digestion, or indirectly through incineration.
4. Consider existing end-of-use infrastructure: If a new bio-based material is introduced, it should not disrupt existing end-of-use treatment systems so that overall costs increase. If a biodegradable alternative is introduced, there should already be an end-of-use pathway for it, such as an operational collection system for organic waste.
5. Avoid leakage of non-circular materials: Product-by-product evaluation is necessary to assess best end-of-use option. There is a fundamental question around whether the packaging material should be looped within the technical cycle or returned to the biological cycle (c.f. Figure 1).
• Technical cycle. Beverage containers that are relatively clean and easy to recog-nise and could participate in deposit refund schemes with high recycling rates may benefit from further focusing on recyclability, which could mean a petro-leum feedstock is still preferable even if there is the option to use bio-based drop-in chemicals.
• Biologicial cycle. Packaging typically incinerated as mixed waste (such as film and sticky food containers) may benefit from being bio-based – or potentially also biodegradable such that it can be disposed of together with food waste in the organics bin (and be recovered in composters or anaerobic digesters).
Based on these design criteria, Denmark could start the shift to bio-based alternatives, first for selected disposable packaging with high tendency of being incinerated as mixed waste, and subsequently start introducing bio-based feedstock for plastic packaging applications with high degree of recycling. The materials could be sourced from non-food organic feedstock, for example residual wood fibre or plant biomass, or organic waste. Apart from making Denmark more resource resilient, this innovation-driven development could create a competitive advantage and opportunities to export new products and technologies.
• By 2020, Denmark might seek to launch the first successful at-scale examples of replacing petro-based plastics by new, advanced bio-based materials (as already conceptualised by Carlsberg/ecoXpac). While little replacement of plastics pro-tecting food is anticipated, Denmark could investigate pockets of opportunity where petro-based plastics properties are overspecified and replace these with a bio-based material with lower barriers. Due to the lead time required to build capacity for production of drop-in monomers, e.g. in bio-refineries (see Section 3.2.1), the estimated increase in bio-based feedstock for existing plastic materials is limited.
• By 2035, Denmark might seek to introduce bio-based drop-in chemicals at scale for the production of recyclable plastic packaging (e.g. PET), leveraging an antic-ipated bio-refining capacity (see Section 3.2.1). At the same time, Denmark could introduce biodegradable alternatives to replace, in particular, petro-based food packaging with low recycling rates, as well as creating a differentiated packaging offering for exported FMCGs to prioritise biodegradable versions for developing markets with low recycling rates.
BARRIERS AND POTENTIAL POLICY OPTIONS
The following paragraphs provide an initial perspective on the barriers limiting the ‘bio-based packaging where beneficial’ opportunity (see Section 2.2.4 for the barriers
264 Polymers typically contain only carbon, hydrogen, oxygen and nitrogen.

138 • DELIVERING THE CIRCULAR ECONOMY – A TOOLKIT FOR POLICYMAKERS
framework). To enable bio-based materials to successfully contribute to the new plastics economy (see Box 7), it is critical to ensure that working pathways exist for them to be produced, to fulfil their role, to be accurately separated, and to reach their intended fate at end-of-use. At this point there is still a large need for technological innovation in all segments of such pathways. For example, advanced bio-based materials with the right properties265 to replace petro-based plastic packaging and with limited negative effects, e.g. without competition with food crops, are still mostly at the advanced R&D or early commercial stage.
The incentive to innovate further is lowered by the actual and potential low cost of petro-based plastics, which are determined by global oil prices. Low prices of petro-based plastics neither reflect the true environmental costs of their production266 nor the cost of recycling them. This suppresses the potential prices that competing bio-based alternatives can command, meaning that margins remain low except in cases of high-price, low-volume products for specific applications. It gives rise to challenges to the profitability of producing bio-based plastics, which is highly dependent on the oil price. In addition, several stakeholders in the packaging value chain point out that moving towards using bio-based materials could complicate the supply chain from the point of view of packaging users because it adds more suppliers and types of material, thereby increasing transaction costs.
Finally, many stakeholders suggest that legal frameworks need to be better defined. For instance, ecoXpac indicated the benefits of a more transparent and speedy approval process for innovative new materials for food packaging. In another example, the field of bio-based materials could benefit from a Danish Act on excise duties that distinguishes better between petro-based and bio-based materials, in line with its aim of promoting environmentally benign types of packaging.
To address these barriers, the following policy options could be further investigated. These options are the result of an initial assessment of how cost-effectively different policy options might overcome the identified barriers (see Section 2.3.3):
• Fund collaboration in the R&D and design phases. With sufficient budget available this could take the form of funding R&D platforms—the further devel-opment of bio-based materials in collaboration with large CPG companies could follow international best-practice models for public-private innovation (for exam-ple the Fraunhofer Institute in Germany and UK’s Catapults). More modest col-laboration support could bring together designers and engineers in formats that draw inspiration from the packaging eco-design advisory services that Eco-Em-ballages offers in France.267
• Investing in improving end-of-use pathways for bio-based and biodegradable materials (including plastics and food waste) in the collection/separation sys-tems.
• Working to clarify the EU regulatory framework for approving new materi-als for food packaging so as to minimise unintended consequences that could hamper innovation and growth in the bioplastics industry.
• Considering contributing to an EU-wide debate on taxation of petroleum-de-rived materials.
265 For example, good gas and liquid barrier properties are crucial for food packaging.
266 Whereas the emissions from producing ethylene from Brazilian sugarcane amount to 0.1 tonnes CO2e/tonne of product (assuming no forest was cleared to cultivate the sugarcane), this rises to 2.1 tonnes for the same product derived from Chinese naphtha.
267 See for example: www.ecoemballages.fr/; ec.europa.eu/environment/waste/prevention/pdf/Eco_Emballag-es_Factsheet.pdf

DELIVERING THE CIRCULAR ECONOMY – A TOOLKIT FOR POLICYMAKERS • 139
COST BREAKDOWN OF PURCHASED GOODS
PERCENT
ADDRESSABLE FOR ACCESS OVER OWNERSHIP MODELS
Diagnostic imaging and radiation equipment
Surgical equipment
Patient care and wound treatment
Medical apparel and textiles
Other medical equipment
Medical equipment and accessories
Laboratory, observation and test equipment
Food and beverage
IT equipment
Other
Total
Addressable for access over ownership models 38
15
26
12
60
100
10062
Readily addressable / high potential
Addressable long-term/low-mid potential
Not addressable
1 Semi-durable equipment (e.g. scalpels, cuffs, sterile drapes) addressable in the longer term 2 Clothing and linen already widely addressed in Denmark 3 Not assessed; long tail of small product categories, although access over ownership models should be feasible in many cases SOURCE: Statistics Denmark, Danish Regions
9
9
4
13
7
4
Figure 33: Share of purchased goods in Danish hospitals that could be covered by performance models
1
2
3
3

140 • DELIVERING THE CIRCULAR ECONOMY – A TOOLKIT FOR POLICYMAKERS
3.6 HospitalsHospitals constitute a large, public service in Denmark and as such procure and consume large amounts of resources. The two key circular economy opportunities identified are to adopt performance models in procurement, and to become leaders in recycling and waste reduction. Modelling suggests that performance models in procurement could save hospitals EUR 70-90 million by 2035. With a systematic effort Danish hospitals could become leaders in recycling and minimisation of avoidable waste. For these opportunities to be realised, it is important that necessary capabilities are developed and existing custom and habits are addressed, for example by supporting pilots and training programmes, and by creating national guidelines and/or targets.
The healthcare sector in developed economies face a tremendous challenge over the next decades. Healthcare costs are increasing, for example driven by an ageing population, technological development and increased expectations from patients. Although Denmark is the country with the lowest projected cost increase, its public spend on healthcare is expected to rise from ~7% of GDP in 2008 to ~10% GDP by 2050.268 Such projections obviously motivate investigations for cost reductions and productivity improvement.
Hospitals are different from the ‘producing’ sectors discussed in Chapters 3.2–3.4 in that their output is a service. Hospitals do, however, procure, use, and discard vast quantities of goods and materials. For this sector this report therefore focuses on how hospitals could use their scale and centralised management to maximise resource efficiency through performance models, and minimise their waste through best practices in prevention and recycling.
In 2013, Danish hospitals spent EUR ~2.4 billion on physical goods.269 Based on what types of products are already offered in the form of performance models, an estimated 38% of the total purchases could be addressable (Figure 33). This includes a range of advanced equipment (e.g. MRI scanners, radiation treatment equipment, and laboratory instruments) and also (semi-)durable goods (e.g. scalpels, cuffs, and surgical apparel). It does not include the long tail of smaller product categories in ‘other medical equipment’, so the estimate is likely on the conservative side.
There are also large quantities of structural waste in healthcare that could be addressed using circular principles. Though these were not explicitly analysed in the Denmark pilot, a few deserve mentioning:
• Virtualisation. Although the technology is not yet mature beyond the level of isolated trials, it is anticipated that the efficiency of part of the healthcare system could be significantly improved by leveraging connectivity and technology-driv-en cost reduction of diagnosis. Two existing examples are the blood glucose monitor for diabetic patients and the various ‘e-health’ applications; a plausible development is that patients take a variety of samples at home using a connect-ed table-top device, send the diagnostic outcome electronically, and consult phy-sicians remotely using a videoconference application.
• Preventive healthcare. Increasing healthcare costs have prompted the idea of governments reducing the need for costly healthcare interventions by increas-ing the overall health of the population. Shifting the focus to disease prevention could offer a tremendous opportunity, not only in terms of avoided investment in hospital beds (and the materials associated with construction and usage/management) but also in terms of reduced productivity loss in the society. The Alzira model from Valencia offers an early example: driven by the nature of the
268 The King’s Fund, Spending on health and social care over the next 50 years. Why think long term?, (2013).
269 Expenses for Denmark’s 5 major regions, data from Danish regions. Purchase of goods represents ~15% of total hospital budgets; hospitals purchase services for an additional EUR 2,400 million.

DELIVERING THE CIRCULAR ECONOMY – A TOOLKIT FOR POLICYMAKERS • 141
public-private partnerships in the model, healthcare providers are incentivised to focus on health promotion and in the long-term reduce the patients’ need for healthcare.270 It is also highly relevant to address the increasing caloric intake that has been growing steadily in Europe other developed economics, and could drive exceedingly high healthcare costs.271
3.6.1 Performance models in procurement
Opportunity: Shift towards performance models in procurement of advanced and (semi)durable equipment.
2035 economic potential:
EUR 70–90 million p.a.
Key barriers: Insufficient capabilities and skills due to lack of experience; imperfect information; custom and habit.
Sample policy options:
Guidelines and targets; capability building; procurement rules.
The central idea in ‘performance’272 models is a contract in which the customer pays for the use, or the performance, of a product rather than the product itself. The rationale is that there is no inherent benefit in owning the product. On the contrary, ownership can entail additional costs (upfront investment), risk (unpredicted repair, maintenance or obsolescence), and end-of-use treatment costs.
THE OPPORTUNITY FOR DENMARK
Performance models are relevant for many of Danish hospitals’ purchasing categories, whether it is leasing clothing and bed linens or contracting the full management of scanning and radiation equipment. At the heart of each such model lies a mutual benefit for suppliers and customers to reduce the total cost of ownership. While the customer is able to reduce purchasing and maintenance costs, as well as maximise performance and uptime, the supplier is able to secure sustainable revenue streams, maximise resource utilisation, and drive efficiency during the use phase.273 Importantly, performance models also incentivise manufacturers to design more durable products that are easier to maintain, repair and refurbish or remanufacture (see Chapter 3.4).
There are already multiple examples of suppliers providing performance that are relevant to, or directed exclusively towards, hospitals. In the healthcare sector, suppliers like Siemens, Philips and GE are already rolling out performance models for their equipment, in addition to having existing refurbishment operations.274 Some of the most well-known examples outside the healthcare sector include Ricoh’s and Xerox’ service contracts for high-volume printers, Desso’s carpet tile concept,275 and Philips’ lighting services (selling ‘lux’ instead of lighting fixtures276).
270 NHS European Office, The search for low-cost integrated healthcare. The Alzira model – from the region of Valencia (2011).
271 Today, the average caloric intake exceeds 3,500 kcal per day, 40% above the recommended daily intake. In addition, the diet has become more fatty, salty, and sweet over the past 40 years. EEA, 2008; Food Stand-ards Agency; European Food Safety Authority; J. Schmidhuber, The EU Diet – Evolution, Evaluation and Impacts of the CAP (FAO, Rome, 2008).
272 Performance models used to collectively denote performance contracts, leasing, asset centralisation con-tracts and other models designed for supplier to help customer minimise total cost of ownership.
273 For a more in-depth discussion on performance-based business models, see Stahel, W. R., Palgrave McMillan, The Performance Economy (2006).
274 www.healthcare.siemens.com/refurbished-systems-medical-imaging-and-therapy; www.healthcare.philips.com/main/products/refurbished_systems/; www3.gehealthcare.com/en/products/categories/goldseal_-_re-furbished_systems/
275 www.desso-businesscarpets.com/corporate-responsibility/cradle-to-cradler/
276 By owning the energy bill, Philips is able to significantly reduce energy consumption and cost. www.ellen-macarthurfoundation.org/case_studies/philips-and-turntoo.
142 • DELIVERING THE CIRCULAR ECONOMY – A TOOLKIT FOR POLICYMAKERS
The partnership between Stockholm County Council and Philips Healthcare for the Nya Karolinska hospital has received a great deal of attention.277 The 20-year comprehensive, function-based delivery and service agreement covers the delivery, installation, maintenance, updating and replacement of medical imaging equipment such as MRI and ultrasound equipment, where the cost risk is carried by Philips and the upside potential (e.g. future lowered prices) is shared. This coincides with Philips opening a new, dedicated refurbishment and remanufacturing facility in Best, the Netherlands in 2014, announced as ‘the next step in our circular economy journey’.278 Allowing suppliers to retain control over their equipment and making full use of parts and components throughout their entire life cycle could generate substantial savings for the hospitals. Jens Ole Pedersen at Philips Healthcare Nordics notes that hospitals could save approximately 25% on TCO of the provided equipment.
Performance-based contractual models could cover more than technically advanced equipment or installations. Uniforms, bed and bathroom linens are commonly procured on a leasing contract. And even semi-durables, which are often used as one-way disposable equipment, are addressable for performance models. In Catalonia, which like Denmark focuses increasingly on the circular economy, Axioma Solucions provides sterilised surgical clothing as a service, while Matachana Group provides sterilisation solutions for equipment at hospitals’ facilities. Axioma Solucions notes that according to an independent study, their ‘Steripak’ can be cycled 75 times and consequently has a resource footprint one eighth that of corresponding one-way clothing, while being up to 15% more cost efficient.279
Danish hospitals have not yet adopted performance models to a large extent. The only category where there is a large penetration is in textiles; laundry services and leasing are already widely adopted.280 There is therefore a large opportunity to initiate such a shift, and the timing to do so appears very good. There are currently 16 large hospital projects in Denmark, seven greenfield projects and nine that are major renovations or expansions.281 Similar to the Nya Karolinska example, they could take a holistic, performance-based approach to procurement of equipment. These new hospitals will open within the next five to ten years, sufficient time to build a new procurement organisation and culture, with less concern for legacy equipment or old habits.
Given the current starting point, Denmark could gradually shift purchasing of goods towards performance models for the addressable share of the purchasing budget (Figure 33):
• By 2020, hospitals could seek to adopt performance contracts for up to 10% of selected product categories (diagnostic imaging and radiation equipment, IT equipment, and laboratory, observation and test equipment).
• By 2035, overall adoption of performance models could have increased to as much as 40%. In addition to product categories already addressed in the short term, similar procurement models could also have begun to penetrate other du-rable and semi-durable goods, such as selected surgical tools and apparel, where the safety/hygiene issues with looping materials can be properly addressed.
With total estimated savings of 15–30%282 compared to traditional procurement, applied to an addressable cost base of 38% of total hospital procurement (see Figure 33), modelling suggests Danish hospitals and equipment suppliers could by 2035 (2020)
277 Katharine Earley in The Guardian, Hospital innovation partnership set to deliver high quality, sustainable pa-tient care (13 November 2014).
278 philips.exposure.co/behind-the-factory-doors
279 The resource efficiency study was conducted by the Autonomous University of Barcelona.
280 Interview with De Forenede Dampvaskerier. Global players like Berendsen plc are also active in this field; www.berendsen.dk/hospital
281 Information provided by Danish Regions.
282 Savings rate depends on product category. Based on expert interviews with healthcare equipment providers and case studies from performance contracts in other industries (e.g. white goods, automotive, printers).

DELIVERING THE CIRCULAR ECONOMY – A TOOLKIT FOR POLICYMAKERS • 143
save EUR 70–90 (10–15) million annually.283 These findings give a directional view of the magnitude of this opportunity for Denmark. They rely by necessity on a number of assumptions, the most important of which are detailed in Appendix B. The estimate has not included more ‘generic’ products, such as lighting, flooring or printers.
BARRIERS AND POTENTIAL POLICY OPTIONS
The following paragraphs provide an initial perspective on the barriers limiting the ‘performance models in hospital procurement’ opportunity (see Section 2.2.4 for the barriers framework). Sector experts from both suppliers and hospitals have noted that the critical barrier to hospitals increasing their use of performance models is that hospital procurement staff are not trained and have limited experience of other forms of tenders such as performance contracts or assessing offerings based on total cost of ownership (TCO) – as well as limited time to change practices. Another social factor mentioned in interviews is the customary perception that leasing is often more expensive than buying and the uneasiness that performance contracts could allow increased private sector influence in public healthcare. Furthermore, hospital management and procurement departments in many cases lack information compared to equipment providers on the economic case for access over ownership. These barriers combine to provide a powerful force of inertia in procurement departments.
To address these barriers, the following policy options could be further investigated. These options are the result of an initial assessment of how cost-effectively different policy options might overcome the identified barriers (see Section 2.3.3):
• Guidelines and targets.
o Creating guidelines for regions or hospitals for the procurement of solutions rather than products, and how to work with target setting on different levels. International examples may serve as ‘blueprints’, such as the Philips–Nya Karolinska contract in Sweden. Through an innovative contract structure, the hospital secures access to a pre-defined level of functionality rather than the availability of specific equipment. Target setting also occurs in regional procurement partnerships in Denmark, e.g. the partnership for green procurement.
o Stimulating shared/centralised procurement amongst hospitals where appropriate, to reap economies of scale and leverage purchasing power. This could take the shape of a centrally negotiated performance-based contract across all regional hospitals, e.g. for lighting. The resulting additional cost savings could further accelerate a large-scale move towards such access-based contractual models.
o Supporting measures to optimise equipment utilisation such as equipment loan programmes between hospitals could round out the benefits from reshaping procurement procedures and skillsets.
• Capability building.
o Developing skillsets for circular economy-oriented procurement, e.g.
§ Training staff in optimal procurement design for access over ownership (e.g. the hospital could provide specialist training courses based on a nationally developed curriculum).
283 Based on current procurement volumes. This sector-specific impact does not include indirect effects, e.g. on supply chains, that are captured in the economy-wide CGE modelling. In addition, the distribution of savings between hospitals and suppliers has not been modelled. It could be argued that it is skewed towards hospi-tals in the short term since suppliers want to create incentives for hospitals to set up performance contracts, but could equilibrate at a more even split in the long-term as the model gets established and consolidated.

144 • DELIVERING THE CIRCULAR ECONOMY – A TOOLKIT FOR POLICYMAKERS
§ Initiating a performance model pilot to develop and apply the total cost of ownership (TCO) concept to allow a more holistic view of cost in hospital procurement – thereby creating a mindset as well as bidding rules that are more conducive towards performance contracts.
§ Building a repository of case studies from national and international examples to build confidence around issues such as e.g. cost efficiency, long-term benefits, contractual flexibility, and dependence on fewer suppliers.
o Establishing a government advisory body with the explicit mission of promoting performance-based contractual models in hospital procurement. Hospitals could be given the option to seek such advice for all or specific procurement projects. This could take the form of a partnership, task force, or network to facilitate knowledge sharing.
• Procurement rules
o Adjusting budget rules to enable joint budgets and closer working between procurement and technical teams (“breaking down siloes”). This could enable more performance-based contracts (with more procurement staff and fewer technical maintenance staff). Removing regulatory or governance barriers that impede interaction of hospital teams and supplier teams could also help.
o Adjusting procurement rules and procedures.
§ Augmenting the procedures for assessing the quality of competing bids with tightly defined ‘circularity’ criteria or KPIs. Such criteria could be part of the (non-binding) guidelines for public procurement and could include promotion, piloting, and knowledge sharing of purchasing criteria). Examples include length of lifetime, reparability, presence of chemicals that hinder recycling, design for disassembling features.
§ Incorporating accounting for externalities (e.g. the life cycle carbon/water/virgin materials footprint) into the guidelines or rules for all public procurement to create full cost transparency.
3.6.2 Waste reduction and recycling in hospitals
Opportunity: Centrally managed and systematic initiative to reduce waste and increase recycling.
2035 economic potential:
Not quantified.
Key barriers: Insufficient capabilities and skills due to lack of experience; custom and habit; imperfect information.
Sample policy options:
Pilot of waste reduction and recycling management integrated into staff training; waste minimisation and recycling targets; increased fiscal incentives to avoid waste generation.
Large hospitals are like miniature cities, with many sizable and complex flows of materials and information. And, similar to cities, they produce large quantities of waste. Hospitals are run by a central management that coordinates staff and sets a strategic direction for the whole organisation, and thus might have the potential to holistically optimise their waste management. Therefore, as is the case for other centrally and
DELIVERING THE CIRCULAR ECONOMY – A TOOLKIT FOR POLICYMAKERS • 145
tightly controlled systems such as airports, it is reasonable to envision hospitals as champions in both waste prevention and recycling.
THE OPPORTUNITY FOR DENMARK
The largest source of (non-hazardous) waste in hospitals is the purchasing and preparation of food and beverage. As explained by one sector expert, it is common for departments to order too many meals from the kitchen to add a safety margin, which risks being magnified by the kitchen’s safety margins. As a result hospital kitchens may end up purchasing more food and ingredients than needed, which ultimately produces avoidable food waste.
The approach to prevent avoidable food waste for large institutions such as hospitals differs from the alternatives laid out for the consumer-facing market (Section 3.2.2) in that it is more centred on right-sizing procured volumes. One way of incentivising this planning challenge is to set standards on sustainable procurement of the food and catering services, such as introduced by the NHS in the UK.284
Given its scale, hospitals could systemise and improve recycling beyond the already ambitious targets of the Danish society set by the ‘Denmark Without Waste’ strategy. Hospitals are part of the service sector where the target for recycling packaging waste in 2018 is 70% (paper, glass, metal and plastic) and 60% for recycling of organic waste in 2018.285 In comparison, Danish hospitals today note recycling rates of 15–30%, with an average below 20%.286
Danish hospitals therefore have an opportunity to make a systematic effort with strong management commitment to improve recycling, while at the same time reducing waste generation. While this effort needs to be driven primarily by a well-informed and committed staff, it could be guided by, for example, working with waste management suppliers that increasingly provide waste minimisation services apart from operating the logistics and treatment. While the potential has not been fully quantified in this case, it should be feasible to achieve overall recycling rates above of approximately 85% (70%) by 2035 (2020). This corresponds to being aligned with the ‘Denmark Without Waste’ target by 2020 and then gradually outpacing it.
BARRIERS AND POTENTIAL POLICY OPTIONS
The following paragraphs provide an initial perspective on the barriers limiting the ‘waste reduction and recycling in hospitals’ opportunity (see Section 2.2.4 for the barriers framework). Hospitals face similar social factor and information barriers when aiming to reduce waste generation and increase recycling as when trying to increase the use of performance models in procurement. There is limited capacity within hospital administrations to consider waste prevention and waste handling and, while procurement departments are already highly professional, hospitals lack expertise in waste prevention and management. Furthermore, hospital targets are centred on quality of healthcare; expert interviews indicate that there is resistance to the idea of adding to or diluting such targets with targets relating to waste. Furthermore, there is limited information on the economic benefits of reducing waste and increasing recycling due to a lack of analysis of procured and disposed materials in hospitals. As in the food and packaging sectors, the incentive to reduce waste and increase recycling would rise if the market prices of packaging, food and other consumables reflected their true environmental costs.
As before, at the level of individual hospitals, the main short-term challenge is improving capabilities and skills as well as changing mindsets. Over a longer time horizon, policymakers might choose to play a role by creating supporting guidelines (non-
284 UK Department of Health, The Hospital Food Standards Panel’s report on standards for food and drink in NHS hospitals (2014).
285 Danish Government, Denmark Without Waste. Recycle more – incinerate less (2013).
286 Excluding construction and garden waste. Based on interviews and correspondence with representatives from hospital environmental managers and Danish Regions.

146 • DELIVERING THE CIRCULAR ECONOMY – A TOOLKIT FOR POLICYMAKERS
binding) and rules (binding) as well as appropriate incentives. Central government might also also take on the externalities barrier by internalising more externalities in the production of food, packaging and other products that may end up being disposed of by hospitals as waste. Doing so would likely increase hospitals’ monetary incentive for waste avoidance and recycling.
To address these barriers, the following policy options could be further investigated. These options are the result of an initial assessment of how cost-effectively different policy options might overcome the identified barriers (see Section 2.3.3):
• Piloting the integration of waste reduction and recycling management into staff training across all hospital functions in new or leading hospitals, and syndi-cating the results into case studies for wider knowledge building.
• Setting waste minimisation and recycling targets for hospitals in line with overall national targets but taking into account its different, challenging) charac-ter, and include associated circular economy metrics in the performance criteria for hospital management.
• Investigate fiscal incentives to avoid non-hazardous waste streams to level the playing field for recycling initiatives as part of a national initiative for all sectors. A complementary measure would be the publication of waste avoid-ance/management performance league tables for hospitals.
• Creating or supporting a platform for Danish hospitals to share information, exchange best practices and develop a joint strategy for reducing waste and in-creasing recycling rates with a view to establishing the country as a frontrunner.
• Initiating a discussion on pricing in of externalities (but balancing with distributional effects) so that the market prices of food, packaging and other consumables reflect the full social and environmental costs of their production, consumption and disposal—and ultimately inform better procurement and opera-tional decisions.

DELIVERING THE CIRCULAR ECONOMY – A TOOLKIT FOR POLICYMAKERS • 147
APPENDIX


DELIVERING THE CIRCULAR ECONOMY – A TOOLKIT FOR POLICYMAKERS • 149
APPENDIX
A A detailed overview of sector selection in the Denmark pilot
This appendix summarises the details underlying the sector selection ‘matrix’ developed for the Denmark case study and shown in Figure 11 in Part 2: the selection of sub-dimensions, the data collection and the calculations. The list of sub-dimensions does not aim to be exhaustive and is not necessarily the optimal one for other regions, but could serve as an inspiration when conducting the sector selection elsewhere.
Figure A1 provides an overview of the sub-dimensions used in the Denmark pilot for the dimensions ‘Role in national economy’ (A) and ‘Circularity potential’ (B). It displays the type of assessment (quantitative vs. qualitative), an indication of how the calculations were performed and the relative weight of quantities within each sub-dimension. When the assessment was qualitative, a scoring-based assessment was performed to yield a ‘semi-quantitative’ result. The sources behind the data and analyses are reported. Figures A2 and A3 provide an overview of the relative scoring of each sub-dimension in the Denmark pilot.
A brief description of the sub-dimensions follows below.
Dimension A. Role in national economy.
A.1. Contribution to the national economy in terms of gross value added. Both the relative size of each sector’s gross value added and the relative growth rate were taken into account, in order to reflect shifting long-term trends as well as current contributions.
A.2. Contribution to national employment and job creation. Employment is obviously a key priority for any policymaker and was thus included in dimension A. Both the relative importance of each sector in terms of full time equivalents and the relative growth rate were taken into account, in order to reflect shifting long-term trends as well as current contributions.
A.3. Competitiveness – trade openness and security of supply. Export and import volumes were included to reflect each sector’s competitiveness on the international market.
A.4. Competitiveness – strategic dimensions. This sub-dimension is the sum of four qualitatively or quantitatively evaluated quantities illustrating the strategic importance of each sector for Denmark’s competitiveness in terms of technology, productivity and sensitivity to global trends. The sum synthesis was selected to reflect that all quantities are important but not necessarily interdependent. The qualitative evaluation was done by assigning a score of ‘high’, ‘medium’ or ‘low’ to each quantity, associated with scores of 10, 5 and 1 respectively.
• Patent activity – Danish patent activity in relation to other countries in the EU, by technology area mapped on Danish sectors.
• Export specialisation – Classification based on whether each sector’s share of Danish exports is significantly above, similar to, or below the average share of exports within the OECD.
• Productivity advantage – Reflects how productive Danish sectors are in com-parison with the same sectors in international peers.
• Energy price sensitivity – Energy expenditure as share of output value, in-cluded to reflect each sector’s sensitivity to changes in energy prices.

150 • DELIVERING THE CIRCULAR ECONOMY – A TOOLKIT FOR POLICYMAKERS
Dimension B. Circularity potential.
B.1. Material intensity – Purchase of commodities are shown as a share of the sector’s turnover to reflect how dependent the sector is on physical resources.
B.2. Environmental profile – Includes weights of both total waste volumes and recycling, in order to reflect both the tendency to create a leakage of material, which could potentially be avoided, and the proficiency with which the material is recovered today, which could potentially be improved.
B.3. Scope for improved circularity – The product of three qualitatively evaluations. A score of ‘high’, ‘medium’ or ‘low’ was assigned to each quantity, associated with scores of 10, 5 and 1 respectively. The product synthesis was selected due to the interdependence of the four quantities.
• Intrinsic material value of output (and waste). Qualitatively estimates the in-trinsic value of the material handled in each sector. Both raw materials and value-added parts are taken into account. Implies both economic and envi-ronmental value.
• Potential for higher value-add from circular activities. States how much more value could potentially be added through circular economy activities; e.g. the theoretical amount of intrinsic material value, value added services, and lon-ger lifetime. Implies both economic and environmental value.
• Feasibility in terms of cost and complexity of implementation. Sizes the esti-mated feasibility of improving circularity, accounting for e.g. whether prod-ucts/materials cross borders or not, how materials are mixed, the cost of sep-aration, and feasibility to engage customers.

DELIVERING THE CIRCULAR ECONOMY – A TOOLKIT FOR POLICYMAKERS • 151
Prio
riti
sati
on o
f se
ctor
s ba
sed
on C
ircu
lari
ty
pote
ntia
l
Prio
riti
sati
on
sect
ors
base
d on
role
in
the
nati
onal
ec
onom
y
NO
TE: G
VA =
gro
ss v
alue
ad
ded
; CA
GR
= c
omp
ound
ann
ual g
row
th r
ate.
Figu
re A
1: Su
mm
ary
of m
etho
ds a
nd d
ata
used
in th
e se
ctor
sel
ecti
on in
the
Den
mar
k pi
lot
A B

152 • DELIVERING THE CIRCULAR ECONOMY – A TOOLKIT FOR POLICYMAKERS
SECTORS GVA1 CAGR1 FTEs1 CAGR1 Imports2 Exports2
Strategic dimen-sions3
Pharmaceuticals
Machinery
Food and Beverages
Basic Metals and fabricated products
Electronic products
Rubber and plastic products
Construction
Hospitals
Mining and quarrying
Shipping
Electricity and gas
Agriculture, forestry and fishing
Water supply, sewerage
High Medium Low
A.1 A.2 A.3 A.4
1 Green: value add/employees >4% of total, CAGR >3%; Red: value add/employees <1% of total; CAGR <0%, Orange: value add/employees 1-4% of total, CAGR 0-3%. 2 Green: imports/exports >5% of total; Red: imports/exports <1% of total; Orange: Imports/exports 1-5% of total. 3 Semi-quantitative. SOURCE: Ellen MacArthur Foundation.
Figure A2: Overview of scoring of ‘Role in national economy’ in the Denmark pilot

DELIVERING THE CIRCULAR ECONOMY – A TOOLKIT FOR POLICYMAKERS • 153
SECTORSMaterial intensity1
Waste generated2
Share not recovered3
Score for improved circularity
Pharmaceuticals
Machinery
Food and Beverages
Basic Metals and fabricated products
Electronic products
Rubber and plastic products
Construction
Hospitals
Mining and quarrying
Shipping
Electricity and gas
Agriculture, forestry and fishing
Water supply, sewerage
High Medium Low
B.1 B.2 B.3
1 Green: material value >40% of sales turnover; Red: material value 10% of sales turnover; Yellow: material value 10-40% of sales turnover. 2 Green: waste generated ≥10%; Red: waste generated <1%; Yellow: waste generated is 1%-10% of total waste in Denmark 3 Share of waste not recycled. SOURCE: Ellen MacArthur Foundation.
Information n/a
Figure A3: Overview of scoring of ‘Circularity potential’ in the Denmark pilot

154 • DELIVERING THE CIRCULAR ECONOMY – A TOOLKIT FOR POLICYMAKERS
B Opportunity prioritisation and sector impact assessment
This appendix describes the assumptions and calculations behind the opportunity prioritisation and impact assessment for each focus sector in the Denmark case study. The methodology for the assessment is described in Sections 2.2.1 – 2.2.3, and the broader context of the results are presented in Part 3 of this report.
As described in Section 2.2.2, two scenarios were defined for the Denmark pilot, one for 2020 and one for 2035. The scenario description serves as a guideline for how the business environment and consumer behaviour, as well as technology, could evolve going forward. It offers a common backdrop to define and assess the different identified opportunities.
Figure B2 gives an overview of how the opportunities identified and mapped using the ReSOLVE framework, were assessed and prioritised, as described in Sections 2.2.1 and 2.2.2. The ten prioritised opportunities span one or more actions in the framework outlined below. An economic impact assessment was conducted for seven of these opportunities. In addition, an estimate of the increased tonnage of plastic packaging recycling was computed, driven by estimates of increased collection rates and yields at recycling facilities. Figures B3–B9 summarise the assumptions, estimates and scaling for each of these assessments, along with the sources used. These assumptions should be read in light of the scenario description detailed in Figure B1. It should be noted that due to variations in the use of scale-factors between the conservative and ambitious circular economy scenarios, the relative contribution of each opportunity to the total sector-specific impact are different and the overview of sector-specific impact presented in Figure 27 is an average of these two scenarios.
Short-term (2020) Long-term (2035)
• Increased acceptance of performance based business models in businesses and the public sector, but still for niche product categories (e.g. ~10% of imaging / radiation equipment in hospitals, ~10% of machinery products)
• Households are comfortable using new separation systems introduced by municipalities as part of the “Denmark Without Waste” strategy (e.g. increase in collection rate of household plastic packaging waste by 15 percentage points)
• Significant remaining margins for improvement in waste reduction
• Rapidly increasing interest in sharing business models (e.g. shared residential and office space)
• Broad acceptance of access over ownership business models in businesses and public sector (e.g. ~30% of a broad range of products in hospitals, ~30-70% of machinery products)
• Fully optimised waste collection and separation infrastructure provided by municipalities and waste managers (collection of 70-80% of plastics for recycling)
• Avoidable food waste reduction approaching theoretical limits due to improved knowledge and use of best practices among consumers, businesses and public institutions (e.g. hospitals)
• Sharing has become the new norm for traditionally underutilised assets (buildings, cars, and durables)
• Key circular economy technologies (e.g. cascading bio-refineries, bio-based alternatives to plastics, 3D printing and design for disassembly in construction, remanufacturing techniques), existing today at late R&D or early commercial stage, have been successfully piloted
• Key circular economy technologies existing today at R&D or early commercial stage have reached maturity due to accelerated innovation
• Increasing remanufacturing of machinery components for use in “as new” products enabled by increasing importance of software for performance
Source: Expert interviews; DBA; Danish EPA; Ellen MacArthur Foundation.
BUSINESS & CONSUMER BEHAVIOUR
TECHNOLOGY
Figure B1: Short-term and long-term scenarios used in the Denmark pilot

DELIVERING THE CIRCULAR ECONOMY – A TOOLKIT FOR POLICYMAKERS • 155
Food and beverage:
• Value capture in cascading bio-refineries (Loop; implicitly Regenerate if more organic materials are returned to the bio-cycle). Impact assessment described in Figure B3.
• Reduction of avoidable food waste (Optimise). Impact assessment described in Figure B4.
Construction and real estate:
• Industrialised production and 3D printing of building modules (Optimise, Ex-change). Impact assessment described in Figure B5.
• Reuse and high-value recycling of components and materials (Loop). Impact as-sessment described in Figure B5.
• Sharing and multi-purposing of buildings (Share; implicitly Virtualise as an en-abler). Impact assessment described in Figure B6.
Machinery:
• Remanufacturing and new business models (Loop; implicitly Share as opportu-nity is partly enabled by performance models that imply access over ownership and design for upgradability). Impact assessment described in Figure B7.
Packaging:
• Increased recycling of plastic packaging (Loop). Calculation of additional plastic material recycling described in Figure B8.
• Bio-based packaging where beneficial (Regenerate).
Hospitals:
• Performance models in procurement (Loop, Share). Impact assessment de-scribed in Figure B9.
• Waste reduction and recycling in hospitals (Loop, Optimise).

156 • DELIVERING THE CIRCULAR ECONOMY – A TOOLKIT FOR POLICYMAKERS
Figure B2: Qualitative opportunity prioritisation of focus sectors in the Denmark pilot
1 Assessment based on focus subsector, product category or material stream in each sector. Food & beverage: Waste/by-products from pork / dairy processing, residual biomass from agriculture, organic waste from households, retail & hospitality. Construction: New buildings. Machinery: Manufacturing of pumps and wind turbines. Packaging: Plastic packaging. Hospitals: Purchasing of goods. SOURCE: Ellen MacArthur Foundation
QUALITATIVE ASSESSMENT OF POTENTIAL IN DENMARK PILOT1
Low potential High potential
Prioritised for fur-ther assessment
Indirectly included or enabler of key sector opportunities
FOOD & BEV. CONSTRUCTION MACHINERY PACKAGING HOSPITALS
XCHANGE

DELIVERING THE CIRCULAR ECONOMY – A TOOLKIT FOR POLICYMAKERS • 157
NO
TE: R
esul
ts e
stim
ated
for
imp
act
of in
dus
trie
s in
sid
e D
enm
ark
only
. Thi
s se
ctor
-sp
ecifi
c im
pac
t d
oes
not
incl
ude
ind
irect
eff
ects
, e.g
. on
sup
ply
cha
ins,
tha
t ar
e ca
ptu
red
in
the
econ
omy-
wid
e C
GE
mod
ellin
g. B
aU =
bus
ines
s as
usu
al.
SOU
RC
ES:
1
Fiv
e co
mp
any
/ in
dus
tria
l org
anis
atio
n in
terv
iew
s an
d fi
ve s
ecto
r ex
per
t in
terv
iew
s.
2 A
dd
itio
nal p
rice
per
ton
ne d
epen
den
t on
typ
e of
by-
pro
duc
t/w
aste
and
its
app
licat
ion.
Ene
rgy
pro
duc
tion
as
bio
fuel
l/b
iog
as e
stim
ated
to
gen
erat
e ad
dit
iona
l EU
R 2
0–3
0/
tonn
e. N
ew c
hem
ical
s es
tim
ated
to
gen
erat
e E
UR
70
–80
/ton
ne. C
osts
est
imat
ed t
o 4
0–5
0%
of
pro
duc
t va
lue.
3
The
Net
herl
and
s O
rgan
isat
ion
for
Ap
plie
d S
cien
tific
Res
earc
h, O
pp
ortu
niti
es f
or a
Circ
ular
Eco
nom
y in
the
Net
herl
and
s (2
013
). P
rici
ng e
stim
ates
der
ived
fro
m a
pp
roxi
mat
e cu
rren
t an
d f
utur
e p
rice
s fo
r a
34 w
aste
/ b
y-p
rod
uct
stre
ams.
4
Dan
ish
EPA
, Org
anis
ke r
estp
rod
ukte
r -
vurd
erin
g a
f p
oten
tial
e og
beh
and
let
mæ
ngd
e (2
014
); K
ortl
æg
ning
af
mad
affal
d i
serv
ices
ekto
ren
(20
14);
Kor
tlae
gni
ng a
f d
agre
nova
tion
i D
anm
ark
- M
ed f
okus
på
etag
ebol
iger
og
mad
spild
(20
14).
5
Est
imat
e, t
aken
as
80%
of
was
te g
ener
ated
by
the
food
and
bev
erag
e in
dus
try
per
EU
R o
f G
VA
(fr
om S
tati
stic
s D
enm
ark)
. See
als
o M
. Gyl
ling
et
al.,
The
10+
mill
ion
tonn
es
stud
y: in
crea
sing
the
sus
tain
able
pro
duc
tion
of
bio
mas
s fo
r b
iore
finer
ies,
Uni
vers
ity
of C
open
hag
en (
2013
), c
oncl
udin
g t
hat
the
agri
cult
ural
sec
tor
coul
d p
rod
uce
an a
dd
itio
nal
10 m
illio
n to
nnes
of
by-p
rod
ucts
for
use
in b
io-r
efine
ries
.
Figu
re B
3: V
alue
cap
ture
in c
asca
ding
bio
-refi
neri
es
Imp
act
asse
ssm
ent
sum
mar
y, 2
035
Food
and
be
vera
ge
Size
as
shar
e of
fo
od a
nd b
ever
age
se
ctor

158 • DELIVERING THE CIRCULAR ECONOMY – A TOOLKIT FOR POLICYMAKERS
NO
TE: R
esults estimated
inside D
enmark only. This sector-sp
ecific imp
act does not includ
e indirect eff
ects, e.g. on sup
ply chains,
that are captured
in the economy-w
ide C
GE
mod
elling. B
aU = b
usiness as usual. SO
UR
CE
S: 1 SITR
A, A
ssessing the circular econom
y potential for F
inland (20
15). 2 E
urostat. 3 D
anish Governm
ent, Denm
ark without w
aste I (2013); D
anmark ud
en affald
II (2015).
4 A
. Halloran et al., A
dressing
food w
aste reduction in D
enmark (Food
policy 4
9, 2014
). 5 D
anish Environm
ental Protection A
gency, K
ortlæg
ning af d
agsrenovation i D
anmark – M
ed fokus p
å etageb
oliger og
mad
spild
(20
14).
6 Danish E
nvironmental P
rotection Ag
ency, Kortlæ
gning
af mad
affald
i servicesektoren: Detaljhand
el, restauranter og storkøkkener
(2014
).
Figure B4: Reduction of avoidable food waste
Imp
act assessment sum
mary, 20
35

DELIVERING THE CIRCULAR ECONOMY – A TOOLKIT FOR POLICYMAKERS • 159
NO
TE: R
esul
ts e
stim
ated
for
imp
act
of in
dus
trie
s in
sid
e D
enm
ark
only
. Thi
s se
ctor
-sp
ecifi
c im
pac
t d
oes
not
incl
ude
ind
irect
eff
ects
, e.g
. on
sup
ply
cha
ins,
tha
t ar
e ca
ptu
red
in
the
eco
nom
y-w
ide
CG
E m
odel
ling
. BaU
= b
usin
ess
as u
sual
. SO
UR
CE
S:
1 E
stim
ate,
info
rmed
by
thre
e co
mp
any
inte
rvie
ws
and
thr
ee s
ecto
r ex
per
t in
terv
iew
s.
2 E
stim
ates
bas
ed o
n re
por
ted
sav
ing
s by
the
Bro
ad G
roup
and
Win
Sun,
con
solid
ated
in e
xper
t in
terv
iew
s. 3
D p
rint
ing
sav
ing
s es
tim
ated
as
50%
of
Win
Sun’
s re
por
ted
sa
ving
s, s
ince
the
re is
sti
ll ve
ry li
ttle
dat
a to
exe
mp
lify
cost
sav
ing
s. A
ctua
l sav
ing
s w
ill v
ary
on a
cas
e-by
-cas
e b
asis
and
be
dep
end
ent
on t
he s
ize
and
com
ple
xity
of
com
pon
ents
bei
ng 3
D p
rint
ed. S
ee a
lso
Elle
n M
acA
rthu
r Fo
und
atio
n, S
UN
and
McK
inse
y C
ente
r fo
r B
usin
ess
and
Env
ironm
ent,
Gro
wth
Wit
hin:
A C
ircu
lar
Econ
omy
Vis
ion
for
a C
omp
etit
ive
Eur
ope
(20
15);
ww
w.a
rchd
aily
.com
/289
496
/; h
ttp
://w
ww
.yhb
m.c
om/i
ndex
.php
?sit
eid
=3
3 E
stim
ates
, inf
orm
ed b
y lit
erat
ure
and
exp
ert
inte
rvie
ws.
See
, e.g
. US
Env
ironm
enta
l Pro
tect
ion
Ag
ency
, Usi
ng R
ecyc
led
Ind
ustr
ial M
ater
ials
in B
uild
ing
s (2
00
8); S
kive
m
unic
ipal
ity,
Afs
lutn
ing
srap
por
t P
roje
kt G
enby
g S
kive
(20
15).
4 S
tati
stic
s D
enm
ark.
5
P.-E
. Jos
ephs
on &
L. S
aukk
oriip
i, W
aste
in c
onst
ruct
ion
pro
ject
s: c
all f
or a
new
ap
pro
ach
(Cha
lmer
s U
nive
rsit
y of
Tec
hnol
ogy,
20
07)
; M. H
ogan
, The
Rea
l Cos
ts o
f B
uild
ing
H
ousi
ng (
SPU
R, 2
014
).
Figu
re B
5: In
dust
rial
ised
pro
duct
ion
and
3D p
rint
ing
of b
uild
ing
mod
ules
; reu
se a
nd h
igh-
valu
e re
cycl
ing
of c
ompo
nent
s an
d m
ater
ials
Imp
act
asse
ssm
ent
sum
mar
y, 2
035
AB

160 • DELIVERING THE CIRCULAR ECONOMY – A TOOLKIT FOR POLICYMAKERS
Figure B6: Sharing and multi-purposing of buildings
Impact assessment summary, 2035
NOTE: Results estimated for impact inside Denmark only. This sector-specific impact does not include indirect effects, e.g. on supply chains, that are captured in the economy-wide CGE modelling. BaU = business as usual. SOURCES: 1 Estimate, informed by literature: GSA Office of Government-wide Policy, Workspace utilisation and allocation benchmark (2011); Cushman & Wakefield, Office space across the world (2013); vasakronan.se/artikel/det-digitala-arbetslivet-ar-har; SITRA, Assessing the circular economy potential for Finland (2015); Ellen MacArthur Foundation, SUN and McKinsey Center for Business and Environment, Growth Within: A Circular Economy Vision for a Competitive Europe (2015). 2 Statistics Denmark; 100% of commerical buildings; 10% of residential, small residential, small non-residential buildings; 50% of public buildings and sports buildings. 3 Statistics Denmark. 4 Office hours = 10 hours per day, After hours = 4 hours per day. Current utilization during office hours taken as 20% higher than reported by GSA.
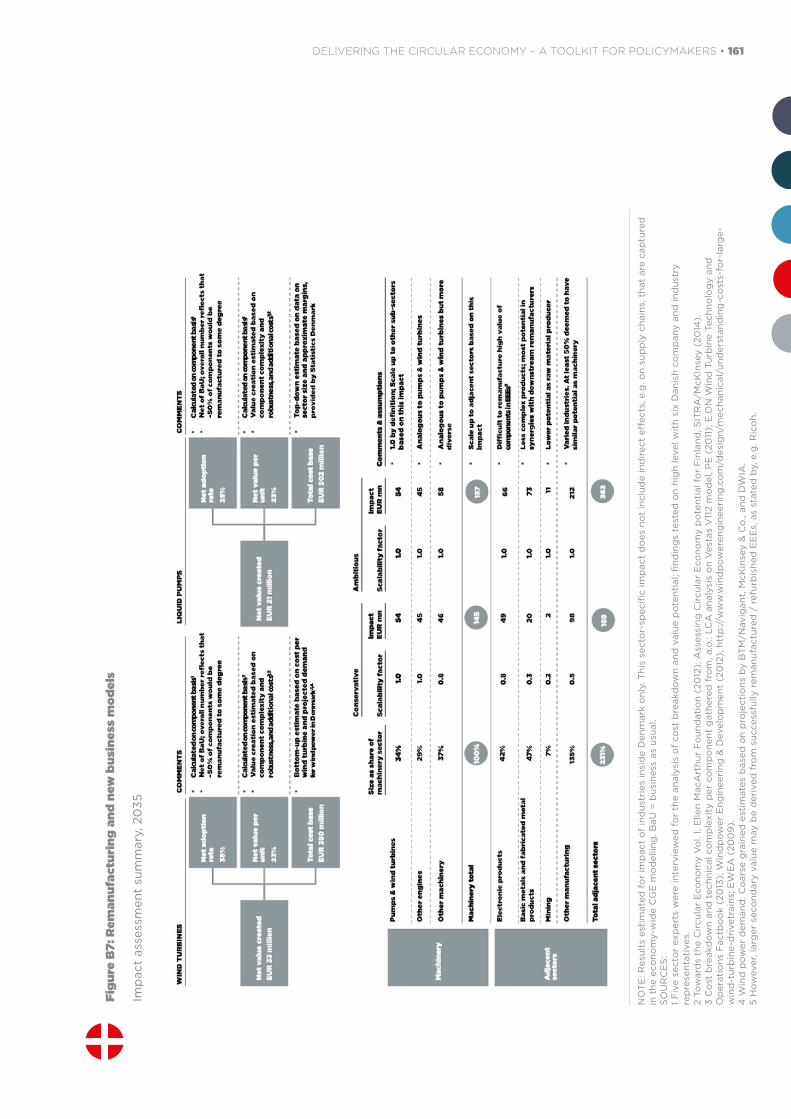
DELIVERING THE CIRCULAR ECONOMY – A TOOLKIT FOR POLICYMAKERS • 161
Figu
re B
7: R
eman
ufac
turi
ng a
nd n
ew b
usin
ess
mod
els
Imp
act
asse
ssm
ent
sum
mar
y, 2
035
NO
TE: R
esul
ts e
stim
ated
for
imp
act
of in
dus
trie
s in
sid
e D
enm
ark
only
. Thi
s se
ctor
-sp
ecifi
c im
pac
t d
oes
not
incl
ude
ind
irect
eff
ects
, e.g
. on
sup
ply
cha
ins,
tha
t ar
e ca
ptu
red
in
the
eco
nom
y-w
ide
CG
E m
odel
ling
. BaU
= b
usin
ess
as u
sual
. SO
UR
CE
S:
1 F
ive
sect
or e
xper
ts w
ere
inte
rvie
wed
for
the
ana
lysi
s of
cos
t b
reak
dow
n an
d v
alue
pot
enti
al; fi
ndin
gs
test
ed o
n hi
gh
leve
l wit
h si
x D
anis
h co
mp
any
and
ind
ustr
y re
pre
sent
ativ
es.
2 To
war
ds
the
Circ
ular
Eco
nom
y V
ol. I
, Elle
n M
acA
rthu
r Fo
und
atio
n (2
012
); A
sses
sing
Circ
ular
Eco
nom
y p
oten
tial
for
Fin
land
, SIT
RA
/McK
Inse
y (2
014
).
3 C
ost
bre
akd
own
and
tec
hnic
al c
omp
lexi
ty p
er c
omp
onen
t g
athe
red
fro
m, a
.o.:
LCA
ana
lysi
s on
Ves
tas
V11
2 m
odel
, PE
(20
11);
E.O
N W
ind
Tur
bin
e Te
chno
log
y an
d
Op
erat
ions
Fac
tboo
k (2
013
); W
ind
pow
er E
ngin
eeri
ng &
Dev
elop
men
t (2
012
), h
ttp
://w
ww
.win
dp
ower
eng
inee
ring
.com
/des
ign/
mec
hani
cal/
und
erst
and
ing
-cos
ts-f
or-l
arg
e-w
ind
-tur
bin
e-d
rive
trai
ns; E
WE
A (
200
9).
4 W
ind
pow
er d
eman
d: C
oars
e g
rain
ed e
stim
ates
bas
ed o
n p
roje
ctio
ns b
y B
TM/N
avig
ant,
McK
inse
y &
Co.
, and
DW
IA.
5 H
owev
er, l
arg
er s
econ
dar
y va
lue
may
be
der
ived
fro
m s
ucce
ssfu
lly r
eman
ufac
ture
d /
ref
urb
ishe
d E
EE
s, a
s st
ated
by,
e.g
. Ric
oh.

162 • DELIVERING THE CIRCULAR ECONOMY – A TOOLKIT FOR POLICYMAKERS
NOTE: This sector-specific impact does not include indirect effects, e.g. on supply chains, that are captured in the economy-wide CGE modelling. SOURCES: 1 Total volumes: Danish Environmental Protection Agency, Statistik for emballageforsyning og indsamling af emballageaffald 2012 (2015). Volume distribution and recycling rates are reconciled from 2008 data provided by the Danish Environmental Protection Agency. 2 Accurate data for PET not inluded in used data set. The the recycling rate is therefore assumed not to change, thus giving a zero contribution to the 2035 scenario. 3 Estimates, based on interviews with sector experts from the waste management industry and the Danish Environmental Protection Agency. 4 Estimates, based on interviews with sector experts and ambition levels presentet in the Denmark without waste strategy. Danish Government, Denmark without waste. Recycle more, incinerate less (2013). 5 Calculated as the sum of addtional volume collected by 2035 at 2035 yield and the additional yield of the collected baseline volume.
Figure B8: Increased recycling of plastic packaging
Impact assessment 2013
Figure B9: Performance models in procurement
Impact assessment summary, 2035
NOTE: This sector-specific impact does not include indirect effects, e.g. on supply chains, that are captured in the economy-wide CGE modelling. BaU = business as usual. SOURCES: 1 Statistics Denmark, Danish Regions 2 Estimates, informed by 4 company interviews; 4 hospital / sector expert interviews 3 Savings rate depends on product category. Based on expert interviews with healthcare equipment providers and case studies from performance contracts in other industries (e.g. white goods, automotive, printers). The distribution of savings between hospitals and suppliers has not been modelled. It could be argued that it is skewed towards hospitals in the short term since suppliers want to create incentives for hospitals to set up performance contracts, but could equilibrate at a more even split in the long-term as the model gets established and consolidated. 4 Weighted averages of product categories

DELIVERING THE CIRCULAR ECONOMY – A TOOLKIT FOR POLICYMAKERS • 163
C Economy-wide impact quantification
Economy-wide impact assessment methodology The economy-wide impact assessment was conducted using NERA Economic Consulting’s NewERA global model. A multi-sector, multi-region trade, dynamic computable general equilibrium model. The model uses standard macro and microeconomic theory to represent the flow of goods and factors of production within the economy. A simplified version of these interdependent economic flows is shown in Figure C1. It illustrates the flow of goods, services and payments in a typical CGE set up between the different economic agents in the domestic and international markets.
Figure C1: Overview of a Computable general equilibrium (CGE) model
In the model, there is a representative household in each region. Households supply factors of production, including labour and capital, to firms. In return, firms provide households with payments for the factors of production. Firm output is produced from a combination of productive factors and intermediate inputs of goods and services supplied by other firms. The final output of individual firms can be consumed within Denmark or exported. The model also accounts for imports into Denmark. Goods and services in the model are treated as ‘Armington’ goods and services, that is, imported and domestically produced goods and services are assumed to be only imperfect substitutes.
In addition to consuming goods and services, households can accumulate savings, which they provide to firms for investments in new capital. Taxes are collected by a passive government, which recycles tax receipts back to the households as lump-sum transfers.
Another feature of the CGE framework is that all markets are required to clear, meaning that the sum of regional products and factors of production must equal their demands, and that the income of each household must equal its factor endowments plus any net transfers received. In other words, there can be ‘no free lunches’. The model assumes general equilibrium, which requires that for all sectors, regions and time periods, there is a global equilibrium where supply and demand are equated simultaneously, as producers and households anticipate all future changes. The mechanism by which this is achieved is through price changes.
To analyse the economic impact of scenarios (e.g. structural change from increased circularity in the economy), CGE models such as the NewERA model represent the interactions and feedback effects in the exchange of goods and services simultaneously between consumers, producers and government and across sectors, regions and time.
Exports

164 • DELIVERING THE CIRCULAR ECONOMY – A TOOLKIT FOR POLICYMAKERS
They are therefore particularly useful to assess both the direct and indirect effects of structural changes and are able to analyse scenarios of changes to the economy with potentially large impacts that have not been implemented in the past.
Limited work has been done to date in modelling the circular economy in a CGE framework. Our review of the literature identified just two sources that would qualify as economic impact assessments of the circular economy using hybrid or CGE frameworks.1 At the time of writing, to our knowledge, there are no CGE models that can fully represent the attributes of a truly circular economy. These include: inputs and material substitutions; changes in resource productivity and production technology; new circular economic sectors, their services and products; priced externalities; and the generalised changes in the stocks and flows of goods, capital, labour and materials.
CGE model description
The CGE model used for the analysis represents five world regions: Denmark and its main trading partners, which have been aggregated as the Rest of Europe, China, Oil exporting countries and Rest of the world. Different aggregations of the economic sectors were used for Denmark and the other regions. In Denmark there are 21 economic sectors (16 non-energy and 5 energy sectors), while in the rest of the world 17 economic sectors (12 non-energy and 5 energy) were represented. From a time perspective, the model was set up to span between 2015 and 2035 and was run in 5-year time increments. These sectoral and geographic dimensions are summarised in Figure C2.
1 Assessment of Scenarios and Options towards a Resource Efficient Europe, European Commission (2014), and A National CGE modeling for Resource Circular Economy, Korea Environment Institute (2006).

DELIVERING THE CIRCULAR ECONOMY – A TOOLKIT FOR POLICYMAKERS • 165
SECTOR DESCRIPTION REGION
Denmark EU, China, OPEC, RoW
GAS Natural gas works Yes Yes
OIL Refined oil products Yes Yes
COL Coal transformation Yes Yes
CRU Crude oil Yes Yes
ELE Electricity, gas and heat Yes
ELY Electricity Yes
GDT Gas and heat Yes
MEP Machinery and electronic products Yes Yes
CNS Construction - New buildings and infrastructure Yes Yes
CNS-Repair Construction - Repair and maintenance of buildings Yes
FBV Food and beverages Yes Yes
CHM Chemical industry, plastics and pharmaceuticals Yes Yes
AGR Agriculture, forestry and fishing Yes Yes
FAB Basic metals and fabricated metal products Yes Yes
MIN Mining Yes Yes
AOG Other manufacturing Yes Yes
WRH Services - wholesale, retail and hospitality Yes Yes
SER Services Yes
RPD Services - Repair of machinery and other durables Yes
RNT Services - Renting of buildings Yes
HSP Services - Hospitals Yes
SOT Services - other Yes
TRN Transport Yes Yes
WTR Sewerage and waste management Yes Yes
SOURCE: NERA Economic Consulting.
Producer behaviour in the model is characterised by a ‘production function’. A production function represents how different inputs are used to manufacture a commodity or service. For example, production of machinery requires capital, labour, energy, and other materials as inputs. Parameters in the production function define the way in which substitution between inputs and outputs changes in response to changes in the relative prices of inputs and outputs. These price-induced substitution relationships are called ‘elasticities’. Figure C3 provides an illustrative representation of a production function. The sigmas (σ) shown are illustrative substitution elasticities between the different inputs. Consumer behaviour, the production of natural resources and regional trade are similarly represented in the CGE model by these ‘nested’ functions.
Theoretically, there are several ways to represent the circular economy within a CGE framework and, as with any modelling exercise, choosing between options involves an effort versus quality trade-off. This trade-off will be between the availability of time, effort and data on the one hand, and the required quantity and quality of detail in
Figure C2: Sectoral and geographical aggregates in the CGE Model in the Denmark pilot

166 • DELIVERING THE CIRCULAR ECONOMY – A TOOLKIT FOR POLICYMAKERS
representing circular economy activities, sectors and flows of goods, materials and externalities, on the other.
Figure C4 presents four potential approaches to represent circularity in a CGE framework and their pros and cons. For policymakers to select which of those approaches is best suited to their needs, there are three important aspects to consider:
1. Detail and precision in representation of economic relations in the circular econ-omy (e.g. are sectors and services associated with circular economy activities to be explicitly modelled, e.g. product dismantlers in the refurbished goods supply chain?).
2. Degree and scope of representation of economic and materials flows (e.g. in ad-dition to monetary flows, does the model need to explicitly represent physical flows of virgin materials, recovered/recycled materials, different by-product and waste types?).
3. Time and effort requirements,(duration of the assessment, access to internal and external experts and modellers) and data and assumption requirements (quantity of primary data readily available to model the required level of detail).
As shown in Figure C4, the approach selected for the Denmark pilot study was chosen as a balanced compromise between the three criteria above.
As described in Section 2.3.1, the hybrid approach consists of several steps preceding the actual CGE modelling. As described in Figure 19, it begins with representing the impact induced by circular economy scenarios in the focus sectors in the form of an input-output table. These changes are then used to ‘re-parametrise’ production (and utility) functions according to the following procedure:
• Interpolate input effects from cost savings (or increases) as well as output ef-fects of revenue increases per focus sector for intermediate model years 2025 and 2030 based on the sector-specific quantification for years 2020 and 2035.
• Re-parametrise production functions (i.e. estimate new parameter values) to match decreases (or increases) in the values of input factors into the focus sec-tors relative to the baseline value.
• Re-parametrise production functions to match increases (or decreases) in the values of the output from focus sectors relative to the baseline value.
• Impose these time-varying changes in inputs and outputs for all model years (i.e. the input-output value structure of implementing the circular economy opportu-nities) by redefining (re-calibrating) the production formulae of all focus sectors.
After re-parametrisation, the model is run and will optimise supply and demand of all commodities and services in the economy via price impacts. The results for the re-parametrised version of the production (and utility) functions now represent the circular economy scenario(s) in the CGE model and can then be compared to the baseline scenario.
Scenario descriptions, key assumptions and sources
• The macro-economic impact modelling was conducted by calibrating the CGE model to a ‘baseline’ (or business as usual) reference scenario and then quantify-ing the changes to key macroeconomic indicators after running a ‘circular econ-omy’ scenario through the model. Two scenarios were assessed, a ‘conservative’ and an ‘ambitious’ version of the circular economy.
• As described above, the scenario inputs to the CGE model were modified in-put-output tables for Denmark for the years 2020 and 2035, where input and output values were adjusted based on the impact from the sector-specific op-portunity assessment (see Section 2.2.3, Chapters 3.2–3.6 and Appendix B).

DELIVERING THE CIRCULAR ECONOMY – A TOOLKIT FOR POLICYMAKERS • 167
APPROACH DESCRIPTION PROS CONS
Use an existing CGE framework to model circularity as an in-crease in resource efficiency or changes in consumption pref-erences
Simplest approach to (partially) modelling circularity
Very general representation
Impacts depend on exogenous parameters (productivity or preferences)
Partial representation or circu-larity, no structural change
As part of a hybrid approach, re-estimate production func-tions in existing CGE structure to match the sector specific estimates of circularity
Easy to implement bottom-up cost and output effects
Captures direct effects on focus sectors and indirect effects on the economy
Limited data requirements and easily replicable
Bottom-up cost and output ef-fects are exogenous
Materials flows not explicitly modelled (captured indirectly by financial flows)
Only partial representation of structural change (no new tech-nologies or sectors)
Develop CGE structure that includes new circular activities (e.g. regenerate, share) as sepa-rate economic activities. Works with hybrid approaches.
Does not require quantifying effects in an ad hoc manner
Approximate size and some effects of circular economy can be quantified
Important time and effort re-quirement
Significant requirement of de-tailed data / assumptions of new activities to calibrate model
Develop CGE structure that rep-resents all materials and value flows and represents all exter-nalities in production and utility functions. Works with hybrid approaches.
Highly detailed representation of circular sectors and flows
Size and effects of circular econ-omy quantified
Circularity levers endogenously determined
Very time-intensive and complex modelling exercise
Substantial data and assump-tions requirements
APPROACH SELECTED FOR DENMARK PILOT
Figure C4: Potential approaches and trade-offs for representing circularity within a CGE framework
Figure C3: Generic structure of production functions in the CGE Model
SOURCE: NERA Economic Consulting.
SOURCE: NERA Economic Consulting.

168 • DELIVERING THE CIRCULAR ECONOMY – A TOOLKIT FOR POLICYMAKERS
Data Data source
Denmark Rest of World
Benchmark year input/output table Statistics Denmark GTAP 8 database
Primary factor and commodity tax rates, output and export tax (subsidy) rates, and import tax rates
GTAP 8 database
Substitution elasticities for production, consumptions functions
• GTAP 8 dataset includes Armington elasticities, intra-import elasticity of substitution, factor substitution elasticities, factor transformation elasticities.
• Other sources include: - Paltsev, S., J.M. Reilly, H.D. Jacoby, R.S. Eckaus, J.
McFarland, M. Sarofim, M. Asadoorian and M. Babiker, 2005: The MIT Emissions Prediction and Policy Analysis (EPPA) Model: Version 4.
- Mikkel Barslund, Ulrik R. Beck, Jens Hauch, Peter B. Nellemann, “MUSE: Model documentation and applications,” Danish Economic Council, Working Paper 2010:4.
GDP and employment data and projections to 2035 DREAM group
1.A.1.1.1.1.1 EIA IEO 20131
Energy demand data and projections to 2035
Danish Energy Agency (ENS)
Statistics Denmark
Own calculations
Energy price data and projections to 2035
Energy production data and projections
CO2 emissions data and projection to 2035
The macro-economic model therefore quantified the direct and indirect econo-my-wide effects that the sector specific structural changes would have on the broader Danish economy.
Baseline scenario. The baseline scenario was developed through the following steps:
• Incorporating the Denmark 2011 input-output table within the GTAP8 dataset and scaling other regions’ economic flows by actual GDP growth from 2007 till 2011 such that a globally balanced dataset was achieved.
• Building in exogenously specified regional forecasts, including Danish projections
• Calibrating the baseline: Adjusting model parameters such that they replicate the macroeconomic outlook by targeting GDP, carbon emissions by sector and by fuel, energy price, and energy production projections. This baseline calibration resulted in a projection consistent with the baseline scenario assumptions.
Circular economy scenarios. From a macroeconomic modelling perspective, the key assumptions of the circular economy scenarios (for both the ambitious and conservative cases) were as follows:
• The functional form of the production and utility functions remain the same be-tween the baseline and the circular economy scenarios.
• Behavioural parameter values of the utility function remain the same between the baseline and the circular economy scenarios.
Figure C5: Data sources used in the baseline calibration and CGE modelling in the Denmark pilot
1 US Energy Information Administration – International Energy Outlook 2013 http://www.eia.gov/forecasts/archive/ieo13/ SOURCE: NERA Economic Consulting.
EIA IEO 20131
DELIVERING THE CIRCULAR ECONOMY – A TOOLKIT FOR POLICYMAKERS • 169
• Energy sector assumptions remain the same between the baseline and the cir-cular economy scenarios (i.e. no explicit modelling of an additional shift towards renewable energy).
Each circular economy scenario is represented by producing an input-output table that represents the changes induced by the circular economy opportunities, quantified as described in section 2.2.3. The allocation of changes in input factors (labour, materials, energy and capital) was done based on an analysis of the changes in demand due to the circular economy activities,2 and from which sectors’ key material inputs are provided in the current (2011) input-output table.
The main difference between the ‘conservative’ and ‘ambitious’ scenarios are how the impact assessed for the deep-dive sub-sector is scaled up to adjacent (sub-)sectors. This difference is described in detail in Appendix B.
Several data sources were combined to construct the baseline calibration and circular economy scenario analysis. These are summarised in Figure C5.
D Assessment of policy options
Figure D1 provides an overview of the basic arithmetic of the policy assessment tool developed for the Denmark pilot study. The tool is a workbook that contains 87 policy interventions identified to address the barriers to the circular economy opportunities in the five focus sectors. The goal of the tool is to rank the policies by their relative cost-effectiveness using a semi-quantitative scoring function. This is done by scoring each intervention on two dimensions, ‘impact’ and ‘cost’, from which a weighted ‘cost-effectiveness score’ is derived.
The development and implementation of the tool described here is one of many alternatives that policymakers can use as a first step to narrow down a long list of policy options to those with the best potential to address the barriers to circular economy opportunities. It should be noted that the main benefit of this tool was that it facilitated discussion. Ultimately, the final sets of policy options for each sector as presented in Part 3 of this report were determined with the help of significant input from government stakeholders and sector experts. While the approach outlined here is a useful first step, it is underlined that it is not meant as a substitute for adequate due diligence and impact assessment in the standard policy making process.
The scoring rules and methodology used to arrive at a prioritised set of policy options are described in detail below. Each policy intervention was scored independently of others, i.e. not allowing them to work in conjunction with any other policy, but keeping in mind their potential to work well as part of a package. All scores are relative, with comparisons made across several dimensions including policy types, circular economy opportunities and sectors to ensure adequate scoring distributions.
Scoring of impact dimension
The ‘impact score’ of a policy is the product of two equally weighted factors: the ‘importance of a barrier’, which builds on the detailed barrier analysis described in Section 2.2.4; and the tentative effectiveness of the policy intervention at overcoming the barrier. The methodology, described in detail below, was systematically applied to all policy interventions to obtain a first set of impact scores, which were discussed and iterated in sector ‘deep dive’ sessions with multiple stakeholders.
• Scoring the ‘importance of barrier’: Based on expert judgment on the size/ importance of the barrier to deliver the circular economy opportunity.
• Scoring the ‘effectiveness’ in 2020 and 2035: Based on an expert-guided es-
2 For example: reduced demand for materials and increased demand for labour due to remanufacturing in machinery; reduced demand for labour and increased need for capital for industrialised production and 3D printing of building modules.

170 • DELIVERING THE CIRCULAR ECONOMY – A TOOLKIT FOR POLICYMAKERS
timate of how effective the policy intervention would be in addressing the barrier, given existing initiatives, over two time periods, equally weighted:
○ Short-term effectiveness (by 2020) with higher scores given to economic/fiscal incentives (subsidies, taxes, guarantees) and lower scores to information or R&D interventions.
○ Long-term effectiveness (by 2035) with the same scores for economic/fiscal incentives and those for information or R&D increased or decreased where relevant.
Scoring of cost dimensionThe ‘cost’ score of a policy is the product of two equally weighted factors: ‘administrative and transaction costs’, determined by estimates and expert consultation; and wider economic costs of the intervention. The methodology, described in detail below, was systematically applied to arrive at a first set of cost scores, which were discussed and iterated in sector ‘deep dive’ sessions with multiple stakeholders.
• Scoring the ‘administrative and transaction costs’: Based on an expert-guided estimate of the combined cost incurred by government to set up and operate the policy and the cost to the private sector of complying with it.
○ Cost incurred by government refers to any foregone revenue or additional spending commitment entered into by the government by virtue of the policy.
○ Cost to the private sector refers to one-off adjustment costs and any increase in the cost of doing business caused by the policy.
• Scoring the ‘wider economic cost’: based on an expert-guided estimate of the cost–benefit trade-off between economic advantages and disadvantages in a sector created by the policy across government, businesses and consumers.
○ An example is a policy that reduces market competition creates advantages for businesses, but disadvantages for consumers. Similarly, a subsidy creates an advantage for its recipients, but disadvantages for the government.
○ The ‘economic advantage and disadvantage’ component focuses on each particular sector. The scoring has not taken into account the intrinsic benefits of the policy supporting circular economy activities, since they are addressed in the ‘impact’ score.
○ The ‘balance across the economy’ component looks at the average net dis-advantage in other parts of the economy due to a sector-directed policy, but not on the distribution of advantages and disadvantages, which belongs to the political viability sphere.
The assessment does not incorporate the economy-wide computational general equilibrium modelling of the impact of circular economy opportunities.
The total impact and cost scores are combined to provide a rank between 1 and 3:
1. Impact and cost are both greater than 50 (out of 100), putting the policy on the short-list
2. One or other of the impact and cost scores is 50 or above, putting the policy in a ‘supporting policy’ category
3. Neither impact nor cost score reaches 50, putting the policy in the unattractive category.
Figure D2 shows a worked example of how the tool was used to provide an initial score for a particular policy option. All of these individual scores that comprise the total impact and total cost scores were subsequently discussed with the project team and Danish government stakeholders and adjusted accordingly.
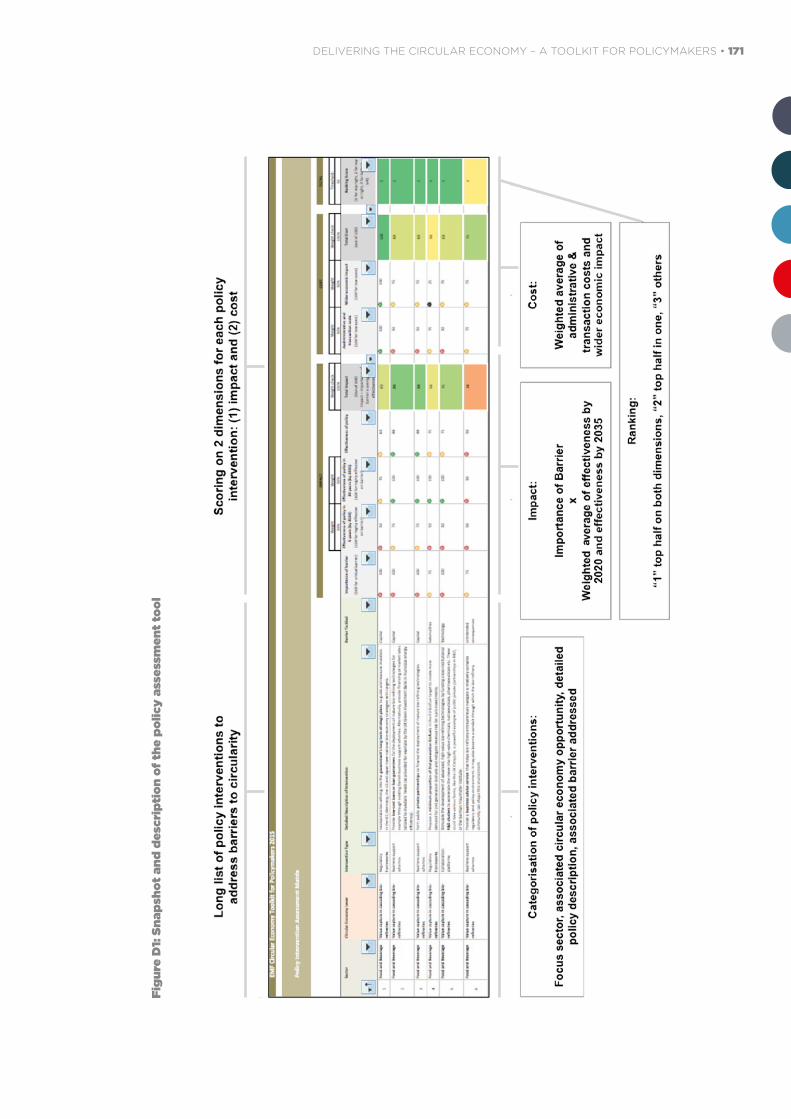
DELIVERING THE CIRCULAR ECONOMY – A TOOLKIT FOR POLICYMAKERS • 171
Figu
re D
1: Sn
apsh
ot a
nd d
escr
ipti
on o
f the
pol
icy
asse
ssm
ent t
ool
a

172 • DELIVERING THE CIRCULAR ECONOMY – A TOOLKIT FOR POLICYMAKERS
Figure D2: W
orked example of the im
plementation of the scoring m
ethodology.

DELIVERING THE CIRCULAR ECONOMY – A TOOLKIT FOR POLICYMAKERS • 173

174 • DELIVERING THE CIRCULAR ECONOMY – A TOOLKIT FOR POLICYMAKERS
LIST OF FIGURES
20 Figure 1: Circular economy – an industrial system that is restorative and regenerative by design
21 Figure 2: The ReSOLVE framework: six action areas for businesses and countries wanting to move towards the circular economy
25 Figure 3: The economic opportunity of the circular economy
26 Figure 4: Estimated potential contribution of the circular economy to economic growth, job creation and reduction of greenhouse gas emissions
40 Figure 5: Step-by-step methodology
44 Figure 6: Circularity baselining in the Denmark pilot
45 Figure 7: Six policy intervention types with examples
46 Figure 8: Policy landscape in the Denmark pilot
48 Figure 9: Potential contribution of the circular economy to ‘common’ policymaker ambitions
49 Figure 10: Measuring the circular economy – initial suggestions from ‘Growth Within’
51 Figure 11: Results of sector prioritisation in Denmark pilot
55 Figure 12: Indicative prioritisation of ReSOLVE action areas for 20 sectors in Europe
56 Figure 13: Qualitative assessment of potential of opportunities for the Construction & Real Estate sector in the Denmark pilot
60 Figure 14: Schematic overview of sector-specific impact quantification
61 Figure 15: Example of barrier analysis for opportunity ‘sharing and multi-purposing of buildings’ in Denmark pilot
62 Figure 16: Mapping policy interventions to barriers
66 Figure 17: Policy intervention relevance by level of government in Denmark
75 Figure 18: Methodological options for economic impact assessment modelling
76 Figure 19: Overview of a ‘hybrid’ CGE approach
78 Figure 20: Overview of direct and indirect effects in pilot CGE modelling
79 Figure 21: How economy-wide circular economy policy might complement sector-specific policy
83 Figure 22: Prioritisation of opportunities
84 Figure 23: Example roadmap
94 Figure 24: Ten circular economy opportunities in five focus sectors
96 Figure 25: Illustrative status of circular economy in Denmark today and potential by 2035
95 Figure 26: Estimated potential impact of further transitioning to the circular economy in Denmark
99 Figure 27: Breakdown of potential economic impact by quantified opportunity
100 Figure 28: Barrier matrix for the ten prioritised opportunities in Denmark
108 Figure 29: Main sources of food waste in global food value chain – production and consumption

DELIVERING THE CIRCULAR ECONOMY – A TOOLKIT FOR POLICYMAKERS • 175
126 Figure 30: Examples of what remanufacturing and new business models could look like for pumps in Denmark
127 Figure 31: Estimated potential adoption rates and value creation in wind turbines and pumps in the Denmark pilot
131 Figure 32: Share of plastic packaging collected for recycling in Denmark
139 Figure 33: Share of purchased goods in Danish hospitals that could be covered by performance models
151 Figure A1: Summary of methods and data used in the sector selection in the Denmark pilot
152 Figure A2: Overview of scoring of ‘Role in national economy’ in the Denmark pilot
153 Figure A3: Overview of scoring of ‘Circularity potential’ in the Denmark pilot
154 Figure B1: Short-term and long-term scenarios used in the Denmark pilot
156 Figure B2: Qualitative opportunity prioritisation of focus sectors in the Denmark pilot
157 Figure B3: Value capture in cascading bio-refineries
158 Figure B4: Reduction of avoidable food waste
159 Figure B5: Industrialised production and 3D printing of building modules; reuse and high-value recycling of components and materials
160 Figure B6: Sharing and multi-purposing of buildings
161 Figure B7: Remanufacturing and new business models
162 Figure B8: Increased recycling of plastic packaging
162 Figure B9: Performance models in procurement
163 Figure C1: Overview of a Computable general equilibrium (CGE) model
165 Figure C2: Sectoral and geographical aggregates in the CGE Model in the Denmark pilot
167 Figure C3: Generic structure of production functions in the CGE Model
167 Figure C4: Potential approaches and trade-offs for representing circularity within a CGE framework
168 Figure C5: Data sources used in the baseline calibration and CGE modelling in the Denmark pilot
171 Figure D1: Snapshot and description of the policy assessment tool
172 Figure D2: Worked example of the implementation of the scoring methodology.
LIST OF BOXES
30 Box 1: Natural systems degradation
67 Box 2: Policy case example – The Scottish Institute for Remanufacture
68 Box 3: Policy case example – Dutch Green Deal
70 Box 4: Policy case example – Circular public procurement in the US
72 Box 5: Policy case example – Danish Taskforce for Resource Efficiency
124 Box 6: Remanufacturing and refurbishment
130 Box 7: The Global Plastic Packaging Roadmap

176 • DELIVERING THE CIRCULAR ECONOMY – A TOOLKIT FOR POLICYMAKERS
ABOUT THE ELLEN MACARTHUR FOUNDATION
The Ellen MacArthur Foundation was established in 2010 with the aim of accelerating the transition to the circular economy. Since its creation the Foundation has emerged as a global thought leader, establishing circular economy on the agenda of decision makers across business, government and academia. The Foundation’s work focuses on three interlinking areas:
Insight and Analysis - Providing robust evidence about the benefits of the transition
The Foundation works to quantify the economic potential of the circular model and develop approaches for capturing this value. The Foundation has created a series of economic reports highlighting the rationale for an accelerated transition towards the circular economy, and exploring the potential benefits across different stakeholders and sectors. The Foundation believes the circular economy is an evolving framework, and continues to widen its understanding by working with international experts including key thinkers and leading academics. Our insight and analysis feed into a growing body of reports, case studies, publications and multimedia resources presented on our websites, which include Circulatenews.org, our portal for circular economy news and feature articles.
Business and Government - Catalysing circular innovation, creating the conditions for it to flourish
Since its launch the Foundation has emphasised the real-world relevance of its activities, and understands that business innovation sits at the heart of any transition to the circular economy. The Foundation works with its Global Partners (Cisco, Kingfisher, Philips, Renault, and Unilever) to develop circular business initiatives and to address challenges to implementing them. In 2013, with the support of its Global Partners, it created the world’s first dedicated circular economy innovation programme, the Circular Economy 100. Programme members comprise industry leading corporations, emerging innovators (SMEs), affiliate networks, government authorities, regions and cities. The CE100 provides a unique forum for building circular capabilities, addressing common barriers to progress, understanding the necessary enabling conditions, and piloting circular practices in a collaborative environment.
Education - Inspiring learners to re-think the future through the circular economy framework
The Foundation is creating a global teaching and learning platform built around the circular economy framework, working in both formal and informal education. With an emphasis on online learning, the Foundation provides cutting edge insights and content to support circular economy education and the systems thinking required to accelerate a transition. Our formal education work includes comprehensive Higher Education programmes with partners in Europe, the US, India, China and South America, international curriculum development with schools and colleges, and corporate capacity building programmes. In the informal education arena the Foundation’s work includes Re-thinking Progress, an open house educational event, and the Disruptive Innovation Festival, a global online and face-to-face opportunity to explore the changing economy and how best to respond to it.

DELIVERING THE CIRCULAR ECONOMY – A TOOLKIT FOR POLICYMAKERS • 177

178 • DELIVERING THE CIRCULAR ECONOMY – A TOOLKIT FOR POLICYMAKERS
[back cover]