congestion and marginal losses · pdf filesection 10 congestion and marginal losses 2012...
TRANSCRIPT

Section 10 Congestion and Marginal Losses
2012 Quarterly State of the Market Report for PJM: January through March 167© 2012 Monitoring Analytics, LLC
Congestion and Marginal LossesThe Locational Marginal Price (LMP) is the incremental price of energy at a bus. The LMP at any bus is made up of three components: the system marginal price or energy component (SMP), the marginal loss component of LMP (MLMP), and the congestion component of LMP (CLMP).
SMP, MLMP and CLMP are a product of the least cost, security constrained dispatch of system resources to meet system load. SMP is the incremental cost of energy, given the current dispatch, ignoring losses and congestion. Losses refer to energy lost to physical resistance in the transmission network as power is moved from generation to load. Marginal losses are the incremental change in system power losses caused by changes in the system load and generation patterns. Congestion occurs when available, least-cost energy cannot be delivered to all loads for a period because transmission facilities are not adequate to deliver that energy. When the least-cost available energy cannot be delivered to load in a transmission-constrained area, higher cost units in the constrained area must be dispatched to meet that load.1 The result is that the price of energy in the constrained area is higher than in the unconstrained area because of the combination of transmission limitations and the cost of local generation.
Congestion is neither good nor bad but is a direct measure of the extent to which there are differences in the cost of generation that cannot be equalized because of transmission constraints.
The components of LMP are the basis for determining participant and location specific congestion and marginal losses. The Market Monitoring Unit (MMU) analyzed marginal losses and congestion in PJM markets for the first three months of 2012.
1 This is referred to as dispatching units out of economic merit order. Economic merit order is the order of all generator offers from lowest to highest cost. Congestion occurs when loadings on transmission facilities mean the next unit in merit order cannot be used and a higher cost unit must be used in its place.
Highlights•Total marginal loss costs decreased by $169.1 million or 42.8 percent,
from $409.6 million in the first quarter of 2011 to $234.4 million in the first quarter of 2012.
•Total monthly marginal loss costs in the first quarter of 2012 were lower than monthly marginal loss costs in the first quarter of 2011.2
•Day-ahead marginal loss costs were $248.3 million in the first quarter of 2012 and balancing marginal loss costs were -$13.9 million in the first quarter of 2012.
•The marginal loss credits (loss surplus) decreased in the first quarter of 2012 to $97.7 million compared to $200.1 million in the first quarter of 2011.
•Congestion costs in the first three months 2012 decreased by 65.9 percent compared to congestion costs in the first three months of 2011.
•Monthly congestion costs in the first three months of 2012 were lower than monthly congestion costs in the first three months of 2011.
•Day–ahead congestion costs were $181.3 million in the first three months of 2012 and $407.3 in the first three months of 2011.
•Balancing congestion costs were -$58.5 million in the first three months of 2012 and -$47.4 million in the first three months of 2011.
ConclusionMarginal losses are incremental change in real system power losses caused by changes in system load and generation patterns. Total marginal loss costs decreased by $169.1 million or 42.8 percent, from $409.6 million in the first quarter of 2011 to $234.4 million in the first quarter of 2012. Marginal loss costs were significantly higher in the Day-Ahead Market than the Real-Time Market.
2 See the 2011 State of the Market Report for PJM, Volume II, “Energy Market, Part 1,” Table 2-60.

2012 Quarterly State of the Market Report for PJM: January through March
168 Section 10 Congestion and Marginal Losses © 2012 Monitoring Analytics, LLC
The net marginal loss bill is calculated by subtracting the generation loss credits from the sum of load loss charges, net explicit loss charges and net inadvertent loss charges. Since the net marginal bill is calculated on the basis of marginal, rather than average losses, there is an overcollection of marginal loss related costs. This overcollection, net of total energy charges and residual market adjustments, is the source of marginal loss credits. Marginal loss credits are fully distributed back to load and exports. Marginal loss credits were $97.7 million in the first quarter of 2012.
Congestion reflects the underlying characteristics of the power system, including the nature and capability of transmission facilities, the cost and geographical distribution of generation facilities and the geographical distribution of load. Total congestion costs decreased by $237.1 million or 65.9 percent, from $359.9 million in the first three months of 2011 to $122.8 million in the first three months of 2012. Congestion costs were significantly higher in the Day-Ahead Market than in the Real-Time Market. Congestion frequency was also significantly higher in the Day-Ahead Market than in the Real-Time Market.
ARRs and FTRs served as an effective, but not total, offset against congestion. ARR and FTR revenues offset 97.3 percent of the total congestion costs in the Day-Ahead Energy Market and the balancing energy market within PJM for the 2010 to 2011 planning period.3 During the first ten months (Jun 2011 through March 2012) of the 2011 to 2012 planning period, total ARR and FTR revenues offset more than 100 percent of the congestion costs within PJM. FTRs were paid at 88.1 percent of the target allocation level for the 12-month period of the 2010 to 2011 planning period, and at 83.2 percent of the target allocation level for the first ten months of the 2011 to 2012 planning period.4 Revenue adequacy, measured relative to target allocations for a planning period is not final until the end of the period.
The congestion metric requires careful review when considering the significance of congestion. The net congestion bill is calculated by subtracting 3 See the 2012 Quarterly State of the Market Report for PJM: January through March, Section 12, “Financial Transmission and Auction
Revenue Rights,” at Table 12-19, “ARR and FTR congestion hedging: Planning periods 2010 to 2011 and 2011 to 2012.4 See the 2012 Quarterly State of the Market Report for PJM: January through March, Section 12, “Financial Transmission and Auction
Revenue Rights,” at Table 12-11, “Monthly FTR accounting summary (Dollars (Millions)): Planning periods 2010 to 2011 and 2011 to 2012”
generating congestion credits from load congestion payments. The logic is that congestion payments by load are offset by congestion revenues to generation, for the area analyzed. Net congestion, which includes both load congestion payments and generation congestion credits, is not a good measure of the congestion costs paid by load from the perspective of the wholesale market.5 While total congestion costs represent the overall charge or credit to a zone, the components of congestion costs measure the extent to which load or generation bear total congestion costs. Load congestion payments, when positive, measure the total congestion cost to load in an area. Load congestion payments, when negative, measure the total congestion credit to load in an area. Negative load congestion payments result when load is on the lower priced side of a constraint or constraints. For example, congestion across the AP South interface means lower prices in western control zones and higher prices in eastern and southern control zones. Load in western control zones will benefit from lower prices and receive a congestion credit (negative load congestion payment). Load in the eastern and southern control zones will incur a congestion charge (positive load congestion payment). The reverse is true for generation congestion credits. Generation congestion credits, when positive, measure the total congestion credit to generation in an area. Generation congestion credits, when negative, measure the total congestion cost to generation in an area. Negative generation congestion credits are a cost in the sense that revenues to generators in the area are lower, by the amount of the congestion cost, than they would have been if they had been paid LMP without a congestion component, the total of system marginal price and the loss component. Negative generation congestion credits result when generation is on the lower priced side of a constraint or constraints. For example, congestion across the AP South interface means lower prices in the western control zones and higher prices in the eastern and southern control zones. Generation in the western control zones will receive lower prices and incur a congestion charge (negative generation congestion credit). Generation in the eastern and southern control zones will receive higher prices and receive a congestion credit (positive generation congestion credit).
5 The actual congestion payments by retail customers are a function of retail ratemaking policies and may or may not reflect an offset for congestion credits.

Section 10 Congestion and Marginal Losses
2012 Quarterly State of the Market Report for PJM: January through March 169© 2012 Monitoring Analytics, LLC
As an example, total congestion costs in PJM in the first three months of 2012 were $122.8 million, which was comprised of load congestion payments of $19.1 million, negative generation credits of $118.2 million and negative explicit congestion of $14.5 million (Table 10-14).
Locational Marginal Price (LMP)ComponentsTable 10-1 shows the PJM real-time, load-weighted average LMP components for the first quarter for years 2009 to 2012.
Table 10‑1 PJM real‑time, load‑weighted average LMP components (Dollars per MWh): January through March, 2009 to 2012 (See 2011 SOM, Table 10‑1)
(Jan‑Mar)Real‑Time
LMPEnergy
ComponentCongestion
ComponentLoss
Component2009 $49.60 $49.51 $0.05 $0.04 2010 $45.92 $45.81 $0.06 $0.05 2011 $46.35 $46.30 $0.03 $0.03 2012 $31.21 $31.18 $0.02 $0.00
The PJM price is weighted by accounting load, which differs from the state-estimated load used in determination of the energy component (SMP). The components of the average PJM system price result from these different weights. In the Real-Time Energy Market, the distributed load reference bus is weighted by system estimates of the load in real time. At the time the LMP is determined in the Real-Time Energy Market, the energy component equals the system load-weighted price. However, real-time bus-specific loads are adjusted, after the fact, according to updated information from meters. This meter adjusted load is accounting load that is used in settlements and forms the basis of the reported PJM load weighted prices. This after the fact adjustment means that the Real-Time Energy Market energy component of LMP (SMP) and the PJM real-time load-weighted LMP are not equal.
Table 10-2 shows the PJM day-ahead, load-weighted average LMP components for the first quarter for years 2009 through 2012.
Table 10‑2 PJM day‑ahead, load‑weighted average LMP components (Dollars per MWh): January through March, 2009 to 2012 (See 2011 SOM, Table 10‑2)
(Jan‑Mar)Day‑Ahead
LMPEnergy
ComponentCongestion Component
Loss Component
2009 $49.44 $49.75 ($0.18) ($0.13)2010 $47.77 $47.74 $0.01 $0.02 2011 $47.14 $47.36 ($0.11) ($0.11)2012 $31.51 $31.45 $0.08 ($0.03)
In the Day-Ahead Energy Market, the distributed load reference bus is weighted by fixed-demand bids only and the day-ahead energy component is, therefore, a system fixed demand weighted price. The day-ahead weighted system price calculation uses all types of demand, including fixed, price-sensitive and decrement bids.
Zonal ComponentsThe components of LMP were calculated for each PJM control zone. The real time components of LMP for the control zones are presented in Table 10-3 for January through March of years 2011 and 2012. The day-ahead components of LMP for the control zones are presented in Table 10-4 for January through March of years 2011 and 2012.

2012 Quarterly State of the Market Report for PJM: January through March
170 Section 10 Congestion and Marginal Losses © 2012 Monitoring Analytics, LLC
Table 10‑3 Zonal and PJM real‑time, load‑weighted average LMP components (Dollars per MWh): January through March, 2011 and 2012 (See 2011 SOM, Table 10‑3)
2011 (Jan‑Mar) 2012 (Jan‑Mar)Real‑Time LMP
Energy Component
Congestion Component
Loss Component
Real‑Time LMP
Energy Component
Congestion Component
Loss Component
AECO $54.19 $46.25 $5.42 $2.52 $31.86 $31.17 ($0.34) $1.03 AEP $39.41 $46.16 ($4.99) ($1.76) $29.96 $31.10 ($0.39) ($0.75)AP $45.91 $46.34 ($0.48) $0.05 $31.75 $31.21 $0.34 $0.19 ATSI NA NA NA NA $30.37 $31.06 ($0.83) $0.13 BGE $53.86 $46.70 $4.94 $2.23 $36.38 $31.30 $3.30 $1.78 ComEd $35.23 $45.79 ($7.33) ($3.23) $27.87 $31.01 ($1.32) ($1.82)DAY $39.33 $46.25 ($5.71) ($1.21) $30.53 $31.15 ($0.52) ($0.10)DEOK NA NA NA NA $29.14 $31.17 ($0.44) ($1.59)DLCO $51.82 $46.85 $4.23 $0.74 $29.94 $31.01 ($0.31) ($0.77)Dominion $54.14 $46.75 $4.14 $3.25 $33.01 $31.38 $1.19 $0.44 DPL $37.14 $45.88 ($7.38) ($1.36) $35.06 $31.28 $2.23 $1.54 JCPL $54.19 $46.35 $5.02 $2.82 $32.13 $31.31 ($0.36) $1.18 Met-Ed $51.40 $46.26 $3.87 $1.28 $31.39 $31.25 ($0.35) $0.49 PECO $52.74 $46.31 $4.41 $2.02 $31.53 $31.22 ($0.42) $0.73 PENELEC $45.63 $46.01 ($0.84) $0.46 $31.04 $31.15 ($0.63) $0.53 Pepco $53.35 $46.61 $5.39 $1.35 $35.23 $31.33 $2.69 $1.21 PPL $52.84 $46.42 $5.18 $1.24 $31.19 $31.27 ($0.53) $0.44 PSEG $54.43 $45.99 $5.71 $2.73 $32.25 $31.15 ($0.15) $1.26 RECO $48.68 $46.12 $0.05 $2.51 $32.00 $31.31 ($0.43) $1.12 PJM $46.35 $46.30 $0.03 $0.03 $31.21 $31.18 $0.02 $0.00
Table 10‑4 Zonal and PJM day‑ahead, load‑weighted average LMP components (Dollars per MWh): January through March, 2011 and 2012 (See 2011 SOM, Table 10‑4)
2011 (Jan‑Mar) 2012 (Jan‑Mar)Day‑
Ahead LMP
Energy Component
Congestion Component
Loss Component
Day‑Ahead
LMPEnergy
Component Congestion Component
Loss Component
AECO $56.13 $47.42 $5.58 $3.13 $32.54 $31.48 $0.10 $0.96 AEP $39.70 $47.24 ($5.17) ($2.37) $30.33 $31.41 ($0.24) ($0.83)AP $46.59 $47.42 ($0.72) ($0.11) $31.92 $31.53 $0.23 $0.16 ATSI NA NA NA NA $30.58 $31.33 ($0.71) ($0.04)BGE $55.47 $47.74 $5.23 $2.50 $36.54 $31.59 $3.04 $1.91 ComEd $34.93 $46.71 ($8.01) ($3.77) $27.84 $31.32 ($1.55) ($1.93)DAY $39.41 $47.25 ($5.91) ($1.93) $30.83 $31.46 ($0.35) ($0.28)DEOK NA NA NA NA $29.17 $31.33 ($0.18) ($1.99)DLCO $53.76 $48.01 $4.52 $1.23 $30.54 $31.33 $0.06 ($0.85)Dominion $57.23 $47.90 $5.41 $3.92 $33.49 $31.66 $1.24 $0.59 DPL $37.25 $46.94 ($7.85) ($1.84) $34.86 $31.56 $1.53 $1.77 JCPL $56.60 $47.47 $5.54 $3.59 $32.77 $31.59 $0.11 $1.07 Met-Ed $53.28 $47.21 $4.66 $1.41 $31.55 $31.36 ($0.21) $0.40 PECO $56.02 $47.54 $5.76 $2.72 $32.01 $31.49 ($0.16) $0.69 PENELEC $46.51 $47.39 ($1.10) $0.23 $31.53 $31.35 ($0.52) $0.70 Pepco $54.87 $47.59 $5.48 $1.79 $35.60 $31.52 $2.46 $1.62 PPL $54.72 $47.54 $5.88 $1.30 $31.43 $31.49 ($0.36) $0.30 PSEG $57.49 $47.21 $6.55 $3.73 $32.90 $31.49 $0.15 $1.26 RECO $53.93 $47.42 $3.27 $3.25 $32.38 $31.47 ($0.23) $1.13 PJM $47.14 $47.36 ($0.11) ($0.11) $31.51 $31.45 $0.08 ($0.03)
Energy CostsEnergy AccountingThe energy component of LMP is the system reference bus LMP, also called the system marginal price (SMP). The energy charge is based on the applicable day-ahead and real-time energy component of LMP (SMP). Total energy charges are equal to the load energy payments minus generation energy credits, plus explicit energy charges, incurred in both the Day-Ahead Energy Market and the balancing energy market.
Due to losses, total generation will be greater than total load in any hour. Since the hourly integrated energy component of LMP is the same across

Section 10 Congestion and Marginal Losses
2012 Quarterly State of the Market Report for PJM: January through March 171© 2012 Monitoring Analytics, LLC
every bus in every hour, the net energy bill is negative, with more generation credits than load charges in any given hour. This net energy bill is netted against total net marginal loss charges plus net residual market adjustments, which provides for full recovery of generation charges, with any remainder distributed back to load and exports as marginal loss credits.
Total Calendar Year Energy CostsTable 10-5 shows total energy, loss and congestions charges and total PJM billing, for the January through March period of each year from 2009 through 2012.
Table 10‑5 Total PJM charges by component (Dollars (Millions)): January through March, 2011 and 20126 (See 2011 SOM, Table 10‑5)
PJM Billing Charges (Millions)
(Jan‑Mar)Energy
ChargesLoss
ChargesCongestion
ChargesTotal
ChargesTotal
PJM BillingTotal Charges
Percent of PJM Billing2009 ($218) $454 $309 $544 $7,515 7.2%2010 ($208) $417 $345 $554 $8,415 6.6%2011 ($210) $410 $361 $561 $9,584 5.9%2012 ($137) $234 $123 $221 $6,938 3.2%
Total energy charges are shown in Table 10-6. Table 10-6 shows the first quarter for 2009 through 2012 energy costs by market category.
Table 10‑6 Total PJM energy costs by market category (Dollars (Millions)): January through March, 2011 and 2012 (See 2011 SOM, Table 10‑7)
Energy Costs (Millions)Day Ahead Balancing
(Jan‑Mar)Load
PaymentsGeneration
Credits Explicit TotalLoad
PaymentsGeneration
Credits Explicit TotalInadvertent
ChargesGrand Total
2009 $14,129.6 $14,375.6 $0.0 ($246.0) ($71.2) ($98.2) $0.0 $27.0 $0.7 ($218.3)2010 $13,408.9 $13,619.2 $0.0 ($210.2) $15.5 $9.8 $0.0 $5.6 ($3.0) ($207.6)2011 $12,055.5 $12,259.3 $0.0 ($203.9) ($111.6) ($98.6) $0.0 ($12.9) $6.9 ($209.9)2012 $8,407.2 $8,521.8 $0.0 ($114.5) ($47.2) ($18.4) $0.0 ($28.8) $6.8 ($136.5)
6 The Energy Charges, Loss Charges and Congestion Charges include net inadvertent charges.
Monthly Energy CostsTable 10-7 shows a monthly summary of energy costs by type for the first quarter of 2011 and 2012.
Table 10‑7 Monthly energy costs by type (Dollars (Millions)): January through March, 2011 and 2012 (See 2011 SOM, Table 10‑8)
Energy Costs (Millions)2011 (Jan-Mar) 2012 (Jan-Mar)
Day-Ahead
TotalBalancing
TotalInadvertent
ChargesGrand Total
Day-Ahead
TotalBalancing
TotalInadvertent
ChargesGrand Total
Jan ($90.3) ($5.2) $2.1 ($93.3) ($47.8) ($10.1) $2.5 ($55.4)Feb ($61.1) ($2.4) $2.3 ($61.2) ($35.4) ($9.4) $2.4 ($42.3)Mar ($52.4) ($5.4) $2.4 ($55.4) ($31.4) ($9.3) $1.9 ($38.8)Total ($203.9) ($12.9) $6.9 ($209.9) ($114.5) ($28.8) $6.8 ($136.5)
Marginal LossesMarginal Loss AccountingWith the implementation of marginal loss pricing, PJM calculates transmission loss charges for each PJM member. The loss charge is based on the applicable day-ahead and real-time loss component of LMP (MLMP). Each PJM member is charged for the cost of losses on the transmission system, based on the difference between the MLMP at the location where the PJM member injects energy and the MLMP where the PJM member withdraws energy.
More specifically, total loss charges are equal to the load loss payments minus generation loss credits, plus explicit loss charges, incurred in both the Day-Ahead Energy Market and the balancing energy market.
Marginal loss charges can be both positive and negative and consequently the load payments and generation credits can also be both positive and negative. The loss component of LMP
is calculated with respect to the system reference bus LMP, also called the system marginal price (SMP). An increase in generation at a bus that results

2012 Quarterly State of the Market Report for PJM: January through March
172 Section 10 Congestion and Marginal Losses © 2012 Monitoring Analytics, LLC
in an increase in losses will cause the marginal loss component of that bus to be negative. If the increase in generation at the bus results in a decrease of system losses, then the marginal loss component is positive.
On January 1, 2012, PJM integrated the Duke Energy Ohio/Kentucky (DEOK) Control Zone. The metrics reported in this section treat DEOK as part of MISO for the first hour of January and as part of PJM for the second hour of January through March.
Monthly marginal loss costs in the first quarter of 2012 ranged from $61.9 million in March to $95.2 million in January.
The marginal loss credits decreased by $102.4 million or 51.2 percent, from $200.1 million in the first quarter of 2011 to $97.7 million in the first quarter of 2012.
Total Calendar Year Marginal Loss Costs.Table 10-8 shows total marginal loss charges for the first quarter for 2009 through 2012.
Table 10‑8 Total7 PJM Marginal Loss Charges (Dollars (Millions)): January through March, 2011 and 2012 (See 2011 SOM, Table 10‑9)
Marginal Loss Costs (Millions)
(Jan‑Mar) Load Payments Generation Credits Explicit Inadvertent Charges Total2009 ($21.3) ($460.6) $14.7 $0.0 $454.0 2010 ($3.8) ($414.1) $6.3 ($0.0) $416.6 2011 ($26.5) ($421.2) $14.9 $0.0 $409.6 2012 ($11.1) ($252.1) ($6.6) $0.0 $234.4
Total marginal loss costs for the first quarter for 2009 through 2012 are shown in Table 10-9 and Table 10-10. Table 10-9 shows the first quarter for 2009 through 2012 PJM marginal loss costs by category and Table 10-10 shows the first quarter for 2009 through 2012 PJM marginal loss costs by market category.7 Calculated values shown in Section 10, “Congestion and Marginal Losses,” are based on unrounded, underlying data and may differ from
calculations based on the rounded values in the tables.
Table 10‑9 Total PJM marginal loss costs by category (Dollars (Millions)): January through March, 2011 and 2012 (See 2011 SOM, Table 10‑10)
Marginal Loss Costs (Millions)(Jan‑Mar) Load Payments Generation Credits Explicit Inadvertent Charges Total2009 ($21.3) ($460.6) $14.7 $0.0 $454.0 2010 ($3.8) ($414.1) $6.3 ($0.0) $416.6 2011 ($26.5) ($421.2) $14.9 $0.0 $409.6 2012 ($11.1) ($252.1) ($6.6) $0.0 $234.4
Table 10‑10 Total PJM marginal loss costs by market category (Dollars (Millions)): January through March, 2011 and 2012 (See 2011 SOM, Table 10‑11)
Marginal Loss Costs (Millions)Day Ahead Balancing
(Jan‑Mar)Load
PaymentsGeneration
Credits Explicit TotalLoad
PaymentsGeneration
Credits Explicit TotalInadvertent
ChargesGrand Total
2009 ($23.3) ($457.6) $30.9 $465.2 $2.1 ($3.0) ($16.3) ($11.2) $0.0 $454.0 2010 ($8.5) ($413.5) $12.8 $417.8 $4.7 ($0.6) ($6.5) ($1.2) ($0.0) $416.6 2011 ($37.1) ($430.1) $26.0 $419.1 $10.6 $8.9 ($11.1) ($9.5) $0.0 $409.6 2012 ($16.5) ($256.8) $8.0 $248.3 $5.4 $4.7 ($14.6) ($13.9) $0.0 $234.4

Section 10 Congestion and Marginal Losses
2012 Quarterly State of the Market Report for PJM: January through March 173© 2012 Monitoring Analytics, LLC
Monthly Marginal Loss CostsTable 10-11 shows a monthly summary of marginal loss costs by type for the first quarter for 2011 and 2012.
Table 10‑11 Monthly marginal loss costs by type (Dollars (Millions)): January through March, 2011 and 2012 (See 2011 SOM, Table 10‑12)
Marginal Loss Costs (Millions)2011 (Jan‑Mar) 2012 (Jan‑Mar)
Day‑Ahead Total
Balancing Total
Inadvertent charges
Grand Total
Day‑Ahead Total
Balancing Total
Inadvertent charges
Grand Total
Jan $188.5 ($2.9) $0.0 $185.7 $100.6 ($5.4) $0.0 $95.2 Feb $121.8 ($1.8) $0.0 $119.9 $80.4 ($3.2) $0.0 $77.2 Mar $108.7 ($4.8) $0.0 $103.9 $67.2 ($5.3) $0.0 $61.9 Total $419.0 ($9.5) $0.0 $409.5 $248.3 ($13.9) $0.0 $234.4
Marginal Loss Costs and Loss CreditsMarginal loss credits (loss surplus) are calculated by adding the total net energy costs, the total net marginal loss costs and net residual market adjustments. The total energy costs are equal to the net energy costs (generation energy credits less load energy payments plus net inadvertent energy charges plus net explicit energy charges). Total marginal loss costs are equal to the net marginal loss costs (generation loss credits less load loss payments plus net inadvertent loss charges plus net explicit loss charges). Ignoring interchange, the existence of losses will cause total generation to be greater than total load in any hour. Since the hourly integrated energy component of LMP is the same across every generator and load bus in every hour, the net energy bill will be negative (ignoring net interchange), with more generation credits than load charges collected in any given hour. This net energy bill is netted against total net marginal loss charges and net residual market adjustments, with the remainder distributed back to load and exports as marginal loss credits. Residual market adjustments consist of the known day-ahead error value, day-ahead loss MW congestion value and balancing loss MW congestion value. The known day-ahead error value is the financial calculation for the MW imbalance created when the day-ahead case is solved. The day-ahead and balancing loss MW congestion values are congestion values associated with loss MW that need to be deducted from the net of the total marginal loss
costs, total energy costs and day-ahead known error value before marginal loss credits can be distributed.
Table 10-12 shows the total net energy charges, the total net marginal loss charges collected, the net residual market adjustments and total loss credits redistributed in the first quarter for 2009 and 2012.
Table 10‑12 Marginal8 loss credits (Dollars (Millions)): January through March, 2009 through 2012 (See 2011 SOM, Table 10‑13)
Loss Credit Accounting (Millions)
(Jan‑Mar)Total
Energy ChargesTotal Marginal
Loss Charges Adjustments Loss Credits2009 ($218.3) $454.0 ($0.9) $236.6 2010 ($207.6) $416.6 $0.0 $208.9 2011 ($209.9) $409.6 ($0.5) $200.1 2012 ($136.5) $234.4 $0.1 $97.7
CongestionCongestion AccountingTransmission congestion can exist in PJM’s Day-Ahead and Real-Time Energy Market.9 Total congestion charges are equal to the net congestion bill plus explicit congestion charges plus net inadvertent congestions charges, incurred in both the Day-Ahead Energy Market and the balancing energy market.
The net congestion bill is calculated by subtracting generating congestion credits from load congestion payments. The logic is that increased congestion payments by load are offset by increased congestion revenues to generation, for the area analyzed. Whether the net congestion bill is an appropriate measure of congestion for load depends on who pays the load congestion payments and who receives the generation congestion credits. The net congestion bill is an appropriate measure of congestion for a utility that charges load congestion payments to load and credits generation congestion credits to 8 Based on currently available data, the MMU is not able to independently calculate residual market adjustments. The adjustments numbers
included in the table are comprised of the sum of the known day-ahead error value, day-ahead loss MW congestion value, balancing loss MW congestion value and measurement error caused by missing data. In sum, these elements reflect the difference between actual PJM loss credits and MMU calculations of loss credits based on available data.
9 The terms congestion charges and congestion costs are both used to refer to the costs associated with congestion. The term, congestion charges, is used in documents by PJM’s Market Settlement Operations.

2012 Quarterly State of the Market Report for PJM: January through March
174 Section 10 Congestion and Marginal Losses © 2012 Monitoring Analytics, LLC
load. The net congestion bill is not an appropriate measure of congestion in situations where load pays the load congestion payments but does not receive the generation credits as an offset.
In the analysis of total congestion costs, load congestion payments are netted against generation congestion credits on an hourly basis, by billing organization, and then summed for the given period.10 A billing organization may offset load congestion payments with its generation portfolio or by purchasing supply from another entity via a bilateral transaction.
Load Congestion Payments and Generation Congestion Credits are calculated for both the Day-Ahead and Balancing Energy Markets.
The congestion charges associated with specific constraints are the sum of the total day-ahead and balancing congestion costs associated with those constraints. The congestion charges in each zone are the sum of the congestion charges associated with each constraint that affects prices in the zone. The network nature of the transmission system means that congestion costs in a zone are frequently the result of constrained facilities located outside that zone.
Congestion costs can be both positive and negative and consequently load payments and generation credits can also be both positive and negative. The CLMP is calculated with respect to the system reference bus LMP, also called the system marginal price (SMP). When a transmission constraint occurs, the resulting CLMP is positive on one side of the constraint and negative on the other side of the constraint and the corresponding congestion costs are positive or negative. For each transmission constraint, the CLMP reflects the cost of a constraint at a pricing node and is equal to the product of the constraint shadow price and the distribution factor at the respective pricing node. The total CLMP at a pricing node is the sum of all constraint contributions to LMP and is equal to the difference between the actual LMP that results from transmission constraints, excluding losses, and the SMP. If
10 This analysis does not treat affiliated billing organizations as a single organization. Thus, the generation congestion credits from one organization will not offset the load payments of its affiliate. This may overstate or understate the actual load payments or generation credits of an organization’s parent company.
an area experiences lower prices because of a constraint, the CLMP in that area is negative.11
On January 1, 2012, PJM integrated the Duke Energy Ohio/Kentucky (DEOK) Control Zone. The metrics reported in this section treat DEOK as part of MISO for the first hour of January and as part of PJM for the second hour of January through March.
Total Calendar Year CongestionCongestion charges have ranged from 2.7 percent to 9.6 percent of annual total PJM billings since 2000.12 Table 10-13 shows total congestion by year from 1999 through March 2012.13
Table 10‑13 Total annual PJM congestion (Dollars (Millions)): Calendar years 1999 to March 2012 (See 2011 SOM, Table 10‑14)
Congestion Charges
Percent Change
Total PJM Billing
Percent of PJM Billing
1999 $65 NA NA NA2000 $132 103.1% $2,300 5.7%2001 $271 105.3% $3,400 8.0%2002 $453 67.2% $4,700 9.6%2003 $464 2.4% $6,900 6.7%2004 $750 61.7% $8,700 8.6%2005 $2,092 178.8% $22,630 9.2%2006 $1,603 (23.4%) $20,945 7.7%2007 $1,846 15.1% $30,556 6.0%2008 $2,117 14.7% $34,306 6.2%2009 $719 (66.0%) $26,550 2.7%2010 $1,424 98.1% $34,770 4.1%2011 $998 (29.9%) $35,887 2.8%2012 (Jan - Mar) $123 $6,938 1.8%
Figure 10-1 shows PJM monthly congestion for January 2008 through March 2012.
11 For an example of the congestion accounting methods used in this section, see MMU Technical Reference for PJM Markets, at “FTRs and ARRs.”
12 Calculated values shown in Section 10, “Congestion and Marginal Losses,” are based on unrounded, underlying data and may differ from calculations based on the rounded values in the tables.
13 Congestion charges for 2010 reflect an updated calculation compared to the results in the 2010 State of the Market Report for PJM.

Section 10 Congestion and Marginal Losses
2012 Quarterly State of the Market Report for PJM: January through March 175© 2012 Monitoring Analytics, LLC
Figure 10‑1 PJM monthly congestion (Dollars (Millions)): January 2008 to March 2012 (New Figure)
$0
$50
$100
$150
$200
$250
$300
$350
$400
Jan Feb Mar Apr May Jun Jul Aug Sep Oct Nov Dec
Cong
estio
n (Mi
llions
)
20082009201020112012
Total congestion charges in Table 10-14 include both congestion charges associated with PJM facilities and those associated with reciprocal, coordinated flowgates in the MISO.14
Table 10-15 shows the PJM congestion costs by category for the first three months of 2012. The January through March 2012 PJM total congestion costs were comprised of $19.1 million in load congestion payments, $118.2 million in negative generation congestion credits, and $14.5 million in negative explicit congestion costs.
Table 10‑14 Total annual PJM congestion costs by category (Dollars (Millions)): January through March, 2011 and 2012 (See 2011 SOM, Table 10‑15)
YearCongestion Costs (Millions)
Load Payments Generation Credits Explicit Inadvertent Charges Total2011 (Jan - Mar) $65.5 ($331.6) ($37.2) $0.0 $359.9 2012 (Jan - Mar) $19.1 ($118.2) ($14.5) $0.0 $122.8
14 See “Joint Operating Agreement Between the Midwest Independent Transmission System Operator, Inc. and PJM Interconnection, L.L.C.” (December 11, 2008) Section 6.1 <http://pjm.com/documents/agreements/~/media/documents/agreements/joa-complete.ashx> (Accessed March 13, 2012).

2012 Quarterly State of the Market Report for PJM: January through March
176 Section 10 Congestion and Marginal Losses © 2012 Monitoring Analytics, LLC
Table 10‑15 Total annual PJM congestion costs by market category (Dollars (Millions)): January through March, 2011 and 2012 (See 2011 SOM, Table 10‑16)
Year
Congestion Costs (Millions)Day Ahead Balancing
Load Payments
Generation Credits Explicit Total
Load Payments
Generation Credits Explicit Total
Inadvertent Charges
Grand Total
2011 (Jan - Mar) $38.5 ($364.7) $4.1 $407.3 $27.0 $33.1 ($41.2) ($47.4) $0.0 $359.9 2012 (Jan - Mar) $23.9 ($129.9) $27.5 $181.3 ($4.8) $11.7 ($42.0) ($58.5) $0.0 $122.8
Monthly CongestionTable 10-16 shows that during the first three months of 2012, monthly congestion charges ranged from $35.5 million to $46.3 million. Table 10-17 shows the congestion charges during the first three months of 2011.
Monthly congestion costs in the first three months of 2012 were substantially lower than for corresponding months in the first three months of 2011.
Table 10‑16 Monthly PJM congestion charges (Dollars (Millions)): January through March 2012 (See 2011 SOM, Table 10‑17)
Month
Congestion Costs (Millions)Day Ahead Balancing
Load Payments
Generation Credits Explicit Total
Load Payments
Generation Credits Explicit Total
Inadvertent Charges
Grand Total
Jan $4.0 ($53.1) $9.3 $66.3 $1.0 $5.7 ($15.4) ($20.0) $0.0 $46.3 Feb $9.2 ($38.3) $7.4 $54.9 ($3.8) $2.7 ($12.8) ($19.4) $0.0 $35.5 Mar $10.7 ($38.5) $10.9 $60.1 ($2.0) $3.3 ($13.8) ($19.1) $0.0 $41.0 Total $23.9 ($129.9) $27.5 $181.3 ($4.8) $11.7 ($42.0) ($58.5) $0.0 $122.8
Table 10‑17 Monthly PJM congestion charges (Dollars (Millions)): January through March 2011 (See 2011 SOM, Table 10‑18)
Month
Congestion Costs (Millions)Day Ahead Balancing
Load Payments
Generation Credits Explicit Total
Load Payments
Generation Credits Explicit Total
Inadvertent Charges
Grand Total
Jan $27.0 ($228.4) $0.9 $256.4 $21.1 $15.6 ($20.3) ($14.8) $0.0 $241.6 Feb $14.0 ($77.5) $1.0 $92.5 $5.6 $12.8 ($10.9) ($18.0) $0.0 $74.5 Mar ($2.5) ($58.8) $2.2 $58.4 $0.2 $4.7 ($10.0) ($14.6) $0.0 $43.9 Total $38.5 ($364.7) $4.1 $407.3 $27.0 $33.1 ($41.2) ($47.4) $0.0 $359.9
Congested FacilitiesA congestion event exists when a unit or units must be dispatched out of merit order to control the impact of a contingency on a monitored facility or to control an actual overload. A congestion-event hour exists when a specific facility is constrained for one or more five-minute intervals within an hour. A congestion-event hour differs from a constrained hour, which is any hour during which one or
more facilities are congested. Thus, if two facilities are constrained during an hour, the result is two congestion-event hours and one constrained hour. Constraints are often simultaneous, so the number of congestion-event hours likely exceeds the number of constrained hours and the number of congestion-event hours likely exceeds the number of hours within a year.
In order to have a consistent metric for real-time and day-ahead congestion frequency, real-time congestion frequency is measured using the convention that an hour is constrained if any of its component five-minute intervals
is constrained. This is also consistent with the way in which PJM reports real-time congestion. In the first three months of 2012, there were 54,144 day-ahead, congestion-event hours compared to 25,088 day-ahead, congestion-event hours in the first three months of 2011. In the first three months of 2012, there were 4,101 real-time, congestion-event hours compared to 4,399 real-time, congestion-event hours in the first three months of 2011.
Facilities were constrained in the Day-Ahead Market more frequently than in the Real-Time Market. Virtual transactions in the Day-Ahead Market can be used to discretely resolve, without eliminating, constraints on the transmission system. Relative to the Day-Ahead Market, the Real-Time Market has relatively inflexible resources to resolve transmission constraints which means that constraints are often eliminated, rather than discretely controlled.

Section 10 Congestion and Marginal Losses
2012 Quarterly State of the Market Report for PJM: January through March 177© 2012 Monitoring Analytics, LLC
During the first three months of 2012, for only 3.5 percent of Day-Ahead Market facility constrained hours were the same facilities also constrained in the Real-Time Market. During the first three months of 2012, for 46.0 percent of Real-Time Market facility constrained hours, the same facilities were also constrained in the Day-Ahead Market.
The Graceton – Raphael Road transmission line was the largest contributor to congestion costs in the first three months of 2012. With $20.6 million in total congestion costs, it accounted for 16.8 percent of the total PJM congestion costs in the first three months of 2012. The top five constraints in terms of congestion costs together contributed $53.9 million, or 43.9 percent, of the total PJM congestion costs in the first three months of 2012. The top five constraints were the Graceton – Raphael Road transmission line, AP South interface, Belvidere – Woodstock flowgate, West interface, and the Breed – Wheatland flowgate.
Congestion by Facility Type and VoltageIn the first three months of 2012 compared to the first three months of 2011, day-ahead, congestion-event hours increased on the reciprocally coordinated flowgates between PJM and MISO, transmission lines and transformers while congestion frequency on internal PJM interfaces decreased. Real-time, congestion-event hours increased on the reciprocally coordinated flowgates between PJM and the MISO and transmission lines, while congestion frequency on interfaces and transformers decreased.
Day-ahead congestion costs increased on the reciprocally coordinated flowgates between PJM and MISO and transmission lines in the first three months of 2012 compared to the first three months of 2011 and decreased on PJM interfaces and transformers in the first three months of 2012 compared to the first three months of 2011. Balancing congestion costs decreased on the reciprocally coordinated
flowgates between PJM and MISO and PJM interfaces and increased on transformers and transmission lines in the first three months of 2012 compared to first three months of 2011.
Table 10-18 provides congestion-event hour subtotals and congestion cost subtotals comparing the first three months of 2012 results by facility type: line, transformer, interface, flowgate and unclassified facilities. 15,16 For comparison, this information is presented in Table 10-19 for the first three months of 2011.17
Table 10‑18 Congestion summary (By facility type): January through March 2012 (See 2011 SOM, Table 10‑19)
Type
Congestion Costs (Millions)Day Ahead Balancing Event Hours
Load Payments
Generation Credits Explicit Total
Load Payments
Generation Credits Explicit Total
Grand Total
Day Ahead
Real Time
Flowgate ($13.4) ($48.4) $12.2 $47.2 $0.3 $2.6 ($28.8) ($31.0) $16.2 6,983 1,572Interface $12.2 ($25.4) ($0.2) $37.5 $2.3 $3.5 ($2.2) ($3.5) $34.0 1,649 179Line $21.5 ($41.5) $12.5 $75.5 ($6.8) $4.5 ($10.3) ($21.6) $54.0 32,370 1,915Other $1.0 ($0.9) ($0.1) $1.8 ($0.6) ($0.2) $0.2 ($0.3) $1.5 799 196Transformer $2.2 ($13.2) $2.7 $18.1 $0.1 $1.3 ($0.7) ($1.8) $16.3 12,343 239Unclassified $0.2 ($0.5) $0.4 $1.0 ($0.1) $0.1 ($0.2) ($0.3) $0.8 NA NATotal $23.9 ($129.9) $27.5 $181.3 ($4.8) $11.7 ($42.0) ($58.5) $122.8 54,144 4,101
Table 10‑19 Congestion summary (By facility type): January through March 2011 (See 2011 SOM, Table 10‑20)
Type
Congestion Costs (Millions)Day Ahead Balancing Event Hours
Load Payments
Generation Credits Explicit Total
Load Payments
Generation Credits Explicit Total
Grand Total
Day Ahead
Real Time
Flowgate ($22.0) ($39.9) ($0.9) $17.0 $5.3 $4.2 ($21.4) ($20.3) ($3.3) 2,759 1,100Interface $37.8 ($215.0) ($5.4) $247.4 $17.0 $17.4 $3.1 $2.7 $250.1 2,954 877Line $4.2 ($63.6) $6.0 $73.8 $3.5 $10.4 ($18.6) ($25.5) $48.3 13,626 1,482Other $0.0 $0.0 $0.0 $0.0 $0.0 ($0.0) $0.0 $0.1 $0.1 0 2Transformer $17.5 ($46.0) $2.2 $65.7 $0.7 $1.1 ($4.1) ($4.4) $61.3 5,749 938Unclassified $1.0 ($0.1) $2.2 $3.3 $0.4 $0.0 ($0.2) $0.2 $3.5 NA NATotal $38.5 ($364.7) $4.1 $407.3 $27.0 $33.1 ($41.2) ($47.4) $359.9 25,088 4,399
15 Unclassified constraints appear in the Day-Ahead Market only and represent congestion costs incurred on market elements which are not posted by PJM. Congestion frequency associated with these unclassified constraints is not presented in order to be consistent with the posting of constrained facilities by PJM.
16 The term flowgate refers to MISO flowgates.17 For 2008 and 2009, the load congestion payments and generation congestion credits represent the net load congestion payments and
net generation congestion credits for an organization, as this shows the extent to which each organization’s load or generation was exposed to congestion costs.
2012 Quarterly State of the Market Report for PJM: January through March
178 Section 10 Congestion and Marginal Losses © 2012 Monitoring Analytics, LLC
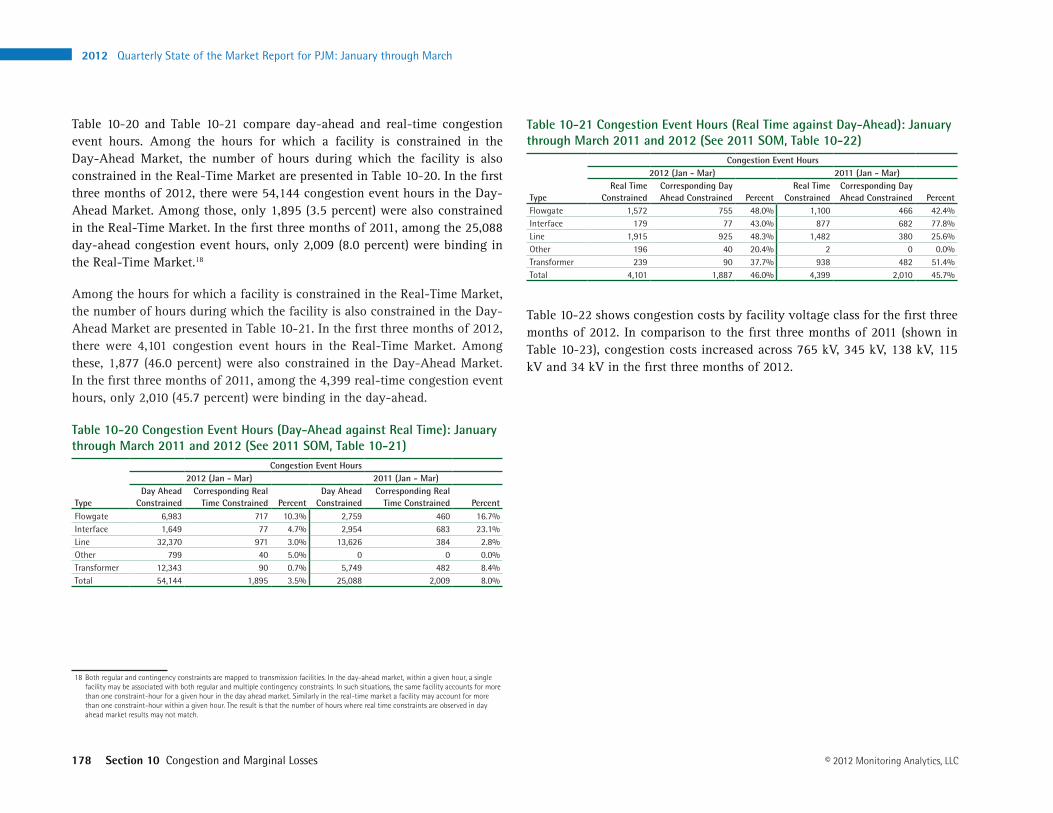
Table 10-20 and Table 10-21 compare day-ahead and real-time congestion event hours. Among the hours for which a facility is constrained in the Day-Ahead Market, the number of hours during which the facility is also constrained in the Real-Time Market are presented in Table 10-20. In the first three months of 2012, there were 54,144 congestion event hours in the Day-Ahead Market. Among those, only 1,895 (3.5 percent) were also constrained in the Real-Time Market. In the first three months of 2011, among the 25,088 day-ahead congestion event hours, only 2,009 (8.0 percent) were binding in the Real-Time Market.18
Among the hours for which a facility is constrained in the Real-Time Market, the number of hours during which the facility is also constrained in the Day-Ahead Market are presented in Table 10-21. In the first three months of 2012, there were 4,101 congestion event hours in the Real-Time Market. Among these, 1,877 (46.0 percent) were also constrained in the Day-Ahead Market. In the first three months of 2011, among the 4,399 real-time congestion event hours, only 2,010 (45.7 percent) were binding in the day-ahead.
Table 10‑20 Congestion Event Hours (Day‑Ahead against Real Time): January through March 2011 and 2012 (See 2011 SOM, Table 10‑21)
Type
Congestion Event Hours2012 (Jan ‑ Mar) 2011 (Jan ‑ Mar)
Day Ahead Constrained
Corresponding Real Time Constrained Percent
Day Ahead Constrained
Corresponding Real Time Constrained Percent
Flowgate 6,983 717 10.3% 2,759 460 16.7%Interface 1,649 77 4.7% 2,954 683 23.1%Line 32,370 971 3.0% 13,626 384 2.8%Other 799 40 5.0% 0 0 0.0%Transformer 12,343 90 0.7% 5,749 482 8.4%Total 54,144 1,895 3.5% 25,088 2,009 8.0%
18 Both regular and contingency constraints are mapped to transmission facilities. In the day-ahead market, within a given hour, a single facility may be associated with both regular and multiple contingency constraints. In such situations, the same facility accounts for more than one constraint-hour for a given hour in the day ahead market. Similarly in the real-time market a facility may account for more than one constraint-hour within a given hour. The result is that the number of hours where real time constraints are observed in day ahead market results may not match.
Table 10‑21 Congestion Event Hours (Real Time against Day‑Ahead): January through March 2011 and 2012 (See 2011 SOM, Table 10‑22)
Type
Congestion Event Hours2012 (Jan ‑ Mar) 2011 (Jan ‑ Mar)
Real Time Constrained
Corresponding Day Ahead Constrained Percent
Real Time Constrained
Corresponding Day Ahead Constrained Percent
Flowgate 1,572 755 48.0% 1,100 466 42.4%Interface 179 77 43.0% 877 682 77.8%Line 1,915 925 48.3% 1,482 380 25.6%Other 196 40 20.4% 2 0 0.0%Transformer 239 90 37.7% 938 482 51.4%Total 4,101 1,887 46.0% 4,399 2,010 45.7%
Table 10-22 shows congestion costs by facility voltage class for the first three months of 2012. In comparison to the first three months of 2011 (shown in Table 10-23), congestion costs increased across 765 kV, 345 kV, 138 kV, 115 kV and 34 kV in the first three months of 2012.

Section 10 Congestion and Marginal Losses
2012 Quarterly State of the Market Report for PJM: January through March 179© 2012 Monitoring Analytics, LLC
Table 10‑22 Congestion summary (By facility voltage): Calendar year 2012 (See 2011 SOM, Table 10‑23)
Congestion Costs (Millions)
Day Ahead Balancing Event Hours
Voltage (kV)Load
PaymentsGeneration
Credits Explicit TotalLoad
PaymentsGeneration
Credits Explicit TotalGrand Total
Day Ahead
Real Time
765 ($0.1) ($1.6) $1.2 $2.7 $0.1 ($0.0) ($0.1) ($0.0) $2.7 874 69500 $13.0 ($29.7) $0.2 $42.9 $2.0 $4.7 ($2.6) ($5.3) $37.7 3,099 237345 ($8.6) ($32.4) $5.1 $29.0 $0.8 $1.2 ($12.8) ($13.3) $15.7 8,305 684230 $18.3 ($13.2) $0.1 $31.6 ($1.2) $1.0 $0.9 ($1.3) $30.3 8,718 1,003161 ($3.9) ($6.3) $3.3 $5.8 ($0.4) $0.2 ($4.4) ($5.0) $0.8 1,320 340138 ($2.9) ($46.8) $16.3 $60.3 ($1.5) $4.2 ($22.0) ($27.7) $32.5 26,301 1,551115 $2.4 $0.1 $0.3 $2.6 ($0.4) $0.2 ($0.0) ($0.7) $2.0 3,137 7569 $5.3 $0.3 $0.5 $5.5 ($4.0) $0.1 ($0.9) ($5.0) $0.5 2,386 14234 $0.0 ($0.0) $0.0 $0.0 $0.0 $0.0 $0.0 $0.0 $0.0 0 012 ($0.0) ($0.0) ($0.0) $0.0 $0.0 $0.0 $0.0 $0.0 $0.0 4 0Unclassified $0.3 ($0.2) $0.4 $0.9 ($0.1) $0.1 ($0.2) ($0.3) $0.6 NA NATotal $23.9 ($129.9) $27.5 $181.3 ($4.8) $11.7 ($42.0) ($58.5) $122.8 54,144 4,101
Table 10‑23 Congestion summary (By facility voltage): Calendar year 2011 (See 2011 SOM, Table 10‑24)Congestion Costs (Millions)
Day Ahead Balancing Event Hours
Voltage (kV)Load
PaymentsGeneration
Credits Explicit TotalLoad
PaymentsGeneration
Credits Explicit TotalGrand Total
Day Ahead
Real Time
765 $0.4 ($1.0) $0.3 $1.6 $2.3 $1.7 ($2.0) ($1.4) $0.2 45 76500 $56.2 ($238.4) ($5.7) $288.9 $20.3 $19.6 ($0.6) $0.2 $289.0 6,120 1,573345 ($24.6) ($63.3) $3.6 $42.3 $4.2 $7.6 ($27.0) ($30.4) $11.9 6,063 1,044230 ($2.6) ($39.6) ($0.3) $36.7 $1.1 $1.2 ($0.3) ($0.3) $36.4 4,264 420161 ($0.3) ($0.5) $0.2 $0.4 ($0.1) $0.3 ($1.3) ($1.7) ($1.2) 52 62138 $3.5 ($20.9) $3.7 $28.1 ($0.6) $1.5 ($9.6) ($11.6) $16.5 5,908 1,071115 $2.5 $0.4 $0.2 $2.3 ($0.1) $0.6 ($0.1) ($0.7) $1.6 940 8469 $2.5 ($1.2) ($0.0) $3.6 ($0.7) $0.8 ($0.2) ($1.6) $2.0 1,687 6934 $0.0 ($0.0) $0.0 $0.0 $0.0 $0.0 $0.0 $0.0 $0.0 0 012 $0.0 $0.0 ($0.0) $0.0 $0.0 $0.0 $0.0 $0.0 $0.0 9 0Unclassified $1.0 ($0.1) $2.2 $3.3 $0.4 $0.0 ($0.2) $0.2 $3.5 NA NATotal $38.5 ($364.7) $4.1 $407.3 $27.0 $33.1 ($41.2) ($47.4) $359.9 25,088 4,399

2012 Quarterly State of the Market Report for PJM: January through March
180 Section 10 Congestion and Marginal Losses © 2012 Monitoring Analytics, LLC
Constraint DurationTable 10-24 lists constraints in the first three months of 2011 and 2012 that were most frequently in effect and Table 10-25 shows the constraints which experienced the largest change in congestion-event hours from the first three months of 2011 to the first three months of 2012.
Table 10‑24 Top 25 constraints with frequent occurrence: January through March 2011 and 2012 (See 2011 SOM, Table 10‑25)
No. Constraint Type
Event Hours Percent of Annual HoursDay Ahead Real Time Day Ahead Real Time
2011 2012 Change 2011 2012 Change 2011 2012 Change 2011 2012 Change1 Sporn Transformer 0 2,257 2,257 0 0 0 0% 26% 26% 0% 0% 0%2 Graceton - Raphael Road Line 10 1,392 1,382 11 407 396 0% 16% 16% 0% 5% 5%3 Oak Grove - Galesburg Flowgate 52 1,320 1,268 62 340 278 1% 15% 14% 1% 4% 3%4 Crete - St Johns Tap Flowgate 1,494 1,189 (305) 394 155 (239) 17% 14% (4%) 4% 2% (3%)5 Rockwell - Crosby Line 0 1,321 1,321 0 0 0 0% 15% 15% 0% 0% 0%6 Belmont Transformer 1,527 1,266 (261) 105 49 (56) 17% 14% (3%) 1% 1% (1%)7 Wolfcreek Transformer 716 1,187 471 94 9 (85) 8% 14% 5% 1% 0% (1%)8 Huntingdon - Huntingdon1 Line 0 1,126 1,126 0 0 0 0% 13% 13% 0% 0% 0%9 Conesville 138 Transformer 0 1,107 1,107 0 0 0 0% 13% 13% 0% 0% 0%10 Monticello - East Winamac Flowgate 17 796 779 45 295 250 0% 9% 9% 1% 3% 3%11 Conesville 345 Transformer 0 1,038 1,038 0 0 0 0% 12% 12% 0% 0% 0%12 Kammer Transformer 0 995 995 0 0 0 0% 11% 11% 0% 0% 0%13 AP South Interface 1,172 881 (291) 513 73 (440) 13% 10% (3%) 6% 1% (5%)14 Howard - Shelby Line 0 942 942 0 0 0 0% 11% 11% 0% 0% 0%15 Belvidere - Woodstock Line 68 537 469 12 374 362 1% 6% 5% 0% 4% 4%16 Linden - VFT Line 532 908 376 0 0 0 6% 10% 4% 0% 0% 0%17 Brues - West Bellaire Line 79 854 775 71 13 (58) 1% 10% 9% 1% 0% (1%)18 Emilie - Falls Line 789 842 53 0 0 0 9% 10% 1% 0% 0% 0%19 Silver Lake - Pleasant Valley Line 0 817 817 0 0 0 0% 9% 9% 0% 0% 0%20 East Towanda - S.Troy Line 15 779 764 0 0 0 0% 9% 9% 0% 0% 0%21 Big Sandy - Grangston Line 29 777 748 0 0 0 0% 9% 9% 0% 0% 0%22 Cumberland - Bush Flowgate 211 646 435 22 119 97 2% 7% 5% 0% 1% 1%23 Hillsdale - New Milford Line 0 679 679 0 81 81 0% 8% 8% 0% 1% 1%24 Breed - Wheatland Flowgate 0 500 500 0 172 172 0% 6% 6% 0% 2% 2%25 Belvidere - Woodstock Flowgate 0 631 631 0 0 0 0% 7% 7% 0% 0% 0%

Section 10 Congestion and Marginal Losses
2012 Quarterly State of the Market Report for PJM: January through March 181© 2012 Monitoring Analytics, LLC
Table 10‑25 Top 25 constraints with largest year‑to‑year change in occurrence: January through March 2011 and 2012 (See 2011 SOM, Table 10‑26)
No. Constraint Type
Event Hours Percent of Annual HoursDay Ahead Real Time Day Ahead Real Time
2011 2012 Change 2011 2012 Change 2011 2012 Change 2011 2012 Change1 Sporn Transformer 0 2,257 2,257 0 0 0 0% 26% 26% 0% 0% 0%2 South Mahwah - Waldwick Line 1,706 23 (1,683) 203 0 (203) 19% 0% (19%) 2% 0% (2%)3 Graceton - Raphael Road Line 10 1,392 1,382 11 407 396 0% 16% 16% 0% 5% 5%4 Oak Grove - Galesburg Flowgate 52 1,320 1,268 62 340 278 1% 15% 14% 1% 4% 3%5 Wylie Ridge Transformer 1,235 54 (1,181) 329 0 (329) 14% 1% (13%) 4% 0% (4%)6 Rockwell - Crosby Line 0 1,321 1,321 0 0 0 0% 15% 15% 0% 0% 0%7 Huntingdon - Huntingdon1 Line 0 1,126 1,126 0 0 0 0% 13% 13% 0% 0% 0%8 Conesville 138 Transformer 0 1,107 1,107 0 0 0 0% 13% 13% 0% 0% 0%9 Conesville 345 Transformer 0 1,038 1,038 0 0 0 0% 12% 12% 0% 0% 0%10 Monticello - East Winamac Flowgate 17 796 779 45 295 250 0% 9% 9% 1% 3% 3%11 Kammer Transformer 0 995 995 0 0 0 0% 11% 11% 0% 0% 0%12 Howard - Shelby Line 0 942 942 0 0 0 0% 11% 11% 0% 0% 0%13 Belvidere - Woodstock Line 68 537 469 12 374 362 1% 6% 5% 0% 4% 4%14 Silver Lake - Pleasant Valley Line 0 817 817 0 0 0 0% 9% 9% 0% 0% 0%15 East Towanda - S.Troy Line 15 779 764 0 0 0 0% 9% 9% 0% 0% 0%16 Hillsdale - New Milford Line 0 679 679 0 81 81 0% 8% 8% 0% 1% 1%17 Big Sandy - Grangston Line 29 777 748 0 0 0 0% 9% 9% 0% 0% 0%18 Pleasant Prairie - Zion Flowgate 593 0 (593) 140 0 (140) 7% 0% (7%) 2% 0% (2%)19 AP South Interface 1,172 881 (291) 513 73 (440) 13% 10% (3%) 6% 1% (5%)20 Brues - West Bellaire Line 79 854 775 71 13 (58) 1% 10% 9% 1% 0% (1%)21 Breed - Wheatland Flowgate 0 500 500 0 172 172 0% 6% 6% 0% 2% 2%22 Belvidere - Woodstock Flowgate 0 631 631 0 0 0 0% 7% 7% 0% 0% 0%23 Evert - South Troy Line 0 626 626 0 0 0 0% 7% 7% 0% 0% 0%24 Lake Nelson - Middlesex Line 22 621 599 0 0 0 0% 7% 7% 0% 0% 0%25 Bedington - Black Oak Interface 573 0 (573) 0 2 2 7% 0% (7%) 0% 0% 0%

2012 Quarterly State of the Market Report for PJM: January through March
182 Section 10 Congestion and Marginal Losses © 2012 Monitoring Analytics, LLC
Constraint CostsTable 10-26 and Table 10-27 present the top constraints affecting congestion costs by facility for the periods January through March 2012 and 201.
Table 10‑26 Top 25 constraints affecting annual PJM congestion costs (By facility): January through March 2012 (See 2011 SOM, Table 10‑27)
No. Constraint Type Location
Congestion Costs (Millions) Percent of Total PJM Congestion CostsDay Ahead Balancing
Load Payments
Generation Credits Explicit Total
Load Payments
Generation Credits Explicit Total
Grand Total 2012 (Jan ‑ Mar)
1 Graceton - Raphael Road Line BGE $12.8 ($8.9) ($2.4) $19.2 $0.1 $0.1 $1.3 $1.3 $20.6 17%2 AP South Interface 500 $14.3 ($7.6) $0.1 $22.0 $1.3 $1.0 ($2.2) ($2.0) $20.1 16%3 Belvidere - Woodstock Flowgate ComEd ($2.2) ($13.0) $1.3 $12.2 $0.0 $0.0 $0.0 $0.0 $12.2 10%4 West Interface 500 $0.4 ($6.2) ($0.3) $6.3 $0.0 $0.0 ($0.0) ($0.0) $6.3 5%5 Breed - Wheatland Flowgate MISO ($0.7) ($4.0) ($0.0) $3.4 $0.2 $0.3 ($8.5) ($8.6) ($5.2) (4%)6 Crete - St Johns Tap Flowgate MISO ($2.7) ($9.7) ($0.4) $6.6 $0.2 $0.5 ($2.0) ($2.4) $4.2 3%7 Lancaster - Maryland Line ComEd $0.2 ($0.2) $0.2 $0.7 ($0.4) $0.6 ($3.5) ($4.4) ($3.8) (3%)8 East Interface 500 ($2.3) ($7.1) ($0.6) $4.2 $0.1 $0.5 ($0.1) ($0.5) $3.7 3%9 Silver Lake - Pleasant Valley Line ComEd ($2.2) ($4.8) $1.0 $3.7 $0.0 $0.0 $0.0 $0.0 $3.7 3%10 Belmont Transformer AP $0.8 ($4.2) $0.4 $5.3 ($0.3) $1.1 ($0.4) ($1.8) $3.5 3%11 Electric Jct - Nelson Line ComEd ($0.9) ($3.1) $1.1 $3.3 $0.0 $0.0 ($0.0) ($0.0) $3.3 3%12 5004/5005 Interface Interface 500 $0.2 ($3.0) $0.4 $3.6 $0.7 $1.6 $0.1 ($0.8) $2.8 2%13 Jefferson - Clifty Creek Line AEP ($0.1) ($1.9) $0.8 $2.6 $0.0 $0.0 $0.0 $0.0 $2.6 2%14 Kammer Transformer AEP ($0.8) ($3.2) ($0.3) $2.1 $0.0 $0.0 $0.0 $0.0 $2.1 2%15 Brues - West Bellaire Line AEP $1.6 ($0.6) ($0.3) $1.9 ($0.0) $0.0 $0.0 ($0.0) $1.9 2%16 Belvidere - Woodstock Line ComEd ($0.1) ($3.9) $0.7 $4.6 ($1.2) $1.1 ($4.0) ($6.3) ($1.7) (1%)17 Breed - Wheatland Line AEP ($0.9) ($2.6) ($0.0) $1.6 $0.0 $0.0 $0.0 $0.0 $1.6 1%18 Burnham - Munster Line ComEd ($0.1) ($0.3) $0.1 $0.3 $0.0 $0.3 ($1.6) ($1.9) ($1.6) (1%)19 Monticello - East Winamac Flowgate MISO $0.0 ($5.9) $4.2 $10.1 $0.3 $1.2 ($7.6) ($8.6) $1.5 1%20 Lake Nelson - Middlesex Line PSEG $1.3 $0.2 $0.4 $1.5 $0.0 $0.0 $0.0 $0.0 $1.5 1%21 Mazon - Mazon Line ComEd ($0.3) ($1.3) $0.7 $1.8 ($0.0) ($0.0) ($0.3) ($0.3) $1.5 1%22 Wolfcreek Transformer AEP $0.1 ($1.2) $0.3 $1.5 ($0.0) ($0.0) ($0.1) ($0.1) $1.5 1%23 Jefferson - Rockport Line AEP ($0.0) ($0.8) $0.6 $1.5 $0.0 $0.0 $0.0 $0.0 $1.5 1%24 Potomac River Transformer Pepco $1.3 $0.0 $0.1 $1.4 $0.0 $0.0 $0.0 $0.0 $1.4 1%25 Prairie State - W Mt. Vernon Flowgate MISO ($1.6) ($2.5) $0.5 $1.4 ($0.0) ($0.0) ($0.1) ($0.1) $1.3 1%

Section 10 Congestion and Marginal Losses
2012 Quarterly State of the Market Report for PJM: January through March 183© 2012 Monitoring Analytics, LLC
Table 10‑27 Top 25 constraints affecting annual PJM congestion costs (By facility): January through March 2011 (See 2011 SOM, Table 10‑28)
No. Constraint Type Location
Congestion Costs (Millions) Percent of Total PJM Congestion CostsDay Ahead Balancing
Load Payments
Generation Credits Explicit Total
Load Payments
Generation Credits Explicit Total
Grand Total 2011 (Jan ‑ Mar)
1 AP South Interface 500 $53.9 ($78.9) $0.5 $133.3 $9.9 $10.0 ($0.6) ($0.7) $132.6 37%2 5004/5005 Interface Interface 500 ($22.1) ($85.8) ($4.4) $59.3 $6.0 $5.7 $3.6 $4.0 $63.2 18%3 Bedington - Black Oak Interface 500 $10.4 ($14.2) ($2.0) $22.5 $0.0 $0.0 $0.0 $0.0 $22.5 6%4 Belmont Transformer AP $5.9 ($20.4) ($2.2) $24.1 ($1.6) ($0.5) ($0.7) ($1.8) $22.3 6%5 Susquehanna Transformer PPL ($2.9) ($17.4) ($0.1) $14.4 $0.0 $0.0 $0.0 $0.0 $14.4 4%6 AEP-DOM Interface 500 $4.7 ($8.5) $0.8 $14.0 $0.6 $0.4 ($0.1) $0.2 $14.2 4%7 Crete - St Johns Tap Flowgate MISO ($19.5) ($34.0) ($4.0) $10.6 $3.8 $1.8 ($0.9) $1.2 $11.7 3%8 West Interface 500 ($3.4) ($13.2) ($0.1) $9.7 $0.2 $0.0 $0.1 $0.3 $10.0 3%9 Wylie Ridge Transformer AP $10.9 $2.5 $1.7 $10.1 $1.5 $0.6 ($2.2) ($1.4) $8.7 2%10 East Interface 500 ($4.5) ($12.3) ($0.2) $7.6 $0.2 $1.3 $0.1 ($1.0) $6.6 2%11 Lakeview - Pleasant Prairie Flowgate MISO ($0.1) ($0.2) $0.2 $0.3 ($0.2) $0.0 ($4.2) ($4.4) ($4.1) (1%)12 Bridgewater - Middlesex Line PSEG $0.1 ($4.1) $0.1 $4.3 $0.1 $0.2 ($0.3) ($0.4) $3.9 1%13 Cloverdale - Lexington Line 500 $2.0 ($0.9) $0.1 $3.0 $2.7 $1.3 ($0.5) $1.0 $3.9 1%14 Pleasant Prairie - Zion Flowgate MISO ($0.2) ($0.9) $1.7 $2.5 ($0.1) ($0.2) ($6.2) ($6.2) ($3.7) (1%)15 Butler - Karns City Line AP $1.2 ($2.3) ($0.1) $3.4 ($0.1) ($0.3) ($0.0) $0.2 $3.5 1%16 Unclassified Unclassified Unclassified $1.0 ($0.1) $2.2 $3.3 $0.4 $0.0 ($0.2) $0.2 $3.5 1%17 Cedar Grove - Roseland Line PSEG ($0.2) ($3.7) ($0.9) $2.6 $0.4 $0.5 $0.8 $0.7 $3.3 1%18 Electric Jct - Nelson Line ComEd ($1.2) ($6.1) $1.4 $6.4 ($0.1) $0.3 ($2.8) ($3.1) $3.2 1%19 Plymouth Meeting - Whitpain Line PECO ($0.3) ($3.2) $0.0 $2.9 $0.1 $0.0 ($0.1) ($0.0) $2.9 1%20 Wolfcreek Transformer AEP $1.9 ($1.0) ($0.3) $2.6 ($0.2) ($0.2) ($0.1) ($0.0) $2.6 1%21 Bristers - Ox Line Dominion ($0.1) ($2.7) $0.0 $2.6 $0.3 $0.3 ($0.1) ($0.2) $2.4 1%22 Collier - Elwyn Line DLCO ($0.1) ($2.1) $0.1 $2.1 $0.1 ($0.1) ($0.0) $0.1 $2.3 1%23 Rising Flowgate MISO ($1.0) ($1.5) $0.1 $0.7 $0.2 $0.7 ($2.3) ($2.8) ($2.1) (1%)24 Limerick Transformer PECO ($0.6) ($2.7) ($0.1) $2.0 $0.0 $0.0 $0.0 $0.0 $2.0 1%25 Cherry Valley Transformer ComEd $0.8 ($1.0) $0.3 $2.2 $0.0 $0.1 ($0.1) ($0.2) $2.0 1%
2012 Quarterly State of the Market Report for PJM: January through March
184 Section 10 Congestion and Marginal Losses © 2012 Monitoring Analytics, LLC
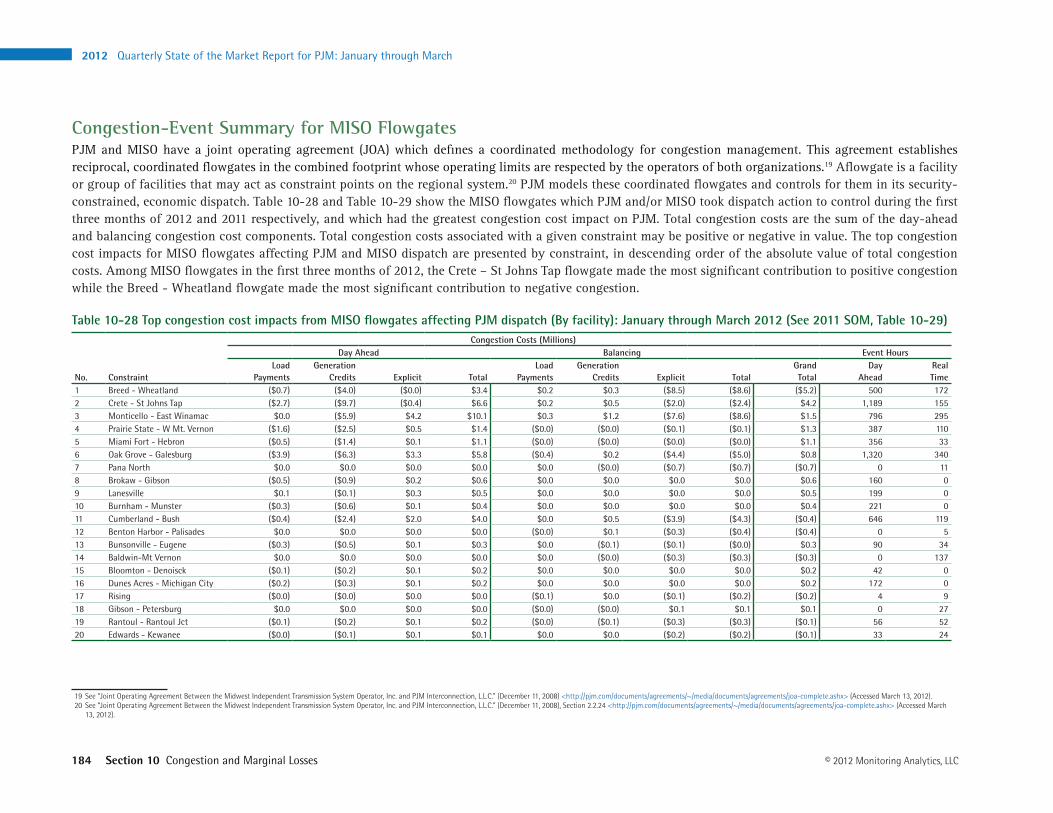
Congestion-Event Summary for MISO FlowgatesPJM and MISO have a joint operating agreement (JOA) which defines a coordinated methodology for congestion management. This agreement establishes reciprocal, coordinated flowgates in the combined footprint whose operating limits are respected by the operators of both organizations.19 Aflowgate is a facility or group of facilities that may act as constraint points on the regional system.20 PJM models these coordinated flowgates and controls for them in its security-constrained, economic dispatch. Table 10-28 and Table 10-29 show the MISO flowgates which PJM and/or MISO took dispatch action to control during the first three months of 2012 and 2011 respectively, and which had the greatest congestion cost impact on PJM. Total congestion costs are the sum of the day-ahead and balancing congestion cost components. Total congestion costs associated with a given constraint may be positive or negative in value. The top congestion cost impacts for MISO flowgates affecting PJM and MISO dispatch are presented by constraint, in descending order of the absolute value of total congestion costs. Among MISO flowgates in the first three months of 2012, the Crete – St Johns Tap flowgate made the most significant contribution to positive congestion while the Breed - Wheatland flowgate made the most significant contribution to negative congestion.
Table 10‑28 Top congestion cost impacts from MISO flowgates affecting PJM dispatch (By facility): January through March 2012 (See 2011 SOM, Table 10‑29)
No. Constraint
Congestion Costs (Millions)Day Ahead Balancing Event Hours
Load Payments
Generation Credits Explicit Total
Load Payments
Generation Credits Explicit Total
Grand Total
Day Ahead
Real Time
1 Breed - Wheatland ($0.7) ($4.0) ($0.0) $3.4 $0.2 $0.3 ($8.5) ($8.6) ($5.2) 500 1722 Crete - St Johns Tap ($2.7) ($9.7) ($0.4) $6.6 $0.2 $0.5 ($2.0) ($2.4) $4.2 1,189 1553 Monticello - East Winamac $0.0 ($5.9) $4.2 $10.1 $0.3 $1.2 ($7.6) ($8.6) $1.5 796 2954 Prairie State - W Mt. Vernon ($1.6) ($2.5) $0.5 $1.4 ($0.0) ($0.0) ($0.1) ($0.1) $1.3 387 1105 Miami Fort - Hebron ($0.5) ($1.4) $0.1 $1.1 ($0.0) ($0.0) ($0.0) ($0.0) $1.1 356 336 Oak Grove - Galesburg ($3.9) ($6.3) $3.3 $5.8 ($0.4) $0.2 ($4.4) ($5.0) $0.8 1,320 3407 Pana North $0.0 $0.0 $0.0 $0.0 $0.0 ($0.0) ($0.7) ($0.7) ($0.7) 0 118 Brokaw - Gibson ($0.5) ($0.9) $0.2 $0.6 $0.0 $0.0 $0.0 $0.0 $0.6 160 09 Lanesville $0.1 ($0.1) $0.3 $0.5 $0.0 $0.0 $0.0 $0.0 $0.5 199 010 Burnham - Munster ($0.3) ($0.6) $0.1 $0.4 $0.0 $0.0 $0.0 $0.0 $0.4 221 011 Cumberland - Bush ($0.4) ($2.4) $2.0 $4.0 $0.0 $0.5 ($3.9) ($4.3) ($0.4) 646 11912 Benton Harbor - Palisades $0.0 $0.0 $0.0 $0.0 ($0.0) $0.1 ($0.3) ($0.4) ($0.4) 0 513 Bunsonville - Eugene ($0.3) ($0.5) $0.1 $0.3 $0.0 ($0.1) ($0.1) ($0.0) $0.3 90 3414 Baldwin-Mt Vernon $0.0 $0.0 $0.0 $0.0 $0.0 ($0.0) ($0.3) ($0.3) ($0.3) 0 13715 Bloomton - Denoisck ($0.1) ($0.2) $0.1 $0.2 $0.0 $0.0 $0.0 $0.0 $0.2 42 016 Dunes Acres - Michigan City ($0.2) ($0.3) $0.1 $0.2 $0.0 $0.0 $0.0 $0.0 $0.2 172 017 Rising ($0.0) ($0.0) $0.0 $0.0 ($0.1) $0.0 ($0.1) ($0.2) ($0.2) 4 918 Gibson - Petersburg $0.0 $0.0 $0.0 $0.0 ($0.0) ($0.0) $0.1 $0.1 $0.1 0 2719 Rantoul - Rantoul Jct ($0.1) ($0.2) $0.1 $0.2 ($0.0) ($0.1) ($0.3) ($0.3) ($0.1) 56 5220 Edwards - Kewanee ($0.0) ($0.1) $0.1 $0.1 $0.0 $0.0 ($0.2) ($0.2) ($0.1) 33 24
19 See “Joint Operating Agreement Between the Midwest Independent Transmission System Operator, Inc. and PJM Interconnection, L.L.C.” (December 11, 2008) <http://pjm.com/documents/agreements/~/media/documents/agreements/joa-complete.ashx> (Accessed March 13, 2012).20 See “Joint Operating Agreement Between the Midwest Independent Transmission System Operator, Inc. and PJM Interconnection, L.L.C.” (December 11, 2008), Section 2.2.24 <http://pjm.com/documents/agreements/~/media/documents/agreements/joa-complete.ashx> (Accessed March
13, 2012).
Section 10 Congestion and Marginal Losses
2012 Quarterly State of the Market Report for PJM: January through March 185© 2012 Monitoring Analytics, LLC
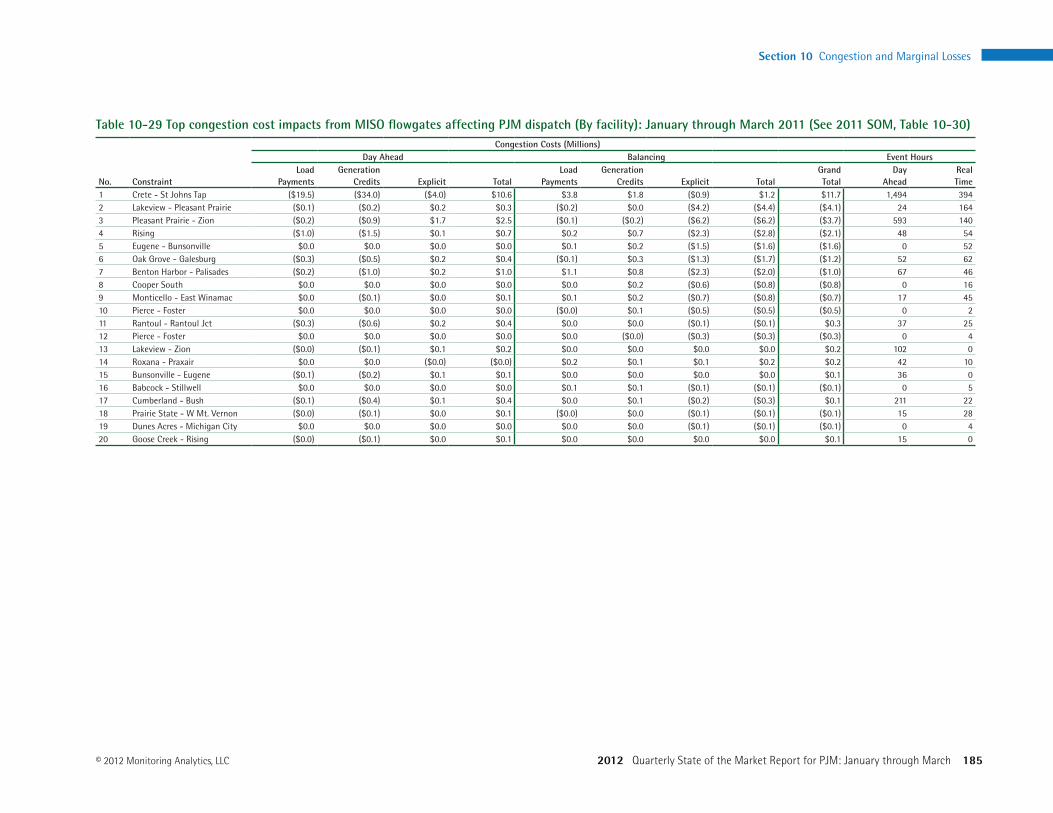
Table 10‑29 Top congestion cost impacts from MISO flowgates affecting PJM dispatch (By facility): January through March 2011 (See 2011 SOM, Table 10‑30)
No. Constraint
Congestion Costs (Millions)Day Ahead Balancing Event Hours
Load Payments
Generation Credits Explicit Total
Load Payments
Generation Credits Explicit Total
Grand Total
Day Ahead
Real Time
1 Crete - St Johns Tap ($19.5) ($34.0) ($4.0) $10.6 $3.8 $1.8 ($0.9) $1.2 $11.7 1,494 3942 Lakeview - Pleasant Prairie ($0.1) ($0.2) $0.2 $0.3 ($0.2) $0.0 ($4.2) ($4.4) ($4.1) 24 1643 Pleasant Prairie - Zion ($0.2) ($0.9) $1.7 $2.5 ($0.1) ($0.2) ($6.2) ($6.2) ($3.7) 593 1404 Rising ($1.0) ($1.5) $0.1 $0.7 $0.2 $0.7 ($2.3) ($2.8) ($2.1) 48 545 Eugene - Bunsonville $0.0 $0.0 $0.0 $0.0 $0.1 $0.2 ($1.5) ($1.6) ($1.6) 0 526 Oak Grove - Galesburg ($0.3) ($0.5) $0.2 $0.4 ($0.1) $0.3 ($1.3) ($1.7) ($1.2) 52 627 Benton Harbor - Palisades ($0.2) ($1.0) $0.2 $1.0 $1.1 $0.8 ($2.3) ($2.0) ($1.0) 67 468 Cooper South $0.0 $0.0 $0.0 $0.0 $0.0 $0.2 ($0.6) ($0.8) ($0.8) 0 169 Monticello - East Winamac $0.0 ($0.1) $0.0 $0.1 $0.1 $0.2 ($0.7) ($0.8) ($0.7) 17 4510 Pierce - Foster $0.0 $0.0 $0.0 $0.0 ($0.0) $0.1 ($0.5) ($0.5) ($0.5) 0 211 Rantoul - Rantoul Jct ($0.3) ($0.6) $0.2 $0.4 $0.0 $0.0 ($0.1) ($0.1) $0.3 37 2512 Pierce - Foster $0.0 $0.0 $0.0 $0.0 $0.0 ($0.0) ($0.3) ($0.3) ($0.3) 0 413 Lakeview - Zion ($0.0) ($0.1) $0.1 $0.2 $0.0 $0.0 $0.0 $0.0 $0.2 102 014 Roxana - Praxair $0.0 $0.0 ($0.0) ($0.0) $0.2 $0.1 $0.1 $0.2 $0.2 42 1015 Bunsonville - Eugene ($0.1) ($0.2) $0.1 $0.1 $0.0 $0.0 $0.0 $0.0 $0.1 36 016 Babcock - Stillwell $0.0 $0.0 $0.0 $0.0 $0.1 $0.1 ($0.1) ($0.1) ($0.1) 0 517 Cumberland - Bush ($0.1) ($0.4) $0.1 $0.4 $0.0 $0.1 ($0.2) ($0.3) $0.1 211 2218 Prairie State - W Mt. Vernon ($0.0) ($0.1) $0.0 $0.1 ($0.0) $0.0 ($0.1) ($0.1) ($0.1) 15 2819 Dunes Acres - Michigan City $0.0 $0.0 $0.0 $0.0 $0.0 $0.0 ($0.1) ($0.1) ($0.1) 0 420 Goose Creek - Rising ($0.0) ($0.1) $0.0 $0.1 $0.0 $0.0 $0.0 $0.0 $0.1 15 0

2012 Quarterly State of the Market Report for PJM: January through March
186 Section 10 Congestion and Marginal Losses © 2012 Monitoring Analytics, LLC
Congestion-Event Summary for the 500 kV SystemConstraints on the 500 kV system generally have a regional impact. Table 10-30 and Table 10-31 show the 500 kV constraints impacting congestion costs in PJM for the first three months of 2012 and 2011 respectively. Total congestion costs are the sum of the day-ahead and balancing congestion cost components. Total congestion costs associated with a given constraint may be positive or negative in value. The 500 kV constraints impacting congestion costs in PJM are presented by constraint, in descending order of the absolute value of total congestion costs.
Table 10‑30 Regional constraints summary (By facility): January through March 2012 (See 2011 SOM, Table 10‑31)
No. Constraint Type Location
Congestion Costs (Millions)Day Ahead Balancing Event Hours
Load Payments
Generation Credits Explicit Total
Load Payments
Generation Credits Explicit Total
Grand Total
Day Ahead
Real Time
1 AP South Interface 500 $14.3 ($7.6) $0.1 $22.0 $1.3 $1.0 ($2.2) ($2.0) $20.1 881 732 West Interface 500 $0.4 ($6.2) ($0.3) $6.3 $0.0 $0.0 ($0.0) ($0.0) $6.3 241 23 East Interface 500 ($2.3) ($7.1) ($0.6) $4.2 $0.1 $0.5 ($0.1) ($0.5) $3.7 160 54 5004/5005 Interface Interface 500 $0.2 ($3.0) $0.4 $3.6 $0.7 $1.6 $0.1 ($0.8) $2.8 131 645 Central Interface 500 ($0.6) ($1.2) $0.1 $0.7 $0.0 $0.0 ($0.0) ($0.0) $0.7 170 26 AEP-DOM Interface 500 $0.2 ($0.3) $0.1 $0.7 $0.3 $0.4 ($0.1) ($0.2) $0.5 66 317 Kammer Transformer 500 $0.0 $0.0 $0.0 $0.0 $0.0 ($0.0) ($0.0) $0.0 $0.0 0 198 Bedington - Black Oak Interface 500 $0.0 $0.0 $0.0 $0.0 $0.0 ($0.0) ($0.0) $0.0 $0.0 0 2
Table 10‑31 Regional constraints summary (By facility): January through March 2011 (See 2011 SOM, Table 10‑32)
No. Constraint Type Location
Congestion Costs (Millions)Day Ahead Balancing Event Hours
Load Payments
Generation Credits Explicit Total
Load Payments
Generation Credits Explicit Total
Grand Total
Day Ahead
Real Time
1 AP South Interface 500 $53.9 ($78.9) $0.5 $133.3 $9.9 $10.0 ($0.6) ($0.7) $132.6 1,172 5132 5004/5005 Interface Interface 500 ($22.1) ($85.8) ($4.4) $59.3 $6.0 $5.7 $3.6 $4.0 $63.2 513 2413 Bedington - Black Oak Interface 500 $10.4 ($14.2) ($2.0) $22.5 $0.0 $0.0 $0.0 $0.0 $22.5 573 04 AEP-DOM Interface 500 $4.7 ($8.5) $0.8 $14.0 $0.6 $0.4 ($0.1) $0.2 $14.2 293 885 West Interface 500 ($3.4) ($13.2) ($0.1) $9.7 $0.2 $0.0 $0.1 $0.3 $10.0 231 126 East Interface 500 ($4.5) ($12.3) ($0.2) $7.6 $0.2 $1.3 $0.1 ($1.0) $6.6 127 227 Cloverdale - Lexington Line 500 $2.0 ($0.9) $0.1 $3.0 $2.7 $1.3 ($0.5) $1.0 $3.9 172 1558 Central Interface 500 ($1.2) ($2.2) ($0.1) $1.0 $0.0 $0.0 $0.0 $0.0 $1.0 45 09 Harrison - Pruntytown Line 500 $0.0 ($0.1) $0.0 $0.1 ($0.0) ($0.0) $0.0 $0.0 $0.1 10 410 Conemaugh - Hunterstown Line 500 $0.0 $0.0 $0.0 $0.0 $0.0 $0.0 $0.0 ($0.0) ($0.0) 0 911 Dominion East Interface 500 $0.0 $0.0 $0.0 $0.0 $0.0 $0.0 ($0.0) $0.0 $0.0 0 1

Section 10 Congestion and Marginal Losses
2012 Quarterly State of the Market Report for PJM: January through March 187© 2012 Monitoring Analytics, LLC
Congestion Costs by Physical and Financial ParticipantsIn the PJM market, both physical and financial participants make virtual supply offers (increments) and virtual demand bids (decrements). A participant is classified as a physical entity if the entity primarily takes physical positions in PJM markets. Physical entities include utilities and wholesale customers. Financial entities include banks, hedge funds, retail service providers and speculators, who primarily take financial positions in PJM markets. All affiliates are considered a single entity for this categorization. For example, under this classification, the trading affiliate of a utility would be treated as a physical company.
Table 10‑32 Congestion cost by the type of the participant: January through March 2012 (See 2011 SOM, Table 10‑33)
Congestion Costs (Millions)Day Ahead Balancing
Participant Type
Load Payments
Generation Credits Explicit Total
Load Payments
Generation Credits Explicit Total
Inadvertent Charges
Grand Total
Financial $7.0 $2.7 $20.8 $25.2 ($7.6) $1.7 ($33.8) ($43.1) $0.0 ($17.9)Physical $16.8 ($132.5) $6.7 $156.1 $2.8 $10.0 ($8.2) ($15.4) $0.0 $140.7 Total $23.9 ($129.9) $27.5 $181.3 ($4.8) $11.7 ($42.0) ($58.5) $0.0 $122.8
Table 10‑33 Congestion cost by the type of the participant: January through March 2011 (See 2011 SOM, Table 10‑34)
Congestion Costs (Millions)Day Ahead Balancing
Participant Type
Load Payments
Generation Credits Explicit Total
Load Payments
Generation Credits Explicit Total
Inadvertent Charges
Grand Total
Financial $33.6 $10.5 $10.6 $33.7 ($4.1) ($1.9) ($40.7) ($42.9) $0.0 ($9.3)Physical $5.0 ($375.2) ($6.5) $373.6 $31.0 $34.9 ($0.5) ($4.4) $0.0 $369.2 Total $38.5 ($364.7) $4.1 $407.3 $27.0 $33.1 ($41.2) ($47.4) $0.0 $359.9
In the first three months of 2012, financial companies as a group were net recipients of congestion credits, and physical companies were net payers of congestion charges. In the first three months of 2012, financial companies received $17.9 million in net congestion credits, an increase of $8.6 million or 92.5 percent compared to the first three months of 2011. In the first three months of 2012, physical companies paid $140.7 million in net congestion charges, a decrease of $228.5 million or 61.9 percent compared to the first three months of 2011.

2012 Quarterly State of the Market Report for PJM: January through March
188 Section 10 Congestion and Marginal Losses © 2012 Monitoring Analytics, LLC