congo basin forest cover change estimate · pdf filelandsat interpretation using an automated...
TRANSCRIPT

CONGO BASIN FOREST COVER CHANGE ESTIMATE FOR 1990, 2000 AND 2005 BY
LANDSAT INTERPRETATION USING AN AUTOMATED OBJECT-BASED
PROCESSING CHAIN
C. Ernsta*, A. Verhegghena, C. Bodartb, P. Mayauxb, C. de Wasseigec, A. Bararwandikad, G. Begotoe, F. Esono Mbaf, M. Ibarag, A.
Kondjo Shokoh, H. Koy Kondjoh, J-S. Makaki, J-D. Menomo Biangj, C. Musampah, R. Ncogo Motogok, G. Neba Shul, B.
Nkoumakalim, C.-B. Ouissikan, P. Defournya
a Earth and Life Institute, Université Catholique de Louvain, Louvain-la-Neuve, Belgium - (celine.ernst,
astrid.verhegghen, pierre.defourny)@uclouvain.be, b Joint Research Centre of the European Commission, Ispra, Italy –
(catherine.bodart, philippe.mayaux)@jrc.ec.europa.eu, c Observatoire des Forêts d’Afrique Centrale, Kinshasa,
République Démocratique du Congo - [email protected], d Ministère de l’Environnement, Département des Forêts,
Burundi, e Word Resources Institute/Projet d'Appui à la Réalisation des Plans d'Aménagement Forestiers, Central
African Republic, f Ministerio de Agricultura y Bosques, Equatorial Guinea.,
g Word Resources Institute, Congo,
h
Ministère de l’Environnement, de Conservation de la Nature et du Tourisme, Direction Inventaire et Aménagement
forestier, Democratic Republic of the Congo, i Word Resources Institute, Gabon,
j Ministère de la Forêt et de la Faune,
Cameroon, k INDEFOR-AP Bata Litoral, Equatorial Guinea,
l Word Resources Institute, Cameroon,
m Ministère de
l’Economie Forestière/DGEF LAGRAC/Université Omar Bongo, Gabon, n Centre National d’Inventaire et
d'Aménagement des ressources Forestières et Fauniques, Congo
KEY WORDS: Congo Basin, forest cover, REDD, land cover, land cover change, object-based validation, high spatial resolution
ABSTRACT:
Central Africa contains the second largest area of contiguous moist tropical forest of the world. In the framework of the Observatory
of Forests in Central Africa (OFAC) and the Forest Resources Assessment (FRA-2010) led by Food and Agricultural Organization
of the United Nations (FAO), each country is invited to provide an estimation of forest cover change for years 1990-2000-2005 (and
later 2010). In this context, developing efficient methods to detect forest changes by processing remote sensing data is more than
ever a challenging need. At the moment, only satellite images can provide enough information on processes such as deforestation at
the scale of Congo basin. An automatic method has been designed to map and quantify forest change in Central Africa. 1168 subsets
of 20 x 20 km of 30 m resolution Landsat or Aster are required to cover the different countries. The different steps of the method are
a (1) multi-date segmentation, applied on each extracts triplet (1990-2000 and 2005), (2) an unsupervised classification and an (3)
automatic pre-labeling. (4) Change is detected by a statistical object-based method. (5) The involvement of national experts is an
essential part of the intepretation process. The OFAC team together with Joint Research Centre (JRC-EU) and FAO invited in
Kinshasa (September 2009) 13 national experts from the 6 countries of the Congo Basin to validate the land cover mapping and
change maps. National experts check, and change if needed, the pre-interpretation of each sample using an object-based validation
tool developed by the JRC. This unique exercise estimates not only deforestation and reforestation but also degradation and
regeneration which are particularly important in Central Africa. These results are expected to contribute to the discussion on the
reduction of CO2 emissions from deforestation and forest degradation (UN-REDD).
* Corresponding author
1. INTRODUCTION
Although they covering less than 10% of the total land
surface of the Earth, tropicals forests include the most
biodiverse of terrestrial ecosystems (Myers et al., 2000). Congo
Basin hosts the second-largest contiguous block of tropical
forest after the Amazon (FAO, 2009) and has been in the
spotlight for several decades as one of the world’s most
threatened ecosystems. In spite of their strategic importance in
global climate change and biodiversity richness, forests have
been grappling with both historical and contemporary issues
like commercial logging, clearing for subsistence agriculture,
poaching for bush meat, including civil strife and influx of
refugees in some of the countries in the region, as well as an
upsurge in resources exploitation for reconstruction after civil
wars like in the Democratic Republic of Congo (CoFCCA,
2009). Quantifying rates of humid tropical forest cover clearing
is critical for many areas of earth system and sustainable science
(Hansen et al., 2008) and to assist policy decision making.
However, it has been difficult to collect reliable data to map and
monitor the deforestation of Central Africa because of the
inaccessibility of its massive land area and very low in-country
forest monitoring capacities (Zhang et al., 2005).
The Observatory for the Forests of Central Africa, an
initiative of multiple members of the Congo Basin Forests
Partnership, aims to pool the knowledge and available data
necessary to monitor the ecological, environmental, and social
aspects of Central Africa's forests. Congo Basin is composed by
six countries: Cameroon, Central African Republic (CAR),
Congo, Democratic Republic of Congo (DRC), Equatorial
Guinea and Gabon. Today, optical earth observations
approaches are operational for forest monitoring. Furthermore,
they offer a unique and valuable information source for large
volume data acquisition and management and a mass volume
processing in a repeatable way. In this context OFAC and FRA-
2010 led by FAO, invited each country to work together to
provide forest cover changes for years 1990, 2000 and 2005.

The International Archives of the Photogrammetry, Remote Sensing and Spatial Information Sciences, Vol. XXXVIII-4/C7
This paper presents all the essential steps in the elaboration
of forest cover changes at regional level: multi-date
segmentation, automated pre-labeling, national expert
validation, statistics computation and first results.
2. OBJECTIVES
Object methods have been used for change detection
whether for temperate forests (Desclée et al., 2006) or tropical
forests (Duveiller et al., 2008). Automation of the method made
possible by study of Verhegghen et al. (this issue), opens new
horizons. The paper aims to demonstrate reproducibility of
figures produced by Duveiller et al. (2008) for Central Africa
forests by an automated object-based method and a national
expert validation. The second objective is to apply the method
to 2000 – 2005 satellite imagery.
3. SELECTION AND PRE-PROCESSING IMAGERY
Figure 1: Data status
1168 subsets of Landsat or Aster imagery (30m resolution),
20 km x 20 km and systematically distributed on Central Africa
have been extracted (Figure 1). For every sample site, two (pair)
or three (triplet) co-registered Landsat or Aster imagery were
available. Each pair is composed by a high resolution Landsat
TM imagery acquired around 1990 and by a Landsat ETM+
acquired around 2000. Each triplet is composed by a high
resolution Landsat TM imagery acquired around 1990, by a
Landsat ETM+ acquired around 2000 and by a Landsat ETM+
or Aster imagery acquired around 2005. The grid system
selected for the systematic sampling is a rectilinear grid based
on 0.5° degrees of geographical latitude and longitude. Due to
the lack of data on cloudy regions, Equatorial Guinea and
Gabon have been over-sampled every 0.25°. Five important
steps have been realized: (1) imagery selection (visual
assessment), (2) multi-temporal image registration, (3) data
calibration, (4) clouds and shadow masking and (5) haze
correction.
4. OPERATIONAL STUDY
Based on recent studies (Desclée et al., 2006; Duveiller et
al., 2008; Verhegghen et al., this issue) we have developed an
automated object-based pre-interpretation to map and quantify
changes in forests of Central Africa.
4.1 Multi-date segmentation
Following method proposed by Desclée et al. (2006), we
used a multi-date segmentation for object delineation. This
method, based on multi-resolution segmentation (Baatz &
Schäpe, 2000), partitions multi-year image into homogeneous
regions. These regions regroups pixel which are spectrally
homogeneous and have a similar land cover change trajectories.
Multi-date segmentation using bands red, near-infrared (NIR),
short wavelength infrared (SWIR) (5) and SWIR (7) has been
applied to each pair or triplet of satellite images at two different
levels. The two levels of segmentation have been implemented
making sure that the smaller level is included in the largest one.
Spectral bands all have the same weight. Thanks to a loop
implemented on the scale parameter in the rule set, smaller level
contains 95% of objects which have a minimum mapping unit
(MMU) of 1 ha. This level is used for the automated pre-
labeling and the interactive interpretation by experts. As the
coarser level (95% of objects have a MMU of 5 ha) is used for
change processes and statistics computation. To hone objects
delineation and to avoid heterogeneous polygons, a spectral
difference segmentation followed by four consecutive multi-
resolution segmentations have been applied.
4.2 Automatic pre-labelling and change detection
Objects (1 ha MMU) delineated by the segmentation step
are classified in 20 clusters by an unsupervised classification (k-
means classification). Classification is performed independently
on each image of the pair or the triplet.
Based on a reference land cover map (i.e. Africover or
Globcover), objects occupied by more than 95 % of forest land
cover are selected. In order to select forest training set, objects
that didn’t prove a spectral signature typical of forests are
eliminated by iterative trimming on mean (within objects) of
band 3, 4, 5 and standard deviation of band 4 (confidence level
of 0.99). Trimming is defined as the removal of extreme values
that behave like outliers (Desclée et al., 2006). Based on three
spectral bands (red, NIR, SWIR), the Mahalanobis distance is
calculated between forest training set and other objects. Object
with a signature within the confidence interval (0.95) are
classified as tree cover. A cluster occupied by more than 70% of
forest object is classified as tree cover. Other clusters are
classified as non forest. Among these, four classes are
differentiated: water, cloud/shadow, shrub cover and other land
cover. The two first are computed with spectral signature in E-
Cognition software. The shrub label is computed by extracting
information from a reference map and adapted through decision
rules (mean object size and Mahalanobis distance).
The resulting land cover legend is the following: (1) tree
cover (the canopy density of the tree layer should be at least
10% and tree height 5 m or more), (2) shrub cover (any woody
vegetation layer of less than 5 m height), (3) other vegetation
cover (land cover other than tree or shrub cover), (4) water, (5)
cloud and shadow and finally (6) no data.
The automated change detection is based on an object
method over two-time interval: 1990-2000 and 2000-2005.
Under the forest mask, which is the result of the union of forest
classification of both dates, the reflectance difference is
computed. The trimming procedure highlights objects
considered as outliers with a confidence level 1-α equal to 0.99.
The International Archives of the Photogrammetry, Remote Sensing and Spatial Information Sciences, Vol. XXXVIII-4/C7
4.3 Participative approach and expert validation
Involvement of national experts is an essential part of the
process. In order to enhanced capacity building in the six
countries of the Congo Basin for monitoring, assessing and
reporting on forests and land use changes, the OFAC team
together with FAO and JRC-EU invited in Kinshasa (DRC) 13
national experts with profound knowledge on regional context.
The workshop participants had to validate the automatic
pre-interpretation land cover mapping and the change detection.
Thanks to an object-based validation tool developed by the
JRC-EU, two validation steps were proposed. At first, national
experts had to check and recode (if needed) the label assigned
to each cluster by the automated labeling. This step had to be
done independently for the two or three dates (year 1990, year
2000 and year 2005). Secondly, they had to check objects
highlighted as change between 1990 and 2000 and between
2000 and 2005 by verifying if change was marked or not in a
label difference and vice versa. 897 samples (two or three dates)
were pre-labeled by the automated processing and available for
the national experts (Figure 1). 443 samples have been validated
by national experts id est 4.8 samples sites a day by expert. Few
extracts have been validated in some areas (south of DRC,
north-west of CAR) due to the complexity of the landscape and
lack of time.
4.4 Statistics computation
This last steps leads to the final assignment of land cover
labels. The land cover information of small objects (MMU of 1
ha) is aggregated to coarser object (MMU of 5 ha) using
decision rules taking into account the proportion of the different
land cover classes. This step creates two additional vegetation
classes: (1) tree cover Mosaic High (the ratio of tree cover area
within the object is between 40 and 70%), (2) tree cover Mosaic
Low (the ratio of tree cover area within the object is between 10
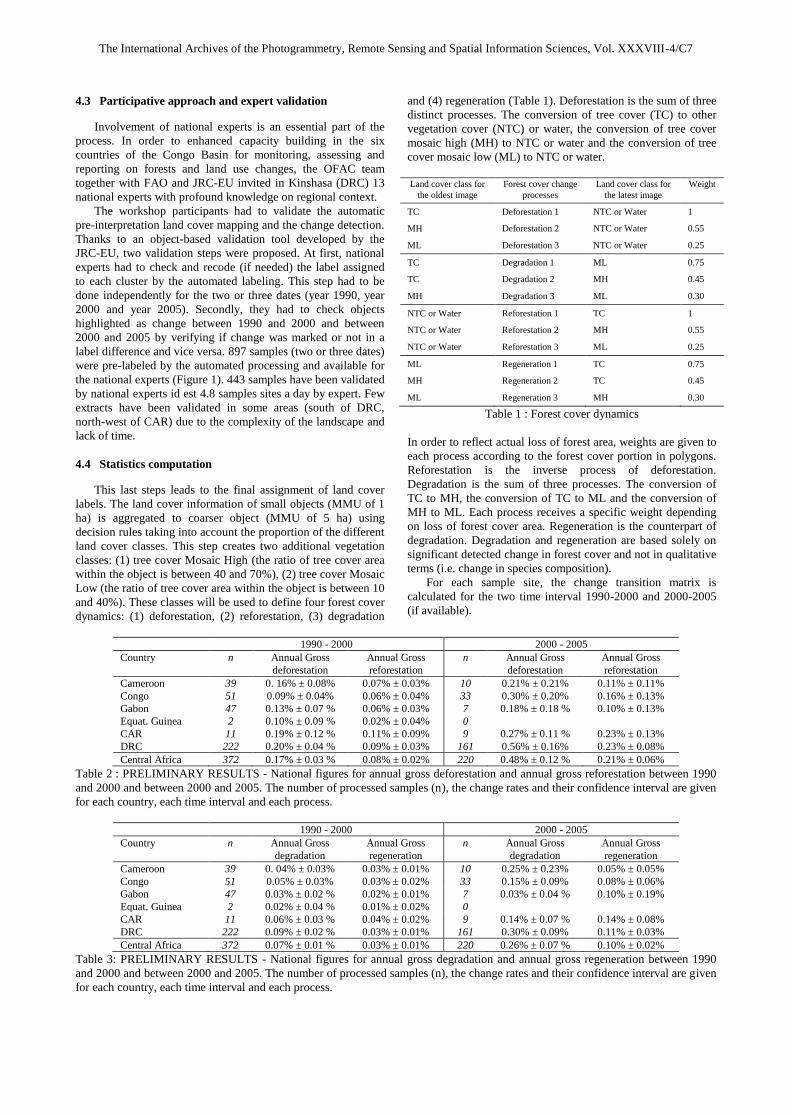
and 40%). These classes will be used to define four forest cover
dynamics: (1) deforestation, (2) reforestation, (3) degradation
and (4) regeneration (Table 1). Deforestation is the sum of three
distinct processes. The conversion of tree cover (TC) to other
vegetation cover (NTC) or water, the conversion of tree cover
mosaic high (MH) to NTC or water and the conversion of tree
cover mosaic low (ML) to NTC or water.
Land cover class for
the oldest image
Forest cover change
processes
Land cover class for
the latest image
Weight
TC Deforestation 1 NTC or Water 1
MH Deforestation 2 NTC or Water 0.55
ML Deforestation 3 NTC or Water 0.25
TC Degradation 1 ML 0.75
TC Degradation 2 MH 0.45
MH Degradation 3 ML 0.30
NTC or Water Reforestation 1 TC 1
NTC or Water Reforestation 2 MH 0.55
NTC or Water Reforestation 3 ML 0.25
ML Regeneration 1 TC 0.75
MH Regeneration 2 TC 0.45
ML Regeneration 3 MH 0.30
Table 1 : Forest cover dynamics
In order to reflect actual loss of forest area, weights are given to
each process according to the forest cover portion in polygons.
Reforestation is the inverse process of deforestation.
Degradation is the sum of three processes. The conversion of
TC to MH, the conversion of TC to ML and the conversion of
MH to ML. Each process receives a specific weight depending
on loss of forest cover area. Regeneration is the counterpart of
degradation. Degradation and regeneration are based solely on
significant detected change in forest cover and not in qualitative
terms (i.e. change in species composition).
For each sample site, the change transition matrix is
calculated for the two time interval 1990-2000 and 2000-2005
(if available).
1990 - 2000 2000 - 2005
Country n Annual Gross
deforestation
Annual Gross
reforestation
n Annual Gross
deforestation
Annual Gross
reforestation
Cameroon 39 0. 16% ± 0.08% 0.07% ± 0.03% 10 0.21% ± 0.21% 0.11% ± 0.11%
Congo 51 0.09% ± 0.04% 0.06% ± 0.04% 33 0.30% ± 0.20% 0.16% ± 0.13%
Gabon 47 0.13% ± 0.07 % 0.06% ± 0.03% 7 0.18% ± 0.18 % 0.10% ± 0.13%
Equat. Guinea 2 0.10% ± 0.09 % 0.02% ± 0.04% 0
CAR 11 0.19% ± 0.12 % 0.11% ± 0.09% 9 0.27% ± 0.11 % 0.23% ± 0.13%
DRC 222 0.20% ± 0.04 % 0.09% ± 0.03% 161 0.56% ± 0.16% 0.23% ± 0.08%
Central Africa 372 0.17% ± 0.03 % 0.08% ± 0.02% 220 0.48% ± 0.12 % 0.21% ± 0.06%
Table 2 : PRELIMINARY RESULTS - National figures for annual gross deforestation and annual gross reforestation between 1990
and 2000 and between 2000 and 2005. The number of processed samples (n), the change rates and their confidence interval are given
for each country, each time interval and each process.
1990 - 2000 2000 - 2005
Country n Annual Gross
degradation
Annual Gross
regeneration
n Annual Gross
degradation
Annual Gross
regeneration
Cameroon 39 0. 04% ± 0.03% 0.03% ± 0.01% 10 0.25% ± 0.23% 0.05% ± 0.05%
Congo 51 0.05% ± 0.03% 0.03% ± 0.02% 33 0.15% ± 0.09% 0.08% ± 0.06%
Gabon 47 0.03% ± 0.02 % 0.02% ± 0.01% 7 0.03% ± 0.04 % 0.10% ± 0.19%
Equat. Guinea 2 0.02% ± 0.04 % 0.01% ± 0.02% 0
CAR 11 0.06% ± 0.03 % 0.04% ± 0.02% 9 0.14% ± 0.07 % 0.14% ± 0.08%
DRC 222 0.09% ± 0.02 % 0.03% ± 0.01% 161 0.30% ± 0.09% 0.11% ± 0.03%
Central Africa 372 0.07% ± 0.01 % 0.03% ± 0.01% 220 0.26% ± 0.07 % 0.10% ± 0.02%
Table 3: PRELIMINARY RESULTS - National figures for annual gross degradation and annual gross regeneration between 1990
and 2000 and between 2000 and 2005. The number of processed samples (n), the change rates and their confidence interval are given
for each country, each time interval and each process.
The International Archives of the Photogrammetry, Remote Sensing and Spatial Information Sciences, Vol. XXXVIII-4/C7
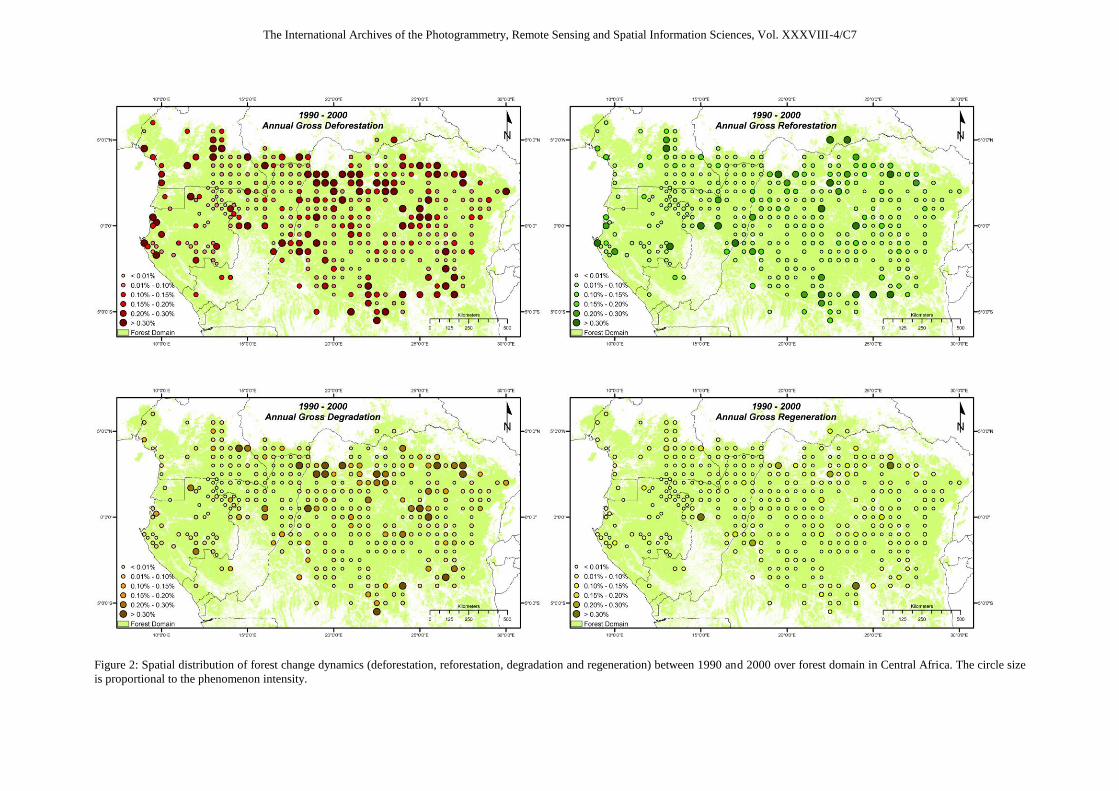
Figure 2: Spatial distribution of forest change dynamics (deforestation, reforestation, degradation and regeneration) between 1990 and 2000 over forest domain in Central Africa. The circle size
is proportional to the phenomenon intensity.

The International Archives of the Photogrammetry, Remote Sensing and Spatial Information Sciences, Vol. XXXVIII-4/C7
Figure 3 : Spatial distribution of forest change dynamics (deforestation, reforestation, degradation and regeneration) between 2000 and 2005 over forest domain in Central Africa. The circle size
is proportional to the phenomenon intensity.
The International Archives of the Photogrammetry, Remote Sensing and Spatial Information Sciences, Vol. XXXVIII-4/C7
5. PRELIMINARY RESULTS
Since each satellite image are not acquired at the same
date but around the first of June 1990, 2000 and 2005, land
cover area and change transition matrix are linearly extrapolated
to these pivot dates. Statistics of forest cover change processes
are calculated. Each process is characterized by an annual rate.
This rate is computed by dividing the total changed surface by
the time period between the two images (typically 10 for change
between 1990 and 2000 and 5 for 2000 - 2005) and by the
estimated total forest area between these two dates (the sum of
forest area between 1990 and 2000 divided by 2 or the sum of
forest area between 2000 and 2005 divided by 2). The variance
is estimated by the classical formula used for random sampling,
even though the design of this current study is systematic. The
calculation can be considered as conservative since it provides
higher figures for variance than the real one (Duveiller et al.,
2008). The total number of validated samples was 443. But only
372 of these 443 samples were located in forest domain and
have been used for the forest cover change estimation. 220
samples of the 372 samples were 3 dates. For 1990-2000, by
comparing these preliminary results (Table 2, Table 3) with
those published by Duveiller et al. (2008), we note confidence
interval coincides, apart from Equatorial Guinea and annual
gross reforestation in DRC. Results differ slightly more for
annual gross degradation and annual gross regeneration.
Approach developed in both studies might explain the
inconsistency of some figures. Duveiller et al. (2008) uses a
manual interpretation and labeling whereas we developed an
automated pre-labeling completed by national expert validation.
Secondly, the land cover classes used in both studies are
different. Furthermore, in this study, specific weights have been
given to each sub-process in order to reflect area forest cover
loss. Finally, the survey of Duveiller et al. (2008) was
composed of 10 x 10 km sampling sites while 20 x 20 km
sampling sites was used in this case.
For 1990-2000, the deforestation phenomenon remains
relatively modest in the Congo Basin overall but tends to
increase sharply for 2000-2005 especially in CAR, Congo and
DRC. Due to missing data in 2000-2005, national figures of
some countries (i.e. Cameroon or Gabon) are not representative
and additional survey are necessary.
For each time-interval, the spatial distribution of
deforestation (Figure 2 and Figure 3), reforestation, degradation
and regeneration processes is illustrated. Between 1990 and
2000, we notice that deforestation, reforestation and
degradation phenomena are more important in accessible areas
such as forest fringe or along the Congo River. This seems to be
less pronounced with the annual regeneration rate. Between
2000 and 2005, deforestation and degradation processes tend to
worsen and reach less accessible areas.
6. CONCLUSIONS
The forests of the Congo Basin are a world treasure that
provides crucial ecosystem services to forest-dependent
communities and that stores enormous quantities of carbon
(Dkamela et al., 2009). Quantifying the temporal and the spatial
deforestation, reforestation, degradation and regeneration rates
is crucial.
Contribution of object based automated method is
undeniable and allows a large data processing and an easily
expert validation. Additional investigate would be interesting to
analyze the reason of some inconsistency between Duveiller et
al. (2008) and this study, to test the reproducibility of the
method and to consolidate annual rates. However, this paper
demonstrates the importance of capacity building and
technology transfer to countries in the Congo Basin, a necessary
step to national ownership. Central African countries have the
technological and scientific maturity for forest change
assessment.
REFERENCES
Baatz, M. & Schäpe A., 2000. Multiresolution Segmentation:
an optimization approach for high quality multi-scale image
segmentation. In J. Strobl, T. Blaschke & G. Griesebner (Eds),
Angewandte Geographische Informationsverarbeitung, XII
(pp.12-23). Heidelberg: Wichmann-Verlag.
CoFCCA, 2009. Altering the climate of poverty under climate
change in Sub-Saharan Africa: Setting priorities for adaptation
with forests climate change. First Year Annual Report, Congo
Basin Forests and Climate Change Adaptation. Center for
International Forestry Research (CIFOR), IDRC, 41pp.
http://www.cifor.cgiar.org/cofcca/
Desclée, B., Bogaert, P., & Defourny, P., 2006. Forest change
detection by statistical object-based method. Remote Sensing of
Environment, 102, 1-11
Dkamela, G.P., Mbambu, F.K., Austin, K., Minnemeyer, S. &
Stolle, F., 2009. Working paper - Voices from the Congo Basin:
Incorporating the Perspectives of Local Stakeholders for
Improved REDD Design. World Resources Institute (WRI),
8pp. http://www.wri.org/publication/voices-from-the-congo-
basin
Duveiller, G., Defourny, P., Desclée, B. & Mayaux, P., 2008.
Deforestation in Central Africa : Estimates at regional, national
and landscape levels by advanced processing of systematically-
distributed Landsat extracts. Remote Sensing of Environment,
112, 1969-1981.
FAO, 2009, State of the World Forests 2009, Food and
Agricultural Organization of the United Nations, Rome.
http://www.fao.org/docrep/011/i0350e/i0350e00.htm
Hansen, M.C., Stehman, S.V., Potapov, P.V., Loveland, T.R.,
Townshend, J.R.G., DeFries, R.S., Pittman, K.W., Arunarwati,
B., Stolle, F., Steininger, M.K., Carroll, M. & Dimiceli, C.,
2008. Humid tropical forest clearing from 2000 to 2005
quantified by using multitemporal and multiresolution remotely
sensed data. Proceedings of the National Academy of Sciences
of the United States of America, 105(27), 9439-9444.
Myers, N., Mittermeier, R.A., Mittermeier, C.G., da Fonseca,
G.A.B & Kent, J., 2000. Biodoversity hot spots for conservation
priorities. Nature, 403, 853-858.
Verhegghen, A., Ernst, C., Beuchle, R. & Defourny, P., This
issue. Automated land cover mapping and independent change
detection in tropical forest using multi-temporal high resolution
data set. The International Archives of the Photogrammetry,
Remote Sensing and Spatial Information Sciences, Vol.
XXXVIII-4/C7.
Zhang, Q., Devers, D., Desch, A., Justice C.O., Townshend, J.,
2005. Mapping Tropical Deforestation in Central Africa.
Environmental Monitoring and Assessment, 101, 69-83.