congressional budget office imf fiscal affairs and research departments conference on fiscal policy...
TRANSCRIPT
Congressional Budget Office
IMF Fiscal Affairs and Research Departments Conference on Fiscal Policy
Implementation Lags of Fiscal Policy
Doug Elmendorf
Director
June 2, 2009

The American Recovery and Reinvestment Act (ARRA)
During Congressional debate from mid-December to mid-February, the U.S. economy was contracting rapidly.
The Federal Reserve cut the funds rate essentially to zero in December and thus was out of ammunition for its principal policy weapon.
As a result, there was a perception of great urgency in providing fiscal stimulus.
2
How Important Was Timeliness?
Many forecasters expected a large gap between actual and potential output to persist for some time. (In CBO’s forecast the output gap was 7 percent of potential in 2009 and 2010 and 5 percent in 2011.) Therefore, policies that provided stimulus for an extended period of time seemed appropriate.
Moreover, fiscal stimulus that ends before the economy has started to regain its footing runs the risk of exacerbating economic weakness when the stimulus ends.
Still, with the economy contracting rapidly, many analysts (and politicians) wanted stimulus to work quickly in order to mitigate further deterioration in the economy.
3

Components of the ARRA
Total Amount
Share Disbursed by End of Fiscal Year
($ billions) 2009 2010 2011
Discretionary spending (Highways, mass transit, energy efficiency, broadband, education, state aid)
308 11% 47% 72%
Entitlements (Food stamps, unemployment compensation, health IT, Medicaid matching rate, refundable tax credits)
267 32% 73% 91%
Revenues (Personal tax credits, business, energy, infrastructure)
212 31% 116% 119%
Total 787 24% 74% 91%4
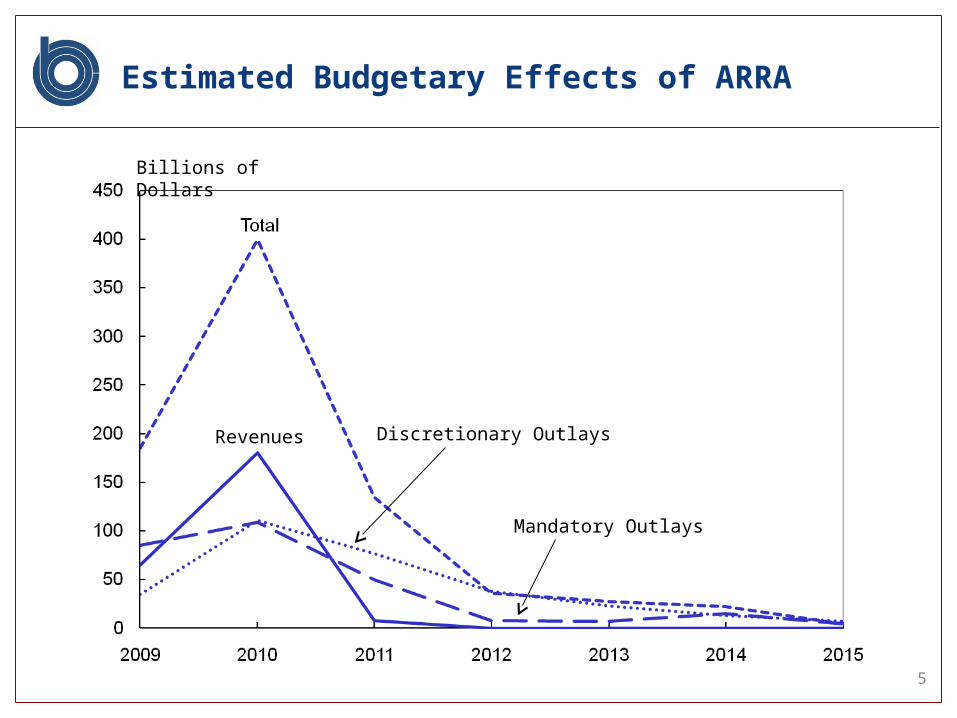
Estimated Budgetary Effects of ARRA
Billions of Dollars
Mandatory Outlays
Discretionary OutlaysRevenues
5

Spend-Out of Discretionary Budget Authority Usually Takes Time
Share spent by end of:
1st year 2nd year 3rd year
Highways 27% 68% 84%
Water Projects 4% 24% 54%
Defense 65% 88% 96%
Average 60% 85% 95%
6

Special Factors for ARRA
ARRA included a number of greatly expanded or brand new programs, which slows spend-out.
Can the White House apply pressure so that spending occurs more quickly?
Legislation could:– Waive environmental reviews– Allow contracts to be awarded without competitive bidding– Award money to fastest movers rather than by formula
across jurisdictions– Offer financial incentives to contractors for faster completion– Give deadlines for states to obligate money 7
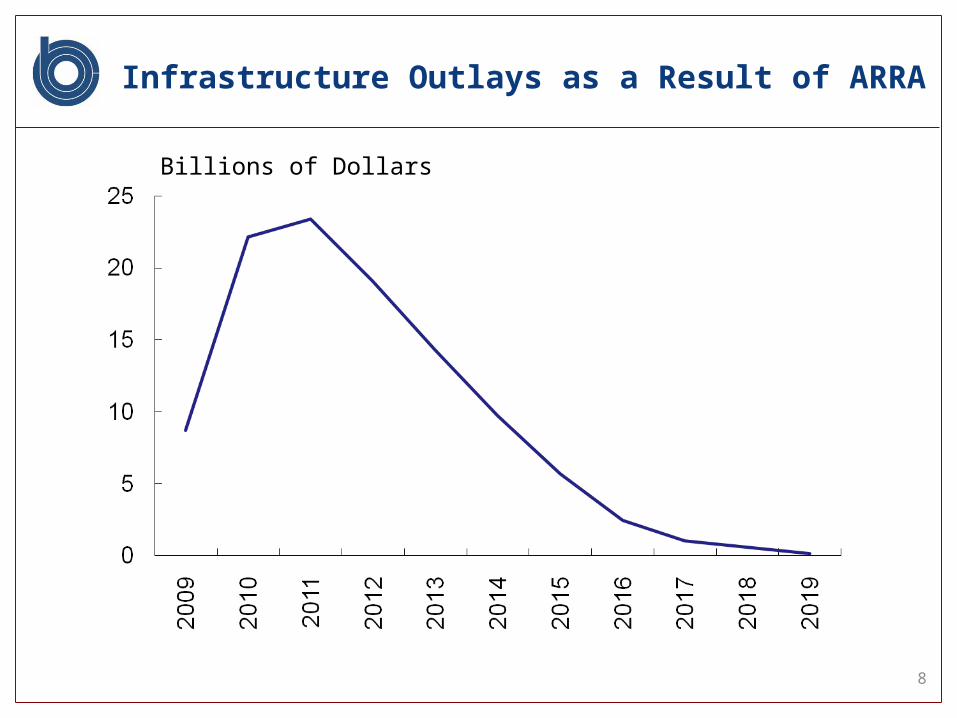
Infrastructure Outlays as a Result of ARRA
Billions of Dollars
8

Entitlements
Transfer payments to individuals (such as unemployment benefits) go out from the federal government quickly.
Aid to states goes out quickly if it builds directly on existing formulas (such as increased federal support for Medicaid) but more slowly otherwise (such as education support). – Key macro question: How quickly and how much do state
budgets respond? Implementation lags include not just time between enactment and changes in federal outlays or receipts, but also time between federal budget changes and changes in GDP.
9

ARRA Outlays to Date (Through May 22nd)
AgencyBudget
AuthorityOutlays
Through May 22nd
Outlaysas a Percentage ofBudget Authority
Education 97,407 1,735 2
Health and Human Services 62,279 16,861 27
Transportation 48,120 69 <1
Energy 38,735 44 <1
Labor 36,423 3,695 10
All Other Agencies 96,077 2,190 2
Total 379,041 24,593 6
Millions of Dollars
10

Revenues
Changes in withholding occur quickly.
Rebates take several months, and more during tax-
filing season.
Deferring or eliminating future tax increases affects
the budget only with a lag. How quickly does it affect household spending?
11

Estimated Effect of 2008 Rebates
20082007
11500
11000
10500
10000
9500
9000
Actual Income
Actual Consumption
ExcludingRebates
ExcludingRebateEffect
Billions of Dollars
12

How Can Implementation Lags Be Reduced?
Have projects “shovel-ready.” But is this practical on a large scale?
Pick tax and spending changes on the basis of implementation speed. But this requires compromise on other aspects of desirable fiscal policy: Who would be helped? What additional goods and services would society consume?
13

Estimated Macroeconomic Effects of ARRA
Fourth Quarters of Calendar Years
2009 2010 2011 … 2019
Real GDP (Percentage change from baseline)
Low estimate of effect 1.4 1.1 0.4 -0.2
High estimate of effect 3.8 3.4 1.2 0
Unemployment Rate (Percentage-point change from baseline)
Low estimate of effect 0.5 0.6 0.3 0
High estimate of effect 1.3 1.9 1.0 0
Employment (Millions of jobs change from baseline)
Low estimate of effect 0.9 1.2 0.6 0
High estimate of effect 2.3 3.6 1.8 0
14
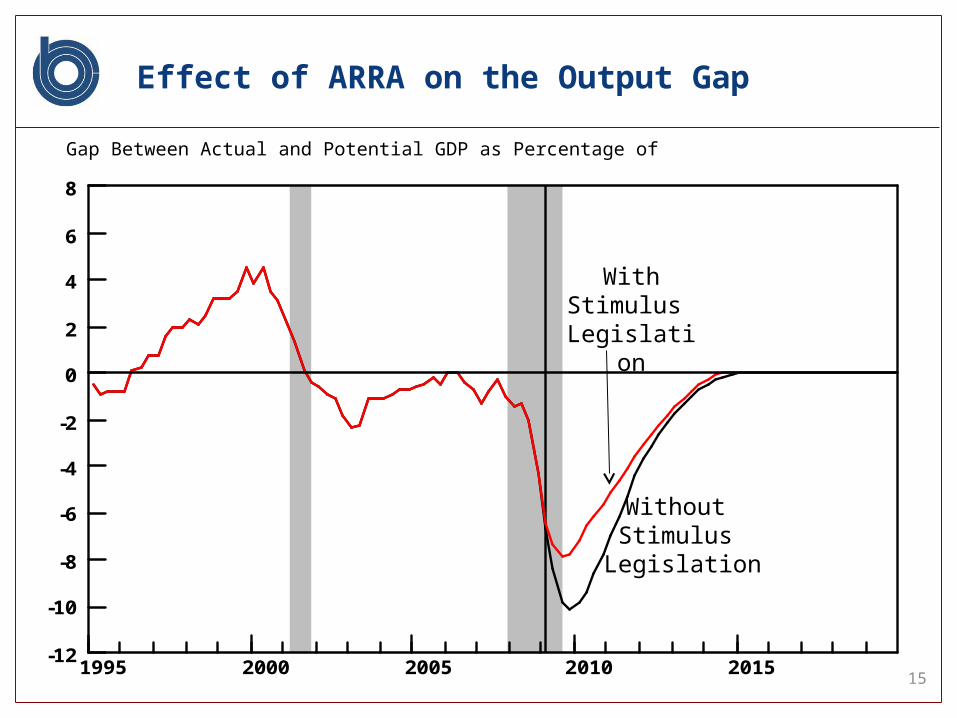
Effect of ARRA on the Output Gap
Gap Between Actual and Potential GDP as Percentage of Potential GDP
20152010200520001995
8
6
4
2
0
-2
-4
-6
-8
-10
-12
Without Stimulus
Legislation
WithStimulus
Legislation
15