congruence between self and subordinates …
TRANSCRIPT

CONGRUENCE BETWEEN SELF AND SUBORDINATES’
PERCEPTIONS ABOUT LEADERSHIP STYLES AND PERFORMANCE
IN BANKING SECTOR OF PAKISTAN
BY
MUHAMMAD ASRAR UL HAQ
DISSERTATION
Submitted in partial fulfillment of the requirements
for the degree of Doctor of Philosophy in Human Resource Education
in the Graduate College of the
University of Illinois at Urbana-Champaign, 2014
Urbana, Illinois
Doctoral Committee:
Professor K Peter Kuchinke, Chair
Professor Rose Mary Cordova-Wentling
Associate Professor Jessica Li
Assistant Professor Jehanzeb Rashid Cheema

ii
ABSTRACT
The banking sector has been the fast growing sector in Pakistan and facing various
challenges, including high turnover, lack of job satisfaction and organizational commitment. The
followers’ behavior fit with the leadership style is an indicator of good performance whereas
incongruity leads to the poor (individual and organizational) performance. The purpose of this
study was to examine the congruence between managers’ (self) and subordinates’ perceptions
about their leadership styles and its impact on performance outcomes. Leadership styles
(independent variables) included transformational leadership, transactional leadership and laissez-
faire leadership. The outcomes (dependent variables) consisted of effectiveness, extra effort,
satisfaction, and organizational commitment. The data was collected from sixty-five banks (65
managers and 225 subordinates) using MLQ 360 (5 X Short) by Bass and Avolio and OCQ by
Meyer and Allen. The managers responded about their self-perceived leadership styles and its
relationship with performance outcomes. The subordinates responded about their perceptions of
managers’ leadership styles and its impact on performance outcomes. The data was analyzed using
MANOVA, ANOVA and multiple regression analysis. The results showed that the banking sector
of Pakistan is a male dominant sector, echoed with the young and well-educated workforce. The
results indicated significant differences between managers’ (self) and subordinates’ perceptions
about their leadership styles at dimension level. In addition, a significant difference was found
between managers and subordinates about the impact of transformational leadership style and
laissez-faire leadership style on different outcomes.
Key words: Leadership Style, Outcomes, Banking, Pakistan

iii
To My Parents and Teachers

iv
ACKNOWLEDGMENTS
I thank Almighty Allah for His blessings that enabled me to accomplish this task. I would
never have been able to complete my PhD degree without guidance and support from many people,
including my advisor, committee members, other professors, friends, and family. I would like to
pay homage to Prof. K Peter Kuchinke for his guidance, support, encouragement, and useful
critiques to complete my degree in timely manner.
Many thanks to Prof. Jehanzeb Rashid Cheema, Prof. Jessica Li, and Prof. Rose Mary
Cordova-Wentling for their guidance and help throughout my research. I would like to express my
deepest appreciation to Prof. Michael Norman, my work supervisor, who always helped me and
gave me his best suggestions whenever I needed.
I am grateful to all my friends and colleagues who helped me to collect data for this study,
especially Mr. Muzhar Javed (Assistant Professor, CIIT), Mr. Khawer Iqbal (Deputy Assistant
Director, I & P), Mr. Naeem Haider (Vice president, MIB), Mr. Rana Abad Ali Khan (Regional
Chief, HBL), Ismail Nasir (MCB), Dr. Syed Muhammad Suhail (Associate Professor, AUP), and
Muhammad Rizwan.
Last but not the least, thanks to the COMSATS Institute of Information Technology
Pakistan for providing me an opportunity to study at the University of Illinois at Urbana-
Champaign.

v
TABLE OF CONTENTS
CHAPTER 1: INTRODUCTION ................................................................................................................ 1
CHAPTER 2: LITERATURE REVIEW ................................................................................................ 25
CHAPTER 3: METHODOLOGY ............................................................................................................. 45
CHAPTER 4: RESULTS .......................................................................................................................... 57
CHAPTER 5: CONCLUSIONS ........................................................................................................ 132
REFERENCES ...................................................................................................................................... 144
APPENDIX A: INSTRUMENTS ............................................................................................................ 160
APPENDIX B: PERMISSION LETTERS TO USE INSTRUMENTS .......................................................... 164
APPENDIX C: CONSENT LETTER ........................................................................................................ 166
APPENDIX D: OUTLIER ANALYSIS ..................................................................................................... 167
APPENDIX E: DESCRIPTIVE STATISTICS FOR LEADERSHIP STYLES AND PERFORMANCE ................ 183
APPENDIX F: PARAMETER ESTIMATES AND POST HOC (TUKEY) ANALYSIS ................................... 187

1
CHAPTER 1
INTRODUCTION
1.01 Background of the Study
Every organization goes through a succession of changes for its development depending
upon different internal and external factors. It is the effective leadership that plays a central role
in all changes for the success of any organization. Hence, the role of leadership cannot be
ignored in the success or failure of any organization. It is the center of almost every activity in
the organization, i.e. defining the vision, making strategic decisions and implementing those
decisions. In this fast global and technological era, organizations are facing different adaptive
changes (Heifetz & Laurie, 1997) which are necessary to survive in the competitive market
(Kotter, 1995). According to Kotter (1995), change demands a new system “which in turn
demands leadership”.
Leadership has been a focus of studies for a long time in social science. But still it is
considered the most studied and least understood area (Humphreys, 2001). Leadership is
considered to be the art of attracting, refining, retaining and utilizing the human capital of any
organization in an effective way but there is no single agreed definition of leadership. Different
scholars and practitioners define leadership in different ways. According to Fielder (1967),
leadership is an interpersonal relationship in which power and influence is unevenly distributed
and one person directs and controls the behaviors of others. Northouse (2009) takes leadership as
a power relationship which exists between the leader and the followers. However, most of the
scholars and practitioners agree that employees' performance, commitment, and satisfaction in
any organization generally depends on the quality of its leadership (Ristow, Amos, & Staude,
1999). That’s why; leadership is usually considered as the ability to influence subordinates (their

2
behavior and attitude) and/or to transform the organization (Conger & Kanungo, 1987; House,
1976). In other words, in this competitive age, organizations are in need for such leaders who can
align the organization with competitive challenges and can motivate the workforce to exert extra
efforts to achieve organizational goals. According to Friedman (2005), it is a paradigm shift
which demands some new kind of leaders.
Leadership of any organization has direct as well as indirect impact on the performance
of the workforce in any organization (Gadot, 2007). However, leadership styles and its influence
on the performance of individuals and organizations differ in different situations and cultures.
According to Bhagat and Steers (2009) leadership is not the same thing across cultures. For last
few decades, a number of researches have been conducted and different models have been
developed to investigate the leadership styles in different organizations throughout the globe.
However, studies on the relationship between leaders’ self and others’ perceptions need further
and thorough investigation. This phenomenon is understudied even in North American and
European hemisphere, and if we talk about the developing countries, it is far-fetched from the
current extent of literature. There is a common agreement among researchers that leadership
style and power varies from culture to culture. According to Fatehi (1996), a good leader in one
culture may not be a good leader in other cultures. Cultural differences strongly influence
leadership styles, norms and traditions. Therefore, the theories and models of leadership need
cultural validation. Muczyk and Holt (2008) state that leadership styles and approaches should be
effectively aligned with culture because it affects the organizational performance (Willmott,
2000). The influence and effectiveness of leaders varies considerably based on the cultural forces
in which leaders perform.

3
1.02 Pakistani Context
Pakistan, officially The Islamic Republic of Pakistan, is situated in the Western part of
the Indian subcontinent. The name Pakistan is derived from two Urdu words Pak (pure) and Stan
(country). Pakistan is the sixth most populous country in the world with more than 190 million
people. The current territory of Pakistan had been the center of several ancient cultures and
undergone many invasions. It has been ruled by different empires and dynasties which caused
the promotion of different cultures. All these people left their influence on the cultural traditions
of Pakistan. Pakistan is a culturally diverse country. There are many differences among different
Figure 1: Map of Pakistan

4
ethnic groups in different aspects, i.e. dress, food, religion, language and traditions. There are
more than 26 languages spoken in Pakistan. However, Urdu and English are national and official
languages respectively. Pakistan consists of the following four provinces, one federal capital
territory, two autonomous territories and a group of federally administered tribal areas.i
Punjab is the most populous province of Pakistan and consists of approximately 60% of
the total country’s population. In addition, it is the most prosperous province of Pakistan. The
city of Lahore is the capital of this province. The other main cities of Punjab are Multan,
Faisalabad, and Rawalpindi. The word Punjab is the combination of two Persian words panj
(five) and ab (water). That’s why; it is also called the land of five rivers. Although, there are
many languages and sub-cultures within Punjab yet Punjabi and Saraiki are the main languages
with particular sub-cultures. Due to its main role in the country’s economy and large population,
Punjab has significant importance in national affairs. It consists of 36 districts.
The province of Sindh and the people live in this region are designated after the river’s
name Sindh. It was called Sindhu River prior to the creation of Pakistan and now it is known as
the Sindh (Indus) river. The province of Sindh is also called Mehran and Bab-ul-Islam (the gate
of Islam). Sindh is located on the western corner of South Asia and is the third largest province
of Pakistan (geographically). Sind has been the center of many old civilizations like the Indus
Valley Civilization (around 3000 BCE).ii Sindh is the second largest economy in Pakistan.
Karachi is the capital city of Sindh Province and the economic hub of Pakistan. The main
languages of Sind province are Sindhi and Saraiki. It consists of 23 districts.
Khyber Pakhtunkhwa, formally known as North-West Frontier Province, located in the
North West of the country. There are many ethnic groups in this province. However, the Pashtun
people are the main ethnic group. Pashto and Urdu are the main languages spoken in Khyber

5
Pakhtunkhwa. Peshawar is the capital of this province. The population of Khyber Pakhtunkhwa
is almost 23 million and almost all the population is Muslim. Khyber Pakhtunkhwa shares its
border with Afghanistan and has been suffering from many decades. Irrespective of the large
number of refugees in province, it is the third largest economy of Pakistan. It has 25 districts
including five provincially administered tribal areas. Some of the districts of Khyber
Pakhtunkhwa are famous for their natural beauty and attracts thousands of tourists from all over
the world every year.
Baluchistan is situated in the south-west of Pakistan and is the largest province of
Pakistan by the area and covers 44% of Pakistan’s total area. It also shares its border with
Afghanistan. Baluchistan has significant importance for its strategic location. Baluchistan is
situated at the Strait of Hormuz and is the shortest route from seaports to Central Asia. Quetta is
the capital of Baluchistan province. The economy of Baluchistan is based on natural gas, coal
and other minerals. The population of Baluchistan is very low due to scarcity of water. Balochi,
Pashto and Brahui are the main languages spoken in Baluchistan. It consists of 30 districts.
Islamabad is the capital of Pakistan. It is the ninth largest city of Pakistan. The population
of Islamabad is almost 1.25 million. The city of Islamabad was built in 1960 to replace the
Karachi as the capital of Pakistan. Islamabad, as the capital of Pakistan, is home to many
migrants from other regions of Pakistan. That’s why; it has a cultural diversity. Islamabad has
the representation of almost all cultures, languages and regions of Pakistan. However, the results
of pilot study showed that the banking sector of Pakistan is not influenced by the sub-cultures in
the country (Asrarulhaq, 2012). Further, no significant difference was found between the
perceptions of managers and subordinates about leadership styles and performance across
regions. Therefore, it is assumed that the banking sector across the country represents same

6
cultural values and norms. In other words, the banking sector of Pakistan is influenced by same
(national) culture across the country. Based on the Hofstede (1980, 2001) dimensions of culture,
Pakistan has been characterized as collectivist and moderate masculine nation with high
uncertainty avoidance and high power distance (Hofstede, 1991; Budhwar & Debrah, 2001). The
following is a brief overview of Pakistani culture. The score for each cultural dimension is taken
from The Hofstede Centeriii.
Pakistan is a hierarchical society with 55 score on the power distance dimension. It
means that Pakistanis have respect for authority. Everybody has a particular position and needs
no further justification. Power distance has a significant role in the perception and practice of
effective leadership styles. In high power distance societies, centralization is popular and
subordinates expect to be told what to do. The organizations are flat structured and the
benevolent autocrat leaders are considered effective leaders. The role of middle management is
not significant.
Pakistan is a collectivist country with the score of 14 on the individualism dimension of
Hofstede. People are emotional, like to be part of unified groups and have strong relationships
with others (fellow members). In collectivist societies, the relationship between leader and
subordinates is based on emotional and personal attachment rather just professional interaction.
The relationship between employer and employee is perceived in moral terms. Therefore, the
perception of effective leadership style in collectivist society may be different from other
societies. Further, Pakistani society is inclined towards moderate masculinity and has 50 score on
the Hofstede masculinity index. It illustrates that Pakistanis are more aggressive, competitive and
ambitious. Organizations, in such societies, have distinct roles for men and women. The
difference of gender has different preferences for leadership behaviors.

7
Pakistan scores 70 on the uncertainty avoidance dimension. It reflects that Pakistani
society has a high preference for avoiding uncertainty. The people in such countries have firm
belief and behavior. The people with such beliefs and nature are less risk taking and have
different perceptions of effective leadership styles.
Transformational and Transactional leadership styles are considered western leadership
styles and may have different preferences for effective leadership styles in other countries
(Northouse, 2009). Based on the above cultural profile of Pakistan, the present study examined
the perceptions and preferences of managers and subordinates about managers’ leadership styles
and performance in the banking sector of Pakistan. It is assumed that the high rated cultural
dimensions (power distance, masculinity and uncertainty avoidance) in Pakistan did not have
significant impact on the results and is aligned with the findings of available literature.
1.03 Banking Sector of Pakistan
Pakistan is a developing country with a blend of different sectors which play a significant
role in its economy like textile, agriculture, and sports goods manufacturing. However, the
importance of the financial sector cannot be ignored in any way. The banking sector, as part of
the financial sector, facilitates economic activities and plays an important role in the progress of
the country.
If we look at the past, the performance of the banking sector in Pakistan was very
lethargic. It has been facing different problems like lack of efficiency, the high intermediate cost
of funds, Government unnecessary involvement, over staffing, and mismanagement of funds.
Even some banks or branches of certain banks were opened by the authorities against the
national interests. The Mehran bank scandal (currently in the court) is one of such examples.

8
However, in the early 1990s, the State Bank of Pakistan initiated some reforms for the financial
sector, i.e. reforms to strengthen the governance and supervision of banks and reforms to reduce
segmentation in the government debt market to the privatization of banks (Husain, 2005)iv.
Since privatization and technological reforms in banking, the banking sector of Pakistan
has become a competitive and productive sector. It has a great role in the economy due to high
growth rate and providing more employment opportunities. According to Rahim (2010), the
banking sector of Pakistan is progressing at the rate of 23% per year since 2005. It has been
considered a highly growing sector and a sector at its boom (State Bank of Pakistan, 2010).
Though employment opportunities in banks are highly paid yet the level of satisfaction among
the employees is low. It is evident from the researches that the banking sector has numerous
problems which cause stress, dissatisfaction, health issues and high turnover in banking industry.
Although, there are different reasons for such problems yet the supervisors’ behavior is
considered one of the common root causes. Based on available literature, it may be inferred that
congruence between leadership styles and followers’ needs is the key to success for any
organization. In this regard, it was necessary for the leadership to know about the needs of their
followers and what they think about their leaders. The present study examined the congruence of
self and subordinates’ perceptions about leadership styles and performance in the banking sector
of Pakistan using the full range leadership model of Bass and Avolio (2011). The full range
leadership model has been studied in abundant organizational settings and is considered one of
the most effective models to measure effective leadership skills in different organizations.
However, there was a gap in the literature about leadership in Pakistan and studies on the
relationship between self and others’ perceptions do not exist. All the available literature on
leadership in Pakistani settings was from one particular perspective. There was need to study the

9
leadership from self and others’ perspectives in Pakistani settings. Therefore, this study is the
first effort to examine the congruence between self and others’ perceptions about leadership
styles and performance in a developing country like Pakistan. Moreover, the present study is a
valuable addition in existing literature on leadership generally and congruence between self and
others’ perceptions about leadership style and performance especially.
1.04 Problem Statement
Banking sector of Pakistan is a fast growing business sector in Pakistan. According to
World Bank study report, the Pakistani banking sector has been ranked second among the South
Asian countries for its performance (Rehman & Raoof, 2010). The competition in the banking
sector is increasing day by day. Today, the high pressure on the economy of Pakistan and
changing monetary policies has increased the importance and challenges of this sector. In
addition, the long work hours, stress, employees’ lack of commitment, job dissatisfaction and
high turnover in banks have intensified the need for effective leadership. The banking sector in
Pakistan is part of the global standard corporate systems. Therefore, it can safely be assumed that
results generated from this study may help to understand the same phenomenon in other contexts
too.
In order to maintain the growth and achieve higher objectives, the top management in the
banks needs to understand the problems and make strategies to satisfy, retain, and motivate
employees to exert extra efforts. It needs such leadership in its branches that can achieve
organizational goals efficiently and effectively. Leaders should have the ability to motivate its
employees to exert extra efforts to achieve higher goals. Moreover, the existing leadership team
(managers) should adopt such leadership styles that help to augment subordinates’ satisfaction,
10
their efforts and performance. According to the Full Range of Leadership (FRL) model by Bass
and Avolio (1994), the most effective leadership styles are transformational and transactional
leadership styles, if adopted collectively, to motivate subordinates, influence their behaviors and
attitudes and improve their performance. Although FRL model has been validated in numerous
settings to measure the impact of both transformational and transactional leadership styles, yet
the researchers are unable to reach some final conclusion that what types of leadership styles
should be used in which settings. It might be due to the difference of culture (organizational as
well as national). Leadership is not the same thing across cultures (Bhagat & Steers, 2009) and
leadership styles may be perceived differently in different settings. Therefore, there is an acute
need of study that helps the leadership to know about their leadership styles and performance in
different cultures through the perceptions of their followers and help them change their
leadership styles according to the need to achieve higher goals.
1.05 Purpose of the Study
The purpose of this study is to determine which leadership styles among
transformational, transactional and laissez-faire dominantly exist, and which style is perceived as
most effective in the banking sector of Pakistan. In addition, the present study examined the
congruence between self and subordinates’ perceptions about the impact of managers’ leadership
styles (transformational, transactional and laissez-faire) and their effectiveness, subordinates’
satisfaction with their leaders, willingness to exert extra effort and organizational commitment.
To achieve objectives of the study, the well-established Multifactor Leadership Questionnaire
(MLQ) 5X short by Bass and Avoliov and the shortened version of Organizational Commitment
Questionnaire (OCQ) by Meyer and Allen (1997) is used to collect data for this study.

11
1.06 Research Hypotheses
The main purpose of this study is to examine the congruence between managers’ (self)
and subordinates’ perceptions about leadership styles and performance. Additionally, the
relationship between leadership styles (transformational, transactional, and laissez-faire) and
performance outcomes (effectiveness, extra effort, satisfaction, affective commitment,
continuance commitment, and normative commitment) as perceived by managers and
subordinates is also explained. Based on the Bass and Avolio (2011) Full Range of Leadership
(FRL) model and existing literature on transformational, transactional and laissez-faire
leadership styles and performance outcomes, the following hypotheses are established:
H1: There is a significant difference between self and subordinates’ perceptions about leadership
styles of managers in the banking sector of Pakistan.
H1a: There is a significant difference between self and subordinates’ perceptions about
transformational leadership style of managers in the banking sector of Pakistan.
H1b: There is a significant difference between self and subordinates’ perceptions about
transactional leadership style of managers in the banking sector of Pakistan.
H1c: There is a significant difference between self and subordinates’ perceptions about
laissez-faire leadership style of managers in the banking sector of Pakistan.
H2: There is a significant relationship between managers’ self-perceived leadership styles
(transformational, transactional and laissez-faire) and subordinates’ perceived outcomes in the
banking sector of Pakistan.
H2a: There is a significant relationship between managers’ self-perceived leadership
styles and effectiveness with their leaders in the banking sector of Pakistan.

12
H2b: There is a significant relationship between managers’ self-perceived leadership
styles and subordinates’ exert to extra effort in the banking sector of Pakistan.
H2c: There is a significant relationship between managers’ self-perceived leadership
styles and subordinates’ satisfaction with their leaders in the banking sector of Pakistan.
H2d: There is a significant relationship between managers’ self-perceived leadership
styles and subordinates’ affective commitment in the banking sector of Pakistan.
H2e: There is a significant relationship between managers’ self-perceived leadership
styles and subordinates’ continuance commitment in the banking sector of Pakistan.
H2f: There is a significant relationship between managers’ self-perceived leadership
styles and subordinates’ normative commitment in the banking sector of Pakistan.
H3: There is a significant relationship between managers’ transformational, transactional and
laissez-faire leadership styles (as perceived by subordinates) and their performance outcomes in
the banking sector of Pakistan.
H3a: There is a significant relationship between managers’ leadership styles (as
perceived by subordinates) and subordinates’ perceived effectiveness with their leaders in
the banking sector of Pakistan.
H3b: There is a significant relationship between managers’ leadership styles (as
perceived by subordinates) and subordinates’ exert to extra effort in the banking sector of
Pakistan.
H3c: There is a significant relationship between managers’ leadership styles (as
perceived by subordinates) and subordinates’ perceived satisfaction with their leaders in
the banking sector of Pakistan.

13
H3d: There is a significant relationship between managers’ leadership styles (as
perceived by subordinates) and subordinates’ affective commitment in the banking sector
of Pakistan.
H3e: There is a significant relationship between managers’ leadership styles (as
perceived by subordinates) and subordinates’ continuance commitment in the banking
sector of Pakistan.
H3f: There is a significant relationship between managers’ leadership styles (as perceived
by subordinates) and subordinates’ normative commitment in the banking sector of
Pakistan.
H4: There is a significant difference between self and subordinates’ perceptions about the
relationship of managers’ leadership styles (transformational, transactional and laissez-faire) and
performance outcomes as it relates to subordinate-manager interaction in the banking sector of
Pakistan.
H4a: There is a significant difference between self and subordinates’ perceptions about
the impact of managers’ leadership style on effectiveness outcome in the banking sector
of Pakistan.
H4b: There is a significant difference between self and subordinates’ perceptions about
the impact of managers’ leadership style on subordinates’ extra effort in the banking
sector of Pakistan.
H4c: There is a significant difference between self and subordinates’ perceptions about
the impact of managers’ leadership style on subordinates’ satisfaction with their
managers in the banking sector of Pakistan.

14
H4d: There is a significant difference between self and subordinates’ perceptions about
the impact of managers’ leadership style on subordinates’ affective commitment in the
banking sector of Pakistan.
H4e: There is a significant difference between self and subordinates’ perceptions about
the impact of managers’ leadership style on subordinates’ continuance commitment in the
banking sector of Pakistan.
H4f: There is a significant difference between self and subordinates’ perceptions about
the impact of managers’ leadership style on subordinates’ normative commitment in the
banking sector of Pakistan.
1.07 Significance of the Study
Leadership studies have significant importance in HRD theory and practice literature.
This study is a significant addition in the existing literature on leadership practices.
Further, the congruence between self and others’ perceptions about leadership styles and
performance from developing country perspectives is a valuable addition in existing
literature on leadership generally and congruence between self and others about
leadership styles and performance especially.
It may help the banking sector of Pakistan to understand perceived leadership styles and
the readiness of subordinates to make extra efforts.
It may help the leadership to think and make necessary changes in their behavior
according to the needs of their followers.
It may help the supervisors to understand their subordinates’ needs and how much
satisfied subordinates are with them.

15
It may help the top management to make necessary interventions to improve
organizational performance in achieving higher goals.
It may open the door for further researches on the same ground in different organizations
and sectors throughout the globe.
1.08 Conceptual/Theoretical Framework
Transformational leadership is one of the important means to organizational change and
effectiveness (Bass & Avolio, 1994; Avolio, 2011). Downton (1973) came up with the
distinction between transformational and transactional leadership styles by explaining leaders as
revolutionary, rebellion and reformer, and many scholars were agreed on the difference between
transformational and transactional leadership styles (Burns, 1978; Stogdill & Bass, 1981).
However, Bass (19985) concluded his study with the concept of the relationship between
transformational and transactional leadership and proposed that transformational leadership
boosts transactional leadership to predict its impacts on followers’ outcomes.
In order to better understand the impact of leadership styles on subordinates’ attitudes,
Bass and Avolio (1994) developed a leadership model called the Full Range Leadership (FRL)
model. This model proposes that leaders use multiple behaviors to influence their followers. This
model is based on the theory of transformational and transactional leadership. The focus of this
study is to examine the degree of agreement between self and subordinates' perceptions about
existing leadership styles and leaders' performance in the banking sector of Pakistan based on the
full range leadership model. Although the full range leadership model has been studied in
Pakistani banking industry to establish the relationship between leadership styles and followers'
outcomes, yet no literature is found on the agreement between self and subordinates' perceptions.

16
The present study is the first effort in this aspect to come up with the self and subordinates'
agreement of perceptions about leadership styles and performance. Further, it may be helpful at
individual and organizational levels to understand and solve potential issues and improve an
individual and organizational performance. In order to better understand the congruence between
managers and subordinates, the main theoretical framework (Figure 5) is established after three
sub frameworks/levels in the study.
Level 1:
This level is about the comparative analysis of managers’ self-perceived leadership styles
and subordinates’ perceptions about their leadership styles. Leadership styles are ranked on
Likert scale (from ‘frequently = 5’ to ‘not at all = 1’) by managers and subordinates based on
Figure 2: Comparison of Managers’ and Subordinates’ Perceptions about Managers’ Leadership
Styles

17
their perceptions of how often a particular behavior is practiced by managers in respective bank.
The leadership styles of managers are assessed on the basis of MLQ leadership styles and
dimensions. The MLQ consisted of three leadership styles: transformational, transactional, and
laissez-faire.
Level 2
This level is about the impact of managers’ self-perceived leadership styles on
subordinates’ outcomes. The relationship of three independent variables (transformational
leadership, transactional leadership, and laissez-faire leadership) with six outcome variables
(managers’ effectiveness, extra effort, satisfaction, affective commitment, continuance
commitment and normative commitment) is examined. In addition, the impact of all leadership
styles on all six outcomes at dimension level is also examined.
Figure 3: Relationship between Managers’ Self-perceived Leadership Styles and Subordinates’
Outcomes

18
Level 3
This section is about the relationship of managers’ leadership styles (as perceived by
subordinates) with their outcomes. The relationship of three main independent variables
(transformational leadership, transactional leadership, and laissez-faire leadership) with six
outcome variables (leader effectiveness, extra effort, satisfaction, affective commitment,
continuance commitment and normative commitment) is examined. In addition, the impact of all
leadership styles on all six outcomes at dimension level is also examined.
Figure 4: Relationship between Managers’ Leadership Styles (as Perceived by Subordinates) and
Outcomes

19
Level 4
The purpose of this main framework is to determine the level of congruence between
managers’ (self) and their subordinates’ perceptions about the relationship between leadership
styles and outcomes. In this perspective, three leadership styles (transformational, transactional,
and laissez-faire) and six leadership outcomes (effectiveness, extra effort, satisfaction, affective
commitment, continuance commitment and normative commitment) are studied in the banking
sector of Pakistan.
1.09 Assumptions of the Study
The population consists of different demographics with different languages, traditions
and cultures. The data is collected from all accessed areas and it is assumed that data
represents the whole banking sector of Pakistan.
Figure 5: Congruence between Managers’ (self) and Subordinates’ Perceptions about Leadership
Styles and Performance

20
It is further assumed that respondents filled out questionnaires with the best of their
knowledge.
It is assumed that all the respondents had enough knowledge of English language and
fully understood the questions given in the questionnaire.
1.10 Limitations of the Study
The questionnaire was based on the perception of employees and different employees can
perceive the same leadership style differently.
There may be some personal biasness in the leader and subordinate relationship which
may affect the accuracy of the data.
There are many factors that can impact subordinates’ performance. However, this study
examined role of only leadership which may be limited.
There might be some self-representation or social desirability bias in managers’ data
which might have affected the accuracy of results.
The sample of the study was not random and did not represent the banking sector of the
whole country. Therefore, the results of the study might not represent the overall banking
sector of Pakistan.
1.11 Definition of Terms
The following definitions for different terms are followed throughout this research:
Affective commitment
Affective commitment means the emotional attachment and involvement of an employee
with the organization (Meyer & Allen, 1991).

21
Contingent reward (CR)
It refers to the behavior in which the leader elucidates the expectations of the followers
and provides them rewards to meet the organization’s expectations (Avolio & Bass, 2004).
Continuance commitment
Continuance commitment refers to an awareness of the cost(s) associated with leaving the
organization (Meyer & Allen, 1991).
Culture
Culture is the collective programming of the mind, which distinguishes the members of
one human group from another (Hofstede, 2001).
Extra effort
The willingness of followers to do more than they are expected, try harder, and desire to
succeed as a result the leader’s behaviors (Bass & Avolio, 2004).
Idealized influence (attributed) (IA)
Idealized influence refers to the behavior in which subordinates trust, respect, and hold
confidence in their leader.
Idealized influence (behavioral) (IB)
It is the behavior in which the leader presents him or her as a role model of high
standards of ethical and moral conduct for their followers.
Immediate subordinates
All officers who report directly to and are under the direct control of branch managers
(regardless of their ranks) are considered immediate subordinates.

22
Individual consideration (IC)
It refers to the behavior in which the leader recognizes the differences among followers
and treats them on the individual basis according to their needs and abilities.
Inspirational motivation (IM)
It refers to the behavior in which the leader stimulates and motivates the followers by
providing them the meaning and the context of the work.
Intellectual stimulation (IS)
It is the behavior in which the leader motivates the efforts of followers to and encourages
them to carry on innovative and creative thinking about the tasks at hand.
Laissez-faire (LF)
It refers to the absence of leadership behavior. In other words, it is considered non-
leadership.
Leader effectiveness
Leader’s effectiveness refers to the capability of meeting the job-related needs of
followers, representing their needs at the higher level, overall group effectiveness, and to
contribute in organizational performance (Bass & Avolio, 2004).
Leadership
Leadership is the ability to influence the attitudes, abilities, and beliefs of people to
achieve goals.
Management-by-exception (active) (MBEA)
It refers to the leadership behavior in which the leader makes standards and then monitors
the mistakes, errors, and deviances of followers based on established standards and takes quick
action when necessary (Bass & Avolio, 2004).

23
Management-by-exception (passive) (MBEP)
It refers to the leadership behavior in which the leader waits until the mistakes occur and
then takes actions to correct the mistakes (Bass & Avolio, 2004).
Multifactor leadership questionnaire (MLQ)
MLQ is a survey questionnaire to determine the leadership styles or behaviors and
leadership outcomes that are recognized in the FRL Model (Bass & Avolio, 2004).
Normative commitment
Normative commitment refers to the perceived obligation to remain with the organization
(Meyer & Allen, 1991).
Organizational commitment
Organizational commitment is the psychological attachment to the organization that
creates a sense of belongingness for the organization and helps to improve productivity.
Passive/Avoidant leadership
It refers to the passive and reactive forms of leadership behaviors (Bass & Avolio, 2004).
Satisfaction
It means to work with others in a satisfying way and fulfilling their needs or expectations
(Bass & Avolio, 2004).
Transactional leadership
It refers to the exchange of reward or punishment for a significant effort. In FRL Model,
it includes contingent reward and management-by-exception (active) (Bass & Avolio, 2004).
Transformational leadership
It refers to the leadership style in which the leader inspires and motivates his/her
followers through a compelling vision, develops innovative approaches to solve problems,

24
promotes individualized support, and, empowers them to accomplish new tasks. (Bass & Avolio,
2004).

25
CHAPTER 2
LITERATURE REVIEW
This chapter reviews different research areas that are relevant to this study. The first
section is a review of the literature on the concept of leadership and different leadership theories.
The second section provides a review of empirical studies in transformational and transactional
leadership and explains the full range leadership model on which the current study is based. The
third section is about the self and other agreement in leadership studies and provides its
significance through different empirical studies. The last section provides a review of different
empirical studies done in the context of the Pakistani banking sector.
2.01 Evolution and Traditional Theories of Leadership
The concept of leadership is as old as the history of people who tried to make groups and
manage individuals for accomplishment of certain tasks. Leadership has been the focus of many
studies for decades and scholars talked about the nature of leadership from different aspects
(Antonakis, Cianciolo, & Stemberg, 2004; Bass, 1990; Conger & Riggio, 2007, Northouse 2007,
Northouse 2009). According to Humphreys (2001), leadership is the most studied and least
understood topic in the social sciences. However, after decades of extensive researches on
leadership, there are more than hundred definitions of leadership (Northouse, 2009) and there is a
little consensus on definition, assessment and its associated outcomes (Birnbaum, 1989). There
are a number of widely agreed concepts which are necessary to understand the accurate concept
of leadership, but many aspects of leadership are still answerless (Yukl, 2001) and need to be
answered. According to Fleishman et al. (1991), more than sixty-five systems are designed to
define and categorize the concept of leadership. According to Northouse (2007), leadership has

26
been defined and studied from different perspectives like trait, ability, skill, behavior and
relationship. On the basis of these perspectives, different leadership theories were developed to
address different organizational problems, and to predict proposed situations in response to
different behaviors (Bass & Avolio, 1993; Hoy & Miskel, 2008).
2.02 Trait Theory
The trait theory of leadership, known as “Great Man theory’, was one of the first
systematic efforts to study the concept of leadership in the early 20th century (Northouse, 2004 &
2007). The idea behind trait theory was that the leaders have some innate qualities or personal
characteristics which distinguish them from other people. These qualities may be social or
political. According to Northouse (2007), some leaders from history like Mohandas Gandhi,
Abraham Lincoln, Napoleon, and Hitler were studied and it was noticed that such leaders were
effective due to some unique and innate leadership qualities. Therefore, different studies were
carried out to find out those attributes and personal characteristics that distinguish them from
others.
Stogdill (1974) conducted different studies between 1920 and 1975 and came up with the
findings of some traits of effective leadership. In 1949, he proposed intelligence, alertness,
insight, responsibility, initiative, persistence, self-confidence, and sociability as the unique traits
of effective leadership. In1974, he identified the responsibility and task completion and added in
the earlier list of leaders’ traits. In addition, he emphasized on the importance of situational
factors for the success of any leader.
Mann (1959) studied leadership traits in small settings and came up with more than five
hundred different measures of personality. He combined the most common measures in seven

27
main characteristics that included intelligence, adjustment, extroversion-introversion,
dominance, masculinity-femininity, conservatism, and interpersonal sensitivity. When he
compared these characteristics in relation to leadership, he found a highly significant relationship
between leadership and intelligence, adjustment, extroversion measures and most of the times,
positive relationship with dominance, masculinity, and interpersonal sensitivity. Further, he
acknowledged the importance of situational elements too. However, Mann (1959) and Stogdill
(1974) agreed that traits for effective leadership vary from situation to situation and sometime
acts in combination.
Fieldler (1967) also agreed that effective leaders cannot be predicted on the basis of only
traits for every situation. However, Lord et al. (1986) considers that conclusions of Stogdill and
Mann were based on flawed studies in a variety of ways and therefore created wrong
conclusions. He is of the view that their results were overgeneralized and negatively interpreted.
Kilpatrick and Locke (1991) talked about six characteristics of effective leadership: motivation,
honesty and integrity, self-confidence, cognitive ability, and knowledge of the business. Kouzes
and Posner (2003) came up with four key leadership traits: honesty, forward-looking, inspiring,
and competency.
According to Pierce and Newstorm (2006), although many researchers came up with
individual traits of effective leadership yet no one was able to predict the leadership success and
failed to identify precise traits that predict leadership success.
2.03 Behavioral Theories of Leadership
The trait theories concentrates on the leaders’ certain personality characteristics whereas
the behavioral theories focuses on the behaviors of the leaders. For instance, what leaders do and
28
how leaders act (Northouse, 2004). According to Northouse (2007), the behavioral theories
include two types of behaviors: task behaviors and relationship behaviors. The task behaviors are
related to the task accomplishment whereas the relationship behaviors motivate the followers to
carry on their efforts. In this regard, Ohio and Michigan studies are considered significant
contributions in the development of behavioral theories.
The first contribution was from Ohio State University researchers (Stogdill, Coons,
Halpin, Winer, & Fleishman) who came up with some influential theories of leadership that
remained popular from 1950s to 1960s (Gill, 2006). They worked on leadership behaviors in
military (Stogdill & Coons, 1957) and found that leadership styles are practiced in different
ways. Most of the time, they influence their followers by initiating structure and consideration.
In initiating structure, the leaders organize work, define the tasks and schedule the work
activities for their followers. In consideration, they develop an atmosphere of respect and trust
with the followers. The effective leaders use both initiating structure and consideration at the
same time at different degrees (Stogdill & Coons, 1957).
The second major contribution in behavioral theories development is from the University
of Michigan studies (researchers include Katz & Kahn). They identified ‘concern for task’
(product oriented) and ‘concern for people’ (employee oriented) behaviors as common
leadership behaviors (Blake & Mouton, 1994; Likert, 1967; Gill, 2006). This model of leadership
behaviors was called the managerial grid (Blake & Mouton, 1994) and then renamed as
leadership grid. The production oriented behavior focuses on the technical aspects of task
accomplishments. The employee oriented behavior focuses on followers to take them as human
beings, to value their individuality, and to pay particular attention to their needs. Likert (1967)
classified leadership styles into four categories: exploitative autocratic, benevolent autocratic,

29
consultative and democratic. Tannenbaum and Schmidt (1973) classified the leadership styles in
similar ways: autocratic, persuasive, consultative and democratic (Gill, 2006).
2.04 Leader Member-Exchange Model
Leader-member exchange (LMX) theory explains the effectiveness of leaders as the
result of psychodynamic exchange between leaders and followers (Gill, 2006). It focuses on the
characteristics of the leaders, followers and the relationship between leaders and followers. The
LMX theory emphasizes that the relationship between every pair of leader and follower vary
with the other pair and different followers may have a different description or relationship with
the same leader (Gill, 2006; Graen et al., 1977). The underlying idea behind the psychodynamic
theory is that the nature of the relationship between leaders and followers is based on the self and
others’ perceptions or understanding (Gill, 2006). Thus, the LMX theory provides a baseline for
current study which aims to find out the congruence between self and others’ perceptions about
leadership performance and styles.
According to leader-member exchange (LMX) theory, leadership is a process that
motivates followers or subordinates to exert extra efforts (Dunnette et al., 1990). Moreover, the
relationship between leaders and followers has a significant relation with followers’ degree of
job satisfaction, job performance, and organizational commitment. (Martin et al., 2005). Further,
the level of interaction between leaders and followers also matters (Kaplan & Norton, 2001).
According to Krishnan (2004), when the quality of exchange between leader and follower
increases, progress also begins to increase. However, it depends on the degree of exchange, the
nature of exchange and the nature of tasks as well.
30
2.05 Contingency Theories of Leadership
Contingency theories propose that there is no best leadership style. Effective and
successful leaders use different leadership styles based on the situation and followers. According
to Goldsmith (2003), effective leadership is to the best fit between the behavior, context and the
need. In order to fully understand the effectiveness and the performance of leaders, it is
necessary to understand the situation in which they lead. In contingency theories, the relationship
between two variables is measured. These two variables may be leadership styles and some
situational variables.
2.06 Fiedler’s Contingency Theory
Fred Fiedler is considered the pioneer of contingency theories. His contingency theory
suggests that the effectiveness of leadership styles depends upon the suitability of the situation in
terms of three parameters. Fiedler (1967) developed the Least Preferred Coworker scale to
determine the effectiveness of leadership styles. This scale suggests that a situation is highly
favorable and fit when the job is clearly defined, the leader has authority or power, and, a healthy
relationship exists between leaders and the followers (Fiedler, 1967; Gill, 2006).
2.07 Path-Goal Theory
Path-goal leadership theory is based on the Fiedler’s contingency theory, and adds
employee motivation as a choice in leadership styles. However, it is not appropriate in those
situations where goals are not consistent. It can be called an ‘expectancy model’ of work
motivation (Evans, 1970; House & Mitchel, 1974; Gill, 2006).

31
Path-goal leadership theory was developed by the House (1971) and later improved by
House and Mitchell (1974). This theory states that the main role of leader is to help subordinates
to solve their problems to achieve goals. Effective leaders always motivate their followers to
understand their tasks and reach goals. However, different subordinates are motivated through
different factors according to their needs and preferences like need affiliation, preference for
structure, desire for control, or self-efficacy. On the other hand, if the tasks are ambiguous and
unstructured, the followers will be less satisfied and less motivated (House & Mitchell, 1974).
2.08 Transformational and Transactional Leadership
Downton (1973) is believed to be the first person who used the terms transformational
and transactional leadership and Burns (1978) was the first person who distinguished leadership
styles based on followers’ motivation as either transformational or transactional. He came up
with the idea that leaders perform two different sets of behaviors to influence their followers:
transformational leadership and transactional leadership. He defined transformational leadership
as a process of motivating followers by focusing on their values to impact on their performance
and envisioning a clear future for them. On the other hand, transactional leadership is a process
of social exchange to have an impact on the performance of employees towards established
goals. However, he viewed transformational and transactional leadership as mutually exclusive.
Based on the Burns work, Bass (1985) reviewed and extended his concept and proposed
transformational leadership theory. According to Bass, transformational leadership is exclusively
about the leaders and their behaviors. He focused on the followers and came up with a
conclusion that transformational and transactional leadership styles are not mutually exclusive
but interdependent or interrelated (Northouse, 2004). Transformational theory suggests that most

32
of the leaders have the characteristics of both the transformational and transactional leadership
styles and the former augments the later. The effective leaders use both leadership styles at
various situations based on the task and the followers.
According to Burns (1978), the transactional leaders focus on the followers’ self-interest
through exchanging different things to motivate them. These exchanges may be of different
natures like salary or bonus in exchange for some task accomplishment. In short, a transactional
leader controls his followers through different types of rewards. Moreover, the transactional
leaders work within systems, try to avoid risks and try to achieve the goals on already set
parameters (Bass, 1985). In most of the situations, transactional leadership is preferred when the
objectives are short term. It does not support well in terms of long term objectives, especially
when organizations go through some big changes. Contrary, the transformational leadership
focuses on long term strategies and transformational leaders motivate their followers by
convincing them that organizational goals are much important than their personal goals and
organizational goals are actually in their own benefits. In this situation, transformational
leadership fits to motivate the followers to exert more efforts than they are actually required.
Further, they facilitate development and change.
In this technological and competitive era, organizations prefer transformational leaders to
motivate and help their workforce to achieve higher goals. They make them aware and able to
accomplish beyond their expectations and perceived capabilities (Palestini, 2009). The
improvement in followers’ performance is the main emphasis of transformational leadership
theory (Avolio, 2011).

33
2.09 The Full Range of Leadership (FRL) Model
In order to better understand the process of leadership effectiveness, Bass and Avolio
(1994) developed a leadership model called the Full Range Leadership (FRL) model. This model
proposes that leaders use multiple behaviors to influence their followers. This model is based on
the theory of transformational and transactional leadership and incorporates both
transformational and transactional leadership behaviors. The Full Range Leadership model
includes three leadership styles: transformational, transactional and passive/avoidant leadership.
There are nine variables in the model that are represented by these three styles.
Transformational leadership.
The transformational style of leadership encourages and motivates the followers through
a leader’s persuasive vision, developing and promoting creativity, and empowering and sharing
responsibility with the followers to achieve high aims (Avolio, 2011). The transformational
leadership style includes five behaviors: idealized influence (attributed), idealized influence
(behavioral), inspirational motivation, intellectual stimulation, and individual consideration.
Idealized influence (attributed).
It refers to the charismatic aspect of transformational leadership in which the leaders
behave in a way that the followers emulate it with their own behaviors to develop respect, trust,
and hold confidence. The power and confidence of the leaders make them ideal for the followers
and motivate the followers to go beyond the expectations for the success of group or
organization. Avolio (2011) considered the following essentials to represent idealized attributes:
to instill pride in others, to go beyond self-interest, to build trust and respect, and to show a sense
of command and confidence.
34
Idealized influence (behavioral).
Idealized influence is the characteristic of those charismatic leaders who motivate their
followers and encourage creativity (Shin & Zhou, 2003). The leaders of this type of quality bring
changes in the behavior of people (Brown & Posner, 2001). The best example of such leaders is
those politicians and activists who invoke the people for nonviolent changes and bring
revolutions. The essentials for the leaders to develop idealized behaviors are to emphasize the
idea of collective aim and operation, and to show moral and ethical values through their own
behaviors (Avolio, 2011).
Inspirational motivation.
Inspirational motivation means that the leaders inspire their followers by creating an
atmosphere of collaboration. This inspirational motivation develops a sense of commitment in
the followers which ultimately supports in followers’ personal development and organizational
effectiveness (Alimo-Metcalfe & Alban-Metcalfe, 2004). The essentials for the leaders to
develop inspirational motivation are to tell the followers about positive opportunities, discuss the
tasks to accomplish, and, motivate them about new vision and a bright future (Avolio, 2011).
Moreover, the inspirational motivators with better understanding of organizations are very
effective to develop a team spirit in the followers (Anderson & Anderson, 2001). However,
leaders’ own vision plays an important role to inspire the followers, to articulate high
expectations, to develop high spirit and to motivate them towards the right direction (Avolio,
2011).
Intellectual stimulation.
Intellectual stimulation reflects the leader’s ability to stimulate followers by promoting
such environment where everyone has value and respect. As a result, the followers make extra

35
efforts for the success of group or organization. Avolio (2011) suggests that leaders appreciate
different ideas to resolve any issue and suggest different solutions for the same task to
intellectually stimulate their followers. Further, to intellectually stimulate the followers, the
leaders motivate the followers to look at every aspect from different perspectives and try to find
different ways to perform same tasks. It helps to develop innovation and creativity in the
followers.
Individualized consideration.
It is common believe that people who get individual attention from their supervisors,
understand their jobs clearly, work better and develop team relationships. During individual
consideration, leaders share their personal ideas and experiences to help followers in different
endeavors of life. In individual consideration, the leaders play role of a mentor, coach, counselor,
or advisor to provide one-on-one guidance (Zigarmi et al., 2005). However, Transactional
leaders influence their followers through authority and power of their position (Kest, 2006).
Contrary, the transformational leaders treat their followers as individuals and develop personal
relationship with them on an individual basis. They take care of individual needs, abilities and
concerns.
Transactional leadership.
The transactional leadership style is to exchange rewards or punishment for any positive
work performance or lack of satisfactory performance with the followers. Transactional
leadership is associated with three behaviors: contingent reward and management-by-exception
(active) and management-by-exception (passive).

36
Contingent reward.
The full-range leadership model is focused on Fiedler’s (1967) theory of contingency
reward. Fiedler (1962) developed a least preferred coworker scale (LPC) to check the leader’s
positive and negative characteristics. According to Northouse (2004), the leaders with a high
score on LPC are best in those situations which are moderately favorable and the leaders with
less score at LPC perform better at highly favorable or highly unfavorable situations. Contingent
reward is the process of any exchange between leaders and followers in response to followers’
exceptional efforts. It is a form of active management as it requires leader to continuously check
the performance of followers and reward them as required. In many situations, contingency
reward is an effective tool of leaders to control and direct the efforts of followers towards the
desired direction. However, contingent rewards work better if combined with transformational
leadership actions.
Management-by-exception (active).
Management-by-exception is to use negative feedback, criticism, or negative
reinforcement to discourage followers from involving in unsatisfactory performance (Avolio,
2011). Management-by-exception is of two types: management-by-exception (active) and
management-by-exception (passive). Management-by-exception (active) is used when the leader
keeps an eye on followers’ activities actively and takes action when they make any violation of
set standards or regulations. However, the followers are informed about the set standards,
conditions of poor performance and its possible consequences by their leaders in advance.
Management-by-exception (passive).
Management-by-exception (passive) is used when the followers are not monitored
actively by the leaders. The leaders take action only when set standards or established

37
regulations are violated (Northouse, 2004). The leaders with such characteristic do not interfere
until problems become serious. They wait until the things go wrong.
Laissez-faire leadership.
Laissez-faire means the absence of leadership (Northouse, 2004). It can be defined as the
most inactive and the most ineffective leadership (Avolio, 2011). It becomes evident when the
leaders avoid responsibility and do not care about what happening around them. They delay
different decisions, and do not make any effort to motivate and satisfy their followers’ needs.
According to Bass (1990), laissez-faire leadership is negatively correlated with followers’
efforts, attitude, and performance.
2.10 Self and Other Agreement in Leadership
Self and other agreement (SOA) means the degree of agreement or congruence level
between leaders’ self-rating and others’ rating about them i.e. subordinates, seniors or coworkers
(Atwater, Wang, Smither, & Fleenor, 2009). The information is collected through different
multisource instruments. However, the validity and reliability of the instrument is very important
in this regard and can be used to measure different outcomes related to leadership styles and
performance.
In leadership research, the individuals’ self-perception about their styles, skills, and
performance etc. are not considered accurate and reliable. It is evident from literature, that
individuals’ self-ratings are significantly different from others’ ratings about them. Moreover, it
is also agreed that only self-ratings about the leadership is challenging (Harris & Schaubroeck,
1988), and leadership performance and effectiveness should not be measured on single ratings

38
(Yammarino & Atwater, 1997). However, self-ratings may be used to interpret the level of self-
awareness (Dunnette, 1993).
The investigation of SOA in Leadership has been an area of great interest and importance
for both researchers and practitioners (Yammarino & Atwater, 1992). There are a number of
leadership outcomes which have been studied in relation to SOA i.e. job commitment, turnover,
satisfaction, performance and well-being.
2.11 Self-Other Rating Agreement Model
In the social sciences, only self-ratings is not considered as an effective and accurate
predictor of leadership outcomes due to the possibility of different bias and personal interest
involve in it. Some of the scholars take self-rating as an unreliable, inaccurate, invalid and
incomplete way of measuring or predicting any behavior or performance (Yammarino &
Atwater, 1993). It is only considered and linked with self-awareness about their personalities,
abilities and capabilities etc. (Mabe & West, 1982).
To better understand the self-other agreement, Yammarino and Atwater (1997) developed
a conceptual model called the self-perception accuracy model. This model was based on different
studies of self-other agreement at 360 scale. They argue that individual as well organizational
performance can be improved through the agreement among self and others’ perceptions at
different levels. It is because the self-perception usually lacks accuracy due to over-estimation or
under-estimation. Moreover, different other factors like experiences, personality traits,
contextual factors, and cognitive processes also affect self-perceptions that lead to inaccurate
self-ratings. On the other hand, the ratings on the basis of only others’ perceptions cannot be
ensured as accurate. The literature shows that there are many factors that influence the accuracy

39
of others’ ratings. According to Smith and Fortunato (2008), the personality traits of the raters
have a significant impact on the quality of ratings. The employees who have lack of trust on their
supervisors and the employees who have a very close relationship with the management could
not provide honest ratings. On the same way, if people provide information face to face, the
individuals show a soft corner in the ratings. There are many factors that impact the accuracy of
others’ ratings like the raters’ personality, values, beliefs, motivation, and interaction with the
ratee, etc.
2.12 Significance of Self–Other Rating Agreement
The incongruities between self and others' ratings have a significant importance for
leaders (Brutus, Fleenor, & Tisak, 1999). The literature supports the argument that lack of
agreement between self-awareness and self-perception to others’ perceptions may have
unpleasant impact on leaders’ effectiveness and their performance (Yammarino & Atwater,
1997). Sometimes, they set some unrealistic goals on the basis of self-perceptions which
ultimately affect the outcomes and performance of individuals as well as the organization.
Further, it is evident in the literature that the leaders with congruent ratings set realistic goals and
achieve the desired goals effectively. Self and others agreement have significant impact on
individual and organizational performance relative to those whose ratings are incongruent with
others (Atwater & Yammarino, 1992). Thus, the congruence between leaders’ self and
subordinates’ performance have a significant impact on individuals as well as organizational
development and performance. The current study investigates the congruity between self and
subordinates’ perceptions about leadership styles and performance through the full range
leadership model of Bass and Avolio (Avolio, 2011) in Pakistani banks.

40
2.13 Organizational Commitment
Organizational commitment is considered one of the most studied variables in the area of
organizational behavior. It is a multi-disciplinary concept and has been studied in different
disciplines like sociology, psychology, management, and human resource development.
Organizational commitment is defined as employees’ psychological affection and devotion to
their organization (Farahani, Taghadosi, & Behboudi, 2011). According to Qureshi, Hayat, Ali,
and Sarwat, (2011), organizational commitment is employees’ sense of responsibility towards
the mission of the organization. There are different views about organizational commitment.
Becker (1960) states that organizational commitment is a bet which an employee loses if s/he
leaves the organization.
According to Allen and Meyer (1990), organizational commitment is combinations of
three commitments or psychological states: affective commitment (emotional attachment),
continuance commitment (perceived costs) and normative commitment (obligation). This is
called ‘three component model of organizational commitment’. Affective commitment is the
emotional attachment of an employee to the organization. Normative commitment is the sense of
responsibility to continue with the organization because they ought to. Continuance commitment
is the decision to continue job with the organization based on the unavailability of alternate
opportunities. However, there is an overlap between affective commitment and normative
commitment (Bergman, 2006; González & Guillén, 2008). To better differentiate the difference,
the individual needs to understand feelings and moral judgments clearly. Further, the job
satisfaction, perceived organizational support and effective leadership styles are also considered
related to organizational commitment.
41
There are different predictors of organizational commitment. According to Mowday,
Porter, and Steers (1982) and Steers (1977), personal traits like age, job tenure, and education
level predict employees’ level of organizational commitment. Glisson and Durick (1988)
consider the leadership as significant predictor of organizational commitment. As a
multidimensional concept (Blau, 1989), it leads to improve employees’ job satisfaction,
productivity, well-being and decrease turnover and absenteeism (Meyer, Stanley, Herscovitch, &
Topolnytsky, 2002).
2.14 A Review of Empirical Researches in Banking Sector of Pakistan
Although a significant number of studies have been done on the banking sector of
Pakistan yet the empirical studies on leadership and particularly transformational and
transactional leadership in the banking sector of Pakistan are not significant. According to Bodla
and Hussain (2009), only two or three studies have been done on leadership theories in Pakistan
and these studies were based on the data from the education sector. According to Bodla and
Husaain (2010), leadership is a quasi-need which is stimulated when individuals work in groups.
Further, the concept of transformational and transactional leadership has been considered as
western styles and did not get much attention in academia as well as in practice Pakistan. The
researcher tried to find out some literature on the congruence between self and others on
leadership styles but did not find any literature. In Pakistani setting, most of the available
literature is based on finding the relationship between leadership styles and individual and
organizational outcomes.
In 2009, Bodla and Hussain conducted a study on the relationship between leadership
styles and their followers’ needs. In this study, they state that the main function of leadership is

42
to understand the followers’ needs and adopt appropriate leadership styles to influence and
motivate the followers to achieve their desired goals. They emphasized on the fit between
leadership styles and followers’ work related needs. The findings of the study show that the
followers’ needs for achievement have a positive relationship with their preference of task
oriented leadership. The employees with high needs for achievement prefer more task oriented
leadership and the employees with a low level of needs for achievement desire for less task
oriented leadership.
In 2009, Abbas and Yaqoob examined the relationship between leadership development
and employee performance in Pakistan. This study was conducted in different private and public
organizations. They came up with the findings that five leadership development factors
(coaching, training and development, empowerment, participation and delegation) have a
significant influence on employee performance. Further, they emphasized on the need of
collaborative efforts and communication to improve performance.
The banking sector of Pakistan is highly competitive due to similar products and services
it offers which adds to the responsibilities and commitment of its employees. The burden of work
and the psychological stress causes less or no sense of identification in the employees and they
look for other jobs. It is difficult for the leadership to retain their human capital and maintain
their ability and performance (Rahim, 2010). He studied the emotional intelligence and stress
level of employees working in Pakistani banks through the ESCI (360-degree instrument by Hay
Group to measure emotional and social competencies). In this study, the employees reported the
level of stress they had in their branches and the role of their supervisors to minimize their stress.
The result shows that “all the respondents report a high level of stress and unsupportive attitude

43
of branch manager”. It can be inferred that there is a relationship between leadership styles and
negative performance outcomes.
Hunjra et al. (2010) studied the relationship between employees’ job satisfaction and
HRM practices. They focused on the impact of job autonomy, team work environment and
leadership behavior on job satisfaction. Further, they examined the major determinants of job
satisfaction on gender basis in the banking sector. The sample of the study consisted of 450
employees in different banks. They came up with the conclusion that HRM practices have a
positive relationship with employee job satisfaction. Moreover, the difference between the male
and female employees was significantly different. Male employees were found more satisfied
than female employees. However, they did not mention any particular factors or reasons of such
significant difference. Leadership behavior had statistically significant correlation coefficient
(0.476 at 5% level of significance) with job satisfaction.
In 2012, Asrar-ul-haq examined the congruence between managers and subordinates’
perceptions about managers’ leadership styles and subordinates’ performance outcomes using
FRL model of Bass and Avolio. Further, he assessed the influence of regional cultures in the
banking sector of Pakistan. The sample of the study consisted of 5 branches from different
regions (provinces) of Pakistan. He came up with the conclusion that a significant relationship
exists between leadership styles (transformational and transactional) and performance outcomes.
Further, the results showed that significant difference exists in the perceptions of managers and
subordinates about managers’ leadership styles at factor level and subordinates’ performance
outcomes. However, no significant difference was noted on cultural basis. The findings of the
study showed that the banking sector of Pakistan is a male dominated sector where all of the
branch managers and 88% of subordinates (participated in the study) were male. It is further

44
validated in Bodla and Nawaz (2010) where most of teaching staff in universities (the higher
education sector) is also male. They analyzed leadership styles of faculty members in public and
private universities. The data was collected from 265 faculty members (157 private and 108
public) using MLQ. The internal consistency of the scale was 0.74. The findings of the study
showed that a significant difference existed about transaction leadership styles among the faculty
of public and private institutions. In addition, no difference was found about transformational
and passive/avoidant leadership styles among faculty members of public and private institutions.
The literature shows that most of the studies are conducted from followers’ perspectives. The
available literature on leadership in Pakistan and especially in the banking sector of Pakistan is
based on followers’ perceptions or observations about their leaders. There is need to study this
relationship from both leaders as well as subordinates’ perspectives in different public and
private sector organizations. Therefore, the purpose of current study is to examine the
congruence between self and subordinates’ perceptions about leadership styles and performance
in the banking sector of Pakistan. This study is a valuable addition in the current literature on
leadership generally and congruence in leadership especially.

45
CHAPTER 3
METHODOLOGY
The purpose of this chapter is to describe the research methods that are used in this study.
This chapter consists of five sections: an overview of research design, population and sample,
instrumentation, data collection and data analysis. These five sections give an overview of the
procedures that are used in this study to examine the congruence between self and subordinates’
perceptions about leadership styles and performance in the banking sector of Pakistan.
3.01 Overview of the Research Design
This quantitative study uses causal comparative design also known as ex-post facto to
study and describe the relationships between and among different variables. It is a quantitative
study as it tests a theory composed of variables, measures with numbers, and analyzes with
statistical procedures (Creswell, 2009) and casual comparative as it tries to establish a cause-
effect relationship among variables. Further, it tries to explain that the values of independent
variables have statistically significant impact on dependent variables. In this study, there are
three independent/predictor variables: transformational leadership (composed of five
dimensions), transactional leadership (composed of three dimensions), and laissez-faire
leadership (composed of one factor). Further, this study has the following four
criterion/dependent variables: perceived leadership effectiveness, subordinates’ readiness to
exert extra effort on job, satisfaction with leaders, and, organizational commitment. To study the
relationship between the dependent criterion variables and independent predictor variables,
multiple regression analysis is be used. However, MANOVA and ANOVA techniques are used

46
to examine the difference of perceptions about leadership styles among managers and
subordinates.
3.02 Organizational Setting
The organizational setting for this research is the banking sector in Pakistan. The choice
of the banking sector for this study is due to the following reasons. First, it is a fast growing
sector in Pakistan and undergoing certain changes i.e. technological, human resource training
and transformation, and, mergers and acquisitions (Bodla & Hussain, 2010). Second, the
available literature on the banking sector of Pakistan shows that leadership styles in banking
have a significant relationship with subordinates’ performance outcomes. Third, the banking
sector of Pakistan operates under the control of the State Bank of Pakistan. Every bank working
in Pakistan follows the same rules and regulations set by the State Bank of Pakistan. In this way,
it is reasonable to study and generalize the findings. Fourth, the banking sector of Pakistan
provides equal job opportunities for both males and femalesvi. In order to recruit, train, retain and
compensate their employees, the banking sector has the same policy. That’s why, the banking
sector is an appropriate choice to conduct any study and implement any policy or
recommendations. Fifth, the workforce of banks does not belong to any particular culture or
region. The people working in banks belong to different cultures and different regions of
Pakistan. In this way, the banking sector is an ideal setting for the present study to examine the
congruence between leaders and subordinates’ perceptions about leadership styles and
performance. Further, it may help to generalize the findings of the study on all banking sector of
Pakistan. Sixth, the HRD is an under studied area in Pakistan and HRM related activities are
mainly the focus of available research studies. Therefore, the findings and recommendations of

47
this study may be helpful for HR professionals to solve different issues at individual, group or
organizational levels. Further, the finding of this study may start a new thinking and opportunity
to improve individual and organizational performance.
Thus, the congruence between leaders and subordinates’ perceptions about the style and
performance of leaders and the readiness of subordinates to exert extra effort is necessary to
achieve higher goals at individual as well as organizational level (Brutus, Fleenor, & Tisak,
1999). Figure 6 shows the general organizational structure of any branch.
Figure 6: General Organizational Structure
3.03 Population and Sample
According to Business Network Switzerland (February 2011)vii, 40 banks with 9,087
branches operate in Pakistan. Developing sample is critical when multiple organizations are
involved in the study (Bartlett, 2001). Therefore, the purposeful sampling technique is used in
this study. The population of this study consisted of branch managers and their immediate
Manager
Cash Dept. Officers Advances Dept.
Officers
Account Opening
and Clearance Dept.
Officers
Cheque Handling
Dept. Officers
Locker Handling
Dept. Officers
48
subordinates from all operational branches of 5 alpha banks in Pakistan. The sample frame for
the current study consisted of 65 operational branches of 5 banks. These five banks consisted of
almost 25,000 employees. However, all 25,000 employees were not the target sample of the
current study. The branches were selected on purposeful sampling technique and only those
branches were considered for this study that had branch manager with at least five subordinates.
The respondents from these branches were selected on non-random purposeful sampling
strategy. However, only those people were selected for this study who had the ability to
understand and respond the questions in English language. The workforce in Pakistani banks
does not belong to that particular area where the branches are located. The banks all over the
country consist of managers and workforce from different regions, with different cultures of the
country and irrespective of gender. So, the respondents/participants for this study were selected
irrespective of their culture, region or gender. Figure 7 provides a summary of the population,
sample size, and expected response rate. The researcher took the verbal consent/permission from
the branch manager through phone calls to participate in this study. The branch managers were
informed about the nature of current research, research procedures, and the potential risks and
benefits recommended by the Institutional Review Board of University of Illinois. After their
verbal consent, the researcher visited the branches personally and invited the branch managers
and subordinates to participate in the study. They were informed about the nature and procedure
of research and the respect for privacy and anonymity in the study. All the respondents were
required to agree with the terms and conditions to participate in this study. The researcher
administered two different questionnaires: one for branch managers and second for subordinates.
The branch managers were asked to fill out the questionnaire based on their perceptions (self-
assessment) about their personal leadership styles and performance outcomes. The subordinates

49
were required to fill out the questionnaire based on their perceptions about the leadership styles
of their manager.
Figure 7: Population, Sample Frame and Response Rate
3.04 Instruments
Multifactor Leadership Questionnaire 360 (5X short) by Bass and Avolioviii is be used to
collect data. This is already developed and widely used questionnaire. It is already validated in
different Pakistani settings (Shahzad, Rehman, & Abbas, 2010; Bodla & Nawaz, 2010; Bushra,
Usman, & Naveed, 2011; Chaudhry, Javed, & Naveed, 2012; Batool, 2013). Bodla and Nawaz
(2010) reported the internal consistency of scale as 0.74. They examined the difference among
Banking Sector of Pakistan (40 banks with approximately 9,087 branches)
5 Alpha Banks
Branches with manager and at least five subordinates
65 Branches
Ability to Respond in English
Sample:
65 Managers and 225
Subordinates
Expected Response
Rate:
90%

50
365 faculty members of public and private universities in Pakistan. They found no significant
difference about transformational leadership and avoidant/passive leadership styles among
faculty members of public and private universities. Though they did not discuss any particular
reasons behind this difference but there may be different factors like compensation, work
environment and management behavior. However, the difference about transactional leadership
style among faculty members of public and private universities is found significant. In this study,
the MLQ 360 (5X short) is used to examine the relationship between transformational,
transactional and laissez-faire leadership styles with subordinate's perceptions about their
satisfaction with leaders, leaders’ effectiveness and their readiness to exert extra effort on job.
The MLQ 5X is a combination of self and other report measures of leadership style and
effectiveness and is based on Bass's (1985) theory of transformational and transactional
leadership. In the present study, both self and other report measure questionnaires are used (one
for the branch manager and second for his/her immediate subordinates) to obtain their
perceptions on different questions related to study.
The MLQ is an already developed and widely used measure to test the full range
leadership model consists of transformational, transactional, and laissez-faire leadership (Bass &
Avolio, 1993; Bass & Avolio, 1994; Avolio, 2011) which are represented through the following
nine dimensions.
Transformational Leadership
1. Idealized influence (attributed)
2. Idealized influence (behavioral)
3. Inspirational motivation (Figure 8 continued)

51
4. Intellectual stimulation
5. Individualized consideration
Transactional Leadership
6. Contingent Reward
7. Management by Exception (active)
8. Management by Exception (passive)
Laissez-Faire Leadership
9. Laissez-faire Leadership
On the basis of empirical studies, the multifactor leadership questionnaire has undergone
many modifications about the behaviors to represent transformational, transactional, and laissez-
faire leadership. The latest version of the multifactor leadership questionnaire (MLQ 360 5X
short) is used in this study. This questionnaire is based on Likert scale from 1 to 5 on scale.
In order to examine the perceptions about organizational commitment, the shortened
Organizational Commitment Questionnaire (OCQ) by Meyer and Allen (1997) is used. The OCQ
is already developed questionnaire and is widely used in different studies to measure
organizational commitment (Steers, 1977; Bergman, 2006; González & Guillén, 2008). The
OCQ has gone many modifications regarding the number of questions and type of organizational
commitment. The latest version of OCQ (1997) is used for this study. The questionnaire is based
on 18 questions and measure three types of organizational commitment (affective, continuance
and normative). In addition, four demographic variables (gender, age, education, and tenure) are
used in this study. However, the above scale is assumed as continuous scale for this study.
Figure 8: Leadership Styles with Measurement Dimensions
52
3.05 Data Collection
The current employees in the positions of branch managers and their immediate
subordinates that can understand and respond the questions in English language. The sample for
this study consists of 65 branches that include 65 branch managers and 225 subordinates. The
branch managers were the heads of particular branches and had administrative experience in
their respective area of expertise. The researcher contacted the branch managers through phone
calls and informed them about the nature of present study, its procedures, and potential risks and
benefits, recommended by the Institutional Review Board of University of Illinois. After their
verbal consent, the researcher visited the banks to administer questionnaires.
In the present study, self-administered paper based questionnaires (one for the branch
manager and second for his/her immediate subordinates) are used to obtain their perceptions
about different questions related to study. A consent letter to participate in this study was part of
the paper based questionnaire and every respondent were required to agree with the terms and
conditions to participate in the study. In order to collect required data (questionnaires) from each
branch, a follow-up visit was scheduled to the respective branches. This procedure took two
months to complete data collection. After data collection process, the data was transferred into
MS Excel sheet and all of the participants were identified by a code. The data remained
confidential. Only researcher had access to check and monitor the data and record it.
3.06 Data Analysis
A five-point Likert scale is used to rate the response and measure the frequency of the
perceived behavior. The following rating scale is used to measure MLQ items:
1 = Not at all

53
2 = Once in a while
3 = Sometimes
4 = Fairly Often
5 = Frequently (if not always)
In order to measure OCQ items, the following five-point Likert scale is used:
1 = Strongly Disagree
2 = Disagree
3 = Do Not Know
4 = Agree
5 = Strongly Agree
The Statistical Package for Social Science (SPSS) is used for data analysis in this study.
The data is analyzed using inferential and descriptive statistics. ANOVA and multiple regression
analysis is used to examine the statistical significance and degree of the relationship among
different dependent and independent variables.
The purpose of descriptive statistics is to illustrate the demographics (gender, experience,
age and education) of the study sample. In addition, zero-order correlations between the
leadership factors and outcome factors is also examined.
The purpose of inferential statistics is to reach the conclusions of the study. Multiple
regressions is used as an inferential statistic technique to analyze the research hypotheses.
According to Lomax (2007), multiple regression technique is used to examine the effects of
more than one predictor (independent) variable on one criterion (dependent variable). Multiple
regression technique is used to examine: how well the independent variables predict dependent

54
variable, and which variables significantly predict the dependent variable (Mertler & Vannatta,
2004).
In the present study, multiple regression analysis is used to understand the impact of
managers’ leadership styles (transformational, transactional and laissez-faire leadership) on
subordinates’ outcomes of leader effectiveness, extra effort, satisfaction with the leader and
organizational commitment. In addition, it is used to determine leadership styles fit in Full Range
Leadership model to predict each outcome, and which leadership factor(s) is significant
predictor(s) of outcomes. The IBM SPSS (Statistical Package for the Social Sciences) version
22.0 is used to analyze the data. The level of significance for multiple regression analysis to
interpret the results is set at .05.
3.07 Pilot Study
Pakistan is a culturally rich country. It represents many sub-cultures, languages and
religions. The purpose of the preliminary study (Asrarulhaq, 2012) was to examine the
congruence between self (managers) and others’ (subordinates) perceptions about managers’
leadership styles and their performance. Further, the aim was to assess the influence of different
sub-cultures in the banking sector of Pakistan. The data was collected from five banks (5
managers and 26 subordinates). The full range leadership model of Bass and Avolio was used to
check the relationship of managers’ leadership styles (transformational, transactional and laissez-
faire) and performance outcomes (effectiveness, satisfaction and extra effort). The data was
collected from five banks (5 managers and 26 subordinates) by using MLQ 360 (5 X Short). The
sample of the study was selected from different regions representing different sub-cultures. The
managers responded about their perceived leadership style and performance. The subordinates

55
responded about perceived leadership styles and performance of their managers. The data was
analyzed using ANOVA and regression analysis.
The results of the study showed that the banking sector of Pakistan is not influenced by
the sub-cultures in the country. All the managers were male and master degree holders.
However, subordinates had 12% female representation. The qualification of 80% subordinates
was master and the rest of 20% were bachelor degree holders. Further, no significant difference
was found among the perceptions of managers and subordinates about leadership styles and
performance across regions. The insignificant difference exists in the perceptions of employees
about the transactional leadership style. The managers at BAL region sometimes used
transactional leadership style whereas the managers at all other regions used it very often.
However, the results indicated that differences exist between managers and subordinates
about their perceptions about the relationship styles at different sub dimensions of
transformational and transactional leadership styles and performance variables. The following
significant differences were found in the preliminary (pilot) study.
First, the managers perceived the impact of idealized influence (behavior), individualized
consideration and intellectual stimulation on effectiveness outcome as positive but insignificant.
On the other hand, subordinates perceived this impact as positive but highly significant.
Second, the managers perceived the impact of idealized influence (attributed),
individualized consideration and inspirational motivation on satisfaction outcome as negative
whereas the subordinates perceived this impact as positive.
Third, the managers perceived the relationship between contingent reward and
subordinates’ extra effort as negative and significant whereas subordinates perceived as negative
and insignificant.

56
Fourth, the managers perceived that management by exception (active) has positive and
insignificant impact on subordinates’ extra effort whereas subordinates perceived it as negative
and insignificant.
The results of this preliminary study guided for the present study. Thus, the present study
examined the congruence between managers and subordinates’ perceptions about leadership
styles and performance in the banking sector of Pakistan. The cultural dimensions (power
distance, masculinity and uncertainty avoidance) are considered the cultural context for the
study.

57
CHAPTER 4
RESULTS
This chapter presents statistical information obtained from data to answer the research
questions and the results of the study. The present study is an effort to examine the congruence
between managers’ (self) and their subordinates’ perceptions about their leadership styles and
performance within full range leadership model (Bass, 1985; Bass & Avolio, 1994; Avolio 2011)
and three component model of organizational commitment (Meyer & Allen, 1991, 1997). This
chapter consists of three sections (a) data screening (b) descriptive statistics and (c) inferential
statistics.
4.01 Screening of Data
Data screening involved data management (transferring and coding data into electronic
files, handling missing data, scoring instruments, identifying outliers (extreme values), and
checking reliability of the instruments. The statistical software IBM SPSS® Statistics version 22
was employed in this regard.
Participation
In total, 70 managers and 250 subordinates from 70 operational branches of five alpha
banks were invited to participate in the study. However, 70 managers and 236 subordinates were
eligible to participate in the study based on English language proficiency requirement. Further,
65 managers and 227 subordinates voluntarily participated in the study, resulting in a response
rate of 92.86% and 96.18% for managers and subordinates respectively. In this regard, two self-
administered paper based questionnaires (one for managers and second for his/her immediate
subordinates) were used to obtain their perceptions about different questions related to study. A
consent letter to participate in this study was part of the paper based questionnaire and every

58
respondent was required to agree with the terms and conditions to participate in the study. In
order to expedite the data collection process, a follow-up visit was scheduled to the respective
branches. However, 63 questionnaires from managers and 224 questionnaires from subordinates
were received to the researcher, resulting in 96.92% of managers and 98.68% of subordinates
participated in the study.
Data management
As recommended by Creswell (2009), the data was transferred from the questionnaires
(paper and pencil version) to an electronic file in Microsoft Excel (MS Excel). In order to avoid
typing errors, data was screened randomly and verified. The data was screened for missing
responses according to given guidelines for survey instruments (MLQ-5X short and OCQ). The
total missing values were reported less than 2%. There are different methods to handle missing
data (Tabachnick & Fidell, 2013). For instance, the Mind Garden quoted Avolio (the co-author
of MLQ-5X short): “I would generally say if you have 3 items for a scale keep that data and plug
in the mean [for those 3 for the 4th item], as that won't change your resultsix.” The same method
was used to deal missing data in this study. The data was scored according to the scoring keys of
instruments (MLQ-5x short and OCQ)
The MLQ instrument contained 45 questions and OCQ instrument contained 18
questions. The 36 items in MLQ questionnaire measured leadership styles and 9 items measured
three outcomes. The Leadership styles included transformational, transactional, and laissez-faire
leadership behaviors. The three outcomes included perceived leadership effectiveness, extra
effort and satisfaction. The 18 OCQ items measured three dimensions of organizational
commitment: affective commitment, continuance commitment and normative commitment. The
scores were computed according to instruments’ scoring keys.

59
Detection of outliers
According to Tabachnick and Fidell (2013), outliers are the extreme values in the data. It
is different from the rest of data and results from some unusual variable/score or combination of
variables/scores. The outliers may affect the accuracy of statistical analysis results. Tabachnick
and Fidell (2013) proposed four general causes of outliers: incorrect data entry, absence of codes
for missing values, item may be outside of the population, and distribution of variables different
from a normal population. The data was entered correctly, missing values were handled carefully
and all the patterns were checked to avoid extreme values. The data was checked for outliers
using SPSS graphical method and was found satisfactory for this study. The graphic
representation of outlier analysis is given in Appendix D.
Reliability of instrument
The reliability and internal consistency of MLQ-5X short and OCQ is globally
recognized. However, in order to determine the internal consistency of the instrument for this
study, cronbach alpha (α) was calculated. The overall internal consistency of the 16 scale
questionnaires (.85 for subordinates’ instrument, .75 for managers’ instrument, and .85 for
combined instruments) was acceptable coefficient for reliability (Creswell, 2009). However,
scale-wise cronbach alpha for managers’ instrument was below average. The literature shows
that self-ratings usually produce lower estimates of internal consistency. In addition, it was
consistent with the early findings of Bass and Avolio (1990, 1993, and 1999). Moreover, it was
necessary to have same structure of variables to compare managers’ and subordinates’
perceptions about leadership styles and performance. Therefore, the scales with lower cronbach
alpha were also used in the study. The scale-wise cronbach alpha can be seen in Table 1.

60
Table 1
Reliability Statistics of Instruments
Variable Cronbach α
(Managers)
Cronbach α
(Subordinates)
Cronbach α (managers and
subordinates combined)
IIA 0.66 0.83 0.83
IIB 0.65 0.83 0.83
IM 0.64 0.83 0.82
IS 0.66 0.84 0.83
IC 0.67 0.83 0.83
CR 0.66 0.84 0.83
MBEA 0.66 0.84 0.83
MBEP 0.77 0.85 0.86
LF 0.79 0.85 0.85
EFF 0.68 0.84 0.86
EE 0.67 0.83 0.83
SAT 0.66 0.85 0.83
ACOM 0.72 0.85 0.84
CCOM 0.74 0.86 0.86
NCOM 0.73 0.86 0.86
Transf_L
Leadership
0.60 0.81 0.81
4.02 Descriptive Statistics
The purpose of this section is to illustrate (a) the demographic characteristics (b) factor
analysis, and (c) zero-order correlation between independent and dependent variables.
Demographic information
The sample of this study is composed of bank managers and their immediate subordinates
from different operational branches of five banks in Pakistan. The total sample of useable

61
surveys obtained from sixty branches is 63 managers and 224 subordinates. The demographic
information about the managers and their subordinates is presented in Table 2.
Table 2
Summary of Sample Composition by Demographic Characteristics
Managers (n=63) Subordinates (n=224)
Demographic Category N % n %
Gender Male 56 90.32 144 67.29
Female 6 9.68 70 32.71
Age 25 years or less 0 0 6 2.80
26-35 years 36 65.45 193 90.19
36-45 years 17 30.91 15 7.01
46 years or above 2 3.64 0
Education Less than 14 years 0 0 0 0
14 years 8 13.79 24 11.27
16 years 42 72.41 187 87.79
18 years or above 8 13.79 2 0.94
Job Tenure Less than 1 year 1 1.85 13 6.02
1-4 years 21 38.89 106 49.08
5-8 years 20 37.04 62 28.70
9 years or above 12 22.22 35 16.20
Note. n= Response, % = Response rate

62
Demographic survey results
The sample consisted of 63 managers and 224 subordinates. The demographics showed
that banking sector in Pakistan is male dominant sector. There were only 6 females at manager
level whereas 32.71 percent subordinates were females which represented less than half of the
subordinates’ sample. Based on gender, a significant difference was found in managers’ self-
perceptions about management by exception (passive) and satisfaction. The detail of gender
based descriptive statistics for leadership styles and performance variables is given in Table 1E
of Appendix E.
As the literature shows the banking sector of Pakistan was rapidly growing due to
advancement of technology and competition, the banks recruited young and skilled people. It
was illustrated by the demographic data that 90.19 percent of the subordinates and 65.45 percent
of managers belonged to 26-35 years age group. There were only 2 managers who had 46 years
of age or more whereas no subordinate belonged to this group. The detail of age based
descriptive statistics for leadership styles and performance variables is given in Table 2E of
Appendix E.
The education level of 86.2 percent managers and 88.73 percent subordinates was at least
Masters. The 13.79 percent managers and 11.27 percent of subordinates had bachelor degrees. In
addition, 8 managers and 2 subordinates had 18 years education or above. The detail of
education based descriptive statistics for leadership styles and performance variables is given in
Table 3E of Appendix E.
For respondents’ job tenure, the majority had one to eight years of experience at
their current positions. The 38.89 percent managers and 49.08 percent subordinates had one to
four years of experience. The managers and subordinates with five to eight years of experience at
63
current position represented 37.08 percent and 28.70 percent of respondents respectively. The
managers with nine years or more experience were 22.22 percent whereas subordinates with nine
years or more experience were 16.20 percent. Based on researcher’s personal experience, some
of the experienced managers were promoted to some administrative positions like Regional
Chief Managers (RCMs) or Assistant Vice Presidents (AVPs) etc. and some got retirement with
attractive packages (offered by banks against their retirement before time) in last couple of years.
The detail of tenure based descriptive statistics for leadership styles and performance variables is
given in Table 4E of Appendix E.
Factor analysis
After determining reliability of the instrument and scales, factor analysis was run to
check the intercorrelations among different dimensions of leadership styles and outcomes to
establish the composite factors to be used in inferential statistical analysis. Principal Axis Factor
(PAF) method (with varimax rotation) was used for factor analysis of managers’ and
subordinates’ data sets separately. The factors were considered based on the eigenvalues (greater
than 1) and KMO measure of sampling adequacy (minimum 6). The results of the subordinates’
data showed that one factor was extracted from five dimensions of transformational leadership.
In addition, one factor was extracted from three dimensions of transactional leadership.
However, the results of managers’ data were different. The five dimensions of transformational
leadership extracted one factor whereas three dimensions of transactional leadership extracted
two factors. As the study aimed at comparing the perceptions of both managers and subordinates
about leadership styles, same method was followed in extracting factors of leadership styles. The
combine factor of all five transformational leadership dimensions was extracted from both
managers’ and subordinates’ data sets and named as transformational leadership style (Transf-L)

64
in respective data sets. The KMO measures for transformational leadership factors were 0.81 (p
< .001) and 0.802 (p < .001) for managers’ and subordinates’ data sets respectively. However, no
factor was extracted from transactional leadership dimensions. Results of extracted factors are
shown in Table 3.
Table 3
Summary of Factor Analysis for Transformational Leadership (5 Factors)
Factor Initial Eigenvalues Extraction Sums of Squared Loadings
Total % of Variance Cumulative % Total % of Variance Cumulative %
Managers
IIA 3.273 65.451 65.451 2.877 57.532 57.532
IIB 0.685 13.69 79.142
IM 0.498 9.959 89.10
IS 0.326 6.518 95.619
IC 0.219 4.381 100.00
Subordinates
IIA 2.715 54.298 54.298 2.183 43.662 43.662
IIB 0.776 15.527 69.826
IM 0.64 12.797 82.623
IS 0.47 9.396 92.018
IC 0.399 7.982 100.00
Zero-order correlation between leadership dimensions and outcomes
Zero-order correlations were tested between leadership dimensions and outcomes based
on the results of MLQ and OCQ instruments. It is used to examine the relationship between two
variables in statistical analysis without considering the influence of other variables. In this study,
Pearson’s product-moment correlation coefficients (r) is used to examine the zero-order

65
correlation. The higher value of (r) represents a strong correlation whereas a lower value of (r)
indicates weak correlation between variables. The results about the relationship between
dimensions of transformational leadership and outcomes are positively correlated and is
consistent with the available literature (Asrarulhaq, 2012; Bass & Avolio, 1990; Bass et al.,
1995). The laissez-faire leadership is negatively correlated with all six performance variables.
However, some patterns of correlation between sub dimensions are interesting. For instance,
Management by exception (passive) is negatively correlated with four performance variables
(effectiveness, satisfaction, affective commitment and normative commitment) and is positively
correlated with two performance variables (satisfaction and continuance commitment). In
addition, gender and education also had some interesting correlations. The correlations between
all variables of the study are reported in Table 4.

66
Table 4
Zero-order Correlation
1 2 3 4 5 6 7 8 9 10 11 12 13 14 15 16 17 18 19 20
1 IIA -
2 IIB .56** -
3 IM .56** .59** -
4 IS .36** .44** .52** -
5 IC .56** .43** .48** .39** -
6 CR .51** .59** .63** .50** .48** -
7 MBEA .56** .42** .47** .33** .59** .38** -
8 MBEP .24** 0.08 0.02 -0.09 .32** -0.07 .38** -
9 LF 0.05 -0.08 -0.09 -0.07 .21** -.18** .22** .61** -
10 EFF .50** .54** .51** .40** .31** .57** .31** -0.10 -.24** -
11 EE .44** .55** .61** .43** .35** .47** .41** 0.08 -0.05 .56** -
12 SAT .23** .44** .44** .46** .18** .42** .22** -.18** -.26** .48** .57** -
13 ACOM 0.06 .16** .18** .14* 0.09 .19** 0.04 -0.05 -.13* .16** 0.11 0.07 -
14 CCOM 0.01 0.01 0.01 0.01 0.05 0.07 0.00 0.01 -0.02 0.05 -0.08 -0.05 -0.01 -
15 NCOM 0.03 0.03 0.05 0.02 0.03 0.05 -0.07 -0.05 -0.05 0.09 0.11 0.09 .19** 0.09 -
16 GEN 0.05 -.15* -0.08 -.22** 0.04 -0.03 .14* .22** .13* 0.07 -0.03 -.17** 0.00 -0.07 0.06 -
17 AGE -0.01 0.01 0.12 .13* 0.04 0.12 0.07 -.12* -.14* 0.09 0.05 0.10 0.11 0.10 0.06 -0.12 -
18 EDU -0.01 -0.02 -0.02 .14* -0.03 -0.05 -0.05 -0.09 -0.10 0.09 0.05 .12* -.12* .17* -0.03 -0.10 -0.07 -
19 TEN -0.08 0.02 .16** .13* 0.05 0.05 0.00 -0.04 0.03 0.06 0.03 0.05 0.07 .13* 0.08 -0.10 .16* 0.04 -
20 Transf_L .81** .75** .77** .55** .66** .63** .55** .19** 0.03 .53** .57** .38** 0.11 -0.05 -0.01 0.00 -0.04 -0.01 0.03 -
Note. IIA = Individualized influence attributed, IIB = Individualized influence behavior, IC = Individualized consideration, IM = Inspirational
motivation, IS = Intellectual Stimulation, CR = Contingent Reward, MBEA = Management by exception active, MBEP = Management by exception
passive, LF = Laissez-faire leadership, EFF = Effectiveness, EE = Extra effort, SAT = Satisfaction, ACOM = Affective commitment, CCOM =
Continuous commitment, NCOM = Normative commitment, GEN = Gender, AGE = Age group, EDU = Education, and TEN = Tenure. Gender is
represented through different codes. Males are given 0 as code and Females are given 1. Different codes are given to different age group. 35 years
or less = 0, and, 36 years or above = 1. Different codes are given to different level of education. 16 years degree or above = 0, Less than 16 years
degree = 1. Different codes are given to different level of tenure. 4 years or less tenure = 1, 5-8 years tenure = 2, 9 years tenure or above = 3.
*p <.05, **p < .01

67
4.03 Inferential Statistics
The purpose of inferential statistics is to address research hypotheses of the study based
on statistical analysis. MANOVA, ANOVA, and OLS multiple regression techniques are used
for inferential statistics in the study. OLS multiple regression is used to predict the value of a
single variable from one or more independent variables. The general purpose of OLS multiple
regression is to explain the relationship between several independent or predictor variables and
one dependent or criterion variable. In other words, multiple regression analysis is used to
determine: how effectively a set of variables can predict a particular outcome and which
variable(s) significantly predict the outcome. In this study, OLS multiple regression analysis is
used to examine the effects of leadership styles (transformational, transactional and laissez-faire)
on outcomes (effectiveness, extra effort, satisfaction, affective commitment, continuance
commitment, and normative commitment). The IBM SPSS 22.0 is used to analyze the data. The
level of significance is set at .05 to interpret regression results.
4.04 Results of Research Hypotheses
The research questions for the present study were based on four levels. The first level
consisted of research questions about the comparison of managers’ (self) and subordinates’
perceptions about their leadership styles. The second level was about the relationship between
managers’ self-perceived leadership styles and subordinates’ outcomes. The third level was
about the relationship between managers’ leadership styles as percieved by subordinates and
their outcomes. The fourth level was about the congruence between managers’ (self) and
subordinates’ perceptions about their leadership styles and performance. The statistical tests used
in the present study to answer the research questions were ANOVA, MANOVA (for level 1

68
questions) and OLS multiple regression analysis (for level 2-4 questions). The statistical results
of the research questions are presented by levels.
4.05 Comparison of Managers’ (Self) and Subordinates’ Perceptions about
Managers’ Leadership Styles (Level 1)
Figure 9: Comparison of managers’ (self) and subordinates’ perceptions about leadership styles
This section is based on the comparative analysis of managers’ self-perceived leadership
styles and subordinates’ perceptions about their leadership styles (transformational, transactional
and laissez-faire). Leadership styles were ranked on Likert scale (from ‘frequently = 5’ to ‘not at
all = 1’) by managers and subordinates based on their perceptions of how often a particular
behavior is practiced by managers in respective bank. The leadership styles of managers were
assessed on the basis of MLQ leadership styles and dimensions. The MLQ consisted of three
leadership styles: transformational, transactional, and laissez-faire. In order to better understand

69
the difference of perceptions about managers’ leadership styles, MANOVA and ANOVA
techniques were used at leadership style level as well as dimension level. In ANOVA, four
demographics (gender, age, education, and tenure) are entered as control variables.
H1: There is a significant difference between self and subordinates’ perceptions about
leadership styles of managers in the banking sector of Pakistan.
In order to assess difference between self (managers’) and subordinates’ about their
leadership styles, two MANOVA models were estimated. Table 5 provides the MANOVA
results. The summary of significant mean differences between managers’ (self) and subordinates’
perceptions about leadership styles is shown in Table 16. In first model, the group difference
between leadership styles was estimated with respect to four demographic variables (gender, age,
education, and tenure). In the second model, the group difference between leadership styles was
estimated with respect to rank (while retaining all four demographics in the first model). Box’s
M test was used to test the equality of covariance matrices. The results indicated that Box’s M
was significant, F (275, 9540.602) = 1.682, p < .001. Wilks' Lambda test statistic was used to
interpret the MANOVA results.
In the first model, Wilks' Lambda value in multivariate tests indicated a statistical
significant group difference between perceived leadership styles with respect to gender and age,
Wilks' Lambda = 0.87, F (9, 227) = 3.90, p < .001, 𝜂2= .134, and Wilks' Lambda = 0.93, F (9,
227) = 1.99, p = .042, 𝜂2= .073 respectively. In the second model, Wilks' Lambda value in
multivariate tests indicated a statistical significant group difference between perceived leadership
styles with respect to gender and rank, Wilks' Lambda = 0.87, F (9, 226) = 3.73, p < .001, 𝜂2=
.129, and Wilks' Lambda = 0.81, F (9, 226) = 5.92, p < .001, 𝜂2= .191 respectively. In order to
better understand the difference between managers’ (self) and subordinates’ perceptions about

70
leadership styles and dimensions, the above hypothesis is divided into sub hypotheses (at
leadership style and dimension level). In order to examine the group differences, parameter
estimates and post-hoc test (Tukey) analysis techniques were used. The parameter estimates
technique was used for four variables (gender, age, education, and rank) to see how different
groups rated the variables. In order to examine the group differences for tenure variable, post-hoc
test (Tukey) analysis was used because parameter estimates is used only for variables with two
groups and tenure consisted of three groups. The overall results showed that gender (female
group) had significant role in managers’ (self) and subordinates’ perceptions about leadership
styles. The detail results of parameter estimates and post-hoc (Tukey) analysis are shown in
Appendix F (Table 1F to Table 10F).
Table 5
Multivariate Test for Leadership styles and Demographics (Managers and Subordinates)
Effect Wilks'
Lambda
F df1 df2 p 𝜂2
Model 1 (without Rank)
GEN 0.87 3.90 9 227 < .001 .134
AGE 0.93 1.99 9 227 .042 .073
EDU 0.95 1.38 9 227 .196 .052
TEN 0.91 1.28 18 454 .194 .048
Model 2 (with Rank)
GEN 0.87 3.73 9 226 < .001 0.129
AGE 0.96 1.10 9 226 .365 0.042
EDU 0.95 1.37 9 226 .202 0.052
TEN 0.91 1.24 18 452 .223 0.047
RANK 0.81 5.92 9 226 < .001 0.191

71
(continues)
H1a: There is a significant difference between self and subordinates’ perceptions about
transformational leadership style of managers in the banking sector of Pakistan.
In order to examine statistical difference between managers’ and subordinates’
perceptions about managers’ transformational leadership style, two ANOVA models were
estimated. Table 6 provides the ANOVA results. In the first model, the main effect of four
demographic variables (gender, age, education, and tenure) on dependent variable was estimated.
The result showed that four demographic variables explained approximately 0.6% of the total
variation in transformational leadership style. The results indicated that no demographic variable
predicted significant change in transformational leadership style.
In the second model, rank was added as an independent variable. The result showed that
(four demographic variables and rank) also explained approximately 0.6% of the total variation
in transformational leadership style. The results indicated that no variable predicted significant
change in transformational leadership. In other words, there was no significant mean difference
in transformational leadership style between managers’ and subordinates’ perceptions.
Table 6
Summary of ANOVA for Transformational Leadership Style
SS df MS F p 𝜂2
Without Rank
GEN 0.05 1 0.05 0.06 .811 ~ 0
AGE 0.23 1 0.23 0.28 .600 .001
EDU 0.13 1 0.13 0.16 .688 .001
TEN 0.62 2 0.31 0.37 .688 .003
Error 193.09 235 0.82

72
Table 6 (continued)
With Rank
GEN 0.06 1 0.06 0.07 .787 ~ 0
AGE 0.26 1 0.26 0.32 .575 .001
EDU 0.14 1 0.14 0.17 .683 .001
TEN 0.60 2 0.30 0.36 .697 .003
Rank 0.03 1 0.03 0.04 .838 .000
Error 193.06 234 0.83
H1b: There is a significant difference between self and subordinates’ perceptions about
laissez-faire leadership style of managers in the banking sector of Pakistan.
In order to examine statistical difference between managers’ and subordinates’
perceptions about managers’ laissez-faire leadership style, two ANOVA models were estimated.
Table 7 provides the ANOVA results. In the first model, the main effect of four demographic
variables (gender, age, education, and tenure) on dependent variable was estimated. The result
showed that four demographic variables explained approximately 5.1% of the total variation in
laissez-faire leadership style. The results indicated that gender and age predicted significant
change in laissez-faire leadership style. The parameter estimates indicated that ‘female’ group
had significantly higher ratings for laissez-faire leadership style, dM = -0.22, SE = (0.10), t = -
2.15, p = .032, 95% CI: [-0.43, -0.02]. In addition, the parameter estimates indicated that
respondents with age group of ‘35 years or less’ had significantly higher ratings for laissez-faire
leadership style, dM = -0.30, SE = (0.14), t = 2.10, p = .037, 95% CI: [0.02, 0.58].
In the second model, rank was added as an independent variable. The result showed that
(four demographic variables and rank) explained approximately 6.3% of the total variation in
laissez-faire leadership style. In addition, there was no variable that predicted significant change.

73
The detail results of parameter estimates and post-hoc (Tukey) analysis are shown in Table 2F of
Appendix F.
Table 7
Summary of ANOVA for Laissez-faire Leadership style
SS Df MS F p 𝜂2
Without Rank
GEN 2.36 1 2.36 4.63 .032 .019
AGE 2.24 1 2.24 4.41 .037 .018
EDU 0.91 1 0.91 1.79 .182 .008
TEN 0.65 2 0.33 0.64 .528 .005
Error 119.67 235 0.51
With Rank
GEN 1.72 1 1.72 3.40 .066 .014
AGE 1.12 1 1.12 2.22 .137 .019
EDU 0.82 1 0.82 1.62 .205 .017
TEN 0.64 2 0.32 0.63 .533 .015
Rank 1.43 1 1.43 2.83 .094 .012
Error 118.24 234 0.51
H1c: There is a significant difference between self and subordinates’ perceptions about
‘idealized influence (attributed)’ dimension of managers’ leadership style in the banking
sector of Pakistan.
In order to examine statistical difference between managers’ (self) and subordinates’
perceptions about idealized influence (attributed), two ANOVA models were estimated. Table 8
provides the ANOVA results. In the first model, the main effect of four demographic variables
(gender, age, education, and tenure) on dependent variable was estimated. The result showed that
four demographic variables explained approximately 1.7 % of the total variation in idealized

74
influence (attributed). The results indicated that no demographic variable predicted significant
change in idealized influence (attributed).
In the second model, rank was added as an independent variable. The result showed that
(four demographic variables and rank) explained approximately 5.7 % of the total variation in
idealized influence (attributed). In addition, rank was the only variable that predicted significant
change. The parameter estimates indicated that managers had significantly higher ratings for
idealized influence (attributed), dM = 0.34, SE = (0.11), t = 3.12, p = .002, 95% CI: [0.13, 0.56].
In other words, there was a significant mean difference in idealized influence (attributed)
between managers’ and subordinates’ perceptions. The detail results of parameter estimates and
post-hoc (Tukey) analysis are shown in Table 3F of Appendix F.
Table 8
Summary of ANOVA for Idealized Influence (Attributed)
SS df MS F p 𝜂2
Without Rank
GEN 0.37 1 0.37 0.86 .354 .004
AGE 0.02 1 0.02 0.05 .829 ~ 0
EDU 0.16 1 0.16 0.39 .534 .002
TEN 1.02 2 0.51 1.21 .302 .010
Error 99.74 235 0.42
With Rank
GEN 0.87 1 0.87 2.13 .146 .009
AGE 0.23 1 0.23 0.55 .457 .002
EDU 0.24 1 0.24 0.58 .446 .002
TEN 1.06 2 0.53 1.30 .276 .011
Rank 3.98 1 3.98 9.72 .002 .040

75
(continues)
H1d: There is a significant difference between self and subordinates’ perceptions about
‘idealized influence (behavior)’ dimension of managers’ leadership style in the banking
sector of Pakistan.
In order to examine statistical difference between managers’ (self) and subordinates’
perceptions about idealized influence (behavior), two ANOVA models were estimated. Table 9
provides the ANOVA results. In the first model, the main effect of four demographic variables
(gender, age, education, and tenure) on dependent variable was estimated. The result showed that
four demographic variables explained approximately 2.2% of the total variation in idealized
influence (behavior). The results indicated that no demographic variable predicted significant
change in idealized influence (behavior).
In the second model, rank was added as an independent variable. The result showed that
(four demographic variables and rank) explained approximately 9.5% of the total variation in
idealized influence (behavior). In addition, rank was the only variable that predicted significant
change. The parameter estimates indicated that managers had significantly higher ratings for
idealized influence (behavior), dM = 0.41, SE = (0.09), t = 4.35, p < .001, 95% CI: [0.22, 0.59].
In other words, there was a significant mean difference in idealized influence (behavior) between
managers’ and subordinates’ perceptions. The detail results of parameter estimates and post-hoc
(Tukey) analysis are shown in Table 4F of Appendix F.
Table 9
Summary of ANOVA for Idealized Influence (Behavioral)
SS df MS F p 𝜂2
Without Rank
GEN 1.19 1 1.19 3.69 .056 .015

76
Table 9 (continued)
AGE 0.01 1 0.01 0.02 .884 ~ 0
EDU 0.06 1 0.06 0.17 .68 .001
TEN 0.35 2 0.17 0.54 .586 .005
Error 76.01 235 0.32
With Rank
GEN 0.45 1 0.45 1.51 .221 .006
AGE 0.65 1 0.65 2.18 .142 .009
EDU 0.11 1 0.11 0.37 .542 .002
TEN 0.22 2 0.11 0.37 .69 .003
Rank 5.68 1 5.68 18.90 .001 .075
Error 70.33 234 0.30
H1e: There is a significant difference between self and subordinates’ perceptions about
‘inspirational motivation’ dimension of managers’ leadership style in the banking sector of
Pakistan.
In order to examine statistical difference between managers’ (self) and subordinates’
perceptions about inspirational motivation, two ANOVA models were estimated. Table 10
provides the ANOVA results. In the first model, the main effect of four demographic variables
(gender, age, education, and tenure) on dependent variable was estimated. The result showed that
four demographic variables explained approximately 3.5% of the total variation in inspirational
motivation. The results indicated that no demographic variable predicted significant change in
inspirational motivation.
In the second model, rank was added as an independent variable. The result showed that
(four demographic variables and rank) explained approximately 14.6% of the total variation in
inspirational motivation. In addition, rank was the only variable that predicted significant
change. The parameter estimates indicated that managers had significantly higher ratings for

77
inspirational motivation, dM = 0.56, SE = (0.10), t = 5.51, p < .001, 95% CI: [0.36, 0.76]. In
other words, there was a significant mean difference in inspirational motivation between
managers’ and subordinates’ perceptions. The detail results of parameter estimates and post-hoc
(Tukey) analysis are shown in Table 5F of Appendix F.
Table 10
Summary of ANOVA for Inspirational Motivation
SS Df MS F p 𝜂2
Without Rank
GEN 0.11 1 0.11 0.27 .603 .001
AGE 1.02 1 1.02 2.53 .113 .011
EDU 0.05 1 0.05 0.13 .717 .001
TEN 1.90 2 0.95 2.37 .095 .020
Error 94.30 235 0.40
With Rank
GEN 0.05 1 0.05 0.15 .697 .001
AGE 0.00 1 0.00 0.01 .936 ~ 0
EDU 0.14 1 0.14 0.38 .539 .002
TEN 1.44 2 0.72 2.01 .136 .017
Rank 10.84 1 10.84 30.38 .001 .115
Error 83.47 234 0.36
H1f: There is a significant difference between self and subordinates’ perceptions about
‘intellectual stimulation’ dimension of managers’ leadership style in the banking sector of
Pakistan.
In order to examine statistical difference between managers’ (self) and subordinates’
perceptions about intellectual stimulation dimension of managers’ transformational leadership

78
style, two ANOVA models were estimated. Table 11 provides the ANOVA results. In the first
model, the main effect of four demographic variables (gender, age, education, and tenure) on
dependent variable was estimated. The result showed that four demographic variables explained
approximately 9% of the total variation in intellectual stimulation. The results indicated that
three demographic variables (gender, age, and education) predicted significant change in
intellectual stimulation. The parameter estimates indicated that ‘male’ group with dM = 0.23, SE
= (0.09), t = 2.66, p = .008, 95% CI: [0.06, 0.40], the respondents with ’36 years or above’ age
with dM = -0.25, SE = (0.12), t = -2.10, p = .037, 95% CI: [-0.49, -0.02], and the respondents
with ‘less than 16 years degree’ with dM = -0.25, SE = (0.12), t = -2.09, p = .038, 95% CI: [-
0.49, -0.01] had significantly higher ratings for intellectual stimulation.
In the second model, rank was added as an independent variable. The result showed that
(four demographic variables and rank) explained approximately 15.8% of the total variation in
intellectual stimulation. In addition, three variables (gender, education, and rank) predicted
significant change in intellectual stimulation. The parameter estimates indicated that ‘male’
group with dM = 0.17, SE = (0.09), t = 1.98, p = .049, 95% CI: [0.00, 0.34], the respondents with
‘less than 16 years degree’ with dM = -0.23, SE = (0.12), t = -1.98, p = .049, 95% CI: [-0.46,
0.00], and ‘managers’ with dM = 0.43, SE = (0.10), t = 4.37, p < .001, 95% CI: [0.24, 0.63] had
significantly higher ratings for intellectual stimulation. In other words, there was a significant
mean difference in intellectual stimulation between managers’ and subordinates’ perceptions.
The detail results of parameter estimates and post-hoc (Tukey) analysis are shown in Table 6F of
Appendix F.

79
Table 11
Summary of ANOVA for Intellectual Stimulation
SS Df MS F p 𝜂2
Without Rank
GEN 2.56 1 2.56 7.08 .008 .029
AGE 1.60 1 1.60 4.42 .037 .018
EDU 1.58 1 1.58 4.36 .038 .018
TEN 1.18 2 0.59 1.63 .199 .014
Error 84.92 235 0.36
With Rank
GEN 1.32 1 1.32 3.92 .049 .016
AGE 0.18 1 0.18 0.55 .46 .002
EDU 1.32 1 1.32 3.93 .049 .017
TEN 0.91 2 0.46 1.36 .259 .011
Rank 6.40 1 6.40 19.06 .001 .075
Error 78.52 234 0.34
H1g: There is a significant difference between self and subordinates’ perceptions about
‘individualized consideration’ dimension of managers’ leadership style in the banking
sector of Pakistan.
In order to examine statistical difference between managers’ (self) and subordinates’
perceptions about individualized consideration, two ANOVA models were estimated. Table 12
provides the ANOVA results. In the first model, the main effect of four demographic variables
(gender, age, education, and tenure) on dependent variable was estimated. The result showed that
four demographic variables explained approximately 5% of the total variation in individualized
consideration. The results indicated that no demographic variable predicted significant change in
individualized consideration.

80
In the second model, rank was added as an independent variable. The result showed that
(four demographic variables and rank) explained approximately 7.5% of the total variation in
individualized consideration. In addition, rank was the only variable that predicted significant
change. The parameter estimates indicated that managers had significantly higher ratings for
individualized consideration, dM = 0.46, SE = (0.11), t = 4.21, p < .001, 95% CI: [0.24, 0.67]. In
other words, there was a significant mean difference in individualized consideration between
managers’ and subordinates’ perceptions. The detail results of parameter estimates and post-hoc
(Tukey) analysis are shown in Table 7F of Appendix F.
Table 12
Summary of ANOVA for Individualized Consideration
SS Df MS F p 𝜂2
Without Rank
GEN 0.08 1 0.08 0.18 .673 .001
AGE 0.09 1 0.09 0.20 .659 .001
EDU 0.15 1 0.15 0.34 .562 .001
TEN 0.15 2 0.07 0.17 .844 .001
Error 102.27 235 0.44
With Rank
GEN 0.53 1 0.53 1.31 .254 .006
AGE 0.30 1 0.30 0.73 .394 .003
EDU 0.25 1 0.25 0.60 .438 .003
TEN 0.17 2 0.09 0.21 .81 .002
Rank 7.20 1 7.20 17.72 .001 .070
Error 95.07 234 0.41

81
(continues)
H1h There is a significant difference between self and subordinates’ perceptions about
‘contingent reward’ dimension of managers’ leadership style in the banking sector of
Pakistan.
In order to examine statistical difference between managers’ (self) and subordinates’
perceptions about contingent reward, two ANOVA models were estimated. Table 13 provides
the ANOVA results. In the first model, the main effect of four demographic variables (gender,
age, education, and tenure) on dependent variable was estimated. The result showed that four
demographic variables explained approximately 1.8% of the total variation in contingent reward.
However, the results indicated that no demographic variable predicted significant change in
contingent reward.
In the second model, rank was added as an independent variable. The result showed that
(four demographic variables and rank) explained approximately 11.9% of the total variation in
contingent reward. In addition, rank was the only variable that predicted significant change. The
parameter estimates indicated that managers had significantly higher ratings for contingent
reward, dM = 0.52, SE = (0.10), t = 5.19, p < .001, 95% CI: [0.32, 0.71]. In other words, there
was a significant mean difference in contingent reward between managers’ and subordinates’
perceptions. The detail results of parameter estimates and post-hoc (Tukey) analysis are shown in
Table 8F of Appendix F.
Table 13
Summary of ANOVA for Contingent Reward
SS Df MS F p 𝜂2
Without Rank
GEN 0.00 1 0.00 0.00 .949 ~ 0

82
Table 13 (continued)
AGE 1.15 1 1.15 3.06 .082 .013
EDU 0.29 1 0.29 0.77 .381 .003
TEN 0.04 2 0.02 0.06 .946 ~ 0
Error 88.53 235 0.38
With Rank
GEN 0.23 1 0.23 0.66 .417 .003
AGE 0.01 1 0.01 0.03 .869 ~ 0
EDU 0.44 1 0.44 1.30 .255 .006
TEN 0.00 2 0.00 0.00 .997 ~ 0
Rank 9.15 1 9.15 26.97 .001 .103
Error 79.38 234 0.34
H1j: There is a significant difference between self and subordinates’ perceptions about
‘management by exception (active)’ dimension of managers’ leadership style in the banking
sector of Pakistan.
In order to examine statistical difference between managers’ (self) and subordinates’
perceptions about management by exception (active), two ANOVA models were estimated.
Table 14 provides the ANOVA results. In the first model, the main effect of four demographic
variables (gender, age, education, and tenure) on dependent variable was estimated. The result
showed that four demographic variables explained approximately 4.1% of the total variation in
management by exception (active). The results indicated that gender was the only variable that
predicted significant change in management by exception (active). The parameter estimates
indicated that ‘female’ group had significantly higher ratings for management by exception
(active), dM = -0.26, SE = (0.10), t = -2.62, p = .009, 95% CI: [-0.46, -0.06].
In the second model, rank was added as an independent variable. The result showed that
(four demographic variables and rank) explained approximately 12.7% of the total variation in

83
management by exception (active). The results indicated that gender and rank variables predicted
significant change in management by exception (active). The parameter estimates indicated that
‘female’ group with dM = -0.34, SE = (0.10), t = -3.51, p = .001, 95% CI: [-0.53, -0.15] and
‘managers’ with dM = 0.54, SE = (0.11), t = 4.80, p < .001, 95% CI: [0.32, 0.77] had
significantly higher ratings for management by exception (active). In other words, there was a
significant mean difference in management by exception (active) between managers’ and
subordinates’ perceptions. The detail results of parameter estimates and post-hoc (Tukey)
analysis are shown in Table 9F of Appendix F.
Table 14
Summary of ANOVA for Management by Exception (Active)
SS df MS F p 𝜂2
Without Rank
GEN 3.27 1 3.27 6.85 .009 .028
AGE 1.55 1 1.55 3.25 .073 .014
EDU 0.12 1 0.12 0.25 .616 .001
TEN 0.42 2 0.21 0.44 .645 .004
Error 112.28 235 0.48
With Rank
GEN 5.39 1 5.39 12.33 .001 .050
AGE 0.05 1 0.05 0.11 .746 ~ 0
EDU 0.23 1 0.23 0.53 .469 .002
TEN 0.23 2 0.11 0.26 .773 .002
Rank 10.06 1 10.06 23.02 .001 .090
Error 102.22 234 0.44

84
H1k: There is a significant difference between self and subordinates’ perceptions about
‘management by exception (passive)’ dimension of managers’ leadership style in the
banking sector of Pakistan.
In order to examine statistical difference between managers’ (self) and subordinates’
perceptions about management by exception (passive), two ANOVA models were estimated.
Table 15 provides the ANOVA results. In the first model, the main effect of four demographic
variables (gender, age, education, and tenure) on dependent variable was estimated. The result
showed that four demographic variables explained approximately 7% of the total variation in
management by exception (passive). The results indicated that gender was the only variable that
predicted significant change in management by exception (passive). The parameter estimates
indicated that ‘female’ group had significantly higher ratings for management by exception
(passive), dM = -0.39, SE = (0.11), t = -3.43, p = .001, 95% CI: [-0.62, -0.17].
In the second model, rank was added as an independent variable. The result showed that
(four demographic variables and rank) explained approximately 7.5% of the total variation in
management by exception (passive). The results indicated that gender was again the only
variable that predicted significant change. The parameter estimates indicated that ‘female’ group
had significantly higher ratings for management by exception (passive), dM = -0.37, SE = (0.12),
t = -3.19, p = .002, 95% CI: [-0.06, -0.14]. In other words, there was no significant mean
difference in management by exception (passive) between managers’ and subordinates’
perceptions. The detail results of parameter estimates and post-hoc (Tukey) analysis are shown in
Table 10F of Appendix F.

85
Table 15
Summary of ANOVA for Management by Exception (Passive)
SS Df MS F p 𝜂2
Without Rank
GEN 7.36 1 7.36 11.77 .001 .048
AGE 1.10 1 1.10 1.76 .186 .007
EDU 0.78 1 0.78 1.25 .265 .005
TEN 0.24 2 0.12 0.19 .824 .002
Error 146.99 235 0.63
With Rank
GEN 6.34 1 6.34 10.15 .002 .042
AGE 0.51 1 0.51 0.82 .365 .004
EDU 0.71 1 0.71 1.14 .286 .005
TEN 0.30 2 0.15 0.24 .786 .002
Rank 0.85 1 0.85 1.37 .243 .006
Error 146.14 234 0.63
Table 16
Summary of Significant Mean Differences between Managers and Subordinates about
Leadership Styles
Managers Subordinates
Idealized influence (attributed) Significantly higher ratings
Idealized influence (behavior) Significantly higher ratings
Inspirational motivation Significantly higher ratings
Intellectual stimulation Significantly higher ratings
Individualized consideration Significantly higher ratings
Contingent reward Significantly higher ratings
Management by exception (active) Significantly higher ratings

86
4.06 Relationship between Managers’ Self-perceived Leadership Styles and
Subordinates’ Outcomes (Level 2)
This section is about the impact of managers’ self-perceived leadership styles on
subordinates’ outcomes. The relationship of three independent variables (transformational
leadership, transactional leadership, and laissez-faire leadership) with six outcome variables
(managers’ effectiveness, extra effort, satisfaction, affective commitment, continuance
commitment and normative commitment) is examined. In addition, the impact of all leadership
styles on all six outcomes at dimension level is also examined. The level of significance is set at
.05 to test hypotheses and IBM SPSS 22.0 is used for OLS multiple regression.
H2: There is a significant relationship between managers’ self-perceived leadership styles
(transformational, transactional and laissez-faire) and subordinates’ perceived outcomes in
the banking sector of Pakistan.
Figure 10: Relationship between managers’ self-perceived leadership styles and subordinates’
outcomes

87
(continues)
As discussed above, there are three leadership styles (independent variables) and six
outcomes (dependent variables). In order to consider the relationship between leadership styles
with every outcome, the above main hypothesis is divided into sub hypotheses (at leadership
style and dimension level) in relation to six outcome variables. Table 17 presents the summary of
all OLS multiple regression models estimated to examine the relationship between independent
and dependent variables at sub hypotheses level. The summary of significant relationships
between leadership styles and outcomes is shown in Table 30. The results at leadership styles
level indicated that transformational leadership style had significant relationship with satisfaction
and continuance commitment outcome. In addition, the contingent reward was significant
predictor of normative commitment whereas management by exception (passive) was reported as
significant predictor of effectiveness outcome. However, only one demographic (5-8 years
tenure) was found significant predictor of satisfaction outcome. The results at dimension level
indicated that idealized influence (behavior), contingent reward, and management by exception
(passive) had significant relationships with satisfaction, normative commitment, and
effectiveness respectively. In addition, demographic variable ‘gender (female)’ was found as
significant predictor of normative commitment whereas ‘education (less than 16 years degree)’
significantly predicted affective commitment and normative commitment outcomes.
Table 17
Summary of Regression Results for Self-Perceived Leadership Styles and Outcomes
EFF EE SAT ACOM CCOM NCOM
Leadership style level
Transf_L 0.19 0.05 0.39* 0.16 -0.36** 0.18
CR -0.04 0.29 0.03 -0.18 0.17 -0.70**

88
Table 17 (continued)
MBEA 0.25 0.35 0.24 -0.35 0.04 -0.28
MBEP -0.47*** 0.10 -0.13 -0.06 -0.04 0.11
LF 0.07 -0.16 -0.17 -0.07 0.05 -0.34
GEN 0.02 -0.38 -0.65 0.54 0.12 0.74
AGE 0.25 0.13 0.19 0.18 0.04 0.18
EDU -0.07 0.28 0.52 -0.72 -0.17 -0.42
TEN1 -0.02 0.16 -0.05 0.00 -0.03 -0.12
TEN2 -0.07 -0.07 -0.57* -0.23 0.12 -0.15
Dimension level
IIA 0.27 -0.04 -0.12 -0.34 -0.29 -0.08
IIB 0.30 0.39 0.79* 0.37 -0.22 0.50
IM 0.11 0.35 0.28 0.52 -0.09 0.17
IS -0.11 -0.14 -0.10 -0.14 -0.31 0.23
IC 0.00 -0.40 0.20 -0.18 0.12 -0.36
CR -0.09 0.13 -0.17 -0.35 0.18 -0.87**
MBEA 0.09 0.25 0.19 -0.31 0.10 -0.29
MBEP -0.46** 0.08 -0.23 -0.16 -0.11 0.13
LF 0.08 -0.10 -0.09 0.00 0.05 -0.27
GEN -0.01 -0.30 -0.44 0.69 0.13 0.90*
AGE 0.26 0.07 0.24 0.17 0.09 0.10
EDU -0.03 0.11 0.47 -0.93* -0.16 -0.61*
TEN1 -0.09 0.10 -0.05 0.00 -0.02 -0.11
TEN2 -0.07 0.14 -0.42 0.01 0.10 0.08
*p < .05. **p < .01. ***p < .001.
H2a: There is a significant relationship between managers’ self-perceived leadership styles
and effectiveness with their leaders in the banking sector of Pakistan.
In order to assess statistical relationship between managers’ self-perceived leadership
styles and effectiveness, OLS multiple regression model was estimated. Table 18 provides the

89
regression results. The regression equation explained 65% of the total variation in effectiveness.
The regression ANOVA was significant, F (10, 39) = 7.27, p < .001. Parameter estimation
results indicated that management by exception (passive) was the only highly significant
predictor of effectiveness. However, this relationship between management by exception
(passive) and effectiveness was reported as negative, b = -0.47, SE = (0.13), t = -3.73, p = .001,
95% CI: [-0.73, -0.22].
Table 18
Multiple Regression Results for the Effect of Leadership Styles on Effectiveness
B SE t P 95% CI
Transf_L 0.19 0.13 1.50 .143 (-0.07, 0.45)
CR -0.04 0.18 -0.21 .832 (-0.41, 0.33)
MBEA 0.25 0.18 1.38 .176 (-0.12, 0.61)
MBEP -0.47 0.13 -3.73 .001 (-0.73, -0.22)
LF 0.07 0.11 0.63 .534 (-0.15, 0.29)
GEN 0.02 0.24 0.06 .951 (-0.47, 0.5)
AGE 0.25 0.14 1.83 .076 (-0.03, 0.53)
EDU -0.07 0.19 -0.37 .711 (-0.46, 0.32)
TEN1 -0.02 0.15 -0.15 .882 (-0.32, 0.27)
TEN2 -0.07 0.18 -0.39 .695 (-0.42, 0.29)
H2b: There is a significant relationship between managers’ self-perceived leadership styles
and subordinates’ extra effort in the banking sector of Pakistan.
In order to assess statistical relationship between managers’ self-perceived leadership
styles and extra effort, OLS multiple regression model was estimated. Table 19 provides the
regression results. The regression equation explained 44% of the total variation in extra effort.

90
The regression ANOVA was significant, F (10, 39) = 3.11, p = .005. Parameter estimation
results indicated that no self-perceived leadership style was significant predictor of subordinates’
extra effort.
Table 19
Multiple Regression Results for the Effect of Leadership Styles on Extra Effort
B SE t p 95% CI
Transf_L 0.05 0.17 0.31 .761 (-0.28, 0.38)
CR 0.29 0.24 1.24 .223 (-0.18, 0.77)
MBEA 0.35 0.23 1.55 .130 (-0.11, 0.81)
MBEP 0.10 0.16 0.60 .552 (-0.23, 0.42)
LF -0.16 0.14 -1.14 .263 (-0.44, 0.12)
GEN -0.38 0.31 -1.23 .226 (-1.00, 0.24)
AGE 0.13 0.18 0.72 .475 (-0.23, 0.48)
EDU 0.28 0.24 1.14 .263 (-0.22, 0.77)
TEN1 0.16 0.19 0.87 .388 (-0.21, 0.54)
TEN2 -0.07 0.22 -0.30 .768 (-0.52, 0.39)
H2c: There is a significant relationship between managers’ self-perceived leadership styles
and subordinates’ satisfaction in the banking sector of Pakistan.
In order to assess statistical relationship between managers’ self-perceived leadership
styles and satisfaction, OLS multiple regression model was estimated. Table 20 provides the
regression results. The regression equation explained 69% of the total variation in satisfaction.
The regression ANOVA was significant, F (10, 39) = 8.53, p < .001. Parameter estimation
results indicated that transformational leadership and tenure (5-8 years) were significant

91
predictors of satisfaction, b = 0.39, SE = (0.18), t = 2.18, p = .035, 95% CI: [0.03, 0.76] and b = -
0.57, SE = (0.24), t = -2.33, p = .025, 95% CI: [-1.06, -0.08] respectively.
Table 20
Multiple Regression Results for the Effect of Leadership Styles on Satisfaction
b SE t p 95% CI
Transf_L 0.39 0.18 2.18 .035 (0.03, 0.76)
CR 0.03 0.26 0.11 .913 (-0.49, 0.55)
MBEA 0.24 0.25 0.95 .349 (-0.27, 0.74)
MBEP -0.13 0.18 -0.72 .474 (-0.49, 0.23)
LF -0.17 0.15 -1.11 .272 (-0.47, 0.14)
GEN -0.65 0.34 -1.93 .061 (-1.34, 0.03)
AGE 0.19 0.19 0.97 .339 (-0.20, 0.58)
EDU 0.52 0.27 1.95 .058 (-0.02, 1.06)
TEN1 -0.05 0.20 -0.24 .808 (-0.46, 0.36)
TEN2 -0.57 0.24 -2.33 .025 (-1.06, -0.08)
H2d: There is a significant relationship between managers’ self-perceived leadership styles
and subordinates’ affective commitment in the banking sector of Pakistan.
In order to assess statistical relationship between managers’ self-perceived leadership
styles and affective commitment, OLS multiple regression model was estimated. Table 21
provides the regression results. The regression equation explained 14% of the total variation in
affective commitment. The regression ANOVA was insignificant, F (10, 39) = 0.64, p = .772.
Parameter estimation results indicated that no independent variable was significant predictor of
affective commitment.

92
Table 21
Multiple Regression Results for the Effect of Leadership Styles on Affective Commitment
b SE t p 95% CI
Transf_L 0.16 0.24 0.67 .509 (-0.33, 0.65)
CR -0.18 0.34 -0.52 .606 (-0.88, 0.52)
MBEA -0.35 0.33 -1.03 .307 (-1.02, 0.33)
MBEP -0.06 0.24 -0.27 .790 (-0.54, 0.42)
LF -0.07 0.20 -0.35 .732 (-0.48, 0.34)
GEN 0.54 0.45 1.18 .244 (-0.38, 1.45)
AGE 0.18 0.26 0.70 .490 (-0.34, 0.7)
EDU -0.72 0.36 -2.02 .051 (-1.45, 0)
TEN1 0.00 0.27 0.00 .997 (-0.55, 0.56)
TEN2 -0.23 0.33 -0.69 .496 (-0.89, 0.44)
H2e: There is a significant relationship between managers’ self-perceived leadership styles
and subordinates’ continuance commitment in the banking sector of Pakistan.
In order to assess statistical relationship between managers’ self-perceived leadership
styles and continuance commitment, OLS multiple regression model was estimated. Table 22
provides the regression results. The regression equation explained 45% of the total variation in
continuance commitment. The regression ANOVA was significant, F (10, 39) = 3.17, p = .005.
Parameter estimation results indicated that transformational leadership was the only significant
predictor of continuance commitment. However, transformational leadership was negatively
associated with subordinates’ continuance commitment, b = -0.36, SE = (0.11), t = -3.25, p =
.002, 95% CI: [-0.58, -0.14].

93
Table 22
Multiple Regression Results for the Effect of Leadership Styles on Continuance Commitment
b SE t p 95% CI
Transf_L -0.36 0.11 -3.25 .002 (-0.58, -0.14)
CR 0.17 0.16 1.07 .293 (-0.15, 0.49)
MBEA 0.04 0.15 0.24 .810 (-0.27, 0.35)
MBEP -0.04 0.11 -0.32 .752 (-0.25, 0.19)
LF 0.05 0.09 0.52 .604 (-0.14, 0.24)
GEN 0.12 0.21 0.58 .567 (-0.30, 0.54)
AGE 0.04 0.12 0.33 .741 (-0.20, 0.28)
EDU -0.17 0.16 -1.03 .309 (-0.50, 0.16)
TEN1 -0.03 0.13 -0.23 .817 (-0.28, 0.22)
TEN2 0.12 0.15 0.78 .442 (-0.19, 0.42)
H2f: There is a significant relationship between managers’ self-perceived leadership styles
and subordinates’ normative commitment in the banking sector of Pakistan.
In order to assess statistical relationship between managers’ self-perceived leadership
styles and normative commitment, OLS multiple regression model was estimated. Table 23
provides the regression results. The regression equation explained 33% of the total variation in
normative commitment. The regression ANOVA was significant, F (10, 39) = 1.94, p = .069.
Parameter estimation results indicated that contingent reward, laissez-faire leadership and gender
(female) were significant predictors of normative commitment. However, contingent reward and
laissez-faire leadership were negatively associated with normative commitment, b = -0.70, SE =
(0.26), t = -2.70, p = .01, 95% CI: [-1.22, -0.18] and b = -0.34, SE = (0.15), t = -2.21, p = .033,
95% CI: [-0.64, -0.03] whereas the relationship between gender (female) and normative

94
commitment was reported as positive, b = 0.74, SE = (0.34), t = 2.17, p = .036, 95% CI: [0.05,
1.42].
Table 23
Multiple Regression Results for the Effect of Leadership Styles on Normative Commitment
b SE t p 95% CI
Transf_L 0.18 0.18 0.97 .337 (-0.19, 0.54)
CR -0.70 0.26 -2.70 .010 (-1.22, -0.18)
MBEA -0.28 0.25 -1.12 .270 (-0.79, 0.23)
MBEP 0.11 0.18 0.64 .527 (-0.25, 0.47)
LF -0.34 0.15 -2.21 .033 (-0.64, -0.03)
GEN 0.74 0.34 2.17 .036 (0.05, 1.42)
AGE 0.18 0.19 0.93 .359 (-0.21, 0.57)
EDU -0.42 0.27 -1.56 .126 (-0.96, 0.12)
TEN1 -0.12 0.21 -0.60 .555 (-0.54, 0.29)
TEN2 -0.15 0.25 -0.59 .559 (-0.64, 0.35)
H2g: There is a significant relationship between managers’ self-perceived leadership styles
(at dimension level) and subordinates’ perception about managers’ effectiveness in the
banking sector of Pakistan.
In order to assess statistical relationship between dimensions of managers’ self-perceived
leadership styles and effectiveness, OLS multiple regression model was estimated. Table 24
provides the regression results. The regression equation explained 68% of the total variation in
effectiveness. The regression ANOVA was significant, F (14, 35) = 5.25, p < .001. Parameter
estimation results indicated that management by exception (passive) was the only significant
predictor of effectiveness. However, the association between management by exception (passive)

95
and effectiveness was reported as negative, b = -0.46, SE = (0.14), t = -3.35, p = .002, 95% CI: [-
0.74, -0.18].
Table 24
Multiple Regression Results for the Effect of Dimensions of Leadership Styles on Effectiveness
b SE t p 95% CI
IIA 0.27 0.18 1.45 .155 (-0.11, 0.64)
IIB 0.30 0.22 1.32 .196 (-0.16, 0.75)
IM 0.11 0.18 0.58 .567 (-0.26, 0.47)
IS -0.11 0.22 -0.49 .628 (-0.54, 0.33)
IC 0.00 0.20 0.01 .993 (-0.41, 0.42)
CR -0.09 0.20 -0.43 .668 (-0.49, 0.32)
MBEA 0.09 0.20 0.46 .651 (-0.32, 0.51)
MBEP -0.46 0.14 -3.35 .002 (-0.74, -0.18)
LF 0.08 0.11 0.68 .503 (-0.15, 0.31)
GEN -0.01 0.26 -0.02 .984 (-0.53, 0.52)
AGE 0.26 0.15 1.73 .093 (-0.05, 0.56)
EDU -0.03 0.21 -0.12 .905 (-0.45, 0.4)
TEN1 -0.09 0.16 -0.57 .571 (-0.41, 0.23)
TEN2 -0.07 0.20 -0.36 .719 (-0.47, 0.33)
H2h: There is a significant relationship between managers’ self-perceived leadership styles
(at dimension level) and subordinates’ extra effort in the banking sector of Pakistan.
In order to assess statistical relationship between dimensions of managers’ self-perceived
leadership styles and extra effort, OLS multiple regression model was estimated. Table 25
provides the regression results. The regression equation explained 52% of the total variation in
extra effort. The regression ANOVA was significant, F (14, 35) = 2.73, p = .008. Parameter
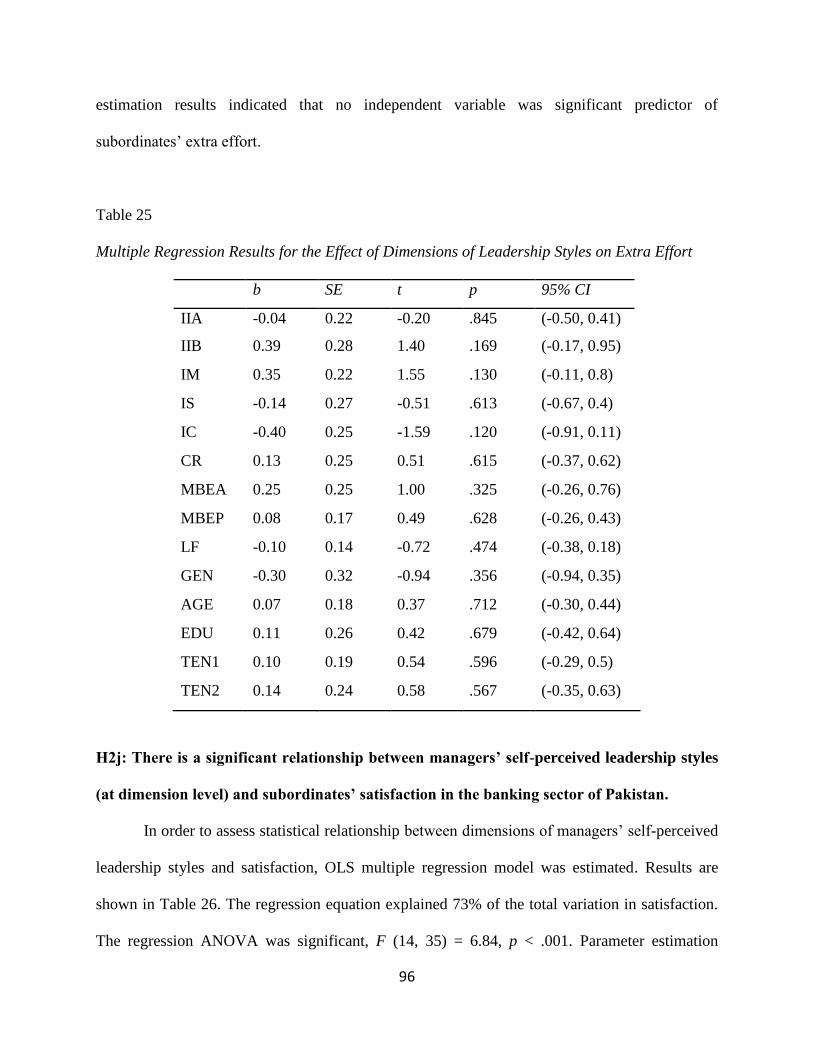
96
estimation results indicated that no independent variable was significant predictor of
subordinates’ extra effort.
Table 25
Multiple Regression Results for the Effect of Dimensions of Leadership Styles on Extra Effort
b SE t p 95% CI
IIA -0.04 0.22 -0.20 .845 (-0.50, 0.41)
IIB 0.39 0.28 1.40 .169 (-0.17, 0.95)
IM 0.35 0.22 1.55 .130 (-0.11, 0.8)
IS -0.14 0.27 -0.51 .613 (-0.67, 0.4)
IC -0.40 0.25 -1.59 .120 (-0.91, 0.11)
CR 0.13 0.25 0.51 .615 (-0.37, 0.62)
MBEA 0.25 0.25 1.00 .325 (-0.26, 0.76)
MBEP 0.08 0.17 0.49 .628 (-0.26, 0.43)
LF -0.10 0.14 -0.72 .474 (-0.38, 0.18)
GEN -0.30 0.32 -0.94 .356 (-0.94, 0.35)
AGE 0.07 0.18 0.37 .712 (-0.30, 0.44)
EDU 0.11 0.26 0.42 .679 (-0.42, 0.64)
TEN1 0.10 0.19 0.54 .596 (-0.29, 0.5)
TEN2 0.14 0.24 0.58 .567 (-0.35, 0.63)
H2j: There is a significant relationship between managers’ self-perceived leadership styles
(at dimension level) and subordinates’ satisfaction in the banking sector of Pakistan.
In order to assess statistical relationship between dimensions of managers’ self-perceived
leadership styles and satisfaction, OLS multiple regression model was estimated. Results are
shown in Table 26. The regression equation explained 73% of the total variation in satisfaction.
The regression ANOVA was significant, F (14, 35) = 6.84, p < .001. Parameter estimation

97
results indicated that idealized influence (behavioral) was the only significant predictor of
satisfaction, b = 0.79, SE = (0.30), t = 2.65, p = .012, 95% CI: [0.19, 1.40].
Table 26
Multiple Regression Results for the Effect of Dimensions of Leadership Styles on Satisfaction
b SE t p 95% CI
IIA -0.12 0.24 -0.49 .630 (-0.62, 0.38)
IIB 0.79 0.30 2.65 .012 (0.19, 1.4)
IM 0.28 0.24 1.17 .251 (-0.21, 0.78)
IS -0.10 0.29 -0.34 .737 (-0.69, 0.49)
IC 0.20 0.27 0.75 .461 (-0.35, 0.76)
CR -0.17 0.27 -0.63 .533 (-0.71, 0.37)
MBEA 0.19 0.27 0.68 .501 (-0.37, 0.74)
MBEP -0.23 0.19 -1.26 .217 (-0.61, 0.14)
LF -0.09 0.15 -0.61 .548 (-0.40, 0.22)
GEN -0.44 0.35 -1.27 .211 (-1.15, 0.26)
AGE 0.24 0.20 1.22 .231 (-0.16, 0.64)
EDU 0.47 0.28 1.65 .107 (-0.11, 1.04)
TEN1 -0.05 0.21 -0.25 .808 (-0.48, 0.38)
TEN2 -0.42 0.26 -1.60 .118 (-0.96, 0.11)
H2k: There is a significant relationship between managers’ self-perceived leadership styles
(at dimension level) and subordinates’ affective commitment in the banking sector of
Pakistan.
In order to assess statistical relationship between dimensions of managers’ self-perceived
leadership styles and affective commitment, OLS multiple regression model was estimated.
Table 27 provides the regression results. The regression equation explained 22% of the total

98
variation in affective commitment. The regression ANOVA was insignificant, F (14, 35) = 0.68,
p = .775. Parameter estimation results indicated that education (16 years or above) was the only
significant predictor of affective commitment. However, the relationship between education (16
years or above) and affective commitment was reported as negative, b = -0.93, SE = (0.39), t = -
2.36, p = .024, 95% CI: [-1.73, -0.13].
Table 27
Multiple Regression Results for the Effect of Dimensions of Leadership Styles on Affective
Commitment
b SE t p 95% CI
IIA -0.34 0.34 -0.99 .330 (-1.02, 0.35)
IIB 0.37 0.42 0.89 .379 (-0.48, 1.22)
IM 0.52 0.34 1.55 .130 (-0.16, 1.21)
IS -0.14 0.40 -0.34 .740 (-0.95, 0.68)
IC -0.18 0.38 -0.46 .646 (-0.95, 0.6)
CR -0.35 0.37 -0.95 .351 (-1.11, 0.4)
MBEA -0.31 0.38 -0.81 .422 (-1.08, 0.46)
MBEP -0.16 0.26 -0.62 .541 (-0.68, 0.36)
LF 0.00 0.21 -0.01 .989 (-0.43, 0.43)
GEN 0.69 0.48 1.44 .159 (-0.28, 1.67)
AGE 0.17 0.28 0.62 .540 (-0.39, 0.73)
EDU -0.93 0.39 -2.36 .024 (-1.73, -0.13)
TEN1 0.00 0.29 -0.01 .994 (-0.60, 0.59)
TEN2 0.01 0.37 0.02 .987 (-0.74, 0.75)

99
(continues)
H2m: There is a significant relationship between managers’ self-perceived leadership styles
(at dimension level) and subordinates’ continuance commitment in the banking sector of
Pakistan.
In order to assess statistical relationship between dimensions of managers’ self-perceived
leadership styles and continuance commitment, OLS multiple regression model was estimated.
Table 28 provides the regression results. The regression equation explained 50% of the total
variation in continuance commitment. The regression ANOVA was significant, F (14, 35) =
2.52, p = .013. Parameter estimation results indicated that no independent variable was
significant predictor of subordinates’ continuance commitment.
Table 28
Multiple Regression Results for the Effect of Dimensions of Leadership Styles on Continuance
Commitment
b SE t p 95% CI
IIA -0.29 0.15 -1.89 .067 (-0.61, 0.02)
IIB -0.22 0.19 -1.13 .265 (-0.60, 0.17)
IM -0.09 0.15 -0.57 .571 (-0.40, 0.22)
IS -0.31 0.18 -1.70 .097 (-0.68, 0.06)
IC 0.12 0.17 0.70 .490 (-0.23, 0.47)
CR 0.18 0.17 1.08 .290 (-0.16, 0.53)
MBEA 0.10 0.17 0.56 .580 (-0.26, 0.45)
MBEP -0.11 0.12 -0.91 .367 (-0.35, 0.13)
LF 0.05 0.10 0.48 .638 (-0.15, 0.24)
GEN 0.13 0.22 0.59 .557 (-0.32, 0.58)
AGE 0.09 0.13 0.75 .460 (-0.16, 0.35)
EDU -0.16 0.18 -0.90 .372 (-0.52, 0.2)
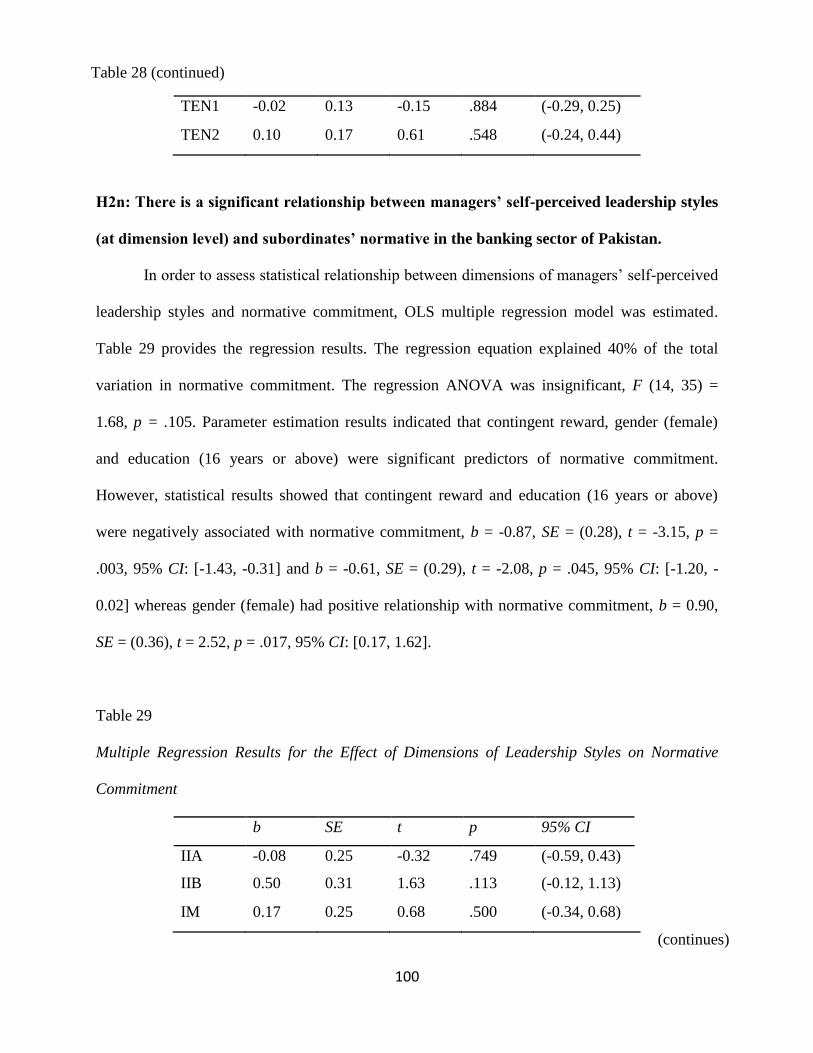
100
Table 28 (continued)
(continues)
TEN1 -0.02 0.13 -0.15 .884 (-0.29, 0.25)
TEN2 0.10 0.17 0.61 .548 (-0.24, 0.44)
H2n: There is a significant relationship between managers’ self-perceived leadership styles
(at dimension level) and subordinates’ normative in the banking sector of Pakistan.
In order to assess statistical relationship between dimensions of managers’ self-perceived
leadership styles and normative commitment, OLS multiple regression model was estimated.
Table 29 provides the regression results. The regression equation explained 40% of the total
variation in normative commitment. The regression ANOVA was insignificant, F (14, 35) =
1.68, p = .105. Parameter estimation results indicated that contingent reward, gender (female)
and education (16 years or above) were significant predictors of normative commitment.
However, statistical results showed that contingent reward and education (16 years or above)
were negatively associated with normative commitment, b = -0.87, SE = (0.28), t = -3.15, p =
.003, 95% CI: [-1.43, -0.31] and b = -0.61, SE = (0.29), t = -2.08, p = .045, 95% CI: [-1.20, -
0.02] whereas gender (female) had positive relationship with normative commitment, b = 0.90,
SE = (0.36), t = 2.52, p = .017, 95% CI: [0.17, 1.62].
Table 29
Multiple Regression Results for the Effect of Dimensions of Leadership Styles on Normative
Commitment
b SE t p 95% CI
IIA -0.08 0.25 -0.32 .749 (-0.59, 0.43)
IIB 0.50 0.31 1.63 .113 (-0.12, 1.13)
IM 0.17 0.25 0.68 .500 (-0.34, 0.68)

101
Table 29 (continued)
IS 0.23 0.30 0.76 .451 (-0.38, 0.83)
IC -0.36 0.28 -1.29 .205 (-0.94, 0.21)
CR -0.87 0.28 -3.15 .003 (-1.43, -0.31)
MBEA -0.29 0.28 -1.04 .306 (-0.87, 0.28)
MBEP 0.13 0.19 0.69 .493 (-0.26, 0.52)
LF -0.27 0.16 -1.72 .095 (-0.59, 0.05)
GEN 0.90 0.36 2.52 .017 (0.17, 1.62)
AGE 0.10 0.20 0.49 .627 (-0.31, 0.51)
EDU -0.61 0.29 -2.08 .045 (-1.20, -0.02)
TEN1 -0.11 0.22 -0.49 .625 (-0.55, 0.33)
TEN2 0.08 0.27 0.29 .777 (-0.47, 0.63)
Table 30
Summary of Significant Relationships between Leadership Styles and Outcomes (Managers’
Perceptions)
Significant relationships
Leadership style level
Transformational leadership style and satisfaction
Transformational leadership style and continuance commitment
Dimension level
Idealized influence (behavior)and satisfaction
Contingent reward and normative commitment
Management by exception (passive) and effectiveness

102
4.07 Relationship between Managers’ Leadership Styles (as Perceived by
Subordinates) and Outcomes (Level 3)
This section is about the relationship of managers’ leadership styles (as perceived by
subordinates) with their outcomes. The relationship of three main independent variables
(transformational leadership, transactional leadership, and laissez-faire leadership) with six
outcome variables (leader effectiveness, extra effort, satisfaction, affective commitment,
continuance commitment and normative commitment) is examined. In addition, the impact of all
leadership styles on all six outcomes at dimension level is also examined. In order to consider the
demographics, two different regression models are run: with demographics and without
demographics. The level of significance is set at .05 to test hypotheses and IBM SPSS 22.0 is
used for multiple regression.
H3: There is a significant relationship between managers’ leadership styles as perceived by
subordinates and their performance outcomes in the banking sector of Pakistan.
Figure 11: Relationship between managers’ leadership styles (as perceived by subordinates)
and outcomes

103
As discussed above, there are three leadership styles (independent variables) and six
outcomes (dependent variables). In order to consider the relationship between leadership styles
with every outcome, the above main hypothesis is divided into sub hypotheses (at leadership
style and dimension level) in relation to six outcome variables. Table 31 presents the summary of
all OLS multiple regression models estimated to examine the relationship between independent
and dependent variables at sub hypotheses level. The summary of significant relationships
between leadership styles and outcomes is shown in Table 44. The results at leadership styles
level indicated that transformational leadership style had significant relationship with
effectiveness, extra effort, satisfaction, and affective commitment. Laissez-faire leadership style
had significant relationship with effectiveness, satisfaction, and affective commitment. In
addition, gender (female) was found significant predictor of effectiveness and normative
commitment. Moreover, contingent reward and tenure (5-8 years) were found significant
predictors of satisfaction and continuance commitment respectively. The results at dimension
level indicated that idealized influence (attributed) and gender (female) were significant
predictors of effectiveness whereas idealized influence (behavior) was significant predictors of
effectiveness and extra effort. Inspirational motivation was found as highly significant predictor
of extra effort. In addition, intellectual stimulation has significant relationship with extra effort
and satisfaction; contingent reward with satisfaction; management by exception (active) with
normative commitment; laissez-faire leadership with effectiveness, satisfaction, and affective
commitment; and tenure (9 years or above) had significant relationship with affective
commitment.

104
Table 31
Summary of Regression Results for Subordinates’ Perceived Leadership Styles and Outcomes
EFF EE SAT ACOM CCOM NCOM
Leadership style level
Transf_L 0.36*** 0.41*** 0.23* 0.12* 0.03 0.13
CR 0.15 0.13 0.37* 0.00 0.10 0.05
MBEA -0.07 -0.01 0.03 -0.02 -0.05 -0.22*
MBEP 0.00 0.05 -0.01 -0.03 0.03 -0.07
LF -0.20** -0.06 -0.41** -0.16* -0.01 0.10
GEN 0.33*** 0.08 -0.12 0.10 -0.05 0.21*
AGE -0.05 -0.18 -0.04 0.11 0.14 -0.02
EDU 0.17 0.11 0.19 -0.05 0.24 -0.08
TEN1 -0.14 -0.16 -0.21 -0.07 0.10 -0.03
TEN2 -0.01 -0.14 -0.01 -0.03 0.44** 0.15
Dimension level
IIA 0.27** 0.00 0.26 0.01 0.07 0.09
IIB 0.22* 0.22* 0.26 0.05 0.01 0.06
IM 0.08 0.43*** 0.23 0.05 -0.02 0.06
IS 0.10 0.21** 0.33* 0.09 -0.06 -0.04
IC -0.02 -0.06 -0.18 0.06 0.03 0.06
CR 0.16 0.12 0.35* -0.01 0.10 0.05
MBEA -0.05 0.05 0.10 -0.02 -0.06 -0.23*
MBEP 0.01 0.11 0.05 -0.03 0.02 -0.08
LF -0.19* -0.03 -0.38** -0.17* -0.01 0.10
GEN 0.34*** 0.10 -0.07 0.12 -0.06 0.20
AGE -0.03 -0.19 -0.02 0.10 0.15 -0.02
EDU 0.17 0.10 0.14 -0.07 0.26 -0.06
TEN1 -0.16 -0.07 -0.12 -0.06 0.07 -0.04
TEN2 0.00 -0.16 -0.04 -0.04 0.44** 0.15
*p < .05. **p < .01. ***p < .001.

105
(continues)
H3a: There is a significant relationship between managers’ leadership styles as perceived
by subordinates and their perception about managers’ effectiveness in the banking sector
of Pakistan.
In order to assess statistical relationship between managers’ leadership styles and
effectiveness, OLS multiple regression model was estimated. Table 32 provides the regression
results. The regression equation explained 41% of the total variation in effectiveness. The
regression ANOVA was significant, F (10, 180) = 12.26, p < .001. Parameter estimation results
indicated that transformational leadership style, laissez-faire leadership style and gender (female)
were significant predictors of effectiveness. However, laissez-faire leadership had negative
relationship, b = -0.20, SE = (0.07), t = -2.71, p < .001, 95% CI: [-0.34, -0.05] whereas
transformational leadership style and gender (female) were positively associated with
effectiveness, b = 0.36, SE = (0.06), t = 5.60, p < .001, 95% CI: [0.23, 0.49] and b = 0.33, SE =
(0.08), t = 4.05, p < .001, 95% CI: [0.17, 0.49] respectively.
Table 32
Multiple Regression Results for the Effect of Leadership Styles on Effectiveness
B SE t p 95% CI
Transf_L 0.36 0.06 5.60 <.001 (0.23, 0.49)
CR 0.15 0.09 1.67 .096 (-0.03, 0.32)
MBEA -0.07 0.07 -0.99 .326 (-0.21, 0.07)
MBEP 0.00 0.06 0.00 .998 (-0.12, 0.12)
LF -0.20 0.07 -2.71 .007 (-0.34, -0.05)
GEN 0.33 0.08 4.05 <.001 (0.17, 0.49)
AGE -0.05 0.15 -0.35 .725 (-0.34, 0.24)
EDU 0.17 0.12 1.49 .138 (-0.06, 0.4)

106
Table 32 (continued)
TEN1 -0.14 0.08 -1.67 .096 (-0.31, 0.03)
TEN2 -0.01 0.12 -0.05 .960 (-0.23, 0.22)
H3b: There is a significant relationship between managers’ leadership styles as perceived
by subordinates and their willingness to exert extra effort in the banking sector of
Pakistan.
In order to assess statistical relationship between managers’ leadership styles and Extra
effort, OLS multiple regression model was estimated. Table 33 provides the regression results.
The regression equation explained 39% of the total variation in extra effort. The regression
ANOVA was significant, F (10, 180) = 11.47, p < .001. Parameter estimation results indicated
that transformational leadership was the only significant predictor of extra effort, b = 0.41, SE =
(0.07), t = 5.58, p < .001, 95% CI: [0.26, 0.55].
Table 33
Multiple Regression Results for the Effect of Leadership Styles on Extra Effort
B SE t p 95% CI
Transf_L 0.41 0.07 5.58 <.001 (0.26, 0.55)
CR 0.13 0.10 1.27 .207 (-0.07, 0.32)
MBEA -0.01 0.08 -0.08 .933 (-0.16, 0.15)
MBEP 0.05 0.07 0.73 .465 (-0.09, 0.19)
LF -0.06 0.08 -0.72 .475 (-0.23, 0.11)
GEN 0.08 0.09 0.89 .373 (-0.10, 0.26)
AGE -0.18 0.17 -1.11 .270 (-0.51, 0.14)
EDU 0.11 0.13 0.81 .420 (-0.15, 0.37)
TEN1 -0.16 0.10 -1.72 .087 (-0.35, 0.02)
TEN2 -0.14 0.13 -1.09 .276 (-0.40, 0.12)

107
(continues)
H3c: There is a significant relationship between managers’ leadership styles as perceived
by subordinates and their satisfaction in the banking sector of Pakistan.
In order to assess statistical relationship between managers’ leadership styles and
satisfaction, OLS multiple regression model was estimated. Table 34 provides the regression
results. The regression equation explained 22% of the total variation in satisfaction. The
regression ANOVA was significant, F (10, 180) = 5.11, p < .001. Parameter estimation results
indicated that transformational leadership, contingent reward, and laissez-faire leadership were
significant predictors of satisfaction. However, transformational leadership and contingent
reward had positive association with satisfaction, b = 0.23, SE = (0.11), t = 2.02, p = .045, 95%
CI: [0.01, 0.46] and b = 0.37, SE = (0.16), t = 2.38, p = .019, 95% CI: [0.06, 0.68] respectively
whereas laissez-faire leadership had negative relationship with satisfaction, b = -0.41, SE =
(0.13), t = -3.14, p = .002, 95% CI: [-0.67, -0.15].
Table 34
Multiple Regression Results for the Effect of Leadership Styles on Satisfaction
b SE t p 95% CI
Transf_L 0.23 0.11 2.02 .045 (0.01, 0.46)
CR 0.37 0.16 2.38 .019 (0.06, 0.68)
MBEA 0.03 0.12 0.24 .814 (-0.22, 0.27)
MBEP -0.01 0.11 -0.12 .904 (-0.23, 0.21)
LF -0.41 0.13 -3.14 .002 (-0.67, -0.15)
GEN -0.12 0.14 -0.87 .387 (-0.41, 0.16)
AGE -0.04 0.26 -0.15 .883 (-0.55, 0.47)
EDU 0.19 0.21 0.92 .361 (-0.22, 0.59)
TEN1 -0.21 0.15 -1.42 .156 (-0.51, 0.08)
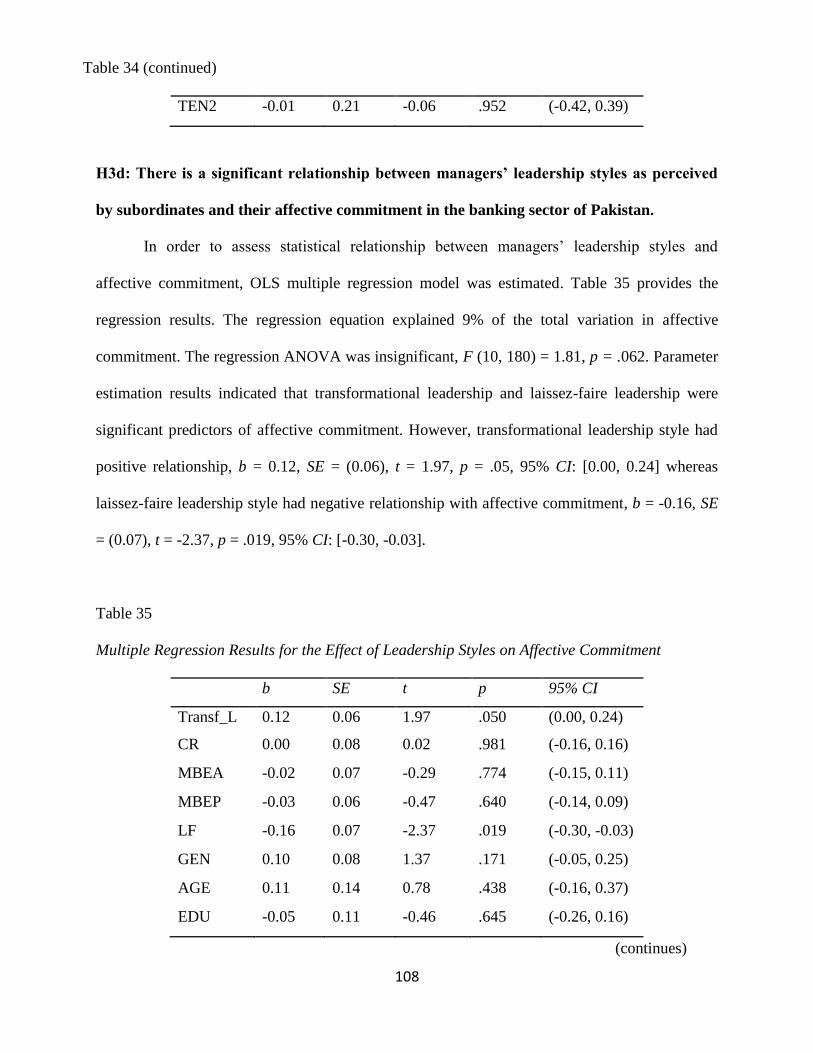
108
Table 34 (continued)
(continues)
TEN2 -0.01 0.21 -0.06 .952 (-0.42, 0.39)
H3d: There is a significant relationship between managers’ leadership styles as perceived
by subordinates and their affective commitment in the banking sector of Pakistan.
In order to assess statistical relationship between managers’ leadership styles and
affective commitment, OLS multiple regression model was estimated. Table 35 provides the
regression results. The regression equation explained 9% of the total variation in affective
commitment. The regression ANOVA was insignificant, F (10, 180) = 1.81, p = .062. Parameter
estimation results indicated that transformational leadership and laissez-faire leadership were
significant predictors of affective commitment. However, transformational leadership style had
positive relationship, b = 0.12, SE = (0.06), t = 1.97, p = .05, 95% CI: [0.00, 0.24] whereas
laissez-faire leadership style had negative relationship with affective commitment, b = -0.16, SE
= (0.07), t = -2.37, p = .019, 95% CI: [-0.30, -0.03].
Table 35
Multiple Regression Results for the Effect of Leadership Styles on Affective Commitment
b SE t p 95% CI
Transf_L 0.12 0.06 1.97 .050 (0.00, 0.24)
CR 0.00 0.08 0.02 .981 (-0.16, 0.16)
MBEA -0.02 0.07 -0.29 .774 (-0.15, 0.11)
MBEP -0.03 0.06 -0.47 .640 (-0.14, 0.09)
LF -0.16 0.07 -2.37 .019 (-0.30, -0.03)
GEN 0.10 0.08 1.37 .171 (-0.05, 0.25)
AGE 0.11 0.14 0.78 .438 (-0.16, 0.37)
EDU -0.05 0.11 -0.46 .645 (-0.26, 0.16)

109
Table 35 (continued)
TEN1 -0.07 0.08 -0.93 .354 (-0.23, 0.08)
TEN2 -0.03 0.11 -0.29 .770 (-0.24, 0.18)
H3e: There is a significant relationship between managers’ leadership styles as perceived
by subordinates and their continuance commitment in the banking sector of Pakistan.
In order to assess statistical relationship between managers’ leadership styles and
continuance commitment, OLS multiple regression model was estimated. Table 36 provides the
regression results. The regression equation explained 11% of the total variation in continuance
commitment. The regression ANOVA was significant, F (10, 180) = 2.25, p = .017. Parameter
estimation results indicated that tenure (9 years tenure or above) was the only significant
predictor of continuance commitment, b = 0.44, SE = (0.13), t = 3.37, p = .001, 95% CI: [0.18,
0.69].
Table 36
Multiple Regression Results for the Effect of Leadership Styles on Continuance Commitment
b SE t p 95% CI
Transf_L 0.03 0.07 0.41 .681 (-0.11, 0.17)
CR 0.10 0.10 0.98 .328 (-0.10, 0.29)
MBEA -0.05 0.08 -0.66 .511 (-0.21, 0.1)
MBEP 0.03 0.07 0.40 .687 (-0.11, 0.17)
LF -0.01 0.08 -0.06 .952 (-0.17, 0.16)
GEN -0.05 0.09 -0.57 .569 (-0.23, 0.13)
AGE 0.14 0.16 0.86 .389 (-0.18, 0.46)
EDU 0.24 0.13 1.87 .063 (-0.01, 0.5)
TEN1 0.10 0.09 1.01 .314 (-0.09, 0.28)
TEN2 0.44 0.13 3.37 .001 (0.18, 0.69)

110
H3f: There is a significant relationship between managers’ leadership styles as perceived
by subordinates and their normative commitment in the banking sector of Pakistan.
In order to assess statistical relationship between managers’ leadership styles and
normative commitment, OLS multiple regression model was estimated. Table 37 provides the
regression results. The regression equation explained 7% of the total variation in normative
commitment. The regression ANOVA was insignificant, F (10, 180) = 1.40, p = .182. Parameter
estimation results indicated that management by exception (active) and gender (female) were
significant predictors of normative commitment, b = -0.22, SE = (0.09), t = -2.52, p = .013, 95%
CI: [-0.40, -0.05] and b = 0.21, SE = (0.10), t = 2.02, p = .045, 95% CI: [0.01, 0.41] respectively.
However, the statistical relationship between management by exception (active) and normative
commitment was reported as negative.
Table 37
Multiple Regression Results for the Effect of Leadership Styles on Normative Commitment
b SE t p 95% CI
Transf_L 0.13 0.08 1.57 .118 (-0.03, 0.29)
CR 0.05 0.11 0.45 .651 (-0.17, 0.27)
MBEA -0.22 0.09 -2.52 .013 (-0.40, -0.05)
MBEP -0.07 0.08 -0.85 .398 (-0.23, 0.09)
LF 0.10 0.09 1.09 .278 (-0.08, 0.29)
GEN 0.21 0.10 2.02 .045 (0.01, 0.41)
AGE -0.02 0.19 -0.13 .896 (-0.39, 0.34)
EDU -0.08 0.15 -0.54 .592 (-0.37, 0.21)
TEN1 -0.03 0.11 -0.29 .772 (-0.24, 0.18)
TEN2 0.15 0.15 0.99 .322 (-0.14, 0.44)

111
(continues)
H3g: There is a significant relationship between managers’ leadership styles (at dimension
level) as perceived by subordinates and their perception about managers’ effectiveness in
the banking sector of Pakistan.
In order to assess statistical relationship between dimensions of managers’ leadership
styles and effectiveness, OLS multiple regression model was estimated. Table 38 provides the
regression results. The regression equation explained 42% of the total variation in effectiveness.
The regression ANOVA was significant, F (14, 176) = 9.18, p < .001. Parameter estimation
results indicated that idealized influence (attributed), idealized influence (behavioral), laissez-
faire leadership, and gender (female) were significant predictors of effectiveness, b = 0.27, SE =
(0.08), t = 3.26, p = .001, 95% CI: [0.11, 0.43], b = 0.22, SE = (0.09), t = 2.49, p = .014, 95% CI:
[0.05, 0.39], b = -0.19, SE = (0.07), t = -2.54, p = .012, 95% CI: [-0.33, -0.04], and b = 0.34, SE
= (0.08), t = 4.09, p < .001, 95% CI: [0.17, 0.50] respectively. However, laissez-faire leadership
was reported as negative predictor of effectiveness.
Table 38
Multiple Regression Results for the Effect of Dimensions of Leadership Styles on Effectiveness
b SE T p (95% CI )
IIA 0.27 0.08 3.26 .001 (0.11, 0.43)
IIB 0.22 0.09 2.49 .014 (0.05, 0.39)
IM 0.08 0.09 0.97 .333 (-0.09, 0.25)
IS 0.10 0.07 1.35 .180 (-0.05, 0.24)
IC -0.02 0.08 -0.24 .809 (-0.17, 0.13)
CR 0.16 0.09 1.85 .066 (-0.01, 0.34)
MBEA -0.05 0.07 -0.74 .461 (-0.19, 0.09)
MBEP 0.01 0.06 0.08 .938 (-0.12, 0.13)

112
Table 38 (continued)
(continues)
LF -0.19 0.07 -2.54 .012 (-0.33, -0.04)
GEN 0.34 0.08 4.09 <.001 (0.17, 0.5)
AGE -0.03 0.15 -0.19 .853 (-0.32, 0.26)
EDU 0.17 0.12 1.44 .152 (-0.06, 0.4)
TEN1 -0.16 0.09 -1.84 .068 (-0.33, 0.01)
TEN2 0.00 0.12 0.02 .985 (-0.23, 0.23)
H3h: There is a significant relationship between managers’ leadership styles (at dimension
level) as perceived by subordinates and their willingness to exert extra effort in the banking
sector of Pakistan.
In order to assess statistical relationship between dimensions of managers’ leadership
styles and extra effort, OLS multiple regression model was estimated. Table 39 provides the
regression results. The regression equation explained 45% of the total variation in extra effort.
The regression ANOVA was significant, F (14, 176) = 10.27, p < .001. Parameter estimation
results indicated that idealized influence (behavioral), inspirational motivation, and intellectual
stimulation were significant predictors of extra effort, b = 0.22, SE = (0.10), t = 2.27, p = .025,
95% CI: [0.03, 0.41]; b = 0.43, SE = (0.10), t = 4.56, p < .001, 95% CI: [0.25, 0.62]; and b =
0.21, SE = (0.08), t = 2.67, p = .008, 95% CI: [0.06, 0.37] respectively.
Table 39
Multiple Regression Results for the Effect of Dimensions of Leadership Styles on Extra Effort
b SE t p (95% CI )
IIA 0.00 0.09 -0.02 .985 (-0.18, 0.18)
IIB 0.22 0.10 2.27 .025 (0.03, 0.41)
IM 0.43 0.10 4.56 <.001 (0.25, 0.62)
IS 0.21 0.08 2.67 .008 (0.06, 0.37)

113
Table 39 (continued)
IC -0.06 0.08 -0.71 .479 (-0.22, 0.1)
CR 0.12 0.10 1.19 .236 (-0.08, 0.31)
MBEA 0.05 0.08 0.59 .558 (-0.11, 0.2)
MBEP 0.11 0.07 1.57 .119 (-0.03, 0.25)
LF -0.03 0.08 -0.38 .707 (-0.19, 0.13)
GEN 0.10 0.09 1.08 .281 (-0.08, 0.27)
AGE -0.19 0.16 -1.16 .248 (-0.50, 0.13)
EDU 0.10 0.13 0.77 .440 (-0.16, 0.36)
TEN1 -0.07 0.10 -0.71 .478 (-0.25, 0.12)
TEN2 -0.16 0.13 -1.24 .216 (-0.41, 0.09)
H3j: There is a significant relationship between managers’ leadership styles (at dimension
level) as perceived by subordinates and their satisfaction in the banking sector of Pakistan.
In order to assess statistical relationship between dimensions of managers’ leadership
styles and satisfaction, OLS multiple regression model was estimated. Table 40 provides the
regression results. The regression equation explained 28% of the total variation in satisfaction.
The regression ANOVA was significant, F (14, 176) = 4.84, p < .001. Parameter estimation
results indicated that intellectual stimulation, contingent reward, and laissez-faire leadership
were the significant predictors of satisfaction, b = 0.33, SE = (0.13), t = 2.59, p = .01, 95% CI:
[0.08, 0.58]; b = 0.35, SE = (0.15), t = 2.28, p = .024, 95% CI: [0.05, 0.65]; and b = -0.38, SE =
(0.13), t = -2.92, p = .004, 95% CI: [-0.63, -0.12] respectively. However, laissez-faire leadership
was reported as negative predictor of satisfaction.

114
Table 40
Multiple Regression Results for the Effect of Dimensions of Leadership Styles on Satisfaction
b SE t p (95% CI )
IIA 0.26 0.14 -0.95 .345 (-0.42, 0.15)
IIB 0.26 0.15 1.71 .089 (-0.04, 0.57)
IM 0.23 0.15 1.54 .125 (-0.07, 0.53)
IS 0.33 0.13 2.59 .010 (0.08, 0.58)
IC -0.18 0.13 -1.35 .180 (-0.43, 0.08)
CR 0.35 0.15 2.28 .024 (0.05, 0.65)
MBEA 0.10 0.12 0.83 .408 (-0.14, 0.35)
MBEP 0.05 0.11 0.45 .654 (-0.17, 0.27)
LF -0.38 0.13 -2.92 .004 (-0.63, -0.12)
GEN -0.07 0.14 -0.48 .630 (-0.35, 0.21)
AGE -0.02 0.26 -0.07 .946 (-0.52, 0.49)
EDU 0.14 0.21 0.69 .489 (-0.26, 0.55)
TEN1 -0.12 0.15 -0.78 .436 (-0.41, 0.18)
TEN2 -0.04 0.20 -0.20 .845 (-0.44, 0.36)
H3k: There is a significant relationship between managers’ leadership styles (at dimension
level) as perceived by subordinates and their affective commitment in the banking sector of
Pakistan.
In order to assess statistical relationship between dimensions of managers’ leadership
styles and affective commitment, OLS multiple regression model was estimated. Table 41
provides the regression results. The regression equation explained 10% of the total variation in
affective commitment. The regression ANOVA was insignificant, F (14, 176) = 1.37, p = .170.
Parameter estimation results indicated that laissez-faire leadership was only significant but

115
negative predictor of affective commitment, b = -0.17, SE = (0.07), t = -2.40, p = .018, 95% CI:
[-0.31, -0.03].
Table 41
Multiple Regression Results for the Effect of Dimensions of Leadership Styles on Affective
Commitment
b SE t p (95% CI )
IIA 0.01 0.08 0.12 .904 (-0.14, 0.16)
IIB 0.05 0.08 0.58 .560 (-0.12, 0.21)
IM 0.05 0.08 0.65 .518 (-0.11, 0.21)
IS 0.09 0.07 1.31 .193 (-0.05, 0.23)
IC 0.06 0.07 0.91 .366 (-0.08, 0.2)
CR -0.01 0.08 -0.10 .917 (-0.17, 0.16)
MBEA -0.02 0.07 -0.28 .777 (-0.15, 0.11)
MBEP -0.03 0.06 -0.43 .669 (-0.15, 0.09)
LF -0.17 0.07 -2.40 .018 (-0.31, -0.03)
GEN 0.12 0.08 1.51 .132 (-0.04, 0.27)
AGE 0.10 0.14 0.71 .480 (-0.18, 0.37)
EDU -0.07 0.11 -0.65 .516 (-0.29, 0.15)
TEN1 -0.06 0.08 -0.78 .437 (-0.23, 0.1)
TEN2 -0.04 0.11 -0.36 .717 (-0.26, 0.18)
H3m: There is a significant relationship between managers’ leadership styles (at dimension
level) as perceived by subordinates and their continuance commitment in the banking
sector of Pakistan.
In order to assess statistical relationship between dimensions of managers’ leadership
styles and continuance commitment, OLS multiple regression model was estimated. Table 42

116
provides the regression results. The regression equation explained 12% of the total variation in
continuance commitment. The regression ANOVA was insignificant, F (14, 176) = 1.67, p =
.066. Parameter estimation results indicated that tenure (9 years or above) was the only
significant predictor of continuance commitment, b = 0.44, SE = (0.13), t = 3.37, p = .001, 95%
CI: [0.18, 0.70].
Table 42
Multiple Regression Results for the Effect of Dimensions of Leadership Styles on Continuance
Commitment
b SE t p (95% CI )
IIA 0.07 0.09 0.78 .435 (-0.11, 0.26)
IIB 0.01 0.10 0.08 .940 (-0.19, 0.21)
IM -0.02 0.10 -0.15 .880 (-0.21, 0.18)
IS -0.06 0.08 -0.76 .451 (-0.23, 0.1)
IC 0.03 0.09 0.36 .720 (-0.14, 0.2)
CR 0.10 0.10 1.02 .310 (-0.10, 0.3)
MBEA -0.06 0.08 -0.76 .450 (-0.22, 0.1)
MBEP 0.02 0.07 0.24 .814 (-0.13, 0.16)
LF -0.01 0.08 -0.10 .923 (-0.17, 0.16)
GEN -0.06 0.09 -0.67 .502 (-0.25, 0.12)
AGE 0.15 0.17 0.88 .381 (-0.18, 0.47)
EDU 0.26 0.13 1.93 .055 (-0.01, 0.52)
TEN1 0.07 0.10 0.76 .449 (-0.12, 0.27)
TEN2 0.44 0.13 3.37 .001 (0.18, 0.7)

117
(continues)
H3n: There is a significant relationship between managers’ leadership styles (at dimension
level) as perceived by subordinates and their normative commitment in the banking sector
of Pakistan.
In order to assess statistical relationship between dimensions of managers’ leadership
styles and normative commitment, OLS multiple regression model was estimated. Table 43
provides the regression results. The regression equation explained 8% of the total variation in
normative commitment. The regression ANOVA was insignificant, F (14, 176) = 1.02, p = .432.
Parameter estimation results indicated that management by exception (active) was the only
significant but negative predictor of normative commitment, b = -0.23, SE = (0.09), t = -2.51, p =
.013, 95% CI: [-0.41, -0.05].
Table 43
Multiple Regression Results for the Effect of Dimensions of Leadership Styles on Normative
Commitment
b SE t p (95% CI )
IIA 0.09 0.11 0.84 .401 (-0.12, 0.3)
IIB 0.06 0.11 0.51 .611 (-0.17, 0.28)
IM 0.06 0.11 0.56 .573 (-0.16, 0.28)
IS -0.04 0.09 -0.42 .673 (-0.23, 0.15)
IC 0.06 0.10 0.64 .523 (-0.13, 0.25)
CR 0.05 0.11 0.45 .651 (-0.17, 0.28)
MBEA -0.23 0.09 -2.51 .013 (-0.41, -0.05)
MBEP -0.08 0.08 -0.91 .362 (-0.24, 0.09)
LF 0.10 0.10 1.05 .296 (-0.09, 0.29)
GEN 0.20 0.11 1.87 .063 (-0.01, 0.41)
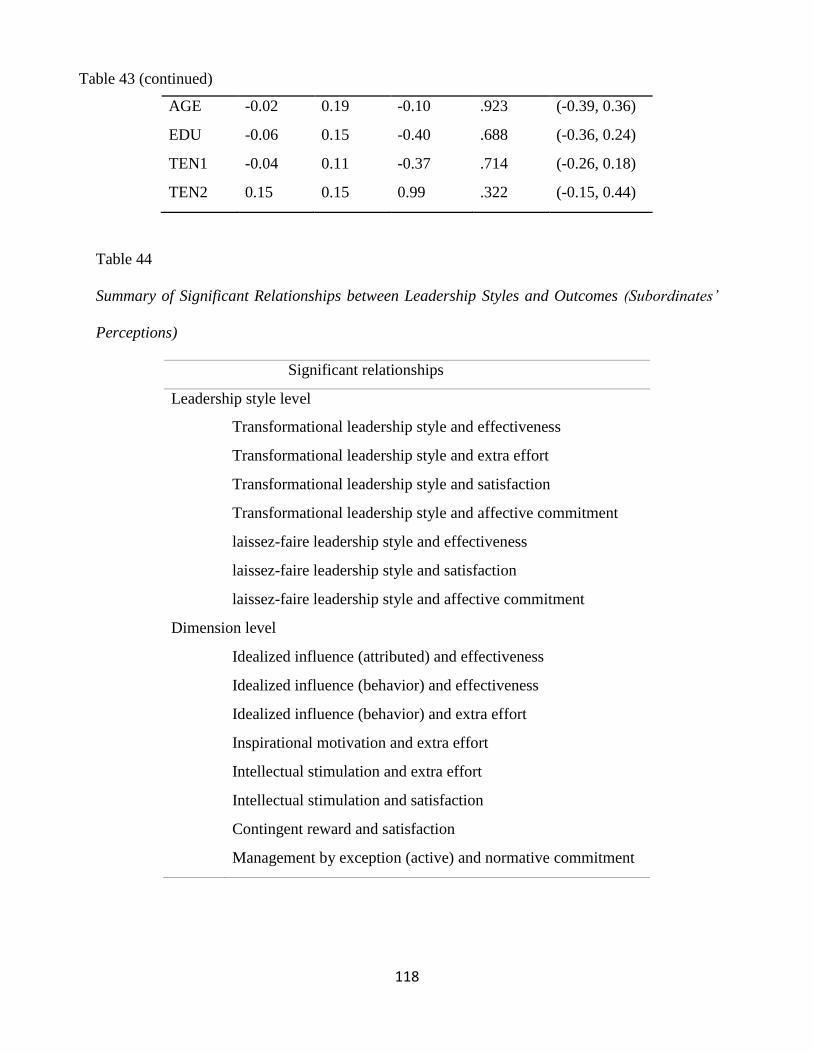
118
Table 43 (continued)
AGE -0.02 0.19 -0.10 .923 (-0.39, 0.36)
EDU -0.06 0.15 -0.40 .688 (-0.36, 0.24)
TEN1 -0.04 0.11 -0.37 .714 (-0.26, 0.18)
TEN2 0.15 0.15 0.99 .322 (-0.15, 0.44)
Table 44
Summary of Significant Relationships between Leadership Styles and Outcomes (Subordinates’
Perceptions)
Significant relationships
Leadership style level
Transformational leadership style and effectiveness
Transformational leadership style and extra effort
Transformational leadership style and satisfaction
Transformational leadership style and affective commitment
laissez-faire leadership style and effectiveness
laissez-faire leadership style and satisfaction
laissez-faire leadership style and affective commitment
Dimension level
Idealized influence (attributed) and effectiveness
Idealized influence (behavior) and effectiveness
Idealized influence (behavior) and extra effort
Inspirational motivation and extra effort
Intellectual stimulation and extra effort
Intellectual stimulation and satisfaction
Contingent reward and satisfaction
Management by exception (active) and normative commitment

119
Figure 12: Congruence between self and subordinates’ perceptions about leadership styles and
performance
4.08 Congruence between Self and Subordinates’ Perceptions about Leadership
Styles and Performance (Level 4)
The purpose of this section is to determine the level of congruence between managers’
(self) and their subordinates’ perceptions about the relationship between leadership styles and
outcomes. In this perspective, three leadership styles (transformational, transactional, and
laissez-faire) and six leadership outcomes (effectiveness, extra effort, satisfaction, affective
commitment, continuance commitment and normative commitment) are studied in the banking
sector of Pakistan. In order to examine the level of congruence between managers and
subordinates, data was analyzed at two levels to better understand the relationship between
independent and dependent variables: at leadership style level and leadership dimension levels.
In addition, four demographic variables (gender, age, education and tenure) were also included
as independent variables. IBM SPSS statistics 22.0 version was used to run regression analysis.

120
(continues)
H4: There is a significant difference between managers’ (self) and subordinates’
perceptions about the impact of managers’ leadership styles on performance outcomes in
the banking sector of Pakistan.
In order to consider the relationship between leadership styles with every outcome, the
above main hypothesis is divided into sub hypotheses (at leadership style and dimension level) in
relation to each of the six outcome variables. The demographic variables (gender, age, education
and tenure) were added as independent variables in regression models. Table 45 presents the
summary of the impact of leadership styles on performance outcomes as perceived by managers
and subordinates. The summary of significant differences between managers’ and subordinates’
perceptions about the relationship of leadership styles and outcome variables is shown in Table
46.
Table 45
Summary of Regression Results for Managers’ and Subordinates’ Perceived Leadership Styles
and Outcomes
b
Managers Subordinates
EFF EE SAT
A
COM
C
COM
N
COM EFF EE SAT
A
COM
C
COM
N
COM
Leadership style level
Transf_L 0.19 0.05 0.39* 0.16 -0.36** 0.18 0.36*** 0.41*** 0.23* 0.12* 0.03 0.13
CR -0.04 0.29 0.03 -0.18 0.17 -0.70** 0.15 0.13 0.37* 0.00 0.10 0.05
MBEA 0.25 0.35 0.24 -0.35 0.04 -0.28 -0.07 -0.01 0.03 -0.02 -0.05 -0.22*
MBEP -0.47*** 0.10 -0.13 -0.06 -0.04 0.11 0.00 0.05 -0.01 -0.03 0.03 -0.07
LF 0.07 -0.16 -0.17 -0.07 0.05 -0.34 -0.20** -0.06 -0.41** -0.16* -0.01 0.10
GEN 0.02 -0.38 -0.65 0.54 0.12 0.74 0.33*** 0.08 -0.12 0.10 -0.05 0. 21*

121
Table 45 (continued)
AGE 0.25 0.13 0.19 0.18 0.04 0.18 -0.05 -0.18 -0.04 0.11 0.14 -0.02
EDU -0.07 0.28 0.52 -0.72 -0.17 -0.42 0.17 0.11 0.19 -0.05 0.24 -0.08
TEN1 -0.02 0.16 -0.05 0.00 -0.03 -0.12 -0.14 -0.16 -0.21 -0.07 0.10 -0.03
TEN2 -0.07 -0.07 -0.57* -0.23 0.12 -0.15 -0.01 -0.14 -0.01 -0.03 0.44** 0.15
Dimension level
IIA 0.27 -0.04 -0.12 -0.34 -0.29 -0.08 0.27** 0.00 0.26 0.01 0.07 0.09
IIB 0.30 0.39 0.79* 0.37 -0.22 0.50 0.22* 0.22* 0.26 0.05 0.01 0.06
IM 0.11 0.35 0.28 0.52 -0.09 0.17 0.08 0.43*** 0.23 0.05 -0.02 0.06
IS -0.11 -0.14 -0.10 -0.14 -0.31 0.23 0.10 0.21** 0.33* 0.09 -0.06 -0.04
IC 0.00 -0.40 0.20 -0.18 0.12 -0.36 -0.02 -0.06 -0.18 0.06 0.03 0.06
CR -0.09 0.13 -0.17 -0.35 0.18 -0.87** 0.16 0.12 0.35* -0.01 0.10 0.05
MBEA 0.09 0.25 0.19 -0.31 0.10 -0.29 -0.05 0.05 0.10 -0.02 -0.06 -0.23*
MBEP -0.46** 0.08 -0.23 -0.16 -0.11 0.13 0.01 0.11 0.05 -0.03 0.02 -0.08
LF 0.08 -0.10 -0.09 0.00 0.05 -0.27 -0.19* -0.03 -0.38** -0.17* -0.01 0.10
GEN -0.01 -0.30 -0.44 0.69 0.13 0.90* 0.34*** 0.10 -0.07 0.12 -0.06 0.20
AGE 0.26 0.07 0.24 0.17 0.09 0.10 -0.03 -0.19 -0.02 0.10 0.15 -0.02
EDU -0.03 0.11 0.47 -0.93* -0.16 -0.61* 0.17 0.10 0.14 -0.07 0.26 -0.06
TEN1 -0.09 0.10 -0.05 0.00 -0.02 -0.11 -0.16 -0.07 -0.12 -0.06 0.07 -0.04
TEN2 -0.07 0.14 -0.42 0.01 0.10 0.08 0.00 -0.16 -0.04 -0.04 0.44** 0.15
*p < .05. **p < .01. ***p < .001.
H4a: There is a significant difference between managers’ and subordinates’ perceptions
about the impact of managers’ leadership styles on effectiveness outcome in the banking
sector of Pakistan.
In order to examine the level of congruence between managers’ and their subordinates’
perceptions about leadership styles with respect to effectiveness, two different OLS regression
models were estimated. Regression results are shown in Tables 18 and 32. The regression model
of managers’ self-perceived leadership styles and effectiveness was significant, 𝑅2 = 0.65, F

122
(10, 39) = 7.27, p < .001. Parameter estimation results indicated that management by exception
(passive) was the only significant but negative predictor of effectiveness, b = -0.47, SE = (0.13), t
= -3.73, p = .001, 95% CI: [-0.73, -0.22]. On the other hand, regression model of subordinates’
perceived leadership styles and effectiveness was also significant 𝑅2 = 0.41, F (10, 180) =
12.26, p < .001. However, parameter estimation results indicated that transformational leadership
style, laissez-faire leadership style, and gender (female) were significant predictors of
effectiveness. The relationship of transformational leadership style and gender (female) with
effectiveness was found as positive b = 0.36, SE = (0.06), t = 5.60, p < .001, 95% CI: [0.23, 0.49]
and b = 0.33, SE = (0.08), t = 4.05, p < .001, 95% CI: [0.17, 0.49] respectively whereas laissez-
faire leadership style was reported as negative predictor of effectiveness, b = -0.20, SE = (0.07), t
= -2.71, p < .001, 95% CI: [-0.34, -0.05].
H4b: There is a significant difference between managers’ and subordinates’ perceptions
about the impact of managers’ leadership styles on extra effort outcome in the banking
sector of Pakistan.
In order to examine the level of congruence between managers’ and their subordinates’
perceptions about leadership styles with respect to extra effort, two different OLS regression
models were estimated. Regression results are shown in Tables 19 and 33. The regression model
of managers’ self-perceived leadership styles and extra effort was significant, 𝑅2 = 0.44, F (10,
39) = 3.11, p = .005 but parameter estimation results indicated no self-perceived leadership style
as significant predictor of extra effort. On the other hand, regression model of subordinates’
perceived leadership styles and extra effort was also significant 𝑅2 = .039, F (10, 180) = 11.47,
p < .001. However, estimation results indicated transformational leadership style as highly

123
significant predictor of extra effort, b = 0.41, SE = (0.07), t = 5.58, p < .001, 95% CI: [0.26,
0.55].
H4c: There is a significant difference between managers’ and subordinates’ perceptions
about the impact of managers’ leadership styles on satisfaction outcome in the banking
sector of Pakistan.
In order to examine the level of congruence between managers’ and their subordinates’
perceptions about leadership styles with respect to satisfaction, two different OLS regression
models were estimated. Regression results are shown in Tables 20 and 34. The regression model
of managers’ self-perceived leadership styles and satisfaction was significant, 𝑅2 = 0.69, F (10,
39) = 8.53, p < .001. Parameter estimation results indicated transformational leadership as
significant, b = 0.39, SE = (0.18), t = 2.18, p = .035, 95% CI: [0.03, 0.76] and tenure (5-8 years)
as significant but negative predictors of satisfaction, b = -0.57, SE = (0.24), t = -2.33, p = .025,
95% CI: [-1.06, -0.08]. On the other hand, regression model of subordinates’ perceived
leadership styles and satisfaction was also significant 𝑅2 = 0.22, F (10, 180) = 5.11, p < .001.
However, parameter estimation results indicated that transformational leadership and contingent
reward were significant predictors of satisfaction, b = 0.23, SE = (0.11), t = 2.02, p = .045, 95%
CI: [0.01, 0.46] and b = 0.37, SE = (0.16), t = 2.38, p = .019, 95% CI: [0.06, 0.68] respectively.
In addition, laissez-faire leadership was also reported as significant but negative predictor of
satisfaction, b = -0.41, SE = (0.13), t = -3.14, p = .002, 95% CI: [-0.67, -0.15].
H4d: There is a significant difference between self and subordinates’ perceptions about the
impact of managers’ leadership styles on affective commitment outcome in the banking
sector of Pakistan.

124
In order to examine the level of congruence between managers’ and their subordinates’
perceptions about leadership styles with respect to affective commitment, two different OLS
regression models were estimated. Regression results are shown in Tables 21 and 35. The
regression model of managers’ self-perceived leadership styles and affective commitment was
insignificant, 𝑅2 = 0.14, F (10, 39) = 0.64, p = .772. Parameter estimation results indicated that
no independent variable was significant predictor of affective commitment. On the other hand,
regression model of subordinates’ perceived leadership styles and affective commitment was
also insignificant 𝑅2 = 0.09, F (10, 180) = 1.81, p = .062. However, the parameter estimation
results indicated transformational leadership as significant predictor, b = 0.12, SE = (0.06), t =
1.97, p = .05, 95% CI: [0.00, 0.24] and laissez-faire leadership as significant but negative
predictor of affective commitment, b = -0.16, SE = (0.07), t = -2.37, p = .019, 95% CI: [-0.30, -
0.03] respectively.
H4e: There is a significant difference between managers’ and subordinates’ perceptions
about the impact of managers’ leadership styles on continuance commitment outcome in
the banking sector of Pakistan.
In order to examine the level of congruence between managers’ and their subordinates’
perceptions about leadership styles with respect to continuance commitment, two different OLS
regression models were estimated. Regression results are shown in Tables 22 and 36. The
regression model of managers’ self-perceived leadership styles and continuance commitment
was significant, 𝑅2 = 0.45, F (10, 39) = 3.17, p = .005. Parameter estimation results indicated
that transformational leadership was the only significant but negative predictor of continuance
commitment, b = -0.36, SE = (0.11), t = -3.25, p = .002, 95% CI: [-0.58, -0.14]. On the other
hand, regression model of subordinates’ perceived leadership styles and continuance
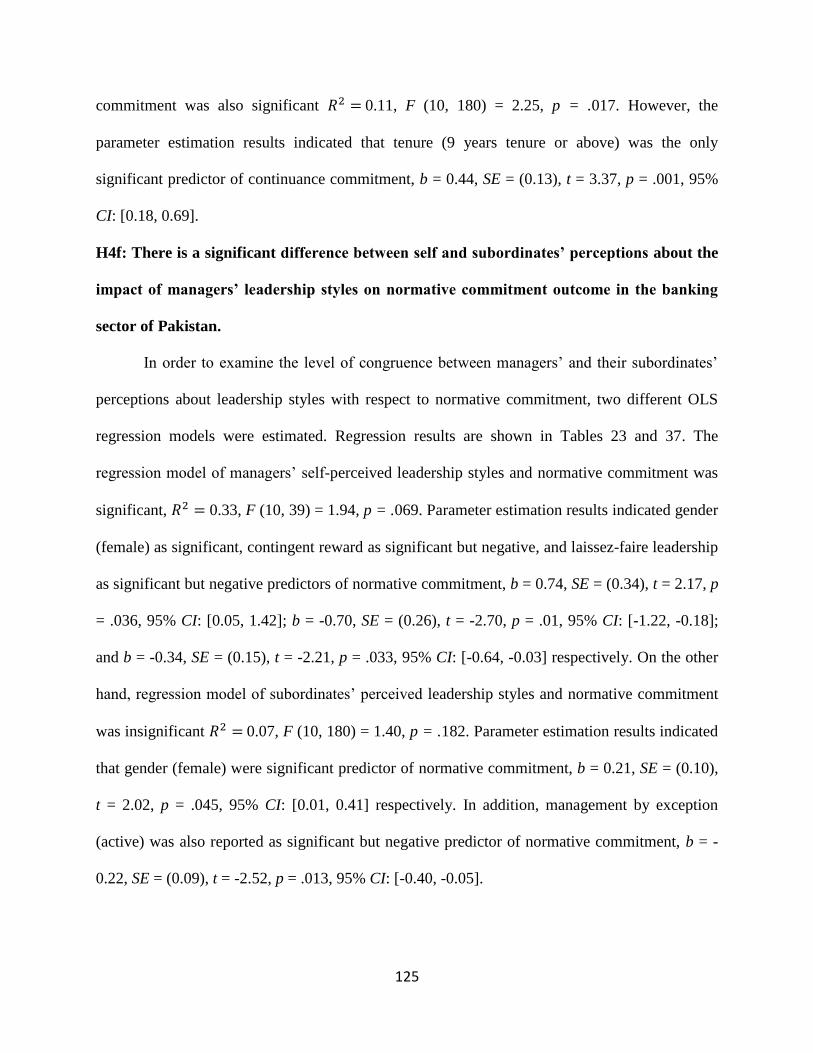
125
commitment was also significant 𝑅2 = 0.11, F (10, 180) = 2.25, p = .017. However, the
parameter estimation results indicated that tenure (9 years tenure or above) was the only
significant predictor of continuance commitment, b = 0.44, SE = (0.13), t = 3.37, p = .001, 95%
CI: [0.18, 0.69].
H4f: There is a significant difference between self and subordinates’ perceptions about the
impact of managers’ leadership styles on normative commitment outcome in the banking
sector of Pakistan.
In order to examine the level of congruence between managers’ and their subordinates’
perceptions about leadership styles with respect to normative commitment, two different OLS
regression models were estimated. Regression results are shown in Tables 23 and 37. The
regression model of managers’ self-perceived leadership styles and normative commitment was
significant, 𝑅2 = 0.33, F (10, 39) = 1.94, p = .069. Parameter estimation results indicated gender
(female) as significant, contingent reward as significant but negative, and laissez-faire leadership
as significant but negative predictors of normative commitment, b = 0.74, SE = (0.34), t = 2.17, p
= .036, 95% CI: [0.05, 1.42]; b = -0.70, SE = (0.26), t = -2.70, p = .01, 95% CI: [-1.22, -0.18];
and b = -0.34, SE = (0.15), t = -2.21, p = .033, 95% CI: [-0.64, -0.03] respectively. On the other
hand, regression model of subordinates’ perceived leadership styles and normative commitment
was insignificant 𝑅2 = 0.07, F (10, 180) = 1.40, p = .182. Parameter estimation results indicated
that gender (female) were significant predictor of normative commitment, b = 0.21, SE = (0.10),
t = 2.02, p = .045, 95% CI: [0.01, 0.41] respectively. In addition, management by exception
(active) was also reported as significant but negative predictor of normative commitment, b = -
0.22, SE = (0.09), t = -2.52, p = .013, 95% CI: [-0.40, -0.05].

126
H4g: There is a significant difference between managers’ and subordinates’ perceptions
about the impact of managers’ leadership styles (at dimension level) on effectiveness
outcome in the banking sector of Pakistan.
In order to examine the level of congruence between managers’ and their subordinates’
perceptions about leadership style dimensions with respect to effectiveness, two different OLS
regression models were estimated. Regression results are shown in Tables 24 and 38. The
regression model of managers’ self-perceived leadership style dimensions and effectiveness was
significant, 𝑅2 = 0.68, F (14, 35) = 5.25, p < .001. Parameter estimation results indicated that
management by exception (passive) was the only significant but negative predictor of
effectiveness, b = -0.46, SE = (0.14), t = -3.35, p = .002, 95% CI: [-0.74, -0.18]. On the other
hand, regression model of subordinates’ perceived leadership style dimensions and effectiveness
was also significant 𝑅2 = 0.42, F (14, 176) = 9.18, p < .001. Parameter estimation results
indicated that idealized influence (attributed), idealized influence (behavioral), and gender
(female) were significant predictors of effectiveness, b = 0.27, SE = (0.08), t = 3.26, p = .001,
95% CI: [0.11, 0.43]; b = 0.22, SE = (0.09), t = 2.49, p = .014, 95% CI: [0.05, 0.39]; and b =
0.34, SE = (0.08), t = 4.09, p < .001, 95% CI: [0.17, 0.50] respectively. In addition, laissez-faire
leadership was also found significant but negative predictor of effectiveness, b = -0.19, SE =
(0.07), t = -2.54, p = .012, 95% CI: [-0.33, -0.04].
H4h: There is a significant difference between managers’ and subordinates’ perceptions
about the impact of managers’ leadership styles (at dimension level) on extra effort
outcome in the banking sector of Pakistan.
In order to examine the level of congruence between managers’ and their subordinates’
perceptions about leadership style dimensions with respect to extra effort, two different OLS

127
regression models were estimated. Regression results are shown in Tables 25 and 39. The
regression model of managers’ self-perceived leadership style dimensions and extra effort was
significant, 𝑅2 = 0.52, F (14, 35) = 2.73, p = .008. Parameter estimation results indicated that no
independent variable was significant predictor of subordinates’ extra effort. On the other hand,
regression model of subordinates’ perceived leadership style dimensions and extra effort was
also significant 𝑅2 = 0.45, F (14, 176) = 10.27, p < .001. However, the parameter estimation
results indicated that idealized influence (behavioral), inspirational motivation, and intellectual
stimulation were significant predictors of extra effort, b = 0.22, SE = (0.10), t = 2.27, p = .025,
95% CI: [0.03, 0.41]; b = 0.43, SE = (0.10), t = 4.56, p < .001, 95% CI: [0.25, 0.62]; and b =
0.21, SE = (0.08), t = 2.67, p = .008, 95% CI: [0.06, 0.37] respectively.
H4j: There is a significant difference between managers’ and subordinates’ perceptions
about the impact of managers’ leadership styles (at dimension level) on satisfaction
outcome in the banking sector of Pakistan.
In order to examine the level of congruence between managers’ and their subordinates’
perceptions about leadership style dimensions with respect to satisfaction, two different OLS
regression models were estimated. Regression results are shown in Tables 26 and 40. The
regression model of managers’ self-perceived leadership style dimensions and satisfaction was
significant, 𝑅2 = 0.73, F (14, 35) = 6.84, p < .001. Parameter estimation results indicated that
idealized influence (behavior) was the only significant predictor of satisfaction, b = 0.79, SE =
(0.30), t = 2.65, p = .012, 95% CI: [0.19, 1.40]. On the other hand, regression model of
subordinates’ perceived leadership style dimensions and satisfaction was also significant 𝑅2 =
0.28, F (14, 176) = 4.84, p < .001. However, the parameter estimation results indicated that
intellectual stimulation and contingent reward were significant predictors of satisfaction, b =

128
0.33, SE = (0.13), t = 2.59, p = .01, 95% CI: [0.08, 0.58] and b = 0.35, SE = (0.15), t = 2.28, p =
.024, 95% CI: [0.05, 0.65] respectively. In addition, laissez-faire leadership was also found
significant but negative predictor of satisfaction, b = -0.38, SE = (0.13), t = -2.92, p = .004, 95%
CI: [-0.63, -0.12].
H4k: There is a significant difference between self and subordinates’ perceptions about the
impact of managers’ leadership styles (at dimension level) on affective commitment
outcome in the banking sector of Pakistan.
In order to examine the level of congruence between managers’ and their subordinates’
perceptions about leadership style dimensions with respect to affective commitment, two
different OLS regression models were estimated. Regression results are shown in Tables 27 and
41. The regression model of managers’ self-perceived leadership style dimensions and affective
commitment was insignificant, 𝑅2 = 0.22, F (14, 35) = 0.68, p = .775. Parameter estimation
results indicated that education (16 years or above) was the only significant but negative
predictor of affective commitment, b = -0.93, SE = (0.39), t = -2.36, p = .024, 95% CI: [-1.73, -
0.13]. On the other hand, regression model of subordinates’ perceived leadership style
dimensions and affective commitment was also insignificant 𝑅2 = 0.10, F (14, 176) = 1.37, p =
.170. Parameter estimation results indicated that laissez-faire leadership was the only significant
but negative predictor of affective commitment, b = -0.17, SE = (0.07), t = -2.40, p = .018, 95%
CI: [-0.31, -0.03].
H4m: There is a significant difference between managers’ and subordinates’ perceptions
about the impact of managers’ leadership styles (at dimension level) on continuance
commitment outcome in the banking sector of Pakistan.

129
In order to examine the level of congruence between managers’ and their subordinates’
perceptions about leadership style dimensions with respect to continuance commitment, two
different OLS regression models were estimated. Regression results are shown in Tables 28 and
42. The regression model of managers’ self-perceived leadership style dimensions and
continuance commitment was significant, 𝑅2 = 0.50, F (14, 35) = 2.52, p = .013. Parameter
estimation results indicated that no independent variable was significant predictor of
subordinates’ continuance commitment. On the other hand, regression model of subordinates’
perceived leadership style dimensions and continuance commitment was insignificant 𝑅2 =
0.12, F (14, 176) = 1.67, p = .066 but parameter estimation results indicated that tenure (9 years
or above) as significant predictor of continuance commitment, b = 0.44, SE = (0.13), t = 3.37, p =
.001, 95% CI: [0.18, 0.70].
H4n: There is a significant difference between managers’ and subordinates’ perceptions
about the impact of managers’ leadership styles (at dimension level) on normative
commitment outcome in the banking sector of Pakistan.
In order to examine the level of congruence between managers’ and their subordinates’
perceptions about leadership style dimensions with respect to normative commitment, two
different OLS regression models were estimated. Regression results are shown in Tables 29 and
43. The regression model of managers’ self-perceived leadership style dimensions and normative
commitment was insignificant, 𝑅2 = 0.40, F (14, 35) = 1.68, p = .105. Parameter estimation
results indicated that contingent reward, gender (female) and education (16 years or above) were
significant predictors of normative commitment, b = -0.87, SE = (0.28), t = -3.15, p = .003, 95%
CI: [-1.43, -0.31]; b = 0.90, SE = (0.36), t = 2.52, p = .017, 95% CI: [0.17, 1.62]; and b = -0.61,
SE = (0.29), t = -2.08, p = .045, 95% CI: [-1.20, -0.02] respectively. However, contingent reward

130
(continues)
and education (16 years or above) had negative relationship with normative commitment. On the
other hand, regression model of subordinates’ perceived leadership style dimensions and
normative commitment was also insignificant 𝑅2 = 0.08, F (14, 176) = 1.02, p = .432.
However, parameter estimation results indicated management by exception (active) as significant
but negative predictor of normative commitment, b = -0.23, SE = (0.09), t = -2.51, p = .013, 95%
CI: [-0.41, -0.05].
Table 46
Summary of Significant Differences for Managers’ and Subordinates’ Perceived Leadership
Styles and Outcomes
Relationship Managers’
perceptions
Subordinates’
perceptions
Leadership style level
Transformational leadership style
and effectiveness
Insignificant
relationship
Significantly positive
relationship
Transformational leadership style
and extra effort
Insignificant
relationship
Significantly positive
relationship
Transformational leadership style
and affective commitment
Insignificant
relationship
Significantly positive
relationship
Transformational leadership and
continuance commitment
Significantly
negative relationship
Insignificant
relationship
laissez-faire leadership style and
effectiveness
Insignificant
relationship
Significantly negative
relationship
laissez-faire leadership style and
satisfaction
Insignificant
relationship
Significantly negative
relationship
laissez-faire leadership style and
affective commitment
Insignificant
relationship
Significantly negative
relationship
Dimension level
Idealized influence (attributed)
and effectiveness
Insignificant
relationship
Significantly positive
relationship

131
Table 46 (continued)
Idealized influence (behavior)
and effectiveness
Insignificant
relationship
Significantly positive
relationship
Idealized influence (behavior)
and extra effort
Insignificant
relationship
Significantly positive
relationship
Idealized influence (behavior)
and satisfaction
Significantly
positive relationship
Insignificant
relationship
Inspirational motivation and
extra effort
Insignificant
relationship
Significantly positive
relationship
Intellectual stimulation and
extra effort
Insignificant
relationship
Significantly positive
relationship
Intellectual stimulation and
satisfaction
Insignificant
relationship
Significantly positive
relationship
Contingent reward and
normative commitment
Significantly
negative relationship
Insignificant
relationship
Contingent reward and
Satisfaction
Insignificant
relationship
Significantly positive
relationship
Management by exception (active)
and normative commitment
Insignificant
relationship
Significantly negative
relationship
Management by exception (passive)
and effectiveness
Significantly
negative relationship
Insignificant
relationship

132
CHAPTER 5
CONCLUSIONS
The purpose of this comparative study was to examine the congruence among managers’
(self) and subordinates’ perceptions about their leadership styles and performance in the banking
sector of Pakistan. In addition, the current study examined the similarities and differences of the
managers’ leadership styles based on their self-assessment and perceptions of their subordinates.
This chapter consists of four parts: (1) summary and discussion of major findings; (2)
implications for research and practice; (3) limitations of the study; and (4) recommendations for
future research.
5.01 Summary and Discussion of Major Findings
The banking sector in Pakistan is found a male dominant sector. The representation of the
female group in the study was 6% at manager level and 32.71% at subordinate level. However, it
should not be considered that females have less opportunities of growth in the banking sector. In
fact, the number of females in the banking sector is increasing if considered with comparison to
previous researches (Asrarulhaq, 2012; Bodla & Hussain, 2009). Results showed that 90.19%
subordinates were between 26 and 35 years old. Similarly, the tenure of subordinates showed
that the majority of employees had less than 10 years of experience which indicated that the
banking sector in Pakistan is echoed by a young generation. In addition, the majority of the
employees had 16 years of education. The results validated the earlier statement (mentioned in
chapter three) that the banking sector is hiring young people with higher education and better
(computer) skills whereas senior people are either retired with incentives or promoted on
management positions.

133
The present study consisted of fours levels. The first level of study was to compare the
leadership styles of branch managers based on their self-assessment and perceptions of their
subordinates. At the leadership style level, unexpectedly, no significant difference was found
between managers’ (self) and subordinates’ perceptions about transformational leadership and
transactional leadership. However, ANOVA results indicated a significant difference in the mean
score of laissez-faire leadership style based on gender and age. Parameter estimates showed that
gender (female group) and age (35 years or less group) had significant but negative ratings for
laissez-faire leadership style. At leadership style dimension level, a highly significant difference
was found between managers and subordinates at all dimensions of transformational leadership
style and transactional leadership style. The managers significantly highly rated leadership style
dimensions in their self-assessment which is consistent with the existing literature on self-
assessed leadership styles (Atwater, Wang, Smither, & Fleenor, 2009; Young, 1980; Ismail,
2012; Mabe & West, 1982; Podsakoff & Organ, 1986). The representation of female managers in
this study was significantly small in numbers which might be the reason of significantly higher
ratings in managers’ self-assessment of their leadership styles. As Visser, Ashton, and Vernon
(2008); Moshavi, Brown, and Dodd (2003); and Brutus, Fleenor, and McCauley (1999) stated
that men highly rate their transformational leadership styles whereas women are more accurate in
this self-assessment of leadership styles. Therefore, there is need for further study on congruence
in leadership from gender perspective. It will further help to understand that how differently
male and female subordinates perceive their women managers. Based on demographics, a
significant difference was found in intellectual stimulation, management by exception (active),
and management by exception (passive). Intellectual stimulation was significantly highly rated
based on three demographics: gender (male group), age (36 years or above), and education (less

134
than 16 years). Management by exception (active) and management by exception (passive) were
significantly highly rated based on gender (female group). The literature (Brutus, Fleenor, &
McCauley, 1999; Moshavi et al., 2003; Ostroff et al., 2004; Vecchio & Anderson, 2009) shows
that younger managers lower rate their performance and effectiveness and old managers
significantly over rate their leadership styles and performance. However, the findings of this
study showed an unexpected and surprising relationship between the age of the managers and
their self-assessment of performance and effectiveness. The younger managers (mostly between
26-35 years of age) significantly highly rated their leadership styles and performance in their
self-assessment.
The second level of study was to examine the relationship between managers’ self-
perceived leadership styles (transformational, transactional, and laissez-faire) and dependent
variables (effectiveness, extra effort, satisfaction, affective commitment, continuance
commitment, and normative commitment). The results of the study revealed that only
transformational leadership style had a significant statistical relationship with satisfaction and
continuance commitment. The relationship of transformational leadership with satisfaction is in
line with the previous literature (Griffith, 2004; Emery & Barker, 2007; Hunjra et al., 2010;
Bushra, Usman, & Naveed, 2011; Asrarulhaq, 2012). However, the negative association of
transformational leadership with continuance commitment and insignificant association with
affective commitment were unexpected. Transformational leadership behavior appeal to the
emotions of subordinates (Bass & Avolio, 1997) and has significant impact on subordinates’
perceptions and motivation. Therefore, it should have a highly significant association with
affective commitment as Lee (2005) stated that transformational leadership is highly associated
with affective commitment. This surprising finding supports the findings (Brutus, Fleenor, &

135
McCauley, 1999; Moshavi et al., 2003; Ostroff et al., 2004; Vecchio & Anderson, 2009) that
young managers lower rate their performance and effectiveness. In addition, the impact of
leadership style dimensions on outcome variables was also examined. The results showed that
most of the leadership style dimensions had an insignificant relationship with outcome variables.
The results revealed that idealized influence (behavior) had a significant relationship with
satisfaction, whereas contingent reward and management by exception (passive) had a significant
but negative relationship with normative commitment and effectiveness respectively.
The third level of study was to examine the relationship between managers’ leadership
styles (transformational, transactional, and laissez-faire) as perceived by subordinates and
dependent variables (effectiveness, extra effort, satisfaction, affective commitment, continuance
commitment, and normative commitment). The results at the leadership style level were in line
with the previous researches (Bass & Avolio, 1994; Ristow, Amos, & Staude, 1999; Hunjra et
al., 2010; Bushra, Usman, & Naveed, 2011; Farahani, Taghadosi, & Behboudi, 2011; Bano,
2013). It revealed that transformational leadership had a significant relationship with
effectiveness, extra effort, satisfaction and affective commitment. However, the insignificant
association between transformational leadership and affective commitment was unexpected and
contrary to the previous researches. The literature shows that transformational leadership styles
has a significantly positive association with affective commitment (Bass & Avolio, 1997; Lee,
2005). The impact of laissez-faire leadership style on effectiveness, satisfaction, and affective
commitment was found significantly negative that was in line with the available literature on
leadership styles in relation to difference outcomes (i.e. Bass & Avolio, 1990; Lowe, Kroeck, &
Sivasubramaniam, 1996; Spinelli, 2005)

136
The fourth level of study was to examine the congruence between managers’ (self) and
subordinates’ perceptions about their leadership styles and performance. The results showed a
significant difference between managers’ and subordinates’ perceptions about their leadership
styles and performance. The subordinates’ perceptions regarding managers’ transformational
leadership style were consistent and in line with the previous researches (Hunjra et al., 2010;
Bushra, Usman, & Naveed, 2011; Bano, 2013). They rated a highly significant association of
transformational leadership style with effectiveness, extra effort, satisfaction and affective
commitment. On the other hand, managers perceived that transformational leadership had no
significant relationship with effectiveness and extra effort which is unexpected and surprising in
self-assessment of leadership styles and performance literature (Bass & Avolio, 1994; Ristow,
Amos, & Staude, 1999). In addition, managers’ perception about the insignificant association
between transformational leadership style and affective commitment is also unexpected and
contrary to the available literature on transformational leadership and commitment. It is inferred
that if managers want to develop feelings of affective commitment in subordinates, they should
not practice transformational leadership style frequently. As the majority of the managers in this
study belonged to 26-35 years of age group, it supports the view that younger managers often
lower rate their performance and effectiveness (Moshavi et al., 2003; Ostroff et al., 2004;
Vecchio & Anderson, 2009). In addition, it is inferred that if managers want their subordinates to
exert extra job effort and develop their affective commitment, they should adopt and practice
transformational leadership style more frequently. The results showed that subordinates reported
a significant but negative impact of laissez-faire leadership on effectiveness, satisfaction, and
affective commitment. On the other hand, managers did not perceive any significant relationship
between laissez-faire leadership and outcomes. At the second step, the congruence between

137
managers and subordinates about leadership styles and performance was examined at the
leadership style dimension level in relation to each outcome. The results showed a significant
difference at every leadership style dimension (except individualized consideration) in relation to
different outcomes.
5.02 Implications for Research and Practice
The findings of this study have several implications for Human Resource Development
(HRD) research and practice. In addition, the findings of this study have certain implications for
current leadership practice in the banking sector and for future leadership studies. The findings
of this study may help the managers to make changes in their leadership styles to be more
effective.
This study was conducted in the context of Pakistan. Due to economic crunch, an
increase in unemployment rate and advancement in technology, the competition in the banking
sector has become severe. In this situation, it is necessary for the success and growth that
management and employees should be on the same lines (share the same mission and vision).
The managers and their subordinates should work hard and together to achieve the mission. The
results of this study imply that subordinates had different perceptions from their managers about
the same things i.e. certain performance outcomes. There exists a gap between their perceptions.
The findings of this study may be helpful to reduce this gap. In addition, the findings of this
study may be helpful in developing certain policies and strategies to hire the best fit workforce
and improve the performance of already hired staff.
The study further implies that more attention should be paid on the leadership
development efforts based on the analysis of the present study. It is proposed that the
138
administration of the banks in Pakistan should develop some leadership programs. The managers
should go under regular training of leadership development. It may help them to lead and
manage the people in an effective way. All institutions including banks should have HRD
departments at regional levels or some HRD professionals at branch levels who work with the
managers to facilitate them in employees’ training and mentoring (career development),
motivation and making retention strategies. The findings of this study may help to design some
programs to educate managers and leaders in the banking sector.
The results of the study reinforce Bhagat and Steers (2009) that leadership is not the same
thing across cultures. It is evident from the study (based on subordinates’ perceptions) that
transformational and transactional leadership styles were widely used leadership styles in the
banking sector of Pakistan. However, the interesting finding was the negative relationship
between some leadership styles and outcomes. For instance, the negative relationship between
transformational leadership and continuance commitment at level 2; the negative relationship
between contingent reward and normative commitment at level 2; insignificant relationship
between transformational leadership and affective commitment at level 2; and the negative
relationship between management by exception (active) and normative commitment at level 3.
The results of this study have created new insights into banking leadership. The
implications could have far reaching effects for future leadership studies. The previous studies
focused on the leaders and their immediate subordinates where congruence between the leader-
follower existed, but the present study revealed some different findings from previous
researches. Further, the existing literature on the congruence between leaders and subordinates is
based on American or European contexts. There is need for further studies on leadership in other

139
parts of the world, especially in the South Asia region. As the perceptions of leadership styles in
South Asia differ from other regions (Northouse, 2009) and is revealed through this study too.
The existing literature on leadership studies establishes a significant and positive
relationship between leadership styles (transformational and transactional) and performance
outcomes (effectiveness, extra effort, satisfaction, and organizational commitment). However,
the findings of this study reveal the inconsistent relationships between leadership styles and
performance outcomes. It is assumed that smaller institutions are better structured by
communication, intimacy, and more personalized leadership. However, the findings of current
study reveal that employees in the smaller institutions observed the leadership behavior more
closely.
As discussed in the problem statement that the banking sector in Pakistan is facing
multiple challenges, including high turnover, and needs effective leadership that could make
strategies to satisfy, retain, and motivate the employees to exert extra efforts. But it seems from
the findings of the study that leadership (managers’ behavior) itself might be a reason for such
problems. According to Avolio (1994), transformational and transactional leadership styles are
the most effective leadership styles if adopted collectively. The findings of the current study
revealed a significant difference among managers’ and subordinates’ perceptions about
leadership styles and performance outcomes which might be an indication that transformational
and transactional leadership styles are not adopted collectively in the banking sector of Pakistan.
In addition, the findings of this study accentuate the need to develop some system to provide
subordinates’ feedback to their managers.
The findings of this study have certain implications for the current managers in the
banking sector of Pakistan. Managers can benefit from the findings of this study to improve their

140
subordinates’ performance, foster an atmosphere of trust and meet the challenges in the banking
sector. For instance, in this study, managers perceived no significant relationship between
transformational leadership and subordinates’ extra effort. On the other hand, subordinates
perceived a significant positive relationship between managers’ transformational leadership and
their willingness to exert extra effort. Thus, based on the findings of this study, if managers want
their subordinates to work harder and spend more time on the job, they should adopt and practice
transformational leadership style more frequently.
The findings of this study have certain implications for banks and other organizations.
The findings of this study are consistent with the available literature that transformational
leadership is significantly associated with perceived leader effectiveness, subordinate satisfaction
with leader and willingness to exert extra effort. Effective leaders have great significance for the
success of any organizations. According to Bass and Avolio (1999), if leaders remain unable to
develop transformational leadership skills through experience, they can exhibit these skills
through trainings. The findings of present study showed that managers perceived no significant
relationship of transformational leadership with effectiveness and extra effort. On the other hand,
subordinates perceived significant and positive relationship of transformational leadership with
effectiveness and extra effort. It may be inferred that managers did not possess or were not aware
of transformational leadership skills. Therefore, certain training programs may be designed to
develop effective managers in the banking sector as well as other organizations.

141
5.03 Limitations of the Study
The questionnaire was based on the perceptions of the employees and different
employees might have perceived the same leadership style differently.
There might be some personal bias in the leader and subordinate relationship which
might have affected the credibility of the data.
Due to the adverse political situation in some regions of the country, the people were
hesitant to participate in the study and their responses might not reflect their true
perceptions.
The normality assumption of data was not fully satisfied. Given the constraints of study,
the results of the study should be interpreted with caution.
Given the structure of banking and cultural norms, some of the group numbers were very
small for reliable conclusion.
The demographics are used as categorical variables in the study. The results might be
more accurate if the researcher had complete information.
The results of the study might be weak due to bias in self-reported survey (managers’
self-assessment about their leadership styles)
5.04 Recommendations for Future Research
The findings of this study give some directions for future research and practice in HRD.
An extensive search revealed that literature on congruence in leadership styles and performance
outcomes is limited. Therefore, the present study is a significant contribution to this body of
knowledge. In addition, it is the first effort to examine the level of congruence between
managers’ and subordinates’ perceptions about leadership styles and performance in the banking

142
sector of Pakistan. The results of this study at congruence level are not consistent with available
literature and may be replicated with more diverse and larger sample to generalize the findings.
The findings of this study could be shared with banks and other organizations. It may
help the leaders to adopt appropriate leadership styles according to need and context of the
situation and organization. In addition, the organizations could use the findings of this study to
hire appropriate individuals (on the basis of leadership styles) for leadership positions and design
effective leadership development programs.
The findings of this study at level one showed that managers rated their leadership styles
significantly higher in self-assessment than their subordinates. The literature on leadership
reveals that self-assessment of leadership styles potentially has self-desirability bias. Thus, there
is need for further studies to examine leadership styles and its relationship with difference
outcomes from 360 degree feedback.
The findings of this study showed that the banking sector of Pakistan is a male dominant
sector. The future study might include gender as the main focus. The difference in gender might
have totally different results. The findings of this study showed a significant difference in the
perceptions of male and female subordinates about the leadership styles of their managers. The
sample of this study consisted of a limited number of females at manager level. The future study
may be designed to examine the leadership styles of female managers in banks and how male
and female subordinates perceive their leadership styles in relation to performance outcomes.
There are many leadership theories with different factors that affect different outcomes,
i.e. motivation, engagement, well-being, organizational behavior and organizational
performance. Future research studies may be designed to examine congruence about leadership
styles and some other performance outcomes.

143
The present study was designed in context of the Pakistani banking sector. This study
may be replicated in different other sectors and organizations in Pakistan i.e. textile sector,
education sector, and telecom sector. It will add to the knowledge base on leadership style
preferences and effectiveness generally and in Pakistani context especially. In addition, the
impact of national culture on leadership styles and different outcomes can also be an important
aspect for future studies.

144
REFERENCES
Abbas, Q. (2009). Effects of leadership development on employee performance in Pakistan.
Pakistan Economic and Social Review, 47, 2, 269-292.
Adler, N. J. (1983). Cross-cultural management: Issues to be faced. International Studies of
Management and Organization. , 13, 1-2, 7-45.
Alimo-Metcalfe, B., & Alban-Metcalfe, R. J. (2001). The development of a new transformational
leadership questionnaire. Journal of Occupational & Organizational Psychology, 74, 1,
1-27.
Allen, N. J., & Meyer, J. P. (1990). The measurement and antecedents of affective, continuance
and normative commitment to the organization. Journal of Occupational Psychology, 63,
1, 118.
Anderson, D., & Ackerman-Anderson, L. S. (2001). Beyond change management: Advanced
strategies for today's transformational leaders. San Francisco: Jossey-Bass/Pfeiffer.
Antonakis, J., Cianciolo, A. T., & Sternberg, R. J. (2004). The nature of leadership. Thousand
Oaks, CA: Sage Publications.
Ardichvili, A., & Kuchinke, K. P. (2002). Leadership styles and cultural values among managers
and subordinates: a comparative study of four countries of the former Soviet Union,
Germany, and the US. Human Resource Development International, 5, 1, 99-117.
Asrarulhaq, M. (2012). Congruence between self and subordinates’ perceptions about leadership
styles and performance in banking sector of Pakistan. Unpublished manuscript,
University of Illinois at Urbana-Champaign.

145
Atwater, L. E., & Yammarino, F. J. (1992). Does Self-other Agreement on leadership
perceptions moderate the validity of leadership and performance predictions?. Personnel
Psychology, 45, 1, 141-164.
Atwater, L., Wang, M., Smither, J. W., & Fleenor, J. W. (2009). Are cultural characteristics
associated with the relationship between self and others’ ratings of leadership? Journal of
Applied Psychology, 94, 4, 876-886.
Avolio, B. J. (2011). Full range leadership development. Thousand Oaks, Calif: Sage.
Avolio, B. J., Bass, B. M., & Zhu, F. W. W. (2004). Multifactor leadership questionnaire:
Manual and sampler set. Menlo Park, Calif. ?: Mind Garden, Inc.
Bachman, L. F. (2004). Statistical analyses for language assessment. Cambridge: Cambridge
University Press.
Bano, F. B. (2013). An Empirical Study on Effect of Transformational Leadership on
Organizational Commitment in the Banking Sector of Pakistan. IOSR Journal of Business
and Management, 8, 2, 38-44.
Bartlett, K. R. (2002). The relationship between training and organizational commitment: A
study in the health care field. Human Resource Development Quarterly, 12, 4, 335-352.
Bass, B. M. (1985). Leadership and performance beyond expectations. New York: Free Press.
Bass, B. M. (1990). From Transactional to Transformational Leadership: Learning to Share the
Vision. Organizational Dynamics, 18, 3, 19-31.
Bass, B.M., & B.J. Avolio. (1990). The implications of transactional and transformational
leadership for individual, team and organizational development. In R.W. Woodman &
W.A. Passmore (Eds.) Research in organizational change and development. Greenwich,
CT: JAI Press.

146
Bass, B. M., & Avolio, B. J. (1993). Transformational leadership and organizational culture.
Public Administration Quarterly, 17, 1, 112.
Bass, B. M., & Avolio, B. J. (1993). Transformational leadership: A response to critiques. In M.
M. Chemers & R. Ayman (Eds.), Leadership theory and research: Perspectives and
directions (pp. 49-80). San Diego, CA: Academic Press.
Bass, B. M., & Avolio, B. J. (1994). Improving organizational effectiveness through
transformational leadership. Thousand Oaks: Sage Publications.
Bass, B. M., & Avolio, B. J. (1997). Full range leadership development: Manual for the
multifactor leadership questionnaire. Palo Alto, Calif: Mind Garden.
Bass, B. M., Avolio, B. J. (1999). Platoon Readiness as a Function of Transformational
/Transactional Leadership, Squad Mores, and Platoon Cultures. Ft. Belvoir: Defense
Technical Information Center.
Bass, B., & Avolio, B. (1999). Training Full Range Leadership. Redwood City, CA:
Mind Garden.
Bass, B. M., and Bass, R. (2008). The Bass handbook of leadership: theory, research, and
application. New York: Free Press.
Bass, B. M., Stogdill, R. M., & Stogdill, R. M. (1990). Bass & Stogdill's handbook of leadership:
Theory, research, and managerial applications. New York: Free Press.
Becker, H. S. (1960). Notes on the Concept of Commitment. The American Journal of Sociology,
66, 1, 32-40.
Bergman, M. E. (2006). The relationship between affective and normative commitment: review
and research agenda. Journal of Organizational Behavior, 27, 5, 645.

147
Bhagat, R. S., & Steers, R. M. (2009). Cambridge handbook of culture, organizations, and work.
Cambridge, UK: Cambridge University Press.
Birnbaum, R. (1990). The Implicit Leadership Theories of College and University Presidents.
Review of Higher Education, 12, 2, 125-36.
Blake, R. R., & Mouton, J. S. (1994). The managerial grid. Houston: Gulf Pub.
Blau, G. (1989). Using Job Involvement and Organizational Commitment Interactively to Predict
Turnover. Journal of Management, 15, 1, 115-127.
Bodla, M. A., & Hussain, G. (2009). Follower’ Needs and Leadership Styles: An Empirical Fit
among Banking. International Journal of Global Business, 2, 2, 61-80
Bodla, M. A., & Hussain, G. (2010). Need for Leadership: Empirical Evidence from Pakistan.
International Journal of Management and Information Systems, 14, 5, 79-86.
Bodla, M. A., & Nawaz, M. M. (2010). Comparative study of full range leadership model among
faculty members in public and private sector higher education institutes and
universities. International Journal of Business and Management, 5, 4, 208-214.
Borrego, E. & Johnson, R. G. (2012) Cultural competence for public managers: managing
diversity in today's world Boca Raton, FL: CRC Press, Taylor and Francis Group.
Brace, N., Kemp, R., & Snelgar, R. (2009). SPSS for psychologists. New York: Routledge
Brown, L. M., & Posner, B. Z. (2001). Exploring the relationship between learning and
leadership. Leadership & Organization Development Journal, 22, 5, 274-280.
Brutus, S., Fleenor, J. W., & McCauley, C. D. (1999). Demographic and personality predictors
of congruence in multi-source ratings. The Journal of Management Development, 18, 5,
417−435.

148
Brutus, S., Fleenor, J. W., & Tisak, J. (1999). Exploring the Link Between Rating Congruence
and Managerial Effectiveness. Canadian Journal of Administrative Sciences, 16, 4, 308-
322.
Budhwar, P. S., & Debrah, Y. A. (2001). Human resource management in developing countries.
London: Routledge.
Burns, J. M. G. (1978). Leadership. New York: Harper & Row.
Bushra, F., Usman, A., & Naveed, A. (2011). Effect of Transformational Leadership on
Employees' Job Satisfaction and Organizational Commitment in Banking Sector of
Lahore (Pakistan). International Journal of Business & Social Science, 2, 18, 261-267.
Bycio, P., Hackett, R. D., & Allen, J. S. (1995). Further assessments of Bass's (1985)
conceptualization of transactional and transformational leadership. Journal of Applied
Psychology, 80, 4, 468-478.
Chaudhry, A. Q., Javed, H., & Sabir, M. (2012). The impact of transformational and
Transactional leadership styles on the motivation of employees in Pakistan. Pakistan
Economic and Social Review. 50, 2, 223-231.
Conger, J. A., & Kanungo, R. N. (1987). Toward a Behavioral Theory of Charismatic
Leadership in Organizational Settings. Academy of Management Review, 12, 4, 637-647.
Conger, J. A., & Riggio, R. E. (2007). The practice of leadership: Developing the next
generation of leaders. San Francisco, Calif: Jossey-Bass.
Creswell, J. W. (2009). Research design: Qualitative, quantitative, and mixed methods
approaches. Los Angeles: Sage.
Downton, J. V. (1973). Rebel leadership: commitment and charisma in the revolutionary
process. New York: Free Press.

149
Dunnette, M. D. (1993). My Hammer or Your Hammer?. Human Resource Management,
32, 2/3, 373-384.
Dunnette, M. D., Hough, L. M., & Triandis, H. C. (1990). Handbook of industrial and
organizational psychology. Palo Alto, Calif: Consulting Psychologists Press.
Emery, C. R., & Barker, K. J. (2007). The effect of transactional and transformational leadership
styles on the organizational commitment and job satisfaction of customer contact
personnel. Journal of Organizational Culture, Communications & Conflict, 11, 1, 77-90.
Evans, M. G. (1970). The Effects of Supervisory Behavior on the Path-Goal Relationship.
Organizational Behavior & Human Performance, 5, 3, 277-298.
Farahani, M., Taghadosi, M., & Behboudi, M. (2011). An Exploration of the Relationship
between Transformational Leadership and Organizational Commitment: The Moderating
Effect of Emotional Intelligence: Case Study in Iran. International Business Research, 4
4, 211-217.
Fatehi, K. (1996). International Management: A cross-cultural and functional perspective.
Upper Saddle River, New Jersey: Prentice Hall.
Fiedler, F. E (1967). A contingency model of leadership effectiveness. New York: McGraw-Hill.
Fiedler, F. E. (1962). Leader attitudes, group climate, and group creativity. The Journal of
Abnormal and Social Psychology, 65, 5, 308-318.
Fiedler, F. E. (1967). A theory of leadership effectiveness. New York: McGraw-Hill.
Fleishman, E. A., Mumford, M. D., Zaccaro, S. J., Levin, K. Y., Korotkin, A. L., & Hein, M. B.
(1991). Taxonomic efforts in the description of leader behavior: A synthesis and
functional interpretation. The Leadership Quarterly, 2, 4, 245-287.

150
Friedman, T. L. (2005). The world is flat: A brief history of the twenty-first century. New York:
Farrar, Straus and Giroux.
Gill, R. (2003). Change management--or change leadership?. Journal of Change Management,
3, 4, 307.
Gill, R. (2006). Theory and practice of leadership. London: SAGE Publications.
Glisson, C., & Durick, M. (1988). Predictors of Job Satisfaction and Organizational Commitment
in Human Service Organizations. Administrative Science Quarterly, 33, 1, 61-81.
Goldsmith, M. (2003). The many facets of leadership. Upper Saddle River, NJ: Financial
Times/Prentice Hall.
Gonzalez, T. F., & Guillen, M. (2008). Organizational Commitment: A Proposal for a Wider
Ethical Conceptualization of 'Normative Commitment'. Journal of Business Ethics, 78, 3,
401-414.
Graen, G., Cashman, J. F., Ginsburg, S., & Schiemann, W. (1977). Effects of Linking-Pin
Quality on the Quality of Working Life of Lower Participants. Administrative Science
Quarterly, 22, 3, 491-504.
Griffith, J. (2004). Relation of principal transformational leadership to school staff job
satisfaction, staff turnover, and school performance. Journal of Educational
Administration, 42, 3, 333-356.
Heifetz, R. A., & Laurie, D. L. (1997). The Work of Leadership. Harvard Business
Review, 75, 1, 124-34.
Hofstede, G. (1983). The Cultural Relativity of Organizational Practices and Theories. Journal of
International Business Studies, 14, 2, 75-89.
151
Hofstede, G. (2001). Culture’s consequences: Comparing values, behaviors, institutions, and
organizations across nations. Thousand Oaks: SAGE Publications.
Hofstede, G. H. (1980). Culture's consequences: International differences in work-related
values. Beverly Hills, Calif: Sage Publications.
Hofstede, G. H. (1991). Cultures and organizations: Software of the mind. London: McGraw-
Hill.
House, R. J. (1971). A Path Goal Theory of Leader Effectiveness. Administrative Science
Quarterly, 16, 3, 321-339.
House, R. J. (1976). A 1976 theory of charismatic leadership. Toronto: University of Toronto,
Faculty of Management Studies.
House, R. J. (2004). Culture, leadership, and organizations: the GLOBE study of 62 societies.
Thousand Oaks, Calif: Sage Publications.
House, R. J., & Mitchell, T.R. (1974). Path-goal theory of leadership. Journal of Contemporary
Business, 3(4), 81-98.
Hoy, W. K., & Miskel, C. G. (2008). Educational administration: Theory, research, and
practice. Boston: McGraw-Hill.
Humphreys, J. H. (2001). Transformational and transactional leader behavior: The relationship
with support for e-commerce and emerging technology. Journal of Management
Research, 1, 13, 150–159.
Hunjra, A. I., Kashif-ur-Rehman,., Chani, M. I., Aslam, S., & Azam, M. (2010). Factors
effecting job satisfaction of employees in Pakistani banking sector. African Journal of
Business Management, 4, 10, 2157-2163.

152
Ismail, M. R. (2012). Teachers' perceptions of principal leadership styles and how they impact
teacher job satisfaction. (Doctoral dissertation, Colorado State University). Retrieved
from http://search.proquest.com/docview/1020578348?accountid=14553.
Kaplan, R.S., & Norton, D.P. (2001). The strategy-focused organization. Journal of Strategy &
Leadership, 29, 3, 41.
Kest. R. T. (2006). Principles of leadership: Leadership management. Futurics, 3, 1/2, 52-72.
Kirkpatrick, S. A., & Locke, E. A. (1991). Leadership: do traits matter? Academy of
Management Executive 5, 2, 48-60.
Kotter, J. P. (1995). Leading Change: Why Transformation Efforts Fail. Harvard Business
Review, 73, 2, 59.
Kouzes, J. M., & Posner, B. Z. (2003). Credibility: How leaders gain and lose it, why people
demand it. San Francisco: Jossey-Bass Publishers.
Krishnan, V. R. (2004). Impact of transformational leadership on followers influence strategies.
Leadership & Organization Development Journal, 25, 1, 58-72.
Kroeber, A. L., & Kluckhohn, C. (1952). Culture: A critical review of concepts and definitions.
Cambridge, Mass: The Museum.
Lee, J. (2005). Effects of leadership and leader-member exchange on commitment. Leadership &
Organization Development Journal, 26, 8, 655-672.
Li, J., Lam, K., & Qian, G. (2001). Does Culture Affect Behavior and Performance of Firms?
The Case of Joint Ventures in China. Journal of International Business Studies, 32, 115-
132.
Likert, R. (1967). The human organization: Its management and value. New York: McGraw-
Hill.
153
Lomax, R. G. (2007). An introduction to statistical concepts. Mahwah, N.J: Lawrence
Erlbaum Associates Publishers.
Lord, R. G., Brown, D. J., Harvey, J. L., & Hall, R. J. (2001). Contextual constraints on
prototype generation and their multilevel consequences for leadership perceptions. The
leadership Quarterly, 12, 3, 311-338.
Lord, R. G., de, V. C. L., & Alliger, G. M. (1986). A meta-analysis of the relation between
personality traits and leadership perceptions: An application of validity generalization
procedures. Journal of Applied Psychology, 71, 3, 402-410.
Lowe, K. B., Kroeck, K. G., & Sivasubramaniam, N. (1996). Effectiveness correlates of
transformational and transactional leadership: A meta-analytic review of the MLQ
literature. The Leadership Quarterly, 7, 3, 385-425.
Mabe, P. A., & West, S. G. (1982). Validity of self-evaluation of ability: A review and meta-
analysis. Journal of Applied Psychology, 67, 3, 280-296.
Mann, R. D. (1959). A review of the relationships between personality and performance in small
groups. Psychological Bulletin, 56, 4, 241-270.
Martin, R. R., Thomas, G. G., Charles, K. K., Epitropaki, O. O., & McNamara, R. R. (2005). The
role of leader-member exchanges in mediating the relationship between locus of control
and work reactions. Journal Of Occupational & Organizational Psychology, 78, 1, 141-
147.
McSweeney, B. (2002). Hofstede's model of national cultural differences and their
consequences: A triumph of faith - a failure of analysis. Human Relations, 55, 1, 89-118.
Meyer, J. P., & Allen, N. J. (1991). A three-component conceptualization of organizational
commitment. Human Resource Management Review, 1, 1, 61-89.

154
Meyer, J. P., & Allen, N. J. (1997). Commitment in the workplace: Theory, research, and
application. Thousand Oaks, Calif: Sage Publications.
Meyer, J. P., Stanley, D. J., Herscovitch, L., & Topolnytsky, L. (2002). Affective, Continuance,
and Normative Commitment to the Organization: A Meta-analysis of Antecedents,
Correlates, and Consequences. Journal of Vocational Behavior, 61, 1, 20-52.
Mitchell, T. R. (1974). Expectancy models of job satisfaction, occupational preference and
effort: A theoretical, methodological, and empirical appraisal. Psychological Bulletin,
81, 12, 1053-1077.
Moshavi, D., Brown, F. W., & Dodd, N. G. (2003). Leader self-awareness and its relationship to
subordinate attitudes and performance. Leadership and Organizational Development
Journal, 24, 407−418.
Mowday, R. T., Porter, L. W., & Steers, R. M. (1982). Employee-organization linkages: The
psychology of commitment, absenteeism, and turnover. New York: Academic Press.
Muczyk, J., & Holt, D. (2008). Toward a Cultural Contingency Model of Leadership. Journal of
Leadership & Organizational Studies, 14, 4, 277-286.
Newman, K. L., & Nollen, S. D. (1996). Culture and congruence: the fit between management
practices and national culture. Journal of International Business Studies, 27, 4, 753-779.
Northouse, P. G. (2004). Leadership: Theory and practice. Thousand Oaks, Calif: Sage.
Northouse, P. G. (2007). Leadership: Theory and practice. Thousand Oaks: SAGE Publications.
Northouse, P. G. (2009). Introduction to leadership: Concepts and practice. Los Angeles: Sage
Publications.
Northouse, P. G. (2009b). Leadership: Theory and practice. Thousand Oaks, California: Sage.

155
Ostroff, C., Atwater, L. E., & Feinberg, B. J. (2004). Understanding self–other agreement: A
look at rater and ratee characteristics, context, and outcomes. Personnel Psychology, 57,
2, 333−375.
Palestini, R. H. (2009). From leadership theory to practice: A game plan for success as a leader.
Lanham: Rowman & Littlefield Education.
Pheng, L. S., & Yuquan, S. (2002). An exploratory study of Hofstede’s cross-cultural dimensions
in construction projects. Management Decision, 40, 1, 7-16.
Pierce, J. L., & Newstrom, J. W. (2006). Leaders & the leadership process: Readings, self-
assessments & applications. Boston: McGraw-Hill Irwin.
Podsakoff, P., & Organ, D. (1986). Self-reports in organizational research: Problems and
prospects. Journal of Management, 12, 4, 531−544.
Puffer, S. (1993). A riddle wrapped in an enigma: Demystifying Russian managerial motivation.
European Management Journal, 11, 4, 473-480.
Qureshi, J., Hayat, K., Ali, M., & Sarwat, N. (2011). Impact of Job Satisfaction and
Organizational Commitment on Employee Performance, Evidence from Pakistan.
Interdisciplinary Journal Of Contemporary Research In Business, 3, 4, 642-657.
Rahim, S. H. (2010). Emotional Intelligence and Stress: An Analytical. International Journal of
Trade, Economics and Finance, 1, 2.
Ristow, A. M., Amos, T. L., & Staude, G. E. (1999). Transformational leadership and
organizational effectiveness in the administration of cricket in South Africa. South
African Journal of Business Management, 30, 1, 1–5.
Rousseau, D. M., & Fried, Y. (2001). Location, location, location: contextualizing organizational
research. Journal of Organizational Behavior, 22, 1, 1-13.
156
Schein, E. H. (1985). Organizational culture and leadership. San Francisco: Jossey-Bass
Publishers.
Schein, E. H. (1992). Organizational culture and leadership. San Francisco: Jossey-Bass.
Schneider, S. C., & Meyer, A. (1991). Interpreting and responding to strategic issues: The impact
of national culture. Strategic Management Journal, 12, 4, 307-320.
Scott, W. R., & Meyer, J. W. (1994). Institutional environments and organizations: Structural
complexity and individualism. Thousand Oaks, Calif: SAGE Publications.
Shahzad, K., Rehman, K. U. & Abbas, M. (2010). HR practices and leadership styles as
predictors of employee attitude and behavior: Evidence from Pakistan. European Journal
of Social Sciences, 14, 3, 417-426.
Shung Jae, S., & Jing, Z. (2003). Transformational Leadership, Conservation, and Creativity:
Evidence from Korea. Academy Of Management Journal, 46, 6, 703-714.
Sinha, D. (1984). Psychology in the Context of Third World Development. International Journal
of Psychology, 19, 1-4, 17-29.
Smith, A., & Fortunato, V. (2008). Factors Influencing Employee Intentions to Provide Honest
Upward Feedback Ratings. Journal of Business & Psychology, 22, 3, 191-207.
Spinelli, R. J. (2006). The Applicability of Bass's Model of Transformational, Transactional, and
Laissez-Faire Leadership in the Hospital Administrative Environment. Hospital Topics,
84, 2, 11-19.
Steers, R. M. (1977). Antecedents and Outcomes of Organizational Commitment. Administrative
Science Quarterly, 22, 1, 46-56.
Stogdill, R. M. (1974). Handbook of leadership: A survey of theory and research. New York:
Free Press.

157
Stogdill, R. M., & Bass, B. M. (1981). Stogdill's handbook of leadership: A survey of theory and
research. New York: Free Press.
Stogdill, R. M., & Coons, A. E. (1957). Leader behavior: Its description and measurement.
Columbus: Bureau of Business Research, College of Commerce and Administration,
Ohio State University.
Tabachnick, B. G., & Fidell, L. S. (1996). Using multivariate statistics. New York, NY:
HarperCollins College Publishers.
Tabachnick, B. G., & Fidell, L. S. (2013). Using multivariate statistics. Boston: Pearson
Education.
Tannenbaum, R., & Schmidt, W. H. (1973). How to choose a leadership pattern. Harvard
Business Review, 51, 162-164.
Trompenaars, F., & Hampden-Turner, C. (2012). Riding the waves of culture: Understanding
diversity in global business. London: Nicholas Brealey.
Vecchio, R. P., & Anderson, R. J. (2009). Agreement in self–others' ratings of leader
effectiveness: The role of demographics and personality. International Journal of
Selection and Assessment, 17, 2, 165−179.
Vigoda-Gadot, E. (2007). Leadership style, organizational politics, and employees'
performance: An empirical examination of two competing models. Personnel Review, 36,
5, 661-683.
Visser, B. A., Ashton, M. C., & Vernon, P. A. (2008). What makes you think you're so smart?
Measured abilities, personality, and sex differences in relation to self-estimates of
multiple intelligences. Journal of Individual Differences, 29, 1, 35−44.
158
Willmott, R. (2000). The Place of Culture in Organization Theory: Introducing the
Morphogenetic Approach. Organization, 7, 1, 95-128.
Yammarino, F. J., & Atwater, L. E. (1993). Understanding Self-Perception Accuracy:
Implications for Human Resource Management. Human Resource Management, 32, 2/3,
231-247.
Yammarino, F. J., & Atwater, L. E. (1997). Do Managers See Themselves as Others See Them?
Implications of Self-Other Rating Agreement for Human Resources Management.
Organizational Dynamics, 25, 4, 35-44.
Young, E. M. W. (1980). A study of the self-perception and subordinate perception of the
leadership behavior of black library directors. (Doctoral dissertation, Peabody College
for Teachers of Vanderbilt University). Retrieved from
http://search.proquest.com/docview/303000422?accountid=14553.
Yukl, G. A. (2001). Leadership in organizations. Upper Saddle River, NJ: Prentice Hall.
Yukl, G. A. (2002). Leadership in organizations. Upper Saddle River, NJ: Prentice Hall.
Zagorsek, H., Jaklic, M., & Stough, S. J. (2004). Comparing leadership practices between the
United States, Nigeria, and Slovenia: does culture matter?. Cross Cultural Management,
11, 2, 16-34.
Zigarmi, D., Edeburn, C., Blanchard, K., & O'Connor, M. (2005). The Leader within: Learning
Enough About Yourself to Lead Others. Harlow: Pearson Professional Education.
i http://en.wikipedia.org/wiki/Administrative_units_of_Pakistan Retrieved on October 14, 2012 ii http://en.wikipedia.org/wiki/Sindh Retrieved on October 14, 2012 iii http://geert-hofstede.com/pakistan.html (Retrieved on March 13, 2012) iv http://www.sbp.org.pk/about/speech/financial_sector/2005/BANKING_SECTOR_REFORMS.pdf
(Retrieved on March 2, 2012) v http://www.mindgarden.com/products/mlqr.htm#mlqrs (Retrieved on March 22, 2012) vi http://www.hbl.com/downloads/pdf/Code-Of-Ethics-HBL.pdf (Retrieved on September 30, 2013) vii http://www.osec.ch/sites/default/files/PakistanBankingSector2011.pdf (Retrieved on March 27, 2012)

159
viii http://www.mindgarden.com/products/mlqr.htm#mlqrs (Retrieved on March 22, 2012) ix http://www.mindgarden.com/faq.htm Retrieved on February 15, 2014

160
APPENDIX A
INSTRUMENTS

161

162
OCQ Scale
(For Managers)
1. It would be hard for me to leave this bank right now, even if I wanted to
2. I do not feel any obligation to remain with my current employer (bank)
3. I would be very happy to spend the rest of my career with this bank
4. One of the few negative consequences of leaving this bank would be the scarcity of
available alternatives
5. Even if it were to my advantage, I do not feel it would be right to leave my
organization now

163
OCQ Scale
(For Subordinates)
1. It would be hard for my subordinates to leave this bank right now, even if they
wanted to
2. My subordinates do not feel any obligation to remain at current bank
3. My subordinates would be very happy to spend the rest of their career with this
bank
4. One of the few negative consequences of leaving this bank would be the scarcity of
available alternatives
5. Even if it were to their advantage, they do not feel it right to leave this bank

164
APPENDIX B
PERMISSION LETTERS TO USE INSTRUMENTS

165
(Permission to Use OCQ)
from: John Meyer [email protected]
to: M Asrar-ul-Haq <[email protected]>
subject: RE: Permission to use Organizational Commitment Questionnaire (OCQ)
Greetings,
Thank you for your interest in our work. You can get the commitment scales and permission to use them for academic research purposes from the following website: http://employeecommitment.com. I hope that all goes well with your research.
Best regards,
John Meyer
Dr. John Meyer Department of Psychology Rm 8411, Social Science Centre Western University London, Ontario, Canada N6A 5C2 Phone: (519) 661-3679 Fax: (519) 661-3961 Email: [email protected]
* Note: The academic license is free of charge and intended for academic use only. If you wish to use the
product in a commerical application, please obtain a commercial license by purchasing. Retrieved from
http://employeecommitment.com/

166
APPENDIX C
CONSENT LETTER
Dear Participant:
I am a faculty member at the COMSATS Institute of Information Technology (CIIT) and
pursuing my Ph.D in Human Resource Development (HRD) at the University of Illinois at
Urbana-Champaign (UIUC), the USA. I am working on a research project titled 'congruence
among the leaders' (self) and their subordinates' perceptions about their leadership styles and
performance in the banking sector of Pakistan'. This research is being supervised by Dr. K. Peter
Kuchinke, Professor at UIUC. I would like to invite you to participate in this research study.
The purpose of this study is to examine the leadership styles and its impacts on subordinates'
attitudes towards their leaders' performance and their readiness to exert extra efforts on the
current job in Pakistan. Managers will be requested to consider their own leadership style (how
they perceive about themselves) and subordinates will consider the leadership style of their
managers. Both groups will be requested to fill out a short questionnaire based on their
perceptions. The findings of this study may help managers to understand the perceptions and
needs of their subordinates and adopt appropriate leadership styles. In addition, the overall
findings of the study may be shared with the respondents that might affect their job satisfaction,
commitment and performance. It will help to create a more pleasant, effective, and productive
environment. Moreover, information about any particular branch or person will not be shared
with anyone.
Your participation in this study is voluntary and we anticipate no risk other than you experience
in your normal life. There is no such question that may reveal your personal information. The
information about any particular branch will not be shown and discussed in the study. The results
of the study will be presented in relation to combined responses of multiple branches/banks. The
survey will take maximum twenty minutes and your identity in this study is confidential and only
researchers will have access to the collected data and will maintain confidentiality of your
records. However, if you want to skip any question or quit your participation in this study at any
stage, you can do without any penalty. If you need any further information about this study or
your participation, please feel free to contact the researchers at [email protected] or
If you have any questions about your rights as a participant in this study or any concerns or
complaints, please contact the University of Illinois Institutional Review Board at 001-217-333-
2670 (collect calls will be accepted if you identify yourself as a research participant) or via email
at [email protected]. Please print a copy for your record and click yes to participate in survey or
click no to exit.
I understand the risks and benefits of this research study and agree to participate in this
research study:
Yes:
No:

167
APPENDIX D
OUTLIER ANALYSIS
Managers
Figure 1D: Transformational Leadership
Figure 2D: Laissez-faire Leadership

168
Figure 3D: Idealized Influence (Attributed)
Figure 4D: Idealized Influence (Behavior)

169
Figure 5D: Inspirational Motivation
Figure 6D: Intellectual Stimulation

170
Figure 7D: Individualized Consideration
Figure 8D: Contingent Reward

171
Figure 9D: Management by Exception (Active)
Figure 10D: Management by Exception (Passive)
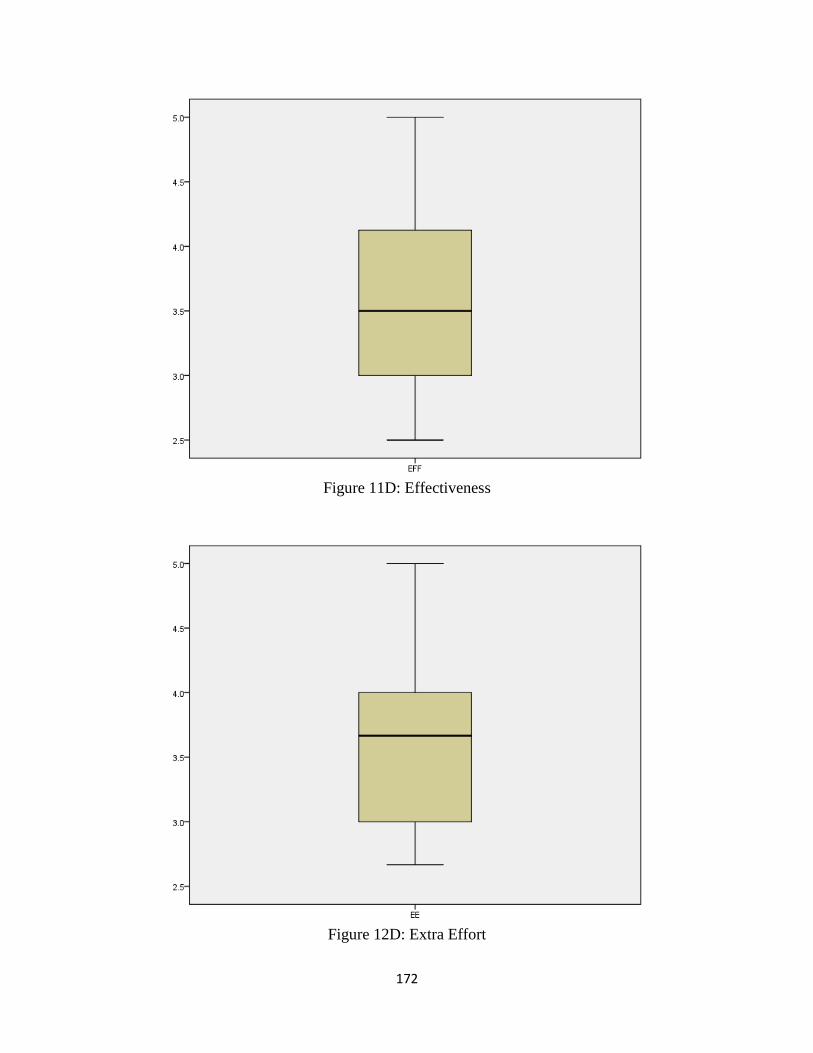
172
Figure 11D: Effectiveness
Figure 12D: Extra Effort

173
Figure 13D: Satisfaction
Figure 14D: Affective Commitment

174
Figure 15D: Continuance Commitment
Figure 16D: Normative Commitment

175
Subordinates
Figure 17D: Transformational Leadership
Figure 18D: Laissez-faire Leadership

176
Figure 19D: Idealized Influence (Attributed)
Figure 20D: Idealized Influence (Behavior)

177
Figure 21D: Inspirational Motivation
Figure 22D: Intellectual Stimulation

178
Figure 23D: Individualized Consideration
Figure 24D: Contingent Reward
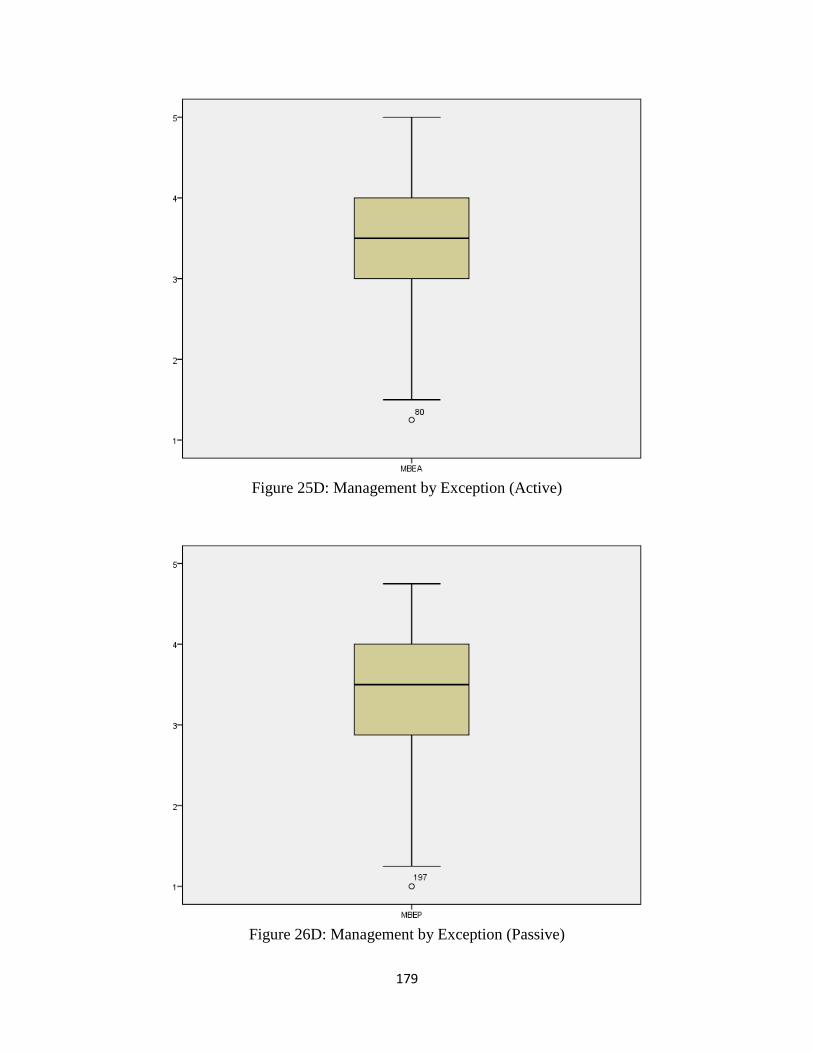
179
Figure 25D: Management by Exception (Active)
Figure 26D: Management by Exception (Passive)
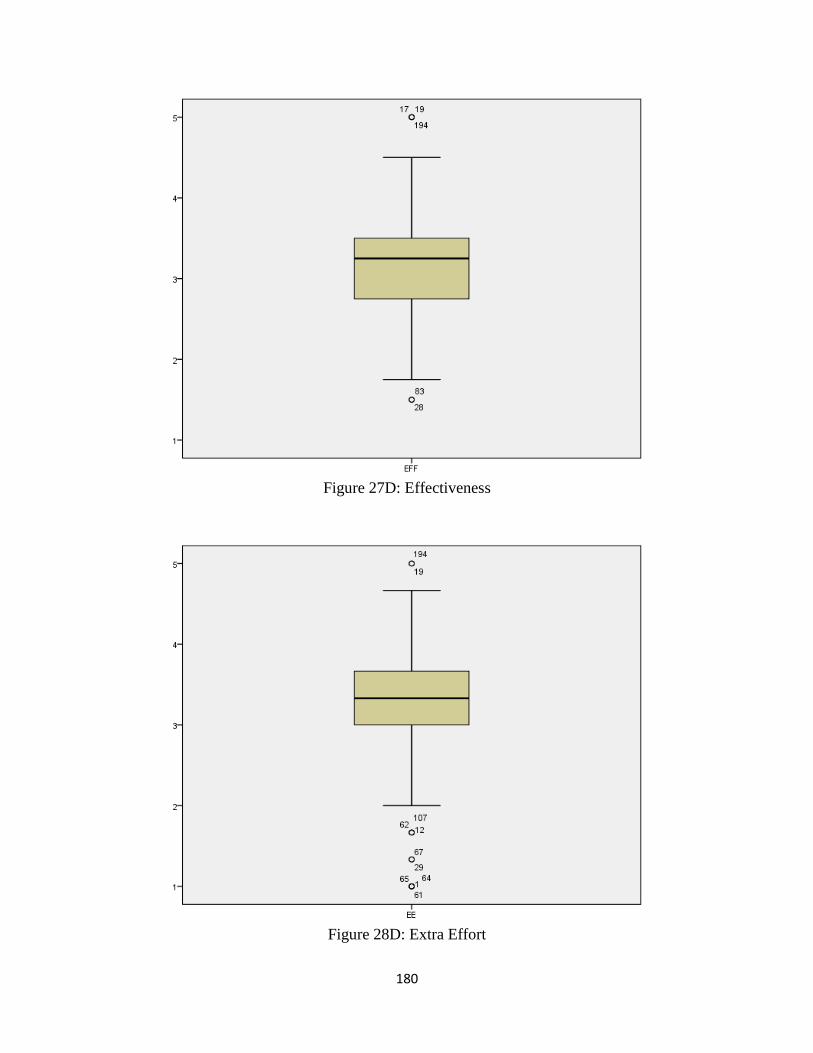
180
Figure 27D: Effectiveness
Figure 28D: Extra Effort

181
Figure 29D: Satisfaction
Figure 30D: Affective Commitment

182
Figure 31D: Continuance Commitment
Figure 32D: Normative Commitment

183
APPENDIX E
DESCRIPTIVE STATISTICS FOR LEADERSHIP STYLES AND PERFORMANCE
Table 1E
Gender Based Descriptive Statistics for Leadership Styles and Performance
Managers Subordinates
Male Female Male Female
n M SD n M SD n M SD n M SD
IIA 56 3.76 0.57 6 3.92 0.20 144 3.45 0.66 70 3.59 0.65
IIB 56 3.69 0.53 6 3.25 0.39 144 3.28 0.61 70 3.20 0.51
IM 56 3.88 0.68 6 3.58 0.47 144 3.26 0.59 70 3.30 0.55
IS 56 3.71 0.58 6 3.17 0.30 144 3.20 0.62 70 3.02 0.53
IC 56 3.85 0.50 6 3.88 0.34 144 3.40 0.69 70 3.56 0.64
CR 56 3.67 0.66 6 3.63 0.26 144 3.17 0.54 70 3.24 0.61
MBEA 56 4.02 0.55 6 4.38 0.21 144 3.47 0.67 70 3.80 0.73
MBEP 56 3.04 0.91 6 3.93 0.47 144 3.25 0.77 70 3.55 0.68
LF 56 2.61 1.02 6 3.29 0.29 144 2.85 0.64 70 2.98 0.54
EFF 56 3.70 0.64 6 3.33 0.30 144 3.12 0.62 70 3.38 0.60
EE 56 3.72 0.63 6 3.22 0.27 144 3.16 0.76 70 3.27 0.57
SAT 56 3.61 0.86 6 2.50 0.32 144 2.99 1.01 70 2.81 0.85
ACOM 56 3.15 0.77 6 3.11 0.49 144 2.94 0.44 70 2.99 0.57
CCOM 56 3.42 0.49 6 3.75 0.14 144 3.25 0.53 70 3.16 0.63
NCOM 56 3.22 0.62 6 3.33 0.67 144 2.98 0.63 70 3.12 0.63

184
Table 2E
Age Based Descriptive Statistics for Leadership Styles and Performance
Managers Subordinates
35 years or less 36 years or above 35 years or less 36 years or above
n M SD n M SD n M SD n M SD
IIA 36 3.77 0.62 19 3.80 0.46 199 3.53 0.66 15 3.23 0.58
IIB 36 3.59 0.56 19 3.79 0.52 199 3.30 0.58 15 2.82 0.54
IM 36 3.79 0.70 19 3.96 0.69 199 3.29 0.60 15 3.13 0.43
IS 36 3.55 0.57 19 3.87 0.63 199 3.16 0.61 15 2.98 0.59
IC 36 3.89 0.50 19 3.82 0.48 199 3.46 0.68 15 3.33 0.49
CR 36 3.62 0.57 19 3.86 0.72 199 3.21 0.56 15 3.01 0.51
MBEA 36 4.12 0.56 19 3.95 0.48 199 3.57 0.69 15 3.59 0.87
MBEP 36 3.21 0.97 19 2.98 0.84 199 3.36 0.74 15 3.14 0.87
LF 36 2.75 1.01 19 2.42 0.98 199 2.91 0.63 15 2.79 0.58
EFF 36 3.59 0.58 19 3.89 0.66 199 3.23 0.62 15 2.91 0.64
EE 36 3.56 0.53 19 3.84 0.77 199 3.23 0.68 15 2.80 0.84
SAT 36 3.38 0.98 19 3.74 0.73 199 2.96 0.94 15 2.73 1.07
ACOM 36 3.10 0.80 19 3.28 0.71 199 2.92 0.50 15 2.94 0.43
CCOM 36 3.53 0.42 19 3.45 0.53 199 3.22 0.56 15 3.40 0.49
NCOM 36 3.19 0.73 19 3.31 0.41 199 3.01 0.63 15 2.94 0.64

185
Table 3E
Education Based Descriptive Statistics for Leadership Styles and Performance
Managers Subordinates
More than 16
years degree
Less than 16
years degree
More than 16 years
degree
Less than 16 years
degree
n M SD n M SD n M SD n M SD
IIA 50 3.82 0.51 8 3.53 0.84 189 3.50 0.65 24 3.55 0.81
IIB 50 3.63 0.57 8 3.63 0.42 189 3.25 0.59 24 3.19 0.53
IM 50 3.87 0.62 8 3.81 0.90 189 3.28 0.58 24 3.22 0.55
IS 50 3.66 0.57 8 3.69 0.58 189 3.13 0.60 24 3.46 0.62
IC 50 3.94 0.48 8 3.47 0.34 189 3.46 0.65 24 3.51 0.83
CR 50 3.68 0.63 8 3.63 0.71 189 3.20 0.55 24 3.06 0.67
MBEA 50 4.10 0.51 8 3.81 0.85 189 3.60 0.72 24 3.51 0.62
MBEP 50 3.19 0.90 8 2.53 1.01 189 3.35 0.74 24 3.27 0.91
LF 50 2.74 1.04 8 2.20 0.87 189 2.91 0.59 24 2.81 0.79
EFF 50 3.66 0.63 8 3.75 0.65 189 3.19 0.63 24 3.36 0.61
EE 50 3.62 0.60 8 3.75 0.85 189 3.18 0.70 24 3.27 0.82
SAT 50 3.45 0.93 8 3.94 0.68 189 2.92 0.95 24 3.21 1.02
ACOM 50 3.17 0.71 8 2.69 0.74 189 2.93 0.48 24 2.80 0.57
CCOM 50 3.50 0.46 8 3.40 0.33 189 3.18 0.56 24 3.49 0.49
NCOM 50 3.23 0.55 8 3.13 0.95 189 3.04 0.62 24 2.98 0.72

186
Table 4E
Tenure Based Descriptive Statistics for Leadership Styles and Performance
Managers Subordinates
4 years or
less
5-8 years 9 years or
above
4 years or
less
5-8 years 9 years or
above
n M SD n M SD n M SD n M SD n M SD n M SD
IIA 22 3.86 0.63 20 3.66 0.56 12 3.88 0.46 119 3.54 0.68 63 3.53 0.70 34 3.29 0.51
IIB 22 3.72 0.57 20 3.75 0.59 12 3.54 0.44 119 3.25 0.59 63 3.34 0.55 34 3.23 0.52
IM 22 3.94 0.75 20 3.84 0.65 12 3.90 0.70 119 3.17 0.60 63 3.45 0.57 34 3.38 0.43
IS 22 3.60 0.57 20 3.72 0.60 12 3.83 0.68 119 3.14 0.56 63 3.24 0.53 34 3.27 0.73
IC 22 3.80 0.50 20 3.85 0.53 12 4.06 0.39 119 3.48 0.65 63 3.48 0.73 34 3.45 0.54
CR 22 3.61 0.67 20 3.81 0.58 12 3.79 0.72 119 3.22 0.56 63 3.16 0.56 34 3.21 0.50
MBEA 22 4.16 0.62 20 4.00 0.47 12 3.98 0.49 119 3.58 0.74 63 3.63 0.63 34 3.54 0.61
MBEP 22 3.02 1.04 20 3.05 0.91 12 3.19 0.80 119 3.37 0.78 63 3.43 0.66 34 3.19 0.75
LF 22 2.59 1.06 20 2.56 1.12 12 2.71 0.82 119 2.89 0.58 63 2.96 0.62 34 2.96 0.65
EFF 22 3.75 0.61 20 3.71 0.67 12 3.58 0.62 119 3.17 0.56 63 3.25 0.67 34 3.25 0.65
EE 22 3.79 0.77 20 3.62 0.52 12 3.53 0.54 119 3.14 0.70 63 3.35 0.60 34 3.13 0.81
SAT 22 3.75 0.87 20 3.63 0.97 12 3.08 0.76 119 2.89 0.95 63 3.03 0.94 34 3.10 0.92
ACOM 22 3.05 0.93 20 3.19 0.64 12 3.08 0.55 119 2.90 0.50 63 2.99 0.48 34 2.97 0.50
CCOM 22 3.43 0.50 20 3.43 0.49 12 3.64 0.34 119 3.21 0.62 63 3.13 0.44 34 3.45 0.54
NCOM 22 3.17 0.81 20 3.27 0.50 12 3.29 0.46 119 3.02 0.63 63 2.96 0.59 34 3.17 0.70

187
APPENDIX F
PARAMETER ESTIMATES AND POST HOC (TUKEY) ANALYSIS
Table 1F
Parameter Estimates and Post Hoc (Tukey) Analysis for Transformational Leadership
Parameter dM SE t p 95% CI
Without Rank
GEN (male vs. female) -0.03 0.13 -0.24 .811 (-0.29, 0.23)
AGE (35 years or less vs. 36 years
or above
0.09 0.18 0.53 .600 (-0.26, 0.45)
EDU (16 years degree or above vs.
less than 16 years degree)
0.07 0.18 0.40 .688 (-0.29, 0.43)
TEN
4 years or less vs. 5-8 years -0.09 0.13 .766 (-0.4, 0.22)
5-8 years vs. 9 years or above 0.16 0.18 .626 (-0.25, 0.58)
9 years or above vs. 4 years or
less
-0.07 0.16 .901 (-0.46, 0.32)
With Rank
GEN (male vs. female) -0.04 0.13 -0.27 .787 (-0.3, 0.23)
AGE (35 years or less vs. 36 years
or above
0.11 0.19 0.56 .575 (-0.27, 0.48)
EDU (16 years degree or above vs.
less than 16 years degree)
0.07 0.18 0.41 .683 (-0.28, 0.43)
TEN
4 years or less vs. 5-8 years -0.09 0.13 .767 (-0.4, 0.22)
5-8 years vs. 9 years or above 0.16 0.18 .627 (-0.25, 0.58)
9 years or above vs. 4 years or
less
-0.07 0.17 .901 (-0.46, 0.32)
RANK: (managers vs subordinates) 0.03 0.16 0.20 .838 (-0.27, 0.34)

188
Table 2F
Parameter Estimates and Post Hoc (Tukey) Analysis for Laissez-Faire Leadership
Parameter dM SE t p 95% CI
Without Rank
GEN (male vs. female) -0.22 0.10 -2.15 .032 (-0.43, -0.02)
AGE (35 years or less vs. 36 years
or above
0.30 0.14 2.10 .037 (0.02, 0.58)
EDU (16 years degree or above vs.
less than 16 years degree)
0.19 0.14 1.34 .182 (-0.09, 0.47)
TEN
4 years or less vs. 5-8 years -0.01 0.1 .996 (-0.25, 0.24)
5-8 years vs. 9 years or above -0.06 0.14 .907 (-0.39, 0.27)
9 years or above vs. 4 years or
less
0.07 0.13 .864 (-0.24, 0.37)
With Rank
GEN (male vs. female) -0.19 0.10 -1.84 .066 (-0.4, 0.01)
AGE (35 years or less vs. 36 years
or above
0.22 0.15 1.49 .137 (-0.07, 0.51)
EDU (16 years degree or above vs.
less than 16 years degree)
0.18 0.14 1.27 .205 (-0.1, 0.46)
TEN
4 years or less vs. 5-8 years -0.01 0.1 .996 (-0.25, 0.24)
5-8 years vs. 9 years or above -0.06 0.14 .907 (-0.39, 0.27)
9 years or above vs. 4 years or
less
0.07 0.13 .863 (-0.24, 0.37)
RANK: (managers vs subordinates) -0.20 0.12 -1.68 .094 (-0.44, 0.04)

189
Table 3F
Parameter Estimates and Post Hoc (Tukey) Analysis for Idealized Influence (Attributed)
Parameter dM SE t p 95% CI
Without Rank
GEN (male vs. female) -0.09 0.09 -0.93 .354 (-0.27, 0.1)
AGE (35 years or less vs. 36 years
or above
-0.03 0.13 -0.22 .829 (-0.28, 0.23)
EDU (16 years degree or above vs.
less than 16 years degree)
0.08 0.13 0.62 .534 (-0.18, 0.34)
TEN
4 years or less vs. 5-8 years 0.08 0.09 .693 (-0.15, 0.3)
5-8 years vs. 9 years or above 0.11 0.13 .640 (-0.19, 0.41)
9 years or above vs. 4 years or
less
-0.19 0.12 .237 (-0.47, 0.09)
With Rank
GEN (male vs. female) -0.14 0.09 -1.46 .146 (-0.32, 0.05)
AGE (35 years or less vs. 36 years
or above
0.10 0.13 0.74 .457 (-0.16, 0.36)
EDU (16 years degree or above vs.
less than 16 years degree)
0.10 0.13 0.76 .446 (-0.16, 0.35)
TEN
4 years or less vs. 5-8 years 0.08 0.09 .683 (-0.14, 0.3)
5-8 years vs. 9 years or above 0.11 0.12 .629 (-0.18, 0.41)
9 years or above vs. 4 years or
less
-0.19 0.12 .225 (-0.47, 0.08)
RANK: (managers vs subordinates) 0.34 0.11 3.12 .002 (0.13, 0.56)

190
Table 4F
Parameter Estimates and Post Hoc (Tukey) Analysis for Idealized Influence (Behavior)
Parameter dM SE t P 95% CI
Without Rank
GEN (male vs. female) 0.16 0.08 1.92 .056 (0, 0.32)
AGE (35 years or less vs. 36 years
or above
0.02 0.11 0.15 .884 (-0.21, 0.24)
EDU (16 years degree or above vs.
less than 16 years degree)
0.05 0.11 0.41 .680 (-0.18, 0.27)
TEN
4 years or less vs. 5-8 years -0.07 0.08 .687 (-0.26, 0.13)
5-8 years vs. 9 years or above 0.13 0.11 .482 (-0.13, 0.39)
9 years or above vs. 4 years or
less
-0.06 0.1 .832 (-0.3, 0.18)
With Rank
GEN (male vs. female) 0.10 0.08 1.23 .221 (-0.06, 0.26)
AGE (35 years or less vs. 36 years
or above
0.17 0.11 1.47 .142 (-0.06, 0.39)
EDU (16 years degree or above vs.
less than 16 years degree)
0.07 0.11 0.61 .542 (-0.15, 0.28)
TEN
4 years or less vs. 5-8 years -0.07 0.08 .668 (-0.26, 0.12)
5-8 years vs. 9 years or above 0.13 0.11 .456 (-0.12, 0.38)
9 years or above vs. 4 years or
less
-0.06 0.1 .820 (-0.29, 0.18)
RANK: (managers vs subordinates) 0.41 0.09 4.35 <.001 (0.22, 0.59)

191
Table 5F
Parameter Estimates and Post Hoc (Tukey) Analysis for Inspirational Motivation
Parameter dM SE t P 95% CI
Without Rank
GEN (male vs. female) 0.05 0.09 0.52 .603 (-0.13, 0.23)
AGE (35 years or less vs. 36 years
or above
-0.20 0.13 -1.59 .113 (-0.45, 0.05)
EDU (16 years degree or above vs.
less than 16 years degree)
0.05 0.13 0.36 .717 (-0.2, 0.3)
TEN
4 years or less vs. 5-8 years -0.21 0.09 .066 (-0.42, 0.01)
5-8 years vs. 9 years or above 0.08 0.12 .796 (-0.21, 0.37)
9 years or above vs. 4 years or
less
0.13 0.12 .512 (-0.14, 0.4)
With Rank
GEN (male vs. female) -0.03 0.09 -0.39 .697 (-0.21, 0.14)
AGE (35 years or less vs. 36 years
or above
0.01 0.12 0.08 .936 (-0.24, 0.26)
EDU (16 years degree or above vs.
less than 16 years degree)
0.07 0.12 0.62 .539 (-0.16, 0.31)
TEN
4 years or less vs. 5-8 years -0.21 0.09 .047 (-0.41, 0)
5-8 years vs. 9 years or above 0.08 0.12 .774 (-0.2, 0.35)
9 years or above vs. 4 years or
less
0.13 0.11 .472 (-0.13, 0.38)
RANK: (managers vs subordinates) 0.56 0.10 5.51 <.001 (0.36, 0.76)

192
Table 6F
Parameter Estimates and Post Hoc (Tukey) Analysis for Intellectual Stimulation
Parameter dM SE t p 95% CI
Without Rank
GEN (male vs. female) 0.23 0.09 2.66 .008 (0.06, 0.4)
AGE (35 years or less vs. 36 years
or above
-0.25 0.12 -2.10 .037 (-0.49, -0.02)
EDU (16 years degree or above vs.
less than 16 years degree)
-0.25 0.12 -2.09 .038 (-0.49, -0.01)
TEN
4 years or less vs. 5-8 years -0.17 0.09 .116 (-0.38, 0.03)
5-8 years vs. 9 years or above 0 0.12 1.000 (-0.27, 0.28)
9 years or above vs. 4 years or
less
0.17 0.11 .261 (-0.09, 0.43)
With Rank
GEN (male vs. female) 0.17 0.09 1.98 .049 (0, 0.34)
AGE (35 years or less vs. 36 years
or above
-0.09 0.12 -0.74 .460 (-0.33, 0.15)
EDU (16 years degree or above vs.
less than 16 years degree)
-0.23 0.12 -1.98 .049 (-0.46, 0)
TEN
4 years or less vs. 5-8 years -0.17 0.08 .098 (-0.37, 0.02)
5-8 years vs. 9 years or above 0 0.11 1.000 (-0.26, 0.27)
9 years or above vs. 4 years or
less
0.17 0.11 .236 (-0.08, 0.42)
RANK: (managers vs subordinates) 0.43 0.10 4.37 <.001 (0.24, 0.63)

193
Table 7F
Parameter Estimates and Post Hoc (Tukey) Analysis for Individualized Consideration
Parameter dM SE t p 95% CI
Without Rank
GEN (male vs. female) -0.04 0.10 -0.42 .673 (-0.23, 0.15)
AGE (35 years or less vs. 36 years
or above
-0.06 0.13 -0.44 .659 (-0.32, 0.2)
EDU (16 years degree or above vs.
less than 16 years degree)
0.08 0.13 0.58 .562 (-0.18, 0.34)
TEN
4 years or less vs. 5-8 years -0.02 0.1 .976 (-0.25, 0.21)
5-8 years vs. 9 years or above -0.05 0.13 .912 (-0.36, 0.25)
9 years or above vs. 4 years or
less
0.07 0.12 .817 (-0.21, 0.36)
With Rank
GEN (male vs. female) -0.11 0.09 -1.14 .254 (-0.29, 0.08)
AGE (35 years or less vs. 36 years
or above
0.11 0.13 0.85 .394 (-0.15, 0.38)
EDU (16 years degree or above vs.
less than 16 years degree)
0.10 0.13 0.78 .438 (-0.15, 0.35)
TEN
4 years or less vs. 5-8 years -0.02 0.09 .975 (-0.24, 0.2)
5-8 years vs. 9 years or above -0.05 0.12 .906 (-0.35, 0.24)
9 years or above vs. 4 years or
less
0.07 0.12 .805 (-0.2, 0.35)
RANK: (managers vs subordinates) 0.46 0.11 4.21 <.001 (0.24, 0.67)

194
Table 8F
Parameter Estimates and Post Hoc (Tukey) Analysis for Contingent Reward
Parameter dM SE t p 95% CI
Without Rank
GEN (male vs. female) 0.01 0.09 0.06 .949 (-0.17, 0.18)
AGE (35 years or less vs. 36 years
or above
-0.21 0.12 -1.75 .082 (-0.45, 0.03)
EDU (16 years degree or above vs.
less than 16 years degree)
0.11 0.12 0.88 .381 (-0.13, 0.35)
TEN
4 years or less vs. 5-8 years -0.03 0.09 .955 (-0.24, 0.18)
5-8 years vs. 9 years or above 0.01 0.12 .999 (-0.28, 0.29)
9 years or above vs. 4 years or
less
0.02 0.11 .983 (-0.24, 0.28)
With Rank
GEN (male vs. female) -0.07 0.09 -0.81 .417 (-0.24, 0.1)
AGE (35 years or less vs. 36 years
or above
-0.02 0.12 -0.16 .869 (-0.26, 0.22)
EDU (16 years degree or above vs.
less than 16 years degree)
0.13 0.12 1.14 .255 (-0.1, 0.36)
TEN
4 years or less vs. 5-8 years -0.03 0.08 .950 (-0.23, 0.17)
5-8 years vs. 9 years or above 0.01 0.11 .998 (-0.26, 0.27)
9 years or above vs. 4 years or
less
0.02 0.11 .981 (-0.23, 0.27)
RANK: (managers vs subordinates) 0.52 0.10 5.19 <.001 (0.32, 0.71)

195
Table 9F
Parameter Estimates and Post Hoc (Tukey) Analysis for Management by Exception (Active)
Parameter dM SE t p 95% CI
Without Rank
GEN (male vs. female) -0.26 0.10 -2.62 .009 (-0.46, -0.06)
AGE (35 years or less vs. 36 years
or above
-0.25 0.14 -1.80 .073 (-0.52, 0.02)
EDU (16 years degree or above vs.
less than 16 years degree)
0.07 0.14 0.50 .616 (-0.2, 0.34)
TEN
4 years or less vs. 5-8 years -0.03 0.1 .944 (-0.27, 0.2)
5-8 years vs. 9 years or above 0.08 0.14 .831 (-0.24, 0.4)
9 years or above vs. 4 years or
less
-0.05 0.13 .929 (-0.34, 0.25)
With Rank
GEN (male vs. female) -0.34 0.10 -3.51 .001 (-0.53, -0.15)
AGE (35 years or less vs. 36 years
or above
-0.04 0.14 -0.32 .746 (-0.32, 0.23)
EDU (16 years degree or above vs.
less than 16 years degree)
0.10 0.13 0.72 .469 (-0.17, 0.36)
TEN
4 years or less vs. 5-8 years -0.03 0.1 .939 (-0.26, 0.19)
5-8 years vs. 9 years or above 0.08 0.13 .817 (-0.23, 0.38)
9 years or above vs. 4 years or
less
-0.05 0.12 .923 (-0.33, 0.24)
RANK: (managers vs subordinates) 0.54 0.11 4.80 <.001 (0.32, 0.77)

196
Table 10 F
Parameter Estimates and Post Hoc (Tukey) Analysis for Management by Exception (Passive)
Parameter dM SE t p 95% CI
Without Rank
GEN (male vs. female) -0.39 0.11 -3.43 .001 (-0.62, -0.17)
AGE (35 years or less vs. 36 years
or above
0.21 0.16 1.33 .186 (-0.1, 0.52)
EDU (16 years degree or above vs.
less than 16 years degree)
0.18 0.16 1.12 .265 (-0.14, 0.49)
TEN
4 years or less vs. 5-8 years -0.02 0.12 .975 (-0.3, 0.25)
5-8 years vs. 9 years or above 0.12 0.15 .707 (-0.24, 0.49)
9 years or above vs. 4 years or
less
-0.1 0.14 .773 (-0.44, 0.24)
With Rank
GEN (male vs. female) -0.37 0.12 -3.19 .002 (-0.6, -0.14)
AGE (35 years or less vs. 36 years
or above
0.15 0.17 0.91 .365 (-0.18, 0.48)
EDU (16 years degree or above vs.
less than 16 years degree)
0.17 0.16 1.07 .286 (-0.14, 0.48)
TEN
4 years or less vs. 5-8 years -0.02 0.11 .975 (-0.3, 0.25)
5-8 years vs. 9 years or above 0.12 0.15 .706 (-0.24, 0.49)
9 years or above vs. 4 years or
less
-0.1 0.14 .772 (-0.44, 0.24)
RANK: (managers vs subordinates) -0.16 0.14 -1.17 .243 (-0.42, 0.11)