conilurine rodent evolution · 2011. 2. 11. · conilurine rodent evolution: the role of ecology in...
TRANSCRIPT

Conilurine Rodent Evolution:
The role of ecology in modifying evolutionary consequences of environmental change
Thesis submitted by Frederick David Ford BSc (Hon) ANU
In June 2003
for the degree of Doctor of Philosophy in Zoology and Tropical Ecology
within the School of Tropical Biology James Cook University
“Some of these exhibit the close similarity arising from their common
ancestry abroad; others have evolved as peculiar types during prolonged
isolation.”
Ellis Le Geyt Troughton
ii

Statement of Access
I, the undersigned, the author of this thesis, understand that James Cook
University will make the thesis available for use within the university library
and, via the Australian Digital Theses network, for use elsewhere.
I understand that, as an unpublished work, a thesis has significant protection
under the Copyright Act and;
I do not wish to place any further restriction on the access to this work.
iii

Abstract
Conilurine rodents are the most speciose and ecologically diverse rodent group within
Australia. Previous research has demonstrated that conilurines are members of a larger
Australasian Murid tribe, the Hydromyini, and are generally thought to be an endemic
Australian radiation with a fossil history dating to the mid Pliocene. However, monophyly
of conilurines is not well established due to the distant placement of some genera in recent
systematic studies. I investigated the evolution of conilurine rodents using a combination of
molecular and ecological techniques. I examined phylogenetic relationships among all
Australian rodent genera using the mitochondrial control region and a nuclear intron
(DHFR 1). These results suggested that conilurines are monophyletic, and that unresolved
generic relationships within the group are the product of an early savannah radiation.
Building on the results of systematic studies, I examined patterns of speciation and
population divergence in model species and species groups. Bioclimatic range modelling
and some ecological studies were performed to aid interpretation of molecular evolution
within these groups. The overall goal of this thesis is to provide a detailed account of some
evolutionary processes affecting an interesting group for which such information is lacking,
and to highlight the potential of conilurines for evolutionary study in an Australian context.
A more specific goal is to investigate the effect that species ecology has on altering the
evolutionary response of different species to the same environmental stimuli.
Molecular studies identified a number of taxonomic issues within the group. The genera
Notomys, Mastacomys and Pseudomys formed a monophyletic group identified by previous
studies. Mastacomys was placed within Pseudomys, with which it was recently
synonymised, and Notomys was not clearly separable from Pseudomys. Both Notomys and
Mastacomys should be recognised as genera. As a result, Pseudomys was split into several
smaller genera. These included resurrection of the genus Thetomys for P. gracilicaudatus
and P. nanus, and creation of a new genus Phorolithomys for the recently described pebble-
mound mice. A further three groups are apparent within Pseudomys, but splitting of these at
the generic level is contingent on further resolving the placement of several species among
them. Some individuals previously described as P. delicatulus from north-western Australia
iv

appear to be a morphologically cryptic species, and were placed outside the P. delicatulus/
novaehollandiae group in phylogenetic trees. The subspecies P. delicatulus mimulus has no
genetic basis. Pseudomys laborifex is probably a subspecies of P. johnsoni, which is an
unexpected result given the distribution of P. laborifex in the Kimberley, a region
anticipated to contain the sib-taxon to the Top End P. calabyi.
Phylogeographic studies of variation in the mitochondrial control region revealed
significant differences in the evolution of species groups as result of their differing
ecologies. This contrast centres on the morphologically similar pebble-mound mice and
delicate mouse group. These are the largest species groups within the current genus
Pseudomys. Pebble-mound mice are characterised by the fact that they require pebbly
habitat for breeding, and have therefore speciated in allopatry due to erosion and
fragmentation of that habitat. Climatic change has also affected pebble-mound mice, and
has driven recurrent extinction processes, in part re-enforced by the inability of pebble-
mound mice to track climatic change across pebble-free habitats.
The delicate mouse group have distributions primarily determined by climate. This means
they are periodically isolated and bottlenecked, but also experience secondary contact when
conditions permit range expansion. A major finding was that there is no taxon
corresponding to Pseudomys pilligaensis, and that individuals of both P. delicatulus and P.
novaehollandiae have been included within that species. The genetic distinctness of P.
novaehollandiae from P. delicatulus was no greater than that among individuals of P.
delicatulus. Whether P. delicatulus and P. novaehollandiae represent sib-species or
subspecies was not resolved, but evidence of clinal morphology and probable interbreeding
suggests that they have not yet speciated. Pseudomys hermannsburgensis, an arid zone
member of the delicate mice, showed little genetic variability, and no geographical
structuring across a very large distribution. This result is consistent with ecological studies
that show the species possesses morphological adaptations to aridity and exists in relatively
mobile populations. A similar result was found for the co-distributed P. desertor.
v

Patterns of genetic structuring are not predictable based on crude habitat preference. It was
thought a priori that Zyzomys argurus was a taxon with a similar habitat preference to
pebble-mound mice and that it would also exhibit deep genetic structuring between
allopatric populations found in rocky habitats across northern Australia. Previous isozyme
studies did not find such a relationship, and this was confirmed by mtDNA sequencing.
Unlike most other study species, there was no signal from the last glacial maximum,
despite the fact that Z. argurus would not have been able to track climate change as many
species did. A broad climatic tolerance and good dispersal ability seem to explain the lack
of population structuring.
Amplification of nuclear copies of the mitochondrial control region hampered efforts to
study the chestnut mice, P. gracilicaudatus and P. nanus. However, three clean control
region sequences were obtained that apparently confirmed currently recognised species
boundaries. Nuclear copies were also amplified from the pebble-mound mice, but primers
were designed that prevented their hindrance of phylogeographic studies.
The characterisation of evolution among conilurine rodents presented here reveals that
species ecology clearly accounts for many differences in patterns of population divergence
and speciation. I suggest that ecological interpretation of evolutionary pattern can be
extended to a general contrast between the entire conilurine assemblage and marsupials.
vi

Acknowledgements
It is not hard to find those willing to travel the wilder parts of northern Australia, but it is
often a struggle to find people who will embrace the reality of early mornings bashing
through charcoal coated scrub just to scribe a few numbers and catch fleeting glimpses of
small furry creatures. It is even more difficult to find people who will come back for more.
Repeat offenders who provided invaluable help during field trips included Jane Antrobus,
Zoe Baron, Mathu, Laura Inman, Ben Collins, Tabitha Lloyd, Allen McIllwee and Euan
Ritchie. Others proved stoic enough to overcome both the hardships of fieldwork in remote
locations and prolonged exposure to my rambling and sometimes (often?) demanding ways
on long field trips- special thanks to Kathy Tsang, Dave Shevill, Chris Parker, Bob Wong,
Daniel Keating and Kelli Gowland.
Several people have made outstanding contributions. Much of this thesis would not have
happened without the help of Steve Donnellan. Steve provided advice that guided the
direction of molecular research since the beginnings of my project, and his insistent
gathering of tissue samples for the South Australian Museum has allowed the scope of this
thesis to broaden to levels I could not have originally hoped for. Martin Elphinstone has
also been instrumental in shaping the course of my thesis, providing intron primers and
invaluable discussion of molecular issues. Mike Cermak’s Masters thesis left a
considerable legacy of pebble-mound mouse tissues and ecological information from
Hidden Valley on which I have largely built my studies. Mike has continued his assistance
by allowing me access to his data, for which I am extremely grateful. The cooperation of
Hideyuki Tokushimi in studies of mice from the Pilliga region has been particularly fruitful
for me personally, and came at the cost to Hideyuki of the species status of his own study
animals. I am forever grateful for his provision of tissue samples and information regarding
“Pilliga mice”. Thanks to Alice Whetherell for the wonderful drawings of rodents that
brighten up these pages and Emily Bolitho for turning latitudes and longitudes into
meaningful (colourful) maps.
vii

Many people around Australia have provided advice, assistance and tissues samples from
their own parts of the world; John Woinarski, John Griffiths, Greg O’Neil and Michelle
Watson in the Northern Territory, Tony Start and Norah Cooper in Western Australia,
Barbara Wilson in Victoria, Bill Breed in South Australia, Sandy Ingelby and Murray Ellis
in New South Wales, Steve Van Dyck, Peter Sparshott, Craig Eddie, Alex Kutt and Paul
Williams in Queensland.
Those in the Biological Sciences group at JCU have provided day-to-day support and
welcome friendship. The patient efforts of all the technical staff have been extremely
helpful, particularly the accommodating deeds of Rob Gegg, Alan Wignal, Natalie Casey,
Jodie and Ros Burgess, Di MacNamara and Jan Nugent. All members of the Mammal
Ecology lab and Molecular Ecology and Evolution lab have been wonderful workmates,
however special mention must go to Chris Dudgeon for her early help wrestling with DNA,
Euan Ritchie for losing at Boules more often than he won, Jo Isaac for being Jo, Yvette
Williams for not eating my chocolate before 12:00am, Selma for demonstrating lab
blunders that are better avoided, and Julia Gardiner for humouring me by pretending to be
more interested in rodents than she really was. Special thanks to Ben and Anna for putting a
roof over my head for the final weeks of my write-up.
Many landholders, managers and National Parks rangers have obligingly let me roam their
properties chasing rodents. Bill German and Brian Furber have allowed over seven years of
fieldwork on pebble-mound mice to be performed on their properties in Hidden Valley, and
more recently the Australian Wildlife Conservancy has been very supportive of my work
on Mount Zero station. The continued acceptance of my presence and various changing
work plans in Hidden Valley has been a major factor in the advancement and completion of
this thesis. Bill Lennox and Neil Teague of QLD National Parks provided especially
memorable visits to their parks. Rob and Roseanne Campbell of Goondicum were the
epitome of gracious country hosts. Early morning home brews shared in prospector’s
shacks in the back blocks of Mt Britton made the 4:00am starts more bearable, as did the
stories of “Tasmanian Tigers” stalking the hills. Bill Venn ably dealt with my abuse of
protocol regarding use of the Paluma house, which has been a welcome second home over
viii
the last four years. When I wasn’t dedicating myself to mice I was privileged to share my
time with some excellent housemates, among which Charlie my Cockatiel and Hermie my
Turtle had the most persistent smiles. However, Shalon tended to contribute in more
tangible ways, such as paying bills, keeping the place ship-shape, and keeping itinerant
house-mates in line while I abandoned Townsville for months at a time. Steve and Shalon
also provided a home on my return to Townsville to finalise my thesis submission.
No student can be expected to successfully complete a PhD without adequate support from
their supervisors. For my part I have been allowed a wonderful freedom in planning and
conducting my research. I sincerely thank Chris Johnson and David Blair for refining my
ideas, writing, and research persona, while allowing me to indulge in many academic and
recreational side-lines (although David’s increasingly common threats to nail my foot to the
lab floor in the latter half of my study were duly noted1).
Research detailed in this thesis has required constant high levels of funding. I again thank
Chris and David for their efforts in securing and allowing me access to funding from the
Australian Research Council and James Cook University Merit Research Grants scheme.
Financial assistance was also provided by the Royal Zoological Society of New South
Wales via an Ethel Mary Read scholarship, the Australian Geographic Society, a
supplementary IRA grant and a Doctoral Merit Research Scheme grant awarded by School
of Tropical Biology. I also received scholarship in the form of an Australian Postgraduate
Award, and a completion scholarship from James Cook University, which is all that
supports me as I write these acknowledgements. Research was carried out under ethics
permits from the James Cook University (A547) and South Australian ethics committees
(11/2002). Scientific permits: 7824, 9349 (Parks and Wildlife NT), N0/002424/99/SAA,
F1/000391/00/SAA, F1/000391/02/SAA (Parks and Wildlife, QLD), 1444 (Natural
Resources, QLD), permit M24574 and licence 92 (Environment and Heritage, SA),
SF003492 (CALM, WA).
1 and generally ignored
ix

Table of Contents
ABSTRACT .....................................................................................................................................................IV
ACKNOWLEDGEMENTS ............................................................................................................................... VII
TABLE OF CONTENTS......................................................................................................................................X
LIST OF ILLUSTRATIONS AND DIAGRAMS.................................................................................................... XIV
LIST OF TABLES ......................................................................................................................................... XVII
STATEMENT ON SOURCES DECLARATION ................................................................................................. XVIII
TERMINOLOGY AND NOMENCLATURE......................................................................................................... XIX
SECTION 1. BACKGROUND TO AUSTRALIAN RODENT EVOLUTION
CHAPTER 1. GENERAL INTRODUCTION ............................................................................................... 1
1.1 EXPLAINING THE SPECTACULAR RADIATION ............................................................................................. 1
1.1.1 Mice, rats and many questions ......................................................................................................... 1
1.2 FOCAL QUESTIONS .................................................................................................................................... 3
1.2.1 Systematic relationships ................................................................................................................... 3
1.2.2 Speciation studies............................................................................................................................. 4
1.2.3 Ecology and diversification: evolution played out on different stages............................................. 8
1.3 RECONSTRUCTING EVOLUTIONARY PATTERN ......................................................................................... 10
1.4 THESIS STRUCTURE................................................................................................................................. 13
CHAPTER 2. MURID RODENTS IN AUSTRALIA.................................................................................. 14
Chapter summary .................................................................................................................................... 14
2.1 THE MODERN FAUNA .............................................................................................................................. 15
2.1.1 The largest Australian family ......................................................................................................... 15
2.1.2 Discovery and description.............................................................................................................. 17
2.1.3 Relationships within the Hydromyini ............................................................................................. 21
2.2 ORIGINS AND FOSSIL HISTORY OF AUSTRALIAN RODENTS ...................................................................... 28
2.2.1 Origins and Relatives ..................................................................................................................... 28
2.2.2 Fossil history .................................................................................................................................. 30
2.3 EVOLUTION OF THE AUSTRALIAN BIOTA................................................................................................. 36
2.3.1 Climate and Vegetation .................................................................................................................. 36
2.3.2 Recent history of Australian vertebrates ........................................................................................ 41
2.3.3 Relict Savannah diversity ............................................................................................................... 46
2.3.4 Speciation in novel environments: origins of arid zone species diversity ...................................... 51
x

CHAPTER 3. MATERIALS AND METHODS........................................................................................... 56
Methods summary ................................................................................................................................... 56
3.1 MOLECULAR METHODS........................................................................................................................... 57
3.1.1 Sampling and extraction of DNA.................................................................................................... 57
3.1.2 Amplification and sequencing of DNA ........................................................................................... 57
3.1.3 Analysis of sequence data............................................................................................................... 60
3.2 ECOLOGICAL METHODS........................................................................................................................... 62
3.2.1 Ecology of pebble-mound mice ...................................................................................................... 62
3.2.2 BIOCLIM distribution modelling ................................................................................................... 63
SECTION 2. SYSTEMATIC FRAMEWORK FOR AUSTRALIAN RODENT BIOGEOGRAPHY
CHAPTER 4. SPECIES-LEVEL PHYLOGENY OF AUSTRALIAN RODENTS.................................. 65
Chapter summary .................................................................................................................................... 65
4.1 CHAPTER BACKGROUND AND AIMS......................................................................................................... 65
4.2 TISSUE SAMPLES, SEQUENCING AND ANALYSIS....................................................................................... 66
4.3 SPECIES PHYLOGENIES ............................................................................................................................ 69
4.3.1 Mitochondrial control region......................................................................................................... 69
4.3.2 DHFR intron 1 ............................................................................................................................... 73
4.4 A REALISTIC PHYLOGENY: A BIOGEOGRAPHICAL FRAMEWORK .............................................................. 78
4.4.1 Conilurine monophyly: are patterns of endemism indicative of phylogeny?.................................. 78
4.4.2 Generic relationships ..................................................................................................................... 80
4.4.3 Species relationships ...................................................................................................................... 81
4.5 SYNTHESIS.............................................................................................................................................. 94
SECTION 3. PHYLOGEOGRAPHIC CASE STUDIES OF CONILURINE RODENTS
CHAPTER 5. EVOLUTION OF DISTRIBUTIONS AND SPECIES BOUNDARIES WITHIN THE
PEBBLE-MOUND MICE.............................................................................................................................. 97
Chapter summary .................................................................................................................................... 97
5.1 NGADJI AND ITS RELATIVES .................................................................................................................... 98
5.1.1 Pebble-mound mice by name… ...................................................................................................... 98
5.1.2 Ecology of pebble-mound mice .................................................................................................... 100
5.2 GEOGRAPHICAL SAMPLING FOR MOLECULAR STUDIES.......................................................................... 105
5.3 MOLECULAR DIVERGENCE AMONG PEBBLE-MOUND MOUSE POPULATIONS........................................... 108
5.3.1 Mitochondrial control region....................................................................................................... 108
5.3.2 Nuclear introns............................................................................................................................. 114
xi

5.4 EVOLUTION OF THE PEBBLE-MOUND MICE ............................................................................................ 115
5.4.1 How many species of pebble-mound mice are there?................................................................... 115
5.4.2 Geographical distribution of pebble-mound mouse clades and species....................................... 116
5.4.3 Population divergence among pebble-mound mice...................................................................... 118
5.4.4 Speculative history of the pebble-mound mice ............................................................................. 127
5.5 SUMMARY............................................................................................................................................. 130
CHAPTER 6. EVOLUTION OF DISTRIBUTIONS AND SPECIES BOUNDARIES WITHIN THE
DELICATE MICE........................................................................................................................................ 132
Chapter summary .................................................................................................................................. 132
6.1 MOLINIPI AND ITS RELATIVES ............................................................................................................... 133
6.1.1 Delicate mice................................................................................................................................ 133
6.1.2 Ecology of the delicate mice......................................................................................................... 135
6.2 GEOGRAPHICAL SAMPLING FOR MOLECULAR ANALYSIS ....................................................................... 136
6.3 MOLECULAR EVOLUTION...................................................................................................................... 139
6.3.1 Mitochondrial control region....................................................................................................... 139
6.3.2 Nuclear introns............................................................................................................................. 143
6.4 EVOLUTION OF THE DELICATE MICE...................................................................................................... 145
6.4.1 How many species of delicate mice are there?............................................................................. 145
6.4.2 Geographical distribution of delicate mouse clades .................................................................... 146
6.4.3 Evolutionary history of delicate mouse species............................................................................ 147
6.4.4 Speculations on delicate mouse evolution .................................................................................... 171
6.5 SUMMARY............................................................................................................................................. 173
CHAPTER 7. PHYLOGEOGRAPHY OF ZYZOMYS ARGURUS .......................................................... 175
Chapter summary .................................................................................................................................. 175
7.1 A MEDIUM-SIZED, SPECIALISED, TAXON ............................................................................................... 175
7.1.1 A (mostly) rock rat........................................................................................................................ 175
7.2 GEOGRAPHICAL SAMPLING FOR GENETIC STUDIES ................................................................................ 177
7.3 PHYLOGEOGRAPHY OF ZYZOMYS ARGURUS ............................................................................................ 178
7.3.1 Mitochondrial control region....................................................................................................... 178
7.3.2 DHFR intron 1 ............................................................................................................................. 182
7.3.3 BIOCLIM Modelling .................................................................................................................... 182
7.3.4 Evolution of Zyzomys argurus ...................................................................................................... 183
7.4 SUMMARY............................................................................................................................................. 185
xii

CHAPTER 8. GENETIC DIVERGENCE AMONG CHESTNUT MICE AND PSEUDOMYS
DESERTOR POPULATIONS...................................................................................................................... 186
Chapter summary .................................................................................................................................. 186
8.1 GENERALIST SPECIES ............................................................................................................................ 186
8.1.1 Comparative species .................................................................................................................... 186
8.2 GEOGRAPHICAL SAMPLING FOR MOLECULAR STUDIES.......................................................................... 188
8.3 GENETIC DIFFERENTIATION OF CHESTNUT MOUSE AND P. DESERTOR POPULATIONS ............................. 190
8.3.1 Mitochondrial control region....................................................................................................... 190
8.4 SUMMARY............................................................................................................................................. 195
SECTION 4. ECOLOGY, EVOLUTION AND CONILURINE RODENTS
CHAPTER 9. DISCUSSION........................................................................................................................ 196
Explaining the conilurine radiation ...................................................................................................... 196
9.1 DESCRIBING DIVERSITY ........................................................................................................................ 197
9.1.1 Patterns of conilurine diversity .................................................................................................... 197
9.1.2 Species.......................................................................................................................................... 197
9.1.3 Genera: a matter of opinion......................................................................................................... 201
9.2 SPECIATION AND POPULATION DIVERGENCE AMONG CONILURINES ...................................................... 201
9.2.1 Modes of speciation...................................................................................................................... 201
9.2.2 Ecological correlates of evolutionary pattern.............................................................................. 204
9.2.3 Some patterns of evolutionary interest ......................................................................................... 209
9.3. IS THE IMPORTANCE OF ECOLOGY SCALE-DEPENDENT?........................................................................ 213
9.3.1 Explaining biodiversity................................................................................................................. 213
9.3.2 Finalé ........................................................................................................................................... 221
REFERENCES ............................................................................................................................................. 223
APPENDIX I. ALIGNED CONTROL REGION AND DHFR INTRON 1 SEQUENCES.................... 258
xiii

List of Illustrations and Diagrams
Figure 1.1. Distribution of pebble-mound mice and delicate mice. .......................................6
Figure 1.2. Approximate maximal distributional limits of pebble-mound mice and delicate
mice.................................................................................................................................9
Figure 2.1. Relationships among Australian rodent genera (Watts and Aslin 1981). ..........24
Figure 2.2. Relationships among Australian hydromyine rodents. ......................................28
Figure 2.3. Biogeographic subregions of Australia..............................................................39
Figure 2.4. Some areas of endemism around the Australian continental margin.................41
Figure 2.5. Distribution of Australian rodents in relation to moisture regime. ....................45
Figure 2.6. Vegetation of Australasia during the LGM. ......................................................48
Figure 4.1. Mitochondrial control region sequence divergence among Australian rodents.71
Figure 4.2. Maximum-likelihood tree of Australian rodent control region sequence. .........72
Figure 4.3. DHFR intron 1 sequence divergence among Australian rodents.......................76
Figure 4.4. Maximum-likelihood tree of Australian rodent DHFR intron 1 sequence. .......77
Figure 4.5. Systematic relationships among Pseudomys group rodents...............................86
Figure 4.6. Pseudomys group relationships based on mitochondrial control region............87
Figure 4.7. Synthesis of phylogenetic relationships between conilurine rodents. ...............96
Figure 5.1. Images from the life of pebble-mound mice....................................................103
Figure 5.2. Aspects of population dynamics of Pseudomys patrius. .................................106
Figure 5.3. Distribution of pebble-mound mice and sampling locations. ..........................108
Figure 5.4. Nuclear copy and true mitochondrial sequence from pebble-mound mice. ....110
Figure 5.5. Genetic distance between 35 pebble-mound mouse control region haplotypes.
....................................................................................................................................112
Figure 5.6. Maximum-likelihood tree of pebble-mound mouse control region haplotypes.
....................................................................................................................................113
Figure 5.7. Alignment of DHFR intron 1 sequence from fifteen pebble-mound mice. .....115
Figure 5.8. Geographical distribution of pebble-mound mouse control region clades. .....118
Figure 5.9. Major soil type and the distribution of pebble-mound mice............................118
Figure 5.10. Nested haplotype network of Pseudomys johnsoni control region haplotypes.
....................................................................................................................................123
xiv

Figure 5.11. BIOCLIM prediction of the distribution of Pseudomys johnsoni..................124
Figure 5.12. Nested haplotype network of Pseudomys patrius control region haplotypes.
....................................................................................................................................126
Figure 5.13. Speculative history of the pebble-mound mice..............................................129
Figure 6.1. Distribution of delicate mice and sampling locations......................................139
Figure 6.2. Genetic distance between 64 delicate mouse control region haplotypes. ........141
Figure 6.3. Maximum-likelihood tree of delicate mouse control region haplotypes. ........142
Figure 6.4. Alignment of DHFR intron 1 sequence from eleven delicate mice.................144
Figure 6.5. Geographical distribution of delicate mouse clades. .......................................147
Figure 6.6. Nested haplotype network of Pseudomys hermannsburgensis control region
haplotypes. ..................................................................................................................151
Figure 6.7. Bioclimatic prediction of the ranges of Pseudomys delicatulus and Pseudomys
cf. delicatulus..............................................................................................................154
Figure 6.8. Clinal and “fixed” differences between members of the P. delicatulus complex.
....................................................................................................................................159
Figure 6.9. Nested haplotype network of Pseudomys delicatulus(QLD), P. novaehollandiae
and “P. pilligaensis” control region haplotypes. ........................................................162
Figure 6.10. Bioclimatic range prediction of Queensland Pseudomys delicatulus ..................
and Pseudomys novaehollandiae. ...............................................................................163
Figure 6.11. Location of sampling sites and control region clade frequency in the Pilliga.
....................................................................................................................................166
Figure 6.12. Evolution of the P. delicatulus complex (inc. P. novaehollandiae and “P.
pilligaensis”). ..............................................................................................................170
Figure 7.1. Distribution of Zyzomys argurus and sampling locations................................178
Figure 7.2. Genetic distance between Zyzomys argurus control region haplotypes. .........180
Figure 7.3. Nested haplotype network of Zyzomys argurus control region haplotypes. ....181
Figure 7.4. Bioclimatic modelling of the distribution of Zyzomys argurus. ......................183
Figure 8.1. Distribution of the chestnut mice, P. desertor, and sampling locations. .........190
Figure 8.2. Genetic distance between sequences obtained from chestnut mice.................192
Figure 8.3. Genetic distance between nine Pseudomys desertor control region haplotypes
....................................................................................................................................194
xv

Figure 9.1. Biogeography of derived sperm morphology among conilurine rodents. .......210
Figure 9.2. Range size distributions for Australian mammals. ..........................................219
xvi
List of Tables
Table 2.1. Native rodents of Australia. .................................................................................16
Table 2.2. A brief taxonomic history of conilurine rodent genera. ......................................20
Table 2.3. Generic and sub-generic assignments of Pseudomys and Leggadina species. ....22
Table 2.4. Pliocene rodent faunas of Australia .....................................................................33
Table 2.5. Some Quaternary rodent fossil deposits. .............................................................35
Table 3.1. Climatic layers used for distribution modelling in BIOCLIM. ...........................64
Table 4.1. Tissue type and source.........................................................................................68
Table 5.1. Sampling locations and tissue sources for pebble-mound mice. .......................107
Table 5.2. Inter-taxon control region divergence among pebble-mound mice...................116
Table 6.1. Sampling locations and tissue sources for the delicate mice. ............................138
Table 6.2. Genetic distance at the ARAF intron 1 locus between Pseudomys delicatulus, P.
novaehollandiae, P. pilligaensis and Pseudomys cf. delicatulus ...............................144
Table 6.3. Inter-taxon control region divergence among delicate mice. ............................145
Table 7.1. Sampling locations and tissue sources for Zyzomys argurus.............................177
Table 7.2. DHFR distance matrix for three Zyzomys argurus populations. .......................182
Table 8.1. Sampling locations and tissue sources for chestnut mice and P. desertor. .......189
Table 8.2. Control region distance matrix for three chestnut mice.....................................193
Table 8.3. Control region divergence among Pseudomys desertor populations. ...............193
Table 9.1. Proposed changes to Pseudomys species and subspecies taxonomy .................200
Table 9.2. Species distributions and areas of endemism in northern Australia. .................207
xvii

Statement on Sources Declaration
I declare that this thesis is my own work and has not been submitted in any form for
another degree or diploma at any university or other institution of tertiary education.
Information derived from published or unpublished work of others has been acknowledged
in the text and a list of references is given.
Frederick David Ford
xviii
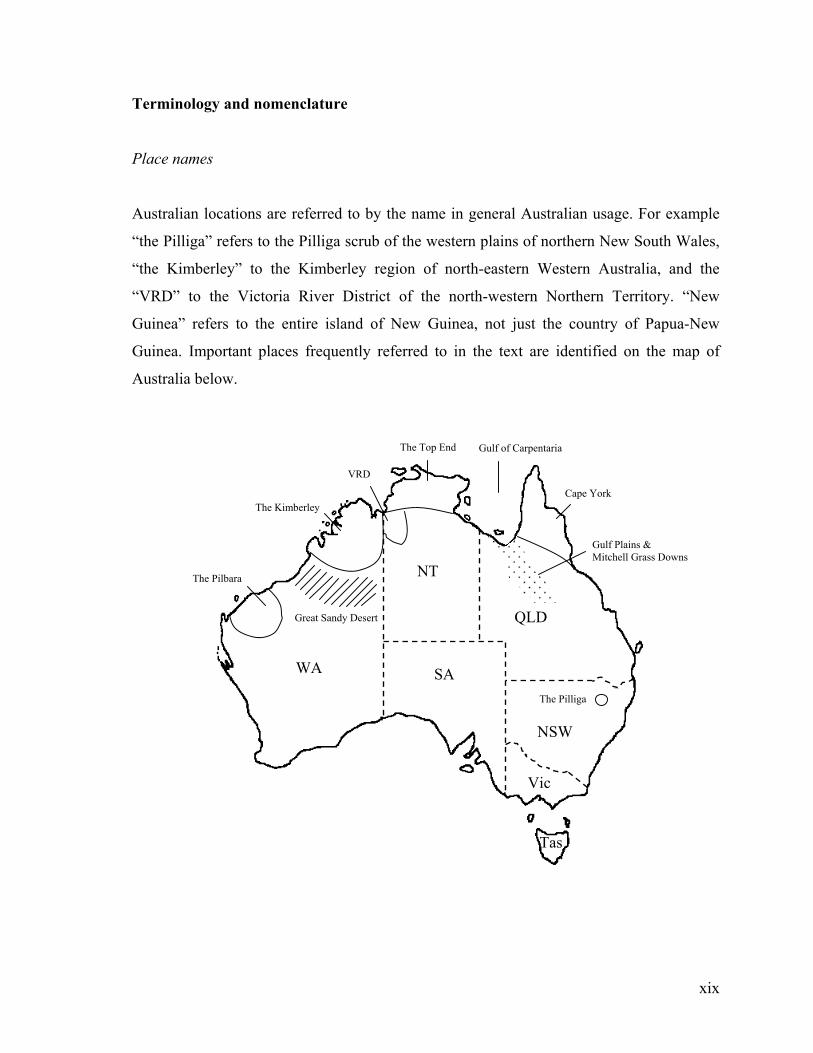
Terminology and nomenclature
Place names
Australian locations are referred to by the name in general Australian usage. For example
“the Pilliga” refers to the Pilliga scrub of the western plains of northern New South Wales,
“the Kimberley” to the Kimberley region of north-eastern Western Australia, and the
“VRD” to the Victoria River District of the north-western Northern Territory. “New
Guinea” refers to the entire island of New Guinea, not just the country of Papua-New
Guinea. Important places frequently referred to in the text are identified on the map of
Australia below.
The Kimberley
Gulf of Carpentaria
Gulf Plains & Mitchell Grass Downs
The Pilbara
The Top End
The
A
Cape York
VRD
Great Sandy Desert
NT
Pilliga
NSWQLD
S
WAVic
Tasxix
Rodent nomenclature
Names of Australian rodent species and genera follow Mackenzie and Burbidge (2002).
Native names given by Mackenzie and Burbidge (2002) are given at the first mention of the
species’ common name, e.g., delicate mouse (Molinipi; P. delicatulus). Following Watts
and Baverstock (1994a) “Hydromyini”, or hydromyine, refers collectively to all members
of the previously defined tribes Conilurini, Hydromyini and Uromyini. “Conilurine” is used
here to refer to genera previously included in the tribe Conilurini (Conilurus, Leggadina,
Leporillus, Mastacomys, Mesembriomys, Notomys, Pseudomys, Zyzomys). The genera
Hydromys and Xeromys are referred to as “water rats” and the genera Uromys and Melomys
as “mosaic-tailed rats”.
A number of taxonomic revisions are suggested in chapters 4-6. These are not formally
proposed here, and this thesis does not constitute a published work under the Zoological
Code of Nomenclature article 8.2 “Publication may be disclaimed”. Therefore suggested
names contained herein should not be considered a nomenclatural revision. Formal
proposal of names will follow in appropriate journals, in some cases pending further
research.
Other terms
Times and timescales are represented using geological nomenclature; million years ago-
Ma, thousand years ago- ka. Time periods of relevance to this thesis are the Tertiary period
(65Ma-~1.6Ma), which included the Miocene (22.5-5.5Ma) and Pliocene (5.5-~1.6Ma)
epochs, and the Quaternary period (~1.8Ma- present), which consisted of the Pleistocene
(~1.6Ma-10ka) and Holocene (10ka-present) epochs. The last glacial maximum is referred
to as the LGM, and locally corresponds to the period 22-18ka. “Savannah” refers to those
vegetation communities in northern Australia considered savannah by the Tropical
Savannahs CRC, less the Gulf Plains and Mitchell Grass Downs, and includes grass-
dominated monsoonal ecosystems, and those in which a grass-dominated understorey is
present with varying degrees of tree cover, including woodland and open forest. Genetic
xx

terms: base pair- bp; genomic DNA- gDNA; insertion-deletion mutation- indel; isolation-
by-distance- IBD; Kishino-Hasegawa test- K-H test; mitochondrial DNA- mtDNA;
polymerase chain reaction- PCR. “Sib-species” and “sib” are used to refer to recently
diverged taxa that are each others closest relatives in phylogenetic reconstruction.
xxi
Chapter 1. General Introduction
1.1 Explaining the spectacular radiation
1.1.1 MICE, RATS AND MANY QUESTIONS
Rodents are a significant part of the Australian vertebrate fauna. Around 70 species in 13
genera are thought to have been present at the time of European colonisation, representing
one quarter of the continent’s mammals (Mackenzie and Burbidge 2002). Almost 50
species stem from a single late Tertiary colonisation that gave rise to the conilurine rodents
(Lee et al. 1981), a radiation that has been described as “spectacular” (Ride 1970, Happold
1976). The ecology of some species is well researched (Cockburn 1980, Kemper 1990, Fox
et al. 1994, Luo et al. 1994, Luo and Fox 1995, 1996, Read and Tweedie 1996, Smith et al.
1996, Smith and Quin 1996a, Haering and Fox 1997, Smith et al. 1997, Jerry et al. 1998),
and Happold (1976) was fervent in her promotion of the group as an evolutionary model.
However, although patterns of diversification (as species phylogenies) have been
researched (Baverstock et al. 1981, Lidicker and Brylski 1987, Godthelp 1989, Watts et al.
1992), few studies have addressed intra-specific evolution in the group in detail (Jerry et al.
1998, Moro et al. 1998, Myroniuk 1998), and speciation processes are essentially unknown.
Many aspects of the conilurine group beg explanation. Their diversity has evolved over a
short period (Baverstock 1984), often in the absence of any obvious geographical barriers.
Systematic relationships are not resolved, particularly within the genus Pseudomys
(Baverstock et al. 1981, Lidicker and Brylski 1987, Godthelp 1989, Watts et al. 1992),
which contains almost half the conilurine species (Mackenzie and Burbidge 2002). There
are few recognised sib-species (Lee et al. 1981). Conilurines have had great success in arid
environments (Watts and Aslin 1981). However, although they probably evolved from New
Guinean rainforest stock, they are rare or absent in wetter habitats in Australia (Lee et al.
1981, Baverstock 1984). The hopping mice (genus Notomys) are speciose (Mackenzie and
Burbidge 2002), have greatly derived morphology (Watts and Aslin 1981), unique
1

reproductive physiology (Breed 1981, 1986) and have been accorded a very long history by
some authors (e.g. Watts and Aslin 1981). However, these desert-living rodents are highly
adapted to environments that are less than one million years old (Bowler 1982). It is not
clear why the evolution of some characters, such as chromosomes (Baverstock et al. 1977b,
Baverstock et al. 1983) and sperm morphology (Breed 1997), has been unusually
conservative among all conilurine species, despite the marked ecological and
morphological diversity of the group. With so many potential areas for investigation, this
thesis focuses on building an empirical data set describing patterns of speciation and
diversification, topics that until now could only be the subject of speculation. Essentially, I
am trying to “get the ball rolling” by formulating evolutionary hypotheses for conilurine
rodents based on evolutionary patterns within model species groups.
The empirical framework presented in this thesis is derived from nested molecular studies.
These describe evolutionary patterns among Australian rodents at scales ranging from
complete species phylogenies (chapter 4) to intra-specific population divergence (chapters
5-8). In addition to the studies detailed in this thesis, my research program involved
significant bodies of work not reported here. In particular, I conducted ecological and
behavioural studies that form important background for evolutionary studies of pebble-
mound mice reported in chapter 5. Species ecology is a fundamental influence on evolution
(Schliewen et al. 2001), and this is particularly so in Australia where events such as marine
incursions or mountain building are rarely the cause of population isolation
(Palaeogeographic Group 1990). Instead, climatic change has driven geographical isolation
of populations (Keast 1961, Ford 1978, Nix 1982). This fact was central to the choice of
species groups studied here. The two main groups, the pebble-mound mice and delicate
mice, have fundamentally different ecologies despite very similar morphologies. One of the
major questions tested here is whether the two groups differ in their evolutionary history
despite having been subjected to the same climatic influences.
2

1.2 Focal questions
1.2.1 SYSTEMATIC RELATIONSHIPS
Various molecular and morphological methods have been applied to resolving the
phylogeny of Australian rodents over the last twenty-five years (Baverstock et al. 1977b,
Baverstock et al. 1981, Baverstock et al. 1983, Lidicker and Brylski 1987, Watts et al.
1992, Torrance 1997). Taxonomic studies before that time tended to suggest relationships
and nominate species groups (Thomas 1910, Iredale and Troughton 1934, Tate 1951, Crabb
1977), and some speculation on ancestral characters was made. A review of systematic
studies reveals moderately well resolved relationships between major Australian rodent
lineages, but leaves many generic and species relationships unresolved. Australian rodents
belong to at least three distinct lineages (Lee et al. 1981, Watts and Baverstock 1994a); 1)
the tribe Hydromyini, 2) one species of Pogonomys and 3) Rattus species. Conilurine
rodents, the focus of this thesis, are members of the Hydromyini (Watts et al. 1992).
However, it is not clear from previous systematic studies whether conilurines are a
monophyletic group (Baverstock et al. 1981, Lidicker and Brylski 1987, Watts et al.1992,
Torrance 1997), despite the fact that all conilurine genera are endemic to Australia, and
obviously closely related (Watts and Kemper 1989, Strahan 1995). Within the conilurine
fauna, systematic relationships among some genera are well established, with the genera
Mastacomys, Notomys and Pseudomys forming a strongly supported monophyletic
assemblage (Baverstock et al. 1977b, Baverstock et al. 1981, Baverstock et al. 1983, Watts
et al. 1992), and the tree rats Conilurus and Mesembriomys closely related to each other
(Misonne 1969, Watts et al. 1992, Torrance 1997). Other genera are labile in their apparent
relationships, and Leggadina has fallen outside the conilurine group in two separate studies
(Baverstock et al. 1981, Watts et al.1992), despite historical synonymy with Pseudomys.
Pseudomys is a genus of increasingly dubious status. Nearly half the conilurine rodents
belong to Pseudomys (Mackenzie and Burbidge 2002), and recent molecular studies have
shown that the long recognised genus Mastacomys consistently falls within the generic
boundaries of Pseudomys (Baverstock et al. 1981, Watts et al. 1992, Torrance 1997). The
3

highly morphologically derived genus Notomys has also been included within Pseudomys
in some analyses (Baverstock et al. 1981, Torrance 1997).
In the first results section of this thesis (chapter 4) I aimed to:
- Resolve whether conilurines are monophyletic with respect to the mosaic-tailed rats,
which occur in both New Guinea and Australia
- Resolve phylogenetic relationships among Australian rodent genera (including non-
conilurine genera)
- Establish species relationships within the currently defined genus Pseudomys with
respect to Mastacomys and Notomys, and propose, where appropriate, new generic
boundaries
1.2.2 SPECIATION STUDIES
Model groups
The major goal of this thesis was to describe patterns of divergence between closely related
conilurine taxa, including populations, subspecies, sib-species and members of species
groups. Such an aim is clearly unfeasible for the entire conilurine fauna. However, a
prudent choice of model species groups allows general statements about the evolution of
the entire group to be made. Conilurines are an ideal group for this kind of study, because
they have a relatively short Australian history, and macro-evolutionary patterns are less
likely to be masked by intermediate events than in the much older marsupial fauna. There
are apparently few closely related conilurine species (Baverstock et al. 1981, Lee et al.
1981), and of those that are, few are still distributed throughout their natural range (Smith
and Quin 1996b), so a further aim of systematic studies was to identify groups of closely
related species that may not have been previously identified. Two groups within the genus
Pseudomys were thought a priori to be ideal, and systematic studies (chapter 4) confirmed
the monophyly of each. The pebble-mound mice and Pseudomys delicatulus and its close
relatives (the “delicate mice”) are both groups of five currently recognised species. They
4

are widely distributed (fig. 1.1), subjecting them to processes influencing many other
conilurine species.
Pebble-mound mice and delicate mice are the smallest Australian rodents, with the average
weight of most species between 10 and 15 grams. They are morphologically very similar,
and where species of the two groups occur in sympatry, it is only in the last twenty years or
so that a taxonomic distinction has been made between them (Kitchener 1980, 1985,
Kitchener and Humphries 1986, 1987, Van Dyck 1991). The delicate mice are important in
the context of Australian rodent biogeography, because they include a south-eastern
Australian member, P. novaehollandiae, and a central Australian member, P.
hermannsburgensis, that are still found at locations scattered throughout most of their
known historical and pre-historical distributions (Breed 1995a, Kemper 1995). Delicate
mice and pebble-mound mice also complement each other as study groups because the
delicate mice exhibit a preference for widespread lowland habitats (Braithwaite and
Covacevich 1995, Breed 1995a, Fox 1995a, Kemper 1995, Watts 1995a), and are thus
widely distributed, with members of the group being parapatric and sympatric, while
species of pebble-mound mice have allopatric distributions on rocky uplands (Kerle 1995a,
Start and Kitchener 1995, Woinarski et al. 1995, Van Dyck and Birch 1996).
There are questions regarding the taxonomic status of regional populations currently
described as P. delicatulus (Breed 2000), and Lee (1995) regarded establishing the
taxonomy and systematics of the delicate mice as a priority, particularly the species status
of P. pilligaensis. There have also been numerous discoveries of new populations of
pebble-mound mice scattered between the locations from which species descriptions were
originally made. There is thus a real need for population-level sampling of all small
Pseudomys species to establish phylogenetic relationships and species boundaries. This
type of study allows powerful inferences to be drawn regarding the processes leading to
divergence of those species, particularly where differences are apparent between pebble-
mound mice and delicate mice, morphologically similar species that fundamentally differ in
their distributional patterns as a result of their habitat preference.
5
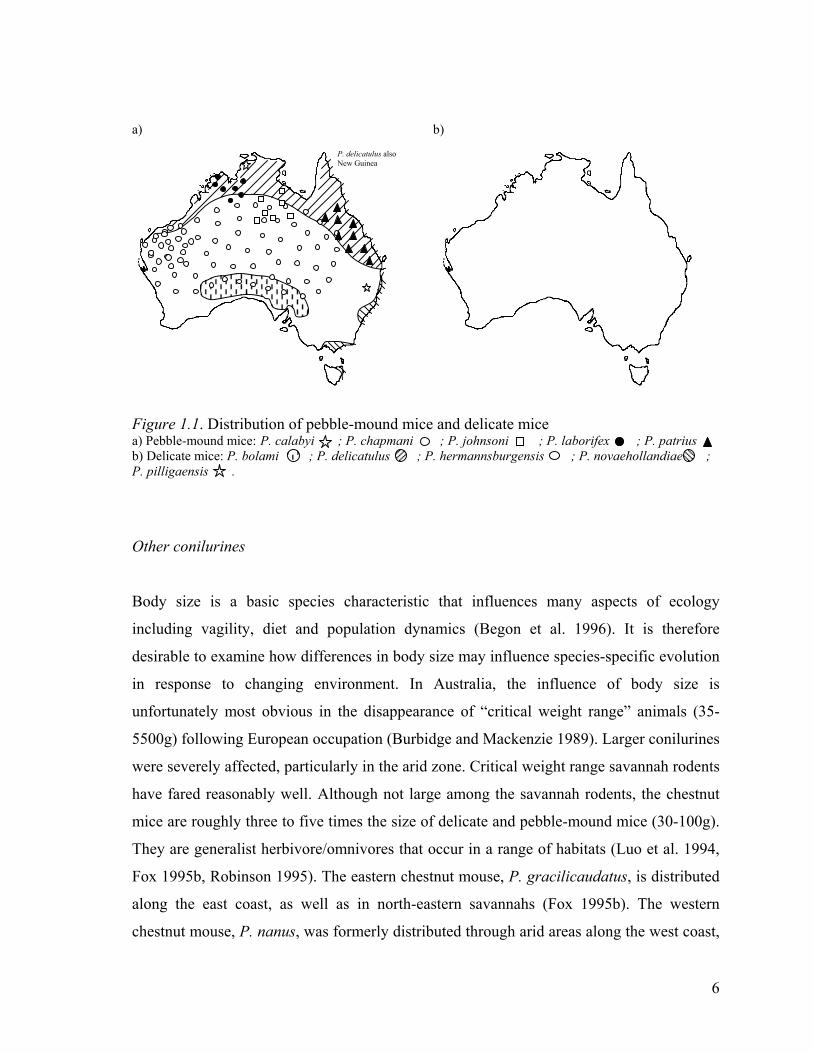
a) b)
P. delicatulus also New Guinea
Figure 1.1. Distribution of pebble-mound mice and delicate mice a) Pebble-mound mice: P. calabyi ; P. chapmani ; P. johnsoni ; P. laborifex ; P. patrius b) Delicate mice: P. bolami ; P. delicatulus ; P. hermannsburgensis ; P. novaehollandiae ; P. pilligaensis .
Other conilurines
Body size is a basic species characteristic that influences many aspects of ecology
including vagility, diet and population dynamics (Begon et al. 1996). It is therefore
desirable to examine how differences in body size may influence species-specific evolution
in response to changing environment. In Australia, the influence of body size is
unfortunately most obvious in the disappearance of “critical weight range” animals (35-
5500g) following European occupation (Burbidge and Mackenzie 1989). Larger conilurines
were severely affected, particularly in the arid zone. Critical weight range savannah rodents
have fared reasonably well. Although not large among the savannah rodents, the chestnut
mice are roughly three to five times the size of delicate and pebble-mound mice (30-100g).
They are generalist herbivore/omnivores that occur in a range of habitats (Luo et al. 1994,
Fox 1995b, Robinson 1995). The eastern chestnut mouse, P. gracilicaudatus, is distributed
along the east coast, as well as in north-eastern savannahs (Fox 1995b). The western
chestnut mouse, P. nanus, was formerly distributed through arid areas along the west coast,
6
but has since contracted to northern areas of its distribution in the Kimberley and Top End
(Robinson 1995). The chestnut mice are superficially similar to the desert mouse, P.
desertor, an ecologically analogous species with a range now known to encompass most of
the arid zone (Kutt et al. in press). The chestnut mice and P. desertor have distributions that
are very similar to those of P. delicatulus and P. hermannsburgensis, and to some extent P.
novaehollandiae, and therefore provide a suitable test of the effect body size may have on
divergence among widespread species.
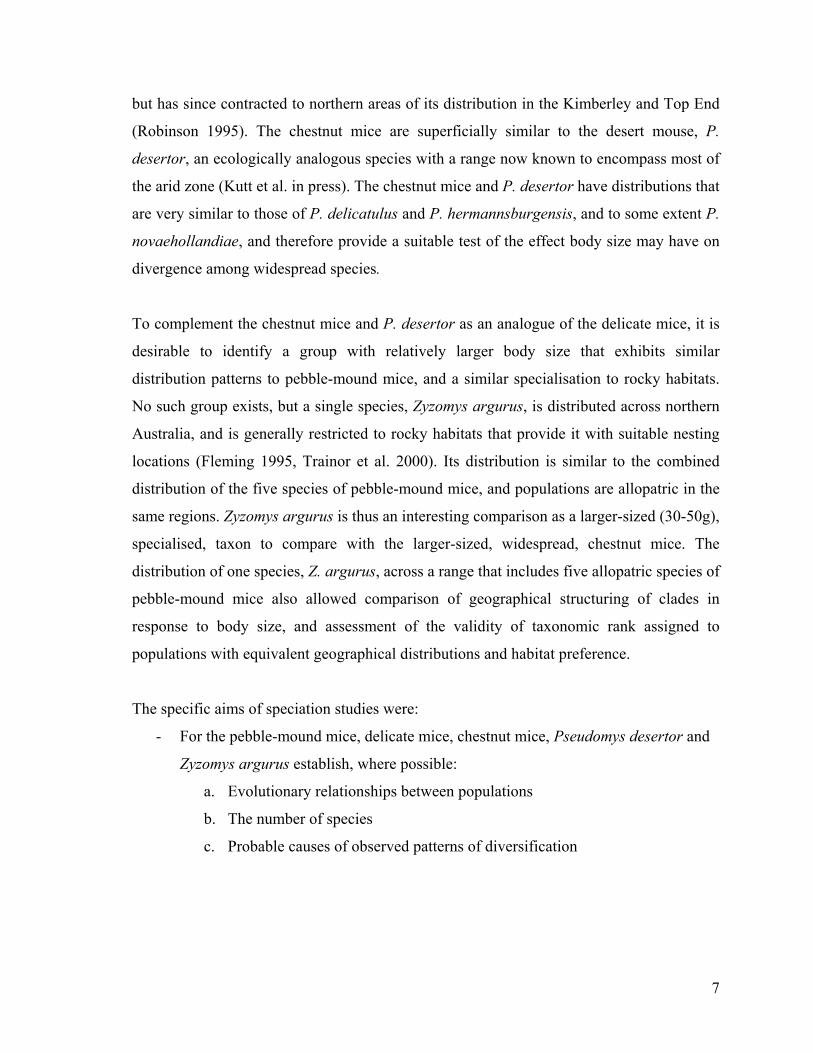
To complement the chestnut mice and P. desertor as an analogue of the delicate mice, it is
desirable to identify a group with relatively larger body size that exhibits similar
distribution patterns to pebble-mound mice, and a similar specialisation to rocky habitats.
No such group exists, but a single species, Zyzomys argurus, is distributed across northern
Australia, and is generally restricted to rocky habitats that provide it with suitable nesting
locations (Fleming 1995, Trainor et al. 2000). Its distribution is similar to the combined
distribution of the five species of pebble-mound mice, and populations are allopatric in the
same regions. Zyzomys argurus is thus an interesting comparison as a larger-sized (30-50g),
specialised, taxon to compare with the larger-sized, widespread, chestnut mice. The
distribution of one species, Z. argurus, across a range that includes five allopatric species of
pebble-mound mice also allowed comparison of geographical structuring of clades in
response to body size, and assessment of the validity of taxonomic rank assigned to
populations with equivalent geographical distributions and habitat preference.
The specific aims of speciation studies were:
- For the pebble-mound mice, delicate mice, chestnut mice, Pseudomys desertor and
Zyzomys argurus establish, where possible:
a. Evolutionary relationships between populations
b. The number of species
c. Probable causes of observed patterns of diversification
7

The synthesis of these studies allowed general inferences to be made regarding broader
patterns of conilurine evolution. Specific modifications to those patterns may be key to
understanding the role ecology has played in speciation processes in late Tertiary and
Quaternary Australia.
1.2.3 ECOLOGY AND DIVERSIFICATION: EVOLUTION PLAYED OUT ON DIFFERENT STAGES
The two major species groups discussed here, the pebble-mound mice and delicate mice,
are excellent models for testing the notion that ecology may produce different evolutionary
relationships among co-distributed species groups with different ecologies. One under-
emphasised aspect of biogeography in northern Australia is the large fluctuations in
coastline throughout the Pleistocene. The present day coast is an atypical situation, yet it is
the basis for discussion of areas of endemism (Keast 1961, Cracraft 1982). Many species
have the opportunity to exploit areas to the north of Australia when sea levels are lowered
(section 2.3.3), while some cannot exploit the entire area bounded by the current coastline.
For instance, the pebble-mound mice are apparently restricted to hilly or pebbly landscapes,
while delicate mice are not particularly constrained by topography (see above). The present
day 200m asl contour is a rough proxy for hilly landscapes, and therefore the maximum
possible extent of the distribution of pebble-mound mice in the last 20ky. The 150m bsl
contour is a proxy for the maximum extent of the distribution of more generalist delicate
mice, a pattern re-iterated throughout the Pleistocene due to changing sea level (fig. 1.2;
Chappell and Shackleton 1986, Haq et al. 1987). Climate will have been an important
influence on both groups, but only the delicate mice have the capacity to fully trace
climatic changes across the landscape. Thus, there are delicate mice in southern New
Guinea (Flannery 1995), but no pebble-mound mice. Many regions occupied by pebble-
mound mice are ancient, stable, landscapes, and a lack of recent mountain building means
that the extent of suitable habitat for pebble-mound mice has probably only decreased in
area since rodents colonised Australia (Palaeogeographic Group 1990, Twidale and
Campbell 1995).
8

Figure 1.2. Approximate maximum distributional limits of pebble-mound mice and delicate mice. Inner line 200m asl contour (from BIOCLIM data), which roughly equates to maximum distribution of pebble-mound mice in northern Australia. Outer line current 150m bsl contour/shoreline during LGM (Palaeogeographic Group 1990, Yokoyama et al. 2001) that encloses maximum distribution of delicate mice (which also includes areas above 200m).
Distributions, areas of endemism and speciation
A major confounding factor in any analysis of speciation is a limited ability to extrapolate
past events from current species distributions (Endler 1982). Distributions of Australian
vertebrate species are generally fragmented into a number of reasonably well-defined areas
of endemism (Heatwole 1987, Cranston and Naumann 1991), and sib-taxa are often
restricted to complementary areas of endemism isolated by arid corridors (Keast 1961, Ford
1978). However, the isolation of several major areas of endemism has been periodic
throughout the late Pleistocene, and initial segregation of populations was probably a
9

moderately recent event (mid? Pleistocene) (Bowler 1982, Archer and Fox 1984).
Timescales involved in isolation of such populations have often not been sufficient to allow
speciation according to many authors (Smith-White 1982, Avise et al. 1998, Knowles
2001). This fact is highlighted among rodents by Watts and Aslin’s (1981) assertion that
the sib-species Pseudomys albocinereus and P. apodemoides were probably isolated by
rising sea levels following the LGM, 16-18Ka. This biogeographical scenario is probably
correct, but speciation over an 18ky period simply due to allopatry is highly improbable
among conilurine rodents, which, unlike native Rattus, do not seem pre-disposed to
processes such as chromosomal re-arrangements (Baverstock et al. 1977b,c,d) that could
lead to rapid speciation.
I explored some of these issues by focussing on the northern savannah conilurine fauna.
This is the richest rodent community in Australia, and is partitioned into three major
allopatric refuge areas. Relatively recent arid barriers in the form of the Great Sandy Desert
and Carpentarian Barrier separate the major refugia. By virtue of the fact that part of the
Carpentarian Barrier is the Gulf of Carpentaria itself, this barrier is only a periodic isolating
mechanism for most species, as the floor of the Gulf is exposed when sea levels fall below
50m bsl (section 2.3.3; Chivas et al. 2001). The Great Sandy Desert is probably a more
severe long-term barrier. Most rodent distributions are affected by these barriers, yet
current taxonomy suggests very different relationships between allopatric populations
among the different groups. This provided an excellent opportunity to contrast events
leading to speciation and more recent events dictating species distributions.
1.3 Reconstructing evolutionary pattern
To address the aims of speciation studies, population sampling was required across the
distribution of the species involved. This allowed construction of molecular phylogenies
that traced an evolutionary continuum of divergence from populations through to species
groups. Previously, intra-specific taxa such as subspecies have been based solely on
morphological variation, which is often subject to natural selection or random effects such
as drift, and may reflect little of the evolutionary history of the taxa involved (Thorpe et al.
10

1995, Salzburger et al. 2002a). Population genetics can determine the level of genetic
divergence or gene flow among populations (Goldstein et al. 1995, Hartl and Clark 1997,
Parker et al. 1998), but DNA sequencing of neutral markers can further reveal the
evolutionary relationships between populations (i.e. the genetic divergence of populations
through time) in the absence of effects due to natural selection (Avise et al. 1987,
Bermingham and Moritz 1998). MtDNA has become the primary tool of such
investigations, because it does not recombine, and therefore preserves historical signal
(Avise et al. 1987, Templeton et al. 1995). There is an enthusiastic literature dedicated to
exploring ways of utilising the new types of information that can be gleaned from DNA
sequencing methods, and the study of intra-specific mtDNA phylogenies has become
known as phylogeography (Fitch 1995, Harvey et al. 1995, Templeton 1998).
Trees based on mtDNA essentially identify patterns of cladogenesis rather than speciation.
This is due to two factors; 1) in many biologists view, including mine, speciation is the
result of permanent cessation of gene flow between previously interbreeding populations
(Briddle and Jiggins 2000, Coyne and Orr 1998) and 2) mitochondrial DNA cannot record
gene exchange due to its matrilineal pattern of inheritance (Avise et al. 1997). Thus,
nuclear introns are also examined here to corroborate findings of mtDNA analysis. Should
obvious divergence at nuclear loci occur between mtDNA taxa in geographical proximity,
than a strong case for specific difference can be made. Such was the case with the original
description of Pseudomys bolami, a member of the delicate mice. Fixed differences at
isozyme loci between nearby populations of P. bolami and P. hermannsburgensis were the
basis for the re-description of the sub-species as a full species (Kitchener et al. 1984). The
field of phylogeography relies on the fact that intra-specific taxa are commonly
encountered in mitochondrial studies, and determining the species status of some mtDNA
taxa identified in this thesis is impossible based on results presented here. Details of these
taxa are provided in results chapters, in particular chapter 6. As a result of the ambiguity of
these results, the contentious field of species definitions is for the most part ignored in
favour of a more general interpretation of patterns of the cladogenesis, which are
unambiguous, and suitably highlight the potential differences in modes of speciation
between study groups.
11
Analysis of intra-specific genetic variation can rely on simple phylogenetic methods.
Evolutionary relationships among populations can be examined using normal tree building
procedures, and molecular subspecies and their geographical distributions easily identified.
However, new techniques have been developed that attempt to remove some of the
speculation involved in interpretation of phylogenetic trees. Nested clade analysis is a
technique developed by Templeton (1993) and Templeton et al. (1995) that compares the
geographical distribution of clades at a series of nested levels. The exact nested
contingency test of Templeton and Sing (1993) allows a non-subjective estimation of
whether significant departures from the expected pattern of genetic relatedness occur over
given distances (i.e. departures from panmixia due to restricted gene flow and geographical
association of haplotypes). Further exploration of the cause of restricted gene flow is
provided by comparison of the geographical distribution of haplotypes within the nested
clade to the distribution of the entire clade. An inference key (Templeton et al. 1995,
Templeton 1998) allows the probable cause of restricted gene flow to be determined where
geographical sampling of populations is adequate. This method has been criticised, in
particular the inference key, as it does not allow an estimation of error, or give any
indication of how much better the explanation provided by the key is than are alternative
interpretations (Knowles and Madison 2002). Nevertheless, nested clade analysis provides
an additional interpretive tool, and much of the doubt surrounding the validity of answers
provided by the inference key can be removed by taking into account other information
such as palaeoclimatic data. Nested clade analysis was used to explore the spatial and
temporal relationships of populations of six species in chapters 5-7.
Palaeoclimatic history, comparative patterns in co-distributed species, and climatic
distribution modelling were additional lines of evidence used to aid interpretation of
species evolution from patterns of molecular evolution. Distribution modelling using
BIOCLIM (Nix 1986) aimed to elucidate what critical factors determine the current
distribution of some species examined in chapters 5-7, and by inference, what the effect of
known changes in past climates or geology might have been.
12
1.4 Thesis structure
Section1. Background to Australian rodent evolution.
Includes chapters 1-3 detailing the known evolutionary history of Australian rodents and
the methods used in this thesis.
Section 2. Systematic framework for Australian rodent biogeography.
Includes chapter 4, which presents new phylogenetic studies and a synthesis of past
taxonomic and systematic work.
Section 3. Phylogeographic case studies of conilurine rodents.
Includes chapters 5-8 describing and attempting to explain patterns of molecular divergence
evident in model rodent groups outlined above.
Section 4. Ecology, evolution and conilurine rodents.
Includes chapter 9, which gives an overview of patterns of conilurine evolution at all
taxonomic scales. The effect that ecology has had on patterns of evolution is explored, and
the relationships of rodent evolution to that of marsupials is discussed in terms of large-
scale processes framed against the background of new neutral models of macroecology.
13
Chapter 2. Murid rodents in Australia
CHAPTER SUMMARY
In this chapter I review evidence that Australian rodents are the result of a series of recent
invasions. Most are members of the tribe Hydromyini, which includes three groups (the
conilurines, mosaic-tailed rats and water rats), but two non-hydromyine rodent genera
occur in Australia; Pogonomys and Rattus. The conilurine rodents are the oldest and most
diverse rodent lineage within Australia, with a probable history on the continent of five
million years. Other groups invaded more recently, some making use of land connections
with New Guinea during the Pleistocene, while others may have arrived in the late
Pliocene. The complex evolutionary history of landscapes and faunas of the Australasian
region makes determining phylogenetic relationships difficult. Even the monophyly of the
conilurine lineage is questionable on the basis of systematic studies, despite the endemism
of the group within Australia. Irrespective of the relationships of conilurines to other
groups, it is only conilurine genera that show extensive speciation within Australia. Species
diversity of conilurines is centred on the tropical savannahs and central deserts. This
contrasts with the mesic preferences of most Australian vertebrate groups, including other
rodent lineages. The history of savannah and arid zone habitats suggests that the diversity
of savannah conilurines is the result of an ancestral radiation, which is now relict, and arid
zone faunas are a recently derived sub-set of savannah faunas. There is a marked lack of
conilurines in wetter habitats, and this is unlikely to be the result of marsupial competition.
Rather, the history of conilurines may have been constrained to some extent by an initial
success in seasonally arid savannah habitats, which allowed further success in desert
environments as they developed, but precluded invasion of tropical rainforests.
14
2.1 The modern fauna
2.1.1 THE LARGEST AUSTRALIAN FAMILY
Mckenzie and Burbidge (2002) recognised 69 species of native Australian rodent, all within
the family Muridae, sub-family Murinae. This represents 27% of the native mammal fauna.
Australian rodents range in size from the delicate mouse (Pseudomys delicatulus) that may
reach maturity at 6g (Braithwaite and Covacevich 1995), to the large rats Hydromys
chrysogaster (avg. 755g, but up to 1275g) and Mesembriomys gouldii (avg. 728g) (Watts
and Aslin 1981, Strahan 1995). Rodents inhabit every Australian environment, and
physiological adaptations to specialised lifestyles are evident in a number of taxa, notably
the aquatic water rats (Hydromys) and desert-living hopping mice (Notomys) (Watts and
Aslin 1981). Five distinct groups are recognisable within the Australian rodents (table 2.1),
and have been ascribed familial, sub-familial or tribal status in the past (Simpson 1961,
Watts and Aslin 1981, Lidicker and Brylski 1987). The current classification in Australian
literature unites three groups, the endemic Australian genera (previously the tribe
Conilurini (Dahl 1897, Watts and Aslin 1981) and subfamily Pseudomyinae (Simpson
1945)), the water rats (previously the tribe Hydromyini (Watts and Aslin 1981) and
subfamily Hydromyinae (Thomas 1896)) and the mosaic-tailed rats (previously the tribe
Uromyini (Watts and Aslin 1981)) in a single tribe, the Hydromyini, within the subfamily
Murinae (Watts and Baverstock 1994b). The water rats and mosaic-tailed rats also occur in
New Guinea, where they are far more diverse than in Australia (Flannery 1995). A single
species of prehensile-tailed rat (Pogonomys sp.) and eight species of Rattus also occur in
Australia (Mackenzie and Burbidge 2002). Combined, these groups constitute the most
speciose family of Australian mammals. In this thesis the Australian endemic rodent genera
are still described as conilurines (Dahl 1897), as they form a long recognised natural
grouping that appears to have systematic support (chapter 4). Other hydromyine groups are
referred to simply as mosaic-tailed rats and water rats. The Hydromyini and Pogonomys sp.
have been described as “old endemics” in recognition of an older Australasian origin than
species of Rattus, which have been labelled “new endemics” (Tate 1951, Watts and Aslin
1981).
15
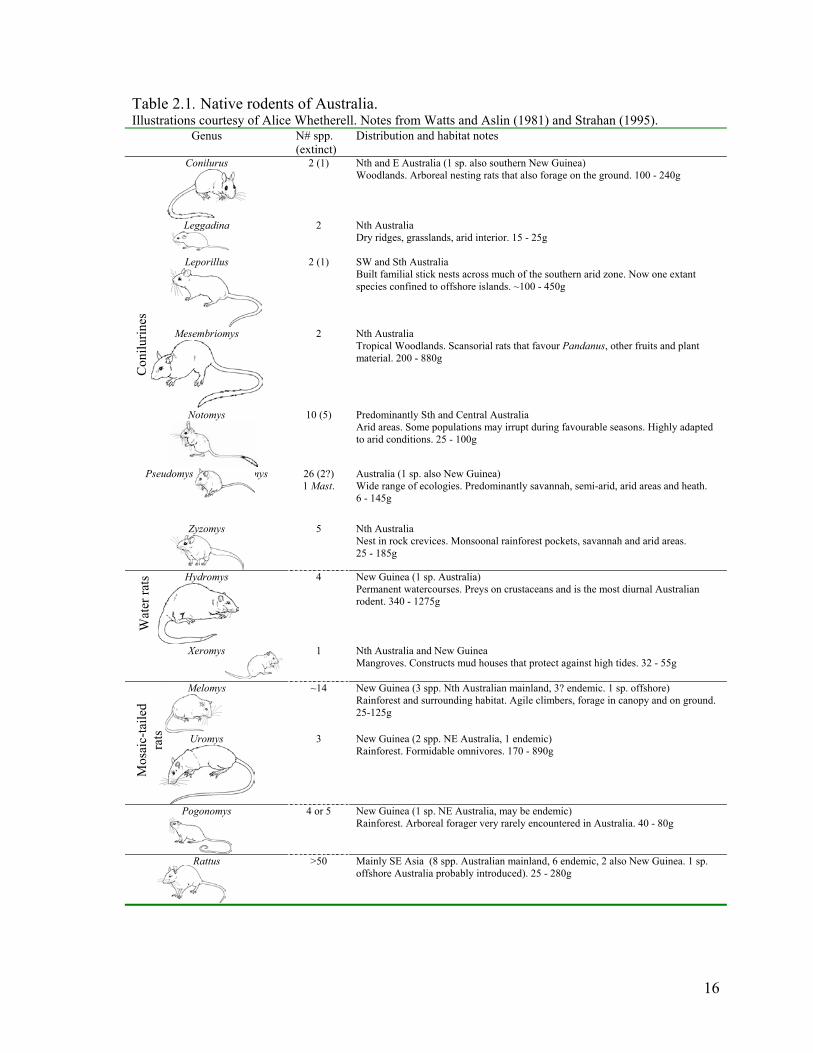
Table 2.1. Native rodents of Australia. Illustrations courtesy of Alice Whetherell. Notes from Watts and Aslin (1981) and Strahan (1995).
Genus N# spp. (extinct)
Distribution and habitat notes
Conilurus
2 (1)
Nth and E Australia (1 sp. also southern New Guinea) Woodlands. Arboreal nesting rats that also forage on the ground. 100 - 240g
Leggadina
2
Nth Australia Dry ridges, grasslands, arid interior. 15 - 25g
Leporillus
2 (1)
SW and Sth Australia Built familial stick nests across much of the southern arid zone. Now one extant species confined to offshore islands. ~100 - 450g
Mesembriomys
2
Nth Australia Tropical Woodlands. Scansorial rats that favour Pandanus, other fruits and plant material. 200 - 880g
Notomys
10 (5)
Predominantly Sth and Central Australia Arid areas. Some populations may irrupt during favourable seasons. Highly adapted to arid conditions. 25 - 100g
Pseudomys and Mastacomys
26 (2?) 1 Mast.
Australia (1 sp. also New Guinea) Wide range of ecologies. Predominantly savannah, semi-arid, arid areas and heath. 6 - 145g
Zyzomys
5
Nth Australia Nest in rock crevices. Monsoonal rainforest pockets, savannah and arid areas. 25 - 185g
Hydromys
4
New Guinea (1 sp. Australia) Permanent watercourses. Preys on crustaceans and is the most diurnal Australian rodent. 340 - 1275g
Xeromys
1
Nth Australia and New Guinea Mangroves. Constructs mud houses that protect against high tides. 32 - 55g
Melomys
~14
New Guinea (3 spp. Nth Australian mainland, 3? endemic. 1 sp. offshore) Rainforest and surrounding habitat. Agile climbers, forage in canopy and on ground. 25-125g
Uromys
3
New Guinea (2 spp. NE Australia, 1 endemic) Rainforest. Formidable omnivores. 170 - 890g
Pogonomys
4 or 5
New Guinea (1 sp. NE Australia, may be endemic) Rainforest. Arboreal forager very rarely encountered in Australia. 40 - 80g
Rattus
>50
Mainly SE Asia (8 spp. Australian mainland, 6 endemic, 2 also New Guinea. 1 sp. offshore Australia probably introduced). 25 - 280g
Con
ilurin
es
Wat
er ra
ts
Mos
aic-
taile
d ra
ts
16

2.1.2 DISCOVERY AND DESCRIPTION
Early explorers of the Australian interior often noted rodent species such as Leporillus
apicalis and Conilurus albipes, both now extinct (Mitchell 1839, Sturt 1849, Smith and
Quin 1996b). It is an unfortunate fact that pastoralism and invasion of feral species far
outpaced scientific endeavours in central Australia. In regions such as western New South
Wales the rodent fauna was once thought to be meagre, but fossil evidence has revealed the
presence of may taxa not historically recorded from the region (Dickman 1994, Ellis 1995,
Dickman et al. 2000). Ten conilurine species recognised by Mackenzie and Burbidge
(2002) are known only from limited material. Lack of museum material, ecological, and
distribution information for some of these species makes accurate assessment of their
taxonomic status difficult (Watts and Aslin 1981).
Following the initial phase of discovery and description of Australian rodents Gould (1863)
recognised 27 species of Australian rodent in three genera; 1) Hapalotis, which included
species now placed in Conilurus, Mesembriomys, Notomys and Pseudomys, 2) Hydromys
and 3) Mus, which included species now in Melomys, Rattus and Pseudomys. These were
predominantly described on the basis of external characters, but 13 of the 16 conilurine
species recognised by Gould (1863) are still regarded as valid. Specimens of a single
species, Pseudomys australis, were included in both Mus and Hapalotis (table 2.2). Gould
(1863) did not recognise the previously described genera Conilurus Ogilby 1838 (see
Mahoney (1982) for nomenclatural comments on Conylurus Ogilby 1837), Notomys Lesson
1842, or Pseudomys Gray 1832, although he gave an account of species belonging to those
genera, including the generic types. In the late nineteenth and early twentieth century
Thomas (1882, 1889, 1906b, a, Thomas and Dollman 1909, Thomas 1910, 1921) was
active in describing new genera and species of Australian rodent, and collectors such as
Stalker were visiting remote locations that yielded many new species (Thomas 1906b,
Thomas and Dollman 1909). In the wake of Thomas’ work, Troughton reviewed the status
of many taxa, and also described a number of new species (Troughton 1923, 1932, Iredale
and Troughton 1934, Troughton 1936, 1937). Tate (1951) also conducted a major
taxonomic review of Australasian rodents. Among the conilurine rodents (the “Pseudomys
17

group” of Troughton (1941) and the “Australian genera” of Tate (1951)) the large-bodied
genera Leporillus and Mesembriomys were considered by Iredale and Troughton (1934),
and Tate (1951), to consist of the same species recognised today, with the addition of L.
jonesi, now regarded as an insular (and only surviving) form of L. conditor. Iredale and
Troughton (1934) and Ellermann (1941) recognised two species of Conilurus regarded as
synonymous with C. penicillatus by Tate (1951) and all subsequent authors, but the
taxonomy of that genus has been relatively stable. Zyzomys has also seen little taxonomic
revision since the inclusion of Laomys Thomas 1909 as a sub-genus (Tate 1951), now a
junior generic synonym (Kitchener 1989), although two new species within the previously
recognised Z. woodwardi were described by Kitchener (1989). The taxonomy of Notomys
species has been relatively stable, although there has been confusion between several
species in the past (Mahoney 1969, 1982) and the description of several synonymous
forms. Notomys cervinus was placed in a separate genus by Waite (1900) and Iredale and
Troughton (1934), but was retained in Notomys by Brazenor (1934) and all subsequent
authors (table 2.2).
The remaining conilurine genera have a more complicated taxonomic history, which is still
not resolved. Thomas (1910) united a large number of relatively non-descript species
within Pseudomys Gray 1832 and described four sub-genera, Gyomys, Leggadina,
Pseudomys, and Thetomys. Troughton (1932) still regarded these as sub-genera, but Iredale
and Troughton (1934) elevated Thomas’ four sub-genera to full genera (table 2.3), a
development that Troughton (1937) felt was in keeping with Thomas’ (1910) implicit
opinion of the level of difference between the groups. Ellermann (1941) regarded Thetomys
and a sub-genus of Pseudomys, but did not regard Leggadina or Gyomys as closely related
to that genus, suggesting a closer affinity of Gyomys with Rattus and Leggadina with Mus.
Tate (1951) regarded Gyomys, Pseudomys and Thetomys as sub-genera of Pseudomys,
while he separated Leggadina as a full genus, in which he regarded “Leggadina delicatula”
to be particularly divergent from Pseudomys (table 2.2). Pseudomys delicatulus is now
regarded as a good Pseudomys species (Mackenzie and Burbidge 2002), despite the generic
distinction of Leggadina (Watts et al. 1976).
18

Within the Pseudomys group of genera Iredale and Troughton (1934), Ellermann (1941)
and Tate (1951) recognised roughly the same species, although some new species were
described in the interim, and assignment to genera/sub-genera differed slightly (table 2.3).
Discrepancies included Tate (1951) regarding Troughton’s (1936) Leggadina berneyi as
Pseudomys (Gyomys) berneyi. This mistake is perplexing, as a large accessory M1 cusp
typifies the species, which is now synonymous with Leggadina forresti (Troughton 1936).
Gyomys was distinguished from Leggadina by the lack of such a cusp. Tate presumably did
not view the type, although it is listed on page 191 as “studied and photographed”. He
apparently followed Ellermann (1941), who listed Gyomys berneyi without explanation,
and without viewing the type. Troughton (1973) still regarded the species as a Leggadina.
Iredale and Troughton (1934) placed the damaged type of P. fieldi in Leggadina. Troughton
(1937) reviewed the type of P. fieldi and placed it within Pseudomys, but Ellermann (1941)
still regarded it as a species of Leggadina. Tate (1951) included P. fieldi in Thetomys. All
these authors placed P. praeconis in Thetomys. Despite inconsistent and mutually exclusive
generic assignment in the past, Pseudomys fieldi and P. praeconis are now considered to
represent a single species (Morris and Robinson 1995). All authors before Ride (1970)
recognised multiple synonyms of Leggadina forresti, P. australis and P. nanus. Many of
these species were described because Troughton and earlier authors exhibited a general
reluctance to accept very large species distributions, which are actually typical of central
Australian rodent species. The recognition and description of many synonymous forms by
these authors was therefore the result of the limited nature of reference material,
recognition of insular forms as full species rather than local phenotypes, and geographically
disparate collecting locations.
19

Table 2.2. A brief taxonomic history of conilurine rodent genera. For each author: the first line gives the number of species recognised in each genus or sub-genus, the second line the number of those species still recognised, and the genus/genera to which they are assigned. Where a genus was recognised as a sub-genus, the senior generic name is indicated in abbreviated form, e.g. (sub-Pseud) indicates that Tate (1950) recognised Gyomys Thomas 1910 as a sub-genus of Pseudomys Gray 1832. “-” indicates that a genus was not recognised as containing conilurine species. The number of species currently assigned to each genus (Mackenzie and Burbidge 2002) is shown to aid interpretation of earlier treatments.
Author Mus Linnaeus
1758
Leggadina Thomas 1910
Gyomys Thomas
1910
Thetomys Thomas 1910
Pseudomys Gray 1832
Conilurus Ogilby 1838
Leporillus Thomas 1906
Mesembriomys Palmer 1906
Hapalotis Lichtenstein
1829
Zyzomys Thomas
1909
Laomys Thomas
1909
Mastacomys Thomas 1882
Ascopharynx Waite 1900
Notomys Lesson 1842
Gould 10 - - - - - - - 13 - - - -(1863)
1 Melomys 2 Conilurus6 Pseudomys 2 Leporillus
4 Rattus 1 Mesembriomys 3 Notomys 1 Pseudomys
Iredale & - 7 5 5 6 4 3 2 - 1 2 2 1 8 Troughton 1 Leggadina 5 Pseudomys
3 Pseudomys
3 Pseudomys
2 Conilurus
2 Leporillus
2 Mesembriomys
1 Zyzomys
2 Zyzomys
1 Mastacomys
1 Notomys
6 Notomys
(1934) 4 Pseudomys
Ellermann - 7 8 (sub-Pseud):5 6 4 3 2 - 1 2 2 - 10(1941) 1 Leggadina 1 Leggadina 3 Pseudomys
3 Pseudomys
2 Conilurus
2 Leporillus
2 Mesembriomys
1 Zyzomys
2 Zyzomys
1 Mastacomys
7 Notomys
4 Pseudomys 7 Pseudomys
Tate - 6 (sub-Pseud): 9
(sub-Pseud): 6
(sub-Pseud): 7 2 3 2 - 1 (sub-Zyz): 2
2 - 12
(1951) 1 Leggadina 1 Leggadina 4 Pseudomys
4 Pseudomys
2 Conilurus
2 Leporillus
2 Mesembriomys
1 Zyzomys
2 Zyzomys
1 Mastacomys
8 Notomys 4 Pseudomys 8 Pseudomys
Ride - - - - 17 2 2 2 - 3 - 1 - 9
(1970) 1 Leggadina 2 Conilurus 2 Leporillus 2 Mesembriomys
3 Zyzomys 1 Mastacomys
9 Notomys 15 Pseudomys
Watts & - 2 - - 18 2 2 2 - 3 - 1 - 10
Aslin 2 Leggadina 17 Pseudomys 2 Conilurus 2 Leporillus 2 Mesembriomys
3 Zyzomys 1 Mastacomys 10 Notomys (1981)
Mackenzie - 2 - - 26 2 2 2 - 5 - 1 - 10
& Burbidge
(2002)
Other Paraleporillus1 Ammomys Thylacomys generic Martinez and Thomas 1906 Waite 1897
synonyms Lidicker 1971 Podanomalus Waite 1898
1 Paraleporillus stirtoni (Martinez and Lidicker 1971) was described from a fossil, and has never been applied to modern specimens of P. australis, with which it is considered synonymous.
20

Nineteen seventy and 1976 saw two major developments in the taxonomy of small
conilurines. Ride (1970) published a volume in which rodent taxonomy was based on the
unpublished work of J. Mahoney. Thomas’ (1910) sub-genera were recombined in a single
genus, Pseudomys, which contained 17 species, two of which have since been synonymised
as P. fieldi, one was Leggadina forresti, and the remainder of which are still regarded as
valid (table 2.3; Mackenzie and Burbidge 2002). Sub-generic rankings were abandoned due
to lack of clear-cut characters separating different groups, as evidenced by the plasticity of
previous generic arrangements (table 2.3). Watts (1976) and Watts and Aslin (1981)
modified Ride’s classification by recognising Leggadina forresti, and added L.
lakedownensis to that genus (Baverstock et al. 1976, Watts 1976). This basic classification
is that accepted by Strahan (1995) and Mackenzie and Burbidge (2002), and in general
usage today. Several authors have suggested that Pseudomys could, or should, be split into
multiple genera (Baverstock et al. 1981, Godthelp 1989), but identifying valid species
groups within the monophyletic complex has proved difficult (Watts et al. 1992).
2.1.3 RELATIONSHIPS WITHIN THE HYDROMYINI
Despite the diversity of morphology and ecology evident among hydromyine rodents they
are an extremely conservative group in some respects. All species have only four inguinal
teats (Thomas 1910). Sperm morphology is highly derived compared to Rattus, but is
conserved across all genera, with isolated departures from the ancestral form found only in
some species of Pseudomys and Notomys (Breed 1997). The karyotype is subject to minor
re-arrangement in some species, with no significant modification to the presumed ancestral
type except in the genus Zyzomys (Baverstock et al. 1981, Baverstock et al. 1983).
Dentition does vary between hydromyine lineages. Water rats are distinctive in that the
molar row has been reduced to two basined molars (Tate 1951). Conilurines and mosaic-
tailed rats possess three molars that have more typical murid cusps (Ellermann 1941),
although there is a marked reduction in the size of upper labial cusps of conilurines when
compared to Mus and Rattus (Simpson 1961). Crabb (1977) described complex patterns of
dental evolution among Australian rodents, and noted cases of convergence and parallel
evolution in dental form. The fact that some characters vary widely among species, while
21

others are highly conserved, has made identifying phylogenetically informative
synapomorphic characters among conilurines difficult. Consequently, relationships between
many taxa are still unresolved.
Table 2.3. Generic and sub-generic assignments of Pseudomys and Leggadina species. Current taxonomy is given first (Mackenzie and Burbidge 2002), including previous synonyms (small type). Where past taxonomy differs from Mackenzie and Burbidge (2002), either by full generic distinction, or by recognising synonymous forms as distinct species, the genus (or sub-genus) name is given in black. Where previous treatments do not differ generic or sub-generic names (if recognised) are given in grey.
Mackenzie and Burbidge (2002)
Iredale and Troughton
(1934)
Ellermann (1941)
Tate (1951)
Ride (1970)
Leggadina forresti Leggadina Leggadina Leggadina Pseudomys messorius Leggadina- species Leggadina- species Leggadina- species - waitei Leggadina- species Leggadina- species Leggadina- species - berneyi - Gyomys- species Gyomys- species - L. lakedownensis - - - - Pseudomys albocinereus Gyomys Gyomys Gyomys Pseudomys P. apodemoides Gyomys Gyomys Gyomys Pseudomys (P. glaucus?) P. australis Pseudomys Pseudomys Pseudomys Pseudomys greyii - - - - lineolatus - - Pseudomys- species - murinus - - - - auritus Pseudomys- species Pseudomys- species Pseudomys- species - minnie Pseudomys- species Pseudomys- species Pseudomys- spp. P. aus. - rawlinnae Pseudomys- species Pseudomys- species Pseudomys- species - P. bolami Leggadina- ssp. P.
herm. Leggadina- ssp. P.
herm. Leggadina- ssp. P.
herm. (Pseudomys)
P. calabyi - - - - P. chapmani - - - - P. delicatulus Leggadina Leggadina Leggadina Pseudomys pumilus - Gyomys- species Gyomys- species - P. desertor Gyomys Gyomys Gyomys Pseudomys P. fieldi Leggadina Leggadina Thetomys Pseudomys praeconis Thetomys- species Thetomys- species Thetomys- species Pseudomys- species P. fumeus - Gyomys Gyomys Pseudomys P. glaucus Gyomys Gyomys Gyomys - P. gouldii Thetomys Thetomys Thetomys Pseudomys P. gracilicaudatus Thetomys Thetomys Thetomys Pseudomys P. hermannsburgensis Leggadina Leggadina Leggadina Pseudomys P. higginsi Pseudomys Pseudomys Pseudomys Pseudomys leucopus - - - - P. johnsoni - - - - P. laborifex - - - - P. nanus Thetomys Thetomys Thetomys Pseudomys ferculinus Thetomys- species Thetomys- species Thetomys- species - P. novaehollandiae Gyomys Gyomys Gyomys Pseudomys P. occidentalis - - Gyomys Pseudomys P. oralis Pseudomys- ssp. P. aus. Pseudomys- ssp. P. aus. Pseudomys Pseudomys P. patrius Leggadina Leggadina Leggadina - P. pilligaensis - - - - P. shortridgei Pseudomys Pseudomys Pseudomys Pseudomys P. sp. (2: 1-Vic, 1-QLD) - - - -
22
Watts and Aslin (1981) presented a synthesis of morphological and early molecular work
(fig. 2.1). Following Baverstock et al. (1977b) Rattus was regarded as an outgroup to all
other Australian rodents, which agreed with earlier notions that Australian rodents were
derived from a Rattus-like ancestor (Tate 1951, Watts 1974). Pogonomys was separated as
a sister group to the remaining taxa, which were combined within the subfamily
Hydromyinae. The Hydromyinae (as used by Watts and Aslin 1981 and Lee et al. 1981)
subsumed the older sub-families Pseudomyinae (Simpson 1961) and Hydromyinae
(Thomas 1896), and recognised their close affinity with the mosaic-tailed rat genera,
Uromys and Melomys, which had previously been allied with Rattus (e.g. Tate 1951, Ride
1970). Watts and Aslin (1981) grouped the genera of “mice” Mastacomys, Leggadina and
Pseudomys, and speculated that the genus Leporillus may be related to the group. The close
relationship they postulated between Leggadina and Pseudomys reflected previous
inclusion of Leggadina species within Pseudomys (Thomas 1910, Ride 1970) and the
inclusion of Pseudomys delicatulus and P. hermannsburgensis within the genus Leggadina
(Troughton 1941, Tate 1951). The tree rat genera Mesembriomys and Conilurus are clearly
related based on general characters and dental morphology (Tate 1951, Misonne 1969), and
the rock rats, Zyzomys, were nominated by Watts and Aslin (1981) as their sister taxon. The
highly derived morphology that characterises the genus Notomys was thought by Watts and
Aslin (1981) to be the result of 15 million years of independent evolution (fig. 2.1). Watts
and Aslin (1981) outlined broad generic relationships, but there was little resolution of
those relationships, and no phylogenetic treatment at the species level, although species
groups were nominated within the genera Pseudomys and Notomys. Timescales proposed
by Watts and Aslin (1981) are far in excess of those now regarded as relevant to Australian
rodent evolution (see section 2.2), and the early divergence times given in their tree pre-
date the origin of the murine sub-family (Jacobs and Downs 1994).
23

A
B
C
D
E
Figure 2.1. RelationshipsTree modified from Watts andconilurines; E, Rattus.
A number of molecular a
inherent in Watts and As
and Brylski 1987, Watts
relationships among thes
Australia’s endemic rode
still problematic (Donnel
Pseudomys group
The most convincing
morphologically unremar
derived genus, Notomys.
that Notomys and Masta
indication of monophyly
identified a reciprocal tr
genera. The rarity of reci
Millions of years before present
among Australian rodent genera (Watts and Aslin 1981). Aslin (1981). A, Pogonomys; B, water rats; C, mosaic-tailed rats; D,
nd morphological studies have attempted to clarify the uncertainty
lin’s tree (Baverstock et al. 1981, Baverstock et al. 1983, Lidicker
et al. 1992, Torrance 1997). The consistency of some generic
e studies is sufficient to establish relationships between some of
nt genera, but the relationships of New Guinean hydromyines are
lan 1989, Watts and Baverstock 1994a).
clade within the Australian conilurines consists of the
kable Pseudomys and Mastacomys, and the most morphologically
Ellermann (1941) foreshadowed this relationship by suggesting
comys may have been derived from Pseudomys, but the first clear
of this group was provided by Baverstock et al. (1983) who
anslocation between chromosomes 1 and 2, shared by the three
procal translocations and the correlation of chromosomal location
24

inspired the statement that this relationship was “unquestionable” (Baverstock et al. 1983
pg. 114) Further support for the close relationship is indicated by sequencing of
mitochondrial DNA (Torrance 1997), isozyme electrophoresis (Baverstock et al. 1981),
penis morphology of many species (Lidicker and Brylski 1987), and microcomplement
fixation (Watts et al. 1992). Dental characters are shared between these three genera (Crabb
1977), although independent evolutionary trends occur within each, and Crabb (1977) felt
that although Mastacomys and Pseudomys were closely related, the singular morphology of
Notomys warranted its separation as an independent lineage. Mastacomys is a monotypic
genus with very distinctive broad molars (Misonne 1969) that has repeatedly fallen within
Pseudomys (as currently defined) in phylogenetic analysis (Baverstock et al. 1981, Watts et
al. 1992, Torrance 1997), and Watts and Baverstock (1992) formally recommended the
sinking of Mastacomys within Pseudomys. Notomys has sometimes fallen within the genus
Pseudomys in systematic analysis (e.g. Torrance 1997). The Notomys/Pseudomys lineage
represents a clade to the undoubted exclusion of tree rats, Leggadina and New Guinean
genera (Baverstock et al. 1983). Their relationship to Leporillus and Zyzomys has not been
firmly established.
Tree rats
The tree rats, genera Conilurus and Mesembriomys, form a second credible grouping in
accordance with general morphology, skull morphology and dentition (Tate 1951, Misonne
1969, Crabb 1977, Watts and Aslin 1981), penis morphology (Lidicker and Brylski 1987),
mitochondrial DNA sequencing (Torrance 1997), isozymes (Baverstock et al. 1981) and
microcomplement fixation (Watts et al. 1992). There is some support for the inclusion of
Leporillus in this clade, as a sister taxon to Conilurus/Mesembriomys. Watts and Aslin
(1981) placed Leporillus as a sister to Pseudomys/Mastacomys, and Baverstock et al.
(1981) found Leporillus isozymes to group within Pseudomys in some analyses. Leporillus
has only two internal cusps on its first two upper molars, while tree rats have three, and
Crabb (1977) considered tree rats distinct from Leporillus on that basis. However, Misonne
(1969) considered Leporillus dentition to be a close derivative of that of Mesembriomys.
Lidicker and Brylski (1987), Watts et al. (1992) and Torrance (1997) all found a close
25
relationship to tree rats. Chromosomal evidence is not available to assess the presence of
the Notomys/Pseudomys reciprocal translocation in Leporillus.
Leggadina and Zyzomys
The remaining conilurine genera are more difficult to place. Leggadina and Zyzomys form
inconsistent relationships with conilurine and New Guinean genera in systematic studies.
Unlike the conservative chromosomal evolution of most hydromyines, Zyzomys has a
highly derived karyotype (Baverstock et al. 1977b). Its skull morphology is similar to the
tree rats (Misonne 1969), and like them it has three internal cusps on its first two upper
molars (Tate 1951, Crabb 1977). Other studies (Baverstock et al. 1981, Lidicker and
Brylski 1987) indicated a closer relationship to Pseudomys, although the major
reorganisations of its karyotype make it unclear whether it possesses a Notomys/Pseudomys
chromosomal translocation (Baverstock et al. 1983). Mitochondrial cytochrome b
sequences suggested that Zyzomys and Leggadina form a sister clade to Notomys and
Pseudomys (Torrance 1997), although there was little bootstrap support for this
relationship. Leggadina resembles members of Pseudomys in general morphology and
penis morphology (Lidicker and Brylski 1987), but microcomplement fixation indicated a
basal position to the entire hydromyine tree (Watts et al. 1992), and isozyme studies
provided a similar result (Baverstock et al. 1981).
Conilurines
Conilurines do not always form a monophyletic clade excluding New Guinean genera in
systematic studies. Watts et al. (1992) and Baverstock et al. (1981) presented trees in which
conilurines were not monophyletic. Similarly, Lidicker and Brylski’s (1987) analysis of
penis morphology did not segregate conilurines from mosaic-tailed rats, nor did the result
of Torrance’s (1997) mitochondrial sequencing. However, conilurines are easily made a
monophyletic clade in Baverstock et al’s (1981) study of isozymes if the position of
Leggadina is ignored. Leggadina is also problematic in Watts et al's (1992) tree, but the
mosaic-tailed rats, Zyzomys and tree rats further confound the issue by forming a sister-
26

clade to Notomys/Pseudomys, although relationships within this clade were unresolved.
Lidicker and Brylski (1987) concluded that the conilurines were a monophyletic tribe
despite their analysis showing several New Guinean genera within the conilurines. This
seems justified given that their analysis split the Notomys/Pseudomys clade into two
divergent branches separated by members of Melomys and several other New Guinean
genera. Penis morphology is therefore probably not a useful marker for discerning higher-
level relationships, a view supported by Watts et al. (1992). Tate (1951) and Troughton
(1941) both thought that conilurines were a distinct assemblage, although Tate (1951)
speculated that Lorentzimys, which is not particularly closely related (Donnellan 1989),
might be a member of the group. Baverstock et al. (1983) proposed a model of
chromosome evolution within the Hydromyini that entailed an early divergence of mosaic-
tailed rats and conilurines from water rats, and a subsequent splitting of the conilurines
from mosaic-tailed rats.
Established relationships
The discussion above noted few well established relationships. This thesis investigates
diversification of conilurine rodents, yet it is still not clear whether conilurines are a
monophyletic clade. Within the conilurines there is support for a monophyletic clade
containing the genera Mastacomys, Notomys and Pseudomys and another containing
Conilurus and Mesembriomys. The genus Leporillus is probably related to
Conilurus/Mesembriomys clade, but it is not clear where the affinities of Leggadina or
Zyzomys lie (fig. 2.2). Relationships are not problematic within most conilurine genera, as
they mostly contain only two species. However, within Pseudomys there is a history of
taxonomic unrest (section 2.1.2), and few species relationships are known with any
confidence. Species relationships within this genus are discussed in detail in chapter 4.
27

Leggadina
Figure 2.2. Relationships among Australian hydromyine rodentsRelationship shown are those with good support from previous systematic sttaxa shared with New Guinea (Water rats (Australian genera Hydromys and (Australian genera Melomys and Uromys)). Black branches are conilurine ge
2.2 Origins and fossil history of Australian rodents
2.2.1 ORIGINS AND RELATIVES
The origin of the hydromyine lineage is obscure. Based on mi
could not identify any sister-taxon among the Australasian an
they examined, Watts and Baverstock (1994b) speculated that t
branching of the South-east Asian murine radiation, and probab
the late Miocene 6-8Ma. Aplin (accepted) supports this date b
biogeographical reconstructions. Rattus is often used as an out
(e.g. Baverstock et al. 1981, Baverstock et al. 1983, Lidicker a
for convenience sake than a conviction that Rattus is the siste
The genus Pogonomys is a member of a similarly sister-less gro
(Watts and Baverstock 1994a, Watts and Baverstock 1994b). M
Pseudomys
Water rats
Mosaic-tailed rats
Leporillus
Zyzomys
Mesembriomys
Conilurus
Notomys
Mastacomys
. udies. Grey branches highlight Xeromys) and Mosaic-tailed rats nera.
crocomplement studies that
d South-east Asian species
he Hydromyini are an early
ly arrived in Australasia in
ased on fossil evidence and
group in systematic studies
nd Brylski 1987), but more
r taxon of the Hydromyini.
up of New Guinean rodents
any authors have felt that
28

the ancestor of Australian rodents was Rattus-like (Watts 1974, Hand 1984), or a Rattus-
like form possessing a cricetid two-cusped dental pattern (Tate 1951), although Simpson
(1961) proposed a purely cricetine ancestor. These authors were referring to conilurine
rodents, as at that time water rats and mosaic-tailed rats were considered distantly related to
conilurines. Some authors noted New Guinean or South-east Asian species that possess
characters they thought were ancestral to the conilurine rodents (Lidicker 1968, Misonne
1969), including the genera Anisomys and Lenothrix. Misonne (1969) followed Tate (1951)
in including the New Guinean genus Lorentzimys as a member of his Australian
Pseudomyinae. The close relationship of some Australian and New Guinean genera has
been confirmed by chromosomal, isozyme and microcomplement fixation studies
(Baverstock et al. 1977b, Baverstock et al. 1981, Baverstock et al. 1983, Watts et al. 1992),
but other New Guinean rodents are relatively distantly related to the Hydromyini. Fossil
rodents are known from eastern Indonesia, but none appear ancestral to the Hydromyini
(Flannery 1989).
The fact that the sister group of the Hydromyini is proving difficult to find is not surprising.
A chaotic geological and biogeographical history in the late Tertiary (Hall 1998, Holloway
and Hall 1998) has produced a series of rapid murine sub-radiations in South-east Asia,
including those of New Guinea and Australia (Musser and Carlton 1993, Watts and
Baverstock 1994a, Watts and Baverstock 1994b). The formation of modern New Guinea
was a particularly dynamic process of land accretion, upheaval, fragmentation, and
unification (Polhemus and Polhemus 1998). The land units that comprise modern New
Guinea have probably been sites of repeated processes of radiation and extinction (Heads
2002), and although Watts et al. (1995) favour an origin of the Hydromyini west of
Wallace’s line, the evolutionary history of New Guinean faunas could mask any
phylogenetic signal from a New Guinean sister clade.
In contrast, the origin of the conilurine lineage appears to have been a relatively simple
event, resulting from a single invasion of a stable continent (Dahl 1897, Simpson 1961,
Lidicker 1968, Happold 1976), although the uncertainty of systematic relationships among
the hydromyine rodents (Watts and Baverstock 1994a) provides a caveat. The fact that
29
mosaic-tailed rats and water rats are predominantly New Guinean would suggest that
colonisation of Australia took place via part of what today is the island of New Guinea
(Watts and Baverstock 1994b, Strahan 1995, Aplin accepted). This differs from the ideas of
Flannery (1989), Godthelp (1999) and (Hand 1984) who suggested that rodents entered
Australia directly from Indonesia, possibly from the drier islands of Timor or Flores. This
unlikely scenario would suggest that water rats and mosaic-tailed rats originated in
Australia and later spread to New Guinea. Lowered sea levels in the late Miocene
(Chappell and Shackleton 1986, Haq et al. 1987) probably resulted in a land connection
between Australia and parts of New Guinea that could have facilitated an invasion of
Australia from New Guinea. Marsupial interchange between Australia and New Guinea has
been dated to this time (Aplin et al. 1993, Krajewski et al. 1993). Waif dispersal from New
Guinea could have occurred at any time. Multiple invasions of Australia by New Guinean
mosaic-tailed rats, Pogonomys, and Rattus occurred during the Pleistocene via land bridges
across Torres Straight (Simpson 1961, Watts and Aslin 1981, Taylor et al. 1983). Two
conilurine species (Conilurus penicillatus and Pseudomys delicatulus) invaded New Guinea
(Flannery 1995). They each have a New Guinean distribution restricted to the Trans-Fly
plains, an area that is essentially the northern extension of Australian habitats cut off by
rising sea level at the end of the LGM (Flannery 1995).
2.2.2 FOSSIL HISTORY
Tertiary fossil history
Dating the entry of rodents to Australia would ideally rely on the appearance of rodent
fossils at a discrete time interval in a widespread, continuous, fossil history. Unfortunately,
the Tertiary fossil record of Australia is poor and comprised of scattered faunas
representing relatively short time periods that are often difficult to date (Rich et al. 1982,
Archer et al. 1989). The earliest reliably dated Australian fossil rodents are found in
northern and central Australian deposits dated between 3 and 4 Ma (table 2.4). There is an
apparently well-defined age of 4+/- 0.12 Ma for the rodent-bearing Bluff Downs local
fauna in northeast Queensland (Archer and Wade 1976). However, Aplin (accepted)
30

considers rodent bearing deposits older than 3.4Ma to be either unreliably dated, or not to
have been suitably examined to establish their rodent content. Rodent fossils are not present
in any Miocene deposits, even in faunas that contain rodent-sized marsupials (Archer et al.
1989, Tedford and Wells 1990, Archer et al. 1999), so an early Pliocene or latest Miocene
colonisation is strongly suggested by the fossil record. Most Tertiary rodent fossils are
obviously conilurine, although Godthelp (1999) suggested a Dendromurine-like fossil from
Riversleigh is distinct from all modern Australian rodents, and Aplin (accepted) has
recovered a distinctively basined water rat tooth from a 2.8Ma+ deposit on Barrow Island.
The Rackham’s roost small mammal fauna from Riversleigh in northwest Queensland has
been speculatively dated at 4-5Ma (Archer et al. 1991, Godthelp 1999). However, this is a
biostratigraphic date, and Aplin (accepted) is not confident of a date older than 3Ma.
Rackham’s roost contains thirteen rodent species in three conilurine genera; Leggadina,
Pseudomys and Zyzomys. On the basis of the diversity of rodents in this deposit Godthelp
(1999) proposed a Miocene rodent colonisation of Australia. However, given the essentially
un-dated nature of the deposit, caution dictates that it be regarded as a “Pliocene” fauna,
with no greater significance in resolving origins of the conilurines until a firm dating
method is applied to the site. The fact that rodents were apparently absent from the
Hamilton area of southern Australia in the early Pliocene (Hand 1984) suggests a post-
Miocene origin. However, habitat surrounding the Hamilton deposits at the time of
deposition was generally a mixture of wet forest types (Macphail 1996) that may have
precluded conilurine rodents solely on the basis of ecological preference (section 2.3.2).
Fossil deposits from the late Pliocene onward are generally rich in rodent fossils, although
there is a dearth of early Pleistocene material. Many sites have been assigned an age
relating roughly to the Plio/Pleistocene boundary (Rich et al. 1982). However, most have
not been appropriately dated and may be much more recent. Two dated sites of note from
the late Pliocene are Dog Rocks (2.03-2.48Ma; Whitelaw 1989), which contains two
Pseudomys species from southern Victoria (table 2.4), and Fisherman’s Cliff on the lower
Murray River. The latter (2.42-2.87Ma; Whitelaw 1991) contains a diverse rodent fauna
(Marshall 1973, Crabb 1977) consisting of seven conilurine species in five genera, although
31
Crabb’s Leggadina idjibudoo is probably a Pseudomys species, as he included P.
hermannsburgensis and P. delicatulus within Leggadina. Other species present resembled
Leporillus apicalis, Notomys, Pseudomys occidentalis and P. albocinereus. The presence of
putative modern species in the deposit (Crabb 1977) is probably an indication of
comparison to modern forms rather than of a static fauna in the region. No Conilurus or
Mesembriomys fossils have been recorded from the Pliocene or early Pleistocene, despite
obviously deep phylogenetic division between them and other conilurines (section 2.1.3).
The first appearance of the genera Hydromys and Rattus may be recorded in the two million
year old Floraville deposit of northwest Queensland (Rich et al. 1982), although this
Plio/Pleistocene age is based only on biostratigraphic evidence. Marshall (1973) recorded
Rattus from Fisherman’s Cliff, however Crabb (1977) did not. The fossil record of
Australian Rattus is certainly older than the 40ka quoted by Watts and Aslin (1981), and
Godthelp (1999) favoured a 2Ma origin of Australian Rattus. However, he suggested that
the original lineage has been superseded by New Guinean species. Aplin (accepted) does
not consider there to be any relevant evidence regarding the date of entry by Rattus. A
possible mechanism for colonisation around 2Ma would have been provided by a drop in
sea level due to the first formation of the northern polar ice cap (Chappell and Shackleton
1986, Haq et al. 1987).
32

Table 2.4. Pliocene rodent faunas of Australia Data from Aplin (accepted), Marshall (1973), Rich et al. (1982), Whitelaw (1989, 1991), Godthelp (1999).
Site Location Age Rodents present Parwan S Vic 4.06-4.2a Rodent Bluff Downs NE QLD 3-4Ma Unidentified conilurine (1) Kanunka NE SA 3.4Ma Muridae Riversleigh NW QLD 3+Ma Leggadina (2 spp.) Pseudomys (7 spp.) Zyzomys (1 sp.) “Dendromurine” (1 sp.) Unidentified (2) Barrow Island NW WA 2.8-3.6Ma Pseudomys (1sp.)
Zyzomys New genera (2)
Chinchilla SE QLD 2-3 Ma Pseudomys vandycki Fisherman’s Cliff NW Vic 2.42-2.87Ma Arujaomys
Leggadina idjibudoo1 Leporillus apicalis Notomys (1 spp) Pseudomys (2 spp.) P. albocinereus P. occidentalis Murinae
Dog Rocks S Vic 2.03-2.48Ma Pseudomys (2 spp.) Floraville NW QLD ~2?Ma Pseudomys spp.
Rattus sp. Malkuni NE SA ~2Ma Rodent
1 Probably a Pseudomys species.
Quaternary Australian Rodents
Abundant rodent fossils are found in Pleistocene and Holocene deposits. Nearly all rodents
in these deposits are modern species (table 2.5). Most Pleistocene and Holocene sites are
cave deposits from owl roosts (Wakefield 1972), or lacustrine and fluvial deposits in
central Australia (Tedford and Wells 1990). Quaternary fossil deposits reveal wholesale
changes in the distribution of rodent and marsupial species in response to natural climatic
fluctuations, and more recently as a result of European colonisation. Both features are of
relevance to this thesis.
The co-occurrence of many species in late Pleistocene deposits has been labelled as
“disharmonious” (Lundelius 1983, Tedford and Wells 1990) due to the fact that the species
in question are now geographically separated and appear to have fundamentally different
ecological preferences. This highlights the importance of species ecology in dictating
different responses to changing environmental conditions, thereby modifying the potential
33

evolutionary consequences of environmental change for different species. The presence of
koalas (Phascolarctos cinereus) on the Nullarbor Plain during the past 20ky indicates
caution is required when discussing barriers and biogeographic pattern (Lundelius 1983).
The Nullarbor Plain is currently one of the most arid regions of Australia and is considered
a major barrier between many taxa, including the rodent sib-species Pseudomys
albocinereus and P. apodemoides. The Nullarbor is a significant long-term barrier to plants
(White 1994), but some “forest” mammals were able to exploit the region quite recently,
which must be taken into account when discussing allopatric populations. Comment on
natural biogeographic pattern is also made difficult by post-colonisation range reductions
(Smith and Quin 1996b). In fact several of Lundelius’ own “disharmonious” allopatric
species were not naturally allopatric. Notable among the rodents in this regard is P.
desertor, which is still sympatric with the rufous bettong (Aepyprymnus rufescens), but
was not known to be so until very recently. Recent range reductions of many rodent taxa
are recorded in sub-fossil deposits in which bones of locally extinct species are found in
association with those of introduced Mus musculus, Rattus rattus or Oryctolagus cuniculus
and in radio-carbon dated late Holocene deposits (Archer and Baynes 1972, Baynes 1984,
Ellis 1995). Some conilurine species have disappeared from tens of thousands of square
kilometres (Smith and Quin 1996b).
34

Table 2.5. Some Quaternary rodent fossil deposits. (P) Pleistocene only. (H) Holocene only. * Extinct; # no longer present in region of deposit Site Location Age Rodents present Pyramid Cave (Wakefield 1972)
NE Victoria ~>20ka (P) and <10ka (H)
Rattus fuscipes R. lutreolus Hydromys chrysogaster (P) Melomys cervinipes (P)# Conilurus albipes* Mastacomys fuscus Pseudomys fumeus P. higginsi (P)# P. novaehollandiae P. oralis (H)#
Devil’s Lair (Baynes et al. 1975)
SW Western Australia 12-20ka Rattus fuscipes Hydromys chrysogaster Notomys sp.* Pseudomys albocinereus P. fieldi# P. occidentalis# P. shortridgei#
Texas Caves (Archer 1978)
SE Queensland Late? Pleistocene Rattus fuscipes? R. lutreolus? Conilurus albipes* Pseudomys gracilicaudatus P. desertor# P. novaehollandiae P. oralis# P. sp.
Mootwingee (Ellis 1995) (pers. comm.)
W New South Wales Post-colonisation Leporillus conditor# Mus domesticus Notomys cervinus# N. longicaudatus* Pseudomys australis# P. hermannsburgensis P. bolami# Rattus villosissimus#
Wombeyan (Ride 1960)
SE New South Wales Pleistocene Mastacomys fuscus Pseudomys australis# P. fumeus#
Wilgie Mia (Baynes 1984)
CW Western Australia 1ka-present Leporillus apicalis* L. conditor# Notomys sp. N. longicaudatus* Pseudomys nanus# P. fieldi# P. hermannsburgensis Rattus tunneyi
Victoria Cave (Wells et al. 1984)
S South Australia <150ka? Conilurus cf. albipes* Mastacomys fuscus# Pseudomys albocinereus1 P. australis# P. cf. fumeus# Rattus sp.
1. P. apodemoides?
35
2.3 Evolution of the Australian biota
2.3.1 CLIMATE AND VEGETATION
Overview
Extensive deserts and arid landforms that currently typify Australia are atypical when
compared to past conditions (Ayliffe et al. 1998). As late as the early-mid Miocene, much
of Australia supported rainforests of Gondwanan origin (Christophel and Greenwood 1989,
White 1994). Throughout the mid-late Tertiary and Quaternary, climatic events have
caused the gradual and accelerating loss of rainforests and their replacement by xeric
communities (Bowler 1982, Christophel and Greenwood 1989, Flower and Kennett 1994,
Martin 1998). Deflection of ocean currents by drifting continents and events such as the
closure of the isthmus of Panama intensified latitudinal sea and air temperature gradients,
altering pressure gradients and forcing the sub-equatorial high-pressure belt northward
(Bowler 1982). Movement of the high-pressure belt caused increasingly seasonal weather
patterns and produced strong, dry, westerly winds that resulted in a continuous reduction in
precipitation across Australia (Bowler 1982). Superimposed on these longer-term processes
were shorter Milankovitch cycles acting on time scales of 19Ky, 40Ky and 100Ky that alter
insolation and were responsible for severe cold periods and glaciations during the
Pleistocene (Imbrie et al. 1989, Webb and Bartlein 1992). Australia’s low relief and
latitudinal position minimised the direct impact of Pleistocene glacial ice (Twidale and
Campbell 1995). However, the intensely arid conditions and strong winds that accompanied
large scale glaciations of the Pleistocene saw the formation of Australia’s arid landscapes,
with dune fields, gibbers and playa lakes becoming commonplace only in the last 500ky
(Bowler 1982, Krieg et al. 1990, Clarke 1994, Hesse 1994, Macphail 1997, Zheng et al.
1998, Pell et al. 2000, Bowler et al. 2001).
36

Vegetation of the Late Tertiary
By the latest Miocene (~6Ma) Australia was beginning to resemble the continent of today.
In general the climate was still wetter, but moisture and temperature gradients were similar
to today (Macphail 1997). Rainforests had long since disappeared from central and western
Australia and much of Queensland, and open vegetation with xeric components was present
(Lange 1978, Truswell and Harris 1982, Christophel and Greenwood 1989, Martin and
McMinn 1994). The northeast of Australia supported a habitat mosaic of rainforest and
sclerophyll forest, although of different composition and in different proportion to today
(Christophel and Greenwood 1989, Martin and McMinn 1993). South-eastern Australia
supported extensive rainforest and sclerophyll forests in which Eucalyptus was increasingly
common (Truswell and Harris 1982, Christophel and Greenwood 1989, Macphail et al.
1995, Macphail 1996, Martin 1997, Greenwood et al. 2000). The early Pliocene was
relatively warmer and wetter than the cold period that ended the late Miocene (Galloway
and Kemp 1981). Rainforests of the east expanded slightly during the early-mid Pliocene
(Martin 1991), but grasses continued to increase throughout the interior and areas such as
the Eyre Peninsula, far western New South Wales and western Queensland were home to
woodland and savannah communities (Truswell and Harris 1982, Christophel and
Greenwood 1989, Martin 1997). The vegetation of the current arid zone and its margins
contained a richer mosaic of vegetation than today, including developing xeric
communities and relict forest and rainforest communities (Benbow et al. 1995, Martin
1998). Grasses had been increasing in abundance since the Eocene, but it was not until the
Pliocene that woodlands and savannah woodlands became prevalent, being replaced by
grasslands and shrubland during the Pleistocene (Christophel and Greenwood 1989, Martin
1998). Savannahs of the Pliocene experienced severe winter aridity, with a summer wet
season, causing extensive leaching of soil nutrients and reactivation of drainages of the
interior that were dormant during the late Miocene (Bowler 1982, Palaeogeographic Group
1990).
By the late Pliocene cooler conditions had returned as the northern polar ice cap formed
(Shackleton et al. 1984). This heralded the beginning of increasingly severe climatic cycles.
37

By the end of the Pliocene, around 1.6 Ma, the current distribution of Australian vegetation
had been roughly established, with sclerophyll forests restricted to continental margins in
the east and southwest, and rainforests reduced to isolates in the east (Christophel and
Greenwood 1989). During the Pleistocene these boundaries fluctuated markedly on local
scales in concert with glacial cycles, and cyclical altitudinal changes in vegetation are well
documented in eastern Australia and Tasmania (Hopkins et al. 1993, Kershaw 1994,
Macphail et al. 1995, Nanson and Price 1998). The major changes in Australian vegetation
over the past million years have been related to the formation of the current arid zone, with
sand, gibber and salinity replacing woodlands and savannah, and the development of hardy
chenopod and spinifex communities capable of enduring these conditions (Bowler 1982,
Christophel and Greenwood 1989, Martin 1998). The extent of the arid zone increased
markedly during glacial maxima, and evidence of aridity reaching the present continental
margins is found in the form of aeolian dune fields of desert origin in western Victoria,
southern South Australia and the Kimberley (Jennings 1975). Very recent changes in
Pleistocene and Holocene vegetation, and the observed aridity of the present inter-glacial
compared to equivalent periods earlier in the Pleistocene, have been attributed to the impact
of human arrival during the last glacial cycle (Kershaw and Nanson 1993, Ayliffe et al.
1998, Luly 2001).
Modern Bioregions
Despite the atypical nature of the modern environment, Nix (1982) has shown that the
broad distributions of modern plant taxa conform to current environmental conditions, and
are not an artefact of past climate. Using only modern thermal and moisture regimes as an
indication of plant growing conditions Nix (1986) was able to demonstrate that the
biogeographic subregions usually recognised within Australia (Archer and Fox 1984,
Cranston and Naumann 1991) emerge from analysis (fig. 2.3). These basic subregions, the
Bassian, Torresian and Eyrean are referred to throughout the remainder of this thesis. Each
is further sub-divided, and many modifications of the basic scheme have been proposed for
different groups of organisms (Burbidge 1960, Kikkawa and Pearse 1969, Cranston and
Naumann 1991). However, rodents conform reasonably well to the scheme shown in figure
38
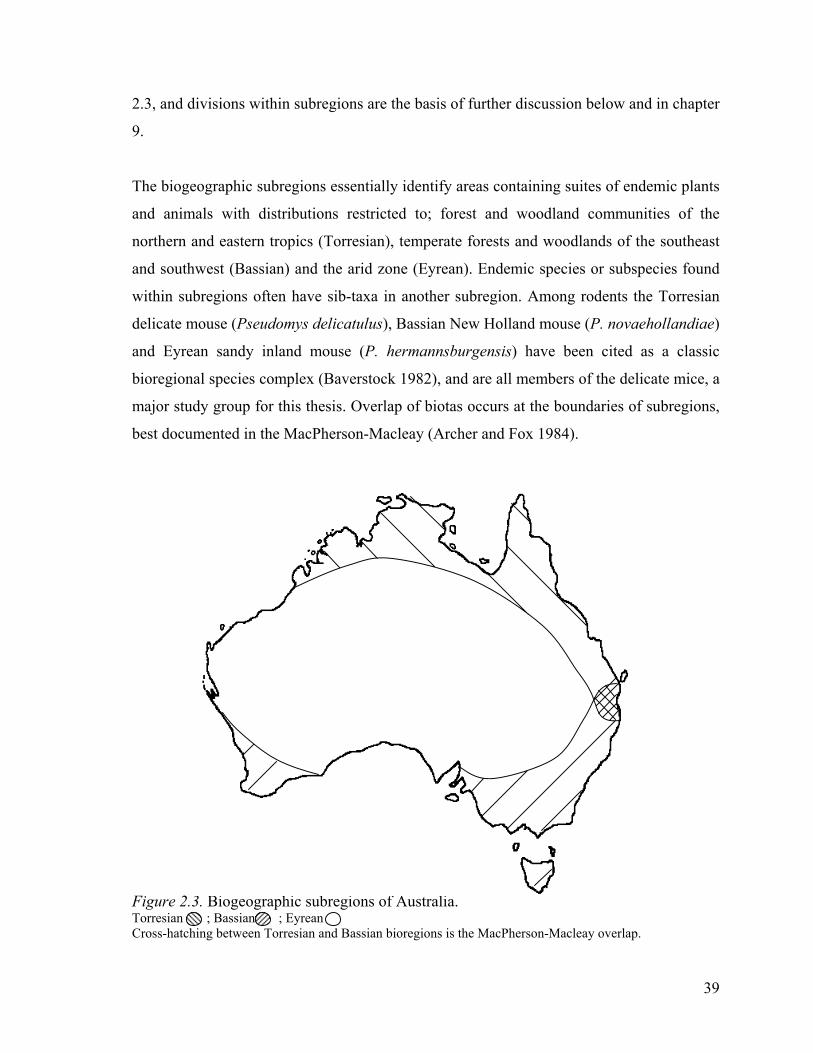
2.3, and divisions within subregions are the basis of further discussion below and in chapter
9.
The biogeographic subregions essentially identify areas containing suites of endemic plants
and animals with distributions restricted to; forest and woodland communities of the
northern and eastern tropics (Torresian), temperate forests and woodlands of the southeast
and southwest (Bassian) and the arid zone (Eyrean). Endemic species or subspecies found
within subregions often have sib-taxa in another subregion. Among rodents the Torresian
delicate mouse (Pseudomys delicatulus), Bassian New Holland mouse (P. novaehollandiae)
and Eyrean sandy inland mouse (P. hermannsburgensis) have been cited as a classic
bioregional species complex (Baverstock 1982), and are all members of the delicate mice, a
major study group for this thesis. Overlap of biotas occurs at the boundaries of subregions,
best documented in the MacPherson-Macleay (Archer and Fox 1984).
Figure 2.3. Biogeographic subregions of Australia. Torresian ; Bassian ; Eyrean Cross-hatching between Torresian and Bassian bioregions is the MacPherson-Macleay overlap.
39

Living on the outer
The major biogeographic subregions reflect the overall biogeographic pattern of the
Australian biota. There is a recently developed, relatively homogeneous, arid interior
surrounded by a non-arid periphery (Heatwole 1987). The periphery consists of much older
and more heterogeneous ecosystems. This is reflected in the fact that species distributions
in the Torresian and Bassian zones are often fragmented or restricted when compared to
broad distributions of many central Australian species (Archer and Fox 1984, Heatwole
1987). Many areas of endemism have been described that identify repeated patterns of
range fragmentation occurring in habitats that surround the arid zone, generally as a result
of increasing aridity (fig. 2.4; Keast 1961, Cracraft 1982, Crisp et al. 2001). The relevance
of areas of endemism to understanding evolutionary pattern, particularly in northern and
central Australia, is discussed briefly in chapter 9. The main basis for that discussion is the
critical examination of the effect two major barriers in northern Australia, the Carpentarian
Barrier and the Great Sandy Desert, have had on the distributions and divergence of
conilurine rodents (section 2.3.3).
40

Figure 2.4. Some areas of endemism around the Australian continental margin. Areas modified from Cracraft (1982). Areas in central Australia are not shown.
2.3.2 RECENT HISTORY OF AUSTRALIAN VERTEBRATES
“Non-forest animals”
Northward-drifting Tertiary Australia carried a cargo of largely Gondwanan temperate
rainforest plants and animals (Archer et al. 1991). These groups underwent major
radiations, and the mid Miocene marsupial fauna of Australia was possibly more diverse
than at any other time (Archer et al. 1999). As the continent entered lower latitudes the
endemic fauna was faced with widespread loss of its rainforest habitat, which retreated to
the cooler south and wetter continental margins (section 2.3.1). Fossil faunas of arboreal
marsupials in central Australia are replaced by progressively more terrestrial forms
throughout mid-late Miocene deposits (Hope 1982), and by 8Ma large terrestrial birds and
41

mammals dominate the central Australian Alcoota deposit, collectively termed “non-forest
animals” by Hope (1982). The transition of the fauna from forest to non-forest animals is
well illustrated by the genus Burramys. These pygmy possums were found throughout
Miocene rainforests of central Australia, and are common in Miocene deposits from
Riversleigh (Archer et al. 1989). Their distribution can be traced through late Tertiary fossil
deposits, first becoming restricted to the south-east (Macphail 1996), and then to relictual
pockets of rainforest of the eastern highlands (Ride 1960, Archer et al. 1991). Others, like
the ektopodontids, simply disappeared (Pledge 1982).
Forest animals
Although many native species adapted successfully to the increasingly arid and open centre
of Australia, communities of the arid zone are significantly less diverse than those of
surrounding habitats. There are twice as many bird species found in tropical and eastern
Australia than there are in central Australia (Pianka and Schall 1981, Schodde 1999). Bats
share this pattern of diversity, and like birds, are more diverse in the tropics than in
temperate forests (Pianka and Schall 1981). Marsupials are more diverse in forested eastern
Australia than in the tropics and arid Australia is clearly depauperate compared to both
regions (Pianka and Schall 1981). Partitioning of habitats is a fundamental process leading
to species diversity (Begon et al. 1996), and forests, particularly rainforests, provide far
greater opportunity for niche partitioning than do the simple, widespread, nutrient-deprived,
communities of arid Australia (Morton and James 1987, Schodde 1999). Structural
diversity is therefore probably the primary factor dictating the diversity of most vertebrate
groups. However, the history of a group will indelibly mark its future evolution, and the
arboreal legacy of Gondwanan rainforests should not be underestimated in dictating a
predisposition towards forest habitats (Smith-White 1982).
Partitioners
Lizards are a vertebrate group that has been particularly successful in the arid zone (Pianka
and Schall 1981). Lizards effectively partition simple desert habitats such as spinifex, with
42

a single spinifex plant representing multiple feeding niches (Morton and James 1987).
Mammals or birds could not partition habitat at that level, and Morton and James (1987)
further propose that the abundance of termites in arid Australia has provided a specialised
feeding niche that lizards are better adapted to exploit than other vertebrates. Australian
desert lizards have long been noted as remarkably diverse when compared to those of North
America, while other vertebrates appear to be less successful in comparison to that
continent (Morton et al. 1994). The uncertainty of rainfall and general unpredictability of
habitats in the Australian arid zone may have favoured lizards over other groups because
they were capable of withstanding longer periods without food than endotherms and were
advantaged by open spaces in which to bask (Schall and Pianka 1978, Morton and James
1987).
Environmental and systematic aspects of rodent diversity
Like other vertebrate groups, rodents exhibit high diversity in tropical forests. However,
this diversity is attributable to multiple recent invasions from New Guinean rainforests (Lee
et al. 1981), and the origin and distribution of endemic species diversity lies elsewhere
(Watts and Aslin 1981). The distribution of conilurine species diversity (fig. 2.5) reveals
the group to be non-forest animals. The fact that the bulk of Australian rodents are non-
forest taxa draws an immediate contrast to marsupials and birds (above). Structural
arguments regarding the relatively low diversity of marsupials and birds in the arid zone
should equally apply to rodents, indicating that other factors are influencing the diversity of
the conilurine lineage.
Watts and Aslin (1981) noted that Australian rodents were “strongly adapted to drier
habitats” (pg. 19), and a preference for dry conditions is immediately apparent from the
distribution of conilurine species diversity in relation to a soil moisture index (fig. 2.5).
Unlike Rattus species, water rats and mosaic-tailed rats, diversity of conilurines is greatest
in the arid zone and the seasonally arid northern savannahs. Species diversity is low in the
moist southeast, where forests are common, and conilurines are completely absent from
closed forests of the northeast. Species diversity in the arid zone is unlike that of northern
43

savannahs in that the bulk of species belong to the genera Pseudomys or Notomys. In
contrast, generic diversity in savannahs is high, while species diversity within most genera
is low.
The mosaic-tailed rats and Pogonomys sp. are recent descendents of New Guinean
rainforest stock (Lee et al. 1981, Watts and Baverstock 1994a), and are still basically
confined to that habitat, although Melomys burtoni is found in tropical grasslands, and
Melomys cervinipes may occur outside rainforest in the southern parts of its range (Kerle
1995c, Redhead 1995). If species diversity of New Guinean rodent groups occurring in
Australia is compared to a soil moisture index (fig. 2.5), a clear preference for the wettest
available habitats is evident. This is especially true of the aquatic genera Hydromys and
Xeromys. Species of Rattus also exhibit a marked preference for forest habitats and wetter
areas of the continent (fig. 2.5), although Rattus villosissimus occurs in moist refugia of the
inland and occupies large tracts of typically arid habitat when conditions are suitable
(Newsome and Corbett 1975), and Rattus tunneyi may once have been very widespread
throughout arid Australia, but has now disappeared from most of the continent (Watts and
Aslin 1981).
44
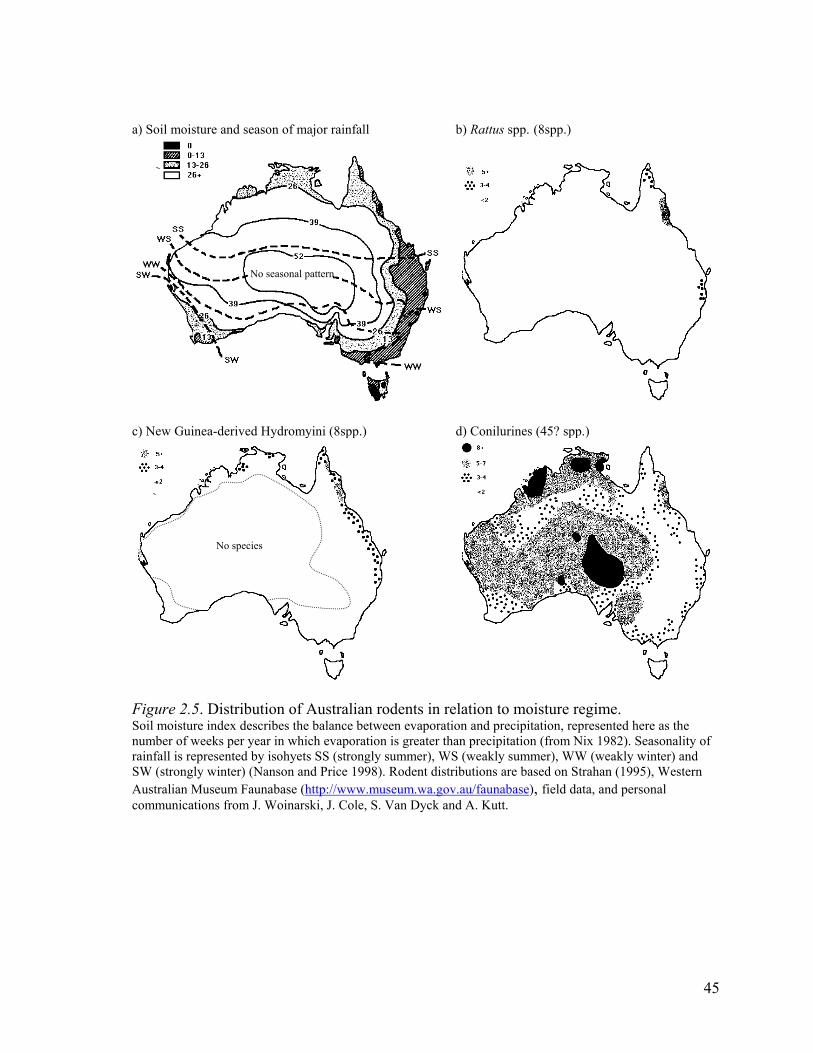
a) Soil moisture and season of major rainfall
b) Rattus spp. (8spp.)
c) New Guinea-derived Hydromyini (8spp.) d) Conilurines (45? spp.)
Figure 2.5. DSoil moisture inumber of weerainfall is reprSW (strongly wAustralian Mucommunicatio
No species
istrindex dks per
esentedinter)
seum Fns from
No seasonal pattern
bution of Australian rodents in relation to moisture regime. escribes the balance between evaporation and precipitation, represented here as the year in which evaporation is greater than precipitation (from Nix 1982). Seasonality of by isohyets SS (strongly summer), WS (weakly summer), WW (weakly winter) and (Nanson and Price 1998). Rodent distributions are based on Strahan (1995), Western aunabase (http://www.museum.wa.gov.au/faunabase), field data, and personal J. Woinarski, J. Cole, S. Van Dyck and A. Kutt.
45

2.3.3 RELICT SAVANNAH DIVERSITY
Eucalypt-dominated monsoonal habitats with a grassy understorey, collectively referred to
here as tropical savannahs, are the only Australian habitats with a richer conilurine fauna
than the arid zone (fig. 2.5). Under the auspices of “savannah” I also include the restricted
monsoonal rainforest pockets inhabited by large Zyzomys, although they are included more
as a matter of geographical convenience than genuine similarity. The savannahs are subject
to highly seasonal rainfall, and have a negative water budget (evaporation>precipitation)
for up to six months of the year (fig. 2.5). Those of the Kimberley and Top End contain two
genera and several species of different sized mice, two genera of large and medium-sized
tree rats, and specialised species such as rock-rats, a hopping mouse and pebble-mound
mice (Woinarski 2000). I propose this indicates the diversity of savannahs is ancestral, as it
is only in savannahs that such ecologically and systematically diverse conilurine
communities are found. Early fossil faunas are also from savannah habitats (Godthelp
1999), and the Pliocene spread of savannah conditions probably coincided with the arrival
or diversification of conilurine rodents (section 2.3.2). The fate of these ancestral conilurine
communities during the Pleistocene has paralleled the earlier fate of forest marsupial and
bird communities, in that they have become restricted to the continental margin. The spread
of arid conditions has forced savannahs northwards, where they now form three major
refuge areas in the Pilbara, Kimberley-Top End and Cape York (fig. 2.6). Keast (1961)
termed these the Hammersly, northwest and northeast refuges and recognised them as
having a marked effect on divergence of bird races and species. The Pilbara actually lies
within the arid zone proper, but by virtue of its gorges provides microclimates that harbour
savannah species such as Mesembriomys macrurus (Morton et al. 1996).
As noted above, savannah faunas are partitioned into three large refuge areas. The Great
Sandy Desert and Carpentarian Barrier are responsible for this partitioning. Each is a
significant departure from the vegetation, topography and climate of the adjacent savannahs
(below and fig. 2.6). The effect of these two barriers on the rodent fauna of northern
Australia is a major focus of speciation studies in this thesis. Both barriers cause
disjunction of many vertebrate distributions. However, both are typified by relatively recent
46

Pleistocene aridity and landforms (Bowler 1976, Wyrwoll et al. 1986, Kershaw and Nanson
1993), so attributing a role in speciation to them on the basis of current species distributions
is potentially controversial (Avise et al. 1998). A detailed reconstruction of the evolution of
these barriers, and their probable relationship to animal distributions, is therefore required
before discussing their possible influence on rodent diversification.
History of the savannah belt
The landforms of the savannah regions have been stable for very long time periods, and are
some of the best-preserved ancient landscapes in the world (Twidale and Campbell 1995).
Recent geomorphological evolution of the Great Sandy Desert and Carpentarian Barrier is
discussed below. The two major aspects of Pleistocene environmental change in northern
Australia are a cyclic pattern of effective precipitation (Bowler et al. 2001, De Dekker
2001), and large fluctuations in the extent of land in response to changing sea level
(Yokoyama et al. 2001). These two factors do not interact in a straightforward manner.
Although the Holocene is a warm interglacial period and is wetter than the cold LGM,
cooler temperatures during glacial cycles can actually result in increased effective
precipitation due to reduced evaporation (Ayliffe et al. 1998, Bowler et al. 2001), and some
evidence suggests that greater precipitation may also have occurred (Nott et al. 1996). This
means that for plants that can tolerate cooler temperatures the extent of suitable conditions
may actually expand considerably to the north during parts of glacial cycles. Migration of
plant species into, and out of, local areas is recorded over short time scales in the
Kimberley (Wallis 2001). However, during glacial maxima, bands of habitats move
northward in response to arid conditions, and the eucalypt woodlands currently found in the
Top End were postulated by van der Kaars (1991) to be found 800km further north than
today during the LGM (fig. 2.6).
47
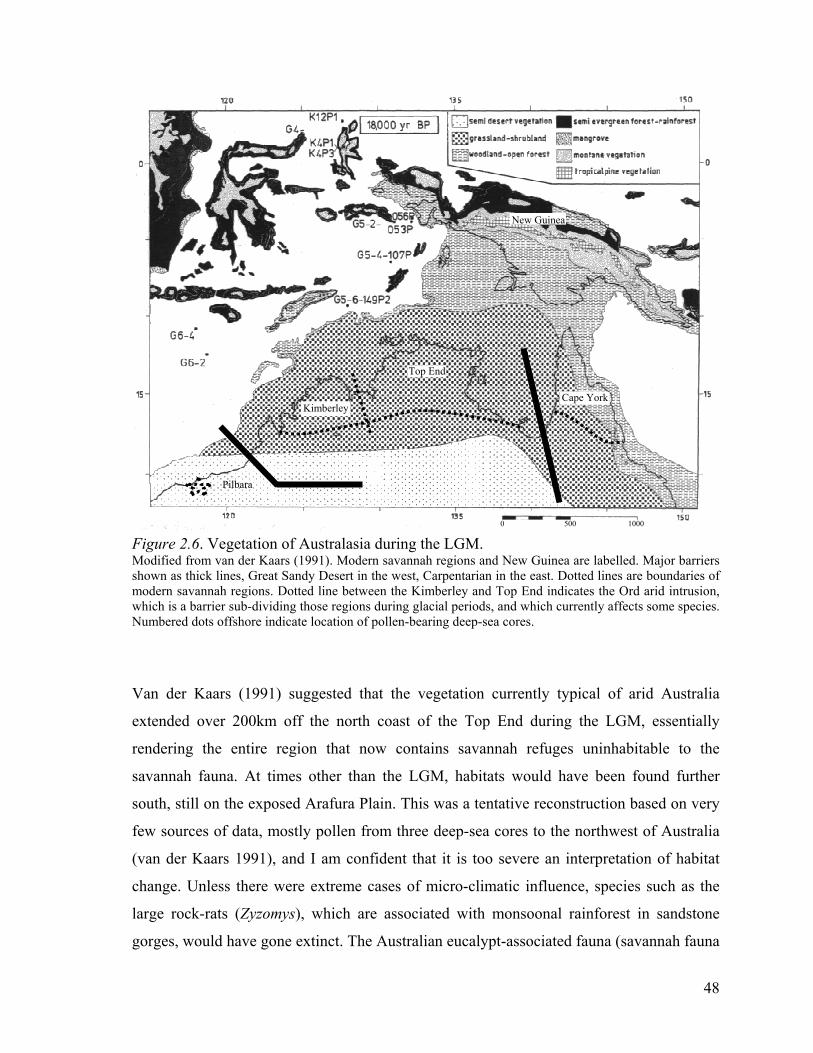
Kimberley
Top End
Cape York
New Guinea
Figure 2.6. VModified from shown as thick modern savannawhich is a barriNumbered dots
Van der Kaa
extended ove
rendering th
savannah fau
south, still on
few sources o
(van der Kaa
change. Unle
large rock-ra
gorges, woul
Pilbara
0 500 1000
egetation of Australasia during the LGM. van der Kaars (1991). Modern savannah regions and New Guinea are labelled. Major barriers lines, Great Sandy Desert in the west, Carpentarian in the east. Dotted lines are boundaries of h regions. Dotted line between the Kimberley and Top End indicates the Ord arid intrusion,
er sub-dividing those regions during glacial periods, and which currently affects some species. offshore indicate location of pollen-bearing deep-sea cores.
rs (1991) suggested that the vegetation currently typical of arid Australia
r 200km off the north coast of the Top End during the LGM, essentially
e entire region that now contains savannah refuges uninhabitable to the
na. At times other than the LGM, habitats would have been found further
the exposed Arafura Plain. This was a tentative reconstruction based on very
f data, mostly pollen from three deep-sea cores to the northwest of Australia
rs 1991), and I am confident that it is too severe an interpretation of habitat
ss there were extreme cases of micro-climatic influence, species such as the
ts (Zyzomys), which are associated with monsoonal rainforest in sandstone
d have gone extinct. The Australian eucalypt-associated fauna (savannah fauna
48

here) would have primarily migrated to New Guinea, and occupied a significant portion of
that island, yet only two (of a possible 17) savannah conilurines are now found in eucalypt
habitats of southern New Guinea. I am aware of no fossil evidence that suggests most of the
fauna was present in southern New Guinea in recent times. Flannery (1989) suggested that
woodland and savannah habitats were present between the two islands, and Nix and
Kalama (1972) proposed woodland and open forest. However, allowing for the speculative
nature of van der Kaars (1991) map, two features are of great importance. 1) Large areas to
the north of Australia historically provided suitable habitats for species currently confined
by high sea level, 2) many areas currently occupied by species on the mainland would not
have been suitable for them in the recent past. The interaction of the formation of the
Carpentarian Barrier and Great Sandy Desert with these changes in habitat creates a
complex situation in which to interpret population divergence that is not suggested by the
contemporary distributions of species.
Geological formation of barriers
The Carpentarian Barrier and Great Sandy Desert were both inundated by Cretaceous seas,
an event that occurred long before murid rodents evolved, but one that indicates a long-
term history of low elevation and topography (Palaeogeographic Group 1990). Beard
(1974) described the Great Sandy Desert as “a monotonous expanse of gently undulating
country” (pg. 30) and (Twidale 1956) regarded the Carpentarian plains (which are
comprised of the Gulf Plains and Mitchell Grass Downs) as an excellent example of a
peneplain- an area completely flattened by erosion. Both areas have been gently up-warped
since the Cretaceous marine incursion (Twidale 1956, Beard and Webb 1974, Coventry et
al. 1980), a process that may be ongoing in the region of the Selwyn Upwarp in the
Carpentarian plains (Twidale 1966). However local topographic relief is minimal, and
Twidale described the “Selwyn Range” as a “figment of some cartographer’s imagination”
(pg. 491). Both the Carpentarian plains and the region of the Great Sandy Desert were
subject to processes of deep weathering during the Miocene and Pliocene, which produced
lateritic surfaces still evident in many areas (Twidale 1956, Beard and Webb 1974,
Coventry et al. 1980, Twidale and Campbell 1995).
49

While the Pliocene history of the two regions is similar, the Pleistocene saw active drainage
and fluvial action in the Great Sandy Desert cease (Beard and Webb 1974,
Palaeogeographic Group 1990). Fluvial erosion has been ongoing on the Carpentarian
plains, and resulted in the current peneplain following stripping of the lateritic surface
(Twidale 1956, Coventry et al. 1980). The current level of the plain was probably achieved
only in the last 1Ma (Coventry et al. 1985). The cessation of fluvial action in the Great
Sandy Desert was followed by predominantly aeolian activity that has seen the formation
and spread of a large sand sheet. The sand sheet has been worked into longitudinal dunes
running ESE-WNW that form the northwest portion of a massive whorl of desert dunes
around the centre of the continent (Wasson 1986). The dunes are oriented according to the
dominant wind direction during the late Pleistocene (Jennings 1975, Wasson 1986), when
the fields were active, but they are now stabilised by Acacia-dominated vegetation
(Wyrwoll et al. 1986). The age of the Great Sandy Desert dune fields has not been
established, but those in the northeast are older than 230ka (Bowler et al. 2001). No dune
fields in Australia have been dated as older than 700ka (Wasson 1986, Gardner et al. 1987).
It seems reasonable to assume an age of around 500ka for a significant inland barrier to
animal movement through the region. However, aeolian dunes continuous with the main
Great Sandy Desert at the mouth of the Fitzroy River, in the west Kimberley, have been
dated to around the time of the LGM or early Holocene (Jennings 1975), so contact
between the Kimberley and Pilbara may have been possible along the coastal strip much
more recently than 500ka.
Vegetation history of barriers
The history of vegetation in the northwest is poorly known. On the basis of a single sea-
core Martin and McMinn (1994) suggested that Casuarina forests dominated the late
Miocene vegetation of the region, and these were progressively replaced by grasslands
through the Plio-Pleistocene with no dominance by eucalypts at any time. If true, these
results would deny the evidence of a previously continuous savannah fauna across northern
Australia. However, they are probably wrong, as van der Kaars (1991) recorded abundant
50

eucalypt pollen in sea-cores off the northwest of Australia until 190ka, when cycles of
grass-dominated vegetation appear in the record. It appears that up until the mid
Pleistocene there may have been contact of savannah habitats between the Kimberley and
Pilbara. But in the late Pleistocene conditions became arid, periodically very arid, and dune
fields and unsuitable habitats isolated the Pilbara (Wende et al. 1997, Bowler et al. 2001).
This was not the case in the Carpentarian Barrier. The development of the semi-arid, almost
tree-less vegetation that dominates the Carpentarian plains is unknown, but is probably
largely irrelevant to the contact of Cape York and Top End faunas. Exposure of the Arafura
Plain and Carpentarian basin during long periods of the Pleistocene has meant that the
current isolation of Cape York due to the Gulf of Carpentaria and inland plains is a
comparatively infrequent situation (Torgensen et al. 1983, Yokoyama et al. 2001). In the
last 100ka the Gulf bed was exposed periodically between 80ka and 40ka and was
continuously exposed from 40ka until 9.7ka, when the last marine transgression occurred
(Chivas et al. 2001). At times when the basin is empty a large lake, Lake Carpentaria, fills
much of the south-eastern part of the present day Gulf (Torgensen et al. 1983, Chivas et al.
2001). Grasslands and swamps are common around the lake, but eucalypt-dominated
vegetation would almost certainly be present in the north (Torgensen et al. 1988, van der
Kaars 1991). The most obvious effect of land exposure to the north of Australia has been
the re-current exchange of animals with New Guinea, but it is possible that such exposure
has been a major factor in maintaining the cohesion of the savannah fauna in the face of the
current dissected distribution of such habitats.
2.3.4 SPECIATION IN NOVEL ENVIRONMENTS: ORIGINS OF ARID ZONE SPECIES DIVERSITY
The centre of Australia has long been viewed as a sink. In the report of mammals collected
on the Horn Expedition Spencer wrote “Following extinction in the central area of the
greater part of its marsupial fauna, there ensued migration of such forms as could live in an
arid region…”(Spencer 1896; pg. 7). Theories regarding the adaptation of Australia’s fauna
to the arid zone usually invoke the idea of reinvasion and speciation from surrounding
habitats. Schodde (1999) unambiguously described the pattern of diversification within
Australian birds as grading “from rainforest source to desert sink” (pg. 314). On theoretical
51
grounds Greenslade (1982) demonstrated that under a modified r-K selection model,
diversification of species once they had adapted to the arid zone was unlikely due to
prevailing selection regimes, and concluded that the source of the arid zone biota was likely
to be the semi-arid zone to the north, a pattern cited by Ride (1970) in regards to the
macropod genera Onychogalea and Lagorchestes.
Christophel and Greenwood (1989) provide a more inspiring appraisal of Australia’s drier
habitats by describing rainforests as being “surrounded by a sea of evolutionary novelty”
(pg. 107) in recognition of the fact that loss of forests was not simply a process of attrition.
Archer and Fox (1984) also suggested that central Australian taxa had gained the
“opportunity to undergo rapid and divergent evolution” (pg. 14). This was certainly true for
plants. Despite the impression of Australia as an entirely green continent for the bulk of the
Tertiary, xeromorphic plants may have been present in Australia since early in the period
due to generally poor soils and locally drier conditions (Smith-White 1982, Truswell and
Harris 1982). The expansion of aridity resulted in further adaptation of these xeric plants,
and eventually the evolution of new desert genera, and a suite of new habitats (Truswell
and Harris 1982). Endemic xeromorphic plants are now one of three major components of
Australia’s flora, and deserts are dominated by such species (Keast 1981). The fauna
reacted to aridity in similar fashion. The displacement of arboreal taxa from central
Australia represents the end of a long period of forest mammals (Archer et al. 1999).
However, they were replaced by animals more suited to open spaces such as grazing
kangaroos, which underwent a large radiation in the Pliocene as grasses and woodland
became commonplace (Cooke and Kear 1999). Hope (1982) identified the greater part of
the Pliocene, between around 4Ma and the beginning of the Pleistocene as the key period in
the evolution of Australia’s modern fauna. However, the general impression of the
evolution of Australia’s fauna is one centred on forests and rainforests, and that, as Smith-
White (1982) stated in summarising contributions to a volume on evolution of arid zone
species “deserts themselves have rarely been centres of evolutionary episodes of
speciation” (pg. 378). Most of Australia is therefore viewed as a sink consisting of arid
habitat of recent origin, and unlikely to be a venue for speciation. Baverstock (1982)
extended this general model of Australian biotic evolution to include the rodents, citing the
52
closely related Pseudomys delicatulus, P. novaehollandiae and arid zone P.
hermannsburgensis as an example of rodent invasion of the arid zone. However,
Baverstock (1982) acknowledged that the diversification of arid-adapted Notomys was
possibly centred on the arid zone.
The notion that animals disappeared from central Australia, were restricted to near-coastal
habitats, and then re-invaded the centre, in some ways does not correspond well to the
actual development of the modern arid zone. The loss of forest was a gradual process, and
large treed areas persisted in inland Australia long after the bulk of forest had retracted
south-eastward (Truswell and Harris 1982, Christophel and Greenwood 1989, Benbow et
al. 1995), just as aquatic crocodiles and flamingos persisted in central Australia well into
the Pleistocene due to significant run-off from the eastern highlands (Tedford and Wells
1990). Patches of remnant vegetation still persist in moist havens of the central ranges,
containing species with extremely restricted distributions and affinities to species or
populations found in coastal regions (Morton et al. 1996). Koalas still occur along riparian
strips of red-gum forest surrounded by completely unsuitable environments in southwest
Queensland (Martin and Handasyde 1995). The semi-arid zone and savannahs are also not
just bands of habitat that surround the margins of the contemporary arid zone, they
resemble the habitats that preceded arid conditions in central Australia (section 2.3.1). If
the semi-arid zone or savannahs are likely sources of arid zone species, it is a far simpler
model to invoke in situ adaptation to increasing aridity than extinction followed by re-
invasion of habitats that were formerly occupied. This model of faunal evolution would
produce the same pattern of mesic-arid sib-taxa as would re-invasion, and is therefore
untestable, but seems a more plausible hypothesis for the origin of at least some arid zone
species.
Arid zone species presumably have an origin relating to the development of the arid zone.
Yet development of true desert is a very recent phenomenon, probably beginning in earnest
around 1Ma (Bowler 1976) and not completed until the final arid phase of the Pleistocene
22-16ka years ago (Bowler 1982, Krieg et al. 1990, Clarke 1994, Hesse 1994, Zheng et al.
1998, Pell et al. 2000). 700ky is a particularly short time scale on which to contemplate
53

macroevolutionary patterns, and is considered by some authors too brief to reasonably
permit speciation events (Avise et al. 1998, Knowles 2001). In fact Smith-White (1982)
and Nix (1982) regard the Pleistocene in Australia as a time of range reduction and
movement, but not diversification. Avise (1998) concluded that the Pleistocene may have
initiated processes that will result in speciation, but time periods of two million years are
generally required to produce species. In north-eastern Australia the contraction of
rainforests to high altitude refugia during the Pleistocene has been proposed as a
mechanism of sib-taxon divergence, but Moritz et al. (2000) have applied molecular clocks
to show divergence of some taxa occurred up to seven million years ago, despite clear
mechanisms for divergence during the Pleistocene. The evolution of conilurine diversity in
the arid zone is therefore of interest due to the unusual rapidity with which it must have
occurred, particularly within Notomys, and because the arid zone rodent fauna is
significantly more species rich than that in forests, which are the proposed sources of avian
and marsupial arid zone diversity.
Mesic enigma
The lack of conilurine rodents in forest habitats is the greatest enigma of the group’s
evolution, particularly given their probable Mio/Pliocene New Guinean rainforest heritage.
Conilurus albipes was once found in woodlands of the southeast, but it is only Pseudomys
species that frequent forests. There are only five species of Pseudomys that may be found in
forest environments in the southeast, and of these, only P. fumeus, P. higginsi and P. oralis
are true forest taxa (Stoddart and Challis 1993, Smith and Quin 1996a, Ford et al. 2003).
Pseudomys gracilicaudatus and P. novaehollandiae are species that frequent heaths that
may be found as a sub-stratum in forests (Kemper 1990, Luo and Fox 1996, Wilson and
Bradtke 1999), and P. fumeus is usually dependent on a heathy understorey (Ford et al.
2003). None of these species are now sympatric in forests, and all occur at low density
(Watts and Aslin 1981). The lack of conilurines in forest habitats has been speculatively
attributed to competition from marsupials (Lee et al. 1981), but typical rodent niches are
not, and have not been, occupied by marsupial species (Archer et al. 1999). Possums might
compete with omnivorous tree rats for food and nesting hollows, but species of both are
54

sympatric in the north. In general, rodent-sized marsupials are insectivores, while
conilurine rodents tend to be omnivorous, with a tendency towards granivory and herbivory
(Watts 1977, Murray et al. 1999). The distinctive dentition of rodents allows exploitation of
gnawing niches unavailable to most other groups (Watts and Aslin 1981). A simpler
explanation for the lack of forest conilurines lies in a chance ancestral radiation in savannah
environments that established a fundamental preference for drier environments. Flannery
(1989) proposed a similar scenario whereby Australian rodents were derived from dry
South-east Asian habitats. However that does not account for clear systematic relationships
with New Guinean rodents (Watts and Baverstock 1994a, Watts and Baverstock 1994b).
The general absence of conilurines from forests will probably remain a matter for
speculation.
55
Chapter 3. Materials and Methods
METHODS SUMMARY
It is difficult to unravel processes of speciation that probably pre-date the modern
distributions of species by a million years or more. A simple approach was adopted in this
thesis, the generation or review of multiple lines of corroborative evidence derived from
palaeoecology, ecology, ecological biogeography, taxonomy, and molecular phylogenetics.
This approach was used to allow objective evaluation of the accuracy of hypotheses based
on molecular methods and associated analyses. Any method of evolutionary reconstruction
or interpretation of molecular data can reasonably be questioned (Zharkikh and Li 1992,
Wakeley 1996, Farris et al. 2001, Knowles and Madison 2002), and I felt that over-
analysing data in an attempt to achieve apparent statistical rigour could be counter-
productive. Molecular phylogenetic trees form the basis for understanding the relationships
between species and populations. These trees were produced using standard methods of
Kimura two-parameter distance and maximum-likelihood analyses. Bootstrap testing,
topology tests and saturation tests provided evaluations of the internal support for
molecular trees. Nested clade analysis was performed as a supplementary method of
examining molecular sequence data. Sampling was not designed with this process in mind,
and samples sizes were often too small for successful use of the method. Ecological
analyses attempted to characterise the distributions of species and critical limiting factors
determining those distributions. This involved bioclimatic distribution modelling for
several species, and in the case of pebble-mound mice, detailed ecological studies that will
be reported elsewhere.
56

3.1 Molecular methods
3.1.1 SAMPLING AND EXTRACTION OF DNA
Entire cellular DNA was obtained from field-collected biopsies, samples provided by other
researchers, and museum collections. Field biopsies were tail-tip or ear punches
immediately preserved in 100% ethanol after collection. The source and nature of all
samples involved in a particular study is noted in the relevant sections of chapters 4-8.
DNA was extracted using phenol:chloroform extractions modified from Hoelzel (1992).
Tissue samples were minced and placed in 300µl of lysis buffer (40mM Tris ph 8.0, 2mM
EDTA, 0.2 NaCl, 1% SDS) and 1µl Proteinase K (20mg/ml) then incubated for several
hours at 55°C. Two digestions were performed with 300µl phenol:chloroform:IAA,
followed by a single digestion with chloroform:IAA. DNA was precipitated overnight at
4°C in 2.5 volume of 100% ethanol and 0.1 volume 3M NaAC, then centrifuged to pellet
the DNA at 10,000rpm for 10 minutes. The pellet was washed in 800µl 70% ethanol and
stored in nuclease-free water at 4°C for immediate use, or -20°C for longer-term use.
3.1.2 AMPLIFICATION AND SEQUENCING OF DNA
Mitochondrial control region
Approximately 400bp of mitochondrial DNA was amplified from the 5’ end of the control
region, between the tRNA Proline and central conserved domain (block CSB-D (Southern
et al. 1988)). Primers used were MT 15996L (Campbell et al. 1995) and MT16502H (M.
Elphinstone, pers. comm.). The amplified segment includes a hyper-variable region that
had been successfully employed in studies of Australian rodents by Campbell et al. (1995)
and Jerry et al. (1998). Amplification reactions were run on an MJ Research PTC 200
Peltier thermal cycler. PCR reaction volumes were; 1µl of DNA template from a 1:10
dilution of DNA derived from phenol:chloroform extractions, 2µl of MgCL2 (25mM), 2µl
of Qiagen PCR buffer solution, 0.1µl (5 units) QIAGEN Taq DNA polymerase, 0.5µl of
each primer (10pm/µl), 0.4µl dNTP, and 13.5µl of nuclease-free water. Cycling conditions
57

were 94oC for 1min, 30 cycles of (94oC for 10sec, 55oC for 10sec, 75oC for 1min) followed
by 75oC for five minutes.
Nuclear copies of mitochondrial DNA
Nuclear copies of the control region were identified from eight Pseudomys species. I
designed the primers FFMTH1 (5’-GTTTTATGGGCCCGGAGCG) and FFMTH2 (5’-
TGGTGGGCGGGTTGTTG) based on alignment of true Pseudomys control region
sequence to prohibit amplification of the nuclear copy identified from pebble-mound mice
(section 5.3.1). Only results from the longer strand amplified by FFMTH1 are reported, and
this primer was located 15bp internally from the heavy strand primer MT16502H. The
primers NCMTH1 (5’- TCCCAA(G/T)TT(G/T)AATGTTCCCGGAGCA) and NCMTH2
(5’- AGTTTCACAGAAGATGGTAGAAG) were designed from sequence of nuclear copy
obtained from P. calabyi and P. patrius and specifically amplified the nuclear copy of the
control region that was excluded by FFMTH1 and FFMTH2.
Purification of control region PCR product
PCR products were purified by isopropanol precipitation (Hoelzel 1992). PCR reactions
were combined with 120µl 70% isopropanol and left at room temperature for 15 minutes
before pelleting the PCR product by centrifuging at 11,000rpm for 20 minutes. After
removal of the supernatant, the pellet was washed in 500µl of 70% isopropanol and re-spun
at 11, 000rpm for 13 minutes. After drying, the pellet was re-suspended in 20µl of nuclease
free water.
Nuclear introns
Sixty intron primer pairs designed by Lyons et al. (1997) were screened on DNA derived
from Pseudomys patrius. To allow twenty primer-pairs to be screened simultaneously,
semi-optimal touchdown cycling protocols and reaction conditions were designed based on
optimal conditions provided by Martin Elphinstone (Southern Cross University). ACTC,
58

ARAF1, CHAT, COL3A1, DHFR and MYH2 produced PCR product, and were then
screened under optimal conditions on DNA from P. delicatulus, P. hermannsburgensis, P.
laborifex, P. patrius and Zyzomys argurus. ARAF, CHAT and COL3A1 produced
extremely variable patterns of multiple banding between species and genera. ACTC,
DHFR1 and MYH2 produced a single band of similar size in all species, and the products
were sequenced to assess variability of each marker. For those loci where results are
reported in this thesis reaction volumes and cycling conditions for PCR were:
Dihydrofolate reductase (DHFR) intron 1; reaction volumes as for control region; cycling
conditions 94oC for 1min, 30 cycles of (94oC for 15sec, 57oC for 20sec, 75oC for 1min)
followed by 75oC for five minutes.
A-raf (ARAF) intron 1; reaction volumes as for control region, except for 1µl of MgCL2
(25mM) and 14.5µl of nuclease-free water; cycling conditions 94oC for 1min, 30 cycles of
(94oC for 15sec, 51oC for 20sec, 75oC for 1min) followed by 75oC for five minutes.
Further PCR of ACTC, DHFR1 and MYH2 identified multiple bands that were absent from
P. patrius or superimposed on the original check gels. Intron PCR products of ARAF,
ACTC, CHAT DHFR1, and MYH2 were therefore run on 1.5% agarose 1x TAE gels at
80v to separate bands. PCR bands were excised and cleaned using a commercial QIAquik
gel extraction kit. Identification of the correct intron sequence was attempted by alignment
against sequences of the intron downloaded from Genbank and by BLAST searches of
Genbank. For most PCR products BLAST searches resulted in ambiguous results where
gene segments from other chromosomal locations or loci were amplified, possibly due to
transposable elements. Pure exon sequences were also commonly amplified. In cases where
intron sequence was identified, that band was used as a standard to aid subsequent PCR
cleanups.
Sequencing of control region and intron PCR product
Approximately 400ng of purified PCR product was prepared for sequencing using
commercial BigDye Terminator sequence preparation kits. Sequencing reactions were
59

purified by ethanol precipitation (Crouse and Amorese 1989). The reaction mix was added
to 2µl 3M NaAC, 47.5µl 100% ethanol and 2.5µl 100% isopropanol, vortexed, and left on
ice for fifteen minutes. Reactions were centrifuged at 11,000rpm for 20 minutes, rinsed
with 500µl 70% ethanol, and re-spun at 11,000rpm for 15 minutes, then dried. Samples
were forwarded to Griffith University Molecular Biology Facility where they were read on
an Applied Biosystems 377 DNA Sequencing System.
3.1.3 ANALYSIS OF SEQUENCE DATA
Sequence editing
Electropherograms of DNA sequence were examined and edited individually before
preliminary alignment in Se-Al v2.0a11(Rambaut 2002). Visual alignment of sequences
was straightforward between related taxa. Aligned sequences were exported to PAUP*
4.0b10 (Swofford 1998) and a distance tree was produced using a neighbour-joining
algorithm based on a Kimura two-parameter distance matrix. Groups of taxa with similar
sequence identified by distance analysis were then aligned in Se-Al. Electropherograms of
each taxon were examined in the context of the aligned sequence of the most similar taxa,
and, where available, the complimentary sequence of the same taxon.
Ambiguities in sequences were resolved where the following criteria were met:
- all taxa with similar sequence shared the same unambiguous base, as did members
of at least three other related groups identified by distance analysis, and that base
was evident in the ambiguous electropherogram signal of the taxon in question, or
- the reverse sequence of the taxon in question had a resolved base at that site, and
that base matched all other members of the closely related taxa
Ambiguities were recorded where:
- forward and reverse sequences differed in a resolved base at a given site (unless that
site was conserved across all sequenced Australian rodent taxa)
60

- forward (and reverse sequences if available) showed ambiguous electropherogram
signals at a given site that differed from the base evident in related taxa at that site.
All sequences were then re-aligned in Se-Al. Intron data sets were readily aligned without
the aid of automatic alignment, however, control region sequences were first aligned using
Clustal X (Thompson et al. 1994), and then imported into Se-Al for final alignment.
Aligned sequences were tested for substitution saturation using the index of Xia et al.
(2003) in the program DAMBE (Xia 2000, Xia and Xie 2001).
Tree building
Aligned sequences were exported to PAUP* for analysis. Distance trees formed by
neighbour-joining of Kimura two-parameter matrices (Kimura 1980) and maximum-
likelihood trees (Felsenstein 1981) were the primary basis for analysis. Maximum-
likelihood tree topologies were initially found using an exhaustive search and mutational
parameters of sequence data determined by Modeltest v3.04 (Posada and Crandall 1998).
Bootstrapping of distance and likelihood trees was based on 100 replicates using a full
heuristic search algorithm. In some instances there was justification for further analysis.
Bootstrapped parsimony trees were run with gaps treated as a fifth base to account for
indels. Some further manipulation of sequence alignments was undertaken to examine
specific questions, as detailed in relevant chapters. Maximum-likelihood tree topologies
were compared under varying topological constraints in PAUP* using two-tailed Kishino-
Hasegawa tests (Kishino and Hasegawa 1989) employing a RELL distribution and 1000
bootstrap replicates.
Nested clade analysis
The program TCS 1.13 (Clement et al. 2000) was used to create nested clades from
sequence alignment files. Nested clade files based on TCS clades were written according
the protocol detailed in the program documentation for GeoDis v2.0 (Posada 2000), and
were analysed using that program. Decimal latitude and longitude were used, and outgroup
61

probabilities were not defined. Details of taxa subjected to this analysis are provided in
chapters 5, 6 and 7.
Molecular clocks
Some readers will consider the fact that I have not applied a molecular clock to my data a
glaring omission. It was not, there is; 1) no way of calibrating a molecular clock for the
control region of conilurine rodents, which is a very specific case of molecular evolution
that cannot rely on any other mutational rate calculation (Larizza et al. 2002) and 2) dating
the divergence of haplotypes will not resolve the date of important cladogenic events,
particularly in the late Pleistocene, because the coalescence of haplotypes will predate
events such as range fragmentation by a considerable margin. This is because divergence of
haplotypes within clades is not generally related to the cladogenic event (see for example
section 5.4.3), moreover, the dynamics of mtDNA evolution suggest that mtDNA
molecular clocks may not be applicable to relatively recent events (Hoelzer et al. 1998).
3.2 Ecological methods
3.2.1 ECOLOGY OF PEBBLE-MOUND MICE
Outcomes of behavioural and ecological studies of pebble-mound mice are briefly reported
in chapter 5. These studies incorporated almost 80 000 trap nights and covered the region
between southeast Queensland and the Kimberley. Radiotelemetry and observational
studies were also conducted. The aims of ecological studies were to establish the
importance and function of pebble mounds, determine habitat preference and distribution of
pebble-mound mice at local, regional and continental scales, and to describe the population
dynamics, vagility and breeding behaviour of P. patrius.
62

3.2.2 BIOCLIM DISTRIBUTION MODELLING
Bioclimatic modelling of the distribution of selected clades was undertaken to investigate
the relationship between potential climatic tolerances of a species and the realised
distribution of species. This was of particular interest in the pebble-mound mice, as a
central premise of this thesis is that the distribution of pebble-mound mice is constrained by
both topographic and climatic factors, whereas delicate mice are not particularly
constrained by topography. Models were run by Emily Bolitho, JCU, using 14 climatic
layers (table 3.1) in BIOCLIM (Nix 1986). Only 14 climatic layers were used due to the
continental scale of questions being addressed, and the relatively few locations used in
modelling. Although an extensive location database was available for delicate mice and
some other species, it was decided to only use those locations from which mice had been
sequenced due to differences between reported identification of specimens and their
molecular identity. The limited locations from which pebble-mound mice were sequenced
often represented the known distribution of the species involved. A nine-second digital
elevation model (AUSLIG 1997) was used in modelling climatic profiles.
The small number of geographical locations meant that distribution modelling performed
here is generally a conservative estimate of the potential distribution of most clades.
However, both genetic analysis and BIOCLIM are best performed on a representative
sampling of a species distribution. Thus, by attempting to sample the entire geographical
range of most species, a reasonable sampling of that species climatic envelope was
achieved. This was particularly so in the relatively flat landscapes of northern Australia
where topography is a less important influence on climatic shape than in the southeast,
where only one species was modelled (P. novaehollandiae) based on the majority of known
locations for the species.
63

Table 3.1. Climatic layers used for distribution modelling in BIOCLIM.
Layer Description Annual mean temperature Mean weekly temperature Isothermality Mean diurnal temperature range/annual temperature
range Temperature seasonality Standard deviation of mean weekly temperature Max temp of warmest period Min temp of coolest period Temperature annual range Annual precipitation Precipitation seasonality Standard deviation of weekly precipitation Precipitation of wettest quarter Precipitation of driest quarter Precipitation of warmest quarter Precipitation of coldest quarter Annual mean radiation Mean weakly radiation Radiation seasonality Standard deviation of weekly radiation
64

Chapter 4. Species-level phylogeny of Australian rodents
CHAPTER SUMMARY
Results are presented here from two genetic loci in an attempt to reconcile differences
among previous phylogenetic studies of conilurine rodents. The majority of Australian
rodent species were sequenced, and all but one extant conilurine rodent were involved in
the studies. Most relationships supported by mitochondrial control region and the nuclear
DHFR intron 1 locus agree with a synthesis of previous results. Marginal support for
monophyly of the conilurine rodents was found, but repeated patterns of radiation within
Australasian and Australian rodents makes resolution of generic and sub-tribal relationships
difficult. It is concluded that conilurines are probably monophyletic, and should be
considered so until proof against their monophyly is forthcoming. Support was found for
the monophyly of all conilurine genera except Pseudomys, which included Mastacomys,
and was not clearly separated from Notomys in any analysis. The genera Mastacomys and
Notomys are retained, and at least three further genera are recognised within the Pseudomys
group in order to reconcile the recognition of Mastacomys and Notomys with the remaining
diversity of the current genus Pseudomys. Support was not found for some unusual results
from past studies, including the placement of Leporillus within Pseudomys, or the basal
placement of Leggadina within the Hydromyini.
4.1 Chapter background and aims
A robust phylogeny can provide a cornerstone for evolutionary studies. Unfortunately the
phylogeny of Australian rodents is poorly known (section 2.1.3). To fully resolve the
relationships of Australian rodents it would be necessary to investigate large numbers of
species from New Guinea in addition to those occurring in Australia (Donnellan 1989,
Watts and Baverstock 1994a, Watts and Baverstock 1994b, Menzies 1996, Torrance 1997).
However, conilurine rodents are the focus of this thesis, and it is possible to concentrate on
this group in an exclusively Australian context. This chapter attempted to reconcile results
65

from previous phylogenetic studies of Australian species, including water rats, mosaic-
tailed rats and conilurines, and adds two new phylogenies derived from DNA sequencing of
the mitochondrial control region and a nuclear intron. An ideal outcome of these studies
would have been a fully resolved species phylogeny. However, the realities of systematic
studies are generally far from ideal and studies in this chapter had three major aims:
1) Identify closely related species groups suitable for studies of speciation
2) Determine whether conilurine rodents are monophyletic to the exclusion of mosaic-
tailed rats
3) Examine the integrity of the genus Pseudomys and, if appropriate, recommend intra-
or inter-generic divisions that are consistent with the biological and molecular
diversity of species within the genus, and the taxonomic status of equivalent
conilurine groups
4.2 Tissue samples, sequencing and analysis
Tissue was obtained from all extant species of conilurine rodent recognised by Mackenzie
and Burbidge (2002) except Notomys aquilo (table 4.1). Museum samples provided by the
Australian Biological Tissue Collection of the South Australian Museum formed the bulk
of species for this study. Field biopsies were also collected for many species. Where
multiple tissue samples were held for a single species they were used to test the consistency
of sequence obtained from different geographical locations. Few major discrepancies were
found between different tissue samples, and where these were identified, they were the
product of miss-labelled tissues or miss-identified museum vouchers. A single sequence
was therefore used to represent each species in the final analysis. The tissue from the
closest sampled location to the type locality of each species was chosen to ensure the
correct identity of species included in the phylogeny. Liver samples where preferentially
used to minimise the risk of incorrect sequences due to amplification of nuclear copies of
mitochondrial DNA (e.g. sections 5.3.1 and 8.3.1). Sequences included in analysis of the
control region in this chapter do not exhibit characteristics that identified the presence of
nuclear copies in some species (chapters 5 and 8).
66

Relationships within Pseudomys are a focus of this chapter and were re-examined
independently of broader conilurine species phylogenies (section 4.4.3). Control region
data were re-analysed to better evaluate relationships within Pseudomys. To reduce
possible ambiguities in alignment only Notomys mitchelli, Mastacomys fuscus and those
species currently assigned to Pseudomys were included in analysis. To minimise the
possible effect of site saturation 99 haplotype sequences from nine species of delicate mice
and pebble-mound mice were aligned. Any sites that exhibited intraspecific variation
involving bases present at that site in related species were recorded as ambiguities. A
consensus sequence for each species of pebble-mound mouse and delicate mouse was then
aligned against the Pseudomys data set. Invariable sites were excluded from analysis. Sites
that were variable within more than one species of delicate mouse or pebble-mound mouse
were excluded, unless highly conserved among other species. Sites that exhibited high
levels of variation that did not correspond to known phylogenetic patterns were also
excluded. For example, at a site where “A” was present in most species, if a “G” was
present in comparatively unrelated species such as P. higginsi, P. desertor, P. chapmani
and N. mitchelli.
67

Table 4.1. Tissue type and source. Extant: Extinct. Details of samples used in species trees given first, comparative samples second (see text). All conilurine species recognised by Mackenzie and Burbidge (2002) are shown. ABTC- Australian biological tissue bank; GB- Genbank; NTMU- Northern Territory Museum; SAMAM- South Australian Museum; SCU- Southern Cross University; WAMM- Western Australian Museum Species Site Type Source/voucher conilurines Conilurus albipes Conilurus penicillatus Mitchell Plat., WA, (Kakadu) Liver, (ear) (ABTC) WAMM 21963, Field biopsy Leggadina forresti Unknown, (Various) Liver, (gDNA) (ABTC) WAMM 17031, SCU Leggadina lakedownensis Mitchell Plateau, WA (various) Liver, (gDNA) GB AF084248 Field biopsy (A. Kutt), SCU Leporillus apicalis Leporillus conditor Franklin Island, SA Liver ABTC 13331 Mastacomys fuscus Kosciuszko NP, NSW Liver (ABTC) SAMAM 10928 Mesembriomys gouldii Mitchell Plat., WA, (Mareeba) Liver, (ear) (ABTC) WAMM 21995, Field biopsy
(Ford) Mesembriomys macrurus Mitchell Plateau, WA Liver (ABTC) Notomys alexis Curtin Springs, NT Liver (ABTC) SAMAM 17468 Notomys amplus Notomys aquilo Notomys cervinus Sandringham Station, QLD Liver (ABTC) SAMAM 16886 Notomys fuscus Unknown Liver (ABTC) SAMAM 17508 Notomys longicaudatus Notomys macrotis Notomys mitchelli Konettra Downs, SA Liver (ABTC) SAMAM 18497 Notomys mordax Notomys sp. Pseudomys albocinereus Wanneroo, WA Liver (ABTC) WAMM 18856 Pseudomys apodemoides Lucindadale, SA Liver (ABTC) SAMAM 19345 Pseudomys australis Giddi Giddina ck., SA Liver (ABTC) SAMAM 17428 Pseudomys bolami Whyalla, SA Liver (ABTC) SAMAM 18279 Pseudomys calabyi Kakadu, NT, (Litchfield NP) Ear, (Liver) Field biopsy (M. Watson) Pseudomys chapmani Woodstock, WA, (Various) Liver WAMM 29440, (See ch.5) Pseudomys delicatulus Patonga, NT, (Various) Liver, (Various) ABTC 8034, (See ch.6) Pseudomys desertor Alice Springs, NT, (Various) Liver, (Various) ABTC 8143, (See ch.7) Pseudomys fieldi Shark Bay, WA Liver ABTC 8093 Pseudomys fumeus Yarrangobilly, NSW, (Various) Ear, (Ear, Tails) Field biop. (Ford), (Field biops. Ford/Banks) Pseudomys glaucus Pseudomys gouldii Pseudomys gracilicaudatus Blackbraes NP, QLD, (Various) Liver, (Various) Biopsy (Ford/P. Williams), (See ch.7) Pseudomys hermannsburgensis Curtin Springs, NT, (Various) Ear, (Various) SAMAM 12570, (See ch.6) Pseudomys higginsi Captive Bred Liver ABTC 8139 Pseudomys johnsoni Kurundi Station, NT, (Various) Tail, (Various) Field biop.(Ford), (See ch.5) Pseudomys laborifex Mitchell Plat., WA, (Various) Liver, (Various) WAMM 21764, (See ch.5) Pseudomys nanus Mitchell Plat., WA, (Various) Liver, (Various) (ABTC) WAMM 21625, (See ch.7) Pseudomys novaehollandiae Anglesea, VIC, (Various) Ear, (Various) Field biopsy (B. Wilson), (See ch.6) Pseudomys occidentalis Berdering, WA (Berdering) Liver ABTC 8042, (ABTC) Pseudomys oralis Carai, NSW, (Billilimbra) Liver Biopsy (SCU), (Biopsy SCU) Pseudomys patrius Hidden Valley, QLD Liver Biopsy (Ford) Pseudomys pilligaensis Pilliga, NSW, (Binnaway) Liver ABTC 18120, (Field biopsies H. Tokushima) Pseudomys shortridgei Unknown Liver ABTC 8145 Pseudomys sp. Zyzomys argurus Pellew Is., NT, (Various) Liver, (Various) (ABTC) NTMU 1423, (See ch. 7) Zyzomys maini Nourlangie Rck, NT, (Various) Liver, (Various) (ABTC) 7899, (ABTC, Field Biop. Watson) Zyzomys palatalis Woologorang, NT (via TWP) Ear Biopsy (Ford) Zyzomys pedunculatus MacDonnell R., NT Ear ABTC 65820 Zyzomys woodwardi
Mitchell Plateau, WA Liver (ABTC) WAMM 21550
“New Guinean” hydromyines Melomys burtoni Hidden Valley, QLD Tail Field biopsy (Ford) Melomys cervinipes Paluma, QLD Tail Field biopsy (Ford) Uromys caudimaculatus Paluma, QLD Tail Field biopsy (Ford) Uromys hadrourus Thornton Peak, QLD Sequence GB U17184 Xeromys myoides
Ramingining, NT Liver (ABTC) NTMU 4744
Murinae Rattus tunneyi Drysdale River, WA Tail Field biopsy (Ford)
68

4.3 Species phylogenies
4.3.1 MITOCHONDRIAL CONTROL REGION
Sequencing of the mitochondrial control region was primarily undertaken to allow
phylogeographic studies of closely related taxa (chapters 5-8). However, alignment of
control region sequences was relatively straightforward between divergent taxa such as
Uromys, Leggadina and Pseudomys. It might be expected that relationships at deeper
taxonomic levels would be unresolved due to substitution saturation at variable sites, and
the tree would therefore be useful for identifying closely related species and little else.
However, one of the major aims of this chapter is to identify sib-species and species
complexes suitable for biogeographic study, and the control region is an excellent marker
for that purpose. Approximately 360bp of control region sequence was unambiguously
amplified from at least one member of each Australian genus except Hydromys (appendix
i). Nearly all extant conilurines were sequenced. However, Notomys aquilo tissue was not
available, multiple nuclear copies of the mitochondrion confounded attempts to sequence
Pseudomys fumeus, and PCR of Zyzomys pedunculatus was unsuccessful due to
unidentified inhibitors. Alignment of hydromyine taxa against Rattus and Mus was
possible, but unreliable. Trees presented therefore include Xeromys myoides as an outgroup
to four species and two genera of the Australian mosaic-tailed rats and 36 conilurine
species, including 22 Pseudomys species.
Bootstrapped Kimura two-parameter distance and maximum-likelihood analyses were
performed as detailed in chapter 3. Analysis was performed on 362bp of aligned sequence,
with 111 variable sites, 79 of which were parsimony informative. Likelihood analysis was
based on the mutational model determined by Modeltest (GTR+I+G model: (A 0.3481; C
0.0661; G 0.2002; T 0.3856) Nst=6 Rmat=(A-C 1.2845; A-G 6.3413; A-T 1.3815; C-G
0.7802; C-T 3.7810; G-T 1.000) Rates=gamma Shape=0.7685). The distance tree (fig. 4.1;
minimum evolution score: 1.80196) and likelihood tree (fig. 4.2; likelihood score: -ln
3496.53342) both supported similar relationships between terminal taxa, but, as expected,
there was little support for relationships at deeper taxonomic levels, and the trees differed
69

markedly in their topologies. Enforcing the distance tree topology on the likelihood tree
resulted in a tree that was not significantly different to the best tree (-ln 3519.35212; K-H
test p= 0.084). In fact, the only re-arrangement of generic relationships that resulted in a
significantly worse supported tree topology for the maximum likelihood tree was the
exclusion of Mastacomys from Pseudomys (likelihood score: -ln 3542.7346; K-H test p<
0.000). Saturation tests (Xia et al. 2003) with assumed proportion of invariant sites set at 0,
0.3 and 0.6 indicated little effect of saturation between aligned sequences (p<0.000).
Despite the lack of rigorous support for tree topologies in constraint tests, strong bootstrap
support is provided for the monophyly of all genera except Pseudomys and Notomys (figs.
4.1 and 4.2). There is also support for the monophyly of a group containing the genera
Conilurus, Leporillus and Mesembriomys. The mosaic-tailed rat genera Melomys and
Uromys are monophyletic in the distance tree, but not in the likelihood tree. The five
species of pebble-mound mice (Pseudomys calabyi, P. chapmani, P. johnsoni, P. laborifex
and P. patrius) are a very strongly supported clade. Three species of Notomys (N. alexis
and N. fuscus and N. mitchelli) are strongly supported as a monophyletic group, but N.
cervinus does not group with them. Enforcing monophyly on Notomys barely changes
support for the likelihood tree (likelihood score: –ln 3498.78935; K-H test p= 0.742). Aside
from the pebble-mound mice, there are few well-supported groupings within Pseudomys.
The only other clade of more than two species to gain bootstrap support is the delicate
mice. Pseudomys delicatulus, P. novaehollandiae and P. pilligaensis are a monophyletic
group with 76% bootstrap support, and P. bolami and P. hermannsburgensis are united
with this clade in both trees, but have marginal bootstrap support (49% in distance
analysis). The sib-species P. albocinereus and P. apodemoides, P. higginsi and P. fieldi
and, P. nanus and P. gracilicaudatus, are all well supported.
70

NotmitNotale
NotfusNotcer
PseoccPsejoh
PselabPsecal
PsepatPsecha
PseausPseoraPsealbPseapo
PseshoPsedes
PsehigPsefie
MasfusPsenan
PsegracPsedel
PsenovPsepil
PsebolPseher
LeglakLegfor
ZyzmainZyzarg
ZyzpalZyzwood
LepconMesgou
MesmacConpen
MelcerMelbur
UrocauUrohad
0.01 substitutions/site
pebble-mound m
ice
delicate mice
56 77
64
93
100
55
98
80
73 98
76
99
83
97
52
69
100
1
100
96
Figure 4.1. Mitochondrial coTree produced by neighbour-joiniXeromys myoides. Node labels= b
XeromysXermyo
ntrol region sequence divergence among Australian rodents. ng of Kimura two-parameter distance matrix of 362bp sequences. Outgroup ootstrap support (>50%) based on 100 replicates.
71

NotmitNotale
NotfusLeglak
LegforZyzmain
ZyzargZyzpal
ZyzwoodPsedel
PsepilPsenov
PsebolPseher
MelcerMelbur
LepconMesgou
MesmacConpen
UrocauUrohad
PseshoPsedes
PseausPsealb
PseapoPseora
MasfusPsehig
PsefiePseocc
PsenanPsegrac
NotcerPsejoh
PselabPsecal
PsechaPsepat
s0.05 subs
pebble-mound m
ice
delicate mice
76
78
90
61
62
75
52
77
94
61
100
85
92
61
98
91
52 65
Figure 4.2. Maximum-likMaximum-likelihood tree baseXeromys myoides. Node labels
XeromyXermyo
titutions/siteelihood tree of Australian rodent control region sequence. d on parameters derived from Modeltest for 362bp of sequence. Outgroup = bootstrap support (>50%) based on 100 replicates.
72

4.3.2 DHFR INTRON 1
Screening of introns (section 3.1.3) identified the Dihydrofolate reductase (DHFR) intron 1
as a marker that seemed to be evolving at a rate appropriate for resolving generic and sub-
generic relationships among Australian rodents. Heterozygosity at the locus was not a
problem for sequence interpretation, as homozygotes appear to differ by only a few bases
(see chapters 5 and 6). Sequences of 398bp were readily aligned among Australian Old
Endemic rodents, and aligned less comfortably against Rattus tunneyi sequence (appendix
i). Alignment against an incomplete Mus musculus sequence downloaded from Genbank
was possible, but the Mus sequence was obviously more divergent from Australian rodents
than was Rattus. As with the control region, several taxa proved problematic to sequence.
Notomys cervinus was a taxon of particular interest due to its alliance with Pseudomys
occidentalis in control region phylogenies. However, repeated attempts to sequence the
species yielded what was interpreted to be a transposable element, but not DHFR intron
sequence. Zyzomys pedunculatus and Z. palatalis also yielded short products that were not
DHFR intron sequence. Pseudomys australis did not produce PCR product, despite
multiple attempts and two re-extractions of gDNA. Xeromys myoides yielded only 350bp of
clean sequence. However, the final 40bp of the DHFR sequence was highly conserved
across the mosaic-tailed rats and tree-rats, allowing an estimation of Xeromys sequence to
be used in alignment that contained only a single ambiguous site. Likewise P.
gracilicaudatus did not produce clean product after bp 345, however, clean sequence from
the very closely related P. nanus and the relatively conserved nature of the final portion of
sequence allowed a probable sequence to be inserted. The causes of these problems were
not clear, but given an abundance of transposable elements and multiple banding patterns
produced by PCR, results for the DHFR intron require further investigation before
publication and should be interpreted as preliminary results only.
Despite these problems, the Kimura two-parameter distance tree and maximum-likelihood
tree based on DHFR intron 1 sequences are highly concordant with those based on the
control region, differing in the fact that they tend to better support relationships at deeper
levels of the phylogeny due to a slower rate of mutation. Sequences differed from the
73

control region in that only 129 sites (of 398) were variable among Australian rodents and
Rattus tunneyi, and only 49 of those were parsimony-informative due to a long branch-
length to Rattus. No effect of saturation is evident in sequences (p<0.000). Trees were
rooted on Rattus tunneyi, and the use of Xeromys myoides as an outgroup to the conilurines
and mosaic-tailed rats in control region analysis was supported by both the distance tree
(fig. 4.3; minimum evolution score: 0.44631) and maximum-likelihood tree (fig. 4.4;
likelihood score: –ln 1580.77449; substitution model: TrN+I (A 0.2146; C 0.2947; G
0.2821; T 0.2086) Nst=6 Rmat=(A-C 1.0000; A-G 3.0258; A-T 1.0000; C-G 1.0000; C-T
3.5696; G-T 1.0000) Rates=equal). Topologies of the two trees were very similar, the
major differences being the lack of structure within the genus Pseudomys in the maximum-
likelihood tree, and the separation of conilurines from mosaic-tailed rats in the maximum-
likelihood tree.
The monophyly of Notomys, Mastacomys and Pseudomys was suggested by control region
distance trees (but not statistically supported), and gained strong bootstrap support in both
DHFR intron 1 trees. Bootstrapping of the distance tree, but not the maximum-likelihood
tree, supported monophyly of a clade containing the genera Conilurus, Leporillus and
Mesembriomys. Mesembriomys and Conilurus were allied in both trees, but this
relationship was only given bootstrap support in the distance tree. The mosaic-tailed rats
were strongly supported as a monophyletic clade in both trees. Three Notomys species
produced identical DHFR sequences and form a clade with P. occidentalis within
Pseudomys. The two species of Zyzomys included in the tree formed a monophyletic clade,
and there was moderate bootstrap support for a sib-taxon relationship to the Notomys-
Pseudomys group. Pseudomys was the only genus not supported as a monophyletic clade,
and members of Pseudomys formed a polytomy with the genera Mastacomys and Notomys.
Species groups within Pseudomys supported by control region analysis were also present in
DHFR intron 1 trees. The delicate mice, pebble-mound mice, P. albocinereus and P.
apodemoides, P. fieldi and higginsi, P. nanus and P. gracilicaudatus, P. desertor and P.
shortridgei all form groups in trees, and most had moderately strong bootstrap support.
Pseudomys fieldi and higginsi were supported at 49% in bootstrapping of the distance tree.
74

Pseudomys fumeus was not included in control region trees but is supported at 77% as a
sib-taxon to P. albocinereus and P. apodemoides.
Several indels in DHFR intron 1 sequences appeared to be phylogenetically informative.
Parsimony analysis was performed to account for sequence gaps by treating them as a “fifth
state”. A bootstrapped parsimony tree yielded a similar result to maximum likelihood, but
tended to better support some relationships (tree length: 191; CI: 0.7853, CI excluding
uninformative characters: 0.5638). Pseudomys fieldi and P. higginsi were allied (62%) and
Pseudomys oralis was allied with P. desertor/shortridgei (65%). The undoubted sib-taxa P.
gracilicaudatus and P. nanus that were not supported by maximum-likelihood
bootstrapping were supported as a monophyletic lineage (92%). However parsimony also
allied Mastacomys fuscus with the delicate mice (82%), and Xeromys myoides with Uromys
caudimaculatus to the exclusion of Melomys on the basis of partially overlapping
(analogous) deletions. Stronger support was generally indicated by parsimony analysis for
relationships supported by maximum-likelihood, notably the delicate mice, which share
two unique (homologous) deletions when compared to other conilurines and were
supported as a monophyletic group at 95%. The parsimony tree is not presented as its
topology is identical to the likelihood tree.
Specific tests of tree topology were conducted on the maximum-likelihood tree to examine
past results regarding the placement of some taxa. A tree in which Leggadina was basal to
the water rats, mosaic-tailed rats and conilurines was not significantly less supported than
the best tree found (likelihood score: -ln 1584.4326; K-H test p= 0.598). A tree that
included Leporillus conditor within Pseudomys was obviously less well supported
(likelihood score – ln 1609.2554), but this difference was marginally non-significant in a
Kinisharo-Hasigawa test (p= 0.072), although a Shimodaira-Hasegawa test indicated that
the tree was significantly worse (p= 0.048). Trees that enforced monophyly on Pseudomys
were not significantly different to the best tree (likelihood score: 1592.17203; K-H test p=
0.281), whether Mastacomys was included within Pseudomys or not (likelihood score of
1587.22806 with Mastacomys included).
75
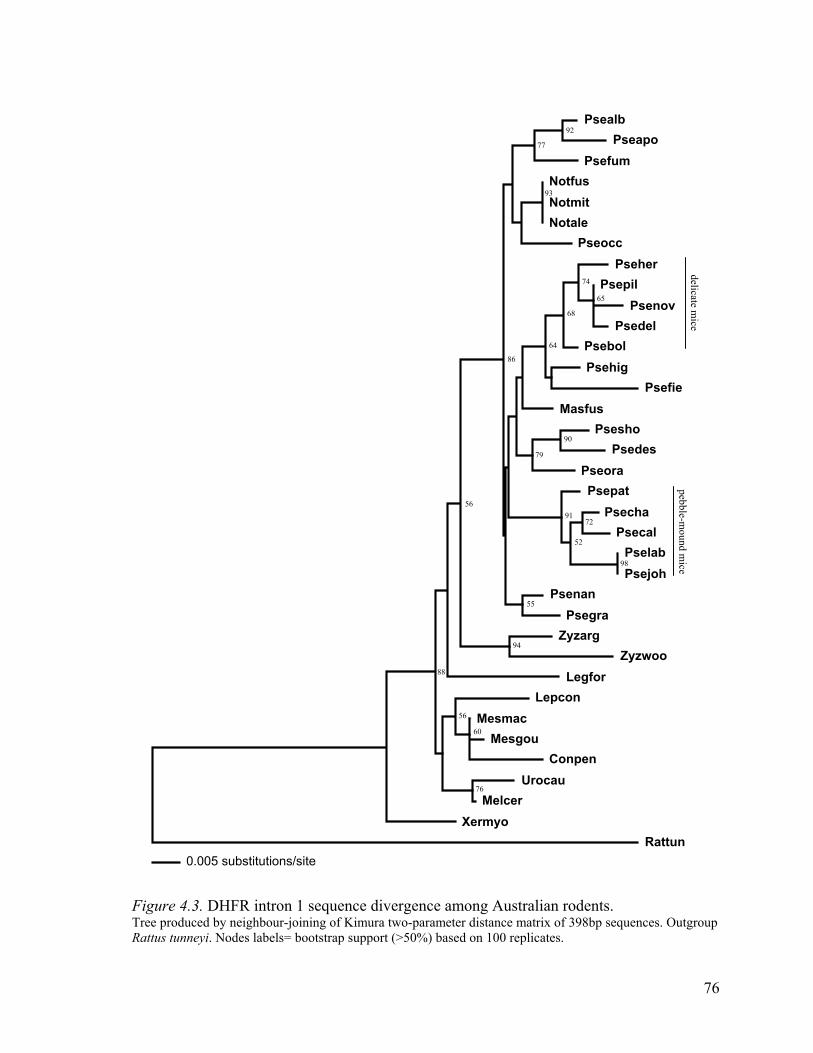
PsealbPseapo
Psefumotfus
NotmitNotale
PseoccPseher
PsepilPsenov
PsedelPsebolPsehig
PsefieMasfus
PseshoPsedes
PseoraPsepat
PsechaPsecal
selabPsejoh
PsenanPsegra
ZyzargZyzwoo
0.005 substitutions/site
pebble-mound m
ice delicate m
ice
Figure 4.3. DHFR intron 1 sequence divergencTree produced by neighbour-joining of Kimura two-paraRattus tunneyi. Nodes labels= bootstrap support (>50%)
88
LegforLepconesmacMesgou
ConpenUrocau
X
e amometer based
76
56
M6056
Meermy
ng Adistanon 10
86
lcero
ustce m0 re
55
ralianatrix o
plicates
91
rodents.f 398bp se.
P98
72
52
79
90
N93
64
68
74
65
92
77
94
Rattun
quences. Outgroup
76

PsealbPseapo
PsefumPseher
PsepilPsenov
PsedelPsebolPsehig
PsefieNotfusNotaleNotmit
PseoccPsenan
PsegraMasfus
PseshoPsedes
PseoraPsepat
PsechaPsecal
PselabPsejoh
ZyzargZyzwoo
LepconLegfor
MesmacMesgou
ConpenUrocau
MelcerXermyo
Rattun0.005 substitutions/site
pebble-mound m
ice delicate m
ice
59
66
51
92
79
95 54
93
86
70
61
59
57
85
Figure 4.4. Maximum-likelihood tree of Australian rodent DHFR intron 1 sequence. Maximum-likelihood tree based on parameters derived from Modeltest for 398bp of sequence. Outgroup Rattus tunneyi. Node labels= bootstrap support (>50%) based on 100 replicates.
77

4.4 A realistic phylogeny: a biogeographical framework
The results presented here accord well with previous work, in particular microcomplement
fixation (Watts et al. 1992). Australian Old Endemic rodents (the Hydromyini) form a
coherent, closely related clade when compared to Rattus. Within this group, water rats
seem to be basal, and the conilurine clade is closely related to the mosaic-tailed rats. Many
species relationships supported by phylogenies based on DNA sequencing are also
expected based on previous research, and the independent production of these results
should place those relationships beyond doubt. Other results, such as the possible inclusion
of Notomys within Pseudomys (as currently defined) are less expected, but are consistent
with some previous findings.
4.4.1 CONILURINE MONOPHYLY: ARE PATTERNS OF ENDEMISM INDICATIVE OF PHYLOGENY?
Analysis of control region and DHFR intron 1 sequences separated the Australian endemic
conilurine rodents from the New Guinea-derived mosaic-tailed rats Uromys and Melomys,
but there was no statistical support for this relationship. Conilurine rodents are obviously
closely related to mosaic-tailed rats, and the fact that topology tests indicated that
Leggadina could be placed in a basal position to all hydromyine rodents without
significantly altering support for the DHFR tree is indicative of a probable series of
radiations at deeper levels of the phylogeny, as is the lack of saturation revealed by Xia et
al. (2003) tests. However, there was a separation of conilurine rodents from the
Uromys/Melomys clade in all bar the DHFR intron 1 distance tree. Penis morphology
(Lidicker and Brylski 1987) and microcomplement fixation (Watts et al. 1992) studies were
unable to separate several conilurine genera from mosaic-tailed rats, and cytochrome-b
sequencing results included many New Guinean genera amongst the Australian endemics
(Torrance 1997), although that tree was affected by saturation at deeper levels (S.
Donnellan pers. comm.). On the basis of these results it would seem that the conilurines are
not strongly supported as a monophyletic lineage, and (Watts and Baverstock 1994b)
synonymised the tribes Conilurini, Hydromyini and Uromyini into a single tribe, the
Hydromyini, on the basis of microcomplement fixation results.
78

The possibility that the conilurines are not monophyletic is biogeographically perplexing
given the strongly endemic nature of both the conilurines and New Guinean genera. It is the
genera Mesembriomys, Leporillus and Conilurus that most often associate with the mosaic-
tailed rats, although the labile position of Leggadina in phylogenies is enigmatic.
Therefore, a simple biogeographic scenario of the evolution of the conilurines may involve
an early invasion from New Guinea that gave rise to Notomys/Pseudomys, Zyzomys and
Leggadina, followed by a more recent invasion by tree rats from New Guinea. The fossil
record does not preclude such a scenario (Godthelp 1999). However, the weight of
evidence still seems to suggest that the conilurines are a monophyletic assemblage, and that
difficulties in resolving their relationship to New Guinean genera stem from virtually
simultaneous processes of divergence from New Guinean stock and radiation within
Australia. Separation of New Guinean and Australian stocks, either by rising Pliocene sea
levels or waif dispersal from New Guinea (section 2.2.1) would, in terms of DNA sequence
analysis, be contemporaneous with an early Pliocene generic radiation of rodents within
Australia.
Conclusion
Lack of synapomorphic characters defining the conilurine clade, and a shallow basal
divergence from New Guinean stock when compared to deep generic divisions within the
conilurines has lead to difficulties in establishing their monophyly. However, conilurines
are probably a true monophyletic group, closely allied to the mosaic-tailed rats and more
distantly to the water rats. This result is suggested by molecular studies presented here
based on two genetic loci and by karyotypic studies. However, there is no definitive proof
of conilurine monophyly.
79
4.4.2 GENERIC RELATIONSHIPS
Conilurine rodents represent a true radiation. The ecological diversity of genera and
plasticity of topologies at deep nodes of the conilurine tree, in the absence of saturation,
support this fact. This makes resolving some generic relationships difficult. The tree rat
genera Conilurus and Mesembriomys and the stick nest rats (Leporillus), form a
monophyletic group, a result suggested by previous research (Lidicker and Brylski 1987,
Watts et al. 1992, Torrance 1997) and strongly supported here. Mastacomys fuscus,
Notomys and Pseudomys form a large and complex monophyletic assemblage in which
generic boundaries are ill defined (Baverstock et al. 1977b, Baverstock et al. 1981,
Baverstock et al. 1983, Godthelp 1989, Watts et al. 1992). Zyzomys species form a well-
supported monophyletic genus that may be a sister-taxon to either Leggadina or
Notomys/Pseudomys on the basis of results presented here.
Since Baverstock et al. (1976) and Watts (1976) re-defined Leggadina only Lidicker and
Brylski (1987) have, erroneously, questioned the species composition of the genus.
Leggadina forresti and L. lakedownensis are the only two known species, and have
repeatedly been shown to be divergent from Pseudomys species (Baverstock et al. 1977b,
Baverstock et al. 1981, Baverstock et al. 1983, Watts et al. 1992, Torrance 1997). This
result is strongly supported by this thesis. However, Leggadina has been enigmatic in its
placement in phylogenies. Baverstock et al. (1981) and Watts et al. (1992) both found
Leggadina to lie outside the conilurine lineage. However, DNA sequencing at
mitochondrial (control region, this study: cyt-b, Torrance (1997)) and nuclear loci (DHFR
intron 1, this study) shows Leggadina to be a conilurine genus. Statistical support for that
relationship in sequencing trees is not strong, but there is a strong morphological argument
against a stronger affinity with water rats or basal hydromyine position (Troughton 1941,
Tate 1951, Watts and Aslin 1981), and no reason to doubt the expected placement of
Leggadina within the conilurine clade. The genus Zyzomys, which is a sister-taxon to
Leggadina in the control region trees, possesses such a highly derived karyotype that
Baverstock et al. (1977b) and Baverstock et al. (1983) were reluctant to ally the genus with
any particular group on the basis of chromosomal homologies. However, this thesis, penis
80
morphology (Lidicker and Brylski 1987), isozyme (Baverstock et al. 1981) and
microcomplement fixation (Watts et al. 1992) studies all indicate that Zyzomys is a
conilurine genus.
Affinities of the genus Leporillus have also been a matter of speculation since isozyme
analysis placed the genus within Pseudomys (Baverstock et al. 1981). Watts and Aslin
(1981) also suggested an affinity with Pseudomys and Leggadina. No study of the
karyotype of Leporillus has been published, and the probable absence of the
Notomys/Pseudomys reciprocal translocation between chromosomes 1 and 2 has therefore
not been established. Both genetic loci studied in this thesis show a close relationship to the
tree rats, Conilurus and Mesembriomys. These genera differ from Leporillus in the number
of internal cusps on the M1 and M2 molars, a character that has formed the basis for the
presumed affinity of Conilurus with Mesembriomys and Zyzomys (3 cusps), and Leporillus
with Pseudomys (2 cusps)(Crabb 1977, Tate 1951). Conilurus and Leporillus are, however,
superficially similar genera. Both have been described as “rabbit rats” because of their size,
large ears and rounded body form (Troughton 1923, Watts and Aslin 1981). There has been
confusion over the identity of specimens referred to (Conilurus) albipes and (Leporillus)
apicalis by early explorers (Mahoney 1982), and Ogilby (1838) described some individuals
of Conilurus albipes as Conilurus constructor in the mistaken belief that it was C. albipes
not L. apicalis that built stick nests. Microcomplement fixation (Watts et al. 1992) and
penis morphology (Lidicker and Brylski 1987) support the close relationship of Leporillus,
Conilurus and Mesembriomys.
4.4.3 SPECIES RELATIONSHIPS
Species relationships within most conilurine genera are straightforward; there are only two
species in Conilurus, Leggadina, Leporillus and Mesembriomys. Relationships among the
five species of Zyzomys cannot be resolved on the basis of results presented in this thesis.
However, it would appear that the recently split species Z. maini, Z. palatalis and Z.
woodwardi (Kitchener 1989) do represent true species, and that Z. palatalis may be more
closely related to Z. argurus than to Z. maini and Z. woodwardi with which it was
81

synonymous until 1989. Zyzomys pedunculatus must be included in analyses before firm
conclusions regarding inter-specific relationships within Zyzomys are made.
Some authors have speculated that Pseudomys might be a “taxonomic wastebin” that
includes a collection of species united solely by lack of derived characters (Baverstock et
al. 1981, Watts and Aslin 1981, Godthelp 1989). Others have recognised all species as
closely related, but have split the genus into multiple genera (Iredale and Troughton 1934,
Tate 1951). As a result, there is a wealth of information regarding relationships between
Pseudomys species. However, published phylogenies have not fully sampled the genus, and
those species that have been examined are often not consistent between studies. Results of
DNA sequencing presented here have confirmed that 23 species currently referred to the
genus Pseudomys form a closely related but complex group. Mastacomys fuscus is
confirmed here as a member of Pseudomys if the current definition of the genus is
accepted. However, the inclusion of, or very close relationship with, Notomys species in
mitochondrial and nuclear phylogenies, penis morphology (Lidicker and Brylski 1987) and
one method of isozyme analysis (Baverstock et al. 1981) increases the number of species
within the “genus” to over thirty. This result indicates that at the very least, sub-genera
need to be re-described, and in all probability generic divisions should be recognised within
the complex. It is also clear that association of species regarded as members of Pseudomys
is not simply a result of retention of ancestral characters. With the exclusion of Leggadina
species historically regarded as members of Pseudomys, all remaining species of
Pseudomys, Notomys and Mastacomys form a monophyletic derived lineage, the
“Pseudomys group”, a relationship strongly supported by sequence analysis (Torrance
1997, this thesis), karyotypic (Baverstock et al. 1977b, Baverstock et al. 1983) and
microcomplement fixation (Watts et al. 1992) studies. There is enough consistency between
past studies of Pseudomys species relationships and the current study to deal explicitly with
the question of how to split Pseudomys into sensible genera. These should be consistent
with the level of taxonomic division between other conilurine genera, and in my opinion
they should also identify natural groups of species that share unique or characteristic
biological attributes.
82

The hopping mice
Species belonging to the genus Notomys possess some of the most derived characteristics of
any Australian rodents. Their gross morphology and locomotion is distinctive; elongate
ears and feet, long brush-tipped tail and a bipedal gait at high speed (Watts and Aslin
1981). Notomys skulls are distinctive, in particular the structure of the zygomatic plate and
arch (Watts and Aslin 1981). Reproductive tracts of N. alexis, N. aquilo, N. mitchelli and N.
fuscus are highly divergent, not only from other conilurines, but from other mammals
(Breed 1981, 1985, 1986). Notomys alexis and N. fuscus are some of the few hydromyine
species in which the structure of the sperm significantly diverges from the ancestral form
(Breed 1997). Watts and Aslin (1981) considered Notomys so distinctive as to be a clade of
equal age to the divergence of mosaic-tailed rats and all other Australian rodents, and
thought 15My of evolution had led to the modern hopping mouse morphology. Does it
make sense then, that sequencing studies presented here suggest Notomys is of no greater
evolutionary age than several species groups within the genus Pseudomys, and that hopping
mice are derived from an ancestral “Pseudomys” species, not basal hydromyine stock?
Recent publications have considered that Watts and Aslin’s (1981) time line is significantly
too long, and predates the origin of hydromyine rodents (Aplin accepted, Watts et al. 1994).
The oldest Notomys-like fossils are late Pliocene in age, and are teeth that appear ancestral
to the modern dentition of Notomys species (Crabb 1977, Godthelp 1999). No information
on morphology of the early Notomys lineage is available. Notomys is clearly allied with
Pseudomys and Mastacomys to the exclusion of all other rodents (Baverstock et al. 1977b,
Baverstock et al. 1983). Baverstock et al’s (1981) isozyme study show Notomys to form a
clade within Pseudomys in distance analyses, and the distance to Notomys from many
Pseudomys species was less than between other Pseudomys species in their Wagner tree
analysis. The idea that Notomys evolved from Pseudomys is also not without precedent.
Ellermann (1941) proposed that Mastacomys and Notomys evolved from Pseudomys on the
basis of gross morphology, and, barring internal morphological peculiarities of some
Notomys species, the hopping mice are essentially “Pseudomys” that hop and have big ears
and feet. There is a strong evolutionary argument for the evolution of Notomys from a
83

“Pseudomys” ancestor (section 9.2.3). However, the genus is distinct, and could be
considered a very closely related monophyletic sib-taxon to Pseudomys on the basis of
topology tests and the results of Watts et al. (1992) and Baverstock et al. (1981).
At least two well-defined clades are identifiable within Notomys. The Notomys
alexis/mitchelli/fuscus clade is evident as a very closely related assemblage in both control
region and DHFR intron 1 trees. This clade is that which possesses highly derived
reproductive tracts (Breed 1981, 1985, 1986), and on this basis also includes N. aquilo (W.
Breed pers. comm.). This clade matches Watts and Aslin’s (1981) “group 3”, and probably
includes the remaining member of that group N. mordax. Notomys cervinus more closely
resembles Pseudomys species in its reproductive tract than it does the N. alexis clade
(Breed 1985, 1986), a state considered ancestral within Notomys by Breed (1986).
Mitochondrial control region does not yield a monophyletic Notomys due to the similarity
of N. cervinus sequence to that of P. occidentalis, although the inclusion of extinct Notomys
species in analysis would no doubt separate N. cervinus from Pseudomys occidentalis.
Skull and dental characters (Tate 1951), the lack of a throat gland (Watts and Aslin 1981),
karyotype (Baverstock et al. 1977b, Baverstock et al. 1977d), isozymes (Baverstock et al.
1981) and microcomplement fixation (Watts et al. 1992) all indicate N. cervinus is quite
distinct from the N. alexis clade, and Waite (1900) placed it in a separate genus, primarily
on the basis that it lacked a throat gland. Watts and Aslin (1981) ally N. macrotis with N.
cervinus. Notomys longicaudatus also lacks the derived reproductive tract of the N. alexis
clade (Breed 1989b) but was placed in a separate group with N. amplus and Notomys sp. by
Watts and Aslin (1981), based mostly on body size. The lack of derived reproductive
characters cannot be taken as an indication of the monophyly of N. cervinus and N.
longicaudatus, and their relationship is unresolved. The placement of N. mordax close to N.
cervinus by Watts and Aslin (1981) is followed here.
84

“Pseudomys”
Figure 4.5 presents relationships of Pseudomys and Notomys species taken from all relevant
systematic studies. Some interpretation of results is necessary to produce the figures,
primarily due to the splitting of Pseudomys species by other genera (4.5c), and inconsistent
results between analytical methods in the same paper that the authors did not attempt to
reconcile (4.5a and d). Trees were formed by uniting the closest related Pseudomys species,
and retaining clades indicated by the original source. The number of species included in
each study varies, and some inconsistencies between studies are probably related to missing
taxa that are intermediate between those that were included. A single Notomys species is
shown in each figure as it is assumed that the genus is monophyletic, but is a lineage
within, or very closely related to, the currently defined genus Pseudomys. Kimura two-
parameter and parsimony trees derived from analysis of the reduced alignment of 118bp
(outlined in section 4.2 (all sites variable, 80 parsimony-informative)) are shown in figure
4.6 and are very similar to past results and relationships presented in more comprehensive
species phylogenies.
85
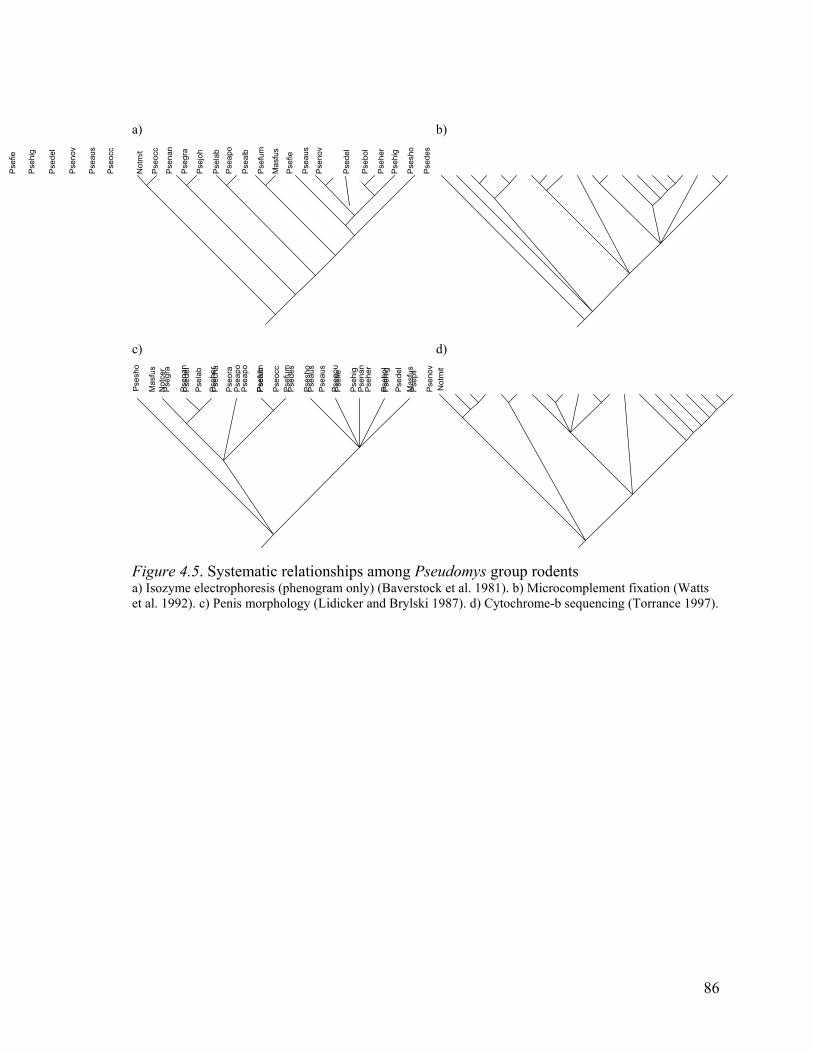
a) b)
c) d)
Pse
fie
Pse
hig
Pse
del
Pse
nov
Pse
aus
Pse
occ
Not
mit
Pse
occ
Pse
nan
Pse
gra
Pse
joh
Pse
lab
Pse
apo
Pse
alb
Pse
fum
Mas
fus
Pse
fie
Pse
aus
Pse
her
Pse
bol
Pse
del
Pse
nov
Pse
hig
Pse
sho
Pse
des
Pse
sho
Not
cer
Pse
del
Pse
her
Pse
apo
Pse
alb
Pse
fum
Pse
aus
Pse
gou
Pse
nan
Pse
hig
Mas
fus
Mas
fus
Not
mit
Pse
gra
Pse
nan
Pse
lab
Pse
cha
Pse
ora
Pse
apo
Pse
fum
Pse
occ
Pse
des
Pse
sho
Pse
aus
Pse
fie
Pse
hig
Pse
her
Pse
bol
Pse
del
Pse
pil
Pse
nov
Figure 4.5. Systematic relationships among Pseudomys group rodents a) Isozyme electrophoresis (phenogram only) (Baverstock et al. 1981). b) Microcomplement fixation (Watts et al. 1992). c) Penis morphology (Lidicker and Brylski 1987). d) Cytochrome-b sequencing (Torrance 1997).
86

Psefie
Psehig
Psedes
Psesho
PsealbPseapo
Masfus
PseoraPseaus
Notmit
PsenanPsegrac Psepat
Pselab
Psejoh
Psecal
Psecha
Pseocc
Psesp.
Pseher
Psedel
Psenov
Psebol
Psesp.
Psedel
Psenov
Pseher
Psebol
Psepat
Psejoh
Pselab
Psecal
Psecha
Psefie
Psehig
Psegrac
Psenan
Pseapo
Psealb
Masfus
Pseaus
Pseora
Psesho
Psedes
Pseocc
Notmit
73
73
51
96
9595
57
ning ance.
ee. Based on reduced
b)
Figure 4.6. Pseudomysgroup relationships based on the mitochondrial control region. a) Unrooted neighbour-joinetwork of K2P distb) Unrooted bootstrapped parsimony tralignment of 118bp. (Psesp. See chapter 6)
a)
87

Genera within Pseudomys
Four clades within “Pseudomys” are clearly divergent from the bulk of other Pseudomys
species:
1) Mastacomys fuscus
Mastacomys Thomas 1882 has long been regarded as a monotypic genus on the basis of
highly divergent dentition (Iredale and Troughton 1934, Tate 1951, Ride 1970, Watts and
Aslin 1981), and continues to be regarded as such (Strahan 1995, Mackenzie and Burbidge
2002) despite clearly and consistently falling within Pseudomys in systematic studies
(Baverstock 1981, Lidicker and Brylski 1987, Watts et al. 1992). Baverstock et al. (1981)
retained Mastacomys, but were reluctant to split Pseudomys to recognise genera of
equivalent standing because of the inconsistency of relationships between other species and
the creation of many smaller genera. Watts et al. (1992) formally included Mastacomys
within Pseudomys, but this nomenclature has not been widely adopted. Mastacomys has
dentition that separates it from all other Pseudomys species, is not particularly closely
related to any Pseudomys species, and should be recognised as a genus.
2) Pseudomys gracilicaudatus, Pseudomys nanus (and P. gouldii?)
The chestnut mice were previously regarded as members of Thetomys either as a sub-genus
(Thomas 1910) or genus (Iredale and Troughton 1934). That name is available, and should
be applied to (P). nanus (the type of Thetomys) and (P.) gracilicaudatus. Watts and Aslin
(1981) allied the chestnut mice with P. desertor and P. shortridgei, but Troughton (1932)
and Tate (1951) concluded that there were conspicuous differences between P. nanus and
P. desertor and placed them in different sub-genera. Chestnut mice have a shorter gestation
period than other Pseudomys species. Pseudomys nanus has a gestation period of only 22-
24 days, which is significantly shorter than that of any other hydromyine (Taylor and
Horner 1972), although the taxonomic importance of this is doubtful. Pseudomys
gracilicaudatus and P. nanus share a pseudogene not detected in any other conilurine
88
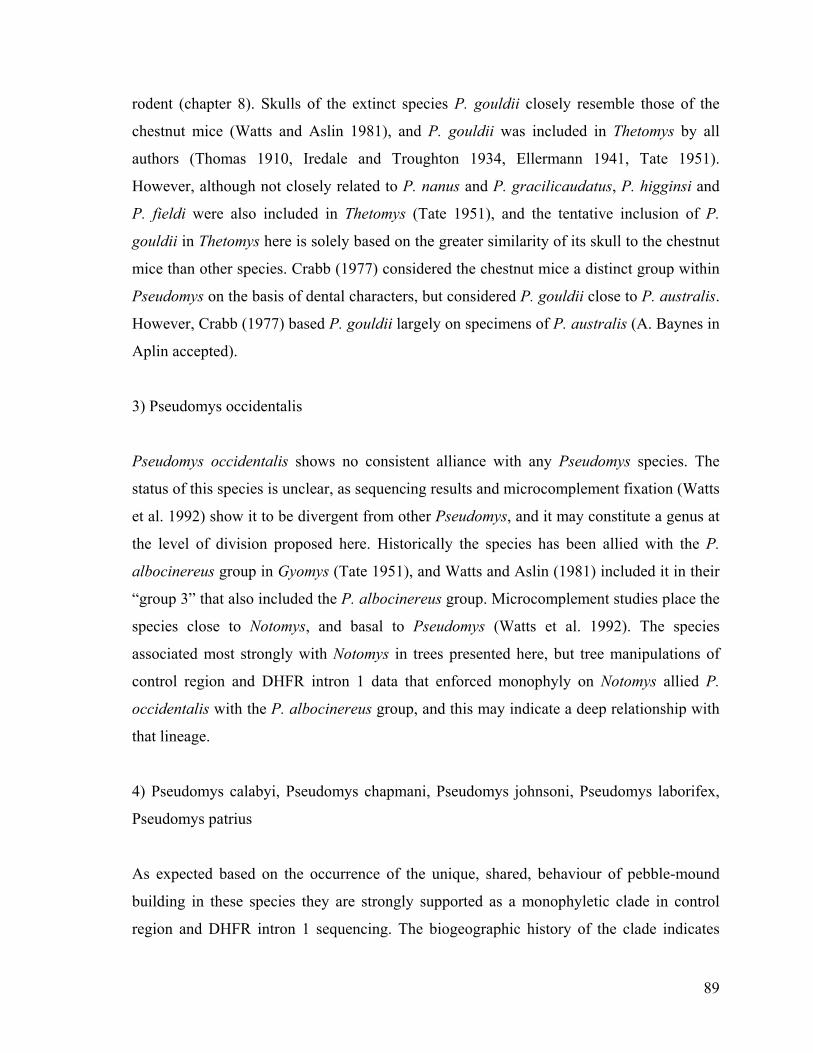
rodent (chapter 8). Skulls of the extinct species P. gouldii closely resemble those of the
chestnut mice (Watts and Aslin 1981), and P. gouldii was included in Thetomys by all
authors (Thomas 1910, Iredale and Troughton 1934, Ellermann 1941, Tate 1951).
However, although not closely related to P. nanus and P. gracilicaudatus, P. higginsi and
P. fieldi were also included in Thetomys (Tate 1951), and the tentative inclusion of P.
gouldii in Thetomys here is solely based on the greater similarity of its skull to the chestnut
mice than other species. Crabb (1977) considered the chestnut mice a distinct group within
Pseudomys on the basis of dental characters, but considered P. gouldii close to P. australis.
However, Crabb (1977) based P. gouldii largely on specimens of P. australis (A. Baynes in
Aplin accepted).
3) Pseudomys occidentalis
Pseudomys occidentalis shows no consistent alliance with any Pseudomys species. The
status of this species is unclear, as sequencing results and microcomplement fixation (Watts
et al. 1992) show it to be divergent from other Pseudomys, and it may constitute a genus at
the level of division proposed here. Historically the species has been allied with the P.
albocinereus group in Gyomys (Tate 1951), and Watts and Aslin (1981) included it in their
“group 3” that also included the P. albocinereus group. Microcomplement studies place the
species close to Notomys, and basal to Pseudomys (Watts et al. 1992). The species
associated most strongly with Notomys in trees presented here, but tree manipulations of
control region and DHFR intron 1 data that enforced monophyly on Notomys allied P.
occidentalis with the P. albocinereus group, and this may indicate a deep relationship with
that lineage.
4) Pseudomys calabyi, Pseudomys chapmani, Pseudomys johnsoni, Pseudomys laborifex,
Pseudomys patrius
As expected based on the occurrence of the unique, shared, behaviour of pebble-mound
building in these species they are strongly supported as a monophyletic clade in control
region and DHFR intron 1 sequencing. The biogeographic history of the clade indicates
89

that it is old (chapter 5) and the genetic distance encompassed within the group is
equivalent to that within much of the remainder of Pseudomys (fig. 4.6). A pseudogene
present in all species of pebble-mound mice is unique to the group, and is highly divergent
from true mitochondrial sequence, indicating an old origin and isolation of the pebble-
mound mouse lineage when compared to other Pseudomys. The only studies that have
included pebble-mound mice (Watts et al. 1992, Torrance 1997) have shown labile or
distant relationships to other Pseudomys species (Torrance’s (1997) “P. johnsoni” and “P.
calabyi” were based on miss-identified tissue samples (S. Donnellan pers. comm.)).
Sequencing of the ZPc gene by Christine Swann, Adelaide University, has also identified
the group as divergent from all other Pseudomys in the possession of a protein-changing
mutation not found in any other murid rodent (C. Swann pers. comm.). Therefore, pebble-
mound mice are characterised by a unique behaviour, which indicates a strong biological
argument for recognition of the group as a distinct genus, and this distinction is matched by
divergence in molecular studies. The name Phorolithomys derived from the Greek for
“stone carrying mice” will be proposed for this group.
The remaining members of Pseudomys tend to group reasonably closely in systematic
analyses, and are shown at the bottom of figure 4.6 (a). Several strongly supported species
groups are apparent (below). Inter-relationships among these groups are more problematic
than the separation of the chestnut mice and pebble-mound mice from them, because the
distances between groups are not so great, and some species show labile affinities.
However, several genera could be recognised within this group, but this will probably rely
on further study due to the unresolved relationships of some taxa.
Pseudomys australis
Pseudomys australis is the type species of the genus. There is a great deal of taxonomic
confusion over specimens referred to the species, and it is not clear what the natural
distribution or taxonomic composition of the species is (or was) (Watts and Aslin 1981,
Brandle et al. 1999). In studies presented here it is difficult to determine any clear
relationships of the species because DHFR intron 1 sequence was not obtained. In several
90

studies the species groups closely with the delicate mice and P. fieldi/higginsi (Baverstock
et al. 1981, Watts et al. 1992, Torrance 1997), although it sometimes groups, more
distantly, with the P. albocinereus group in different analyses performed by those authors.
It is proposed here that in its most limited form, the generic name Pseudomys should be
applied to the delicate mice, P. fieldi/higginsi and P. australis (including any forms that
eventually are regarded as closely related or synonymous with P. australis). However, this
must carry the proviso that there is only slightly stronger support for the alliance of P.
australis with the delicate mouse group than there is for its association with other species
such as P. albocinereus (control region tree here, some cytochrome-b trees (Torrance
1997)).
Delicate mice
All methods of analysis in this thesis support the monophyly of P. bolami, P. delicatulus,
P. hermannsburgensis, P. novaehollandiae and P. pilligaensis. Although not an unexpected
result, this group has not been fully dealt with in previous studies. Watts et al. (1992) found
that P. bolami, P. delicatulus, P. hermannsburgensis and P. novaehollandiae were a
monophyletic assemblage. Lidicker and Brylski (1987) only examined the penis
morphology of P. delicatulus and P. hermannsburgensis, which they considered to be
species of Leggadina. Although not included in their analysis, they regarded P.
novaehollandiae to be a member of a separate genus, Gyomys. The isozyme study of
Baverstock et al. (1981) showed P. delicatulus and P. novaehollandiae as sib-species, but
P. hermannsburgensis was somewhat distant in both their distance and Wagner trees,
although it is clear that Baverstock (1982) regards these three species as a closely related
group. When describing P. pilligaensis Fox and Briscoe (1980) and Briscoe et al. (1981)
also assumed that P. hermannsburgensis, P. delicatulus and P. novaehollandiae were a
closely related species group. Control region and DHFR intron 1 sequencing has confirmed
the suspected alliance of all five of these species (see chapter 6 for a taxonomic and
systematic review of this group).
91

Pseudomys fieldi (including P. praeconis) and Pseudomys higginsi
These two species are given strong support as sibs in analyses presented here. Watts et al.
(1992) show P. fieldi (as praeconis) to be allied with P. australis, while they place P.
higginsi closer to P. desertor/shortridgei. However there is little difference in distances
they report between these taxa, and the relationships they show are not supported by the
same authors earlier studies of isozymes (Baverstock et al. 1981), which agree with the
relationships suggested here. Cytochrome-b sequencing supports the sib-species
relationship of P. higginsi and P. fieldi (Torrance 1997). Troughton (1941) and Tate (1951)
regarded P. higginsi and P. (praeconis) as members of different genera or subgenera, but
also split the synonymous P. fieldi and P. praeconis. Pseudomys fieldi and P. higginsi
consistently group with the delicate mice in systematic studies (Baverstock et al. 1981,
Watts et al. 1992, Torrance 1997).
Pseudomys desertor, P. shortridgei (and P. oralis)
The desert mouse (P. desertor) is allied here with the heath rat (P. shortridgei). The close
relationship of P. desertor and P. shortridgei is supported by microcomplement fixation
(Watts et al. 1992) and cytochrome b sequencing (Torrance 1997). Lidicker and Brylski
(1987) did not include P. desertor in their analysis, and the two species have radically
different sperm morphology (Breed 1997). Crabb (1977) considered them distinct within
Pseudomys and closely related to each other. Troughton (1941) and Tate (1951) separated
the species in different subgenera/genera. Baverstock et al. (1981) did not examine P.
desertor isozymes. The further alliance of the P. desertor/shortridgei clade with P. oralis in
DHFR intron 1 studies accords with skull similarities (Watts and Aslin 1981), but differs
from dental characteristics (Crabb 1977). Pseudomys oralis has not been included in any
published phylogenies, and Watts and Aslin (1981), like Tate (1951), considered it to be
more closely related to P. australis, as it was originally described as a subspecies of that
species (Thomas 1921). Pseudomys oralis is therefore only tentatively allied with P.
desertor and P. shortridgei. Barring an aberrant result in isozyme studies, the P.
desertor/shortridgei group tends to ally with the P. australis/fieldi/delicate mouse group,
92

but at a level deep enough to constitute recognition as a separate group at either the sub-
generic or generic level. The name Lasiomys derived from the Greek for “hairy mice” is
appropriate for mice in this group, which have a grizzled, shaggy, appearance. The name
appears to be a disused synonym of Lophuromys Peters 1874, and should be available.
Pseudomys apodemoides, P. albocinereus, (P. glaucus), P. fumeus
Pseudomys albocinereus and P. apodemoides are a well-recognised sib-species pair,
strongly supported by trees presented in this thesis. The further alliance of these species
with P. fumeus is indicated in DHFR intron 1 trees, a relationship supported by general
morphology (Watts and Aslin 1981), microcomplement fixation (Watts et al. 1992), penis
morphology (Lidicker and Brylski 1987), some cytochrome–b trees (Torrance 1997) and
dentition (Crabb 1977). Pseudomys fumeus is one of four species (Leggadina forresti,
Leporillus apicalis and P. shortridgei are the other three) that were placed in unusual
phylogenetic positions by isozyme studies (Baverstock et al. 1981) when compared to other
studies. Isozyme analysis distanced P. fumeus from most Pseudomys species, and it was
particularly isolated from P. albocinereus and P. apodemoides. All were regarded by Tate
(1951) to be members of the sub-genus Gyomys, and although control region sequence is
not available for P. fumeus, the relationship with P. apodemoides/albocinereus is
reasonably strongly supported. This gains further support from the occurrence of communal
breeding in all three species, despite the atypical conditions under which this occurs in P.
fumeus (Woods and Ford 2000). The extinct P. glaucus is probably a member of this group,
as it has been referred to P. albocinereus (Cockburn 1995b), although Burbidge and
Mackenzie (2002) recognise it as a distinct species. Despite biogeographical concerns
about the synonomy of P. albocinereus and P. glaucus, P. glaucus was probably more
closely related to P. albocinereus/apodemoides than is P. fumeus. The Tertiary fossil
species Pseudomys vandycki resembles P. albocinereus (Godthelp 1989). This group is
closely related to the P. australis and P. desertor groups. The group could be regarded as a
genus. However, P. novaehollandiae is the type of the previous generic name used to
describe these species. The name Calotrichomys derived from the Greek for “beautiful-
haired mice” would be appropriate for this group, as most members are named after the
93

colour or complexion of their fur, and are noted for their beautiful appearance and
demeanour.
4.5 Synthesis
The definition and taxonomic rank of species groups within Pseudomys is a perennial
problem of Australian taxonomy, and with the sinking of the former tribe Conilurini within
the tribe Hydromyini there is now considerably less scope for ascribing evolutionary
significance to deeper level relationships within the group. In my view, the conilurine
rodents should be considered monophyletic at least at the sub-tribe level until conclusive
evidence against their monophyly is presented (fig. 4.7). The composition and taxonomic
rank of the Hydromyini is a topic beyond the scope if this thesis. Irrespective of the status
of the conilurines, the genera Notomys, Pseudomys and Mastacomys clearly constitute a
large well-defined group deserving of some recognition, possibly as a sub-tribe, although
this would re-elevate the conilurines to tribal status. I will simply refer to them as the
Pseudomys group (fig. 4.6.1). The Conilurus/Leporillus/Mesembriomys clade (tree
rat/Leporillus clade) would appear to be of the same status and deserving of the same rank,
while the affinities of Zyzomys and Leggadina are unclear, but they are clearly conilurine.
Genera outside the Pseudomys group are all well supported as monophyletic units (fig. 4.7).
Relationships within the Pseudomys group are still not fully resolved, despite great effort
having been expended on defining species groups. This is probably the result of rapid
radiation of early Pseudomys-like rodents, and ongoing processes of speciation and
extinction with radical changes in environment over the last few million years. In this
regard, my explanation for the observed pattern of relationships differs markedly from Lee
et al. (1981) who proposed an early radiation of the conilurine rodents followed by long
periods of stasis, leading to isolated clades such as Mastacomys. Whether Pseudomys
should be so broadly defined as to include such distinct forms as Mastacomys, which shows
no particular affinity to any other Pseudomys species, is even more pertinent in light of
DNA sequencing of mitochondrial and nuclear loci presented here, which shows that
“Pseudomys” contains a number of divergent evolutionary lineages characterised by unique
94

adaptations including the pebble-mound mice and possibly Notomys. The most logical
approach is to erect multiple genera that reflect the diverse clades within the group.
A glance at the distance trees presented here (figs. 4.1, 4.3 and 4.6 (a)) illustrates the
problem faced by all authors who have attempted to unite species at this level; the basal
node of the Pseudomys group is only marginally deeper than is the basal node of most
clades within the group. There is also a lack of closely related species that leaves several
isolated species in parsimony and likelihood analyses (figs. 4.2, 4.4 and 4.6 (b)). This is
reflected in the morphology of species within the group, and was the motivation for Ride
(1970) to disregard intra-generic taxonomy. The fact that defining multiple genera within
Pseudomys may lead to genera containing only one or two species has been argued to
potentially make the process counter-productive (Baverstock et al. 1981). However, the
historical recognition of Mastacomys as a distinct genus, and the fact that Conilurus,
Leporillus, Mesembriomys and Leggadina contain only two species negates that argument.
Within the Pseudomys group the previously defined genera Notomys and Mastacomys
should be recognised (fig. 4.7). The pebble-mound mice and chestnut mice are as isolated,
or more so, from other Pseudomys species as are Notomys and Mastacomys, and should be
recognised as genera. A large genus Pseudomys is retained by the recognition of the P.
australis/P. fieldi/delicate mouse complex as a genus. The closely related P. desertor/
shortridgei/oralis? clade should probably be regarded a sub-genus, or as is currently the
case, members of Pseudomys, until more evidence confirms groupings suggested here.
Pseudomys albocinereus, P. apodemoides, P. fumeus and P. glaucus are considered to
probably be a good genus with a fossil history of at least three million years. However, as
with the last group, retention in Pseudomys seems an equally valid interpretation until more
data is presented. The relationships of P. occidentalis are unclear, but may lie with the P.
albocinereus group.
95

Water rats Water rats Mosaic-tailed rats Mosaic-tailed rats Conilurus albipes Conilurus albipes C. penicillatus Mesembriomys gouldii M. macrurus Leporillus apicalis L. conditor Leggadina forresti L. lakedownensis N. alexis N. aquilo N. fuscus N. mitchelli N. cervinus N.macrotis N.amplus N. longicaudatus N. mordax N.sp Pseudomys australis P. fieldi P. higginsi P. bolami P. hermannsburgensis P. novaehollandiae P. delicatulus
P. pilligaensis P. desertor P. shortridgei P. oralis P. albocinereus P. apodemoides P. glaucus P. fumeus P. occidentalis
P. calabyi
P. chapmani P. johnsoni P. laborifex P. patrius P. gracilicaudatus P. nanus P. gouldii Mastacomys fuscus Zyzomys argurus Z. maini Z. palatalis Z. pedunculatus Z. woodwardi
Leggadina
zomys Zy
Mastacomys
Notomys
“Phorolithomys”
Thetomys
Pseu
dom
ys g
roup
coni
lurin
es
Pseudomys
“Lasiomys”
Leporillus
Mesem.
Conil.
“Pse
udom
ys”*
“Calotrichomys”
Figure 4.7. Synthesis of phylogenetic relationships between conilurine rodents. Solid boxes denote strongly supported species groups (= genera except in Notomys and Pseudomys). Solid lines are well-supported relationships, dashed lines moderately supported relationships, dotted lines are more speculative. *Alternative (and largest justifiable) definition of the genus Pseudomys.
96

Chapter 5. Evolution of distributions and species boundaries
within the pebble-mound mice
CHAPTER SUMMARY
Population divergence among five currently recognised species of pebble-mound mice is
investigated using the mitochondrial control region and DHFR intron 1. An unexpected
finding was that P. johnsoni of central Australia and P. laborifex of the Kimberley and
VRD are probably subspecies, and form the most distinct clade within the group. Evolution
of the group has not been a straightforward process of isolation. Rather, there has been a
dynamic interaction between geological, topographical and climatic changes. Current
distributions of species are dictated by topographical and geographical constraints, in
particular the Great Sandy Desert and the Carpentarian plains. Range shifts have probably
altered geographical relationships among species, as current distributions are unlikely to
reflect patterns at the time of speciation events. Tertiary lateritic surfaces, now degraded,
are implicated in allowing contact until the mid Pleistocene? between populations of
pebble-mound mice now isolated by pebble-free habitats. Both P. johnsoni and P. patrius
have undergone recent range expansion following the LGM. Population extinction and
bottlenecking, probably during the LGM, lead to the formation of three distinct mtDNA
lineages within P. johnsoni, one of which equates to the described Kimberley form P.
laborifex.
97

5.1 Ngadji and its relatives
Pseudomys calabyi Kitchener and Humphries 1987, Pseudomys chapmani Kitchener
1980, Pseudomys johnsoni Kitchener 1985, Pseudomys laborifex Kitchener and
Humphries 1986, Pseudomys patrius Thomas and Dollman 1909
5.1.1 PEBBLE-MOUND MICE BY NAME…
There are five recently described or rediscovered species of small Pseudomys known as
pebble-mound mice. They are patchily distributed across northern Australia (fig. 5.3), and
construct unique pebble structures in and around their nesting burrows (section 5.1.2). New
populations are still frequently discovered, and the known distributions of pebble-mound
species are far broader than shown in Strahan (1995). Common names of the pebble-mound
mice reflect their distributions. The western pebble-mound mouse (P. chapmani) is found
in Western Australia in the Pilbara, Hamersley Ranges, western uplands of the Little Sandy
Desert, and the Gascoyne and Murchison Ranges (Start et al. 2000). Start et al. (2000)
adopted the nomenclature recommended by Braithwaite et al. (1995) in calling P.
chapmani Ngadji, the name used by the Panyjima people of the Hamersley Ranges. The
central pebble-mound mouse (Ilyema; P. johnsoni) is found in the Davenport and
Murchison Ranges of the Northern Territory, and in rocky ranges and desert country
bordering the Barkly Tableland (Kerle 1995a, J. Cole pers. comm.). It is known from owl
pellets and miss-identified specimens of P. hermannsburgensis from rocky ridges in the
Mittibah-Alexandrina area in the central Barkly Tableland (Thomas 1906b, Kerle 1995a).
Populations of mice from the Mt Isa-Cloncurry region of western Queensland were initially
thought to be P. johnsoni by Van Dyck (pers. comm.), but he later (Van Dyck and Birch
1996, Van Dyck 1997) regarded them as an undescribed species. Populations near the Gulf
of Carpentaria are of uncertain status, but may be P. johnsoni (S. Donnellan pers. comm.).
The Kimberley mouse (Tataroo; P. laborifex) is distributed throughout the north and east of
the Kimberley (Kitchener 1995a). Newly discovered populations of pebble-mound mouse
in the western Northern Territory and Gardner Range in the northwest Tanami Desert,
Western Australia, have been identified as P. laborifex by J. Woinarski (pers. comm.) and
98

N. Cooper (pers. comm.). The Kakadu pebble-mound mouse (Pinti; P. calabyi) was thought
to be restricted to Stage III of Kakadu National Park, but has recently been discovered over
a wider area of the Top End both inside and outside the boundaries of Kakadu (Field data,
J. Griffith pers. comm., G. O’Neil pers. comm., M. Watson pers. comm.). The Queensland,
or eastern, pebble-mound mouse (P. patrius) is found between the Great Dividing Range
and the Queensland coast from Gympie to Cairns (Van Dyck and Birch 1996, S. Burnett
pers. comm., field data).
All species are small, with the average weight of P. chapmani, P. johnsoni and P. laborifex
around 12g (Kitchener 1985, 1995a, Start et al. 2000) and P. calabyi and P. patrius slightly
heavier at 14-15g (Woinarski et al. 1995, Cermak 1999). Field observations and the above
sources indicate that all species share a rich orange-brown upper pelage tinted by dark
emergent guard hairs and a white belly that contrasts strikingly with the upper coat on the
flanks and chin. The thin tail may be pink, pink-grey or grey, and may have faint white
bands. In some older animals the tail may become quite fat (up to 4mm diameter) along its
entire length. In general appearance pebble-mound mice resemble P. delicatulus and P.
hermannsburgensis, which are sympatric with pebble-mound mice in many areas of
northern Australia.
Remote habitats and cryptic morphology have ensured that pebble-mound mice remained
unknown to science across most of their distribution until very recently. Pebble-mounds,
however, have not gone altogether unnoticed. Although Watts and Aslin (1981) cite
Spencer (1896) as noting the presence of pebble-mounds attributed to P.
hermannsburgensis in the Horn Expedition Report, W.B Stalker, the true source of the
observation they cite (reported in Thomas 1906) did describe pebble-mounds from the
eastern Northern Territory as early as 1905. Yet it was not until 1980 when Kitchener
(1980) described P. chapmani from pebble-mounds in the Pilbara region that the use of
both “pebble-mound mouse” and “sandy inland mouse” to describe P. hermannsburgensis
(e.g. Ride 1970, Watts and Aslin 1981) was questioned. Dunlop and Pound (1981) tested
Kitchener’s notion that the synonymy of P. hermannsburgensis and P. chapmani was
responsible for the dual nomenclature of P. hermannsburgensis. The co-occurrence of P.
99

chapmani and pebble mounds which they inhabited, but widespread distribution of P.
hermannsburgensis in the absence of mounds finally extricated P. chapmani from the
delicate mouse group, and established it as the first recognised species of pebble-mound
mouse. The description of P. johnsoni as a pebble-mound mouse followed (Kitchener
1985), and gave a species name to the builder of mounds described eighty years earlier by
Stalker. Pseudomys laborifex and P. calabyi (as P. laborifex calabyi) were initially
described only as small Pseudomys (Kitchener and Humphries 1986, 1987), and were more
recently recognised as pebble-mound mice (Woinarski 1992, MacGuire unpublished,
Woinarski pers. comm.).
The earliest description of a species of mouse from pebble mounds actually dates from
1909. Stalker noted mounds at the northeast Queensland site where he captured specimens
that Thomas and Dollman (1909) later described as “Mus patrius”. Although later authors
recognised Pseudomys patrius (Tate 1951, Briscoe et al. 1981), and Troughton (1941) and
Finlayson (1942) reported two further individuals of “Leggadina patria” from near the
Queensland coast, the species was not regarded as a pebble-mound mouse, and was
synonymised with P. delicatulus by Ride (1970). This meant that the 1991 capture of a
Pseudomys species from a pebble mound south of Charters Towers was somewhat of a
revelation to modern biology (Van Dyck 1991). The specimen proved to be P. patrius, and
the first described species of pebble-mound mouse was recognised as such 82 years later. A
survey over the next four years revealed a distribution stretching over 1,000km of latitude
in eastern Queensland (Van Dyck and Birch 1996).
5.1.2 ECOLOGY OF PEBBLE-MOUND MICE
Extensive studies of pebble-mound mouse ecology were conducted in conjunction with
molecular studies presented here. They will be reported in detail elsewhere. Ecological
studies aimed to describe habitat preference of all species except P. chapmani, which has
been the subject of some ecological studies due to conflict with mining operations in the
Pilbara (Anstee 1996, Anstee et al. 1997). Variation in mound architecture was of interest
because a role has been proposed for pebble-mounds in mate choice (Cermak 1999), and
100

mounds could therefore impact directly on speciation processes. Population dynamics and
movement of Pseudomys patrius in Hidden Valley, northeast Queensland, were studied
over a four-year period to aid interpretation of genetic results. A brief summary of results is
presented here to establish the contrast between the ecologies of pebble-mound mice and
delicate mice.
Mound architecture, usage and function
Behavioural observations and variation in mound architecture suggest that pebble mounds
primarily perform a defensive function. Mounds are built in and around nesting burrows
(fig. 5.1). Burrow systems can be quite complex, and have multiple entrances. Total weight
of pebble accumulations may be over 50kg, but mounds of that size are likely to be decades
old. Pebbles are gathered from the surrounding ground surface to construct mounds.
Pebbles are used to block burrow entrances upon entering and leaving the nest. This
behaviour, and the fact that mice use pebbles to block damage to the burrow system
establishes the primary role of pebbles to be one of defence. There is no evidence of a role
in insulation, or in sexual selection by either sex.
Variation in pebble mound architecture revealed no species-level preference for a particular
design of mound, rather all pebble mounds consist of the same types of structures (fig. 5.1),
but these vary in number and size between mounds. Variation tends to reflect the local
ecological conditions of a population, age of the mound, and the immediate situation in
which a mound is built. For example, in Hidden Valley mounds tend to consist of two or
three volcano-shaped pebble ramparts around burrow entrances, at least one of which is
usually comprehensively blocked. Larger mounds incorporate other structures such as piles
of pebble with no obvious function, and pebble “stuffing” along cracks in tree roots or
rocks (fig. 5.1). “Stuffing” is used to block apparent routes of entry to the burrow system
under the mound. In other regions where trees and rock outcrop are not common, pebble
mounds tend to be more sprawling structures with sheets of pebbles covering the ground.
However, almost as much variation is generally found within large populations than among
populations from across northern Australia, and identical mound design can be found in
101
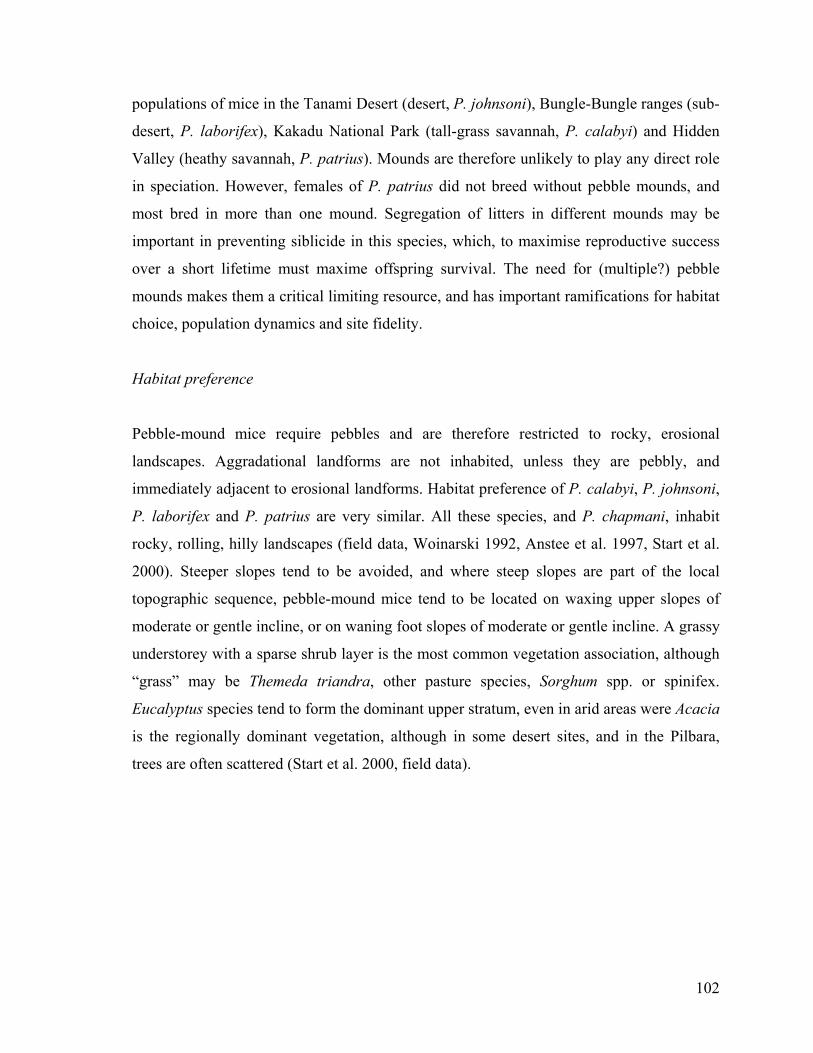
populations of mice in the Tanami Desert (desert, P. johnsoni), Bungle-Bungle ranges (sub-
desert, P. laborifex), Kakadu National Park (tall-grass savannah, P. calabyi) and Hidden
Valley (heathy savannah, P. patrius). Mounds are therefore unlikely to play any direct role
in speciation. However, females of P. patrius did not breed without pebble mounds, and
most bred in more than one mound. Segregation of litters in different mounds may be
important in preventing siblicide in this species, which, to maximise reproductive success
over a short lifetime must maxime offspring survival. The need for (multiple?) pebble
mounds makes them a critical limiting resource, and has important ramifications for habitat
choice, population dynamics and site fidelity.
Habitat preference
Pebble-mound mice require pebbles and are therefore restricted to rocky, erosional
landscapes. Aggradational landforms are not inhabited, unless they are pebbly, and
immediately adjacent to erosional landforms. Habitat preference of P. calabyi, P. johnsoni,
P. laborifex and P. patrius are very similar. All these species, and P. chapmani, inhabit
rocky, rolling, hilly landscapes (field data, Woinarski 1992, Anstee et al. 1997, Start et al.
2000). Steeper slopes tend to be avoided, and where steep slopes are part of the local
topographic sequence, pebble-mound mice tend to be located on waxing upper slopes of
moderate or gentle incline, or on waning foot slopes of moderate or gentle incline. A grassy
understorey with a sparse shrub layer is the most common vegetation association, although
“grass” may be Themeda triandra, other pasture species, Sorghum spp. or spinifex.
Eucalyptus species tend to form the dominant upper stratum, even in arid areas were Acacia
is the regionally dominant vegetation, although in some desert sites, and in the Pilbara,
trees are often scattered (Start et al. 2000, field data).
102

F1cDm
1.
igure 5.1. Images from the l. Underground nest- P. patrius, 2.rack in log)- P. patrius, 3. Radio-ciagram of excavated mound and bound- P. johnsoni, 8. P. patrius d
2.
ife of pebble-mound mice. Mound built around fallen log in buollared P. patrius, 4. Pebble blockaurrow system, 6. Mound at burrow ragging large pebble during mound
3.
5.
8.
7.lldozge in entraconst
4.
6.
er mullock (note “stuffing” along mound-less burrow entrance, 5. nce- P. patrius, 7. Large “carpet” ruction.
103

Vagility
Captures of pebble-mound mice in Hidden Valley were largely restricted to sites at which
mounds were located. However extensive inter-site movement occurs over distances of 1-
3km within homogeneous habitats, particularly among reproductive males. Movements
were never recorded over steeper ranges that isolated populations 2-3km apart. This is
presumably because all recorded long-range movements were by males searching for
mates, and males are unlikely to leave habitats in which females are located. Females
require mounds for breeding and are reluctant to leave sites that contain them.
Population dynamics
Almost ten years of trapping data in Hidden Valley by Cermak (1999) and myself has
recorded a consistent pattern of population cycling, with no major irruptions, and a seasonal
cycle reflecting an annual lifecycle (adult life expectancy ≤1year, significantly less for
males) (fig. 5.2). Start et al. (2000) speculate that P. chapmani is a boom-bust species, but
do not present data of any major population increases, and population irruptions of several
orders of magnitude such as occur in delicate mice species (section 6.1.2) have not been
recorded. Their suggestion that mounds may be a limiting resource suppressing population
booms is almost certainly correct based on my results. Following fire Pseudomys patrius
does not undergo major population booms. In fact, fire has no detectable effect on
population dynamics, even immediately post-fire (fig. 5.2). Start et al. (2000) also noted
that fire did not seem to have a significant effect on populations of P. chapmani. Fire is a
major factor affecting population dynamics of P. delicatulus, P. hermannsburgensis and P.
novaehollandiae (section 6.1.2). The relatively stable population dynamics of P. patrius,
and probably all pebble-mound mice, are attributable to the fact that mound sites are very
long-term stable resources. Good mounds last for decades, possibly centuries, and are
inhabited by successive generations of short-lived mice. Female mice are therefore highly
philopatric, and breeding populations of mice are not mobile. Availability of mounds may
restrict breeding potential, but as a trade-off, most pebble-mound mouse populations appear
to be very stable in the long-term, and I have followed up records of “P. delicatulus” that
were later referred to P. patrius, and found the populations in exactly the same locations as
104

thirty years previously. Location and size of populations of delicate mice species are often
not stable on a monthly basis, let alone longer time-scales (section 6.1.2).
5.2 Geographical sampling for molecular studies
Tissue samples of pebble-mound mice were derived from field studies and museum
collections (table 5.1). Pebble-mound mice occur in 19 bioregions identified by Thackway
and Creswell (1995). The difficulty of adequately sampling the expanding known ranges of
all species meant that the primary aim of sampling was to gain tissue from each of these
bioregions. This was achieved (fig. 5.3). Pseudomys chapmani samples were obtained from
only three sites, but these represent the geographical limits of its range for which samples
were available. Only two sites were sampled for P. calabyi, but the species has only been
recorded from a handful of sites, all within 50km of one or other of the sites sampled here.
Reasonably comprehensive sampling of the known distributions of P. johnsoni, P. laborifex
and P. patrius was achieved.
105

a)
0
5
10
15
20
25
30
Dec Jan Feb Mar Apr May Jun Jul/Aug Sep
Month
b)
0
1
2
3
4
5
6
0 2 4 6 8 11 13 19 21 27 29 31 33 36Months since fire
Figure 5.2. Aspects of population dynamics of Pseudomys patrius. a) Typical population cycling of P. patrius in Hidden Valley. Graph shows period between lowest (pre-breeding) population until maximum population (post juvenile recruitment) for eight 40 trap grids trapped for 3 nights per session (9500 trap nights total). Female non-breeding ; female breeding ; male non-breeding ; male breeding ; sub-adult . b) Effects of fire on pebble-mound mouse populations. Sample size is not shown, but a least squares regression model indicates only season has a significant effect on population size (p<0.000).
106

Table 5.1. Sampling locations and tissue sources for pebble-mound mice. (ABTC)- Australian biological tissue collection with museum voucher; ABTC- no voucher; NTMU- Northern Territory Museum; QMJM- Queensland Museum; WAMM- Western Australian Museum. N= sample size. Sequence ID’s are used to identify individuals from a particular site in results trees. Site Lat. Long. N Type Source/voucher ID’s P. calabyi 1. Kakadu -12.9767 132.5220 3 Tail Field biopsies (M. Watson) c1-3 2. Litchfield -13.4100 130.8972 3 Liver NTMU 4323,4324, ABTC 29492
c5-7
P. chapmani 3. ~LSD -22.4833 122.3000 1 Liver WAMM 40577 ch3 4. LSD -23.8794 120.5033 1 Liver WAMM 44989 ch4 5. Woodstock -21.6958 119.0542 6 Liver (ABTC) WAMM 29440,
29441,29447,29449,32761, 34297 ch1,2,5,6,7
P. johnsoni 6. Helen Springs -18.4978 133.8738 3 Tail Field biopsies (Ford) j1,5,6 7. Kurundi -20.4667 134.4500 2 Liver/Tail Field biopsy (Ford), (ABTC) j8,15 8. Moronan -21.1667 140.9000 3 Liver (ABTC) QMJM 10866,
10867,10868 j10,11,13
9. Muckaty -18.6274 133.9458 1 Tail Field biopsy (Ford)
j16
P. laborifex 10. Gardner R. -19.3334 128.8667 4 Liver ABTC 66290,66291,66292, 66293 l6,7,11, 12 11. Granny Soak -19.1292 128.8919 1 Liver (ABTC) WAMM 51934 l8 12. Gregory NP -15.4917 131.3003 1 Tail Field biopsy (Ford) l18 13. Mitchell Plateau -14.8222 125.8417 5 Liver WAMM 21764,21895, 21962,
ABTC 8095,8136, 8172 l2,3,9,13,14,15
14. Mount Sanford -17.3705 130.8048 3 Liver ABTC 30349,30350,30351 l4,5,10 15. Purnululu -17.3996 128.2717 1 Liver Biopsy (Ford) lodged in WAM l1 16. Victoria R. -15.6170 131.1280 1 Liver ABTC 61616 l23 17. Wickham R. -16.9576 130.4539 7 Liver (ABTC) NTMU 4897,4898,
4899,4900,4901,4902,4903 l16,17, 19,20-22
P. patrius 18. Burra Range -20.5674 145.0967 5 Tail Field biopsies (Ford) p6,12,
13,18,37 19. Goondicum -24.8670 151.4330 1 Tail Field biopsy (Ford) p62 20. Hidden Valley -19.0028 146.0705 10 Liver/Tail Field biopsies (Ford), QMJM 10865 p1,4,10, 38-
40,46, 47,51, 86
21. Many Peaks -24.5667 151.3000 1 Liver QMJM 11940 p134 22. Marodian -25.9662 152.0900 10 Liver/Tail Field biopsies (Ford), QMJM 11271 p7,20-27 23. Minnerva Hills -24.0995 148.0429 6 Tail Field biopsies (Ford) p8,14,28-31 24. Mount Britton -21.3948 148.5229 2 Tail Field biopsies (Ford) p59,60 25. Mount Moffat -25.0333 147.8833 1 Liver QMJM 12735 p135 26. Mount Pollux -22.4764 147.8705 6 Tail Field biopsies (Ford) p11,15,
16,17,33,34
107

Figure 5.3. Distribution of pebble-mound mDistributions based on Start et al. (2000), Van Dyclocalities. Numbers refer to population numbers givP. johnsoni ; P. laborifex ; P. patrius but good sequence was not obtained. The populatio
5.3 Molecular divergence among pebble
5.3.1 MITOCHONDRIAL CONTROL REGION
Nuclear pseudogenes
Sequences obtained from tail tips of Pse
peaks at single nucleotide locations (fig. 5
to be interpretable. There was an obviou
individuals in both the primary signal, ass
1
2 34
5
ik aen n h
-m
ud
.4)
s
um
6
cend in as
o
o
.
s
e
79
and sam Birch (19 table 5.1.
. Tissue been iden
und mou
mys patr
These pe
imilarity
d to be t
8
10 11126
1417
15
1
13pling loc96), field o P. calabyi was availatified as bo
se popul
ius cons
aks often
between
he true m
18
ations. bservations ; ble for Bauth P. johns
ations
istently e
made se
sequenc
itochond
19
20
Pho
x
q
e
ri
21
2223
24
25
26
and sampling . chapmani ; inia Downs ( ) ni and P. laborifex.
hibited multiple
uences too noisy
s from different
al sequence, and
108
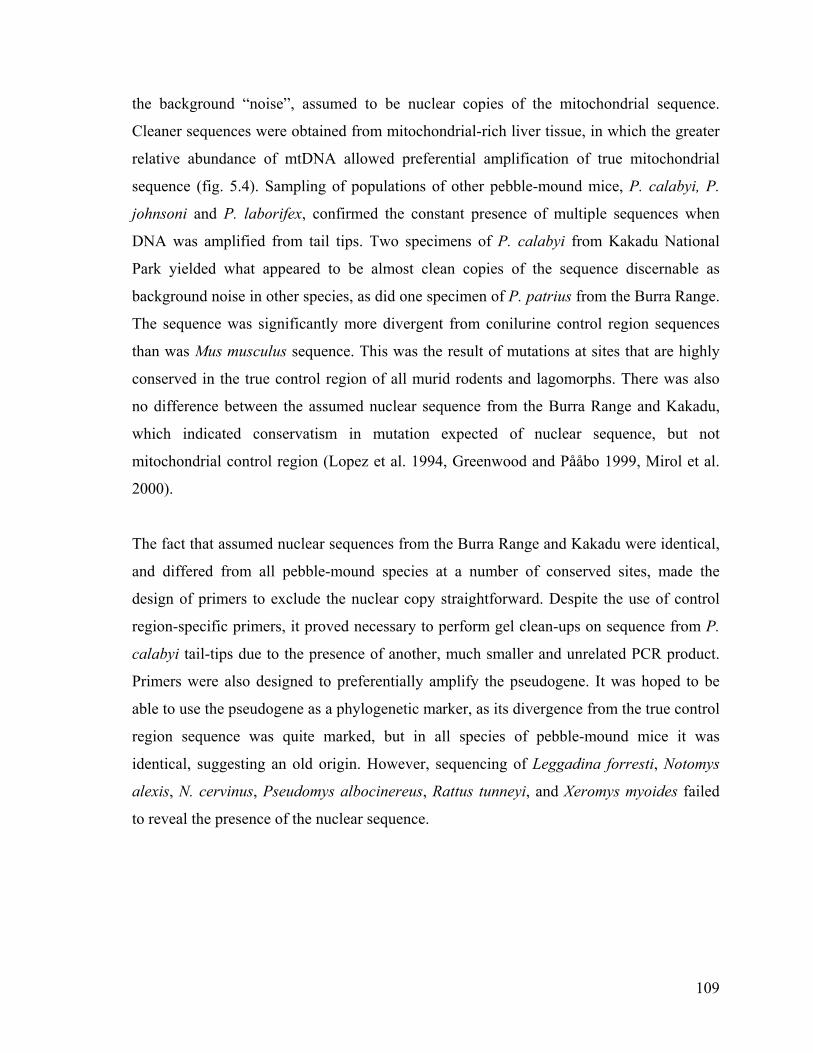
the background “noise”, assumed to be nuclear copies of the mitochondrial sequence.
Cleaner sequences were obtained from mitochondrial-rich liver tissue, in which the greater
relative abundance of mtDNA allowed preferential amplification of true mitochondrial
sequence (fig. 5.4). Sampling of populations of other pebble-mound mice, P. calabyi, P.
johnsoni and P. laborifex, confirmed the constant presence of multiple sequences when
DNA was amplified from tail tips. Two specimens of P. calabyi from Kakadu National
Park yielded what appeared to be almost clean copies of the sequence discernable as
background noise in other species, as did one specimen of P. patrius from the Burra Range.
The sequence was significantly more divergent from conilurine control region sequences
than was Mus musculus sequence. This was the result of mutations at sites that are highly
conserved in the true control region of all murid rodents and lagomorphs. There was also
no difference between the assumed nuclear sequence from the Burra Range and Kakadu,
which indicated conservatism in mutation expected of nuclear sequence, but not
mitochondrial control region (Lopez et al. 1994, Greenwood and Pååbo 1999, Mirol et al.
2000).
The fact that assumed nuclear sequences from the Burra Range and Kakadu were identical,
and differed from all pebble-mound species at a number of conserved sites, made the
design of primers to exclude the nuclear copy straightforward. Despite the use of control
region-specific primers, it proved necessary to perform gel clean-ups on sequence from P.
calabyi tail-tips due to the presence of another, much smaller and unrelated PCR product.
Primers were also designed to preferentially amplify the pseudogene. It was hoped to be
able to use the pseudogene as a phylogenetic marker, as its divergence from the true control
region sequence was quite marked, but in all species of pebble-mound mice it was
identical, suggesting an old origin. However, sequencing of Leggadina forresti, Notomys
alexis, N. cervinus, Pseudomys albocinereus, Rattus tunneyi, and Xeromys myoides failed
to reveal the presence of the nuclear sequence.
109

P. patrius, Hidden Valley, tail.
P. patrius, Hidden Valley, liver.
P. calabyi, Kakadu, tail.
P. patrius, Hidden Valley, tail, nuclear copy primers.
P. patrius, Hidden Valley, tail, control region primers.
Figure 5.4. Nuclear copy and true mitochondrial sequence from pebble-mound mice. Forty-seven bp are shown that exemplify the nature of a pseudogene isolated from pebble-mound mice. Green- A; blue- C; black- G; red- T. The top three sequences were obtained using general murid primers. The bottom two sequences were obtained using primers designed by the author. Note in particular the three “C” peaks that dominate nuclear copy amplified from both P. calabyi and P. patrius. In sequence from tail these peaks are of similar amplitude to true control region sequence, in sequence derived from liver the peaks are reduced to background noise, and using pseudogene-excluding primers they are not present. Several other sites show a similar pattern. Electropherogram signal strength is shown to scale, and as expected, is significantly stronger in “true” sequences.
Control region
Four major clades of pebble-mound mouse control region haplotypes are present across
northern Australia (figs. 5.5 and 5.6). Aligned sequences were shorter than for other study
groups (chapters 7-9) and for the general conilurine phylogeny (chapter 4) because of the
use of pseudogene-excluding primers. Sequences were 336bp in length, including 71
variable sites (65 parsimony-informative). Each clade is separated from the others by
110

significant Kimura two-parameter distance in a well-resolved bootstrapped tree (fig. 5.5;
minimum evolution score: 0.38351). Haplotypes from individuals of Pseudomys calabyi, P.
chapmani and P. patrius cluster into tight groupings conforming to current species
definitions. All remaining haplotypes belong to a single lineage that incorporates
individuals currently described as P. johnsoni, P. laborifex and Pseudomys sp. of Van Dyck
and Birch (1996). This lineage also includes new populations of mice from the VRD that
have been assigned to P. laborifex. Within this clade three distinct lineages are identified in
distance analysis; P. johnsoni and Pseudomys sp. from the central Northern Territory and
western Queensland, P. laborifex from the Kimberley as described by Kitchener and
Humphries (1986) (populations 10, 13 and 15 in fig. 5.3), and new populations of “P.
laborifex” identified from the VRD (populations 11, 12, 14, 16, 17). Relationships
identified by distance analysis are upheld by a bootstrapped maximum-likelihood tree (fig.
5.6; likelihood score: -ln 1134.53589; substitution model: TIM+I+G (A 0.3294; C 0.0646;
G 0.1989; T 0.4071) Nst=6 Rmat=(A-C 1.0000; A-G 9.1980; A-T 0.3403; C-G 0.3403; C-T
4.0186; G-T 1.000) Rates=gamma Shape=1.8345). Pseudomys calabyi, P. chapmani and
P. johnsoni/laborifex are all supported at above 98%. Within the P. johnsoni/laborifex
clade the three internal clades identified by distance analysis are apparent, but only the
VRD and P. johnsoni clades have bootstrap support. The likelihood tree taken from PAUP*
placed the P. laborifex (Kimberley) clade basal to “P. johnsoni” and “P. laborifex (VRD)”,
but not as a monophyletic clade. However monophyly is enforced in figure 5.6 because
long branch lengths to other species, combined with few mutational differences within the
P. johnsoni/laborifex clade creates doubt about the basal placement of this clade, as does
the likely manner of its evolution (section 5.4.3). The trees were of the same length.
111

p37p135p59p13
p8p25
p62
p26
p22p33
p11
ch4
ch3
0.005 substitutions/site
s
l13
l7l1
l14
Figure 5.5. Genetic distance betwUnrooted neighbour-joining tree of Kimuisolated from 87 individuals. Taxon labeSpecies boundaries proposed in this thesare shown as broken circles. Node labels
P. chapmani
c2
c1
c6c7
ch5 ch8ch6ch7
ch1
P. patriu
l8l20
l17l18
j13j16j6
j11
l9
een 35 pebble-mound mouse control rera two-parameter distance estimates for 36 ha
ls correspond to one individual that carried a pis are shown as solid circles, currently describ= bootstrap support for major nodes based on
P. calabyi
“P. johnsoni”
100
98
9789
54
7290
93
100gion happlotypes oarticular hed species 100 replic
100
81
100
55 66 9599
P. johnsoniP.laborifex
lotypes. f 336bp aplotype. boundaries ates.
112
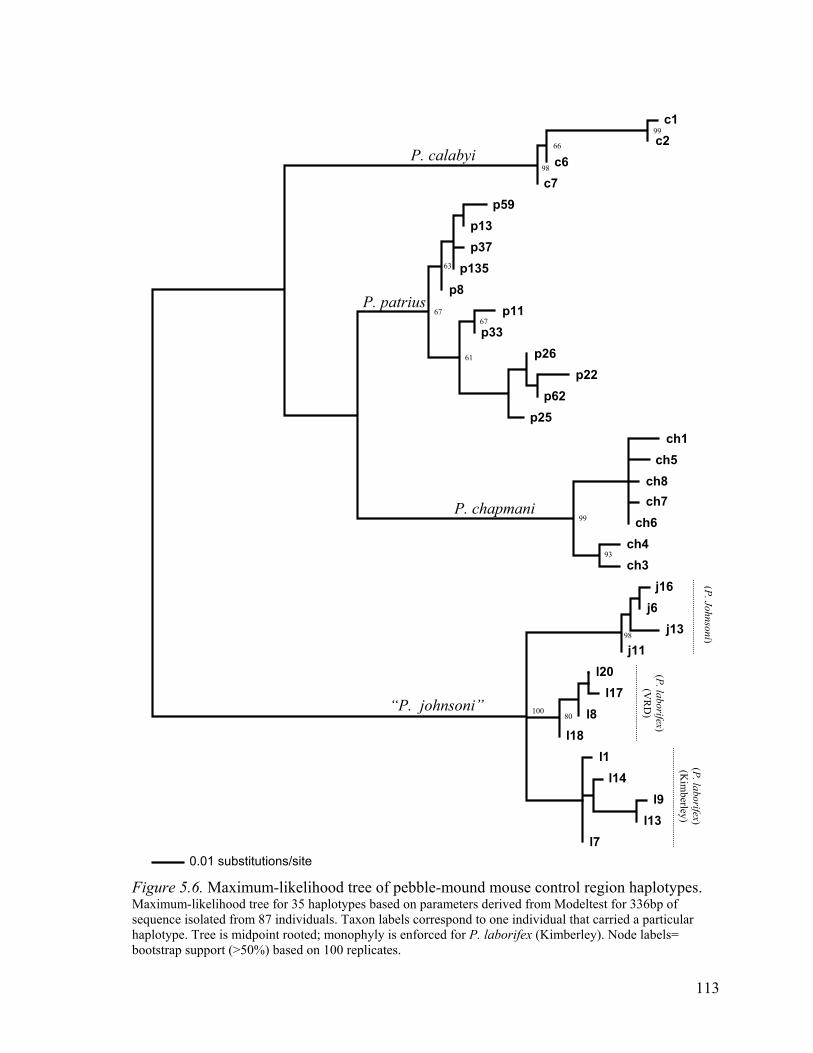
c1c2
c6c7
p59p13p37
p135p8
p11p33
p26p22
p62p25
ch1ch5
ch8ch7
ch6ch4ch3
j16j6
j13j11
l20l17
0.01 substitutions/site
(P. laborif(V
RD
)
(P. Johnsoni)
98
66
99
67
61
67
63
99
93
100
98
Figure 5.6. Maximum-likelihood tree oMaximum-likelihood tree for 35 haplotypes basequence isolated from 87 individuals. Taxon lhaplotype. Tree is midpoint rooted; monophylybootstrap support (>50%) based on 100 replica
“P. johnsoni”
P. patrius
f pebble-msed on paramabels corresp is enforcedtes.
P. chapmani
P. calabyi
l8l18
l1l14
l9l13
l7
(P. laborifex) (K
imberley)
ex)
80
ound mouse control region haplotypes. eters derived from Modeltest for 336bp of ond to one individual that carried a particular
for P. laborifex (Kimberley). Node labels=
113

5.3.2 NUCLEAR INTRONS
In species-level phylogenies using the DHFR intron 1 locus the pebble-mound mice
exhibited sufficient genetic diversity to warrant further use of the marker to examine
relationships within the group. Heterozygosity at the locus was low among sequenced
individuals, and only a few bases appeared to differ between homozygotes (fig. 5.7). The
DHFR locus confirms results suggested by control region analysis. Individuals belonging to
P. calabyi, P. chapmani and P. patrius are slightly divergent from each other (one or two
bp differences), whereas individuals belonging to P. johnsoni and P. laborifex show little
variation at the DHFR intron 1 locus across an extensive geographical range. Three fixed
mutations and two deletions (totalling 4bp) separate the P. johnsoni/laborifex lineage from
the other pebble-mound mice (fig. 5.7). Phylogenetic inferences beyond this are unreliable
due to the limited number of variable sites. However, P. calabyi and P. chapmani share two
fixed mutations that are not present in P. patrius.
One individual of P. laborifex yielded a unique DHFR intron 1 sequence, more similar to
that of P. patrius than other species, and lacking the deletions that characterise the P.
johnsoni/laborifex clade. Unfortunately the origin of the specimen is not clear, and it may
have been derived from captive stock that had the opportunity for cross breeding with P.
calabyi. Two other alternatives are possible; the specimen is a wild hybrid and was
collected from the northern margins of the distribution of P. laborifex, close to the known
distribution of P. calabyi, or the sequence derived from that individual was true DHFR
intron 1 sequence, and the other nine individuals yielded a very similar but incorrect
product. The latter case is unlikely as all sequences were carefully separated during gel
clean-ups, and no signs of other product or background signal were apparent in sequences.
Because of these issues, sequence from the individual in question is not shown in figure
5.7, but the origin of the animal and the possibility of natural crossbreeding or confounding
genetic products are under investigation.
114

p46-Hidden AAAATATGGGCATTGGCAAGAACGGAGACCTGCCCTGGCCTCTGCTCAGGTACGGGCTGGGCTGGGCGGGGGAAATCGAGGCGGTTCACTGAGTAGGGTC p24-Marodian ---------------------------------------------------------------------------------------------------- ch7-LSD ----------------------------------------------------------------------------T----------------------- ch4-Woodstock ----------------------------------------------------------------------------T----------------------- c3-Kakadu ---------------------------------------------------------------------------------------------------- c6-Lichfield ----------------------------------------------------------------------------N----------------------- j8-Kurundi ----------------------------------------------------------------------------T----------------------- j10-Moronan ----------------------------------------------------------------------------T----------------------- l3-Mitchell ----------------------------------------------------------------------------T----------------------- l7-Gardner -----------------------------------------------------------------------N----T----------------------- l11-Gardner ----------------------------------------------------------------------------T----------------------- l12-Gardner ----------------------------------------------------------------------------T----------------------- l23-VicRiver ----------------------------------------------------------------------------T----------------------- l5-MtSandford ----------------------------------------------------------------------------T----------------------- l8-Granny ----------------------------------------------------------------------------T----------------------- p46-Hidden GATCATTTGCCTTGGACGCACAGGCCGACCTGCTTGGAGTCGGGTCTAAGTGGATAGGCCCTGCCGGCTTCAGCAAGAGGCAAAGCTACTGCTGCCCGCG p24-Marodian ---------------------------------------------------------------------------------------------------- ch7-LSD -------------------------------------------------C-------------------------------------------------- ch4-Woodstock -------------------------------------------------C-------------------------------------------------- c3-Kakadu -------------------------------------------------C-------------------------------------------------- c6-Lichfield -------------------------------------------------C-------------------------------------------------- j8-Kurundi --------------------------A-----------N------------------------------------------------------------- j10-Moronan --------------------------A------------------------------------------------------------------------- l3-Mitchell --------------------------A------------------------------------------------------------------------- l7-Gardner --------------------------A------------------------------------------------------------------------- l11-Gardner --------------------------A------------------------------------------------------------------------- l12-Gardner --------------------------A------------------------------------------------------------------------- l23-VicRiver --------------------------A------------------------------------------------------------------------- l5-MtSandford --------------------------A------------------------------------------------------------------------- l8-Granny --------------------------A------------------------------------------------------------------------- p46-Hidden GTGATCCCCCTGCCGTGCCAGCCTTTGCTCACAGGCTCCCTGGCCGGGAACAAAGTCCAGTCACTGGGCAGGCAGCAACACCACCACCCCCACACCGGGA p24-Marodian ---------------------------------------------------------------------------------------------------G ch7-LSD ---------------------------------------------------------------------------------------------------G ch4-Woodstock ---------------------------------------------------------------------------------------------------G c3-Kakadu -------------------------------------------------------------------------------------C---------T---G c6-Lichfield -----------------------------------------------------------------------------------------------N---G j8-Kurundi --------------C------------------------------------------------------------------------------------G j10-Moronan --------------C------------------------------------------------------------------------------------G l3-Mitchell --------------C-----------------------------------------------------N------------------------------G l7-Gardner --------------C------------------------------------------------------------------------------------G l11-Gardner --------------C------------------------------------------------------------------------------------G l12-Gardner --------------C---------------------------------------------------------------------------------N--G l23-VicRiver --------------C------------------------------------------------------------------------------------G l5-MtSandford --------T---T-C------------------------------------------------------------------------------------G l8-Granny --------------C---------------------------------------------------------------------------------N--G p46-Hidden CTTGCACCTTTCGCCGCTGACTTGAGCCTGAGCACACGTGACAGGGATTAACGCAGCGTTTCTCCTAACTTTCAGGAATGAGTTCAAGTACTT p24-Marodian --------------------------------------------------------------------------------------------- ch7-LSD ----------------------------------------------------------------T---------------------------- ch4-Woodstock ----------------------------------------------------------------T---------------------------- c3-Kakadu ----------------------------------------------------------------T---------------------------- c6-Lichfield ----------------------------------------------------------------T---------------------------- j8-Kurundi --------------------------------------------------------T------------------------------------ j10-Moronan --------------------------------------------------------T------------------------------------ l3-Mitchell --------------------------------------------------------T------------------------------------ l7-Gardner --------------------------------------------------------T------------------------------------ l11-Gardner --------------------------------------------------------T------------------------------------ l12-Gardner ----------------------------------------------------N---T------------------------------------ l23-VicRiver --------------------------------------------------------T------------------------------------ l5-MtSandford --------------------------------------------------------T------------------------------------ l8-Granny --------------------------------------------------------T------------------------------------
Figure 5.7. Alignment of DHFR intron 1 sequence from fifteen pebble-mound mice. Codes represent a single individual and its site of origin. cx- P. calabyi; chx- P. chapmani; jx- P. johnsoni; lx- P. laborifex; px- P. patrius. N is recorded for ambiguous sites in heterozygote individuals.
5.4 Evolution of the pebble-mound mice
5.4.1 HOW MANY SPECIES OF PEBBLE-MOUND MICE ARE THERE?
On the basis of results presented in section 5.3 there is probably only four species of
pebble-mound mice; P. calabyi, P. chapmani, P. johnsoni and P. patrius. This conclusion
is based on the relatively small genetic distances separating control region clades within the
P. johnsoni/laborifex clade, the probable very recent origin of these clades (section 5.4.3),
115

and the fact that populations of P. laborifex sampled in this study do not form a clade to the
exclusion of P. johnsoni. Lack of DHFR variation also indicates a recent shared ancestry of
the three taxa in the P. johnsoni clade. Pseudomys johnsoni, P. laborifex (Kimberley) and
P. laborifex (VRD) could be viewed as subspecies, and the names P. johnsoni johnsoni, P.
j. laborifex (Kimberley lineage) and P. j. kitcheneri (VRD) will be proposed. The naming
of a form after Daryl Kitchener is appropriate, as he was primary author of the description
or re-description of five taxa studied in this thesis, including P. johnsoni and P. laborifex.
Maximum inter-clade distances within the P. johnsoni lineage (6.64% “johnsoni” vs.
Kimberley and 5.31% “johnsoni” vs. VRD) are less than almost all minimum interspecies
differences between other pebble-mound mice (minimum distance between two individuals
of other species 6% P. chapmani vs. P. patrius), and average pair-wise differences are
significantly less than those between other species (table 5.1). However, other species of
pebble-mound mice have far more isolated geographical distributions when compared to
each other than do members of the P. johnsoni clade, and relative mtDNA distances are
possibly not a useful indicator of species boundaries within P. johnsoni.
Table 5.2. Inter-taxon control region divergence among pebble-mound mice. Distances based on average pair-wise Kimura two-parameter distances. Species shown at upper left, proposed subspecies lower right. Based on 336bp sequences. “P. johnsoni” in species comparisons refers to all members of the P. johnsoni/laborifex lineage, in subspecies comparisons “P. johnsoni” refers only to the currently recognised taxon.
P. calabyi P. chapmani P. patrius P. johnsoni P. laborifex (Kimberley)
P. laborifex (VRD)
P. calabyi - P. chapmani 10.55% -
P. patrius 8.15% 7.16% - P. johnsoni 11.91% 12.97% 10.39% -
P. laborifex (Kimberley)
4.84% -
P. laborifex (VRD)
4.09% 2.86% -
5.4.2 GEOGRAPHICAL DISTRIBUTION OF PEBBLE-MOUND MOUSE CLADES AND SPECIES
116

The known distributions of the four major pebble-mound mouse control region clades are
all allopatric (fig. 5.8). Figure 5.9 shows the distribution of three major soil types. Known
occurrences of pebble-mound mice map almost perfectly onto the distribution of “shallow
rocky soils”. “Cracking clays” and “deep sand” typify areas in which pebble-mound mice
are conspicuously absent. The combination of these maps and known distributions of
pebble-mound mice suggests that the limits of the distribution of most species are probably
already known. However, in my opinion there is little indication that P. calabyi should not
be found throughout much of Arnhem Land, and the presence of P. johnsoni on the Gulf
Fall indicates that the two species could be in contact throughout the mid-south of the Top
End (fig. 5.8). The distribution of P. patrius possibly includes large areas of Cape York
from which it has not yet been recorded. Geographical isolation of P. chapmani in the
Pilbara/Gascoyne and P. patrius in the eastern highlands of Queensland is probably real, as
they are isolated by deep sands of the Great Sandy Desert (P. chapmani) and cracking clays
of the Carpentarian plains (P. patrius) (fig. 5.9). The geographical separation of P. calabyi
from P. johnsoni (including P. laborifex) is doubtful. Two hundred kilometres currently
separates the closest known populations of these two species, Depot Creek (P. calabyi) and
Gregory NP north (“P. laborifex” (VRD)). The landscape between these sites is generally
rocky hills, although the Daly River basin bisects the gap between the taxa, and may prove
to be an isolating barrier. Within the P. johnsoni/laborifex clade the known distribution of
“P. johnsoni” is separated from “P. laborifex” (Kimberley) and “P. laborifex” (VRD) by
the dune fields of the northern Tanami, but is probably more continuous than currently
known. Unlike the situation with P. chapmani and P. patrius, soils between these areas are
not in unsuitable groups, and the intervening gap in figure 5.9 is benign compared to the
deep sands and cracking clays. The two clades of “P. laborifex” are largely restricted to the
east or west of the WA-NT border region, but are almost certainly in contact in the Gardner
Range (less than 20km between known sites) in the northwest Tanami Desert.
117

Figure 5.8. Geographical distribution of pebble-mound mouse coP. calabyi ; P. chapmani ; P. johnsoni ; P. patrius . Daboundaries between major intra-specific clades of “P. johnsoni”.
Figure 5.9. Major soil type and the distribution of pebble-moundSoils shown black are “shallow stony” soils associated with pebble-mound mored; cracking clays- blue. Maps based on Taylor and Eggleton (2001). 5.4.3 POPULATION DIVERGENCE AMONG PEBBLE-MOUND MICE
ch4
ch3
ch5 ch8ch6ch7
ch1
c2
c1
c6c7
l8l20
l17l18
j13j16j6
j11
l9l13
l7l1
l14
p37p135p59p13
p8p25
p62
p26
p22p33
p11
?
ns
mu
?
trohe
icse
??
?
?d
l region clades. lines indicate roughe. populations. Deep sands-
118

One of the obvious features of the evolution of pebble-mound mice that begs explanation is
how P. patrius and P. chapmani were able to colonise the areas they now inhabit, given
that there are substantial rock-free barriers between them and other pebble-mound mice. In
both cases, the underlying topography has an origin as a flat plain pre-dating the entry of
rodents to Australia by millions of years (section 2.3.3), so how did these species of rocky
hills cross such areas? I believe the answer cannot lie in a change of habitat preference or
one-off migration event. The behavioural compulsion displayed by pebble-mound mice to
build pebble mounds is too strong a limiting factor, and the distances between pebble-free
habitats are too great. Obviously this must not have always been the case. In lieu of the
rugged, rocky, ranges that typify many parts of the distribution of pebble-mound mice, I
propose that eroding lateritic surfaces such as once covered the Mitchell Grass Downs and
areas of the present day Great Sandy Desert may have provided an avenue for continuous
habitation by pebble-mound mice (Twidale 1956, Beard and Webb 1974, Coventry et al.
1980).
The degradation of the rock-like lateritic surfaces in the Mitchell Grass Downs is almost
complete, with a few remnants found near Kynuna and Winton (Learmonth and Learmonth
1971). These hills harbour the only populations of the rock-dwelling Zyzomys argurus
found in western Queensland (QLD museum records). Equivalent lateritic surfaces occur to
the east of the Mitchell Grass Downs, which are likely to be part of the same deeply-
weathered Tertiary surface, although establishing the relative stratigraphy of such surfaces
is difficult (Beard and Webb 1974, Twidale and Campbell 1995, Twidale and Bourne
2001). Much larger lateritic plateaux remain in the Great Sandy Desert because fluvial
erosion, such as stripped the Mitchell Grass Downs surface, ceased in the early-mid?
Pleistocene (Beard and Webb 1974, Palaeogeographic Group 1990). Lateritic surfaces are
often utilised by pebble-mound mice, particularly P. johnsoni, because ferricrete pebbles
produced by the degrading surface are ideal for constructing pebble-mounds. They are
preferred to quartzite pebbles derived from the parent rock along the edge of the Tanami
Desert (field data). The timing of degradation of lateritic surfaces is difficult to establish.
However, rates of planation at the eastern margin of the Mitchell Grass Downs suggest that
20 metres of material has been lost in the last million years (Coventry et al. 1985). In
119
central Australia some lateritic mesas used by P. johnsoni stand only 10m above the
surrounding sand plain, and the Kynuna-Winton Hills are often in the range 20-30m above
the plains. Rocky contact was probably possible between eastern and western Queensland
until at least the early Pleistocene. Similar dates are probably relevant to the Great Sandy
Desert, although the underlying topography of the region has been partly covered by the
modern sand sheet (section 2.3.3), and a more complex interaction of aridity, sand, and
degradation of laterites may have been responsible for isolation of that region.
The most intriguing feature of pebble-mound mouse relationships is the juxtaposition of the
P. johnsoni clade in the Kimberley and VRD. A sib-taxon relationship is expected between
the Top End and these regions. This is true of Leggadina lakedownensis populations (Moro
et al. 1998), and at least sixteen sub-specific or specific sib-taxa among birds (Ford 1978).
Pseudomys calabyi and P. laborifex have been cited as an example of such a relationship
(Woinarski 1992). However, DNA sequences indicate that they are not sibs. The fact that
the (probably/nearly) parapatric P. calabyi and P. johnsoni are more genetically distinct
than P. calabyi, P. chapmani and P. patrius are from each other indicates that evolution of
pebble-mound mice in northern and central Australia has not been a simple process of
isolation in response to topographic/geological change, and suggests a role for more
dynamic processes attributable to climatic change.
To investigate the origin of isolation and intraspecific evolution of P. patrius, and to
reconcile the geographical distribution of P. johnsoni with the environmental history of
northern and central Australia, nested clade analysis (section 1.3 and 3.1.3) was performed
on these two taxa. A bioregional sampling strategy of P. calabyi and P. chapmani tissues
(section 5.2) means that little can be said of the phylogeographic structure within these
species, although the distance between P. calabyi haplotypes from Litchfield and Kakadu
National Parks appears to be high given the relatively small distance between them
(200km), and suggests that with the discovery of further populations of this species a
detailed phylogeographic study is warranted.
Pseudomys johnsoni
120
The nested clade diagram (fig. 5.10) shows tight clustering of haplotypes belonging to the
major clades within P. johnsoni. There is strong geographical association of related
haplotypes. However, clades 1-5, 1-6 and 1-20 are all found in the Gardner Range, despite
the fact that clade 1-20 is in a different 2- and 3-step clade to the other two (because “P.
laborifex” (Kimberley) and “P. laborifex” (VRD) are both found in the Gardner Range.
Exact contingency tests revealed significant effects in clades 4-1 (χ2 15; p= 0.009) and 4-2
(χ2 16; p= 0.000) of the nested haplotype network. These represent a rejection of the null
hypothesis of no geographical association of haplotypes. Significant effects detected in
clades 4-1 and 4-2 equated to contiguous range expansion across the known distribution of
the species, which is evident from the lack of genetic diversity across large areas. The lack
of geographical sampling in areas between Helen Springs and the VRD creates some
ambiguity in results regarding the relationship between these areas, as it is not clear
whether mice are absent from the region. Extensive dune systems are found in the northern
Tanami Desert between the VRD and Helen Springs, but areas to the north of the Tanami
are likely to contain populations of pebble-mound mice that reduce the geographical
distance between the clades. At a higher level, evidence of fragmentation operating
between major clades was suggested by a significant result for the entire cladogram (χ2 23;
p= 0.000). However, the clade diagram does not identify the major clades within P.
johnsoni, so it is not clear what the relevance of this result is. Fragmentation or
bottlenecking leading to the three major clades of P. johnsoni is, however, an obvious
interpretation of the distance tree and haplotype network that warrants further investigation
when the full distributions of species are known.
The direction of the initial range expansion in this species is somewhat speculative. The
distinctness of the P. johnsoni clade when compared to the remaining pebble-mound mice
would suggest that the lineage did not originate in the Kimberley or VRD, or it would
presumably be more similar to P. calabyi. However, there is an unavoidable circularity in
this argument. In an effort to test the reliability of accepted area relationships and
evolutionary patterns the unexpected relationship between P. johnsoni and P. calabyi
cannot be taken as evidence of an origin elsewhere. Possible fragmentation of the species’
121

range is more straightforward. Many species share a sub-specific division on either side of
the Ord arid intrusion that separates the Kimberley and VRD (Ford 1978). This indicates a
surprising susceptibility of P. johnsoni to increased aridity given the arid conditions now
inhabited by the species. Bottlenecks that apparently severely reduced genetic diversity in
the Kimberley and VRD clades probably indicate a northwards contraction of these
populations to the Mitchell Plateau and far northern VRD during the LGM, when evidence
of heightened aridity is found through much of the central Kimberley (Jennings 1975,
Wende et al. 1997). To the east it is likely that the species range contracted northward to
the Gulf Fall, which would have been the least arid part of the current eastern distribution
of P. johnsoni. However, the Davenport Ranges, which are a noted refuge area (Morton et
al. 1996), or the Mount Isa Inlier, are possible sites of the bottleneck that gave rise to “P.
johnsoni”. Subsequent range expansion has lead to few haplotypes in any clade, differing
by only a few mutations, being distributed over distances of 1000km or more. It is therefore
likely the bottleneck of each clade involved only a single refuge area.
122
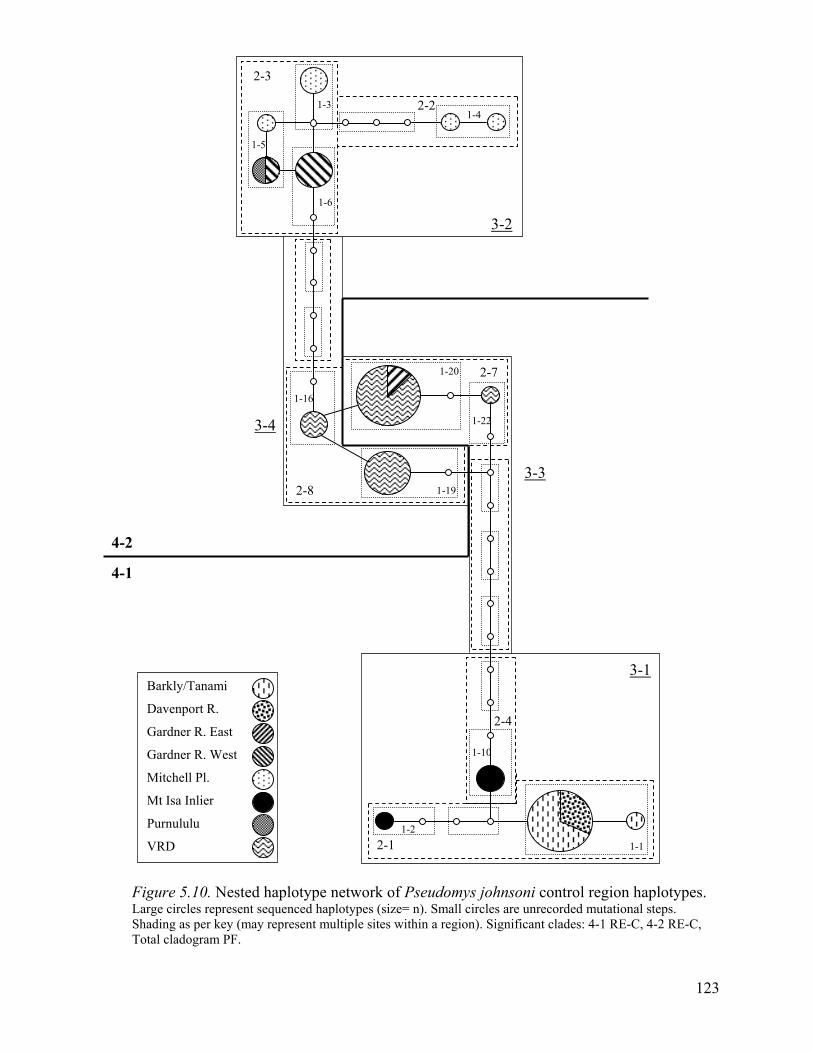
2-1
4-2
4-1
3-2
3-1
3-3
3-4
2-2
2-3
2-4
2-7
2-8
1-4 1-3
1-5
1-6
1-1 1-2
1-10
1-16
1-20
1-19
1-22
Barkly/Tanami
Davenport R.
Gardner R. East
Gardner R. West
Mitchell Pl.
Mt Isa Inlier
Purnululu
VRD
Figure 5.10. Nested haplotype network of Pseudomys johnsoni control region haplotypes. Large circles represent sequenced haplotypes (size= n). Small circles are unrecorded mutational steps. Shading as per key (may represent multiple sites within a region). Significant clades: 4-1 RE-C, 4-2 RE-C, Total cladogram PF.
123

Topographic constraints on the distribution of Pseudomys johnsoni
Given that P. johnsoni inhabits environments ranging from deserts of the northern arid zone
to tropical savannah it is of interest what is constraining, or has constrained, the expansion
of the species’ distribution. Bioclimatic modelling based on the limited site data available
shows that the southern distribution limit of the species may be climatically controlled (fig.
5.11). However, the eastern and western limits are the result of topographic and geological
influence. Ideal climatic conditions for the species exist in areas of the Great Sandy Desert
and on the clay plains of the Mitchell Grass Downs.
Figure 5Dotted lineDesert andpopulationthis thesis
GSD
.11. BIOCLIM prediction of the distribution of Pseudomys separate control region clades. Arrows show climatic prediction of the Mitchell Grass Downs. Red shading is predicted range based ons used in modelling. The population near the Gulf of Carpentaria wabeyond identification to species level. Shading represents 250m asl
MGD
s johnsoni. occurrence in the Great Sandy climate. Dots represent s not successfully sequenced in contours.
124

Pseudomys patrius
Eleven haplotypes were isolated from 42 P. patrius individuals. Two shallow clades were
apparent in distance analysis, and nested clade analysis also identifies these two clades (fig.
5.12). One is restricted to sites in southeast Queensland. This clade appears to have had a
static distribution with evidence of isolation by distance suggested by nested clade analysis
(clade 2-2; χ2 9; p= 0.030). Compared to the restricted south-eastern clade, there is only
marginally more genetic variability across the remainder of the species distribution, which
includes areas stretching over 1000km from the sandstone belt in south-central Queensland
to areas north of Hidden Valley in north Queensland. A single population at Marodian, in
the south-eastern clade, contained three haplotypes separated by up to seven mutations.
Populations in the north tend to contain only one or two closely related haplotypes, and
these are shared between sites hundreds of kilometres apart. Such a pattern is indicative of
range expansion through much of eastern Queensland, and that is the result yielded by
nested clade analysis (clade 1-4; χ2 20.417; p= 0.046: clade 3-1; χ2 29;p= 0.000) (fig. 5.12).
The origin of the two major clades is possibly previous fragmentation of the species’
distribution, although nested clade analysis could not distinguish between fragmentation
and contemporary IBD, but did detect a significant geographical association of haplotypes
for the entire cladogram (χ2 20.1; p= 0.043).
The fact that P. patrius is highly mobile over evolutionary timescales is of interest given
the habitat fidelity shown by the species on a local scale in Hidden Valley. This is
particularly so given that mitochondrial movements are the result of female movement, and
females are highly philopatric. The fact that the species could (re)colonise such a large area
is attributable to the reasonably continuous nature of rocky ranges in the eastern highlands.
The widespread distribution of haplotypes also suggests that the contemporary distribution
of the species is probably fairly continuous throughout suitable habitats of the highlands.
125

1-2
1-8
1-9
1-5
1-3 1-6
1-4
1-1
1-7 2-1
2-3
2-2
2-5
3-1
3-2
Burra Range
Goondicum
Hidden Valley
Many Peaks
Marodian
Minnerva Hills
Mount Britton
Mount Moffat
Mount Pollox
Figure 5.12. Nested haplotype network of Pseudomys patrius control region haplotypes. Large circles represent sequenced haplotypes (size= n). Small circles are unrecorded mutational steps. Shading as per key. Significant clades: 1-4 RE-C, 2-2 IBD or LDD, 3-1 RE-C, Total cladogram IBD or PF (see text for full explanation).
126
Low intra-specific genetic diversity of P. patrius compared to long inter-species genetic
distances suggests that population extinction has been an important process in this species,
just as in P. johnsoni. Northern parts of the species’ current distribution have always been
topographically suitable for the species, and a role for climatic change is again implicated
in the evolution of P. patrius. Aridity is the likely cause of population extinctions through
central Queensland. The extent of arid conditions during the LGM reached at least to the
Townsville region where hopping mouse fossils have been found dating from the LGM
(Aplin pers. comm.). Much of the area currently occupied by P. patrius would have been
desert 20ka. Pseudomys patrius is currently sympatric with the eastern-most populations of
P. desertor, which is also presumably indicative of a recent history of aridity at those sites.
Thus, the apparently stable south-eastern populations of P. patrius affected by IBD, and not
range expansion, are probably in a region not affected by aridity. Re-invasion of much of
the species’ range has probably occurred only in the last 16ky or so. Populations closer to
the central Queensland coast recorded by Troughton (1941) and Finlayson (1942) could
prove of interest, as they may not have been affected by aridity.
5.4.4 SPECULATIVE HISTORY OF THE PEBBLE-MOUND MICE
The current distributions of pebble-mound mice do not seem to reflect the probable history
of speciation in the group. Isolation of P. patrius is an obvious cause of speciation,
although the mechanism may not be degradation of Tertiary land surfaces as proposed here.
Isolation of P. chapmani in the Pilbara by the Great Sandy Desert is also probably the cause
of divergence of that species, however, it is not likely that either of these species diverged
from P. johnsoni, which now occupies habitats to the east of the Great Sandy Desert and
west of the Carpentarian plains. Nor is it likely that P. calabyi has diverged from P.
johnsoni, despite the near parapatric known distributions of the two species, and the usual
sib-taxon relationship between the regions they inhabit. A model of evolution in this group
must therefore allow for probable contact between P. chapmani, P. calabyi and P. patrius
more recently than the divergence of the P. johnsoni clade from them.
127

A possible scenario (fig. 5.13) would therefore involve: A widespread savannah species
that inhabited rocky habitats across northern Australia during the Pliocene. At some point
divergence of the P. johnsoni lineage occurred. I would suggest that this occurred in central
Australia, possibly due to early development of arid conditions leading to a bottleneck in
the Davenport Ranges, or some other random event that allowed adaptation of the clade to
developing arid conditions in central Australia. A single lineage still occupied the Pilbara,
Kimberley-Top End and Queensland, just as many savannah taxa still do. Contact with
Queensland and the Pilbara may have been long-term across lateritic surfaces, or possibly
could have been via a dispersal event across a temporary connection. The continuous range
of the Pilbara-Queensland lineage became fragmented during the early and mid Pleistocene
(via degradation of lateritic surfaces?) and the formation of the Great Sandy Desert. By this
stage the four species lineages were formed, and the P. calabyi lineage was probably
distributed throughout the Kimberley-Top End. The replacement of the P. calabyi lineage
by P. johnsoni in the Kimberley presumably occurred because the P. johnsoni lineage is
better adapted to arid conditions. The Kimberley has been subjected to periods of aridity
that caused local extinction of plants currently typical of the region (Wallis 2001). This
event may have been correlated with the first major loss of eucalypts from the region
around 190ka (van der Kaars 1991). The savannah adapted P. calabyi type that presumably
occupied the Kimberley would be limited in its ability to react to increasing aridity because
the northward movement of habitats during glacial maxima involved exploitation of the
pebble-free exposed sea bed. This lead to the extinction of the savannah clade and its
replacement by P. johnsoni, and to the geographical juxtaposition of P. johnsoni between
the more closely related taxa P. chapmani, P. calabyi and P. patrius. The expanded range
of P. johnsoni was subsequently fragmented by aridity during the LGM, an event that has
lead to three molecular subspecies of limited genetic diversity. Populations of P. patrius
also went extinct across much of its current distribution, and the species has expanded its
range through areas of central Queensland that were desert during the LGM. The expansion
of both these species’ ranges has been restricted by the Carpentarian plains, and the western
limit of P. johnsoni is constrained by the Great Sandy Desert. The recent history of P.
chapmani probably involves similar patterns of range contraction and expansion, limited by
the Great Sandy Desert.
128
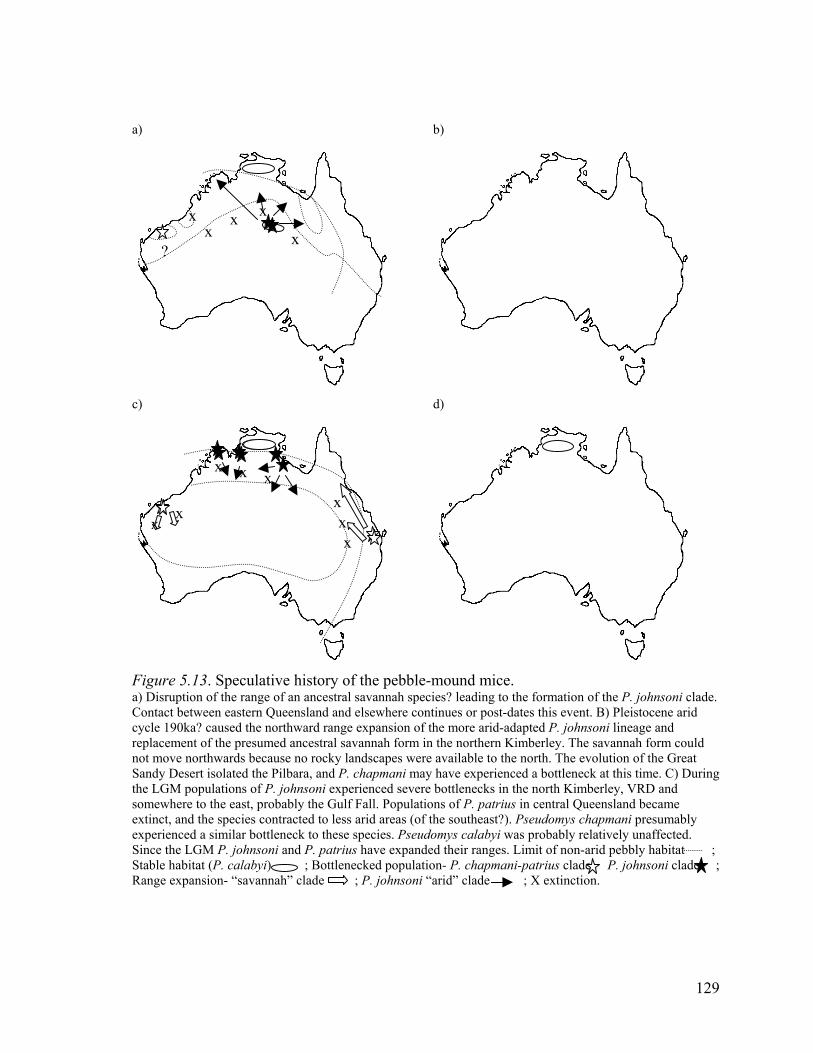
a) b)
c)
Figure 5a) DisrupContact bcycle 190replacemenot moveSandy Dethe LGMsomewheextinct, aexperiencSince theStable haRange ex
x
.13. Stion of tetween ka? caunt of th
northwsert iso populatre to thend the sed a sim LGM Pbitat (P.pansion
x
pecuhe raneastersed the preards blated ions o east,
peciesilar b. john calab- “sav
x
lativege ofn Quee nort
sumedecaus
the Pilf P. j
proba controttlensoni ayi) annah
x
?x
d)
x
x xx
xhistor an anceenslandhward r ancestre no rocbara, anohnsoni bly the acted toeck to thnd P. p ; Bo” clade
x
s aakdeG
at
x
ytanly x
lettl
x
of the pebble-mound mice. ral savannah species? leading to the formation of the P. johnsoni clade. nd elsewhere continues or post-dates this event. B) Pleistocene arid ge expansion of the more arid-adapted P. johnsoni lineage and savannah form in the northern Kimberley. The savannah form could landscapes were available to the north. The evolution of the Great P. chapmani may have experienced a bottleneck at this time. C) During perienced severe bottlenecks in the north Kimberley, VRD and
ulf Fall. Populations of P. patrius in central Queensland became ess arid areas (of the southeast?). Pseudomys chapmani presumably se species. Pseudomys calabyi was probably relatively unaffected. rius have expanded their ranges. Limit of non-arid pebbly habitat ; enecked population- P. chapmani-patrius clade P. johnsoni clade ; ; P. johnsoni “arid” clade ; X extinction.
129
5.5 Summary
-Pebble-mounds are primarily defensive structures.
-Pebble mound architecture varies greatly, with variation not particularly related to genetic
or climatic influences, but strongly influenced by the immediate situation in which a mound
is constructed
-Mounds have not played a role in speciation
-Pebble-mound mice inhabit erosional landscapes capable of producing pebbles, and are
generally found in the upper elements of the local topographic sequence
-Populations of pebble-mound mice are typified by long-term site fidelity, small size and
stable (non-irruptive) population dynamics due to the limiting influence of pebble mounds
-All pebble-mound mice share a unique nuclear copy of their mitochondrial control region
sequence
-There are probably only four species of pebble-mound mice, P. calabyi, P. chapmani, P.
johnsoni and P. patrius. Pseudomys johnsoni includes Pseudomys sp. of Van Dyck and
Birch (1996), and P. laborifex.
-The current distributions of pebble-mound mice are not indicative of speciation processes,
and are the result of dynamic interactions between landscape and climate.
-Divergence of pebble-mound species has involved geographical isolation as a result of:
-loss of suitable pebbly habitat in the Great Sandy Desert and Carpentarian plains
-changing climate? in central Australia
-A reliance on limited topographic situations has constrained the ability of pebble-mound
mice to react to climate change in:
-the Kimberley, where the presumed ancestral “savannah” form has been supplanted
by an “arid” form as aridity spread northwards
-the eastern and western limits of P. johnsoni’s distribution, where unsuitable
landscapes have prevented range expansion such as occurred in the Kimberley.
-the eastern limit of P. chapmani’s distribution
-the western limit of P. patrius’ distribution
-Intra-specific evolution of P. patrius and P. johnsoni is typified by population extinction
leading to:
130

-fragmentation of P. johnsoni into three distinct molecular subspecies
-recent re-invasion of much of eastern Queensland by P. patrius
131
Chapter 6. Evolution of distributions and species boundaries
within the delicate mice
CHAPTER SUMMARY
Patterns of divergence among populations of delicate mice reveal very different
evolutionary relationships than suggested by the current taxonomy of the group. Only two
currently described species, P. hermannsburgensis and P. bolami, are monophyletic.
Individuals described as P. pilligaensis do not form a taxon of any rank, as the currently
recognised species contains members of P. delicatulus and P. novaehollandiae, rendering
those two species paraphyletic. Further paraphyly of P. novaehollandiae results from the
description of some individuals carrying P. novaehollandiae mitochondria as P.
delicatulus. A morphologically cryptic species is reported from the arid north-western parts
of the distribution of the currently recognised P. delicatulus, making P. delicatulus
polyphyletic. It is proposed that true P. delicatulus populations from the north Kimberley
and Top End constitute a subspecies, as do those from Queensland, and that these
subspecies are of roughly equivalent status to the currently described species P.
novaehollandiae. North-south clinal variation in morphology seems to characterise the
eastern distribution of P. delicatulus and P. novaehollandiae, and where these two clades
are in secondary contact in the Pilliga and southeast Queensland, their morphology is
identical. The distributions of all species and clades are primarily under climatic control.
Speciation and taxon divergence within the group mirrors patterns in the general biota, with
a widespread, genetically homogeneous central Australian taxon, and a fragmented group
of taxa around the periphery of the continent. The level of divergence of each taxon from
its nearest relatives is correlated with the degree of aridity of the environments they inhabit,
implicating extinction, range movements and bottlenecks in the evolution of species within
delicate mice.
132

6.1 Molinipi and its relatives
Pseudomys delicatulus (Gould 1842), Pseudomys hermannsburgensis (Waite 1896),
Pseudomys novaehollandiae (Waterhouse 1843), Pseudomys bolami Troughton 1932
and Pseudomys pilligaensis Fox and Briscoe 1980
6.1.1 DELICATE MICE
The five named species referred to here as delicate mice have a continent-wide distribution,
with the exception of southwest Tasmania and far south-western Western Australia (fig. 6.
1). The three widespread members of the group have distributions that largely conform to
the Torresian, Bassian and Eyrean subregions (chapter 2). The delicate mouse (Molinipi;
Pseudomys delicatulus) is distributed in suitable habitats throughout the Torresian
subregion from the northern Pilbara to southeast Queensland (Braithwaite and Covacevich
1995). The sandy inland mouse (Mingkiri; P. hermannsburgensis) occupies the arid interior
(Breed 1995a). Pseudomys hermannsburgensis is sympatric with P. delicatulus in the
southern Kimberley and western Queensland (S. Van Dyck pers. comm., A. Kutt pers.
comm., field data). Scattered populations of the New Holland mouse (Pookila; P.
novaehollandiae) are found on the south-eastern Australian mainland from southeast
Queensland to central Victoria, and in north-eastern Tasmania (Kemper 1995, Van Dyck
1998). Bolam’s mouse (Poonta; Pseudomys bolami) occupies areas immediately inland
from the Great Australian Bight, including the Nullarbor Plain. Pseudomys bolami and P.
hermannsburgensis are sympatric across the northern areas of the formers distribution
(Kitchener et al. 1984). The Pilliga mouse (P. pilligaensis) is restricted to the Pilliga Scrub
of inland northern New South Wales (Fox 1995a).
Delicate mice have been considered close relatives of the pebble-mound mice on the basis
of their extremely similar morphology (Kitchener et al. 1984, Kitchener 1985, Kitchener
and Humphries 1986, Kitchener 1995a), although the two groups are not particularly
closely related based on molecular data (chapter 4). The pelage of P. bolami, P. delicatulus
and P. hermannsburgensis is almost identical to that of pebble-mound mice, being white
below, and orange-brown above, with protruding black guard hairs (Watts and Aslin 1981,
133

Braithwaite and Covacevich 1995, Breed 1995a, Watts 1995a). Weights of these species
range between 9 and 15g (Watts and Aslin 1981, Braithwaite and Covacevich 1995, Breed
1995a, Watts 1995a). Pseudomys novaehollandiae is grey-brown above and off-white
below and is slightly heavier, particularly in the south of its range where weights reach 25g
(Pye 1991, Kemper 1995).
Unlike the short history of pebble-mound mice in the literature, the delicate mice have a
long history of description, re-assignment and rediscovery. Pseudomys novaehollandiae
was among the earlier rodent species noted from Australia (Gould 1863) but was thought to
be extinct until its rediscovery on the New South Wales coast in 1968 (Mahoney and
Marlow 1968). Pseudomys delicatulus, P. hermannsburgensis and P. novaehollandiae were
originally described as species of Mus in the 1800s but included by Thomas (1910) in his
expanded genus Pseudomys. Pseudomys delicatulus and P. hermannsburgnesis were
considered members of the sub-genus Leggadina. Thomas split the delicate mice into two
sub-genera by describing his sub-genus Pseudomys (Gyomys) based on (Mus)
novaehollandiae. Iredale and Troughton (1934) elevated these sub-genera to genera.
Troughton (1936) also split individuals now recognised as a single species, P. delicatulus,
into separate genera by describing some individuals from southeast Queensland as the
pigmy mouse, G. pumilus. Ride (1970) subsumed Leggadina and Gyomys within
Pseudomys and did not recognise sub-genera. Aside from P. bolami and P. pilligaensis
Ride (1970) recognised currently accepted species boundaries by synonymising P. pumilus
and P. delicatulus. Pseudomys bolami was described as a subspecies of P.
hermannsburgensis by Troughton (1932), and was elevated to species status by Kitchener
et al. (1984). Specimens eventually described as Pseudomys pilligaensis were thought to be
an inland population of P. novaehollandiae when first captured in 1975 (Fox 1995a), but
subsequent studies of morphology and enzymes concluded that they represented a distinct
species. Lee (1995) stressed the need for further examination of the taxonomic status of P.
pilligaensis, which he felt was not suitably established to formulate conservation priorities.
134

6.1.2 ECOLOGY OF THE DELICATE MICE
All delicate mice show a general preference for sandy substrates (Watts and Aslin 1981).
Pseudomys delicatulus and P. novaehollandiae are found in habitats ranging from
stabilised coastal dunes to inland eucalypt forests and woodlands (Keith and Calaby 1968,
Fox and Fox 1978, Kemper 1990, Braithwaite and Brady 1993, Braithwaite and
Covacevich 1995, Kemper 1995, Haering and Fox 1997, Lock and Wilson 1999).
Pseudomys bolami and P. hermannsburgensis inhabit dunes and plains of the arid zone and
its southern periphery and each has been recorded from a variety of vegetation associations
(Kitchener et al. 1984, Robinson et al. 1988, McKenzie et al. 1993, Breed 1995a, Moseby
and Read 1998, Letnic 2002). Where these species are sympatric, P. bolami shows a
preference for lower loamy areas, and P. hermannsburgensis is found on higher sandy
dunes (Dell and How 1988, McKenzie et al. 1992). Pseudomys pilligaensis is found in
Eucalyptus and Callitris associations on sandy plains (Fox and Briscoe 1980, Fox 1995a).
The diet of all species is somewhat opportunistic and omnivorous, with a tendency towards
granivory, particularly in P. bolami and P. delicatulus (Cockburn 1980, Braithwaite and
Brady 1993, Murray et al. 1999, Wilson and Bradtke 1999). Pseudomys species often show
a strong summer and spring preference for seed, and this has been linked to habitat
preference in several species (Cockburn 1978, 1981b, Ford et al. 2003). Habitat selection in
P. delicatulus and P. novaehollandiae has likewise been linked to a preference for
floristically rich successional stages that produce suitable food, in particular nutritious
seeds (Cockburn 1980, Braithwaite and Brady 1993). Seed accounted for 90% of the
summer diet of P. novaehollandiae in one study in New South Wales (Thomson 1980).
However, Wilson and Bradtke (1999) recorded only 14% seed in the diet of P.
novaehollandiae from southern Victorian sites. They suggested that their result indicates
dietary flexibility allowing exploitation of available resources across a variety of habitats.
Pseudomys delicatulus, P. novaehollandiae and P. pilligaensis exhibit marked population
fluctuations following fire (Kemper 1990, Braithwaite and Brady 1993, C. Eddie pers.
comm., H. Tokushima pers. comm.). Braithwaite and Brady (1993) recorded a population
increase of P. delicatulus from less than 10 to more than 100 individuals between October
135

and January following a fire. Tokushima (H. Tokushima pers. comm.) recorded an even
more dramatic irruption of mice in the Pilliga, his population growing from a few
individuals to several hundred. Trap saturation meant the full extant of the irruption could
not be determined. Similar patterns have been observed in P. delicatulus in central
Queensland (C. Eddie pers. comm., N. Thurgate pers. comm.). Rodents in central Australia
are noted for spectacular population irruptions (Newsome and Corbett 1975), although the
use of the term “irruption” by Predavec (1994) to describe population fluctuations in a
population of P. hermannsburgensis is potentially misleading, as he recorded increases of
only 20 or so individuals on his study grids. Recruitment of this level could be the result of
only five or six females breeding successfully, and increases of this magnitude are to be
expected in many Pseudomys populations. Where Predavac’s populations differ from
pebble-mound mice is in their mobility, particularly of breeding females. Individuals of P.
hermannsburgensis move very large distances (16km+) (Dickman et al. 1995), and
“populations” of P. bolami, P. delicatulus and P. hermannsburgensis seem to be highly
mobile over short time frames, deserting an area occupied in the previous month, or
exhibiting extremely high rates of individual turnover at a given site (Predavec 1994,
Moseby and Read 1998, C. Eddie pers. comm., A. Start pers. comm., N. Thurgate pers.
comm.). This is particularly so when food resources are patchy due to fire or uneven
rainfall (Letnic 2002).
6.2 Geographical sampling for molecular analysis
Good broad-scale coverage of the distributions of all species was achieved, largely through
supply of museum tissues from southern and western Australia and field biopsies of the
Queensland distribution of P. delicatulus (table 6.1 and fig. 6.2). New Guinean material
from P. delicatulus was not available, and coverage of coastal and far northern Queensland
was sparse. Many tissues samples were formalin-preserved, and only some of these have
yielded good sequence. Those that have not are not listed in table 6.1, and an extensive
collection awaits further analysis. The Pilliga was a location of special interest (section
6.4.3) and almost eighty tissue samples were provided by H. Tokushima, and will form the
basis of future microsatellite studies. Samples were obtained from the Nullarbor where P.
136

hermannsburgensis is sympatric with P. bolami and from the northern Pilbara where P.
hermannsburgensis is sympatric with P. delicatulus. One individual of P. delicatulus from
of Weipa (site 50 in figure 6.1) was sequenced during the final stages of writing-up.
Analysis of that individual’s sequence was restricted to distance analysis to establish
general relationships.
137

Table 6.1. Sampling locations and tissue sources for the delicate mice. (ABTC)- tissue from Australian biological tissue collection with museum voucher; ABTC- no voucher; NTMU- Northern Territory Museum; QMJM- Queensland Museum; SAMAM- South Australian Museum. N= sample size. Sequence ID’s are used to identify individuals from a particular site in results trees. Site Lat. Long. N Type Source/voucher ID’s P. bolami 1. Balcanoona -30.6097 139.4436 2 Liver (ABTC) SAMAM 19518, 19512 b16,17 2. Balladonia -32.0728 124.0500 1 Liver ABTC 8074, 8075 b8,b9 3. Black Flag -30.5833 121.2667 2 Liver ABTC 8058, 8059 b2,3 4. Morgan Vale -33.2445 140.5722 2 Liver (ABTC) SAMAM 12925, 12926 b10,11 5. Mt Gairdner -32.2417 135.9583 2 Liver (ABTC) SAMAM 12475, 12479 b12,13 6. Rawlinna -29.7167 125.3167 1 Liver ABTC 8070 b5 7. Vivian -30.9000 135.7333 2 Liver (ABTC) SAMAM 17966, 27292 b14,15 8. Whyalla -33.0000 137.5750 1 Liver (ABTC) SAMAM 18279 b1 P. delicatulus 9. Bede -23.3661 145.5660 2 Tail Field biopsies (A. Kutt) d5,6 10. Burra Range -20.7237 145.1860 1 Tail Field biopsy (Ford) d1 11. Camp Milo -25.9833 153.0667 1 Skin QMJM 2620 d35 12. Clemant -19.1140 146.4330 1 Liver Field biopsy (A. Kutt) d2 13. Fortuna -22.6500 145.5333 1 Skin QMJM 13835 d57 14. Great Sandy Desert -19.6666 123.3500 1 Liver ABTC 8068 d19 15. Litchfield NP -13.2530 130.7335 2 Liver (ABTC) NTMU 4191, 4192 d23,24 16. Melville Island -11.5053 130.9032 2 Liver ABTC 8035, NTMU 4418 d18,25 17. Mitchell Plateau -14.8917 125.7597 1 Liver (ABTC) WAMM 21624 d20 18. Monklands -23.4847 146.4691 2 Tail Field biopsies (N. Thurgate) d3,15 19. Mount Inkerman -19.7500 147.4830 1 Liver (ABTC) QMJM 11350 d29 20. Nathan River -15.2500 135.5167 1 Liver (ABTC) NTMU 751 d22 21. Oakleigh -23.5861 146.5425 1 Tail Field biopsy (N. Thurgate) d4 22. Patonga -12.9600 132.5770 1 Liver ABTC 8034 d17 23. Pellew Is. -15.5500 136.8333 2 Liver (ABTC) NTMU 1510, 1521 d30,31 24. Ramingining -12.2047 134.9813 1 Liver (ABTC) NTMU 4745 d28 25. Wickham R -16.8252 130.1923 2 Liver (ABTC) NTMU 4712, 4715 d26.27 26. Woodstock -21.6069 119.0397 2 Liver (ABTC) WAMM 29247, 34326 d33,34 P. hermannsburgensis 27. Beetoota -25.6940 140.7440 2 Liver ABTC 8047, 8048 h10,11 28. Big Red -25.8792 139.0531 1 Tail Field biopsy (Ford) h22 29. Curtin Springs -25.5667 131.7972 2 Liver (ABTC) SAMAM 12570, 12571 h8,9 30. Helen Springs -18.4978 133.8738 1 Tail Field biopsy (Ford) h23 31. Kurundi -20.6000 134.8333 2 Liver ABTC 8052, NTMU 3429 h12,15 32. Laverton -27.7622 123.3663 1 Liver ABTC 41428 h16 33. MacDonnell Range -23.7000 132.5000 1 Ear Desert Wildlife Park h3 34. Nifty Mine -21.6666 121.5833 1 Liver (ABTC) WAMM 43170 h20 35. Nullarbor -29.5167 127.0500 2 Liver ABTC 8076, 8077 h25,26 36. Pieracoola WH -29.0117 146.0597 1 Liver (ABTC) SAMAM 15017 h1 37. Purni Bore -26.2833 136.1000 2 Liver (ABTC) SAMAM 15773, 15777 h4,5 6. Rawlinna -29.7167 125.3167 2 Liver ABTC 8069, 8072 h14,24 38. Tallaringa -28.2167 133.3667 2 Liver (ABTC) SAMAM 17483, 17488 h6,7 26. Woodstock -21.5917 119.0792 3 Liver (ABTC) WAMM 29450, 29451, 29466 h17,18,19 P. novaehollandiae 39. Anglesea -38.4050 144.1890 2 Ear Field biopsies (B. Wilson) no1,2 40. Glenrock -27.4900 152.1600 1 Liver QMJM 11978 no10 41. Goobang -32.6924 148.3441 2 Tail Field biopsies (M. Ellis) no3,4 42. Helidon -27.9583 152.3281 1 Liver QMJM 14454 no9 43. Loch Sport -38.0450 147.5850 2 Ear Field biopsies (B. Wilson) no5,6 44. Port Stephens -32.7000 152.1500 1 Seq. Sequence SCU (M. Elphinstone) no15 45. Toowoomba -27.3650 152.1850 2 Tail Field biopsies (P. Sparshott) no12,13 46. Wilsons Promontory -38.9190 146.3660 1 Ear Field biopsy (B. Wilson) no8 P. pilligaensis 47. Binnaway NR -31.4648 149.4550 2 Ear Field biopsies (H. Tokushima) pil2,11 48. Pilliga NR -30.9872 149.3017 4 Liv/Ear Field/Lab biopsies (H. Tokushima) pil4,13,14,15 49. Pilliga SF -30.6265 149.7210 6 Ear Field biopsies (H. Tokushima) pil1,3,5,6,7,8
16
138

Figure 6.1. Distribution of delicate mice and sampling Distributions from Braithwaite and Covacevich (1995), Breed (19sampling locations. Pseudomys bolami ; P. delicatulus P. novaehollandiae ; P. pilligaensis . Site 50 (Weipa) i
32 35
38
17
18
19
20
21
2325
26
22 24
2728
3031
2933
34
3637
44
47-9 40, 42, 45
6.3 Molecular evolution
6.3.1 MITOCHONDRIAL CONTROL REGION
Four major clades are evident in distance and maxi
region sequence (fig. 6.2; minimum evolution score
score: -ln 1591.52371; substitution model: TrN+I+G B
T 0.3744) Nst=6 Rmat=(A-C 1.0000; A-G 19.97
10.0920; G-T 1.0000) Rates=gamma Shape=0.435
currently described species Pseudomys bolami and
1
26
3
57l9 s
m
:
a
0
4
8ocations. 5a), Kemper
; P. hermanns not included
463943
um-likelih
0.50881:
se=(A 0.32
0, A-T 1.0
7). Two cl
P. herman
91
101
(1995), Wburgensisin table 6
41
ood ana
fig. 6.3;
59; C 0.
000; C
ades co
nsburge
11
2
3
14
15
50atts (1995a) and ;
.1 (see text).
lysis of control
likelihood tree
0775; G 0.2222;
-G 1.0000; C-T
rrespond to the
nsis although 3
139
individuals of P. hermannsburgensis were miss-identified as P. bolami. One contains five
individuals from north-western Australia identified as P. delicatulus (P. cf. delicatulus).
The largest clade, the “P. delicatulus complex”, contains all individuals identified as P.
novaehollandiae, P. pilligaensis, and the majority of individuals identified as P.
delicatulus. Bootstrapping of trees strongly supports each of these major clades (fig. 6.2
and 6.3). Distance and likelihood analyses reveal three relatively deep clades within the P.
delicatulus complex, but bootstrapping of maximum-likelihood trees provides marginal
support (51%) for only one of these clades, “P. novaehollandiae”, which includes all
individuals identified as P. novaehollandiae, five individuals identified as P. pilligaensis
and one Queenslnd museum voucher identified as P. delicatulus (QMJM 2620- Camp
Milo, d35). The remaining two clades correspond to; P. delicatulus from the north
Kimberley and Top End (“P. delicatulus (NT)”), and P. delicatulus from Queensland and
seven individuals identified as P. pilligaensis (“P. delicatulus (QLD)”). The individual of
P. delicatulus from Weipa not included in the trees (section 6.2) yielded sequence that was
close to P. delicatulus from central Queensland, and more distantly related to haplotypes d2
and d29, thereby falling well within the P. delicatulus (QLD) clade. The likelihood tree is
rooted on P. hermannsburgensis because that taxon retains ancestral characters when
compared to the P. delicatulus complex, and is ancestral to the group in all control region
phylogenies. The only difference between outgroup and midpoint rooted trees was the
branching of P. cf. delicatulus from the base of the P. hermannsburgensis branch in
midpoint, but not outgroup rooted trees.
140

h
hh20
h6
h7
d34
d3
d19
d26
d27
d20
d24
0.005 substitutions/site
pil14no9
pil3
no4no1
no5
no6
no8
d35&
P. hermannsburgensis
”
s
Figure 6.2. Genetic distance between 64 dUnrooted neighbour-joining tree of Kimura two-pafrom 87 individuals. Labels are one individual thatanother species (bold). Major clades shown as solilabelled for broken circles. Node labels= bootstrap
“P. delicatulus complex
h24h9
h26h1h23
h11
h8
h12
h10
h15
h25
h17
h14
4
22
d30 d31
d17 d25
d18
d22
d28
d2
d29
pil15pil7d3
d1d15d4
pil11 pil6
pil8d6d5
elicate mouse control rerameter distances between 6 carried a haplotype, plus ind circles. Current species bo support (>50%) for major n
d57P. delicatulus (QLD), P. pilligaensis
P. delicatulus P. novaehollandiae, P. pilligaensis
P. delicatulus (NT)
b14b15b2 b13
b16b11b17
b9
b5b1
P. cf. delicatulu
gion 4 hapl
dividuaundarieodes b
P. bolami
99
99100
60
5379
66
haplotypels (ms in “
ased
97
51
60
3 80
otypes. s of 387bp isolated iss-)identified as P. delicatulus” as
on 100 replicates.
141

d27d19
d26d34
d33d20
d25d18
d17d30
d28d22
d31d24
d3pil11
d4pil7
d1d15
pil8pil6
d2d29
d57d5
d6pil15
pil3no4pil14
no9no8
no6no5no1
b1b9
b17
0.005 substi
s
”
P. novaehollandiaeP. pilligaensis P.delicatulus
P. delicatulus (QLD
) P. pilligaensis
P. delicatulus (NT)
57
65
90
63
72
76
85
62
61
51
d35&
Figure 6.3. MaxiMaximum likelihoosequence isolated frto a single individubootstrap support (>
P. bolami
b5b2b15
b14b16
b13b11
h1h11
h9h7
h17h15h14
h4h25
h10h22
h20h6
h26h23
52
100
P. hermannsburgensisP.cf. delicatulu
“P. delicatulus
tutions/site
mum-likelihod tree for 64 hom 87 individuaal that carried 50%) based on
96
h24h8
h12
od tree of delicate mouse control region haplotypes. aplotypes based on parameters derived from Modeltest for 387bp of ls. Tree is rooted using P. hermannsburgensis. Taxon labels correspond a particular haplotype, plus (miss-)identified individuals. Node labels= 100 replicates.
142

6.3.2 NUCLEAR INTRONS
Introns were of particular interest among the delicate mice due to the differences between
established taxonomy of the group and results of control region analysis. Sequencing of
five introns, ARAF, ACTC, CHAT, DHFR and MYH2, showed that they were relatively
invariable, produced ambiguous products, or yielded sequence that aligned with exon
sequences from Genbank. DHFR intron 1 was conserved among members of the group, but
was useful in clearly separating Pseudomys cf. delicatulus from the P. delicatulus complex
on the basis of two mutations and one 14bp deletion (fig. 6.4). A single fixed mutation
characterised the P. delicatulus complex when compared to P. bolami, P.
hermannsburgensis and Pseudomys cf. delicatulus. Phylogenetic use of the locus was not
possible. Specimens of “P. pilligaensis” carrying P. delicatulus and P. novaehollandiae
control region haplotypes were sequenced, and individuals of both types shared a unique
DHFR intron 1 mutation, but were not significantly divergent from other populations of P.
novaehollandiae or P. delicatulus. ARAF intron 1 sequences were highly conserved, but
separated Pseudomys cf. delicatulus from the P. delicatulus complex (table. 6.2).
143

h9-CurtinSp AAAATATGGGCATTGGCAAGAACGGAGACCTGCCCTGGCCTCTGCTCAGGTACGGGCTGGGCGCNGGAAACCGAGGCGGTTCACTGAGTTGGGTCGAGCA b1-Whyalla ----------------------------------------------------------------G--------N-------------------------- d26-Wickham ----------------------------------------------------------------G----------------------------------- d23-Litchfield ----------------------------------------------------------------G----------------------------------- d29-MtInkerman ----------------------------------------------------------------G----------------------------------- pil3-PilligaSF ----------------------------------------------------------------G----------------------------------- pil15-PilligaNR ----------------------------------------------------------------G----------------------------------- pil13-PilligaNR ----------------------------------------------------------------G----------------------------------- pil11-Binnaway ----------------------------------------------------------------G----------------------------------- no12-Toowoomba ----------------------------------------------------------------G----------------------------------- no2-Anglesea ----------------------------------------------------------------G----------------------------------- h9-CurtinSp CNTGCCTTGGACGCACAGGCCGACCTGCTTGGAGTGGGGTCTAAGTGGATAGGCCCTGCCGGCCTCAGCAAGAGGCAAAGCTACTGCTGCCCGCGGTGAT b1-Whyalla -T-------------------------------------------------------------------------------------------------- d26-Wickham -T-------------------------------------------------------------------------------------------------- d23-Litchfield -T---------------------------------------------------------------------------------T---------------- d29-MtInkerman -T---------------------------------------------------------------------------------T---------------- pil3-PilligaSF -T---------------------------------------------------------------------------------T---------------- pil15-PilligaNR -T-------------------------------N-------------------------------------------------T---------------- pil13-PilligaNR -T-------------------------------N-------------------------------------------------T---------------- pil11-Binnaway -T------------------N--------------------------------------------------------------T---------------- no12-Toowoomba -T-------N----------N--------------------------------------------------------------N---------------- no2-Anglesea -T--------------------------------------------------------------------------------GT---------------- h9-CurtinSp CCCTCTGCGGTGCCAGCCTTTGCTCACAGGCTCCCTGGCCGGGAACAAAGTCCAGTCACTGGGCAGGCAGCAACACCACCCCCACACCGGGGCTTGCACT b1-Whyalla --------N-----------------------------------------------------N------------------------------------- d26-Wickham ----------------------------------------------------------------------G----------------------------- d23-Litchfield ----------------------------------T---------N------------------------------------------------------- d29-MtInkerman -------T-------------------------------------------------------------------------------------------- pil3-PilligaSF --------------------------------------------------------------A------------------------------------- pil15-PilligaNR --------------------------------------------------------------A------------------------------------- pil13-PilligaNR N-------------------------------------------------------------A------------------------------------- pil11-Binnaway ---------------------------------------------------------------------------------------------------- no12-Toowoomba ---------------------------------------------------------------------------------------------------- no2-Anglesea -----------------------------------------------------------------------------------------T---------- h9-CurtinSp TTTCGCCGCTGACTTGAGCCTGAGCACACGTGACAGGGATTAACGCAGCGTTTCTCTAACTTTCAGGAATGAGTTCAAGTACTT b1-Whyalla ------------------------------------------------------------------------------------ d26-Wickham ---------------------------------------A-------------------------------------------- d23-Litchfield ------------------------------------------------------------------------------------ d29-MtInkerman ------------------------------------------------------------------------------------ pil3-PilligaSF ------------------------------------------------------------------------------------ pil15-PilligaNR ------------------------------------------------------------------------------------ pil13-PilligaNR ------------------------------------------------------------------------------------ pil11-Binnaway ------------------------------------------------------------------------------------ no12-Toowoomba ------------------------------------------------------------------------------------ no2-Anglesea ------------------------------------------------------------------------------------ Figure 6.4. Alignment of DHFR intron 1 sequence from eleven delicate mice. Codes represent a single individual and its site of origin. bx- P. bolami; dx- P. delicatulus; hx- P. hermannsburgensis; nx- P. novaehollandiae; px- P. pilligaensis. d26-Wickham is an individual identified as P. delicatulus but regarded here as P. cf. delicatulus on the basis of control region analysis. N is recorded for ambiguous sites in heterozygote individuals.
Table 6.2. Genetic distance at the ARAF intron 1 locus between Pseudomys delicatulus, P. novaehollandiae, P. pilligaensis and Pseudomys cf. delicatulus P.pill P.nov P.del(QLD) P.del(NT) P.cf.del P.pill - P.nov 0.0037 - P.del 0.0000 0.0075 - P.del 0.0000 0.0038 0.0037 - P.cf. 0.0156 0.0193 0.0194 0.0117 -
144

6.4 Evolution of the delicate mice
6.4.1 HOW MANY SPECIES OF DELICATE MICE ARE THERE?
There are six distinct molecular taxa within the group (table 6.3). Which of these constitute
species is difficult to establish based on results presented here and in past studies. The
(very) tentative conclusion of this thesis is that there are probably four, P. bolami, P.
delicatulus, P. hermannsburgensis and P. cf. delicatulus but there needs to be critical
evaluation of the species status of P. cf. delicatulus and P. novaehollandiae (included in
“P. delicatulus”) before this question can be resolved. Pseudomys hermannsburgensis and
P. bolami are currently defined species that are strongly supported. Conversely, Pseudomys
delicatulus, P. novaehollandiae and P. pilligaensis do not represent discrete molecular
evolutionary units. Pseudomys pilligaensis is not a mitochondrial taxon, and individuals
described as P. pilligaensis yield either P. delicatulus or P. novaehollandiae control region
sequence. Three clades exist within Pseudomys delicatulus as currently recognised (figs.
6.2 and 6.3). One is a previously unrecognised species, referred to here as P. cf. delicatulus.
This conclusion is supported by mtDNA and two nuclear introns. The remaining two clades
within P. delicatulus are significantly less divergent from each other, but form lineages of
roughly equal depth to their divergence from P. novaehollandiae. The nature of genetic
structuring, biogeography, and probable evolutionary history of these two clades of P.
delicatulus and P. novaehollandiae suggests that they have not yet fully speciated, and are
a sub-specific complex within P. delicatulus (section 6.4.3).
Table 6.3. Inter-taxon control region divergence among delicate mice. Distances based on average pair-wise Kimura two-parameter distances. Species shown at upper left, proposed subspecies at lower right. Percentage differences given here are not directly comparable to those given for pebble-mound mice in table 5.2 because the sequence length here (387bp) contains an additional 51bp. “P. delicat.” includes all subspecies proposed here, but this does not significantly alter distances in species comparisons.
P. bolami P. delicat. P. herman. P. cf. delicat. P. novae P. del (NT) P. del (QLD) P. bolami - P. delicat. 6.09% - P. herman. 7.98% 8.10% -
P. cf. delicat. 5.60% 7.05% 7.91% - P. novae - P. del (NT) 4.86% - P. del (QLD) 4.31% 4.34% -
145

6.4.2 GEOGRAPHICAL DISTRIBUTION OF DELICATE MOUSE CLADES
Sequencing studies have revealed that the distribution of evolutionary clades within the
delicate mouse group differs from the distribution of morphologically defined taxa.
Pseudomys hermannsburgensis is Eyrean, and found throughout central Australia, while all
other species of delicate mouse are distributed around the margins of the continent (fig.
6.5). Pseudomys bolami has a distribution along the southern coasts of the arid zone, and
into the southern arid and semi-arid interior. Based on the distribution of mtDNA
haplotypes and the known distribution of “P. delicatulus” in north-western Australia,
Pseudomys cf. delicatulus is found in arid areas between the southern VRD and the Pilbara,
including the southern Kimberley and Great Sandy Desert (section 6.4.3). The Torresian
and Bassian subregions are home to three clades within the P. delicatulus complex. The
first is found in the north Kimberley and the Top End. Although distribution maps in
Braithwaite and Covacevich (1995) and Watts and Aslin (1981) show P. delicatulus to be
distributed through the Carpentarian Barrier, this does not appear to be the case, and I could
not find evidence of captures of the species from the Carpentarian plains or Mitchell Grass
Downs in the Australian, Northern Territory, Queensland or Western Australian Museum
collections, or from other field workers. De Vis (1884) does record a possible individual
from the mouth of the Norman River, but was not confident if the identification. Based on
control region haplotypes, this thesis is the first study to reveal the presence of P.
delicatulus in New South Wales, and also reveals a broader distribution of P.
novaehollandiae in Queensland than previously thought. These two clades meet in a region
of secondary contact from the Pilliga in New South Wales to the Maryborough-Gladstone
region of southeast Queensland (section 6.4.3), an area that roughly marks the Bassian-
Torresian divide.
146

Figure 6.5. Geographical distribution of delicate mouse clades. P. bolami ; P. delicatulus- Kimberley-Top End ; P. delicatulus- Queensland ; P. (delicatulus) novaehollandiae ; P. hermannsburgensis ; Pseudomys cf. delicatulus .
6.4.3 EVOLUTIONARY HISTORY OF DELICATE MOUSE SPECIES
The distributions of delicate mouse species appear to be climatically determined, and all
species overlap with closely related taxa in regions of climatic transition such as the
Pilbara, southern Kimberley, the southern arid zone and central and south-eastern
Queensland. The ability of these species to react to climatic change by expanding their
range to occupy previously unsuitable habitat, and vice-versa, makes it difficult to
successfully reconstruct the deeper evolutionary history of the delicate mice, as repeated
range shifts may well obscure evolutionarily significant patterns. However, constructive
comment can be made on several features of delicate mouse evolution important to general
147
b14b15b2 b13
b16b11b17
b9
b5b1
h24h9
h26h1h23
h11
h8
h12
h10
h15
h25
h17
h14
h4
h22h20
h6
h7
d34
d33
d19
d26
d27
pil14no9
pil3
no4no1
no5
no6
no8
d20
d24
d30 d31
d17 d25
d18
d22
d28
d2
d29
pil15pil7d3
d1d15d4
pil11 pil6
pil8d6d5
d57

evolution of Australian faunas, and detailed analysis of more recent evolutionary
phenomena can be undertaken.
Pseudomys bolami
The re-description of P. bolami by Kitchener et al. (1984) identified differences in ear
length, pes length, skull and dental features that separated P. bolami from P.
hermannsburgensis. There were eight fixed differences at 15 variable isozyme loci. These
results are matched by the genetic distinctness of the species in control region sequencing.
Pseudomys bolami has an unusual distribution that includes the inhospitable Nullarbor
Plain and southern margins of the arid zone. Few terrestrial mammals are restricted to the
region inhabited by P. bolami. The southern hairy-nosed wombat (Lasiorhinus latifrons)
had a largely concordant natural distribution (Wells 1995), and the southern Ningaui
(Ningaui yvonneae) occurs in limited areas within the distribution of P. bolami (Kitchener
1995b). Among rodents Notomys mitchelli has a similar distribution but is also found in
less arid areas to the southwest of the distribution of P. bolami (Watts 1995c). Some
confusion over the respective distributions of P. bolami and P. hermannsburgensis may
have arisen from past taxonomic synonymy, and three of 17 museum vouchers of P. bolami
sequenced in this study were actually P. hermannsburgensis (these were considered to be
individuals captured prior to the re-description of P. bolami and re-assigned to P.
hermannsburgensis for the purposes of analysis). Sympatry of such ecologically and
morphologically similar Pseudomys species is uncommon, particularly in southern
Australia, but mirrors patterns between species of delicate mice elsewhere.
There is little genetic variation across the range of P. bolami, and no indication of
geographical structuring. Although sample sizes are low, a maximum of one non-sequenced
mutational step separates any of the nine recorded haplotypes from the closest related
haplotype. The sites sampled include the geographical limits of the species range. Lack of
contemporary genetic structuring is readily explained by a fairly continuous distribution
with no geographical barriers. However, the overall lack of genetic diversity, and relative
genetic isolation from related species, indicates that the recent evolution of P. bolami has
148
probably involved a population bottleneck, and that haplotype extinction has reduced the
genetic diversity of this species well below that of any other delicate mouse species, or
subspecies (as defined here). A population bottleneck due to geographical restriction seems
a more likely scenario given the widespread evidence of range reductions during the
Pleistocene and LGM (sections 2.3.2 and 5.4.3).
Pseudomys hermannsburgensis
Two shallow but distinct mitochondrial clades are apparent within P. hermannsburgensis.
Each is distributed widely in the arid zone, and there is no spatial separation of the clades.
Nested clade analysis did not reject the null hypothesis, no geographical association of
alleles, for any clade. This is expected given the lack of correlation between geographical
location and genetic structuring of haplotypes (fig. 6.6). No statistically significant
evidence of fragmentation was detected between the two major clades. More intense
geographical and population sampling may be able to resolve whether a bottleneck or
allopatry was responsible for restriction of genetic diversity in the species, but this is
unlikely because past geographical structuring will almost certainly be masked by current
panmixia.
The ecology of P. hermannsburgensis is such that a lack of geographical structure in
mtDNA studies is readily explicable. Individuals and populations move long distances to
exploit patchy resources resulting from erratic rainfall patterns (Dickman et al. 1995, Letnic
2002). The species is notable for its ability to go without water and concentrate urine
(MacMillen and Lee 1967, Kotler et al. 1998), and has a variable and low basal metabolic
rate that Predavec (1997) suggested was an adaptation to variable environments of the arid
zone. The relatively higher overall genetic diversity of P. hermannsburgensis when
compared to P. bolami shows that it did not undergo a severe bottleneck as seems to have
occurred in P. bolami (P. hermannsburgensis: avge. 1.77%, max. 3.52%; P. bolami: avge.
0.74%, max. 1.33%) during the LGM. Instead, better adaptation to arid conditions and high
mobility would possibly have seen the species’ range move towards the coastal margin, but
not contract to the point where major loss of genetic diversity occurred. The fact that there
149
is no genetic structure within the Eyrean region is indicative of the lack of significant
barriers to movement in the region, even for a small-bodied species.
Pseudomys cf. delicatulus
The recognition of cryptic species of Pseudomys has been a feature of recent Australian
rodent taxonomy. However, most recently described species have been pebble-mound
mice. Pseudomys cf. delicatulus is clearly a delicate mouse, and is similar to P. bolami in
its genetic distinctness. Like P. bolami, its control region sequence is marginally more
similar to that of the P. delicatulus complex than to P. hermannsburgensis, and like P.
bolami, its recognition may be upheld on molecular grounds, and a revision of
morphological characteristics. No morphological revision has compared animals from the
Pilbara with Kimberley-Top End P. delicatulus (true P. delicatulus). The five individuals
found to be members of this species were museum specimens previously referred to P.
delicatulus. Norah Cooper of the Western Australian Museum briefly examined four
individuals from the Pilbara and the northern Kimberley following the initial genetic
findings, and noted that Kimberley animals were smaller overall, had a shorter rostrum,
narrower braincase, smaller bullae, wider palate, and narrower pterygoids. A detailed
review and species description are pending. Should the species be upheld, the proposed
name will be Pseudomys aphanomorphus derived from the Greek for “hidden form”.
150

4-1
4-2
3-1
3-4
3-3
2-1
2-2
2-5
2-8
2-7
2-4
2-3
2-6
1-9
1-7
1-5
1-11
1-6
1-18
1-15
1-10
1-8
1-19
1-3 1-12
1-1
1-2
1-4
North
Northwest
Central
South-central
East
South
Southwest
3-2
Figure 6.6. Nested haplotype network of Pseudomys hermannsburgensis control region haplotypes. Large circles represent sequenced haplotypes (size= n). Small circles are unrecorded mutational steps. Shading as per key (represents multiple sites within a region of the arid zone). Significant clades: none.
151
A single individual of “P. delicatulus” studied by Baverstock et al. (1977a) and Baverstock
et al. (1977b) was reported to come from a site 189km south of Broome. This site lies in the
region where Pseudomys cf. delicatulus probably occurs. Baverstock et al. (1977a) found
only three variable loci of seventeen they screened between P. delicatulus from
Queensland, the Northern Territory and Western Australia. The individual from Western
Australia differed from all Northern Territory and Queensland individuals at a single
isozyme locus (Alb). This represents little significant genetic difference between forms.
However, Baverstock et al. (1976) found no difference at the Alb locus between P.
hermannsburgensis, P. delicatulus from QLD and P. novaehollandiae, and only detected a
single variable locus among the seven they screened for these three species. A karyotype
involving two peri-centric inversions and a medium-sized metacentric Y was shared
between Queensland and Western Australia (possible P. cf. delicatulus), but not the
Northern Territory.
It is likely that all “P. delicatulus” from the Pilbara, Great Sandy Desert and southern parts
of the Kimberley and VRD are members of Pseudomys cf. delicatulus. The exact
distribution of the species is unknown, but appears to have a strong ecological basis when
compared to that of P. delicatulus. BIOCLIM modelling based on the five definite location
records of P. cf. delicatulus and on populations from which individuals of P. delicatulus
were sequenced in the northern Kimberley, the Top End and Queensland shows spatial
separation of the two species, and predicts that P. cf. delicatulus may occur in a relatively
narrow band of habitats between the savannahs of the Top End and central deserts to the
south (fig. 6.7). The species is sympatric with P. hermannsburgensis at Woodstock Station
in the Pilbara, and is probably sympatric with that species across the southern parts of its
distribution, and with P. delicatulus in the north. Records of P. delicatulus from the
Newcastle Waters region (Parker 1973) and Northern Tanami Desert (Gibson 1986) are
likely to represent this species if the preliminary distribution modelling proves correct, and
the fact that the species is found in significantly drier habitats than P. delicatulus is
apparent without the need for any modelling. The five individuals sequenced in this study
exhibited significantly greater genetic divergence than observed in P. bolami, but nothing
further can be said of its genetic structure.
152
Despite the deep mtDNA and nuclear intron divisions between this putative species and P.
delicatulus, I have some reservations of its specific status based on the similarity of
chromosomes and isozymes between a possible individual of this species with P.
delicatulus (above), and more particularly with the reported sperm morphology (Breed
2000) of an individual of “P. delicatulus” from the northern Tanami Desert. This
individual, like the one from south of Broome examined by Baverstock et al. (1977a) and
Baverstock et al. (1977b), came from an arid area I would expect P. cf. delicatulus to
inhabit. Its sperm morphology was identical to that of other Northern Territory and
northern Kimberley P. delicatulus examined by Breed (2000). The reported similarity of
isozymes between these forms may be of little consequence. The studies involved loci that
show minimal differences between P. delicatulus and P. novaehollandiae, and little more
between P. delicatulus and P. hermannsburgensis. Loci used to separate P. bolami from P.
hermannsburgensis may be more appropriate, as that study incorporated all loci that were
variable within the group in other studies, and employed an additional seven loci, four of
which had fixed differences, and another two of which were variable. Chromosomes and
sperm morphology must be described for individuals with known control region identity,
because the suggestion from past studies is that P. cf. delicatulus has a karyotype different
to that of P. delicatulus in the Top End, but the same as Queensland P. delicatulus, but has
sperm morphology identical to that of the Top End and northern Kimberley, but different to
that of Queensland animals. Should P. cf. delicatulus prove to be a deep subspecies of P.
delicatulus, the recognition of P. novaehollandiae as a species would render P. delicatulus
paraphyletic. If P. cf. delicatulus is a species, then the currently recognised taxon P.
delicatulus is polyphyletic. The working hypothesis in this thesis is that P. cf. delicatulus is
probably a species, and that resolution of other characters states must be accompanied by
control region sequencing.
153
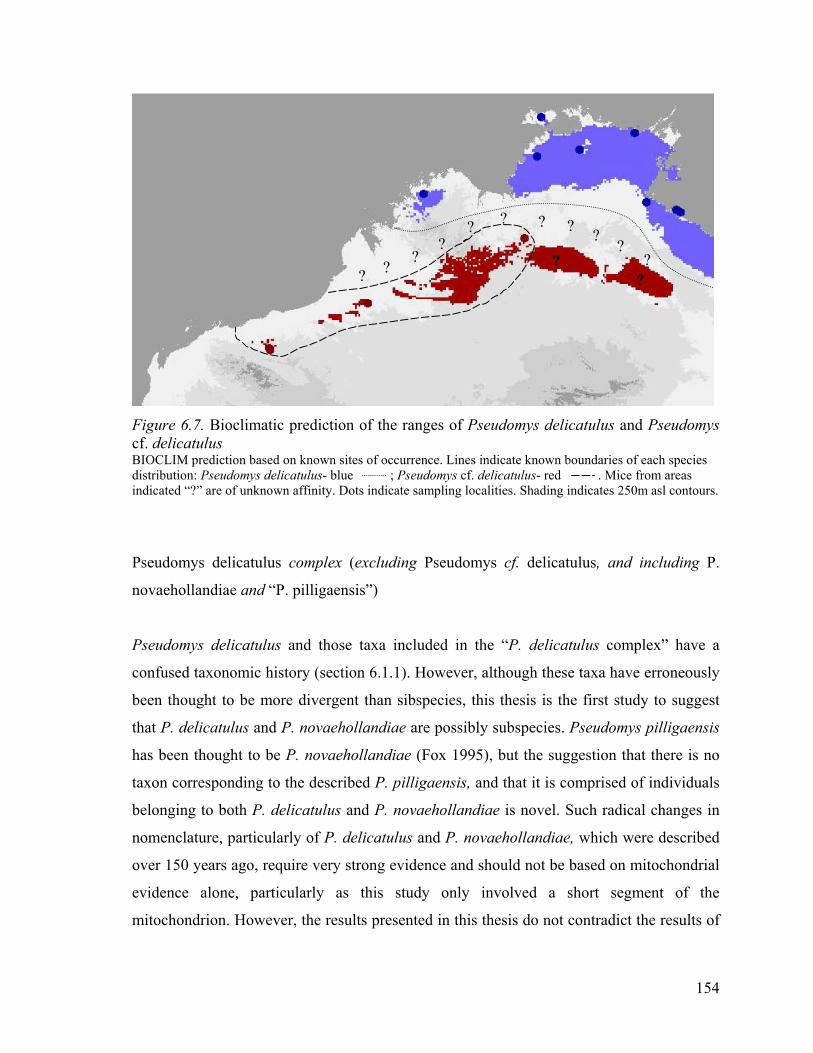
Figure 6.7. Bioclimatic prediction of cf. delicatulus BIOCLIM prediction based on known sites ofdistribution: Pseudomys delicatulus- blue indicated “?” are of unknown affinity. Dots in
Pseudomys delicatulus complex (exc
novaehollandiae and “P. pilligaensis”)
Pseudomys delicatulus and those tax
confused taxonomic history (section 6
been thought to be more divergent th
that P. delicatulus and P. novaehollan
has been thought to be P. novaeholla
taxon corresponding to the described P
belonging to both P. delicatulus and P
nomenclature, particularly of P. delica
over 150 years ago, require very stron
evidence alone, particularly as thi
mitochondrion. However, the results p
?
the r
occu ; Pdicat
ludin
a in
.1.1)
an s
diae
ndia
. pi
. no
tulu
g ev
s st
rese
?
ang
rrencseude sam
g P
clud
. Ho
ibsp
are
e (F
lliga
vae
s an
iden
udy
nted
?
es of
e. Linomys pling
seud
ed i
wev
ecies
poss
ox 1
ensi
holla
d P.
ce an
onl
in th
?
Pseudomys
es indicate knocf. delicatulus- localities. Shad
omys cf. del
n the “P. de
er, although t
, this thesis i
ibly subspeci
995), but the
s, and that it
ndiae is nov
novaeholland
d should not
y involved
is thesis do n
?
?
?delicatulus
wn boundarired . Ming indicates
icatulus, a
licatulus c
hese taxa
s the first
es. Pseudo
suggestion
is compris
el. Such ra
iae, whic
be based
a short
ot contrad
?
an
es oice 25
nd
om
hav
stu
m
th
ed
dic
h w
on
seg
ict
?
?
?d
f f0
p
e
d
ys
a
o
a
e
m
m
?
?Pseudomys
each species rom areas m asl contours.
including P.
lex” have a
erroneously
y to suggest
pilligaensis
t there is no
f individuals
l changes in
re described
itochondrial
ent of the
the results of
154
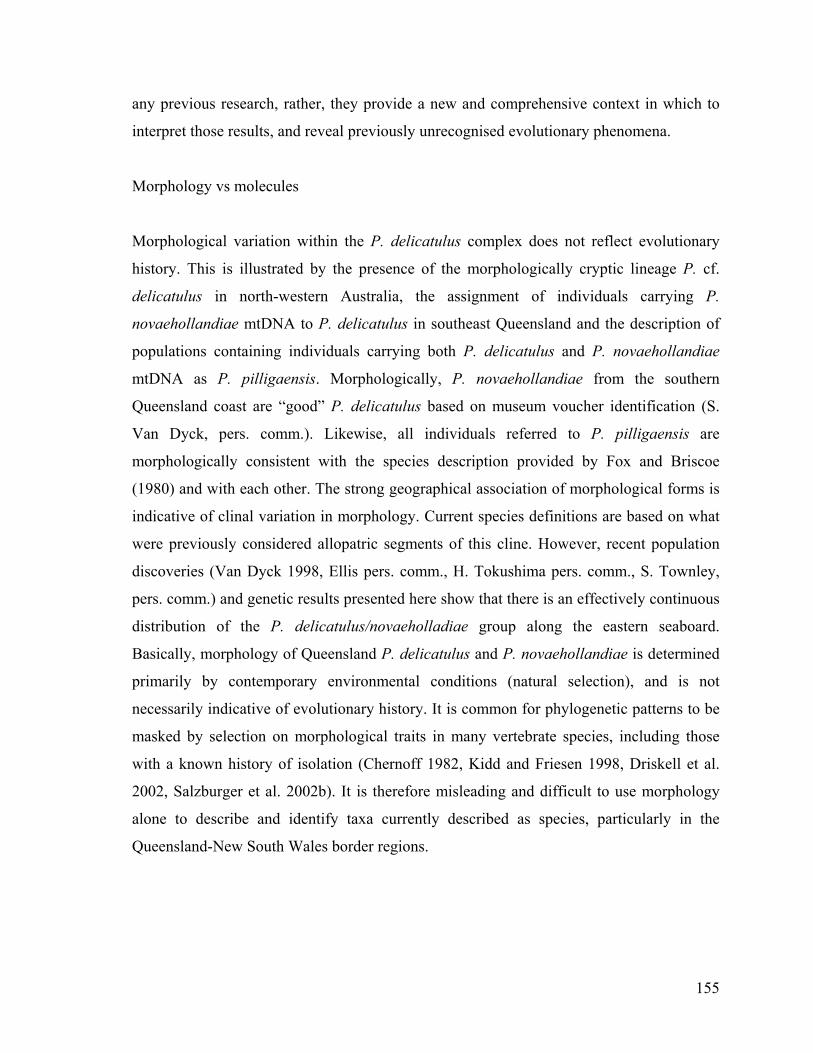
any previous research, rather, they provide a new and comprehensive context in which to
interpret those results, and reveal previously unrecognised evolutionary phenomena.
Morphology vs molecules
Morphological variation within the P. delicatulus complex does not reflect evolutionary
history. This is illustrated by the presence of the morphologically cryptic lineage P. cf.
delicatulus in north-western Australia, the assignment of individuals carrying P.
novaehollandiae mtDNA to P. delicatulus in southeast Queensland and the description of
populations containing individuals carrying both P. delicatulus and P. novaehollandiae
mtDNA as P. pilligaensis. Morphologically, P. novaehollandiae from the southern
Queensland coast are “good” P. delicatulus based on museum voucher identification (S.
Van Dyck, pers. comm.). Likewise, all individuals referred to P. pilligaensis are
morphologically consistent with the species description provided by Fox and Briscoe
(1980) and with each other. The strong geographical association of morphological forms is
indicative of clinal variation in morphology. Current species definitions are based on what
were previously considered allopatric segments of this cline. However, recent population
discoveries (Van Dyck 1998, Ellis pers. comm., H. Tokushima pers. comm., S. Townley,
pers. comm.) and genetic results presented here show that there is an effectively continuous
distribution of the P. delicatulus/novaeholladiae group along the eastern seaboard.
Basically, morphology of Queensland P. delicatulus and P. novaehollandiae is determined
primarily by contemporary environmental conditions (natural selection), and is not
necessarily indicative of evolutionary history. It is common for phylogenetic patterns to be
masked by selection on morphological traits in many vertebrate species, including those
with a known history of isolation (Chernoff 1982, Kidd and Friesen 1998, Driskell et al.
2002, Salzburger et al. 2002b). It is therefore misleading and difficult to use morphology
alone to describe and identify taxa currently described as species, particularly in the
Queensland-New South Wales border regions.
155

An interrupted cline and the deceptive “Gonzo syndrome”
Many characters differ between the type of P. delicatulus Gould 1842 from the Cobourg
Peninsula, Northern Territory, and the type of P. novaehollandiae Waterhouse 1843, from
the Hunter Valley, New South Wales. There is a pronounced accessory cusp on the M1
molar of P. delicatulus that is lacking in P. novaehollandiae (Thomas 1910, Troughton
1937). Pseudomys novaehollandiae is darker, exhibits less contrast between the upper and
lower pelage, has a relatively shorter tail, and is heavier (Watts and Aslin 1981). It
possesses dark shading behind the nose that Van Dyck (1998) described as the “Gonzo
syndrome” (pg. 51) in reference to the fact that it creates a somewhat elongate appearance
of the nose that is not seen in P. delicatulus. Like other Bassian Pseudomys species (P.
fumeus, P. higginsi, P. oralis and P. shortridgei), P. novaehollandiae has a bi-coloured tail
(Kemper 1995). Pseudomys delicatulus from the Cobourg Peninsula lack an apical hook
on their sperm head that is present in P. novaehollandiae, and the tail of the sperm is
attached to the head at different points in the two taxa (Breed 1997). Pseudomys
novaehollandiae differs from P. delicatulus in having a shorter, telocentric, Y chromosome
and lacks a second metacentric autosomal pair (Baverstock et al. 1977b). It shares the peri-
centric inversion in pair 8 present in Queensland P. delicatulus but not Northern Territory
P. delicatulus (Baverstock and Watts 1974, Baverstock et al. 1977b, Baverstock et al.
1983).
The type localities of P. delicatulus and P. novaehollandiae are, however, over 3000km
apart, not allowing for the linear near-coastal distributions of these species. Intermediate
geographical locations yield animals with intermediate forms of many characteristics that
distinguish these species (fig. 6.8). Body weight and colouration are the best indicators of
clinal variation, particularly along the eastern coast. Body weight varies from less than ten
grams in P. delicatulus of the Top End and north Queensland (Braithwaite and Brady 1993)
to over 25g in P. novaehollandiae in southern Victoria and Tasmania (Pye 1991). Through
Queensland, body weights are intermediate (field data, A. Kutt pers. comm., N. Thurgate
pers. comm.). Adult mice in the Pilliga carrying both P. delicatulus and P. novaehollandiae
mtDNA haplotypes weigh 10-12g (Fox 1995a). New South Wales coastal P.
156

novaehollandiae weigh 16g on average (Kemper 1995, Haering and Fox 1997). Animals
tend to have a darker or more muted pelage further south, with the description of P.
pilligaensis intermediate between that of P. delicatulus and P. novaehollandiae (Fox and
Briscoe 1980).
Isozyme studies showed fixed differences at only three loci (of twenty) between P.
delicatulus and P. novaehollandiae, considerably less than between other Pseudomys
species except P. albocinereus and P. apodemoides (4) (Baverstock et al. 1981).
Baverstock et al.’s (1981) study did not include central Queensland individuals, which were
shown previously to exhibit different patterns of variability to the north Queensland
specimens included in their analysis (eg, at the PGM2 locus: individual 14M (Baverstock et
al. 1977a)). It would be expected that central Queensland individuals might be more similar
to P. novaehollandiae on the basis of results presented in this thesis, although variability at
isozyme loci used to examine these taxa is apparently low, and little difference may have
been observed.
A characteristic that has lead to much taxonomic confusion in the delicate mice is the
presence or absence of an accessory cusp on the M1 molar. Thomas (1910) Troughton
(1937, 1941), Tate (1951) and Crabb (1977) attached a great deal of taxonomic significance
to the expression of this cusp, but other authors have noted that there is considerable
variation in expression of the cusp within P. delicatulus and P. novaehollandiae, and other
rodents both within and outside the conilurine fauna (Ellermann 1941, Keith and Calaby
1968), and rightly regard it as a poor taxonomic character (Ride 1970, Mahoney and
Marlow 1968). Mahoney and Marlow (1968) noted that within a single population of P.
novaehollandiae the cusp was variably present or absent, and P. novaehollandiae was the
type of a subgenus based around not possessing a cusp (Thomas 1910). No complete
examination of the geographical distribution of this variation has been presented. However,
it is worth noting that Troughton (1936) described the species Gyomys pumilus from the
Rockhampton-Maryborough area in southeast Queensland due to the absence of an M1
cusp. Troughton noted that it was the smallest member of the genus, which also contained
P. novaehollandiae, at that time known only from localities well to the south. Gyomys
157
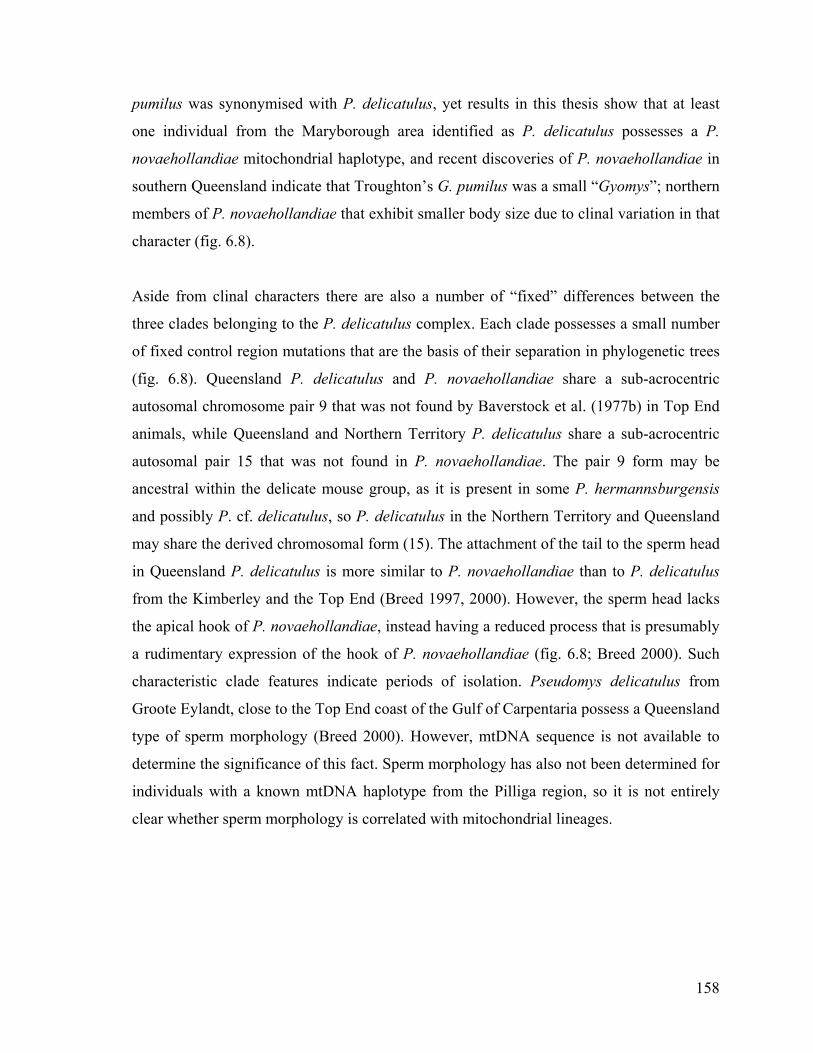
pumilus was synonymised with P. delicatulus, yet results in this thesis show that at least
one individual from the Maryborough area identified as P. delicatulus possesses a P.
novaehollandiae mitochondrial haplotype, and recent discoveries of P. novaehollandiae in
southern Queensland indicate that Troughton’s G. pumilus was a small “Gyomys”; northern
members of P. novaehollandiae that exhibit smaller body size due to clinal variation in that
character (fig. 6.8).
Aside from clinal characters there are also a number of “fixed” differences between the
three clades belonging to the P. delicatulus complex. Each clade possesses a small number
of fixed control region mutations that are the basis of their separation in phylogenetic trees
(fig. 6.8). Queensland P. delicatulus and P. novaehollandiae share a sub-acrocentric
autosomal chromosome pair 9 that was not found by Baverstock et al. (1977b) in Top End
animals, while Queensland and Northern Territory P. delicatulus share a sub-acrocentric
autosomal pair 15 that was not found in P. novaehollandiae. The pair 9 form may be
ancestral within the delicate mouse group, as it is present in some P. hermannsburgensis
and possibly P. cf. delicatulus, so P. delicatulus in the Northern Territory and Queensland
may share the derived chromosomal form (15). The attachment of the tail to the sperm head
in Queensland P. delicatulus is more similar to P. novaehollandiae than to P. delicatulus
from the Kimberley and the Top End (Breed 1997, 2000). However, the sperm head lacks
the apical hook of P. novaehollandiae, instead having a reduced process that is presumably
a rudimentary expression of the hook of P. novaehollandiae (fig. 6.8; Breed 2000). Such
characteristic clade features indicate periods of isolation. Pseudomys delicatulus from
Groote Eylandt, close to the Top End coast of the Gulf of Carpentaria possess a Queensland
type of sperm morphology (Breed 2000). However, mtDNA sequence is not available to
determine the significance of this fact. Sperm morphology has also not been determined for
individuals with a known mtDNA haplotype from the Pilliga region, so it is not entirely
clear whether sperm morphology is correlated with mitochondrial lineages.
158
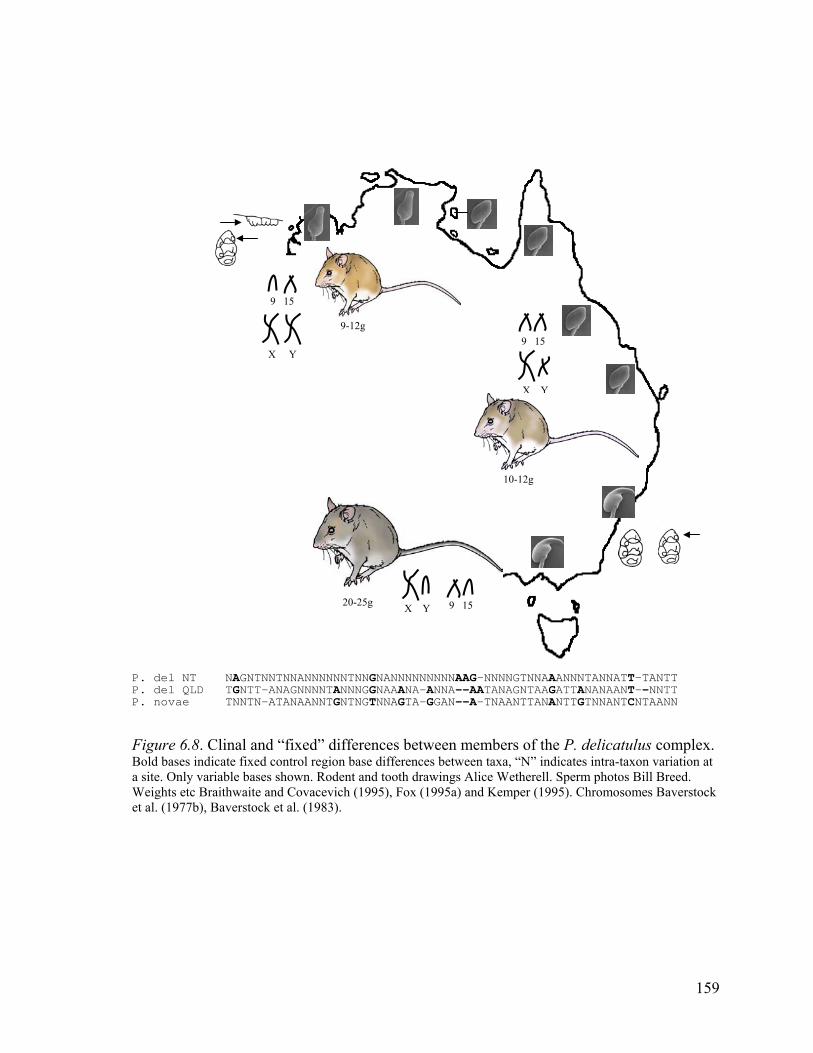
9-12g
10-12g
X Y
9 15X Y
9 15
20-25g X Y 9 15
P. del NT NAGNTNNTNNANNNNNNTNNGNANNNNNNNNNAAG-NNNNGTNNAAANNNTANNATT-TANTT P. del QLD TGNTT-ANAGNNNNTANNNGGNAAANA-ANNA--AATANAGNTAAGATTANANAANT--NNTT P. novae TNNTN-ATANAANNTGNTNGTNNAGTA-GGAN--A-TNAANTTANANTTGTNNANTCNTAANN
Figure 6.8. Clinal and “fixed” differences between members of the P. delicatulus complex. Bold bases indicate fixed control region base differences between taxa, “N” indicates intra-taxon variation at a site. Only variable bases shown. Rodent and tooth drawings Alice Wetherell. Sperm photos Bill Breed. Weights etc Braithwaite and Covacevich (1995), Fox (1995a) and Kemper (1995). Chromosomes Baverstock et al. (1977b), Baverstock et al. (1983).
159

Incipient, sub- or sib-species?
It appears there is contemporary isolation of Kimberley/Top End P. delicatulus from
Queensland P. delicatulus (section 6.4.2), but the division apparent in genetic analysis
almost certainly pre-dates this separation. These clades have successfully interbreed in
captivity, and Baverstock et al. (1977a) found no reasons to recognise the clades as distinct
species on the basis of isozyme divergence. The presence of P. delicatulus on islands in the
Gulf of Carpentaria (Woinarski 2000) and in New Guinea (Flannery 1995) provides
evidence that populations of delicate mice occupied habitats between Cape York, New
Guinea and the Top End during the last glacial period. Reconstructions of habitats
surrounding the pre-historic Lake Carpentaria also indicate suitable habitats for the species
existed in areas that were inundated by the Gulf 10ka (section 2.3.2). The region now
flooded by the Gulf has also been subject to periods of aridity on an ~2500 year cycle (De
Dekker 2001), and aridity may have caused periodic geographical separation of Cape York
and Top End P. delicatulus in the absence of a water barrier. Given the probable frequent
contact between these areas, it is surprising that they are appear to be reciprocally
monophyletic and to possess traits such as different sperm morphology that are constant
among individuals within a region. Greater sampling of Cape York may well alter this
apparent pattern, as movements of animals from the Gulf Plain and Arafura Plain
presumably would occur equally to the Top End and Cape York as sea level rose. The
presence of “Queensland” sperm type on Groote Eylandt off the Top End coast is
potentially an indication of that fact.
The genetic distinctness of Queensland P. delicatulus from P. novaehollandiae is similar to
the distinctness of P. delicatulus from the Top End and Queensland (average pair-wise
distances for control region 4.3% in both cases; minimum divergence between QLD and
NT= 3%, between QLD and P. novaehollandiae= 2.9%). This is harder to explain than
divergence of Queensland and Northern Territory populations due to the continuous land
connection between distributions of the two species throughout the Pleistocene. Nested
clade analysis of Queensland P. delicatulus, “P. pilligaensis” and P. novaehollandiae
suggested a possible explanation of factors leading to divergence of these clades. Three
160

major clades are identified in the nested cladogram (fig. 6.9). The majority of P. delicatulus
haplotypes fall within clade 4-1, and all Victorian and most inland New South Wales P.
novaehollandiae haplotypes fall within clade 4-3. The fact that there is slightly less genetic
distance between than within the two “species” results in clade 4-2 containing both P.
delicatulus haplotypes from central Queensland and P. novaehollandiae haplotypes from
coastal New South Wales and southern Queensland. Haplotypes derived from animals
referred to P. pilligaensis occur in all three major clades. Two individuals from the
northeast Queensland coast form a distinct clade within Queensland (clade 3-1). The
branches between “P. delicatulus” and “P. novaehollandiae” entailed more mutations than
the 95% confidence of the maximum parsimony network created by TCS, but the effects of
fragmentation are obvious (clade 4-2; χ2 30; p= 0.030: total cladogram; χ2 60.219; p=
0.003). Range expansion through central Queensland is suggested by the limited genetic
diversity found over two thousand kilometres of latitude from Weipa to the Pilliga,
although some evidence of IBD was found within clade 3-3 (χ2 22.028; p=0.013). Nested
clade analysis did not detect a significant effect of range expansion. This was probably due
to the fact the Weipa haplotype was not included, and the clade diagram did not identify the
major molecular clades as clades for nested analysis, a similar result to that obtained for P.
johnsoni, which also had long inter-clade branches. Populations of P. novaehollandiae
show relatively greater genetic divergence than Queensland P. delicatulus over similar
distances, and no evidence of range expansion or fragmentation was found. Myroniuk
(1998) has previously shown evidence of range fragmentation in a detailed study of P.
novaehollandiae. He noted isolation of Tasmania and subsequent isolation of western
Victoria from the remainder of mainland populations as important processes creating
genetic structure within the species.
161

Anglesea Loch Sport
Aramac Pilliga
Burra Range Port Stephens
Camp Milo Wilson’s Prom
Central Highlands Toowoomba
Goobang Townsville
1-1
2-1 3-14-1
1-13 1-14 1-3
1-5 1-24
1-12
1-10 1-19
1-23
1-7
1-6
1-11
1-8
1-9
2-3
2-5
2-11
2-9 2-12
2-6
2-10
2-7
2-8
3-3
3-7
3-5
3-6
4-2
4-3
1-2 1-4
2-2 2-4
3-2 3-4
“P. delicatulus”
“P. novaehollandiae”
Figure 6.9. Nested haplotype network of Pseudomys delicatulus (QLD), P. novaehollandiae and “P. pilligaensis” control region haplotypes. Large circles represent sequenced haplotypes (size= n). Small circles are unrecorded mutational steps. Shading as per key (may represent multiple sites within a region). Significant clades: 3-3 IBD, 4-4 PF, Total cladogram PF.
162

BIOCLIM distribution modelling of Queensland P. delicatulus and P. novaehollandiae
haplotypes predicts a zone of contact between the taxa stretching from the vicinity of the
Pilliga through south-eastern Queensland to the Maryborough region (fig. 6.10). Sampling
along this boundary is poor away from the Pilliga, but the fact that both mitochondrial
lineages are found in the Pilliga, and that at least one “P. delicatulus” from Maryborough
carries P. novaehollandiae mtDNA strongly supports the notion of secondary contact along
this zone. Contemporary convergence of suitable climatic factors and distributions
implicates changes in those factors in promoting past fragmentation of the species
distributions. The fact that much of central Queensland is predicted as climatically suitable
for P. delicatulus on the basis of a few reference points suggests a homogeneity of
conditions not present in the range of P. novaehollandiae. This also indicates a uniform
loss of habitat is a likely outcome of changing climate, unlike the complicated interactions
between microclimate and topography that may have prevented regional extinctions of P.
novaehollandiae despite changing climate causing local extinctions or range movement.
Figure 6.10. Bioclimatic range prediction
P. d
elic
atul
us
of Queensland Pseudomys delicatulus and Pseudomys novaehollandiae. Dots indicate sampling localities. Note large areas of predicted habitat in central Queensland compared to the fragmented distribution further south. Shading indicates 250m asl contours P. delicatulus- red ; P. novaehollandiae- blue.
Overlap/ “P. pilligaensis”
P. n
ovae
holla
ndia
e
163

Secondary contact in the Pilliga
The Pilliga mouse, Pseudomys pilligaensis Fox and Briscoe 1980 is a “species” of some
note. It is a threatened taxon, and is the only described rodent endemic to New South Wales
(Dickman et al. 2000). Following morphometric analysis and description of the Pilliga
mouse (Fox and Briscoe 1980), the authors pointed out “no single character, apart from
capture locality, can be cited to unambiguously distinguish P. pilligaensis from its nearest
relatives” (Briscoe et al. 1981 pg. 89). They therefore relied on corroborative evidence
from an isozyme study to justify recognition of a new species. They found that P.
pilligaensis was as distinct from P. novaehollandiae and P. delicatulus as these species
were from each other in isozyme studies, and considered this good evidence of specific
distinction. Differences between P. delicatulus, P. novaehollandiae and P. pilligaensis
amounted to; two alleles unique to P. delicatulus, two to P. pilligaensis, and three to P.
novaehollandiae, at seven variable loci. The study used tissues from a captive colony of P.
delicatulus held in Adelaide. Based on the results of Baverstock et al. (1977a) Briscoe et al.
(1981) felt these tissues would be suitable because P. delicatulus was invariable across its
distribution. They further concluded that differences between P. delicatulus and P.
pilligaensis were greater than differences between Queensland and Western Australian P.
delicatulus. However, only 11 of 25 enzyme systems screened in the two studies were
common to both. One of these (G6PD) produced different results for Baverstock et al.
(1976) when examining P. delicatulus from central Queensland than it did for Briscoe et al.
(1981) using lab stock. Briscoe et al. (1981) were correct in suggesting on the basis of their
results that mice in the Pilliga were as distinct as populations of P. delicatulus and P.
novaehollandiae that they examined. However, the context of the genetic study was
probably inadequate, and the differences they found between taxa were minor. Their study
was unavoidably confounded by the unexpected circumstance of having both their critical
comparative taxa present within the Pilliga population, a fact that has not been recognised
until the results of this thesis.
Two important points arise from the studies of Fox and Briscoe (1980) and Briscoe et al.
(1981); 1) mice in the Pilliga are intermediate, both morphologically and genetically,
164

between P. delicatulus and P. novaehollandiae, 2) There is very little genetic difference
between P. delicatulus and P. novaehollandiae. The alternative to Fox and Briscoe’s (1980)
and Briscoe et al’s (1981) interpretation of these facts is provided by mtDNA sequencing,
and was outlined above; the Pilliga is a region of secondary contact between recently
diverged sib-taxa. The important issue is now to determine what the status of those two
taxa is. Haplotypes belonging to both mitochondrial lineages occur at every site in the
Pilliga from which I have tissue (fig. 6.11), and the northern lineage, P. delicatulus, also
occurs in Binnaway Nature reserve, 85km south of the Pilliga. The inconsistency between
species assignment based on morphology and mtDNA also stretches over 650km to the
northeast of the Pilliga to the Maryborough region. Overlap between mtDNA haplotypes of
P. delicatulus and P. novaehollandiae therefore occurs over a very large area, considerably
wider than typical murine hybrid zones (Sage et al. 1986, Bonhomme and Guenet 1989).
Pseudomys bolami and P. hermannsburgensis, P. hermannsburgensis and P. cf.
delicatulus, and P. hermannsburgensis and P. delicatulus are all sympatric in parts of their
ranges. It would therefore not be surprising if P. delicatulus and P. novaehollandiae were
also sympatric where climatic conditions were favourable for both species. However, P.
delicatulus and P. novaehollandiae are not so genetically distinct as other species. DHFR
intron 1 provided circumstantial evidence of gene flow between mitochondrial haplotypes,
but more work using rapidly evolving microsatellite loci is required to establish whether
that is the case. Pseudomys novaehollandiae and individuals described as P. pilligaensis
have successfully bred in captivity. However, Fox (1995a) states that laboratory breeding
indicates that hybrid offspring of P. novaehollandiae and P. pilligaensis are infertile. This
is not the case, as trials were never completed and the results were inconclusive (L. Lim
pers. comm.). It seems highly unlikely that individuals from the Pilliga that differ by only
one or two control region mutations from nearby populations of “good” P. novaehollandiae
would be unable to inter-breed. Whether P. delicatulus from the Pilliga could do so is
another question. Resolution of the species integrity of P. novaehollandiae is a priority, and
in conjunction with microsatellite studies may rely on the further determination of the rate
at which morphological change occurs through the Pilliga region from “P. delicatulus” to
“P. novaehollandiae”, and on the change in characters such as sperm morphology and
165

karyotype, which must be isolated from individuals with a known mtDNA profile. So far,
only P. delicatulus-type sperm has been reported from Pilliga animals (Breed 2000). It
seems that Van Dyck’s (1998; pg. 50) concern that discovery of new populations of small
Pseudomys in southern Queensland and northern New South Wales might cause a
“taxonomic mega-toothache” has become a reality.
Figure 6.11. Location of sampling sites and control region clade frequency in the Pilliga. n= Site 1 and 3 (3), Site 2 (2), NR (4). “Pseudomys delicatulus” ; “P. novaehollandiae” . Map and samples provided by Hideyuki Tokushima.
Complex evolution
Evolution within the P. delicatulus complex has apparently proceeded as shown in figure
6.12. As with any such interpretation, there are numerous alternative scenarios, but until
better resolution of the situation in the Pilliga-Maryborough region is forthcoming, a simple
account seems the most appropriate. An ancestral Pleistocene taxon was distributed
166
throughout northern and eastern (non-arid) Australia. It was probably clinal in features such
as body size and colouration and had increasingly complex sperm morphology from
northwest to southeast. The ancestral P. delicatulus’ distributional limits would have
fluctuated with climate, but the overall pressure of increasing aridity would have forced the
species outwards (coast-wards) in the long term. At some stage, severe cyclical aridity
began to fragment the near-coastal distribution via repeated flooding of the Gulf of
Carpentaria, arid corridors through the southern Gulf (when exposed), and aridity in central
and southern Queensland.
A potential arid barrier through central-southern Queensland may have been present where
belt of dry habitats of the Brigalow Belt currently reach the coast near Gladstone and
Rockhampton (Thackway and Creswell 1995). The Burdekin Gap is a similar coastal
extension of the Brigalow Belt in north Queensland that had a significant effect in isolating
populations of many species during the Pleistocene (Moritz et al. 2000). Populations in the
Top End and south-eastern Australia would have experienced more mild climatic extremes
than those in central Queensland, and there is high genetic diversity or IBD still evident in
populations from those regions, rather than range expansion or bottlenecks, suggesting
limited extinction when compared to populations in central Queensland. The genetic
diversity of the Top End presumably corresponds to the contraction of populations from the
exposed Arafura plain to the region as sea levels rose. I see no reason that the same should
not be true of Cape York. The preservation of high diversity in the relatively small area of
the Top End suggests that the area exploited by taxa such as P. bolami and intra-specific
lineages within P. johnsoni during the LGM must have been very small indeed to produce
the minimal genetic diversity of those taxa.
Queensland mice and P. novaehollandiae are now apparently in secondary contact.
Although P. delicatulus and P. novaehollandiae have evolved some distinct features in
isolation, the resumption of local selection regimes on previously clinal characters such as
body size has resulted in identical morphology where the two mtDNA lineages are
sympatric. This phenotype has been described as P. pilligaensis, but has a broader
167

distribution through southeast Queensland and northern New South Wales. Whether there
is a smooth gradient in morphology across this region is unclear.
Mice from the Kimberley-Top End and Queensland do not exhibit the same degree of
morphological distinctness as Queensland P. delicatulus do from P. novaehollandiae
despite an equal degree of genetic distinctness. This fact has resulted in the description of
Kimberley-Top End and Queensland animals as a single species, including the genetically
very distinct Pseudomys cf. delicatulus from more arid parts of north-western Australia.
This indicates a strong north-south cline in the phenotypes of the species involved, but less
variation east-west. Therefore, the northwards contraction of Queensland animals did not
create significant morphological differences between Queensland, the Kimberley and the
Top End, when compared to the degree of differences compared to the southeast. Based on
the loss of intermediate Queensland forms, distinctness at several characters, and evidence
of clinal morphology, it could be argued that P. delicatulus and P. novaehollandiae do
represent true species, and that their sympatry and identical morphology in the Pilliga
region is the result of the southern end of a P. delicatulus cline coming into contact with the
northern end of a P. novaehollandiae cline (but see above).
The Kimberley has emerged from this study, and that of the pebble-mound mice, as an area
of dynamic evolutionary processes. Unfortunately, sampling of the mice from the
Kimberley and the genetically diverse populations of the Top End was not sufficient to
allow more detailed investigations of phylogeography or to determine the geographical
distributions of P. delicatulus and Pseudomys cf. delicatulus in the region. However, as
expected based on general area relationships, populations of mice in the northern
Kimberley are genetically most similar to P. delicatulus from the Top End. In this respect
P. delicatulus differs from the pebble-mound mice. Pseudomys delicatulus would have
exploited exposed habitats of the North-west Shelf and Arafura Plain during periods of
heightened aridity and lowered sea level, and this would have allowed re-colonisation of
the Kimberley from that region even if habitats became unsuitable during glacial maxima,
or the species may have been better able to exploit moist gorge refugia within the
Kimberley than the pebble-mound mice. The opportunity for Top End populations to move
168
or expand their range during significant periods of the Pleistocene is probably responsible
for the very high levels of genetic diversity still present in the region. The described
subspecies Pseudomys delicatulus mimulus Thomas 1926 from Groote Eylandt and the Sir
Edward Pellew group has no evolutionary basis. Although no animals from Groote Eylandt
were sequenced, mtDNA sequence from the Pellew group differed by only a few mutations
from nearby mainland populations.
169

a)
b)
Figure 6pilligaena) An ancecyclical arpopulationcline are rnot necessSouthwardnovaehollacharactersPopulation
?
.12. Evsis”). stral, cliidity durs to extin
einforcedarily con colonisndiae. C
. The Kim extincti
X
olution
nal, speciesing glacial ction. Mor. Exposed temporaneation by Qulinal phenoberley is r
on X; Rang
X
X Xof th
is diphasepholsea bous eeenstypice-cole mo
X
e
strs e
ogedvenlan vonve
X
P
ibv
icas ttsd arism
X
.
utenl
o aPiaeden
X
c)
delicatulus complex (inc. P. novaehollandiae and “P.
ed widely throughout northern and eastern Australia. b) Increasing tually fragments the distribution and forces central Queensland distinctions between the southern and northern end of a phenotypic the north are exploited and New Guinea is colonised. These were nd b) may cover several hundred thousand years until 20ka c) . delicatulus post LGM results in secondary contact with P. tion is partly renewed, but each clade retains some unique from the Northwest Shelf?. Limit of arid zone ; Coastline ; t ; Lake Carpentaria .
170

6.4.4 SPECULATIONS ON DELICATE MOUSE EVOLUTION
The delicate mice were chosen as a study group because they are widespread generalists
with distributions that largely reflect the major bioregions of Australia. Results presented in
this chapter show that the evolution of delicate mice reflects general biotic patterns very
well, in fact, better than current taxonomy indicates. There is a central Australian species
(P. hermannsburgensis) that exhibits no genetic structuring. There is a suite of five taxa
distributed around the continental periphery that are highly structured, that exhibit evidence
of long-term occupation of some regions and periodic fragmentation and bottlenecking into
refuge areas. The taxonomic status of these taxa needs critical examination through
breeding trials and correlation between DNA sequence and other characters such as sperm
morphology and karyotype.
Range movement and population extinction in response to arid conditions seem to be
important factors in the recent evolution of the group. The P. delicatulus complex has
largely been able to avoid arid conditions on the exposed sea bed of the Arafura Plain and
in the Kimberley and the Top End, where the greatest intra-taxon genetic diversity of any
species or taxon studied in this thesis is observed (5.8%). Northern and coastal Queensland
and south-eastern Australian populations have also largely avoided severe arid conditions.
However, genetic divergence of clades within the P. delicatulus complex is evident due to
shorter periods of isolation and extinction of geographically intermediate populations
during recent glacial maxima, and flooding of the Gulf of Carpentaria. The importance of
preservation of intra-clade genetic diversity is apparent in the control region distance tree
(fig. 6.2). Were populations of P. delicatulus from the Top End to undergo a series of
extinctions that left a genetic diversity comparable to that seen in P. bolami a similar
pattern of “species” would begin to emerge from the P. delicatulus complex. The evolution
of P. cf. delicatulus has probably resulted from restriction to the Pilbara during a
Pleistocene arid phase, but the (species?) has since had time to adapt to conditions currently
found in the Great Sandy Desert and exhibits almost the same level of genetic diversity as
P. novaehollandiae (based on only five sequences). This suggests that P. cf. delicatulus is
now able to effectively track environmental change without losing genetic diversity. The
171
origin of P. bolami was possibly a similar bottleneck. However the recent history of this
species has masked and hint of what may have been its origins. The current lack of genetic
diversity seen in P. bolami is probably the result of a bottleneck along the southern coast.
Re-invasion of the mainland from the flooding Great Australian Bight at the end of the
LGM may have compounded the effects of the bottleneck.
The major lineages within the delicate mice seem to be (P. hermannsburgensis) vs (P. cf.
delicatulus, P. bolami and the P. delicatulus complex). The origin of these lineages is
obscure, but the central-periphery nature of their respective distributions suggests that
aridity may have played a part in the split, as it has in subsequent divergence of species
around the continental periphery. The dichotomy here lies in the fact that P.
hermannsburgensis inhabits recent environments, and yet retains ancestral characters when
compared to the derived karyotypes and sperm morphology of the P. delicatulus complex.
The fact that P. bolami and P. cf. delicatulus have only recently been recognised means
that their karyotype is not known, although that of a possible individual of P. cf. delicatulus
was described by Baverstock et al. (1977b) (section 6.4.3). The sperm morphology of P.
bolami is the ancestral form shared with P. hermannsburgensis and the majority of
hydromyine rodents, assuming that specimens examined by Breed (1997) were correctly
identified. That of P. cf. delicatulus is not known with any certainty, but may be the
derived form of the P. delicatulus complex. Further intrigue is provided by the fact that
although P. hermannsburgensis has an essentially ancestral karyotype, some individuals
were polymorphic for the peri-centric inversion leading to sub-acrocentric chromosomes of
autosomal pair nine. This re-arrangement is found among members of P. delicatulus
(QLD), P. cf. delicatulus? and P. novaehollandiae.
Resolution of the states of these characters in P. bolami and P. cf. delicatulus will greatly
aid in interpreting the evolution of this group. For instance, the origin of P. cf. delicatulus
may have been a more complex event than the simple allopatric divergence from P.
delicatulus suggested above. The current narrow distribution of P. cf. delicatulus is wedged
between P. hermannsburgensis and P. delicatulus, and could represent an ancient hybrid
zone, leading to a genetically and ecologically intermediate form.
172

6.5 Summary
- Current species taxonomy of the delicate mouse complex differs markedly from
evolutionary lineages identifiable within the complex
- Pseudomys pilligaensis does not represent a distinct evolutionary taxon, and is not a
species
- Pseudomys delicatulus as currently understood is comprised of at least two species,
P. delicatulus and Pseudomys cf. delicatulus, which is not a sib-taxon to the
remaining members of the currently recognised P. delicatulus (P. novaehollandiae
is closer).
- Pseudomys delicatulus from the northern Kimberley and Top End, P. delicatulus
from Queensland, and P. novaehollandiae, constitute evolutionary lineages of
roughly equivalent standing and inter-relatedness.
- Pseudomys delicatulus mimulus is an insular phenotype and has no evolutionary
basis
- There is evidence from captivity and DNA sequencing that P. delicatulus (QLD and
NT) and P. novaehollandiae can interbreed. Members of all three lineages should
be considered a sub-specific? complex pending microsatellite studies and/or inter-
breeding experiments. According to taxonomic precedence the complex should be
named P. delicatulus delicatulus (Kimberley and Northern Territory) P. delicatulus
novaehollandiae, and a new taxon, P. delicatulus stalkeri ssp. nov. (Queensland).
However P. novaehollandiae is entrenched in the literature and common usage, and
is a readily identified taxon except in parts of northern New South Wales and
southern Queensland. Therefore the nomenclatural status quo is a suitable
compromise until species boundaries are fully resolved.
- Distributions of delicate mice are under climatic control, and sympatry is observed
between all species in regions of climatic transition.
- Extinction and range movements have been central factors driving evolution of
delicate mice subspecies and species boundaries through bottlenecking of regional
populations. The effects of this are most pronounced in the current arid zone, where
three species exist due to a longer history of aridity.
173

- Populations around the wetter northern and eastern periphery of the continent have
been relatively untouched by aridity and extinction, except in central Queensland,
which has been recently re-invaded from the north by P. delicatulus.
- Arid barriers and flooding of the Gulf of Carpentaria have caused periodic isolation
of populations of the P. delicatulus complex in the late Pleistocene, but although
these have reinforced some fixed differences between intra-specific clades
(subspecies), speciation may not yet have occurred.
174

Chapter 7. Phylogeography of Zyzomys argurus
CHAPTER SUMMARY
Zyzomys argurus is distributed in three allopatric savannah regions across northern
Australia. There is very little divergence of control region sequences between allopatric
regions, and no historical signal of the LGM. Although IBD and geographical association
of haplotypes are evident, only populations in the Pilbara form a shallow monophyletic
clade, probably as a result of allopatric range fragmentation. Lack of genetic structure was
an unexpected result, as the preferred habitat of Z. argurus is rocky landscapes similar to
those preferred by the highly genetically structured pebble-mound mice. Ecological
adaptability of the species observed in some contemporary populations is likely to explain
the lack of genetic structure.
7.1 A medium-sized, specialised, taxon
Zyzomys argurus (Thomas 1889)
7.1.1 A (MOSTLY) ROCK RAT
There are four Zyzomys species described from northern Australia, however, only the
common rock-rat (Djoorri; Z. argurus) is widely distributed, and is regarded as a rock-
dwelling generalist by Trainor et al. (2000). Zyzomys argurus (<65g) is smaller than other
Zyzomys species, but significantly larger than the pebble-mound mice and delicate mice. It
appears to have a much wider tolerance to moisture regimes than other Zyzomys, and is
found from the northern edge of the arid zone to rainforest margins. The three large
Zyzomys species found in the Top End and the Kimberley are some of the few conilurine
species to show a distinct preference for wetter habitat, being associated with monsoonal
rainforest pockets near sandstone escarpments. Such a limited habitat preference has
resulted in allopatric and restricted distributions (Z. palatalis has been found at only four
175
locations within 30km of each other; Churchill 1996). There is some evidence that Z.
argurus is excluded from monsoonal forest habitats by larger Zyzomys species or has its
number suppressed within those habitats (Kerle and Burgman 1984, Begg and Dunlop
1985). Zyzomys argurus has a varied diet that contains high levels of plant material (seed,
leaves and stems) (Watts 1977, Begg and Dunlop 1985). It is usually associated with rock
outcrops, and Watts and Aslin (1981) proposed a reliance on rocky refuges due to
susceptibility to heat stress noted in captive animals that died when “accidentally left in the
sun”(!) (pg. 139). However, individuals are occasionally captured some distance from
major outcrops (Watts and Aslin 1981), and on the Wessel Islands of the Top End the
species can be found in hummock grassland devoid of rock outcrop (Woinarski and Fischer
1996). Despite a tolerance of arid conditions and flexibility in specific habitat preference,
Z. argurus is still apparently constrained by a similar general topographic preference to that
which dictates the spatial distribution of pebble-mound mice. Thus, populations in the
Pilbara are isolated from the Kimberley by the Great Sandy Desert and eastern Queensland
populations lie to the east of the Mitchell Grass Downs and Gulf Plains. The known
distribution of the species in eastern Queensland is enlarging rapidly with greater survey
effort. Although restricted to allopatric regions, all populations across northern Australia
are regarded as a single species. Lee et al. (1981) single out the species as having a large
distribution exhibiting little genetic variation following the work of (Baverstock et al.
1977a) that found no fixed isozyme differences between allopatric populations. However,
similar isozyme results were found for the highly genetically structured P. delicatulus
(Baverstock et al. 1977a).
Studies of Zyzomys argurus aimed to establish the effects of allopatry, in particular whether
any deep genetic structuring was evident within the species. Zyzomys argurus was chosen
as a relatively specialised taxon of similar size to the chestnut mice. The chestnut mice,
pebble-mound mice and delicate mice all exhibit species-level distinction of populations in
at least one of the allopatric regions in which Zyzomys argurus is distributed. It seems
unlikely that a taxon relatively restricted to rocky habitats (“specialised” for the purposes if
this discussion) would be less structured than the widespread, generalist, chestnut mice,
particularly given the deep division between specialised pebble-mound mouse clades in the
176

same regions. However, most other savannah rodents are considered single species across
the regions in question (Watts and Aslin 1995, Strahan 1995), including Leggadina
lakedownensis, a slightly smaller species with a very similar distribution to Z. argurus
(Strahan 1995).
7.2 Geographical sampling for genetic studies
Sampling of Z. argurus populations provided a reasonable geographical coverage of its
distribution, although only one or two individuals were sequenced from most populations
(fig. 7.1; table 7.1). Control region sequence was obtained from all populations. DHFR
intron 1 sequence was obtained from individuals from Inglis Gap, Litchfield National Park
and Woodstock Station.
Table 7.1. Sampling locations and tissue sources for Zyzomys argurus. (ABTC)- Australian biological tissue collection with museum voucher; ABTC- no voucher; NTMU- Northern Territory Museum; WAMM- Western Australian Museum. N= sample size. Sequence ID’s are used to identify individuals from a particular site in results trees. Site Lat. Long. N Type Source/voucher ID’s 1. Bullita -16.1167 130.4167 2 Liver (ABTC) NTMU 263, 264 Za16,17 2. Depot Creek -13.6467 131.5459 1 Tail Field biopsy (J. Griffiths) Za5 3. Enderby I -20.6080 116.5210 2 Liver ABTC 10594, 10597 Za14,15 4. Fortescue R -21.2910 116.1420 1 Liver ABTC 7897 Za8 5. Guluwuru Is -11.5200 135.4167 2 Liver (ABTC) NTMU 4101, 4102 Za19,20 6. Hidden Valley -19.0085 146.0916 2 Tail Field biopsies (Ford) Za1,2 7. Inglis Gap -17.1150 125.1760 1 Liver ABTC 7898 Za9 8. Litchfield NP -13.0685 130.7130 2 Liver (ABTC) NTMU 4167, 4168 Za21,22 9. Mitchell Plateau -14.8917 125.7500 3 Liver (ABTC) WAMM 21522, 21527,
21908 Za10,11,27
10. Nathan River
-15.2500 135.5167 2 Liv/Tl (ABTC) NTMU 752, Field Biop (Ford)
Za3,18
11. Nourlangie -12.7800 132.7000 1 Liver ABTC 8024 Za13 12. Pellew Is. -15.6666 137.0167 2 Liver (ABTC) NTMU 1423, 1426 Za23,24 13. Woodstock -21.6597 119.0417 2 Liver (ABTC) WAMM 28632, 32732 Za25,26 14. Wyndham -15.4860 128.1200 1 Liver ABTC 8023 Za12
177

Figure 7.1. Distribution of Zyzomys argDistribution of Z. argurus Western Australian MNumbers refer to population numbers given in ta
7.3 Phylogeography of Zyzomys arguru
7.3.1 MITOCHONDRIAL CONTROL REGION
Zyzomys argurus populations across no
differentiation and geographical structur
delicate mice (fig. 7.2). Twenty-two
haplotypes, but most differed from close
In a sequence alignment of 380bp only
Some shallow geographical structure i
evolution score: 0.11141), with Pilbara
1
3
4urus and useums fa
ble 7.1.
s
rthern Au
ing when
of 24 in
ly related
27 sites w
s evident
individua
5
sampling locationunabase (http://www.
stralia are strikin
compared to the
dividuals carried
haplotypes by on
ere variable (18
in distance anal
ls forming a mon
6
7
8
9
10
11
12
13
14
2
s. museum.wa.gov.au/faunabase).
g in their lack of genetic
pebble-mound mice and
unique control region
ly one or two mutations.
parsimony informative).
ysis (fig. 7.2; minimum
ophyletic clade, but this
178

clade differs by only two mutations from Kimberley haplotypes (figs. 7.2 and 7.3).
Queensland and Top End haplotypes do not form monophyletic clades. Bootstrapped
maximum-likelihood trees and parsimony trees do not reveal any well-supported clades
beyond uniting haplotypes from some island populations, and are not presented.
Nested clade analysis suggested few significant cases of restricted gene flow (fig. 7.3).
Populations in the Pilbara that showed slight evidence of allopatric fragmentation from
Kimberley populations due to the Great Sandy Desert yielded internally significant
geographical associations of haplotypes within clade 3-1, but the exact contingency test
was not significant (χ2= 6; p= 0.235). Fragmentation or IBD is evident between populations
distributed through the Top End, Gulf and VRD (clade 3-3; χ2= 26.667; p= 0.005).
Sampling was not detailed enough for the analysis to differentiate between these
hypotheses. However mainland populations are probably only affected by IBD. Island
populations may show evidence of fragmentation, but this is not the case for haplotypes
from the Sir Edward Pellew group (clade 1-9), which fall between haplotypes from the
adjacent mainland (clade 1-8; 1-11). There is a general geographical association of
haplotypes evident in the nested haplotype network, and IBD is inferred for the total
cladogram (χ2= 43.429; p= 0.000). The high level of haplotype diversity per individual,
general geographical association of haplotypes, and low number of missing mutational
steps in the haplotype network, suggests that population extinction has not been a major
factor forcing genetic structuring in this species. As a result, much more intensive sampling
of individuals is required to examine inter-population relationships in this species.
179

Za21Za22
Za3
Za18
3
Za24
Za5
Za13
Za2
d
FigurUnrooindividare hig
Za19Za20Za19
e 7.2ted neuals. hligh
Za20
0.01
Za1
Za9
Za270
Za12
Za1
Za
ZaZa25
Za17
. Genetic distance between Zyzomyighbour-joining tree of Kimura two-paramCodes correspond to a single individual thted (other populations= Kimberley and To
5Za15
s argurus ceter distanceat carried a pp End).
Za12
Za3
Za11
Pilbara
ontrol regios between 22 articular hapl
Queenslan
Za1Za10
Za2Za23
Za18
26Za26
8Za8
n haplotypes. haplotypes of 381bp from 24 otype. Allopatric populations
180

1-11
3-1
3-2
3-3
2-8
2-9
2-6
2-7
2-4
2-5
2-2
2-3
2-1
1-12
1-24
1-23
1-8
1-9
1-6
1-7 1-13
1-2
1-15
1-14
1-22
1-4
1-1
1-5
1-3
1-10
Gulf
Pilbara
Top End
Queensland
VRD
Kimberley
Broken circles= offshore islands
Figure 7.3. Nested haplotype network of Zyzomys argurus control region haplotypes. Large circles represent sequenced haplotypes (size=n). Small circles are unrecorded mutational steps. Shading as per key (may represent multiple sites within a region). Clades exhibiting significant effects: 3-1 AF, 3-3 IBD or F, Total cladogram IBD.
181
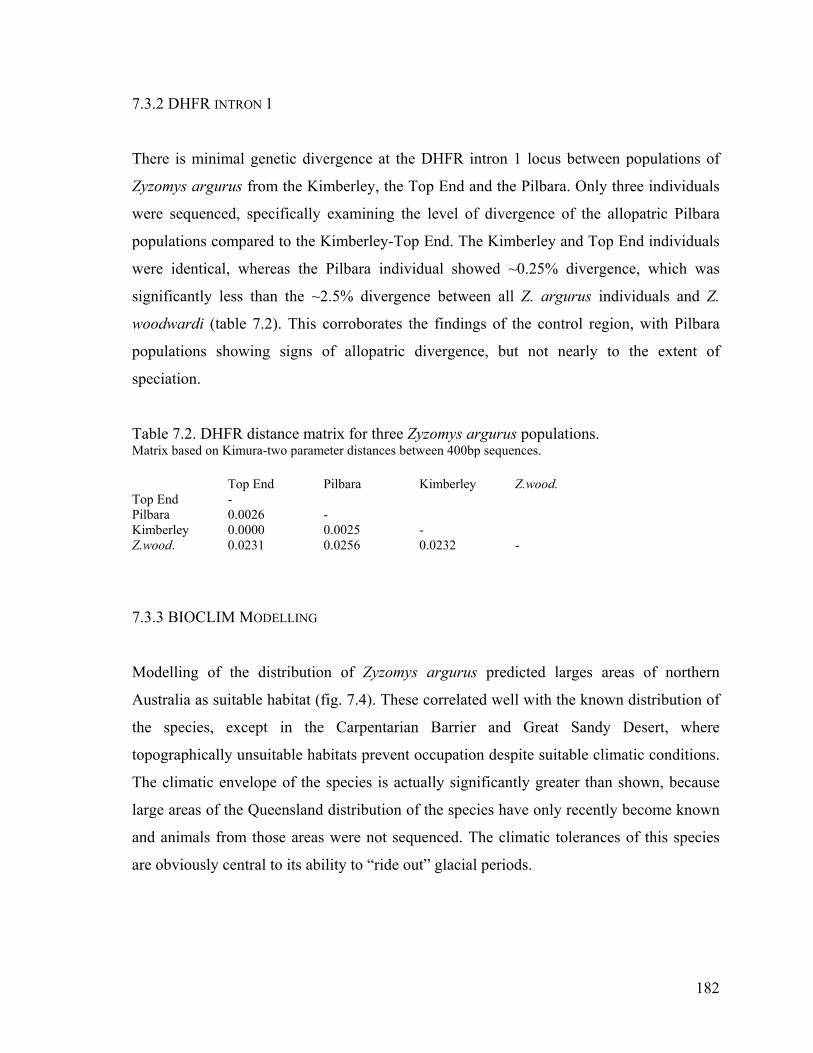
7.3.2 DHFR INTRON 1
There is minimal genetic divergence at the DHFR intron 1 locus between populations of
Zyzomys argurus from the Kimberley, the Top End and the Pilbara. Only three individuals
were sequenced, specifically examining the level of divergence of the allopatric Pilbara
populations compared to the Kimberley-Top End. The Kimberley and Top End individuals
were identical, whereas the Pilbara individual showed ~0.25% divergence, which was
significantly less than the ~2.5% divergence between all Z. argurus individuals and Z.
woodwardi (table 7.2). This corroborates the findings of the control region, with Pilbara
populations showing signs of allopatric divergence, but not nearly to the extent of
speciation.
Table 7.2. DHFR distance matrix for three Zyzomys argurus populations. Matrix based on Kimura-two parameter distances between 400bp sequences. Top End Pilbara Kimberley Z.wood. Top End - Pilbara 0.0026 - Kimberley 0.0000 0.0025 - Z.wood. 0.0231 0.0256 0.0232 -
7.3.3 BIOCLIM MODELLING
Modelling of the distribution of Zyzomys argurus predicted larges areas of northern
Australia as suitable habitat (fig. 7.4). These correlated well with the known distribution of
the species, except in the Carpentarian Barrier and Great Sandy Desert, where
topographically unsuitable habitats prevent occupation despite suitable climatic conditions.
The climatic envelope of the species is actually significantly greater than shown, because
large areas of the Queensland distribution of the species have only recently become known
and animals from those areas were not sequenced. The climatic tolerances of this species
are obviously central to its ability to “ride out” glacial periods.
182
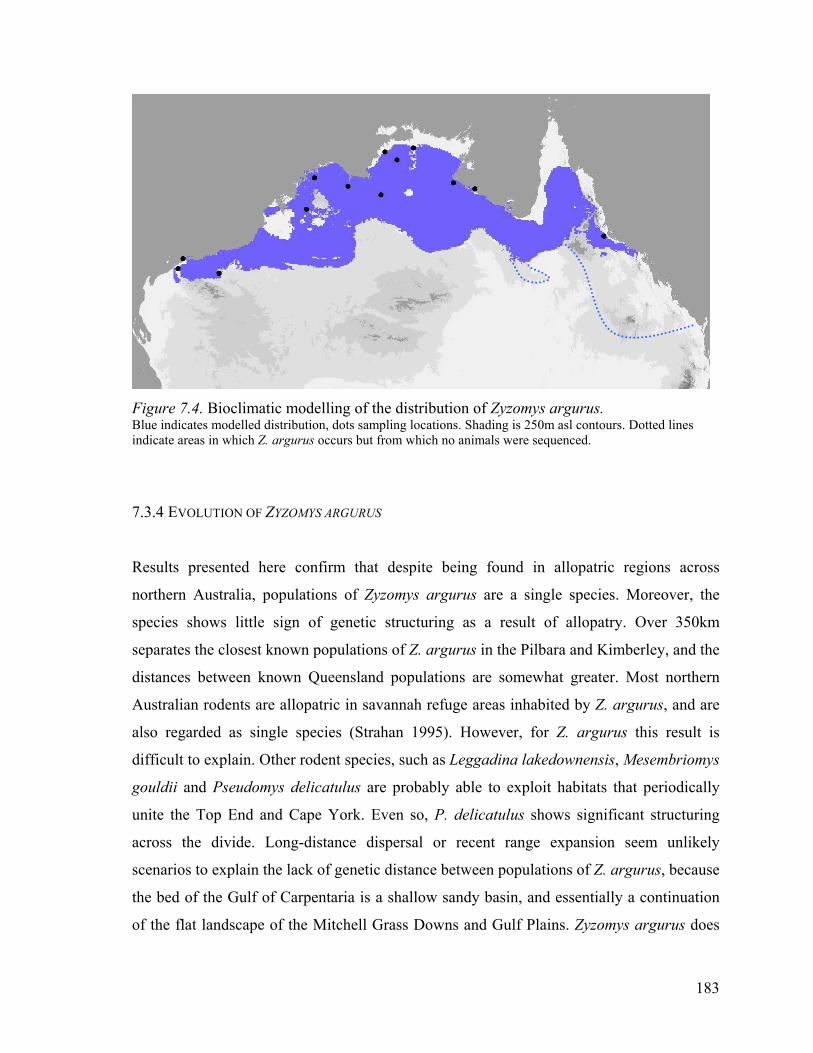
Figure 7.4. Bioclimatic modelling of the distribution of Zyzomys argurus. Blue indicates modelled distribution, dots sampling locations. Shading is 250m asl contours. Dotted lines indicate areas in which Z. argurus occurs but from which no animals were sequenced.
7.3.4 EVOLUTION OF ZYZOMYS ARGURUS
Results presented here confirm that despite being found in allopatric regions across
northern Australia, populations of Zyzomys argurus are a single species. Moreover, the
species shows little sign of genetic structuring as a result of allopatry. Over 350km
separates the closest known populations of Z. argurus in the Pilbara and Kimberley, and the
distances between known Queensland populations are somewhat greater. Most northern
Australian rodents are allopatric in savannah refuge areas inhabited by Z. argurus, and are
also regarded as single species (Strahan 1995). However, for Z. argurus this result is
difficult to explain. Other rodent species, such as Leggadina lakedownensis, Mesembriomys
gouldii and Pseudomys delicatulus are probably able to exploit habitats that periodically
unite the Top End and Cape York. Even so, P. delicatulus shows significant structuring
across the divide. Long-distance dispersal or recent range expansion seem unlikely
scenarios to explain the lack of genetic distance between populations of Z. argurus, because
the bed of the Gulf of Carpentaria is a shallow sandy basin, and essentially a continuation
of the flat landscape of the Mitchell Grass Downs and Gulf Plains. Zyzomys argurus does
183

show an ability to survive in areas free of rock outcrops, and the presence of populations on
rock-free islands off the Top End suggests an ability to disperse over sandy plains.
However populations restricted to rock-free islands are part of the rocky chain of the
Wessel Islands (Woinarski and Fischer 1996), suggesting an historical association with
nearby rocky landscapes. In general, landscapes inhabited by the species are the same as
those inhabited by pebble-mound mice, but Z. argurus is obviously more adaptable to
changing conditions, and does not have such a fundamental behavioural requirement for
rocky areas as do the pebble-mound mice.
In western Queensland there are two populations of Z. argurus in the Kynuna-Winton hills
to the west of the apparently substantial gap of the Mitchell Grass Downs (Fleming 1995,
G. Mifsud pers. comm.). The presence of Z. argurus on these relictual, relatively isolated,
hills is a function of either long-term population stability in small habitat patches, or an
ability to disperse over moderately long distances between suitable habitat. However,
although a single lateritic surface may have bridged the gap between rocky landscapes of
eastern and western Queensland over time scales involved in the divergence of P. patrius
and other pebble-mound mice (chapter 5), there is less chance of a connection recent
enough to explain the lack of divergence of Queensland and Top End Z. argurus (R.
Coventry pers. comm.). The plasticity of the species’ habitat preference has apparently
allowed migration through “unsuitable” environments that are not currently occupied.
Cracking clay soils of the western Queensland plains may have facilitated movement, as
these resemble rock crevices used as nesting sites by the species.
Suitable climates for the species exist throughout many regions of northern Australia. The
fact that there is no historical signal evident from the LGM indicates an astonishing
ecological resilience. The weak effects of IBD and geographical association of haplotypes,
and the presence of a monophyletic clade in the Pilbara, indicate a fairly stable distribution
since before the LGM. It seems very unlikely that the species’ distribution would track
habitat changes to the north, as that would entail wholesale changes in microhabitat
preference over very short time scales. Whatever the case, Z. argurus does not exhibit the
pattern of genetic divergence I expected of a “specialised” taxon distributed in three
184

allopatric regions separated by environments that seemingly lack key aspects of the species
normal habitat. Population divergence is, however, consistent with the current taxonomy of
the species and previous genetic findings (Baverstock et al. 1977a).
7.4 Summary
- Despite being comprised of allopatric populations that display a preference for the
same general landscapes as pebble-mound mice, Zyzomys argurus shows only
shallow genetic structure across its distribution.
- Zyzomys argurus populations in the Pilbara show signs of allopatric divergence due
to the mid-late Pleistocene formation of the Great Sandy Desert.
- Zyzomys argurus populations in Queensland and the Northern Territory do not form
monophyletic clades, and there is no evidence of range fragmentation in control
region sequence data subjected to nested clade analysis.
185

Chapter 8. Genetic divergence among chestnut mice and
Pseudomys desertor populations
CHAPTER SUMMARY
Results are presented from genetic studies of the chestnut mice (P. gracilicaudatus and P.
nanus) and P. desertor. Assumed nuclear copies of the mitochondrial control region
hampered study of the chestnut mice. Three clean sequences were obtained and they
revealed moderate genetic divergence of the Kimberley and Top End, and relatively deep
division of P. nanus (Northern Territory-Western Australia) and P. gracilicaudatus
(Queensland-New South Wales). This agrees with current species descriptions, but until
more comprehensive analysis can be performed, nothing can be said regarding the
phylogeography of these species. Pseudomys desertor exhibits low levels of genetic
divergence across the arid zone, similar to those found in P. hermannsburgensis. These
species have very similar distributions, and have presumably shared a similar recent
history. The range of P. desertor probably extended or moved to include central
Queensland during the LGM, and previous arid phases, and the species is still found in
semi-arid regions of central Queensland.
8.1 Generalist species
Pseudomys desertor Troughton 1932, Pseudomys gracilicaudatus (Gould 1845),
Pseudomys nanus (Gould 1858)
8.1.1 COMPARATIVE SPECIES
The species dealt with in this chapter were chosen for study because they have a similar
habitat preference to the delicate mice, and their distributions are comparable to the
distributions of P. delicatulus (including northern parts of the range of P. novaehollandiae)
and P. hermannsburgensis. Like the delicate mice, areas of sympatry occur between the
186

desert mouse (Wildjin; P. desertor) and each of the chestnut mice (Karrooka; P.
gracilicaudatus and Moolpoo; P. nanus) in areas of climatic interchange between wetter
savannahs and the arid zone (Fox 1995b, Robinson 1995, Kutt et al. in press). The chestnut
mice are allopatric sib-taxa distributed on either side of the Carpentarian Barrier. Despite
the ubiquity among rodents of a discontinuous distribution across the Carpentarian Barrier,
they are the only such sib-species pair in the savannah rodent fauna (excluding pebble-
mound mice). Both species have (or had) natural distributions that included large areas of
non-savannah habitats, including near-coastal areas along the eastern and western seaboard
(fig. 8.1; Kendric and Porter 1973, Mahoney and Posamentier 1975). In northern Australia
P. nanus is found as far inland as the northern Tanami Desert (Robinson 1995), and I have
found the species to be common on rocky ridges in the vicinity of Renner Springs at the
eastern margin of the Tanami. The northern distribution of P. gracilicaudatus is poorly
known, but new captures are expanding the range and number of known inland occurrences
of the species (S. Burnett pers comm., P. Williams pers. comm.)
There is no significant difference between skulls of the two chestnut mouse species (Watts
and Aslin 1981), and Ride (1970) felt they may constitute a single species. However,
chromosomal and electrophoretic studies revealed significant differences between the two
taxa (Baverstock et al. 1977b). Chestnut mice are the Australian equivalent of voles, being
large mice that consume substantial amounts of vegetation in their diet, but seeds are also
important, and moderate quantities of insect and fungus are eaten (Luo et al. 1994, Fox
1995b, Robinson 1995, Luo and Fox 1996). This allows co-existence with smaller, more
granivorous Pseudomys species such as P. novaehollandiae and P. patrius, and both P.
nanus and P. gracilicaudatus are members of rich rodent communities in parts of their
distribution (Luo and Fox 1995, Haering and Fox 1997, Woinarski 2000, personal
observation). The aims of chestnut mouse studies were to examine the pattern of
divergence across the Carpentarian Barrier, attempt to reconcile the widespread, generalist
nature of the species with speciation across this barrier, and to provide a comparative data
set for Pseudomys delicatulus, which is distributed in the same regions.
187
Pseudomys desertor is the ecological equivalent of the chestnut mice in central Australia,
and has been historically confused with the superficially similar P. nanus (Gould 1863,
Finlayson 1941), although the species are quite distinct (Troughton 1932), and would be
included in different genera under the taxonomic scheme proposed in chapter 4. Pseudomys
desertor is sympatric with P. nanus across the northern limit of its distribution, including
the Tanami Desert and southern Kimberley, where I have collected both from the same trap
line. Although Kerle (1995b) and Watts and Aslin (1981) show the distribution of P.
desertor to be restricted to central parts of the Northern Territory, South Australia and
Western Australia, the species is relatively common in central Queensland (Kutt et al. in
press), where it is replaced to the east by P. gracilicaudatus (fig. 8.1). Pseudomys desertor
can be found in a variety of habitats, including sand and clay plains and rocky ridges in
central Australia (Watts and Aslin 1981, Kerle 1995b, Read et al. 1999), and Eucalyptus
woodlands and grasslands in Queensland (Kutt et al. in press). I have recorded the species
in low acacia woodland on rocky ridges, open rocky spinifex, sandy flats and grasslands on
clay plains in central Queensland. It is unusual among Pseudomys species in exhibiting
partly diurnal tendencies (Read et al. 1999, Kutt et al. in press), and unlike most desert
conilurines is apparently solitary (Happold 1976). It has the ability to breed rapidly when
conditions are favourable (Happold 1976, Read et al. 1999). Watts and Aslin (1981)
described the range of P. desertor as “enormous” (pg. 182), yet most locations from which
P. desertor was sampled for this thesis fall outside the distribution they recognised (over
1500km to the east in some cases). Sampling of P. desertor therefore had two main
purposes; to confirm the identity of animals captured in Queensland, and to provide a set of
genetic distances for comparison with the similarly distributed P. hermannsburgensis.
8.2 Geographical sampling for molecular studies
Sampling of chestnut mice was representative of the distribution of the two species (fig.
8.1; table 8.1). However, few individuals per site were sampled and results were limited
due to the presence of nuclear pseudogenes (section 8.3.1). Sampling locations are
concentrated in the east of the distribution of P. desertor, but provide suitable coverage of
188

the arid zone for comparison to P. hermannsburgensis sampled from the same sites (fig.
8.1; table 8.1).
Table 8.1. Sampling locations and tissue sources for chestnut mice and P. desertor. (ABTC) Australian biological tissue collection and museum voucher; ABTC- no voucher; NTMU- Northern Territory Museum; QMJM- Queensland Museum; WAMM- Western Australian Museum. N= sample size. Sequence ID’s are used to identify individuals from a particular site in results trees. Site Lat. Long. N Type Source/voucher ID’s P. gracilicaudatus 1. Hidden Valley -19.0028 146.0705 4 Liv/Tl Field biopsies (Ford) g1,3,4,6 2. Blackbraes NP -19.2290 144.0430 1 Liver Biopsy (Ford/P. Williams) g8 3. Mt. Pollux -22.4764 147.8705 1 Tail Field biopsy (Ford) g2 4. Ravensbourne -27.3650 152.1850 1 Liver QMJM15094 g7 5. Yurragir NP -29.6406 153.3099 1 Seq. Sequence (M. Elphinstone) g9 P. nanus 6. Bradshaw -15.3490 130.2740 1 Liver ABTC 67932 n11 7. Gregory NP -16.5976 130.4539 1 Liver ABTC 27906 n10 8. Helen Springs -18.4978 133.8738 2 Tail Field biopsies (Ford) n6,7 9. Jim Jim -12.9667 132.5667 1 Seq. Sequence (M. Elphinstone) n12 10. Kakadu -12.9767 132.5220 1 Tail Field biopsy (Watson) n3 11. Mitchell -14.8861 125.7986 1 Liver (ABTC) WAMM 21625 n8 12. Purnululu -17.3996 128.2717 1 Tail Field biopsy (Ford) n4,5 13. Pellew Is. -15.7000 136.6333 1 Liver (ABTC) NTMU 1448 n9 P. desertor 14. Albion Vale -22.3032 145.5509 2 Tail Field biopsies (A. Kutt) des5,6 15. Alice Springs -23.6990 133.8810 1 Liver ABTC 8143 des18 16. Burra Range -20.6701 145.1934 1 Tail Field biopsy (Ford) des1 17. Laverton -28.3751 122.6756 1 Liver ABTC 41464 des17 18. MacDonnell -23.7000 132.5000 1 Liver ABTC 24044 des19 19. Moorrinya -21.4200 144.9600 1 Tail Field biopsies (C. Johnson) des4 20. Oakleigh -23.5861 146.5425 2 Tail Field biopsies (A. Kutt) des10,11 12. Purnululu -17.3996 128.2717 1 Tail Field biopsy (Ford) des16
189

Figure 8.1. Distribution of the chestnut mice, P. desertor, and sampling locations. Distributions based on Watts and Aslin (1981), Fox (1995b), Kerle (1995b), Robinson (1995) Kutt et al. (in press) and collection locations. Pseudomys nanus is extinct in the shaded area of its distribution, with the exception of Barrow Island (arrow). Numbers refer to population numbers given in table 8.1. Pseudomys desertor ; P. gracilicaudatus ; P. nanus .
8.3 Genetic differentiation of chestnut mouse and P. desertor populations
8.3.1 MITOCHONDRIAL CONTROL REGION
Nuclear pseudogenes and population divergence among chestnut mice
Like the pebble-mound mice, the chestnut mice share a unique nuclear copy of their control
region. The presence of the nuclear copy was highlighted by very noisy sequence obtained
from tail tips when compared to liver samples and extremely low levels of genetic variation
across the entire distribution of both P. nanus and P. gracilicaudatus in preliminary
190

sequencing. Unlike the pseudogene isolated from the pebble-mound mice the nuclear copy
of the chestnut mice is quite similar to their actual control region sequence, differing at
very few bases. In phylogenetic trees of the entire conilurine fauna the nuclear sequences
still group with chestnut mouse sequences, although they differ from all conilurines at
several highly conserved control region sites. The similarity of the pseudogene sequence to
true control region sequence makes it difficult to construct primers that preclude its
amplification during PCR within the region of the mitochondrion examined in this thesis. If
all chestnut mouse sequences are examined in a Kimura two-parameter distance tree the
pseudogene sequences are readily apparent (fig. 8.2). In “clean” sequence from liver
samples it was usually possible to read two distinct peaks at ambiguous sites, and in nearly
all cases the background noise was identical to the pseudogene sequence for that site.
Likewise, in sequence from tail tips it was often possible to read two distinct peaks, and by
inference, the base present in liver sequence or not present in the pseudogene was probably
the correct one. Sequences inferred in this fashion were not acceptable for anaylsis, but
indicate potential for solving the problem. I currently consider only the sequences from
individuals g8, n8 and n12 to be true mitochondrial sequence. Distances between these
three sequences (table 8.2) are still useful as they are from the Kimberley, Top End and
Queensland, and therefore sample three of the main regions of northern Australia inhabited
by chestnut mice. These show 3.9% divergence between P. nanus in the Top End and
Kimberley, and 6.4-7.4% divergence between P. gracilicaudatus (QLD) and P. nanus. The
sequences align easily, with only one indel creating a one bp gap in P. nanus sequence
when compared to P. gracilicaudatus.
191

g6g9
n3n4n1n9n7
n10n2
g8
n8
n12
g2g7
g3
0.005 substitutions/site Figure 8.2. Genetic distance between sequences obtained from chestnut mice. Unrooted neighbour-joining tree of Kimura two-parameter distances between 10 haplotypes of 379bp isolated from 15 individuals. Circle highlights the 12 sequences believed to be nuclear copies of mitochondrial sequence. Taxon labels refer to individuals carrying a particular haplotype.
192

Table 8.2. Control region distance matrix for three chestnut mice. Matrix based on Kimura-two parameter distance between 379bp sequences. Only the three “clean” sequences from liver are shown here. Codes are individuals and region: gx- P. gracilicaudatus; nx- P. nanus.
g8-QLD n8-Kimberley n12-Top End
g8-QLD -
n8-Kimberley 0.06429045 -
n12-Top End 0.07366365 0.03850857 -
Population divergence in P. desertor
There is very little genetic differentiation of P. desertor populations across a very large
distribution. Individuals from Queensland were clearly P. desertor (fig. 8.3 and table 8.3).
A maximum divergence of 3% between some Queensland sites and Purnululu is indicative
of a similar situation to that observed in P. hermannsburgensis, although in the few
sequences analysed here there appears to be a weak association of haplotypes with
geographical proximity. More detailed sampling is required to establish whether that is the
case.
Table 8.3. Control region divergence among Pseudomys desertor populations. Matrix based on Kimura-two parameter distance between 379bp sequences. Maximum distance between sites is shown.
Albionvale 0.0026
Alice Springs 0.0265 -
Burra Range 0.0079 0.0185 -
Laverton 0.0211 0.0159 0.0185 -
MacDonnell 0.0291 0.0132 0.0265 0.0132 -
Moorrinya 0.0106 0.0212 0.0026 0.0212 0.0291 -
Oakleigh 0.0026 0.0238 0.0079 0.0185 0.0265 0.0079 0.0026
Purnululu 0.0317 0.0212 0.0291 0.0212 0.0238 0.0317 0.0317 -
Albionvale Alice Springs Burra Range Laverton MacDonnell Moorrinya Oakleigh Purnululu
193

des17 (Laver)
des19 (Macdon)
des18 (Alice)
des16 (Purnu)
des10 (Oaklei)
des2 (Albion)
des6 (Albion)
des4 (Moorin)
des1 (Burra)
0.005 substitutions/site Figure 8.3. Genetic distance between nine Pseudomys desertor control region haplotypes. Unrooted neighbour-joining tree of Kimura two-parameter distances between nine haplotypes of 379bp isolated from ten individuals. Taxon labels refer to a single individual that carried a particular haplotype, and to the source population (see also table 8.3).
194
8.4 Summary
- The chestnut mice possess a unique nuclear pseudogene that has thus far
confounded detailed analysis of control region sequence.
- Based on three sequences Pseudomys nanus from the Kimberley and the Top End
are significantly more closely related to each other than either is to P.
gracilicaudatus in north Queensland.
- Recently recognised populations of mice identified as P. desertor in central
Queensland are clearly P. desertor on the basis of control region sequence.
- Pseudomys desertor populations are genetically similar (<3% divergent) from
locations up to 2400km apart in the north-eastern, north-western, south-western and
central parts of the species distribution.
195
Chapter 9. Discussion
EXPLAINING THE CONILURINE RADIATION
In this discussion I focus on extending the results of chapters 4-8 in two ways. I briefly
review patterns of molecular evolution within the conilurine rodents and attempt to
describe the ways in which species ecology has created specific evolutionary consequences
for different species and groups. The varied effects of Pleistocene arid barriers on northern
savannah conilurines are reviewed. I suggest that the biogeographical practice of using
areas of endemism in reconstructing evolutionary history may not be an appropriate method
for describing the evolution of some Australian faunas because the history of current areas
of endemism differs markedly from that of classic case studies in the Neotropics and
elsewhere. I then describe some patterns that seem to be of evolutionary significance within
the conilurine fauna. Having established ecological and environmental models that account
for specific cases of evolution among conilurines I then briefly consider whether local-scale
ecological processes are important in shaping macroecological and macroevolutionary
patterns. Discussion builds on the observations that the phylogeny of conilurine rodents is
imbalanced and that the distribution of range sizes among conilurine rodents is not log-
normally distributed, while that of marsupials is. Recent neutral models of macroecology,
biodiversity and biogeography provide a conceptual framework for discussion.
196

9.1 Describing diversity
9.1.1 PATTERNS OF CONILURINE DIVERSITY
The trophic diversity of conilurine rodents is reflected primarily in the adaptations and
morphology of different genera. I have proposed that this generic diversity is the result of
an early savannah radiation. Aridity is the overwhelming influence on conilurine evolution
following the ancestral savannah radiation, and is a predominantly Pleistocene
phenomenon. Post-radiation diversification of conilurines has primarily involved the
evolution of two arid-adapted genera, Leporillus and Notomys, and the radiation of the
Pseudomys group, which includes a number of arid-adapted Pseudomys species and
Notomys. Species diversity is only high in the Pseudomys group, which creates
phylogenetic imbalance in the conilurine tree. The effects of aridity are obvious in causing
population extinction and partitioning in model species groups (chapters 5-8), and there are
obvious influences of species ecology in modifying the effects of aridity among these
groups (section 9.2.3). Such climatic stimuli have affected all Australian species, but there
are differences between patterns of species diversity in marsupials, birds and rodents that
are not readily explained by structural differences in habitat, in particular the diversity of
conilurines in seasonally arid, semi-arid and arid environments (section 2.3.3). In this
discussion I therefore present the synthesis of the results chapters, and then explore the
possibility that species ecology might not be the best way to investigate macro-evolutionary
patterns in conilurine rodents.
9.1.2 SPECIES
I suggest a number of taxonomic changes may be required in the wake of my studies. In
particular, some species in the delicate mouse group that have long-standing recognition as
good species may require reconsideration as a sub-specific complex. I have highlighted
cases where there is doubt surrounding the significance of results, and I have explicitly
stated that this thesis does not constitute a published work under article 9 of the Zoological
197
Code of Nomenclature. Those results will be tested further and published if they prove
correct.
It should be noted that my taxonomic framework is based on the notion of biological
species. I will not attempt to review the debate over the nature and definition of species,
which is perhaps dealt with most evenly in Wheeler and Meier (2000). However, as they
point out on the cover of their book, “No question in theoretical biology has been more
controversial or perplexing than “What is a species?”. Like many others (Paterson 1985,
Coyne 1992, Gould 1994, Mayr 2000, Lee 2003), I believe that species are a real unit of
evolution for sexual organisms, and in particular mammals and birds. Species represent
perhaps the only meaningful rank in the taxonomic hierarchy; the point where the future
and past evolutionary history of members are shared, but above which only common
ancestry is important in demarcating taxonomic units. Species are therefore unique (Gould
1994). They are not an arbitrary point along an evolutionary continuum of divergence,
although that continuum of divergence certainly exists, running from populations to genera,
families, and so on. Should the concept of species representing unique evolutionary entities
be abandoned, and species become viewed only as units of convenience, what then are we
describing when we discuss speciation and diversification? Speciation literature, as
opposed to literature on species definitions, is very clear on this subject; speciation is the
formation of reproductive isolation (Mayr 1963, Templeton 1981, Barton and Charlesworth
1984, Butlin 1987a, Coyne and Orr 1998, Bridle and Jiggins 2000, Servedio 2000).
Therefore I appeal to the notion that, for example, despite the fact P. novaehollandiae is a
distinct taxon (barring the mismatch between molecular and morphological identification of
individuals), it is not a distinct species if it can be shown that individuals of P.
novaehollandiae in the Pilliga are freely inter-breeding with its very closely related,
morphologically identical sib, P. delicatulus.
Taxa with no apparent basis
Two described taxa were shown to have no evolutionary basis (table 9.1). Pseudomys
delicatulus mimulus Thomas 1926 is a relic of the past description of morphological island
198

variants as different forms. Pseudomys d. mimulus is much more closely related to nearby
mainland populations than are most other mainland populations of P. delicatulus.
Pseudomys pilligaensis Fox and Briscoe 1980 fails a simple test under nearly all species
concepts (e.g. Templeton's (2001) null hypothesis 1) in that it does not consist of
individuals belonging to a single monophyletic lineage. The Pilliga situation is similar to
that of the Japanese endemic Mus musculus molissinus, which in reality was a mixed
population of M. m. castaneus and M. m. musculus (Yonekawa et al. 1988).
Good taxa: good species?
The remaining problems in conilurine taxonomy (table 9.1) illustrate the problems
associated with determining what constitutes a species, and also why an appeal must be
made to a non-arbitrary definition of species. All involve assignment of real taxa to their
correct place in the taxonomic hierarchy, rather than identifying cases where taxa do not
exist. I have proposed that the taxonomic boundaries of Pseudomys johnsoni Kitchener
1985 should be enlarged to include P. laborifex Kitchener and Humphries 1986 because the
level of mtDNA distance between these taxa is significantly lower than between other
conilurine species, and these lineages apparently have a recent origin related to a
straightforward process of isolation during the LGM. Only breeding trials can determine
any greater significance arising from the isolation of these taxa. Problems in the P.
delicatulus complex are outlined elsewhere (above, sections 6.4.4), but arise from relatively
shallow genetic distance among taxa, inconsistent naming of taxa of equivalent depth, lack
of congruence between the genetic and morphological assignment of individuals to
“species”, and incomplete knowledge of the outcomes of secondary contact in the Pilliga
(i.e. is introgression or assortative mating occurring?).
199

Table 9.1. Proposed changes to Pseudomys species and subspecies taxonomy Species (populations) Proposed change to status Grounds P. delicatulus (Pilbara, sth Kimberley- sth VRD)
New species (proposal will be made for name P. aphonomorphous)
Very distinct mitochondrial lineage that is more isolated from nearby P. delicatulus populations than are P. novaehollandiae or P. bolami. Very distinct nuclear intron sequence at two loci. Problem: one possible individual resembles P. delicatulus (NT) in unique derived sperm morphology.
P. delicatulus mimulus Not recognised Minimal genetic divergence from nearby mainland populations. A very recent (~10ky) insular form not described on evolutionary grounds.
P. delicatulus (Queensland, nth New South Wales)*
Subspecies of P. delicatulus (proposal will be made for name P. delicatulus stalkeri)
Distinct mtDNA lineage within P. delicatulus, characterised by several morphological traits including unique sperm morphology and karyotype.
P. laborifex (Kimberley) and Subspecies of P. johnsoni Very recent range fragmentation P. laborifex (VRD) (proposal will be made for
name P. johnsoni laborifex for Kimberley and P. j. kitcheneri for VRD)
probable cause of clade formation. Shallow genetic divergence between clades. Geographical isolation of two “P. laborifex” clades not current, P. johnsoni probably not isolated from others. Inconsistent species assignment of genetically equivalent clades.
P. novaehollandiae Subspecies of P. delicatulus Previously unrecognised continuous, overlapping, distribution of the two taxa. Some evidence of ability to inter-breed in captivity and gene flow in the wild. Lack of spatial separation and identical morphology of both lineages when found in sympatry. Descriptions of this species and P. delicatulus were made from two sites over 3000km apart in a clinal distribution.
P. pilligaensis Junior synonym of P. delicatulus and P. novaehollandiae
No mitochondrial lineage is unique to the species. Those mtDNA haplotypes that are present belong to either P. delicatulus or P. novaehollandiae, which are continuously distributed through the region (above). Description was an artefact of poor survey knowledge of P. delicatulus and P. novaehollandiae, and incomplete context for genetic description.
*Pseudomys delicatulus from the mainland Northern Territory and north Kimberley retain the current name P. delicatulus delicatulus.
200
9.1.3 GENERA: A MATTER OF OPINION
I have defined new genera within the Pseudomys group because; 1) the currently defined
genus encompassed a significantly greater genetic diversity than any other conilurine
genus, 2) it contained several very distinct species assemblages, including the biologically
unique, and relatively old, pebble-mound mice, 3) the genera Notomys and Mastacomys
were not clearly separable from the currently defined boundaries of Pseudomys, and they
are biologically distinct enough to warrant their previous generic status. Genera are
essentially arbitrary units with no formal definition or conventions guiding their description
(Lee 2003). It is therefore potentially of little importance how Pseudomys is taxonomically
defined, as long as distinct evolutionary units are recognised in some form. Molecular
phylogenies combined with a synthetic assessment of previous studies led to the description
of genera in chapter 4. However, future work is required to resolve the doubts I have
highlighted surrounding the assignment of some species to genera/subgenera. The removal
of Thetomys and “Phorolithomys” is well supported.
9.2 Speciation and population divergence among conilurines
9.2.1 MODES OF SPECIATION
Just as there is a long-running debate over the definition of species, there is a protracted
debate over how new species are formed (Mayr 1991). Again, this debate is reviewed at
length elsewhere (Otte and Endler 1989, Coyne and Orr 1998), and I shall only touch on
the subject by reviewing modes of evolution observed in the conilurine fauna. Predictably,
there is evidence presented in chapter 5 of allopatric divergence of pebble-mound mouse
species. Allopatric speciation (Mayr 1942, 1963) is accepted as the most common, and the
“easiest”, process of species formation (Otte and Endler 1989, Foster et al. 1998, Salomon
2001). Populations become geographically isolated, gene flow is reduced or ceases, and
genetic mutations arise that eventually cause reproductive isolation between species should
they come into secondary contact. Besides pebble-mound mice, Pseudomys albocinereus
201

and P. apodemoides, large Zyzomys species and probably many other conilurines are the
result of allopatric speciation.
Bottlenecks and founder-flushes are particular cases of allopatric speciation that entail more
rapid genetic change than may occur in large allopatric populations (Barton and
Charlesworth 1984). The contraction of peripheral populations or migration by few
individuals to form small founder stocks has been postulated to allow emergence of new
co-adapted gene complexes that permit the bottlenecked stock to exploit novel evolutionary
pathways (Meffert 1999). There are several modifications of this theory, but all entail small
population size (Mayr 1963, Carson 1975, Templeton 1980, Barton and Charlesworth
1984). There is experimental support for the evolution of assortative mating and varied
evolutionary trajectories due to founder-flushes (Templeton 1996, Regan et al. 2003).
Baverstock (1982) has previously suggested bottlenecks may have been important in
promoting conilurine speciation, and proposed they would have taken place in the semi-arid
zone. Pseudomys bolami and Pseudomys johnsoni clades appear to have recently
experienced severe bottlenecks, although whether the initial evolution of the species
involved such a step is not clear. Nevertheless, climatic processes that led to the recent
bottlenecks in these species were recurrent throughout the Pleistocene (section 2.3.1)
suggesting that species currently residing in the arid zone may have had their origin as a
result of founder-flushes that allowed previously maladapted species to exploit novel
environmental conditions. I see no reason why bottlenecks could not have taken place
throughout Pleistocene central Australia with populations taking advantage of relictual
pockets of wetter habitat, although the number of refugia present in the region would have
diminished with each successive arid cycle. The lack of genetic structure across the very
large arid zone distribution of P. hermannsburgensis, and probably P. desertor, highlights
the lack of geographical barriers to rodents in central Australia. Bottlenecks may therefore
have been a particularly important factor leading to diversity of arid zone faunas.
Other modes of speciation are more difficult to observe, and to theoretically demonstrate.
Modern authors largely dismiss parapatric speciation and cline theory, although the process
had some influential supporters in the past (Huxley 1942, Bush 1975, Endler 1977). The
202
cline observable in the P. delicatulus complex between P. delicatulus and P.
novaehollandiae almost certainly entailed past allopatric fragmentation (section 6.4.3), and
resembles a “broken cline” proposed by Salomon (2002). Salomon’s (2002) interpretation
of a situation such as observed in the Pilliga is the same as the one I proposed in chapter 6.
Where two taxa with clinal characters share identical forms of the clinal characters in
secondary contact they are probably subspecies, and reproductive isolation has not evolved
during a past period of allopatry.
Sympatric speciation suffers from the same theoretical problem as parapatric speciation. It
is difficult to theoretically demonstrate a mechanism whereby assortative mating and
reproductive isolation can occur within a single population because of the homogenising
effects of gene flow (Lewontin 1974). Recent theoretical and empirical studies have
revived acceptance of sympatric speciation as a biological reality (Butlin 1987a, Coyne
1992, Kaneko and Yomo 2000, Shaw et al. 2000, Danley and Kocher 2001). Sympatric
speciation is often facilitated by some mechanism promoting reinforcement of incipient
assortative mating (Butlin 1987b, Servedio 2000) and pebble mounds were potentially such
a mechanism as they have been hypothetically linked to mating preference (Cermak 1999).
However, pebble mounds proved not to be involved in mating preference, and no evidence
of sympatric speciation was provided by studies presented here. Some suggestion that
sympatric speciation may have occurred within conilurine rodents comes from the disparity
in body size between sympatric species of Mesembriomys and Leporillus that could
indicate niche-partitioning as a driving force of divergence, and ecological specialisation
and rapid speciation among Notomys species that are sympatric with sibs. Ecological
specialisation and rapid divergence have been linked to sympatric mechanisms of
speciation (Butlin 1987a, Danley and Kocher 2001). However, the initial divergence of
these taxa could easily have occurred in allopatry, and the extensive evidence of range
movements among taxa studied here indicates that interpretation of speciation processes
among now sympatric species is generally not possible.
203

9.2.2 ECOLOGICAL CORRELATES OF EVOLUTIONARY PATTERN
Flow on effects: a behavioural cause of macro-evolutionary pattern
The building of pebble mounds has dictated a very different evolutionary pathway for
pebble-mound mice than for the morphologically similar delicate mice. As outlined in
chapter 5, pebble-mounds promote a level of site fidelity remarkable among conilurine
rodents. This applies to breeding females, and hence populations. Males of P. patrius are
highly mobile, and individuals of P. chapmani have been caught some distance from rocky
ridges (Start et al. 2000), but the centre of breeding and population survival is pebbly
habitat. This has been the major factor promoting differences in macroevolution between
pebble-mound mice and delicate mice. In addition pebble-mound mice do not seem to
boom in response to very favourable conditions, probably because mounds are a critical
limiting resource. Disturbances, even fire, do not seem to unduly affect their population
dynamics. On the other hand delicate mice have mobile populations that undergo very large
fluctuations in size, and site fidelity is low (section 6.1.2). Some indication of the relative
global population size of pebble-mound mice and delicate mice comes from the number of
haplotypes isolated from 87 individuals of each group; 64 in the delicate mice, and 37 in
the pebble-mound mice. This is potentially due to uneven effects of extinction acting on the
two groups, but even taking the most diverse site for P. patrius, Marodian, ten samples
yielded three haplotypes. Seven “P. delicatulus” samples from the Pilliga yielded five
haplotypes. Smaller population size of pebble-mound mice may therefore have accelerated
the observed effects of allopatry enforced by geological change.
The major evolutionary consequence of these differing ecologies is secondary contact
between delicate mice. Distributions of delicate mice are apparently under climatic control
and their distributions inter-grade where prevailing climatic conditions inter-grade. More
complete modelling using BIOCLIM has the potential to reveal which climatic factors are
limiting the ranges of delicate mouse taxa, but can only be performed once the
distributional limits of morphologically cryptic taxa such as P. delicatulus and P.
novaehollandiae in southern Queensland and P. cf. delicatulus are established by mtDNA
204

sequencing. Speciation has probably been a straightforward process among allopatric
pebble-mound mice. However, even when delicate mice have diverged in allopatry,
cyclical climate and sea level change periodically re-unites them. In such a situation the
population size while allopatric may be important in dictating the degree of divergence
noted between taxa when in secondary contact. This could result in the ambiguous status of
P. delicatulus clades and P. novaehollandiae, which have probably been repeatedly isolated
as moderately large populations during the late Pleistocene, whereas severely bottlenecked
taxa such as P. bolami may become reproductively isolated following a single allopatric
interlude.
Effects of allopatry on the savannah fauna
A major effect of Pleistocene cycles was the formation of habitat refugia in many parts of
the world (Patterson 1999, Knowles 2001). At high latitudes ice replaced forests (Willis
and Whittaker 2000), while in South America, Africa, India and Australia arid conditions
had a greater effect, with deserts a major feature in Africa, Australia and India (Livingstone
1982, Linder 2001). Holocene climatic change in Africa has now reversed dominant local
conditions to the extent that some ancient desert dunes are colonised by rainforest (Nichol
1999). However, in Australia arid corridors remain between mesic refuge areas (sections
2.3.1 and 2.3.3). Pleistocene arid barriers in northern Australia apparently had little affect
on speciation in the savannah fauna. A review of the 17 conilurine species distributed
across northern Australia reveals no consistent patterns of distribution or speciation in
response to the formation of Pleistocene barriers (table 9.2). Zyzomys argurus and
Leggadina lakedownensis are distributed in all refuge areas and have very different habitat
preferences that see L. lakedownensis also distributed through the Great Sandy Desert, yet
neither exhibit significant mtDNA structuring or divergence between regions (Moro et al.
1998, this thesis). Pebble-mound mice are unique in having a different species distributed
in each of the major refuge areas, and in the subdivisions of the Kimberley and Top End.
All savannah species are found in the Kimberley-Top End with the exception of the pebble-
mound mice P. chapmani and P. patrius. Most species are also found in either the Pilbara
or Cape York. Large Zyzomys species and Conilurus penicillatus are the exceptions. The
205

absence of Conilurus penicillatus from Cape York is difficult to explain, particularly given
its presence in New Guinea (Flannery 1995) and on several islands in the Gulf of
Carpentaria (Dickman and Van Dyck 2000, Woinarski 2000). The restrictive habitat
preferences of large Zyzomys species dictate small contemporary distributions of all three,
but there are fossils of large Zyzomys from Chillagoe (Godthelp 1997), at the base of Cape
York, so recent (Holocene?) extinction of both Conilurus and large Zyzomys from Cape
York is probable.
There are two cases in which Pleistocene barriers cannot be discounted as a cause of
speciation, but where they are not directly implicated in any process beyond dictating the
current distribution of species. These are P. delicatulus/P. cf. delicatulus and P.
gracilicaudatus/P. nanus. Aridity and restriction to the Pilbara are probable causal agents
of the initial divergence of P. cf. delicatulus. However, it was not conclusively established
in chapter 6 whether P. cf. delicatulus is even a sib-taxon to P. delicatulus, and any number
of alternative scenarios are possible, including divergence from P. hermannsburgensis, or
an origin as a hybrid form (chapter 6). The separation of P. nanus and P. gracilicaudatus
by the Carpentarian Barrier may be responsible for the chromosomal and genetic
differentiation of the species (Baverstock et al. 1977a), but given the lack of such processes
in species with similar habitat preferences and distribution (e.g. Leggadina lakedownensis)
it is equally plausible that there is a co-incidental correlation between current distributions
and species boundaries of the two. Speciation in the pebble-mound mice is related to
allopatric isolation across the Pleistocene barriers, but divergence is related to loss of rocky
habitats that may significantly pre-date the current climatic and vegetation barriers.
206

Table 9.2. Species distributions and areas of endemism in northern Australia. Area of endemism: barrier. Each row represents a species or species group. Different species within a group are shaded differently and face in different directions. For example, there are four species of pebble-mound mice, each restricted to a single area of endemism, but five Zyzomys, three of which occur in the Top End, two in the Kimberley, and one that occurs in all areas of endemism (Z. argurus). The natural distribution of Pseudomys nanus (non-shaded member of chestnut mice) in the Kimberley-GSD-Pilbara region is not known and it may have been distributed through the GSD. * = study group in this thesis ((*) only Z. argurus). Pilbara Gt Sndy Des Kimberley - Top End Carpentarian Cape York Conilurus penicillatus 1spp.
Mesembriomys 2spp.
Leggadina 2spp.
Chestnut mice* 2spp.
D
P4
Z
?
elicate mice* 2spp.
ebble-mound mice * spp.
yzomys spp.(*) 5spp.
207

Areas of endemism as biogeographic units
A standard method in biogeography is the use of phylogenetic histories of taxa within areas
of endemism to reconstruct a series of vicariance events describing area relationships
(Anderson 1994, Brooks and McLennan 2001, Hausdorf 2002). The variable and
unpredictable relationships between conilurine species inhabiting areas of endemism in the
northern savannahs suggest that this approach may not be appropriate for much of the
Australian continent. Many authors have highlighted the patterns of endemism within the
Australian vertebrate fauna (Keast 1961, 1981, Archer and Fox 1984, Heatwole 1987), and
Cracraft's (1982) oft-cited summary of evolutionary events for Australian birds was based
on phylogenetic relationships between areas of endemism, including the northern
savannahs. However, current areas of endemism in northern Australia have a very different
history to the classically cited cases in Europe, Neotropical and African rainforests or the
Wet Tropics rainforests of north-eastern Australia (Haffer 1969, Livingstone 1982, Moritz
et al. 2000, Willis and Whittaker 2000). Savannah refuges have not been continuously
inhabited areas to which species retreat at times of glacial activity and heightened aridity.
Making the reasonable assumption that rodents act as an indicator of the fauna as a whole,
some species have probably been more continuously distributed at times during the
Pleistocene because savannah habitats have moved northwards and united in a continuous
band across exposed seas beds. Vrba (1992) has proposed that such migrations of habitats
and their constituent species probably allowed most species to avoid detrimental effects of
Pleistocene glaciations, and also reduced the potential for allopatric speciation during the
epoch. Others, like the resilient Zyzomys argurus, have remained fixed in their distribution
and unaffected by the climatic turmoil around them. Problems associated with the use of
areas of endemism to reconstruct evolutionary history are probably amplified in central
Australia. There has almost certainly not been a series of neat vicariance events such as that
envisaged by Cracraft (1982). Even had there been, the lack of genetic structure across the
distribution of P. hermannsburgensis suggests that reliable evidence for such events would
be lacking in the modern fauna. Moreover, the unsolvable lack of knowledge of the natural
(pre-European colonisation) distributions of terrestrial vertebrates in central Australia
208

probably compounds problems associated with the use of such methods. These issues all
largely stem from one of the premises outlined in chapters 1 and 2; evolution of the
Australian fauna is the result of climatic change that potentially affects each species in
different fashion, and not the result of geological events that affect all species equally.
9.2.3 SOME PATTERNS OF EVOLUTIONARY INTEREST
Correlates of (secondary) contact between conilurine sibs
Sperm morphology has often been referred to in this thesis and differs between P.
delicatulus and P. novaehollandiae (Breed 1997). It also differs between Queensland and
Northern Territory populations of P. delicatulus (Breed 2000). The significance of that
variation is not clear because laboratory breeding has shown fertilisation can occur between
Queensland and Northern Territory animals (Baverstock et al. 1977a), and between Pilliga
animals (of unknown mtDNA haplotype) and P. novaehollandiae (L. Lim pers. comm.).
However, variation in sperm morphology would appear to be in some way related to the
evolution of reproductive isolation among conilurines, even if the process is not complete
in the case of the P. delicatulus complex. Sperm morphology is conserved across all
hydromyines, and many other Australasian rodent species (Breed 1997). In every case
where divergent sperm morphology is observed, the species involved is sympatric or
parapatric with its sib (fig. 9.1). In these cases there are also significant departures from
highly conserved norms in sperm motility and abundance, and in testes mass relative to
body size (Breed and Taylor 2000). These features have been linked to the unusual
reproductive tract and possible breeding system of N. alexis (Suttle et al. 1988, Breed
1989a, Breed and Taylor 2000), but given their occurrence under particular circumstances,
and in Pseudomys species that differ from N. alexis in reproductive physiology and
breeding systems (Happold 1976, Breed 1989) they may have a more general implication
for speciation processes. In the case of the delicate mice, there have possibly been two
phases of sperm evolution, one involved in the divergence of the P. delicatulus complex as
a whole (from P. hermannsburgensis?), and a second now evident with continued
fragmentation of the P. delicatulus complex into sib-taxa.
209

Pseudomys delicatulus (Kimberley-NT)
(dots)
Pseudomys delicatulus (QLD)
(stippling)
Pseudomy
(stippling)
Pseudomy(solid)
(10ka)
Figure Sperm p(1995b),6).
(P. hermannsburgensis)
Pseudomys novaehollandiae
(solid)
s desertor
s shortridgei
Notomys alexis
(stippling)
Notomys fuscus
(large dots)
Notomys mitchelli
(small dots)
9.1. Biogeography of derived sperm morphology among conilurine rodents. hotos Bill Breed. Distributions Watts and Aslin (1981), Braithwaite and Covacevich (1995), Breed Cockburn (1995a), Kemper (1995), Kerle (1995b), Watts (1995b) (modified as specified in chapter
210

Origins and affinities of the arid zone fauna
Baverstock (1982) proposed the semi-arid zone as the centre of diversification of
conilurines, with subsequent invasion of the arid zone. I suggested in section 2.3.4 and in
section 9.2.1 that the actual geographical location was likely to be within the confines of
the current arid zone, because the area was previously savannah or semi-arid habitats and
contained refuge areas through much of the Pleistocene. Relying only on well-resolved
species groups from chapter 4, and on speciation studies in chapters 5-8, some general
patterns of the origin of arid zone species can be explored. Within the Pseudomys group,
each genus or species group exhibits a different set of habitat preferences, but there is a
tendency to include at least one peripheral and one arid zone species. Leggadina too,
contains one arid and one peripheral species. This tends to support Baverstock’s (1982)
proposal of an arid-periphery relationship among conilurine species, with little speciation
having occurred within the arid zone. The Pseudomys group and Leggadina therefore
present a series of independent “invasions” of the arid zone. However, in the case of the
pebble-mound mice, and I would suggest most arid zone species, adaptation to the arid
zone would have occurred in situ, and would not have involved a re-invasion of abandoned
habitat (although the recent history of the group indicates some range movement may have
occurred). The same can be said of Zyzomys pedunculatus. Both pebble-mound mice and
rock rats were probably forced to adapt rather than move their ranges, and both are now
restricted to relatively small ranges within the arid zone. Notomys has apparently undergone
extensive speciation within the arid zone. Leporillus is the only exclusively arid zone
conilurine genus, and speciation presumably occurred within the arid zone.
An early arid bottleneck?
Notomys species are well adapted to aridity. They can utilise hyperthermia when
temperatures are high (MacMillen and Lee 1970), have an exceptional ability to exist free
of exogenous water, and N. alexis can concentrate urine more efficiently than any other
mammal for which data are available (MacMillen and Lee 1967). DNA sequencing and
other molecular studies have demonstrated that Notomys forms a lineage within the
211

Pseudomys group phylogenetic bush, and is not an isolated lineage as once thought on the
basis of its unique morphology (chapter 4). A brief consideration of Notomys morphology
also suggests that this is the case. The large ears, hopping gait and elongated feet are all
features shared by desert rodents of other continents such as jerboas (Dipodidae),
Springhares (Pedetidae) and kangaroo rats (Heteromyidae). Such convergent morphology is
therefore a direct result of intense selective pressure in arid environments. Australian arid
environments are recent, and true deserts are probably less than 1Myo (section 2.3.1). So,
even if a distinct Notomys lineage pre-dates the Pleistocene, it is unlikely that the
morphology and arid-adaptations of the group existed long before that time. How could
such a morphologically distinct group emerge from the Pseudomys group over such a short
time period?
The early onset of aridity probably had a similar affect as it does now, the creation of small
founder populations. There is potential evidence of a small founder population in the
history of the Notomys alexis group. The bizarre reproductive morphology of the group is
so distinct from all other mammals (Breed 1985, 1986) that it is difficult to envisage its
evolution in any circumstance other than isolation of a small population. The initial
evolution of Notomys from a Pseudomys-like ancestor may therefore have involved a
bottleneck in the late Pliocene or early-mid Pleistocene. The Notomys alexis group was not
the direct result of this initial bottleneck, however, as N. cervinus retains a suite of ancestral
characters similar to those of Pseudomys (section 4.4.3). Alternatives to a bottleneck are
also possible, and Breed (1989) favours a mechanistic origin of the reproductive tract of the
N. alexis group.
Is the arid zone a sink?
The general view in Australian biogeography is that the arid zone has been a sink into
which diversity has filtered from the non-arid or semi-arid periphery (section 2.3.4).
Notomys species are probably a product of speciation within the arid zone, but are not
restricted to the arid zone. This indicates range expansion with expanding arid conditions,
and the formation of relict populations once arid conditions retracted to more central
212
locations. Similar processes may have lead to the presence of P. desertor in central
Queensland. Pseudomys fumeus appears to be related to P. albocinereus and P.
apodemoides that occur along the semi-arid southern margins of the arid zone. Both P.
apodemoides and P. albocinereus nest communally (Cockburn 1981a, Morris 1995), a
condition often related to habitation of arid conditions, and that occurs in a number of
Australian desert rodents (Happold 1976, Watts and Aslin 1981). The mesic Pseudomys
fumeus also breeds communally, a behaviour that is not observed in other low-density
mesic rodents (Woods and Ford 2000). This could indicate an arid heritage for P. fumeus,
suggesting expansion out of the arid or semi-arid zone. There is a suggestion then, that the
arid zone may not have functioned simply as a sink for conilurine species diversity. The
genera Notomys and Leporillus have speciated within the arid zone, and Notomys species
have colonised non-arid areas due to past expansion of the arid zone. Some non-arid
Pseudomys species may also have their recent origins within the arid zone fauna, not vice-
versa.
9.3. Is the importance of ecology scale-dependent?
9.3.1 EXPLAINING BIODIVERSITY
Throughout this thesis I have maintained that species ecology explains patterns of evolution
in the conilurine fauna. I have outlined characteristics that determine species distributions,
either climatic or geological, and have suggested that changes in climate or landform are
responsible for promoting evolutionary divergence by altering population size and
connectivity. However, despite describing patterns and causes of evolution within
components of the conilurine fauna, I have not attempted to explain a number of large-scale
evolutionary patterns. Patterns of interest include the phylogenetic imbalance among
conilurine rodents, whereby the Pseudomys group contains 36 of 49 species, a fact borne
out by a recent study that identified both Notomys and Pseudomys as containing
significantly more species than expected in a comparison of most Australian mammal
genera (Cardillo et al. 2003). Another pattern that seems potentially important in conilurine
213

biogeography is that few conilurines have, or had, small or restricted natural ranges when
compared to marsupials.
In closing this thesis I would like to briefly explore these two evolutionary patterns and
draw on the conceptual framework provided by neutral models of macroecology (Bell
2001) and biogeography (Hubble 2001), and on macroecology literature that deals with
patterns of distribution, abundance and phylogenetics that these models address (Gaston et
al. 1997, Webb and Pitman 2002, Jablonski and Roy 2003). The attraction of neutral
models lies in their ability to predict large-scale pattern using simple population level
parameters such as birth, death and migration (Bell 2001, Hubble 2001). The integration of
these models with empirical studies linking large-scale biogeographical pattern to
evolutionary pattern may offer the solution to Gould’s (1985) “paradox of the first tier”
which suggests that there is dissociation between ecological processes classically held
responsible for evolutionary pattern (the “first tier”) and large-scale, infrequent, processes
that over-ride the effects of the first tier and result in macroevolutionary patterns (Gould
1985).
Neutral models
Neutral models consider the abundance of species in a local community to be the product of
random extinction processes between ecologically identical species. This is Hubble’s
(2001) “ecological drift”, and derives from the concept of genetic drift in the neutral theory
of molecular evolution (Ohta 1992, Nei and Kumar 2000). The equivalence of species in a
neutral model is hard for ecologists to accept (de Manzacourt 2001, McGill 2003), and the
consideration of only one trophic level is a problem that needs addressing with further
development of models (Ford 2003). The abundance of a species across a landscape in
neutral models is contingent on its likelihood of migration between sites, which is
determined by the migration rate and its abundance in local communities. That means that
once a species becomes abundant in a local community through chance, it is more likely to
emigrate and more likely to become abundant across a landscape. This leads to a result that
is empirically demonstrable in natural communities; some species are very abundant while
214

most others are not (Marzluff and Dial 1991). In many cases species abundance in local
communities approximates a log-normal distribution, although Hubble (2001) demonstrated
that his zero-sum multinomial described species abundance under varying rates of
immigration, and also accounted for the geometric distribution of species abundances
observed in some communities. This seems at first to have little to do with diversification
rates and range sizes among conilurine rodents. However, Bell (2001) demonstrated that
large range size was a result of being abundant in the global community, essentially
because as abundance increases, the likelihood of occurring in any given patch also
increases, even in models that specifically include spatial correlation of patch occupancy as
a proxy for local adaptation. A positive relationship between abundance in local
communities and range size is a pattern commonly cited in macroecology literature (Brown
1984, Gaston et al. 1997). Large range size has in turn been linked to an increased
likelihood of speciation (Rosenzweig 1995), as has abundance (Webb and Pitman 2002).
Cardillo et al. (2003) reported a positive correlation between larger average range size and
diversification rates among Australian mammals in the study that identified Notomys and
Pseudomys as particularly speciose genera.
Phylogenetic imbalance
Cardillo et al’s (2003) treatment of rodents was flawed, as they compared Zyzomys to
Uromys and the tree-rat/Leporillus clade to Melomys to control for age of lineages. This is
clearly not a suitable comparison in an Australian context as the conilurine lineages have
probably been present for millions of years longer than have Melomys or Uromys.
However, had their comparison taken a more appropriate comparison of diversification
rates the result may have been more striking. Any of the tree-rat/Leporillus clade (6 spp.),
Leggadina (2 spp.) or Zyzomys (5 spp.) would make a suitable comparison of equal age to
the entire Pseudomys group (36spp.), and by comparing the entire Pseudomys group, issues
relating to the actual taxonomic composition of “Pseudomys” are avoided. Cardillo et al.
(2003) suggested that larger range size in some Australian mammal lineages had promoted
faster rates of diversification. It has previously been suggested that large range size
promotes speciation because there is a greater chance of range fragmentation and peripheral
215

isolates forming (Rosenzweig 1995, Wagner and Erwin 1995). However, the alternative,
that large range size retards speciation because a species with a large range is adapted to a
greater variety of conditions and is buffered against formation of small barriers and climate
change, has also been supported (Mayr 1963, Gaston 1998, Jablonski and Roy 2003).
Empirical data and “weight of opinion” suggest that small-medium to medium sized ranges
are most speciation prone (Gaston 1998, pg. 227).
Range sizes, however, are not “heritable” (Webb and Gaston 2003), a fact evident in the
very different range sizes of the conilurine sibs Pseudomys desertor/P. shortridgei, P.
higginsi/P. fieldi, and Notomys alexis/N. fuscus/N. mitchelli, so the effect of larger range is
probably not linked to speciation rates within a lineage over time. Range sizes between
major conilurine lineages are also not significantly different (based on data below). Range
size is therefore not a satisfactory explanation for phylogenetic imbalance in conilurines.
Another aspect linked to both species abundance and phylogenetic imbalance is a fast life-
history (Marzluff and Dial 1991). Cardillo et al. (2003) noted that speciose Australian
mammal lineages have larger litter sizes than non-speciose lineages. Again, this cannot
explain the disparity in species diversity between the Pseudomys group and Leggadina, and
for rodents in general, life history does not seem to be correlated to speciation rates
(Marzluff and Dial 1991). The relatively low abundance of Leggadina (Read 1984, Reid
and Morton 1995, personal observation) may be related to lower species diversity
compared to the Pseudomys group, as abundance has been correlated with membership of
speciose lineages (Schwarz and Simberloff 2001). However, differential species diversity
between related higher-level taxa is common (Purvis and Agapow 2002), appears to be
heritable, and results from features such as differential rates of cladogenesis, extinction and
key innovations for which there is no clear evidence within the conilurine fauna (Chan and
Moore 2002, Savolainen et al. 2002).
Neutral models may be of particular value when considering this type of question. Bell
(2001) did not consider the evolutionary implications of his neutral theory, but Hubble
(2001) included speciation as a central parameter in his Unified Theory. He indulged in a
wide-ranging demonstration of the Unified Theory’s applicability to both biogeography and
216

evolution, including presenting results that suggest there is no need for ecological
differences between taxa when explaining macroevolutionary patterns such as the lack of
species in Leggadina. They can arise by chance from processes that have their root in birth,
death and migration among ecologically equivalent species and individuals. However,
neither Hubble (2001) nor Bell (2001) denied the importance of species ecology in
dictating specific evolutionary patterns, and although neutral models might produce results
describing the distribution and species diversity of pebble-mound mice and delicate mice,
differences in the evolution of these two groups are still best dealt with in an explicit
ecological framework as I have presented in earlier chapters.
Range size
A basic mathematical observation that begins to unite range size and species abundance is
that, in general, they conform to a log-normal, or near log-normal distribution (Bell 2001,
Webb and Pitman 2002). That is, most species have small ranges, significantly fewer have
medium-sized ranges, and very few very large ranges (Gaston 1998). To formalise the
observation that conilurines tend not to have small ranges I analysed data on range sizes of
Australian mammals that had been previously calculated from maps in Strahan (1995) by
Chris Johnson (unpublished data). I re-calculated the area for species where I knew of
major departures from the distribution shown in Strahan (1995). Two important changes
were the range of P. desertor, which is almost twice the area shown in Strahan (1995), and
P. patrius, which is not listed at all. In general, ranges in Strahan are under-estimates of the
actual range size, but this is also true of marsupials, so I did not alter data for the majority
of species. The distribution of marsupial range sizes is log-normal (Shapiro-Wilk test:
p<0.0004), while the distribution of range sizes for all Australian rodents is not (p<0.4187).
The distribution for conilurine rodents alone is an even greater departure from a log-normal
(p<0.6367). The average size of conilurine ranges (1,067,702km2) was not significantly
different from that of marsupials (1,056,326km2; p<0.9634). Marsupials, however,
constitute a group of significantly greater taxonomic rank than do conilurines, so I also
compared only dasyurid marsupials, because they are roughly the same body size as
conilurines, are as speciose, and have also been successful in the arid zone. Dasyurid range
217

sizes were log-normally distributed (p<0.0368), and were not significantly different in size
to those of conilurines (1,103,425km2; p<0.8979). Differences in range size distribution
between these groups are due to the comparative lack of conilurines with very small ranges,
and a comparatively high number with small-medium sized ranges (fig. 9.2). Unlike most
size-class distributions, including that of marsupials, the smallest size-class is not the modal
class. The three smallest range size-classes are approximately the same size, whereas, in a
comparison where both marsupial and conilurine ranges are presented in classes of
200,000km2, the smallest class is distinctly modal for marsupials (fig. 9.2 b and c). Many
range size distributions may be slightly left-skewed due to species with very small ranges
(Gaston 1998), however, following the results of chapter 6, I recognise only one conilurine
that has a very small range, Zyzomys palatalis. One of the reasons Pseudomys pilligaensis
seemed an unlikely taxon before any DNA sequencing was conducted was its very small
range. This was made more unusual by the fact that all its close relatives have medium-
large or large distributions conforming roughly to biogeographic subregions.
Bell (2001) showed that range size and abundance could be considered essentially products
of the same process in a neutral model (above), and successfully predicted the general
empirical correlation between large range size and abundance of a species in local
communities (Brown 1984, Gaston and Blackburn 1996). Larger body size has also been
linked to larger range size (Brown and Maurer 1987), but there is little support for this
relationship from reliable data sets sampled over appropriate scales (Gaston and Blackburn
1996). Ecologists accept that range size is determined by a set of characteristics that include
the fundamental niche of a species and historical contingencies (Begon et al. 1996), and I
have endeavoured in earlier chapters to describe the factors that might determine the
distribution of some species; pebble-mound mice need pebbles, rock rats need rocks, P.
delicatulus in Queensland require different climatic conditions to P. novaehollandiae. It is
in considering the origin and limiting factors determining a species’ range that ecologists
are most pressed to accept the usefulness of neutral models. I do not think that neutral
models provide a suitable evaluation of patterns of range size distribution among conilurine
rodents (below). However, the use of such models is not necessarily in identifying the
cause of pattern, but in identifying significant deviations from the predicted pattern (Bell
218
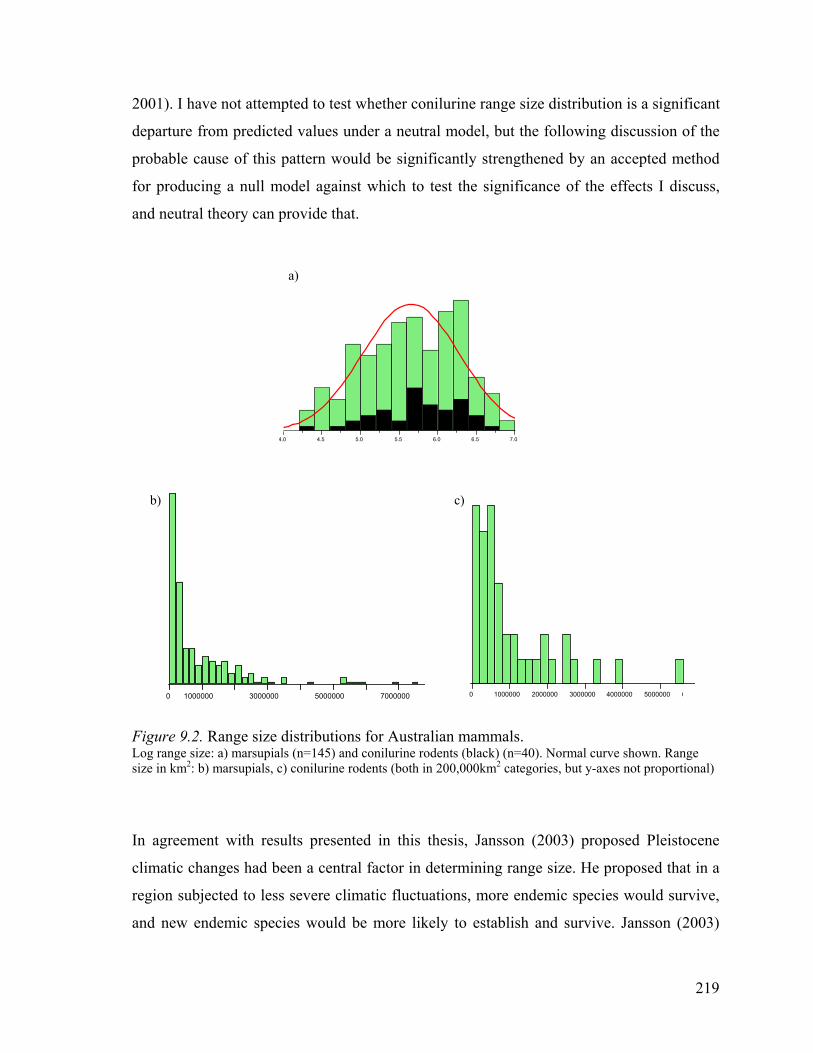
2001). I have not attempted to test whether conilurine range size distribution is a significant
departure from predicted values under a neutral model, but the following discussion of the
probable cause of this pattern would be significantly strengthened by an accepted method
for producing a null model against which to test the significance of the effects I discuss,
and neutral theory can provide that.
4
0 1000000 3000000
Figure 9.2. Range size Log range size: a) marsupialsize in km2: b) marsupials, c
In agreement with resu
climatic changes had be
region subjected to less
and new endemic spec
a)
.0 4.5 5.0 5.5 6.0 6.5 7.0
b)
5000000 7000000
distributions for Australias (n=145) and conilurine roden) conilurine rodents (both in 20
lts presented in this the
en a central factor in dete
severe climatic fluctuatio
ies would be more likely
c)
0 1000000 2000000 3000000 4000000 5000000 6000
n mammals. ts (black) (n=40). Normal curve shown. Range 0,000km2 categories, but y-axes not proportional)
sis, Jansson (2003) proposed Pleistocene
rmining range size. He proposed that in a
ns, more endemic species would survive,
to establish and survive. Jansson (2003)
219
followed Stevens (1989) in suggesting that species with larger ranges were more adapted to
variability, and proposed that species with larger ranges would occupy areas subject to
greater disturbance through the Pleistocene. He offered this as an explanation and
modification of Rapaport’s rule, whereby species at higher latitudes tend to have larger
distributions because these areas were subject to greater Pleistocene climatic fluctuation.
Stephens and Wiens (2003) evoked the idea of time-for-speciation to explain higher species
diversity and smaller range size of emydid turtles in the south-eastern United States when
compared to the northeast. Turtles inhabited the southeast constantly throughout the
Pleistocene, whereas they periodically retreated and re-invaded the northeast due to
glaciation of the region (Stephens and Wiens 2003). Speciation has therefore not occurred
in the northeast, while range fragmentation in the southeast has resulted in speciation and
smaller range size, without increasing the local community diversity at any given site
(Stephens and Wiens 2003).
Variability seems to be the key. Gaston (1998) also observed that in highly variable
environments departures of range size distributions from the log-normal might occur
because the effects of speciation are swamped. So why the contrast between marsupials and
conilurines when both inhabit highly variable environments? Section 2.3.2 outlined the
difference between marsupials, which are “forest animals”, and conilurines that are “non-
forest animals”. Marsupials have a long history in Australia, and the legacy of their
Gondwanan origin is a preference for less variable habitats. Compared to conilurines there
are more endemic, restricted range species in eastern forests. This is also apparent in the
Australian birds, which exhibit a pronounced left skew in the distribution of range sizes
(Gaston 1998), because a proportionally large number have very small or small
distributions in rainforests and forests. In contrast, arid zone mammals tend to be
widespread. Of the 33 species with ranges greater than the 85th percentile in Australian
mammal range sizes (excluding monotremes), 25 are restricted to the arid zone, and a
further three have distributions centred on, or largely comprised of, arid regions. The arid
zone makes up such a large part of Australia that this result could simply be related to the
fact that to have a large range, it must encompass large parts of the arid zone. However,
arid zone mammals, both conilurine and marsupial, have a significantly larger average
220

range size than forest mammals (e.g. for conilurines: t-test, t= 3.723 p<0.0006 df= 38).
Disturbance in Australia was in the form of heightened aridity not glaciers, so unlike the
situation with American turtles, central Australia was still potentially inhabitable during
periods of “disturbance”. This may explain why arid-adapted Notomys species show signs
of specialisation, smaller range size, and rapid speciation within the arid zone in defiance of
Greenslade’s (1982) theoretical prediction that species adapted to arid conditions were
unlikely to speciate. The very widespread Pseudomys species of the region have apparently
not diversified within the highly disturbed habitats.
Does species ecology explain macroevolutionary patterns within conilurines?
I can only provide a classic “yes and no” answer: phylogenetic imbalance within
conilurines could be partly related to body size, but no ecological attribute suitably
accounts for the lack of species diversity within Leggadina compared to the Pseudomys
group. Neutral models, however, produce such results without any need for ecological
differences between clades. I favour ecologically-based explanations for the non log-
normal distribution of range sizes within the group, and of differences in evolution evident
between pebble-mound mice and delicate mice. However, the parameters and patterns
involved in ecological explanations for conilurine macroevolution are entwined within the
conceptual and predictive framework of neutral models, and once the ecological
community has accept them, neutral models will provide a pivotal null model for assessing
the real importance of ecological processes. The unification of these factors and the
development of neutral models accounting for realistic levels of community structure may
be in its infancy, but neutral models should be embraced and explored by the ecological
community in an attempt to marry apparently small-scale realities such as habitat choice
and competition with large-scale ecological and phylogenetic patterns.
9.3.2 FINALÉ
I believe I have shown here that species ecology is a fundamental influence guiding
evolutionary processes in conilurine rodents, and that those effects have been translated
221
into macro-evolutionary patterns. A less empirical goal of this thesis was to promote the
conilurine group as an interesting evolutionary model. I hope that I have illustrated the
unique place conilurine rodents hold in the evolution of the Australian biota. They arrived
late in development of modern Australia, and their evolution has taken place largely outside
the environments that have been the centre of the evolutionary history for most Australian
vertebrates. This means that with further characterisation of evolutionary processes and
pattern, conilurines may provide a valuable contrast to studies of marsupial evolution.
Many directions for future research are suggested by results presented here. In particular,
studies of the P. delicatulus complex could prove of great theoretical interest regarding
speciation processes, and the northern savannah fauna still provides excellent opportunities
to investigate the importance of Pleistocene climatic cycles and species ecology in
speciation, although such opportunities are unfortunately lacking in many other areas due to
an horrific extinction record.
222
References
Anderson, S. 1994. Area and endemism. Quarterly Review of Biology 69:451-471.
Anstee, S. D. 1996. Use of external mound structures as indicators of the presence of the
pebble-mound mouse, Pseudomys chapmani, in mound systems. Wildlife Research
23:429-434.
Anstee, S. D., J. D. Roberts, and J. E. O'Shea. 1997. Social structure and patterns of
movement of the western pebble-mound mouse, Pseudomys chapmani, at
Marandoo, Western Australia. Wildlife Research 24:295-305.
Aplin, K. P. accepted. Ten million years of rodent evolution in the Australasian region: a
review of the phylogenetic evidence and a speculative historical biogeography. in J.
Merrick, G. Clayton, M. Archer, and S. J. Hand, editors. Vertebrate Zoogeography
and Evolution in Australasia.
Aplin, K. P., P. R. Baverstock, and S. C. Donnellan. 1993. Albumin immunological
evidence for the time and mode of origin of the New Guinean terrestrial mammal
fauna. Science in New Guinea 19:131-145.
Archer, M. 1978. Quaternary vertebrate faunas from the Texas caves of southeastern
Queensland. Memoirs of the Queensland Museum 19:61-109.
Archer, M., R. Arena, M. Bassarova, K. Black, J. Brammall, B. Cooke, P. Creaser, K.
Crosby, A. Gillespie, H. Godthelp, M. Gott, S. J. Hand, B. Kear, A. Krikmann, B.
Mackness, J. Muirhead, A. Musser, T. Myers, N. Pledge, Y. Wang, and S. Wroe.
1999. The evolutionary history and diversity of Australian mammals. Australian
Mammalogy 21:1-45.
Archer, M., and A. Baynes. 1972. Prehistoric mammal faunas from two small caves in the
extreme south-west of Western Australia. Journal of the Royal Society of Western
Australia 55:80-89.
Archer, M., and B. Fox. 1984. Background to vertebrate zoogeography in Australia. Pages
1-15 in M. Archer and G. Clayton, editors. Vertebrate Zoogeography and Evolution
in Australia. Hesperian Press, Perth.
Archer, M., S. J. Hand, and H. Godthelp. 1991. Riversleigh. The story of Animals in the
Ancient Rainforests of Central Australia. Reed, Sydney.
223
Archer, M. A., H. Godthelp, S. J. Hand, and D. Megirian. 1989. Fossil mammals of
Riversleigh, northwestern Queensland: Preliminary overview of biostratigraphy,
correlation and environmental change. Australian Zoologist 25:29-61.
Archer, M. A., and M. Wade. 1976. Results of the Ray E. Lemley expeditions, part 1. The
Allingham formation and a new Pliocene vertebrate fauna from northern
Queensland. Memoirs of the Queensland Museum 17:54-58.
AUSLIG. 1997. GEODATA 9 second DEM. AUSLIG, Canberra.
Avise, J. C., J. Arnold, R. M. Ball, E. Bermingham, T. Lamb, J. E. Neigel, C. A. Reeb, and
N. Saunders. 1987. Intraspecific phylogeography: the mitochondrial DNA bridge
between population genetics and systematics. Annual Review of Ecology and
Systematics 18:489-522.
Avise, J. C., D. Walker, and G. C. Johns. 1998. Speciation durations and Pleistocene effects
on vertebrate phylogeography. Proceedings of the Royal Society of London (B)
265:1707-1712.
Ayliffe, L. K., P. C. Marianelli, K. C. Moriarty, R. T. Wells, M. T. McCulloch, G. E.
Mortimer, and H. J. C. 1998. 500 ka precipitation record from southeastern
Australia: evidence for interglacial relative aridity. Geology 26:147-150.
Barton, N. H., and B. Charlesworth. 1984. Genetic revolutions, founder effects and
speciation. Annual Review of Ecology and Systematics 15:133-164.
Baverstock, P. 1984. Australia's living rodents: a restrained explosion. in M. Archer and G.
Clayton, editors. Vertebrate Zoogeography and Evolution in Australasia. Hesperian
Press, Perth.
Baverstock, P. R. 1982. Adaptations and evolution of the mammals of arid Australia. Pages
175-178 in W. R. Barker and P. J. M. Greenslade, editors. Evolution of the Flora
and Fauna of Arid Australia. Peacock Publications, Frewville.
Baverstock, P. R., J. T. Hogarth, S. R. Cole, and J. Covacevich. 1976. Biochemical and
karyotypic evidence for the specific status of the rodent Leggadina lakedownensis
Watts. Transactions of the Royal Society of South Australia 100:109-112.
Baverstock, P. R., and C. H. S. Watts. 1974. Water balance and kidney function in some
rodents endemic to Australia. Laboratory Animal Science 24:743-751.
224

Baverstock, P. R., C. H. S. Watts, M. Adams, and S. R. Cole. 1981. Genetical relationships
among Australian rodents (Muridae). Australian Journal of Zoology 29:289-303.
Baverstock, P. R., C. H. S. Watts, and S. R. Cole. 1977a. Electrophoretic comparison
between allopatric populations of five Australian pseudomyine rodents (Muridae).
Australian Journal of Biological Science 30:471-485.
Baverstock, P. R., C. H. S. Watts, M. Gelder, and A. Jahnke. 1983. G-banding homologies
of some Australian Rodents. Genetica 60:105-117.
Baverstock, P. R., C. H. S. Watts, and J. T. Hogarth. 1977b. Chromosome evolution in
Australian rodents I: the Pseudomyinae, the Hydromyinae and the Uromys/Melomys
group. Chromosoma 61:95-125.
Baverstock, P. R., C. H. S. Watts, Hogarth, J. T., Robinson, A. C. and Robinson, J. F.
1977c. Chromosome evolution in Australian rodents II: the Rattus group.
Chromosoma 61:227-41.
Baverstock, P. R., C. H. S. Watts, and J. T. Hogarth. 1977d. Polymorphic patterns of
heterochromatin distribution in Australian hopping mice, Notomys alexis, N.
cervinus and N. fuscus (Rodentia: Muridae). Chromosoma 61:243-256.
Baynes, A. 1984. Native mammal remains from Wilgie Mia Aboriginal ochre mine:
evidence on the pre-European fauna of the western arid zone. Records of the
Western Australian Museum 11:297-310.
Baynes, A., D. Merrilees, and J. K. Porter. 1975. Mammal remains from the upper levels of
a late Pleistocene deposit in Devil's Lair, Western Australia. Journal of the Royal
Society of Western Australia 58:97-117.
Beard, J. S., and M. J. Webb. 1974. Great Sandy Desert, 1:100 000 Vegetation Series,
explantory notes to sheet 2. University of Western Australia Press, Perth.
Begg, R. J., and C. R. Dunlop. 1985. The diets of the large rock-rat, Zyzomys woodwardi,
and the common rock-rat, Z. argurus (Rodentia:Muridae). Australian Wildlife
Research 12:19-24.
Begon, M., J. L. Harper, and C. R. Townsend. 1996. Ecology, 3rd edition. Blackwell
Science, Oxford.
Bell, G. 2001. Neutral macroecology. Science 293:2413-2418.
225

Benbow, M. C., N. F. Alley, R. A. Callen, and A. D. Greenwood. 1995. Geological history
and palaeoclimate. South Australian Geological Survey Bulletin 54:208-217.
Bermingham, E., and C. Moritz. 1998. Comparative phylogeography: concepts and
applications. Molecular Ecology 7:367-369.
Bonhomme, F., and J. L. Guenet. 1989. The wild house mouse and its relatives. in M. F.
Lyon and A. G. Searle, editors. Genetic Variants and Strains of the Laboratory
Mouse. Oxford University Press, Oxford.
Bowler, J. M. 1976. Aridity in Australia: age origins and expression in aeolian landforms
and sediments. Earth Science Reviews 12:279-310.
Bowler, J. M. 1982. Aridity in the late Tertiary and Quaternary of Australia. Pages 35-45 in
W. R. Barker and P. J. M. Greenslade, editors. Evolution of the Flora and Fauna of
Arid Australia. Peacock Publications/Australian Systematic Botany Society,
Adelaide.
Bowler, J. M., K. Wyrwoll, and Y. Lu. 2001. Variations of the northeast Australian summer
monsoon over the last 300,000 years: the paleaohydrological record of the Gregory
(Mulan) Lakes system. Quaternary International 83-85:63-80.
Braithwaite, R. W., and P. Brady. 1993. The delicate mouse, Pseudomys delicatulus: a
continuous breeder waiting for good times. Australian Mammalogy 16:94-98.
Braithwaite, R. W., and J. Covacevich. 1995. Delicate mouse. Pages 592-593 in R. Strahan,
editor. The Mammals of Australia. Reed New Holland, Sydney.
Braithwaite, R. W., S. R. Morton, A. A. Burbidge, and J. H. Calaby. 1995. Australian
Names for Australian Rodents. Australian Nature Conservation Agency, Canberra.
Brandle, R., K. E. Moseby, and M. Adams. 1999. The distribution, habitat requirements
and conservation status of the plains rat, Pseudomys australis (Rodentia:Muridae).
Wildlife Research 26:463-477.
Brazenor, C. W. 1934. A revision of the Australian jerboa mice. Memoirs of the National
Museum of Victoria 8:74-89.
Breed, W. G. 1981. Unusual anatomy of the male reproductive tract in Notomys alexis
(Muridae). Journal of Mammalogy 62:373-375.
226

Breed, W. G. 1985. Morphological variation in the female reproductive tract of Australian
rodents in the genera Pseudomys and Notomys. Journal of Reproduction and
Fertility 73:379-384.
Breed, W. G. 1986. Comparative morphology and evolution of the male reproductive tract
in the Australian hydromyine rodents (Muridae). Journal of the Zoological Society
of London 209:607-629.
Breed, W. G. 1989a. Hopping mice do it differently. New Scientist 10:24-25.
Breed, W. G. 1989b. Reproductive anatomy and sperm morphology of the long-tailed
hopping mouse, Notomys longicaudatus (Rodentia:Muridae). Australian
Mammalogy 13:201-204.
Breed, W. G. 1995a. Sandy inland mouse. Pages 604-605 in R. Strahan, editor. The
Mammals of Australia. Reed New Holland, Sydney.
Breed, W. G. 1995b. Spinifex hopping-mouse. Pages 568-570 in R. Strahan, editor. The
Mammals of Australia. Reed New Holland, Sydney.
Breed, W. G. 1997. Evolution of the spermatazoon in Australasian rodents. Australian
Journal of Zoology 45:459-478.
Breed, W. G. 2000. Taxonomic implications of variation in the sperm head morphology of
the Australian delicate mouse, Pseudomys delicatulus. Australian Mammalogy
21:193-199.
Breed, W. G., and J. Taylor. 2000. Body mass, testes mass, and sperm size in murine
rodents. Journal of Mammalogy 81:758-768.
Bridle, J. R., and C. D. Jiggins. 2000. Adaptive dynamics: is speciation too easy? Trends in
Ecology and Evolution 15:225-226.
Briscoe, D. A., B. J. Fox, and S. Ingleby. 1981. Genetic differentiation between Pseudomys
pilligaensis and related Pseudomys (Rodentia: Muridae). Australian Mammalogy
4:89-92.
Brooks, D. R., and D. A. McLennan. 2001. A comparison of a discovery-based and an
event-based method of historical biogeography. Journal of Biogeography 28:757-
767.
Brown, J. H. 1984. On the relationship between abundance and distribution of species.
American Naturalist 124:255-279.
227

Brown, J. H., and B. A. Maurer. 1987. Evolution of species assemblages: effects of
energetic constraints and species dynamics on the diversification of the American
avifauna. American Naturalist 130:1-17.
Burbidge, A. A., and N. L. Mackenzie. 1989. Patterns in the modern decline of Western
Australia's vertebrate fauna: causes and conservation implications. Biological
Conservation 50:143-198.
Burbidge, N. T. 1960. The phytogeography of Australia. Australian Journal of Botany 8:75-
211.
Bush, G. L. 1975. Modes of animal speciation. Annual Review of Ecology and Systematics
6:339-364.
Butlin, R. 1987a. A new approach to sympatric speciation. Trends in Ecology and
Evolution 2:310-311.
Butlin, R. 1987b. Speciation by reinforcement. Trends in Ecology and Evolution 2:8-13.
Campbell, N. J. H., F. C. Harris, M. S. Elphinstone, and P. R. Baverstock. 1995. Outgroup
heteroduplex analysis using temperature gradient gel electrophoresis: high
resolution, large scale, screening of DNA variation in the mitochondrial control
region. Molecular Ecology 4:407-418.
Cardillo, M., Huxtable, J. S. and Bromham, L. 2003. Geographic range size, life history
and rates of diversification in Australian mammals. Journal of Evolutionary
Biology. 16:282-288
Carson, H. L. 1975. The genetics of speciation at the diploid level. American Naturalist
109:83-92.
Cermak, M. 1999. Population structure, population dynamics and dispersal of the Pebble-
mound mouse Pseudomys patrius. MSc thesis. James Cook University, Townsville.
Chan, K. M. A., and B. R. Moore. 2002. Whole-tree methods for detecting differential
diversification rates. Systematic Biology 51:855-865.
Chappell, J., and N. J. Shackleton. 1986. Oxygen isotopes and sea level. Nature 324:137-
140.
Chernoff, B. 1982. Character variation among populations and the analysis of
biogeography. American Zoologist 22:425-439.
228

Chivas, A. R., A. Garcia, S. van der Kaars, M. J. J. Couapal, S. Holt, J. M. Reeves, D. J.
Wheeler, A. D. Switzer, C. Murray-Wallace, D. Banerjee, D. M. Price, S. X. Wang,
G. Pearson, N. T. Edgar, L. Beaufort, P. De Dekker, E. Lawson, and C. B. Cecil.
2001. Sea-level and environmental changes since the last interglacial in the Gulf of
Carpentaria, Australia: an overview. Quaternary International 83-85:19-46.
Christophel, D. C., and D. R. Greenwood. 1989. Changes in climate and vegetation in
Australia during the Tertiary. Review of Palaeobotany and Palynology 58:95-109.
Churchill, S. K. 1996. Distribution, habitat and status of the Carpentarian rock-rat, Zyzomys
palatalis. Wildlife Research 23:77-91.
Clarke, J. D. A. 1994. Geomorphology of the Kambalda region, western Australia.
Australian Journal of Earth Sciences 41:229-239.
Clement, M., D. Posada, and K. A. Crandall. 2000. TCS: a computer program to estimate
gene genealogies. Molecular Ecology 9:1657-1660.
Cockburn, A. 1978. The distribution of Pseudomys shortridgei (Muridae: Rodentia) and its
relevance to that of other heathland Pseudomys. Australian Wildlife Research
5:213-219.
Cockburn, A. 1980. The diet of the New Holland mouse (Pseudomys novaehollandiae) and
the house mouse (Mus musculus) in a Victorian coastal heathland. Australian
Mammalogy 3:31-34.
Cockburn, A. 1981a. Population processes of the silky desert mouse, Pseudomys
apodemoides (Rodentia), in mature heathlands. Australian Wildlife Research 8:499-
514.
Cockburn, A. 1981b. Population regulation and dispersion of the smoky mouse, Pseudomys
fumeus I. Dietary determinants of microhabitat preference. Australian Journal of
Ecology 6:231-254.
Cockburn, A. 1995a. Heath mouse. Pages 617-618 in R. Strahan, editor. The Mammals of
Australia. Reed New Holland, Sydney.
Cockburn, A. 1995b. Silky mouse. Pages 585-586 in R. Strahan, editor. Mammals of
Australia. Reed New Holland, Sydney.
Cooke, B., and B. Kear. 1999. Evolution and diversity of kangaroos (Macropodoidea,
Marsupialia). in M. Archer, R. Arena, M. Bassarova, K. Black, J. Brammall, B.
229
Cooke, P. Creaser, K. Crosby, A. Gillespie, H. Godthelp, M. Gott, S. J. Hand, B.
Kear, A. Krikmann, B. Mackness, J. Muirhead, A. Musser, T. Myres, N. Pledge, Y.
Wang, and S. Wroe, editors. The evolutionary history and diversity of Australian
mammals. Australian Mammalogy 21: 27-28.
Coventry, R. J., D. Hopley, J. B. Campbell, I. Douglas, N. Harvey, A. P. Kershaw, J.
Oliver, C. V. G. Phipps, and K. Pye. 1980. The Quaternary of northeastern
Australia. Pages 375-417 in R. A. Henderson and P. J. Stephenson, editors. The
Geology and Geophysics of northeastern Australia. Geological Society of Australia,
Queensland Division, Brisbane.
Coventry, R. J., P. J. Stephenson, and A. W. Webb. 1985. Chronology of landscape
evolution and soil development in the upper flinders area, Queensland, based on
isotopic dating of Cainozoic basalts. Australian Journal of Earth Sciences 32:433-
447.
Coyne, J. A. 1992. Genetics and speciation. Nature 355:511-515.
Coyne, J. A., and H. A. Orr. 1998. The evolutionary genetics of speciation. Philosophical
Transactions of the Royal Society of London (B) 353:287-305.
Crabb, P. L. 1977. Fossil mammals of the lower Pleistocene Moorna Sands, south-west
New South Wales, Australia, with an analysis of the Australian Pseudomyine murid
molars. PhD thesis. Monash University, Clayton, Victoria.
Cracraft, J. 1982. Geographic differentiation, cladistics, and vicariance biogeography:
reconstructing the tempo and mode of evolution. American Zoologist 22:411-424.
Cranston, P. S., and I. D. Naumann. 1991. Biogeography. Pages 180-197 in I. D. Naumann,
editor. The Insects of Australia: a textbook for students and research workers.
CSIRO Publishing, Melbourne.
Crisp, M. D., S. Laffan, H. P. Linder, and A. Monro. 2001. Endemism in the Australian
flora. Journal of Biogeography 28:183-198.
Crouse, J., and A. Demorese. 1989. Ethanol precipitation: ammonium acetate as an
alternative to sodium acetate. Focus 9.2:3-5.
Dahl, K. 1897. Biological notes on north Australian Mammalia. The Zoologist series 4
1:189-216.
230
Danley, P. D., and T. D. Kocher. 2001. Speciation in rapidly diverging systems: lessons
from lake Malawi. Molecular Ecology 10:1075-1086.
De Dekker, P. 2001. Late Quaternary cyclic aridity in tropical Australia. Palaeogeography,
Palaeoclimatology, Palaeogeology 170:1-9.
de Manzacourt, C. 2001. Consequences of community drift. Science 293:1772.
de Vis, C. W. 1884. Notes on the fauna of the Gulf of Carpentaria. Proceedings of the
Royal Society of Queensland 1:154-156.
Dell, J., and R. A. How. 1988. The biological survey of the eastern goldfields of Western
Australian. Part 5: Edjudina-Menzies study area. Records of the Western Australian
Museum 31:441-452.
Dickman, C. R. 1994. Mammals of New South Wales: past, present and future. Australian
Zoologist 29:158-165.
Dickman, C. R., D. Lunney, and A. Matthews. 2000. Ecological attributes and conservation
of native rodents in New South Wales. Wildlife Research 27:347-355.
Dickman, C. R., M. Predavec, and F. J. Downey. 1995. Long-range movements of small
mammals in arid Australia: implications for land management. Journal of Arid
Environments 31:441-452.
Dickman, C. R., and S. M. Van Dyck. 2000. Status, ecological attributes and conservation
of native rodents in Queensland. Wildlife Research 27:333-346.
Donnellan, S. C. 1989. Phylogenetic relationships of New Guinean rodents (Rodentia:
Muridae) based on chromosomes. Australian Mammalogy 12:61-67.
Driskell, A. C., S. Pruett-Jones, K. A. Tarvin, and S. Hagevik. 2002. Evolutionary
relationships among blue- and black-plumaged populations of the white-winged
fairy-wren (Malurus leucopterus). Australian Journal of Zoology 50:581-595.
Dunlop, J. N., and I. R. Pound. 1981. Observations on the pebble-mound mouse Pseudomys
chapmani Kitchener, 1980. Records of the Western Australian Museum 9:1-5.
Ellermann, J. R. 1941. The Families and Genera of living Rodents. With a list of named
forms (1758-1936) by R.W. Hayman and G.W.C. Holt. Volume II. Family Muridae.
British Museum of Natural History, London.
Ellis, M. 1995. A discussion of the large extinct rodents of Mootwingee National park,
western New South Wales. Australian Zoologist 30:39-42.
231

Endler, J. 1982. Problems in distinguishing historical from ecological factors in
biogeography. American Zoologist 22:441-452.
Endler, J. A. 1977. Geographic Variation, Speciation, and Clines. Princeton University
Press, Princeton.
Farris, J. S., M. Kallersjo, and J. E. De Laet. 2001. Branch lengths do not indicate support-
even in maximum likelihood. Cladistics 17:298-299.
Felsenstein, J. 1981. Evolutionary trees from DNA sequences: a maximum likelihood
approach. Journal of Molecular Evolution 17:368-376.
Finlayson, H. H. 1941. On central Australian mammals. Part II. The Muridae. Transactions
of the Royal Society of South Australia 65:215-231.
Finlayson, H. H. 1942. A new Melomys from Queensland with notice of two other
Queensland rats. Transactions of the Royal Society of South Australia 66:243-247.
Fitch, W. 1995. Uses for evolutionary trees. Philisophical Transactions of the Royal
Society of London (B) 349:93-102.
Flannery, T. 1995. Mammals of New Guinea. Reed Books, Sydney.
Flannery, T. F. 1989. Origins of the Australo-Pacific land mammal fauna. Australian
Zoological Reviews 1:15-24.
Fleming, M. R. 1995. Common rock-rat. Pages 620-621 in R. Strahan, editor. The
Mammals of Australia. Reed New Holland, Sydney.
Flower, B. P., and J. P. Kennett. 1994. The Miocene climatic transition: East Antarctic ice
sheet development, deep ocean circulation and global carbon cycling.
Palaeogeography, Palaeoclimatology, Palaeogeology 108:537-555.
Ford, F. 2003. The Unified Neutral Theory of Biodiversity and Biogeography: book
review. Austral Ecology 28:93-94.
Ford, F., A. Cockburn, and L. S. Broome. 2003. Habitat preference, diet and demography
of the smoky mouse, Pseudomys fumeus (Rodentia: Muridae), in south-eastern New
South Wales. Wildlife Research 30:89-101.
Ford, J. 1978. Geographical isolation and morphological and habitat differentiation
between birds of the Kimberley and Northern Territory. EMU 78:25-35.
232

Foster, S. A., R. J. Scott, and W. A. Cresko. 1998. Nested biological variation and
speciation. Philosophical Transactions of the Royal Society of London (B) 353:207-
218.
Fox, B. 1995a. Pilliga mouse. Pages 616-617 in R. Strahan, editor. The Mammals of
Australia. Reed New Holland, Sydney.
Fox, B. J. 1995b. Eastern chestnut mouse. Pages 601-603 in R. Strahan, editor. The
Mammals of Australia. Reed New Holland, Sydney.
Fox, B. J., and D. A. Briscoe. 1980. Pseudomys pilligaensis, a new species of murid rodent
from the Pilliga Scrub, northern New South Wales. Australian Mammalogy 3:109-
126.
Fox, B. J., and M. D. Fox. 1978. Recolonisation of coastal heath by Pseudomys
novaehollandiae. Australian Journal of Ecology 3:447-465.
Fox, B. J., D. G. Read, E. Jefferys, and J. Luo. 1994. Diet of the Hastings River mouse
(Pseudomys oralis). Wildlife Research 21:491-505.
Galloway, R. W., and E. M. Kemp. 1981. Late Cainozoic environments in Australia. in A.
Keast, editor. Ecological Biogeography of Australia. W. Junk, The Hague.
Gardner, G. J., A. J. Mortlock, D. M. Price, M. L. Readhead, and R. J. Wasson. 1987.
Thermoluminescence and radiocarbon dating of Australian desert dunes. Australian
Journal of Earth Sciences 34:343-357.
Gaston, K. J. 1998. Species range size distributions: products of speciation, extinction and
transformation. Proceedings of the Royal Society of London (B) 353:219-230.
Gaston, K. J., and T. M. Blackburn. 1996. Global scale macroecology: interactions between
population size, geographic range size and body size in the Anseriformes. Journal of
Animal Ecology 65:701-714.
Gaston, K. J., T. M. Blackburn, and J. H. Lawton. 1997. Interspecific abundance-range size
relationships: an appraisal of mechanisms. Journal of Animal Ecology 66:579-601.
Gibson, D. F. 1986. A biological survey of the northern Tanami Desert. Conservation
Commission of the Northern Territory, Alice Springs.
Godthelp, H. 1989. Pseudomys vandycki, a Tertiary murid from Australia. Memoirs of the
Queensland Museum 28:171-173.
233

Godthelp, H. 1999. Diversity, relationships and origins of the Tertiary and Quaternary
rodents of Australia. in M. Archer, R. Arena, M. Bassarova, K. Black, J. Brammall,
B. Cooke, P. Creaser, K. Crosby, A. Gillespie, H. Godthelp, M. Gott, S. J. Hand, B.
Kear, A. Krikmann, B. Mackness, J. Muirhead, A. Musser, T. Myres, N. Pledge, Y.
Wang, and S. Wroe, editors. The evolutionary history and diversity of Australian
mammals. Australian Mammalogy 21: 1-45.
Godthelp, H. J. 1997. Zyzomys rackhami sp. nov. (Rodentia, Muridae) a rockrat from
Pliocene Rackham's Roost site, Riversleigh, northwestern Queensland. Memoirs of
the Queensland Museum 41:329-333.
Goldstein, D. B., A. R. Linares, L. L. Cavalli-Sforza, and M. W. Feldman. 1995. An
evaluation of genetic distances for use with microsatellite loci. Genetics 139:463-
471.
Gould, J. 1863. The Mammals of Australia. Vol. III. (as "Placental Mammals of
Australia"). Macmillan, Melbourne.
Gould, S. J. 1985. The paradox of the first tier: an agenda for paleobiology. Paleobiology
11:2-12.
Gould, S. J. 1994. Ernst Mayr and the centrality of species. Evolution 48:31-35.
Greenslade, P. J. M. 1982. Selection processes in arid Australia. Pages 125-130 in W. R.
Barker and P. J. M. Greenslade, editors. Evolution of the flora and fauna of arid
Australia. Peacock Publications, Adelaide.
Greenwood, A. D., and S. Pååbo. 1999. Nuclear insertion sequences of mitochondrial DNA
predominate in hair but not in blood of elephants. Molecular Ecology 8:133-137.
Greenwood, D. R., A. J. Vadala, and J. G. Douglas. 2000. Victorian Paleogene and
Neogene Macrofloras: a conspecus. Proceedings of the Royal Society of Victoria
112:65-92.
Haering, R., and B. J. Fox. 1997. Habitat use by sympatric populations of Pseudomys
novaehollandiae and Mus domesticus in coastal heathland. Australian Journal of
Ecology 22:69-87.
Haffer, J. 1969. Speciation in Amazonian forest birds. Science 165:131-137.
234

Hall, R. 1998. The plate tectonics of Cenozoic SE Asia and the distribution of land and sea.
Pages 99-131 in R. Hall and J. D. Holloway, editors. Biogeography and Geological
Evolution of SE Asia. Backhuys Publishers, Leiden.
Hand, S. 1984. Australia's oldest rodents: master mariners from Malaysia. Pages 905-912 in
M. Archer and G. Clayton, editors. Vertebrate Zoogeography and Evolution in
Australasia. Hesperian Press, Perth.
Happold, M. 1976. Social behaviour of the conilurine rodents (Muridae) of Australia.
Zietschrift fur Tierpsychologie 40:113-182.
Haq, B. U., J. Hardenbol, and P. R. Vail. 1987. Chronology of fluctuating sea levels since
the Triassic. Science 235:1156-1166.
Hartl, D. L., and A. G. Clark. 1997. Principles of Population Genetics, 3rd edition. Sinauer
Associates, Sunderland.
Harvey, P. H., A. J. Leigh Brown, and J. Maynard Smith. 1995. New uses for new
phylogenies: editors' introduction. Philosophical Transactions of the Royal Society
of London (B) 349:3-4.
Hausdorf, B. 2002. Units in biogeography. Systematic Biology 51:648-652.
Heads, M. 2002. Birds of paradise, vicariance biogeography and terrane tectonics in New
Guinea. Journal of Biogeography 29:261-283.
Heatwole, H. 1987. Major components and distribution of the terrestrial fauna. Pages 101-
135 in D. W. Walton, editor. Fauna of Australia. Australian Government Publishing
Service, Canberra.
Hesse, P. P. 1994. The record of continental dust from Australia in Tasman Sea sediments.
Quaternary Science Reviews 13:257-272.
Hoelzel, A. R. 1992. Molecular Genetic Analysis of Populations: a practical approach.
Oxford University Press, USA.
Hoelzer, G. A., J. Wallman, and D. J. Melnick. 1998. The effects of social structure,
geographical structure, and population size on the evolution of mitochondrial DNA:
II. Molecular clocks and the lineage sorting period. Journal of Molecular Evolution
47:21-32.
235

Holloway, J. D., and R. Hall. 1998. SE Asian geology and biogeography: an introduction.
in R. Hall and J. D. Holloway, editors. Biogeography and Geological Evolution of
SE Asia. Backhuys Publishers, Leiden.
Hope, J. 1982. Late Cainozoic vertebrate faunas and the development of aridity in
Australia. Pages 85-100 in W. R. Barker and P. J. M. Greenslade, editors. Evolution
of the Flora and Fauna of Arid Australia. Peacock Publications/Australian
Systematic Botany Society, Adelaide.
Hopkins, M. S., J. Ash, A. W. Graham, J. Head, and R. K. Hewett. 1993. Charcoal
evidence of the spatial extent of Eucalyptus woodland expansions and rainforest
contractions in north Queensland during the late Pleistocene. Journal of
Biogeography 20:357-372.
Hubbell, S. P. 2001. The Unified Neutral Theory of Biodiversity and Biogeography.
Princeton University Press, Princeton.
Huxley, J. S. 1942. Evolution: the modern synthesis. Allen and Unwin, London.
Imbrie, J., A. McIntyre, and A. Mix. 1989. Oceanic response to orbital forcing in the Late
Quaternary: observational and experimental strategies. Pages 121-164 in A. Berger,
A. Schneider, and J. C. Duplessy, editors. Climate and Geo-sciences. Kluwer,
Dordrecht.
Iredale, T., and E. L. G. Troughton. 1934. A check-list of the mammals recorded from
Australia. Memoirs of the Australian Museum 6:1-122.
Jablonski, D., and K. Roy. 2003. Geographical range and speciation in fossil and living
molluscs. Proceedings of the Royal Society of London (B) 270:401-406.
Jacobs, L. L., and W. R. Downs. 1994. The evolution of murine rodents in Asia. Pages 149-
156 in Y. Tomida, C. K. Li, and T. Setoguchi, editors. Rodent and Lagomorph
Families of Asian Origins and Diversification. National Science Museum
Monographs, Tokyo.
Jansson, R. 2003. Global patterns in endemism explained by past climatic change.
Proceedings of the Royal Society of London (B) 270:583-590.
Jennings, J. N. 1975. Desert dunes and estuarine fill in the Fitzroy estuary (north-western
Australia). Catena 2:215-262.
236
Jerry, D. R., T. A. Dow, M. S. Elphinstone, and P. R. Baverstock. 1998. Historical and
contemporary maternal population structuring in the endangered Hastings River
mouse (Pseudomys oralis). Conservation Biology 12:1017-1022.
Kaneko, K., and T. Yomo. 2000. Sympatric speciation: compliance with phenotype
diversification from a single genotype. Proceedings of the Royal Society of London
(B) 267:2367-2373.
Keast, A. 1961. Bird speciation on the Australian continent. Bulletin of the Museum of
Comparative Zoology, Harvard 123:403-495.
Keast, A. 1981. Origins and relationships of the Australian biota. Pages 2000-2050 in A.
Keast, editor. Ecological Biogeography of Australia. W. Junk, The Hague.
Keith, K., and J. H. Calaby. 1968. The New Holland mouse, Pseudomys novaehollandiae
(Waterhouse), in the Port Stephens district, New South Wales. CSIRO Wildlife
Research 13:45-58.
Kemper, C. 1995. New Holland mouse. Pages 611-612 in R. Strahan, editor. The Mammals
of Australia. Reed New Holland, Sydney.
Kemper, C. M. 1990. Small mammals and habitat disturbance in open forest of coastal New
South Wales. I. Population parameters. Australian Wildlife Research 17:195-206.
Kendric, G. W., and J. K. Porter. 1973. Remains of a thylacine and other fauna from caves
in the Cape Range, Western Australia. Journal of the Royal Society of Western
Australia 56:116-122.
Kerle, J. A. 1995a. Central pebble-mound mouse. Pages 607-608 in R. Strahan, editor. The
Mammals of Australia. Reed New Holland, Sydney.
Kerle, J. A. 1995b. Desert mouse. Pages 594-595 in R. Strahan, editor. The Mammals of
Australia. Reed New Holland, Sydney.
Kerle, J. A. 1995c. Grassland melomys. Pages 632-634 in R. Strahan, editor. The Mammals
of Australia. Reed New Holland, Sydney.
Kerle, J. A., and M. A. Burgman. 1984. Some aspects of the ecology of the mammal fauna
of the Jabiluka area, Northern Territory. Australian Wildlife Research 11:207-222.
Kershaw, A. P. 1994. Pleistocene vegetation of the humid tropics of northeastern
Queensland, Australia. Palaeogeography, Palaeoclimatology and Palaeoecology
109:399-412.
237

Kershaw, A. P., and G. C. Nanson. 1993. The last full glacial cycle in the Australian region.
Global and Planetary Change 7:1-9.
Kidd, M. G., and V. L. Friesen. 1998. Analysis of mechanisms of microevolutionary
change in Cepphus guillemots using patterns of control region variation. Evolution
52:1158-1168.
Kikkawa, J., and K. Pearse. 1969. Geographical distribution of land birds in Australia- a
numerical analysis. Australian Journal of Zoology 17:821-840.
Kimura, M. 1980. A simple method for estimating evolutionary rate of base substitutions
through comparative studies of nucleotide sequences. Journal of Molecular
Evolution 16:111-120.
Kishino, H., and M. Hasegawa. 1989. Evaluation of the maximum likelihood estimate of
the evolutionary tree topologies from DNA sequence data, and the branching order
in Hominoidea. Journal of Molecular Evolution 29:170-179.
Kitchener, D. J. 1980. Description of a new species of Pseudomys (Rodentia: Muridae)
from Western Australia. Records of the Western Australian Museum 8:405-414.
Kitchener, D. J. 1985. Description of a new species of Pseudomys (Rodentia: Muridae)
from the Northern Territory. Records of the Western Australian Museum 12:207-
221.
Kitchener, D. J. 1989. Taxonomic appraisal of Zyzomys (Rodentia, Muridae) with
description of two new species from the Northern Territory, Australia. Records of
the Western Australian Museum 14:331-373.
Kitchener, D. J. 1995a. Kimberley mouse. Pages 608-609 in R. Strahan, editor. Mammals
of Australia. Reed New Holland, Sydney.
Kitchener, D. J. 1995b. Southern ningaui. Pages 119-120 in R. Strahan, editor. The
Mammals of Australia. Reed New Holland, Sydney.
Kitchener, D. J., M. Adams, and P. R. Baverstock. 1984. Redescription of Pseudomys
bolami Troughton, 1932 (Rodentia: Muridae). Australian Mammalogy 7:149-159.
Kitchener, D. J., and W. F. Humphries. 1986. Description of a new species of Pseudomys
(Rodentia: Muridae) from the Kimberley region, Western Australia. Records of the
Western Australian Museum 12:419-434.
238
Kitchener, D. J., and W. F. Humphries. 1987. Description of a new subspecies of
Pseudomys (Rodentia: Muridae) from the Northern Territory. Australian
Mammalogy 15:47-54.
Knowles, L. L. 2001. Did Pleistocene glaciations promote divergence? Tests of explicit
refugial models in montane grasshoppers. Molecular Ecology 10:691-701.
Knowles, L. L., and W. P. Madison. 2002. Statistical phylogeography. Molecular Ecology
11:2623-2635.
Kotler, B. P., C. R. Dickman, and J. S. Brown. 1998. The effects of water on patch use by
two Simpson Desert granivores (Corvus coronoides and Pseudomys
hermannsburgensis). Australian Journal of Ecology 23:574-578.
Krajewski, C., J. Painter, A. C. Driskell, L. Buckley, and M. Westerman. 1993. Molecular
systematics of New Guinean Dasyurids (Marsupialia:Dasyuridae). Science in New
Guinea 19:157-166.
Krieg, G. W., R. A. Callen, D. I. Gravestock, and C. G. Gatehouse. 1990. Geology. Pages
1-26 in M. J. Tyler, C. R. Twidale, M. Davies, and C. B. Wells, editors. Natural
History of the Northeast Deserts. Royal Society of South Australia Occasional
Publication 6, Adelaide.
Lange, R. T. 1978. Carpological evidence for fossil Eucalyptus and other Leptospermae
(subfamily Leptospermoideae of Myrtaceae) from a Tertiary deposit in the South
Australian arid zone. Australian Journal of Botany 26:221-233.
Larizza, A., G. Pesole, A. Reyes, E. Sbisa, and C. Saccone. 2002. Lineage specificity of the
evolutionary dynamics of the mtDNA d-loop region in rodents. Journal of
Molecular Evolution 54:145-155.
Learmonth, N., and A. Learmonth. 1971. Regional Landscapes of Australia. Angus and
Robertson, Sydney.
Lee, A. K. 1995. Action Plan for Australian Rodents. Australian Nature Conservation
Agency, Canberra.
Lee, A. K., P. R. Baverstock, and C. H. S. Watts. 1981. Rodents-the late invaders. Pages
1522-1553 in A. Keast, editor. Ecological Biogeography of Australia. The Hague,
W. Junk.
239

Lee, S. Y. M. 2003. Species concepts and species reality: salvaging a Linnaean rank.
Journal of Evolutionary Biology 16:179-188.
Letnic, M. 2002. Long distance movements and the use of fire mosaics by small mammals
in the Simpson Desert, central Australia. Australian Mammalogy 23:125-134.
Lewontin, R. C. 1974. The Genetic Basis of Evolutionary Change. Columbia University
Press, New York.
Lidicker, W. Z, jr. 1968. A phylogeny of New Guinean rodent genera based on phallic
morpholgy. Journal of Mammalogy 49:609-643.
Lidicker, W. Z, jr. 1962. The nature of subspecies boundaries in a desert rodent and its
implications for subspecies taxonomy. Systematic Zoology 11:160-171.
Lidicker, W. Z, jr., and P. V. Brylski. 1987. The conilurine rodent radiation of Australia,
analyzed on the basis of phallic morphology. Journal of Mammalogy 68:617-641.
Linder, H. P. 2001. On areas of endemism, with an example from the African Restionaceae.
Systematic Biology 50:892-912.
Livingstone, D. A. 1982. Quaternary geography of Africa and the refuge theory. Pages 523-
536 in G. T. Prance, editor. Biological Diversification in the Tropics. Columbia
University Press, New York.
Lock, M. L., and B. A. Wilson. 1999. The distribution of the New Holland mouse
(Pseudomys novaehollandiae) with respect to vegetation near Anglesea, Victoria.
Wildlife Research 26:565-577.
Lopez, J. V., N. Yuhki, R. Masuda, W. Modi, and S. J. O'Brien. 1994. Numt, a recent
transfer and tandem amplification of mitochodrial DNA to the nuclear genome of
the domestic cat. Journal of Molecular Evolution 39:174 -190.
Luly, J. G. 2001. On the equivocal fate of Late Pleistocene Callitris Vent. (Cupressaceae)
woodlands in arid South Australia. Quaternary International 83-85.
Lundelius, E. L. J. 1983. Climatic implications of Late Pleistocene and Holocene faunal
associations in Australia. Alcheringa 7:125-149.
Luo, J., and B. J. Fox. 1995. Competitive effects of Rattus lutreolus presence on food
resource use by Pseudomys gracilicaudatus. Australian Journal of Ecology 20:556-
564.
240

Luo, J., and B. J. Fox. 1996. Seasonal and successional dietary shifts of two sympatric
rodents in coastal heathland: a possible mechanism for co-existence. Australian
Journal of Ecology 21:121-132.
Luo, J., B. J. Fox, and E. Jefferys. 1994. Diet of the eastern chestnut mouse (Pseudomys
gracilicaudatus). Wildlife Research 21:401-417.
Lyons, L. A., T. F. Laughlin, N. G. Copeland, N. A. Jenkins, J. E. Womack, and S. J.
O'Brien. 1997. Comparative anchor tagged sequences (CATS) for integrative
mapping of mammalian genomes. Nature Genetics 15:48-56.
MacGuire, M. unpublished. Observations on the breeding, growth rates and behaviour of a
new species of Pseudomys- Pseudomys calabyi. Territory Wildlife Park,
Palmerston.
Mackenzie, N. L., and A. A. Burbidge. 2002. Australian Mammal Audit a component of
the National Land and Water Resources Biodiversity Audit. Western Australian
Wildlife Research Centre, Perth.
MacMillen, R. E., and A. K. Lee. 1967. Australian desert mice: independence of exogenous
water. Science 158:383-385.
MacMillen, R. E., and A. K. Lee. 1970. Energy metabolism and pulmocutaneous water loss
of Australian hopping mice. Comparative Biochemistry and Physiology 35:355-
369.
Macphail, M. K. 1996. Neogene environments in Australia, 1: re-evaluation of microfloras
associated with important Early Pliocene marsupial remains at Grange Burn,
southwest Victoria. Review of Palaeobotany and Palynology 92:307-328.
Macphail, M. K. 1997. Late Neogene climates in Australia: fossil pollen- and spore-based
estimates in retrospect and prospect. Australian Journal of Botany 45:425-464.
Macphail, M. K., E. A. Colhoun, and S. J. Fitzsimons. 1995. Key periods in the evolution
of the Cenozoic vegetation and flora in western Tasmania: the Late Pliocene.
Australian Journal of Botany 43:505-526.
Mahoney, J. A. 1969. A reindentification of the Australian Muridae in the Leiden Museum
listed by F. A. Jentink in 1887 and 1888. Zoologische Mededelingen 43:279-286.
Mahoney, J. A. 1982. Identities of the rodents (Muridae) listed in T.L. Mitchell's "Three
expeditions into the interior of eastern Australia, with descriptions of the recently
241

explored region of Australia Felix, and of the present colony of New South Wales".
Australian Mammalogy 5:15-36.
Mahoney, J. A., and B. J. Marlow. 1968. The rediscovery in New South Wales (Ku-ring-
gai Chase National Park and Port Stephens) of the New Holland mouse, Pseudomys
novaehollandiae (Waterhouse, 1843) (Rodentia: Muridae). Australian Journal of
Science 31:221-223.
Mahoney, J. A., and H. Posamentier. 1975. The occurrence of the native rodent Pseudomys
gracilicaudatus (Gould, 1845) (Rodentia: Muridae) in New South Wales. Journal of
the Australian Mammal Society 1:333-346.
Marshall, L. G. 1973. Fossil vertebrate faunas from the Lake Victoria region, s.w. New
South Wales, Australia. Memoirs of the National Museum of Victoria 34:151-172.
Martin, A. P., and A. McMinn. 1993. Palynology of Sites 815 and 823; the Neogene
vegetation history of coastal northeastern Australia. Proceedings of the Ocean
Drilling Program Scientific Results 133:421-427.
Martin, H. A. 1991. Tertiary stratigraphy palynology and Palaeoclimate of the inland river
systems in New South Wales. Pages 181-194 in M. A. J. Williams, P. De Dekker,
and A. P. Kershaw, editors. The Cainozoic in Australia: a Re-appraisal of the
Evidence. Special Publication of the Geological Society of Australia 18.
Martin, H. A. 1997. The use of ecological tolerances for the reconstruction of Tertiary
palaeoclimates. Australian Journal of Botany 45:475-492.
Martin, H. A. 1998. Tertiary climatic evolution and the development of aridity in Australia.
Proceedings of the Linnean Society of New South Wales 119:115-136.
Martin, H. A., and A. McMinn. 1994. Late Cainozoic vegetation history of north-western
Australia, from the palynology of a deep sea core (ODP site 765). Australian
Journal of Botany 42:95-102.
Martin, R. W., and K. A. Handasyde. 1995. Koala. Pages 196-198 in R. Strahan, editor.
The Mammals of Australia. Reed New Holland, Sydney.
Martinez, C., and W. Z. Lidicker, jr. 1971. Description of a new genus and species of fossil
rodent from Australia. Journal of Mammalogy 52:775-781.
Marzluff, J. M., and K. P. Dial. 1991. Life-history correlates of taxonomic diversity.
Ecology 72:428-439.
242

Mayr, E. 1942. Systematics and the Origin of Species. Columbia University Press, New
York.
Mayr, E. 1963. Animal Species and Evolution. Harvard University Press, Cambridge,
Massachusetts.
Mayr, E. 1991. One Long Argument. Harvard University Press, Cambridge, Massachusetts.
Mayr, E. 2000. The biological species concept. Pages 17-29 in Q. D. Wheeler and R.
Meier, editors. Species Concepts and Phylogenetic Theory: a Debate. Columbia
University Press, New York.
McGill, B. J. 2003. A test of the unified neutral theory of biodiversity. Nature 422:881-885.
McKenzie, N. L. M., J. K. Rolfe, N. J. Hall, and W. K. Youngson. 1993. Vertebrate fauna.
in "The Biological Survey of the eastern Goldfields of Western Australian. Part 9:
Noresman-Balladonia Study Area" eds McKenzie, N. M. L. and Hall, N. J. Records
of the Western Australian Museum 42:33-54.
McKenzie, N. L. M., J. K. Rolfe, and W. K. Youngson. 1992. Vertebrate fauna. in "The
Biological Survey of the eastern Goldfields of Western Australian. Part 8: Kurnalpi-
Kalgoorlie Study Area" eds McKenzie, N. M. L. and Hall, N. J. Records of the
Western Australian Museum 41:37-63.
Meffert, L. M. 1999. How speciation experiments relate to conservation biology.
Bioscience 49:701-715.
Menzies, J. I. 1996. A systematic revision of Melomys (Rodentia: Muridae) of New Guinea.
Australian Journal of Zoology 44:367-426.
Mirol, P. M., S. Mascheretti, and J. B. Searle. 2000. Multiple nuclear pseudogenes of
mitochondrial cytochrome b in Ctenomys (Caviomorpha, Rodentia) with either
great similarity to, or high divergence from, the true mitochondrial sequence.
Heredity 84:538-547.
Misonne, X. 1969. African and Indo-Australian Muridae: evolutionary trends. Musee Royal
de L'Afrique Central, Tervuren, Belgique. Zoologie 172:1-219.
Mitchell, T. L. 1839. Three expeditions into the interior of eastern Australia; with
descriptions of the recently explored region of Australia Felix, and of the present
colony of New South Wales. T. & W. Boone, London.
243

Moritz, C., J. L. Patton, C. J. Schneider, and T. B. Smith. 2000. Diversification of rainforest
faunas: an intergrated molecular approach. Annual Review of Ecology and
Systematics 31:533-563.
Moro, D., N. J. H. Campbell, M. S. Elphinstone, and P. R. Baverstock. 1998. The
Thevenard Island mouse: historic and conservation implications from mitochondrial
DNA sequence-variation. Pacific Conservation Biology 4:282-288.
Morris, K. D. 1995. Ash-grey mouse. Pages 583-584 in R. Strahan, editor. The Mammals
of Australia. Reed New Holland, Sydney.
Morris, K. D., and A. C. Robinson. 1995. Shark bay mouse. in R. Strahan, editor. The
Mammals of Australia. Reed New Holland, Sydney.
Morton, S. R., J. H. Brown, D. A. Kelt, and J. W. R. Reid. 1994. Comparisons of
community structure among small mammals of North American and Australian
deserts. Australian Journal of Zoology 42:501-525.
Morton, S. R., and C. D. James. 1987. The diversity and abundance of lizards in arid
Australia: a new hypothesis. American Naturalist 132:237-256.
Morton, S. R., J. Short, and S. D. Barker. 1996. Refugia for Biological Diversity in Arid
and Semi-arid Australia. Biodiversity Series, Paper No. 4, Department of
Environment Sport and Territories, Biodiveristy Unit., Canberra.
Moseby, K. E., and J. L. Read. 1998. Population dynamics and movement patterns of
Bolam's mouse, Pseudomys bolami, at Roxby Downs, South Australia. Australian
Mammalogy 20:353-368.
Murray, B. R., C. R. Dickman, C. H. S. Watts, and S. R. Morton. 1999. The dietary ecology
of Australian desert rodents. Wildlife Research 26:857-858.
Musser, G. G., and M. D. Carlton. 1993. Family Muridae. Pages 501-755 in D. E. Wilson
and D. M. Reeder, editors. Mammal Species of the World. Smithsonian Institution
Press, Washington DC.
Myroniuk, P. 1998. Conservation genetics of the New Holland mouse (Pseudomys
novaehollandiae): an analysis of mitochondrial DNA control region variation. MSc
thesis. Deakin University, Geelong.
244

Nanson, G. C., and D. M. Price. 1998. Quaternary change in the Lake Eyre basin of
Australia: an introduction. Paleogeography, Paleoclimatology, Palaeoecology
144:235-237.
Nei, M., and S. Kumar. 2000. Molecular Evolution and Phylogenetics. Oxford University
Press, New York.
Newsome, A. E., and L. K. Corbett. 1975. Outbreaks of rodents in semi-arid and arid
Australia: causes, preventions, and evolutionary considerations. in I. Prakash and P.
K. Ghosh, editors. Rodents in Desert Environments. Dr. W. Junk, The Hague.
Nichol, J. E. 1999. Geomorphological evidence and Pleistocene refugia in Africa. The
Geographical Journal 165:79-89.
Nix, H. 1982. Environmental determinants of biogeography and evolution in Terra
Australis. Pages 47-66 in W. R. Barker and P. J. M. Greenslade, editors. Evolution
of the Flora and Fauna of Arid Australia. Peacock Publications/Australian
Systematic Botany Society, Adelaide.
Nix, H. A. 1986. A biogeographic analysis of the Australian elapid snakes. Pages 4-15 in R.
Longmore, editor. Atlas of Elapid Snakes, Australian Flora and Fauna Series
Number 7. Australian Government Publishing Service, Canberra.
Nix, H. A., and J. D. Kalama. 1972. Climate as a dominant control in the biogeography of
northern Australia and New Guinea. Pages 61-92 in D. Walker, editor. Bridge and
Barrier: the Natural and Cultural History of Torres Strait. Department of
Biogeography and Geomorphology, Australian National University, Canberra.
Nott, J. F., D. M. Price, and E. A. Bryant. 1996. A 30,000 year record of extreme floods in
tropical Australia from relict plunge-pool deposits: implications for future climate
change. Geophysical Research Letters 23:379-382.
Ogilby, W. 1838. Notice of certain Australian quadrupeds, belonging to the Order
Rodentia. Transaction of the Linnean Society of London 18:121-132.
Ohta, T. 1992. The nearly neutral theory of molecular evolution. Annual Review of
Ecology and Systematics 23:263-286.
Otte, D., and J. Endler. 1989. Speciation and its Consequences. Sinauer, Sunderland.
Palaeogeographic Group, B. 1990. Australia: Evolution of a Continent. Bureau of Mineral
Resources, Australia.
245
Parker, P. G., A. A. Snow, M. D. Schug, G. C. Booton, and P. A. Fuerst. 1998. What
molecules can tell us about populations: choosing and using a molecular marker.
Ecology 79:361-382.
Parker, S. A. 1973. An annotated checklist of the native land-mammals of the Northern
Territory. Records of the South Australian Museum 16.
Paterson, H. E. H. 1985. The recognition concept of species. Pages 21-29 in E. S. Vrba,
editor. Species and Speciation. Pretoria Transvaal Museum, Pretoria.
Patterson, B. D. 1999. Contingency and determinism in mammalian biogeography: the role
of history. Journal of Mammalogy 80:345-360.
Pell, S. D., A. R. Chivas, and I. S. Williams. 2000. The Simpson, Strzelecki and Tirari
Deserts: development and sand provenance. Sedimentary Geology 130:107-130.
Pianka, E. R., and J. J. Schall. 1981. Species densities of Australian vertebrates. Pages
1666-1694 in A. Keast, editor. Ecological Biogeography of Australia. W. Junk, The
Hague.
Pledge, N. S. 1982. Enigmatic Ektopodon. Pages 480-488 in P. V. Rich and E. M.
Thompson, editors. The Fossil Vertebrate Record of Australasia. Monash
University, Melbourne.
Polhemus, D. A., and J. T. Polhemus. 1998. Assembling New Guinea: 40 million years of
island arc accretion as indicated by the distributions of aquatic Heteroptera
(Insecta). Pages 327-340 in R. Hall and J. D. Holloway, editors. Biogeography and
Geological Evolution of SE Asia. Backhuys Publishers, Leiden.
Posada, D. 2000. GeoDis: a program for the cladistic nested analysis of the geographical
distribution of genetic haplotypes. Molecular Ecology 9:487-488.
Posada, D., and K. A. Crandall. 1998. Modeltest: testing the model of DNA substitution.
Bioinformatics 14:817-818.
Predavec, M. 1994. Population dynamics and environmental changes during natural
irruptions of Australian desert rodents. Wildlife Research 21:569-582.
Predavec, M. 1997. Variable energy demands in Pseudomys hermannsburgensis: possible
ecological consequences. Australian Journal of Zoology 45:85-94.
Purvis, A., and P. Agapow. 2002. Phylogeny imbalance: taxonomic level matters.
Systematic Biology 51:844-854.
246
Pye, T. 1991. The New Holland mouse (Pseudomys novaehollandiae) (Rodentia: Muridae)
in Tasmania: a field study. Wildlife Research 18:521-531.
Rambaut, A. 2002. Sequence Alignment Editor v2.0a11.
Read, D. G. 1984. Diet and habitat preference of Leggadina forresti (Rodentia: Muridae) in
western New South Wales. Australian Mammalogy 7:215-217.
Read, D. G., and T. D. Tweedie. 1996. Floristics of habitats of Pseudomys oralis (Rodentia:
Muridae). Wildlife Research 23:485-493.
Read, J., P. Copley, and P. Bird. 1999. The distribution, ecology and current status of
Pseudomys desertor in South Australia. Wildlife Research 26:453-462.
Redhead, T. D. 1995. Fawn-footed melomys. Pages 636-637 in R. Strahan, editor. The
Mammals of Australia. Reed New Holland, Sydney.
Regan, J. L., L. M. Meffert, and E. H. Bryant. 2003. A direct experimental test of founder-
flush effects on the evolution of the evolutionary potential for assortative mating.
Journal of Evolutionary Biology 16:302-312.
Reid, J. W. R., and S. R. Morton. 1995. Forrest's mouse. Pages 555-556 in R. Strahan,
editor. The Mammals of Australia. Reed New Holland, Sydney.
Rich, T. H., M. Archer, M. D. Plane, T. F. Flannery, N. S. Pledge, S. Hand, and P. V. Rich.
1982. Australian Tertiary mammal localities. Pages 525-572 in P. V. Rich and B.
M. Thompson, editors. The Fossil Vertebrate Record of Australasia. Monash
University Offset Printing Unit, Clayton.
Ride, W. D. L. 1960. The fossil mammalian remains of the Burramys parvus breccia from
the Wombeyan Caves, New South Wales. Journal of the Royal Society of Western
Australia 43:74-80.
Ride, W. D. L. 1970. A Guide to the Native Mammals of Australia. Oxford University
Press, Melbourne.
Robinson, A. C. 1995. Western chestnut mouse. Pages 609-610 in R. Strahan, editor. The
Mammals of Australia. Reed New Holland, Sydney.
Robinson, A. C., K. D. Casperson, P. D. Canty, and C. A. MacDonald. 1988. A biological
survey of the Gawler Ranges, South Australia, in October 1985. South Australian
National Parks Service and South Australian Museum, Adelaide.
247

Rosenzweig, M. L. 1995. Species Diversity in Space and Time. Cambridge University
Press, Cambridge.
Sage, R. D., J. B. Whitney, and A. C. Wilson. 1986. Genetic analysis of a hybrid zone
between domesticus and musculus mice (Mus musculus complex): haemoglobin
polymorphisms. Current Topics in Microbiology and Immunology 127:75-85.
Salomon, M. 2001. Evolutionary biogeography and speciation: essay on a synthesis.
Journal of Biogeography 28:13-27.
Salomon, M. 2002. A revised cline theory that can be used for quantified analyses of
evolutionary processes without parapatric speciation. Journal of Biogeography
29:509-517.
Savolainen, V., S. B. Heard, M. P. Powell, T. J. Davies, and A. Ø. Mooers. 2002. Is
cladogenesis heritable? Systematic Biology 51:835-843.
Schall, J. J., and E. R. Pianka. 1978. Geographical trends in species numbers. Science
201:679-686.
Salzburger, W., J. Martens, A. A. Nazarenko, Y. Sun, R. Dallinger, and C. Sturmbauer.
2002a. Phylogeography of the Eurasian willow tit (Parus montanus) based on DNA
sequences of the mitochondrial cytochrome b gene. Molecular Phylogenetics and
Evolution 24:26-34.
Salzburger, W., J. Martens, and C. Sturmbauer. 2002b. Paraphyly of the blue tit (Parus
caeruleus) suggested from cytochrome b sequences. Molecular Phylogenetics and
Evolution 24:19-25.
Schliewen, U., K. Rassmann, M. Markmann, J. Markert, T. Kocher, and D. Tautz. 2001.
Genetic and ecological divergence of a monophyletic cichlid species pair under
fully sympatric conditions in Lake Ejagham, Cameroon. Molecular Ecology
10:1471-1488.
Schodde, R. 1999. A reappraisal of bird evolution on the Australian continent. in K.
Simpson, N. Day, and P. Trusler, editors. Field Guide to the Birds of Australia.
Viking, Ringwood, Victoria.
Schwarz, M. W., and D. Simberloff. 2001. Taxon size predicts rates of rarity in vascular
plants. Ecological Letters 4:464-469.
248

Servedio, M. R. 2000. Reinforcement and the genetics of non-random mating. Evolution
54:21-29.
Shackleton, N. J., J. Backman, H. Zimmermann, D. V. Kent, M. A. Hall, D. G. Roberts, D.
Schnitker, and J. Baldorf. 1984. Oxygen isotope calibration of the onset of ice-
rafting and history of glaciation in the North American region. Nature 307:620-623.
Shaw, P. W., G. F. Turner, R. M. Idid, R. L. Robinson, and G. R. Carvalho. 2000. Genetic
population structure indicates sympatric speciation of Lake Malawi cichlids.
Proceedings of the Royal Society of London (B) 267:2273-2280.
Simpson, G. C. 1961. Historical zoogeography of Australian mammals. Evolution 15:431-
436.
Smith, A. P., S. Ferrier, H. Hines, and D. Quin. 1996. Modelling the geographic range of
the endangered Hastings River mouse (Pseudomys oralis) (Rodentia: Muridae) in
north-east New South Wales. New South Wales National Parks and Wildlife
Service.
Spencer, W. B. 1896. Mammalia. Pages 1-52 in W. B. Spencer, editor. Report on the work
of the Horn Scientific Expedition to central Australia Pt. 2- Zoology. Melville,
Mullen and Slade, Melbourne.
Smith, A. P., C. Phillips, and S. Townley. 1997. Diet and habitat preference of the Hastings
River mouse (Pseudomys oralis) (Rodentia: Muridae). A report to the Hastings
River mouse recovery team. austeco environmental consultants, Armidale.
Smith, A. P., and D. G. Quin. 1996a. Microhabitat requirements of the Hastings River
mouse (Pseudomys oralis) (Rodentia: Muridae). New South Wales National Parks
and Wildlife Service.
Smith, A. P., and D. G. Quin. 1996b. Patterns and causes of extinction and decline in
Australian conilurine rodents. Biological Conservation 77:243-267.
Smith-White, S. 1982. Summary and redintegration. Pages 371-379 in W. R. Barker and P.
J. M. Greenslade, editors. Evolution of the Flora and Fauna of Arid Australia.
Peacock Publications/Australian Systematic Botany Society, Adelaide.
Southern, S. O., P. J. Southern, and A. E. Dizon. 1988. Molecular characterisation of a
cloned dolphin mitochondrial genome. Journal of Molecular Evolution 28.
249

Start, A. N., S. D. Anstee, and M. Endersby. 2000. A review of the biology and
conservation status of the Ngadji, Pseudomys chapmani Kitchener, 1980 (Rodentia:
Muridae). CALMScience 3:125-147.
Start, A. N., and D. J. Kitchener. 1995. Western pebble-mound mouse. Pages 590-592 in R.
Strahan, editor. The Mammals of Australia. Reed New Holland, Sydney.
Stephens, P. R., and J. J. Wiens. 2003. Explaining species richness from continents to
communities: the time-for-speciation effect in emydid turtles. American Naturalist
161:112-128.
Stevens, G. C. 1989. The latitudinal gradient in geographical range: how so many species
coexist in the tropics. American Naturalist 133:240-256.
Stoddart, D. M., and G. Challis. 1993. Habitat use and body form of the long-tailed mouse
(Pseudomys higginsi). Wildlife Research 20:733-738.
Swofford, D. L. 1998. Phylogenetic Analysis Using Parsimony (and other methods).
Version 4. Sinauer Associates, Sunderland, Massachusetts.
Tate, G. H. H. 1951. The rodents of Australia and New Guinea. Bulletin of the American
Museum of Natural History 97:189-430.
Taylor, G. and Eggleton, R. A. 2001. Regolith Geology and Geomorphology. John Wiley
Sons, Brisbane.
Taylor, J. M., J. H. Calaby, and S. C. Smith. 1983. Native Rattus, land bridges, and the
Australian region. Journal of Mammalogy 64:463-475.
Taylor, J. M., and B. E. Horner. 1972. Observations on the reproductive biology of
Pseudomys (Rodentia: Muridae). Journal of Mammalogy 53:318-328.
Strahan, R. 1995. The Mammals of Australia. Reed New Holland, Sydney.
Sturt, C. 1849. Narrative of an expedition into central Australia performed under the
authority of Her Majesty's Government, during the years 1844, 45 and 46, together
with a notice of the province of South Australia, in 1847. T. & W. Boone, London.
Suttle, J. M., H. D. M. Moore, E. J. Peirce, and W. G. Breed. 1988. Quantitative studies on
variation in sperm head morphology of the hopping mouse, Notomys alexis. The
Journal of Experimental Zoology 247:166-171.
Tedford, R. H., and R. T. Wells. 1990. Pleistocene deposits and fossil vertebrates from the
"dead heart of Australia". Memoirs of the Queensland Museum 28:263-284.
250

Templeton, A. R. 1980. The theory of speciation via the founder principle. Genetics
94:1011-1038.
Templeton, A. R. 1981. Mechanisms of speciation- a population genetic approach. Annual
Review of Ecology and Systematics 12:23-48.
Templeton, A. R. 1993. The "Eve" hypothesis: a genetic crytique and re-analysis. American
Anthropologist 95:51-72.
Templeton, A. R. 1996. Experimental evidence for the genetic-transilience model of
speciation. Evolution 50:909-915.
Templeton, A. R. 1998. Nested clade analysis of phylogeographic data: testing hypotheses
about gene flow and population history. Molecular Ecology 7:381-397.
Templeton, A. R. 2001. Using phylogeographic analyses of gene trees to test species status
and process. Molecular Ecology 10:779-791.
Templeton, A. R., E. Routman, and C. A. Phillips. 1995. Separating population structure
from population history: a cladistic analysis of the geographical distribution of
mitochondrial DNA haplotypes in the tiger salamander, Ambystoma tigrinum.
Genetics 140:767-782.
Thackway, R., and I. D. Creswell. 1995. An Interim Biogeographic Regionalisation for
Australia: a framework for establishing a national system of reserves, Version 4.
Australian Nature Conservation Agency, Canberra.
Thomas, O. 1882. On two new Muridae from Tasmania. Annals and Magazine of Natural
History 5:413-416.
Thomas, O. 1889. Description of a new species of Mus from South Australia. Annals and
Magazine of Natural History 6:433-435.
Templeton, A. R., and C. F. Sing. 1993. A cladistic analysis of phenotypic associations
with haplotypes inferred from restriction endonuclease mapping. IV. Nested
analyses with cladogram uncertainty and recombination. Genetics 134.
Thomas, M. O., and G. Dollman. 1909. On mammals from Inkerman, North Queensland,
presented to the National Museum by Sir William Ingram, Bt. and the Hon. John
Forrest. Proceedings of the Royal Zoological Society of London 1908:788-794.
251

Thomas, O. 1896. On mammals from Celebes, Borneo, and the Philippines, recently
received at the British Museum. Annals and Magazine of Natural History 18:241-
250.
Thomas, O. 1906a. A list of further collections of mammals from Western Australia,
including a series from Bernier Island, obtained from Mr. Balston; with field notes
from the collector, Mr. G. C. Shortridge. Proceedings of the Zoological Society of
London 1906:763-777.
Thomas, O. 1906b. On mammals from northern Australia presented to the national museum
by Sir Wm. Ingram, Bt., and the Hon. John Forrest. Annals and Magazine of
Natural History 7:81.
Thomas, O. 1910. The generic arrangement of the Australian Murines hitherto referred to
Mus. Annals and Magazine of Natural History 8:603-607.
Thomas, O. 1921. On three new Australian rats. Annals and Magazine of Natural History
9:618-622.
Thompson, J. D., D. G. Higgins, and T. J. Gibson. 1994. CLUSTAL W: improving the
sensitivity of progressive multiple sequence alignment
through sequence weighting, positions-specific gap penalties and weight matrix
choice. Nucleic Acids Research 22:4673-4680.
Thomson, P. C. 1980. Population dynamics and feeding ecology of the New Holland
mouse, Pseudomys novaehollandiae (Waterhouse 1843) and the house mouse, Mus
musculus (Linnaeus 1785). MSc thesis. Macquarie University, Sydney.
Thorpe, R. S., A. Malhotra, H. Black, J. C. Daltry, and W. Wuster. 1995. Relating
geographical pattern to phylogenetic process. Philosophical Transactions of the
Royal Society of London (B) 349:61-68.
Kutt, A. P., N. Y. Thurgate and D. Hannah. in press. Distribution and habitat preference of
the desert mouse (Pseudomys desertor) in Queensland. Wildlife Research
Torgensen, T., M. F. Hutchinson, D. E. Searle, and H. A. Nix. 1983. General bathymetry of
the Gulf of Carpentaria and the Quaternary physiography of Lake Carpentaria.
Palaeogeography, Palaeoclimatology, Palaeogeology 41:207-225.
252

Torgensen, T., J. Luly, P. De Dekker, M. R. Jones, D. E. Searle, A. R. Chivas, and W. J.
Ullman. 1988. Late Quaternary environments of the Carpentarian Basin, Australia.
Palaeogeography, Palaeoclimatology, Palaeogeology 67:245-261.
Torrance, A. W. 1997. Evolution, Phylogeny, Biogeography, and Diversification of the
Australasian Hydromyinae (Rodentia: Muridae). PhD thesis. Harvard University,
Cambridge, Massachusetts.
Trainor, C., A. Fischer, J. C. Z. Woinarski, and S. Churchill. 2000. Multiscale patterns of
habitat use by the Carpentarian rock-rat (Zyzomys palatalis) and the common rock-
rat (Z. argurus). Wildlife Research 27:319-332.
Troughton, E. L. G. 1923. A revision of rats of the genus Leporillus and the status of
Hapalotis personata, Krefft. Records of the Australian Museum 14:23-41.
Troughton, E. L. G. 1932. On five new rats of the genus Pseudomys. Records of the
Australian Museum 18:287-294.
Troughton, E. L. G. 1936. Description of new rats and mice from Queensland. Memoirs of
the Queensland Museum 11:14-22.
Troughton, E. L. G. 1937. The status of "Mus" novaehollandiae Waterhouse, and allied
forms. Records of the Australian Museum 20:185-190.
Troughton, E. L. G. 1941. Furred Animals of Australia. Angus and Robertson, Sydney.
Troughton, E. L. G. 1973. Furred Animals of Australia (revised and abridged addition).
Angus and Robertson, Sydney.
Truswell, E. M., and W. K. Harris. 1982. The Cainozoic palaeobotanical record in arid
Australia: fossil evidence for the origins of an arid-adapted flora. Pages 67-76 in W.
R. Barker and P. J. M. Greenslade, editors. Evolution of the Flora and Fauna of Arid
Australia. Peacock Publications/Australian Systematic Botany Society, Adelaide.
Twidale, C. R. 1956. Chronology of denudation in northwest Queensland. Bulletin of the
Geological Society of America 67:867-882.
Twidale, C. R. 1966. Late Cainozoic activity in the Selwyn Upwarp, northwest
Queensland. Journal of the Geological Society of Australia 13:491-494.
Twidale, C. R., and J. A. Bourne. 2001. The use of duricrusts and topographic relationships
in geomorphological correlation: conclusions based on Australian experience.
Catena 33:105-122.
253

Twidale, C. R., and E. M. Campbell. 1995. Pre-Quaternary landforms in a low latitude
context: the example of Australia. Geomorphology 12:17-35.
van der Kaars, W. A. 1991. Palynology of eastern Indonesian marine piston-cores: a Late
Quaternary vegetational and climatic record for Australasia. Palaeogeography,
Palaeoclimatology, Palaeogeology 85:239-302.
Van Dyck, S. 1991. A little secret from the Masons. Wildlife Australia 28:18-19.
Van Dyck, S., and J. Birch. 1996. Pebble-mound Mice, Pseudomys patrius and Pseudomys
sp. (Rodentia: Muridae) in Queensland. Australian Nature Conservation Agency,
Brisbane.
Van Dyck, S. M. 1997. Queensland pebble-mound mice...up from the tailings. Pages 40-47
in Nature Australia (Spring).
Van Dyck, S. M. 1998. New Holland mouse. Pages 49-53 in Nature Australia (Spring).
Vrba, E. S. 1992. Mammals as a key to evolutionary theory. Journal of Mammalogy 73:1-
28.
Wagner, P. J., and D. H. Erwin. 1995. Phylogenetic patterns as tests of speciation models.
Pages 87-122 in D. H. Erwin and R. L. Anstey, editors. New Approaches to
Speciation in the Fossil Record. Columbia University Press, New York.
Waite, E. R. 1900. The generic name Thylacomus. Annals and Magazine of Natural History
7:222-223.
Wakefield, N. A. 1972. Palaeoecology of fossil mammal assemblages from some
Australian caves. Proceedings of the Royal Soceity of Victoria 85:1-26.
Wakeley, J. 1996. The excess of transitions among nucleotide substitutions: new methods
of estimating transition bias underscore its significance. Trends in Ecology and
Evolution 11:158 -163.
Wallis, L. A. 2001. Environmental history of northwest Australia based on phytolith
analysis at Carpenters Gap 1. Quaternary International 83-85:103-117.
Wasson, R. J. 1986. Geomorphology and Quaternary history of the Australian continental
dunefields. Geographical Review of Japan 59 (sB):55-67.
Watts, C. H. S. 1974. The native rodents of Australia: a personal view. Australian
Mammalogy 1:109-115.
254

Watts, C. H. S. 1976. Leggadina lakedownensis, a new species of murid rodent from north
Queensland. Transactions of the Royal Society of South Australia 100:105-108.
Watts, C. H. S. 1977. The foods eaten by some Australian rodents (Muridae). Australian
Wildlife Research 4:151-157.
Watts, C. H. S. 1995a. Bolam's mouse. Pages 588 in R. Strahan, editor. The Mammals of
Australia. Reed New Holland, Sydney.
Watts, C. H. S. 1995b. Dusky hopping-mouse. Pages 575-576 in R. Strahan, editor. The
Mammals of Australia. Reed New Holland, Sydney.
Watts, C. H. S. 1995c. Mitchell's hopping mouse. Pages 579-580 in R. Strahan, editor. The
Mammals of Australia. Reed New Holland, Sydney.
Watts, C. H. S., and H. J. Aslin. 1981. The Rodents of Australia. Angus and Robertson,
Sydney.
Watts, C. H. S., and P. R. Baverstock. 1994a. Evolution in New Guinea Muridae (Rodentia)
assessed by microcomplement fixation of albumin. Australian Journal of Zoology
42:295-306.
Watts, C. H. S., and P. R. Baverstock. 1994b. Evolution in some South-east Asian Murinae
(Rodentia), as assessed by microcomplement fixation of albumin, and their
relationship to Australian murines. Australian Journal of Zoology 42:711-722.
Watts, C. H. S., P. R. Baverstock, J. Birrell, and M. Krieg. 1992. Phylogeny of the
Australian rodents (Muridae): a molecular approach using microcomplement
fixation of albumin. Australian Journal of Zoology 40:81-90.
Watts, C. H. S., and C. M. Kemper. 1989. Muridae. Pages 939-956 in D. W. Walton and B.
J. Richardson, editors. Fauna of Australia. Mammalia. Australian Government
Publishing Service, Canberra.
Webb, C. O., and N. Pitman, C. A. 2002. Phylogenetic balance and ecological evenness.
Systematic Biology 51:898-907.
Webb, T. J., and K. J. Gaston. 2003. On the heritability of geographic range sizes.
American Naturalist 161:553-566.
Webb, T., and P. J. Bartlein. 1992. Global changes during the past 3 million years-climatic
controls and biotic responses. Annual Review of Ecology and Systematics 23:141-
173.
255

Wells, R. T. 1995. Southern hairy-nosed wombat. Pages 202-203 in R. Strahan, editor. The
Mammals of Australia. Reed New Holland, Sydney.
Wells, R. T., K. Moriarty, and D. L. G. Williams. 1984. The fossil vertebrate deposits of
Victoria Fossil Cave Naracoorte: an introduction to the geology and fauna.
Australian Zoologist 21:305-333.
Wende, R., G. C. Nanson, and D. M. Price. 1997. Aeolian and fluvial evidence for Late
Quaternary environmental change in the east Kimberley of Western Australia.
Australian Journal of Earth Sciences 44:519-526.
Wheeler, Q. D., and R. Meier. 2000. Species Concepts and Phylogenetic Theory: a Debate.
Columbia University Press, New York.
White, M. E. 1994. After The Greening The Browning of Australia. Kangaroo Press,
Sydney.
Whitelaw, M. J. 1989. Magnetic polarity stratigraphy and mammalian fauna of the late
Pliocene (Early Matuyama) section at Batesford (Victoria), Australia. Journal of
Geology 97:624-631.
Whitelaw, M. J. 1991. Magnetic polarity stratigraphy of Pliocene and Pleistocene fossil
vertebrate localities in southeastern Australia. Geological Society of America
Bulletin 103:1493-1503.
Willis, K. J., and R. J. Whittaker. 2000. The refugial debate. Science 287:1406-1407.
Wilson, B. A., and E. Bradtke. 1999. The diet of the New Holland mouse, Pseudomys
novaehollandiae (Waterhouse) in Victoria. Wildlife Research 26:439-451.
Woinarski, J. C. Z. 1992. Habitat relationships for two poorly known mammal species
Pseudomys calabyi and Sminthoposis sp. from the wet-dry tropics of the Northern
Territory. Australian Mammalogy 15:47-54.
Woinarski, J. C. Z. 2000. Conservation status of rodents in the monsoonal tropics of the
Northern Territory. Wildlife Research 27:421-435.
Woinarski, J. C. Z., R. W. Braithwaite, and M. Maguire. 1995. Kakadu pebble-mound
mouse. Pages 589-590 in R. Strahan, editor. The Mammals of Australia. Reed New
Holland, Sydney.
Woinarski, J. C. Z., and A. Fischer. 1996. Wildlife of the Wessel Islands. Parks and
256
Wildlife Commission of the Northern Territory, Palmerston.
Woods, R. E., and F. D. Ford. 2000. Observation on the behaviour of the smoky mouse
Pseudomys fumeus (Rodentia: Muridae). Australian Mammalogy 22:35-42.
Wyrwoll, K. H., N. L. McKenzie, B. J. Pederson, and I. J. Tapley. 1986. The Great Sandy
Desert of northwestern Australia: the last 7000 years. Search 17:208-210.
Xia, X. 2000. Data Analysis in Molecular Biology and Evolution. Kluwer Academic
Publishers, Boston.
Xia, X., and Z. Xie. 2001. DAMBE: data analysis in molecular biology and evolution.
Journal of Heredity 92:371-373.
Xia, X., Z. Xie, M. Salemi, L. Chen, and Y. Wang. 2003. An index of substitution
saturation and its application. Molecular Phylogenetics and Evolution 26:1-7.
Yokoyama, Y., A. Purcell, K. Lambeck, and P. Johnston. 2001. Shore-line reconstruction
around Australia during the Last Glacial Maximum and Late Glacial Stage.
Quaternary International 83-85:9-18.
Yonekawa, H., K. Moriwaki, O. Gotoh, N. Miyashita, Y. Matsushima, L. Shi, W. S. Cho,
X. Zhen, and Y. Tagashira. 1988. Hybrid origin of Japanese mice "Mus musculus
molossinus": evidence from restriction analysis of mitochondrial DNA. Molecular
Biology and Evolution 5:63-78.
Zharkikh, A., and W.-H. Li. 1992. Statistical properties of bootstrap estimation of
phylogenetic variability from nucleotide sequences: II. Four taxa without a
molecular clock. Journal of Molecular Evolution 35:356-366.
Zheng, H., K. Wyrwoll, Z. Li, and C. McA Powell. 1998. Onset of aridity in southern
Western Australia - a preliminary palaeomagnetic appraisal. Global and Planetary
Change 18:175-187.
257

Appendix i. Aligned control region and DHFR intron 1 sequences
Control region (3 pages): Xeromys TAGCTACCCC CAAGTTTTAT GGGCCCGGAG CGAGAAGAGG GGCAT-G-GG TGGGCGGGTT GTTGGTTTCA CGGAGGATGG Melcer .......... .......C.. .......... .......... A....TA-A. .......... ....A..... .......... Melbur .......... .......... .......... .......... .....TA-A. .......... .A........ .......... Urocau .......... .......... .......... .......... .....-A-.. .......... ....A..... ..........
Lepcon .......... ......G... .......... .......... .....-.-.. .......... ....A..... .......... Mesgou .......... ...A...A.. .......... .......... ..T..-A-.. .......... ....A..... .......... Conpen .......... .......... .......... .......... .....-AT.. .......... .A........ ..........
Notmit .......... .......... .......... .......... .....-.-.. .......... ....A..... ..........
Notfus .......... .......C.. .......... .......... .....-A-.. .......... .......... ..........
Psealb .......... .......... .......... .......... .....-A-.. .......... .......... .......... Pseapo .......... .......... .......... .......... .....-A-.. .......... .......... .......... Masfus .......... .......... .......... .......... .....-.-.. .......... .......... .......... Psehig .......... .......... .......... .......... .....-A-.. .......... .A.......T ..........
Psesho .......... .......... .......... .......... .....-A-.. .......... ....A..... .......... Psedes .......... .......... .......... .......... .....-A-.. .......... ....A..... .......... Pseora .......... .......A.. .......... .......... .....-.-.. .......... ....A..... .......... Psejoh .......... .......... .......... .......... .....-T-.. .......... .......... .......... Pselab .......... .......... .......... .......... .....-T-.. .......... .......... .......... Psecal .......... .......... .......... .......... .....-T-.. .......... .......... .......... Psepat .......... .......... .......... .......... .....-T-.. .......... ....A..... .......... Psecha .......... .......... .......... .......... .....-T-.. .......... .......... .......... Psedel .......... .......... .......... .......... .....-A-.. .......... ....A..... .......... Psepil .......... .......... .......... .......... .....-A-.. .......... .......... .......... Psenov .......... .......... .......... .......... .....-A-.. .......... ....A..... .......... Pseher ...TC..... .......... .......... .......... .....-A-.. .......... .......... .......... Psebol .......... .......... .......... .......... .....-A-.. .......... ....A..... .......... Psenan .......... .......A.. .......... .......... .....-A-.. .......... .......... .......... Psegrac .......... .......... .......... .......... .....-A-.. .......... .......... ..........
Urohad .......... .......... .......... .......... .....-A-.. .......... ....A..... ..........
Mesmac .......... ...A...A.. .......... .......... .....-A-.. .......... .......... .......... Leglak .......... .......A.. .......... .......... .....TA-A. .......... .A..A..... .......... Legfor .......... .......... .......... .......... .....TA-.. .......... .A........ .......... Zyzmain .......... .......... .......... .......... .....TA-.. .......... .A..A..... .......... Zyzarg .......... .......C.. .......... .......... .....TA-.. .......... .A..A..... .......... Zyzped .......... .......... .......... .......... .....TA-A. .......... .A..A..... .......... Zyzwood .......... .......... .......... .......... .....TA-.. .......... .A..A..... ..........
Notale .......... .......... .......... .......... .....-A-.. .......... ....A..... ..........
Notcer .......... .......A.. .......... .......... .....-A-.. .......... ....A..... .......... Pseocc .......... ......GA.. .......... .......... .....-.-.. .......... ....A..... .......... Pseaus .......... .......... .......... .......... .....-A-.. .......... .......... ..........
Psefie .......... .......... .......... .......... .....-A-.. .......... .........T ..........
258

Xeromys TAGAAGTACC GACCACAT-G TGGAAGGGGA TAGTCATATG GAAGAGAAGA GTTTATGACT TAATGGTGTA TGTCTGATAA Melcer .....C..TA ..T-TA..-. .A.C...... .......G.. .........G .......... .......... .....A.... Melbur .....C..TA ..T-TA..-. .A.C...... .......G.. .........G A......... .......... .....A.... Urocau .....A..TA ..T-TG..-. .......... .......... .......... .......... .......... .....A.... Urohad ....GA..TA ..T-TG..-. ...G...... .......... ........AG .......... .......... .....A.... Lepcon ....GT..TA AGT-GT..-. .......... .....G.... ...A....AG A......... .......... .....A.... Mesgou .....C..GA ..TT.A..-. .......... .....G.... ...A.....G A......... .......... .....A....
Leglak .....A.TTA ..T-TA..-. G......... .......... .....T..AG .......... .......... .....A....
Psesho ....TA.TTA ..T-TA..-. .......... .....G.... ..CA.T.... .......... .......... .....C....
Zyzarg .......... ...AT-.... .......... T...--.A.. GG..-..... .....T...A ..--..T... -......AG.
Zyzwood .......... .....-.G.A .......... T...--.A.. CA..-..... .....T...A A.--A.T..G -......... Notmit .......... ....T-.G.A .......... T...--.A.G .G..G..... .....T...A ..--A....A -.........
Notfus .......... ..C.T-.T.. .......... T...--.AC. ....-..... .....T...A A.--A..A.G -.GGA....T
Pseocc .......... ..A.T-.... .......... ....--.AA. .A..T..... .....T.... A.--A.T... -.....-.G. Pseaus .......... ....T-.... .......... ....--.A.G ....-..... .....T.... A.--AGT.A. -........T
Masfus .....G.... .T.A.-.... ........G. -...--.AC. ....-..... .....T.... A.--.GTA.. -......ACT Psehig .......... ...ATA.G.A .......... ....--.AC. ....-..... .....T.... A.--..TA.A -......A.T
Psedes .......... ....T-...A .......... T...--.AC. AA..-..... .....T..A. ..--A.T... -..G......
Psejoh .......... .T..T-GT.A ........G. G...--.AC. AG..-..... ..G..GA..A C.-AT....G T.T......G
Psecal .......... .TC.T-...A .......... ....--.A.. AA.G-....G .....TA... ..TTA....G T........G Psepat .....G.... .T..T-...A .......... ....--.A.. GG.A-..... .....TT... A.--..T..G -.........
Conpen .....C..GA .....A..-. G......... .......... ...A...... .......... .......... .....A.... Mesmac .....C..GA .....A..-. .......... .......... ........AG A......... .......... .....A....
Legfor ....TA.TTA ..T-CT..-. G......... .......... .....T..AG .......... .......... .....A.... Zyzmain ....TA..TA ..TTTT..-. .......... .......... ..T..T..AG .......... .......... .....A.... Zyzarg ....TA.TTA .TG-TT..-. G......... .......... .....T..AG .......... .......... .......... Zyzped ....TA.TTA .TT-GT..-. G......... .......... .....T..AG .......... .......... .....A.... Zyzwood ....TA.TTA .TT-TT..-. G..T...... .......... .....T..AG .......... .......... .....A.... Notmit .....C-TTA ....CA..-. .......... .......... .....T.... .......... .......... .....A.... Notale .....C-TTA ....CA..-. .......... .......... .....T.... .......... .......... .....A.... Notfus .....C-TTA ....CA..-. .......... .....G.... ...A.T.... .......... .......... .....A.... Notcer ....GA.TTA ATT-TA..-. .......... .......... .....T.... .......... .......... .....A.... Pseocc ....GA.TTA ..T-TA..-. .A.C...... .......... .....T.... .......... .......... .....A.... Pseaus .....A.TTA ..T-TT..-. .......... .....G..G. ..C..T.... .......... .......... .....A.... Psealb .....A.TTA AGT-TA..-. G......... .....G.... .....T.... .......... .......... .....A.... Pseapo ....GA.TTA A.T-CA..T. G......... .....G.... ..T..T.... .......... .......... .....A.... Masfus .....A.TTA ..T-TA..-. .......... .....G.... ..TA.T..AG A......... .......... .....A.... Psehig ....TA.TTA ..T-....-. .......... .......... ..GA.T.... .......... .......T.T A....A.... Psefie ....TAATTA A.T-.T..-. .......... .......... .....T.... A......... .......T.T A....A....
Psedes ....TA.TTA ..T-TA..-. .......... .......... ..T..T.... .......... .......... .....C.... Pseora .....A.TTA ..T-TA..-. .......... .....G.... ..T..T.... .......... .......... .....A.... Psejoh ....GA.TTA ..T-CA..-. .......... .......... ...A.T.... .......... .......... .....A.... Pselab ....GA.TTA ..T-TA..-. .......... .......... ...A.T.... .......... .......... .....A.... Psecal .....A..TA A.T-TA..-. .A.C...... .......... .....T.... .......... .......... .....A.... Psepat ....GA.TTA ..T-TA..-. .......... .......... .....T.... .......... .......... .....A.... Psecha ....TAGTTA ..T-CA..-. .A.C...... .......G.. .....T...G .......... .......... .....A.... Psedel .....A..TA ..T-TG..-. .......... .......... .....T..AG .......... .......... .....A.... Psepil .....A..TA A.T-TA..-. .......... .......... .....T..AG .......... .......... .....A.... Psenov .....A..TA ..T-TA..-. .......... .......... .....T..AG .......... .......... .....A.... Pseher .....A.TTA .TT-TT..-. .......... .....G.... ..GA.T..AG .......... .......... .....A.... Psebol .....A..TA ....TA..-. .......... .......... .....T..AG A......... .......... .....A.... Psenan .....A.TTA A.T-TA..-. .......... .......... ........AG .......... .......... .....A.... Psegrac ....TA.TTA N.T-TA..-. .......... .......... .....T..AG .......... G......... .....A.... Xeromys CACAGATATG TCTTA-AAAG CATTAATTAA AATG--TGTT TCTT-AATAT TCATGAGTTT GT--GAATTT -TAAGTTGAA Melcer .....T.... ...A.-...A .......... ....--.T.. .A.G-..... .....T.... ..--A..... -......... Melbur .......... ...AT-...A .......... ....--.T.. CT.G-G.... .....T...A ..--A..... -......A.. Urocau .......... ..C.T-...A .......... ....--.T.A GG..-..... .......... A.--A..... -......A.. Urohad .......... ...GT-...A .......... ....--.T.G GT..-..... .....T.... A.--A..... -.....CA.. Lepcon .....G.... ....T-.... .......... ....--.CC. GT..-..... .....T.G.. A.--.GT... -C........ Mesgou .......... .....-T... .......... ....--.A.. GT..-..... .....T.G.. A.--..T... -.T......G Conpen .......... ...GT-G..A .......... ....--.T.. GT..-G.... .....TTA.. A.--.GT... -.GG....G. Mesmac .......... .....-.... .......... ....--.TC. AT..-..... .....T.G.. A.--..T... -......... Leglak .......... ...AT-...A .......... ....--.T.. GT.C-..... .....T.... A.--A...A. -......A.. Legfor .......... ...AT-...A .......... ....--.T.. GT.C-..... .....T.... A.--...... -......A.T Zyzmain .......... ....T-.G.T .......... T...--.A.. AG..-..... .....T...A A.--A.T.A. -..T...A.G
Zyzped .......... ...GT-...A .......... T...--.A.. CG..-..... .....T...A ..--A..... -......AG.
Notale .......... ..C.T-...A .......... T...--.ACG .G..A..... .....T...A ..--A....G -.........
Notcer .......... ...AT-.G.T .......... ....--.AC. ....-..... .....T.... A.--...... -.T.....GG
Psealb .......... ...AT-.G.. .......... T...--.AC. ....-..... .....TT.G. C.--TGTA.. -........T Pseapo .......... ...AT-.... .......... T...--.AC. ....-..... .....T..A. A.--A.TA.. -AGG.....T
Psefie .....T.... ...ATA.G.T .......... ....--..C. .T..TG.... .....T.... A.--..T... -......... Psesho .....G.... ...AT-.G.. .......... T...--.A.. AA.G-..... .....TA.G. A.--.G.... -.........
Pseora .......... ...A.-G..A .......... ....--GAC. AA..-..... .....-.... A.--AG.... T........T
Pselab .......... .T..T-GT.A ........G. G...--.AC. AG..-..... ..G..GA..A C.-AT....G T.C....AGG
Psecha .......... .T..T-.... ....G..... ....--.A.. .G..-..... .....T.... A.--.GT..G -.GG.....G Psedel .......... ...AT-.G.A .......... ....--.A.G GG..-..... .....G.G.A A---AGTA.. -......... Psepil .......... ...AT-.G.A .......... ....--.A.. AA..-..... .......G.A A---A.TA.. -..G....G. Psenov .......... ...AT-...A .......... ....--.A.. GA..-..... .....G...G A---AGTA.. -.GG.....G Pseher .......... ....T-TG.A .......... ....TG.A.G GG..-..... .....TA..C .A--.GTA.. -........T Psebol .......... ...AT-.... .......... ....--.A.. GA..-..... .....T.... AG--..TA.. -......... Psenan .....G.... .GGAT-TG.. .......... ....--.A.G GT.G-..... C....TT.A. A.--.G-... --G.....G. Psegrac .......... .G.ATTT... .......... ....--.A.N GT..-..... .....TT.G. T.--A..... --......G.
259

Xeromys --ATATCATT TATGTC-TTA ATTCATTAAT GTTATG-TTC TTGCTTATAT GCTAGGGGTA AATAATTTAA TGTACGATAT Melcer --..T.G... A.....-... .......... T..T.A-.A. A......... .......... .......... .......... Melbur --..T.G... A.....-... .......G.. T.AT.A-.A. A......... .......... .......... .......... Urocau --T.T.A... A.....-... .......... T.AT.A-... G......... .......... .......... .......... Urohad --..T.G... A.....-... G......... T.AT.A-... G......... .......... .......... .......... Lepcon -T..TCT... ......-C.. .......... A.ATAA-.A. G......... .....T.... .......... .......... Mesgou --T.T.A... A..A..-... .......... AGAT..-.A. .......... .......... .......... .......... Conpen --G.T.T..G A...A.-... .......G.. AAAT.A-.A. .......... ........G. .......... .......... Mesmac --..T.A... A.....-C.. .......G.. AAAT.A-.A. .......... .....C..A. .......... .......... Leglak --....T... A.....-... .......G.. A.AT.A-.A. .......... .....T.... .......... .......-.. Legfor --....A... A.....-... .......G.. T.AT.A-.A. .......... .....T.... .......... ..........
Zyzarg --T..GG.G. G.....-... ...A...... ..AT..-.C. .......... .....T.... .......... .......... Zyzped --T..GG.G. A.....-... ...A...... ..AT.A-.C. .......... .....T.... .......... .......... Zyzwood --T.GAGG.. A.....-... .......... T.AT.A-... .......... .....T.... .......... .......... Notmit --T...T... A.....-..G ..C....G.. T-.T.AG.A. .......... ........C. .......... .....A.... Notale --....T... A.....-..G .......G.. TA.T.AA.A. .......... .......... .......... .......... Notfus --........ A..A..-C.. G......G.. T..T.AG.A. .......... .......... .......... .......... Notcer -TTG.-AT.A A.....-... G......G.. T.ATAA-.A. .......... .......... .......... ..........
Psesho --....A... A.....-... .......G.. T.AT.A-.A. A......... ........A. .......... ..........
Psedel -AT.G.AG.. A.....-.G. .........A TA.T.A-.A. A......... .....T.... ...G...... ..........
Xeromys ACATT-AATG TTCTATAGTA CTATATAATT TT-ATGTACT
Mesmac .....-.... ......T... .......... ..-.......
Notale .....-.... .A...AT..G .......G.. ..-.......
Psehig .....-.... ..T..-T... ....G..... .--.......
Psepat .....-.... ..T..AT... ....G..... ..-.......
Psegrac .....-.... .AA..GT... .......... ..-.......
Zyzmain --G..AATG. A.....-C.. .......G.. A.AT..-.A. .......... .....T.... .......... .....A....
Pseocc -TTA..AG.. A.....-... ...A...... T..T.A-.A. A......... .......... .......... .......... Pseaus --....GG.. A.....-C.. .......G.. T.AT..-.A. A......... ........A. G.G....... .......... Psealb --T....... A.....-C.. .......... T.AT.TT.A. A......... ........A. .......... .......... Pseapo --........ A.....-... .......G.. T.AT.T-.A. A......... ........A. .......... .......... Masfus --....AT.. A.....-... G......... AGAT.A-.A. A......... ........A. .......... .......... Psehig --TA..A... A.....-... ..C....G.. TAAT..-.A. A......... ........A. .......... .......... Psefie --TA..A..G A.....-... T......... T.AT.A-.A. G......... ........A. .......... ..........
Psedes --T...A... A.....C... G......G.. TAAT.A-.A. A......... .......... .......... .......... Pseora --G....... A.....-... .......G.. T.AT..-.A. A......... ........A. .......... .......... Psejoh -TTGTATG.. AGGT.T-..G .A........ .A.TAA-.A. .......... .....T..AG .......... .....T.... Pselab -TTATAG... A.AT..-... .A.....G.. AA.TAA-.A. .......... .....T..AG .......... .....T.... Psecal -TTGTAATA. G..T..-..G .A.....G.. AG.TA.-.A. .......... ........A. .......... .....T.... Psepat -TTATAGT.. A..T..-... .A........ T..TAA-.A. .......... ........A. .......... .....T.... Psecha -ATATAGT.. ...T..-C.. .......... .A.TAA-.A. .......... ........A. .......... .....T....
Psepil -TTA..A... A.....-... .......G.. TA.T.A-.A. G......... .....T.... .......... .......... Psenov --T...A... A..A..-... .......... TG.T.A-.A. G......... .....T.... .......... .......... Pseher --TA..A... A.....-C.. .......G.. T.GT..-.A. A......... .....T.... .......... .......... Psebol --T...G... A.....-... ..A....G.. TAAT..-.A. A......... .....T..A. .......... .......... Psenan TT....ATA. G.....-..C G..A...... A.....-.A. A......... ........A. T......... .......... Psegrac TT....AT.. A.....-..T G..A...... AG.T.A-.A. A......... ........A. .......... ..........
Melcer .....-.... ......T... .......... ..-....... Melbur .....-.... ......T... ....G..... ..-....... Urocau .....-.... ......T... ....G..... ..-....... Urohad .....-.... .C....T... .......... ..-....... Lepcon ....A-G... ..A...T... .......... ..-....... Mesgou .....-.... ......T... .......... ..-....... Conpen ....A-.... .ATA..T... .......G.. ..-.......
Leglak .....-.... ..AGT.T... ........A. ..-....... Legfor .....-.... ..ACT.T... ....G...A. ..-....... Zyzmain .....-.... .-....T... .......... ..-....... Zyzarg .....-.... .-T.G.T... .......... ..-....... Zyzped .....-.... .-........ .......... ..-....... Zyzwood .....-.... .-T.G.T... .......... ..-....... Notmit .....-.... .G...AT..G T......G.. ..-.......
Notfus .....-.... .AT..AT... .......G.. ..-....... Notcer .....-.... ..T..AT... .......... ..-....... Pseocc .....-.... .....AT... .......... ..T....... Pseaus .....-.... ..T..AT... ...A...T.. ..-....... Psealb .....-.... ..T...T... .......... ..-....... Pseapo .....-.... ..T...T... .......... ..-....... Masfus .....-.... .CT...T... ....G..... ..-......G
Psefie .....-.... .-T...T... ....G..... ..-....... Psesho .....-.... ......T... .......... ..-....... Psedes .....-.... ..T...T... .......... ..-....... Pseora .....-.... ..T...T... .......... ..-....... Psejoh .....T.... ..T..AT... .......... ..-......A Pselab .....TG... ..T..AT... .......... ..-....... Psecal .....-.... ..T..AT..G T......... ..-.......
Psecha .....-.... ..T..AT... ....G..... ..-....... Psedel .....-.... ..T....... .......... ..-....... Psepil .....-.... ..-....... .......... ..-....... Psenov .....-.... .......... .......... ..-....... Pseher .....-.... ..T....... .......... ..-....... Psebol .....-.... ..T....... ..T....... ..-....... Psenan .....-.... .AA..AT... .......... ..-.......
260

DHFR intron 1(3 pages): Psealb AAAATATGGG CATTGGCAAG AACGGAGACC TGCCCTGGCC TCTGCTCAGG TACGGGCTGG GCTGGGCGCG GGAAACCGAG Pseapo .......... .......... .......... .......... .......... .......... .......... ..........
Pseher .......... .......... .......... .......... .......... ...-----.. .........T ..........
Psenov .......... .......... .......... .......... .......... ...-----.. .......... ..........
Pseocc .......... .......... .......... .......... .......... ...C...... .......... ..........
Psecha .......... .......... .......... .......... .......... .......... ........G. .....TT...
Rattun .......... .......... .........T .......... .......... ...TAA.C.. .......T.. .......C..
Psealb GCGGTTCACC GAGTTGGGTC GAGCACTTGC CTTGGACGCA CAGGCTGACC TGCTTGGAGT CGGGTCTAAG TGGATAGGCC
Psebol .........T .......... .......... .......... .....C.... .......... G......... ..........
Psefum .......... .......... .......... .......... ..C....... .......... .......... ........C.
Psepil .......... .......... .......... .......... .......... ...-----.. .......... ..........
Psedel .......... .......... .......... .......... .......... ...-----.. .......... .......... Psenan .......... .......... .......... .......... ..C....... .......... .......... .....-.... Psegra .......... .......... .......... .......... .......... .......... .......... .......... Psehig .......... .......... .......... .......... .......... .......... .......... .......... Psefie .......... .......... .......... .......... .......... .......... .......... .......... Notfus .......... .......... .......... .......... .......... ...C...... .......... .......... Notale .......... .......... .......... .......... .......... ...C...... .......... ..........
Notmit .......... .......... .......... .......... .......... ...C...... .......... .......... Masfus .......... .......... .......... .......... .......... ...-----.. .......... .......... Psesho .......... .......... .......... .......... .......... .......... .......... .......... Pseora .......... .......... .......... .......... .......... .......... .......... .......... Lepcon .......... .......... .......... .......... .......... .......... .......... .......... Legfor .......... .......... .......... .......... .......... ...C...... .......... .......... Psepat .......... .......... .......... .......... .......... .......... ........G. .....T....
Psecal .......... .......... .......... .......... .......... .......... ........G. .....T.... Pselab .......... .......... .......... .......... .......... ....---... ........G. .....TT... Urocau .......... .......... .......... .......... .......... .......... .......... .......... Zyzarg .......... .......... .......... .......... .......... .......... .......... .......... Zyzwoo .......... .......... .......... .......... .......... .......... .......... ....G..... Mesmac .......... .......... .......... .......... .......... .......... .......... .......... Mesgou .......... .......... .......... .......... .......... ..T....... .......... ..........
Melcer .......... .......... .......... .......... .......... .......... .......... .......... Psedes .......... .......... .......... .......... .......... .......... .......... .......... Psebol .......... .......... .......... .......... .......... ...-----.. .......... .......... Psejoh .......... .......... .......... .......... .......... ....---... ........G. .....TT... Conpen .......... .......... .......... .......... .......... .......... .......... .......... Xermyo .......... .......... .......... .......... .......... .......... .......... ..........
Pseapo .........T .......... .......... .......... .......... .......... .......... .......... Psefum .........T .......... .......... .......... .....C.... .......... .......... .......... Pseher .........T .......... .......... .......... .....C.... .......... G......... .......... Psepil .........T .......... .......... .......... .....C.... .......... G......... .......... Psenov .........T .......... .......... .......... .....C.... .......... G......... .......... Psedel .........T .......... .......... .......... .....C.... .......... G......... .......... Psenan .........T ....A..N.. .......... .......... .....C.... .......... .......... .......... Psegra .........T ....A..T.. .......... .......... ..T..C.... .......... .......... .......... Psehig .........T .......... .......... .......... .....C.... .......... .......... .......... Psefie .........T .......... .......... .......... .T...C.... ........A. .......... .......... Notfus .........T .......... .......... .......... .....C.... .......... .......... .......... Notale .........T .......... .......... .......... .....C.... .......... .......... .......... Pseocc .........T .......... .......... .......... .....C.... .......... .......... .......... Notmit .........T .......... .......... .......... .....C.... .......... .......... .......... Masfus .........T ....A..... .......... .....----- ----.C.... .......... .......... .......... Psesho .........T ....A..... .......... ......T... .....C.... .......... .......... .......... Pseora .........T ....A..... .......... ......T... .....C.... .......... .......... .......A.. Lepcon .........T ....A..... .......... ....A..... .....C.... .......... ...A...... .......... Legfor .........T ....A..... .......... .......... .....C.... ........C. .......... .....G.... Psepat .........T ....A..... ..T..T.... .......... .....C.... .......... .......... .......... Psecha .........T ....A..... ..T..T.... .......... .....C.... .......... .........C .......... Psecal .........T ....A..... ..T..T.... .......... .....C.... .......... .........C .......... Pselab .........T ....A..... ..T..T.... .......... .....CA... .......... .......... .......... Urocau .........T ..-------- ---------- ------.... .....G.... .......... .........A C......... Zyzarg .........T ....A..... .......... .......... .....C.... .......... .......... .......... Zyzwoo .........T ..A.A....T .......... .......... .....C.... .......... .......... .......... Mesmac .........T ....A..... .......... .......... .....C.... .......... .......... C......... Mesgou .........T ....A..... .......... .......... .....C.... .......... .......... C......... Rattun .......C.T ....A...G. .G..G....G .........G .....C.... ....C....A ....CG.G.. C---C..... Melcer .........T ....A..... .......... .......... .....G.... .......... .........A C......... Psedes .........T ....A..... .......... ......T... .....C.... .......... .......... ..........
Psejoh .........T ....A..... ..T..T.... .......... .....CA... .......... .......... .......... Conpen .........T ..A.A..... .......... .......... .....C.... .......... .......... C......... Xermyo .........T ....A...-- ---------. .......... .....C.... .......... .......C.. C.....A...
261
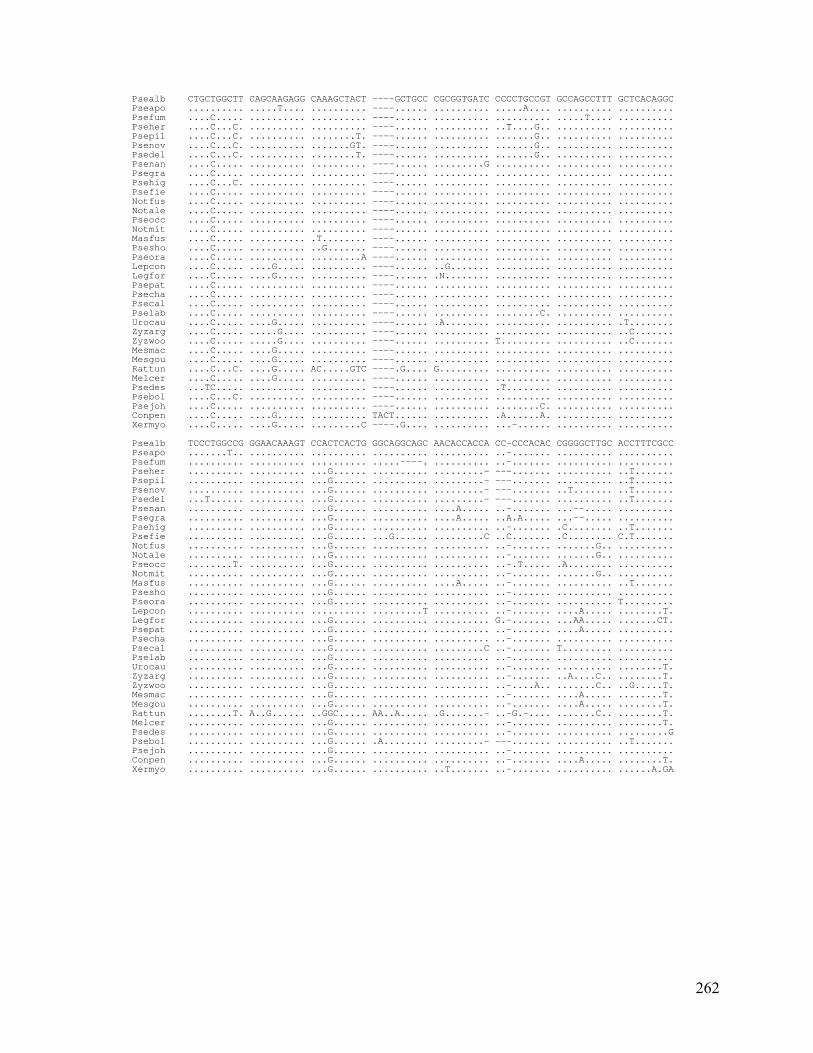
Psealb CTGCTGGCTT CAGCAAGAGG CAAAGCTACT ----GCTGCC CGCGGTGATC CCCCTGCCGT GCCAGCCTTT GCTCACAGGC Pseapo .......... .....T.... .......... ----...... .......... .....A.... .......... .......... Psefum ....C..... .......... .......... ----...... .......... .......... .....T.... .......... Pseher ....C...C. .......... .......... ----...... .......... ..T....G.. .......... .......... Psepil ....C...C. .......... ........T. ----...... .......... .......G.. .......... .......... Psenov ....C...C. .......... .......GT. ----...... .......... .......G.. .......... .......... Psedel ....C...C. .......... ........T. ----...... .......... .......G.. .......... .......... Psenan ....C..... .......... .......... ----...... .........G .......... .......... .......... Psegra ....C..... .......... .......... ----...... .......... .......... .......... .......... Psehig ....C...C. .......... .......... ----...... .......... .......... .......... .......... Psefie ....C..... .......... .......... ----...... .......... .......... .......... .......... Notfus ....C..... .......... .......... ----...... .......... .......... .......... .......... Notale ....C..... .......... .......... ----...... .......... .......... .......... .......... Pseocc ....C..... .......... .......... ----...... .......... .......... .......... .......... Notmit ....C..... .......... .......... ----...... .......... .......... .......... .......... Masfus ....C..... .......... .T........ ----...... .......... .......... .......... .......... Psesho ....C..... .......... ..G....... ----...... .......... .......... .......... .......... Pseora ....C..... .......... .........A ----...... .......... .......... .......... .......... Lepcon ....C..... ....G..... .......... ----...... ..G....... .......... .......... .......... Legfor ....C..... ....G..... .......... ----...... .N........ .......... .......... ..........
Xermyo ....C..... ....G..... .........C ----.G.... .......... ...-...... .......... ..........
Psedel ...T...... .......... ...G...... .......... .........- ---....... .......... ..T.......
Melcer .......... .......... ...G...... .......... .......... ..-....... .......... ........T.
Psepat ....C..... .......... .......... ----...... .......... .......... .......... .......... Psecha ....C..... .......... .......... ----...... .......... .......... .......... .......... Psecal ....C..... .......... .......... ----...... .......... .......... .......... .......... Pselab ....C..... .......... .......... ----...... .......... ........C. .......... .......... Urocau ....C..... ....G..... .......... ----...... .A........ .......... .......... .T........ Zyzarg ....C..... .....G.... .......... ----...... .......... .......... .......... ..C....... Zyzwoo ....C..... .....G.... .......... ----...... .......... T......... .......... ..C....... Mesmac ....C..... ....G..... .......... ----...... .......... .......... .......... .......... Mesgou ....C..... ....G..... .......... ----...... .......... .......... .......... .......... Rattun ....C...C. ....G..... AC.....GTC ----.G.... G......... .......... .......... .......... Melcer ....C..... ....G..... .......... ----...... .......... .......... .......... .......... Psedes ...TC..... .......... .......... ----...... .......... .T........ .......... .......... Psebol ....C...C. .......... .......... ----...... .......... .......... .......... .......... Psejoh ....C..... .......... .......... ----...... .......... ........C. .......... .......... Conpen ....C..... ....G..... .......... TACT...... .......... .A......A. .......... ..........
Psealb TCCCTGGCCG GGAACAAAGT CCACTCACTG GGCAGGCAGC AACACCACCA CC-CCCACAC CGGGGCTTGC ACCTTTCGCC Pseapo .......T.. .......... .......... .......... .......... ..-....... .......... .......... Psefum .......... .......... .......... .....----. .......... ..-....... .......... .......... Pseher .......... .......... ...G...... .......... .........- ---....... .......... ..T....... Psepil .......... .......... ...G...... .......... .........- ---....... .......... ..T....... Psenov .......... .......... ...G...... .......... .........- ---....... ..T....... ..T.......
Psenan .......... .......... ...G...... .......... ....A..... ..-....... ...--..... .......... Psegra .......... .......... ...G...... .......... ....A..... ..A.A..... ...--..... .......... Psehig .......... .......... ...G...... .......... .......... ..-....... .C........ ..T....... Psefie .......... .......... ...G...... ...G...... .........C ..C....... .C........ C.T....... Notfus .......... .......... ...G...... .......... .......... ..-....... .......G.. .......... Notale .......... .......... ...G...... .......... .......... ..-....... .......G.. .......... Pseocc ........T. .......... ...G...... .......... .......... ..-.T..... .A........ .......... Notmit .......... .......... ...G...... .......... .......... ..-....... .......G.. .......... Masfus .......... .......... ...G...... .......... ....A..... ..-....... .......... ..T....... Psesho .......... .......... ...G...... .......... .......... ..-....... .......... .......... Pseora .......... .......... ...G...... .......... .......... ..-....... .......... T......... Lepcon .......... .......... .......... .........T .......... ..-....... ....A..... ........T. Legfor .......... .......... ...G...... .......... .......... G.-....... ...AA..... .......CT. Psepat .......... .......... ...G...... .......... .......... ..-....... ....A..... .......... Psecha .......... .......... ...G...... .......... .......... ..-....... .......... .......... Psecal .......... .......... ...G...... .......... .........C ..-....... T......... .......... Pselab .......... .......... ...G...... .......... .......... ..-....... .......... .......... Urocau .......... .......... ...G...... .......... .......... ..-....... .......... ........T. Zyzarg .......... .......... ...G...... .......... .......... ..-....... ..A....C.. ........T. Zyzwoo .......... .......... ...G...... .......... .......... ..-....A.. .......C.. ..G.....T. Mesmac .......... .......... ...G...... .......... .......... ..-....... ....A..... ........T. Mesgou .......... .......... ...G...... .......... .......... ..-....... ....A..... ........T. Rattun ........T. A..G...... ..GGC..... AA..A..... .G.......- ..-G.-.... .......C.. ........T.
Psedes .......... .......... ...G...... .......... .......... ..-....... .......... .........G Psebol .......... .......... ...G...... .A........ .........- ---....... .......... ..T....... Psejoh .......... .......... ...G...... .......... .......... ..-....... .......... .......... Conpen .......... .......... ...G...... .......... .......... ..-....... ....A..... ........T. Xermyo .......... .......... ...G...... .......... ..T....... ..-....... .......... ......A.GA
262

Psealb GCTGACTTGA GCCTGAGCAC ACGTGACAGG GATTAACGCA GTGTTTCTC- TAACTTTCAG GAATGAGTTC AAGTACTT Pseapo .......... .......... .......... .......... .........- .......... .......... ........ Psefum .......... .......... .......... .......... .........- .......... .......... ........ Pseher .......... .......... .......... .......... .C.......- .......... .......... ........ Psepil .......... .......... .......... .......... .C.......- .......... .......... ........ Psenov .......... .......... .......... .......... .C.......- .......... .......... ........
Pseora .......... .......... .......... .......... .C.......- .......... .......... ........
Psedel .......... .......... .......... .......... .C.......- .......... .......... ........ Psenan .......... .......... .......... .......... .........- .......... .......... ........ Psegra .......... .......... .......... .......... .........- .......... .......... ........ Psehig .......... .......... .......... ....G..... .C.......- .......... .......... ........ Psefie .......... .T........ .......... .......... .C.......- .......... .......... ........ Notfus .......... .......... .......... .......... .C.......- .......... .......... ........ Notale .......... .......... .......... .......... .C.......- .......... .......... ........ Pseocc .......... .......... .......... .......... .........- .......... .......... ........ Notmit .......... .......... .......... .......... .C.......- .......... .......... ........ Masfus .......... .......... .......... .......... .C.......- .......... .......... ........ Psesho .....T.... ........T. .......... A......... .C.......- .......... .......... ........
Lepcon .......G.. .......... .......... AG........ N........- .......... .......... ....N... Legfor .......G.T .......... .......... .G........ .........- .......... .......... ........ Psepat .......... .......... .......... .......... .C.......C .......... .......... ........ Psecha .......... .......... .......... .......... .C.......T .......... .......... ........ Psecal .......... .......... .......... .......... .C.......T .......... .......... ........ Pselab .......... .......... .......... .......... .........- .......... .......... ........ Urocau .......G.. .......... .......... AG........ .........- .......... .......... ........ Zyzarg .......G.. .......... .......... AG....T... .........- .......... .......... ........ Zyzwoo .......G.. .......... ...A...... -C-....... .........- .......... .......... ........ Mesmac .......G.. .......... .......... AG........ .........- .......... .......... ........ Mesgou .......G.. .......... .......... AG........ .........- .......... .......... ........ Rattun CT.....G.. .......... ..ACATG.CT .G.....A.. .........- ----...... .......... ........ Melcer .......G.. .......... .......... .G........ .........- .......... .......... ........ Psedes .....T.... ........T. .......... .......... .C.......- .......... .......... ........ Psebol .......... .......... .......... .......... .C.......- .......... .......... ........ Psejoh .......... .......... .......... .......... .........- .......... .......... ........ Conpen .......G.. .......... .......TA. AG........ .....-...- .......... .......... ........ Xermyo .......G.. .......... .......... NG........ .........- .......... .......... ........
263