connected dimension - telstra€¦ · connected government: thenn i oovatni dimension. 2 table of...
TRANSCRIPT

CONNECTED GOVERNMENT: THE INNOVATION DIMENSION
2
TABLE OF CONTENTS
FOREWORD 4
EXECUTIVE SUMMARY 6 KEY FINDINGS FROM THE RESEARCH 6
The what, when and how of using government services 7
Preferences, perceptions and expectations for the future 7
RESEARCH CONCLUSIONS 7
FUTURE DIRECTIONS: THE INNOVATION DIMENSION 8
A conceptual representation of a Syndesic Service platform 9
SECTION 1: USING GOVERNMENT SERVICES 10 SO, HOW DO AUSTRALIANS INTERACT WITH GOVERNMENT? 10
ACCESSING GOVERNMENT SERVICES: WHAT DO WE DO? 14
WHAT DIGITAL CHANNELS DO AUSTRALIANS PREFER – AND WHY? 16
DISCRETE DIGITAL SERVICES 20
SECTION 2: PREFERENCES AND PERCEPTIONS: WHAT DO WE THINK AND WHAT DO WE WANT FROM OUR GOVERNMENT SERVICES? 22 KEY FINDINGS 22
PREFERENCES FOR INTERACTION: WHAT WE WANT 22
PERCEPTIONS OF GOVERNMENT SERVICES: WHAT WE THINK 24
Perceptions of current digital performance 26
Perceptions of digital priority: what’s most important to Australians 26
Sector and jurisdiction comparisons: how does government shape up? 27
ROLE OF TRUST: DO WE TRUST GOVERNMENT WITH OUR DATA? 29
SECTION 3: DELIVERING THE FUTURE OF GREAT EXPECTATIONS 32 EXPECTATIONS OF THE FUTURE 32
ATTITUDES TO DIGITAL SERVICE DELIVERY 34
3
SECTION 4: A NEW MODEL FOR GOVERNMENT SERVICE DELIVERY 36 THE TECHNOLOGY DIMENSION 36
Computing power 36
Cloud computing 37
Big data 37
Smart devices 37
Connectivity 37
Cognitive computing 38
Disruptions on the horizon 38
THE TRUST DIMENSION 39
THE INNOVATION DIMENSION 39
The Transactional Service Model – the tradition 39
The Digital Service Model – the now 41
The Syndesic Service Model – the future 42
CONCLUSION 45 AUSTRALIANS LIKE USING DIGITAL GOVERNMENT SERVICES, AND WANT (AND EXPECT) MORE 45
AUSTRALIANS TRUST GOVERNMENTS WITH THEIR DATA, BUT DON’T NECESSARILY TRUST THE INTERNET 45
AUSTRALIANS’ EXPECTATIONS AND CONCERNS ARE MILDER THAN THOSE OF PEOPLE INTERNATIONALLY 45
GOVERNMENT SERVICE DELIVERY: AN INNOVATIVE CONCEPTUAL MODEL 46
ABOUT THE AUTHOR 47 RESEARCH BACKGROUND AND METHODOLOGY 47
4
FOREWORD
The publication of this report comes at a time when innovation is front of mind for the elected government, the public sector and the public at large.
Maintaining the momentum for innovation is important.
The comprehensive nature of recent policy announcements, along with the public’s increased awareness of the significant role that technology and innovation plays in changing the world around us, has created a sense of opportunity and enthusiasm.
However, there is a great deal of hard work ahead. Innovation may disrupt existing industries, even entire sectors of the economy, and lead to growth and great success for some innovators. Nevertheless, it must be noted that technology advances, disruption and innovation don’t necessarily bring about growth and prosperity for the entire population.
Indeed, by way of example, many of the businesses considered to be the poster children for innovation, with corresponding high financial valuations, make extensive use of technology, but employ many fewer people than the companies and industries they disrupt. The resulting investment capital and human
capital surpluses will have an unfavourable impact on economic and employment metrics.
For the public sector to address these issues (and others such as competitiveness, well-being, sustainable advantage and growth) in a fast-changing – and, arguably, geopolitically and economically rebalancing – world, many policy, program and service delivery challenges will need to be tackled.
The public sector must, now more than ever, be ready, able and willing to face the challenges ahead with a mindset that embraces the opportunities offered by the future.
Success will depend upon tailoring the approach, structure and culture that reflects the best qualities of the sector – including its values, skills, knowledge and ethos. These will need to be integrated into a model that is capable of meeting the challenges ahead, including the expectations of the public. Ultimately, it is success against such challenges that will truly make the public sector an exemplar of the innovation and digital transformation agenda.
The public sector has its most tangible and distinct presence in its everyday engagement with the public. Thus, for most Australians – whether as individuals or in organisations accessing services or interacting with government in the course of their activities – the success of the public sector model means a great deal.
There have been many studies on the impact of ‘suboptimal’ engagement and service delivery on the public. Such studies sought to quantify various effects – the financial cost to the public and to the government, the productivity loss, the compliance impact on organisations, etc.
5
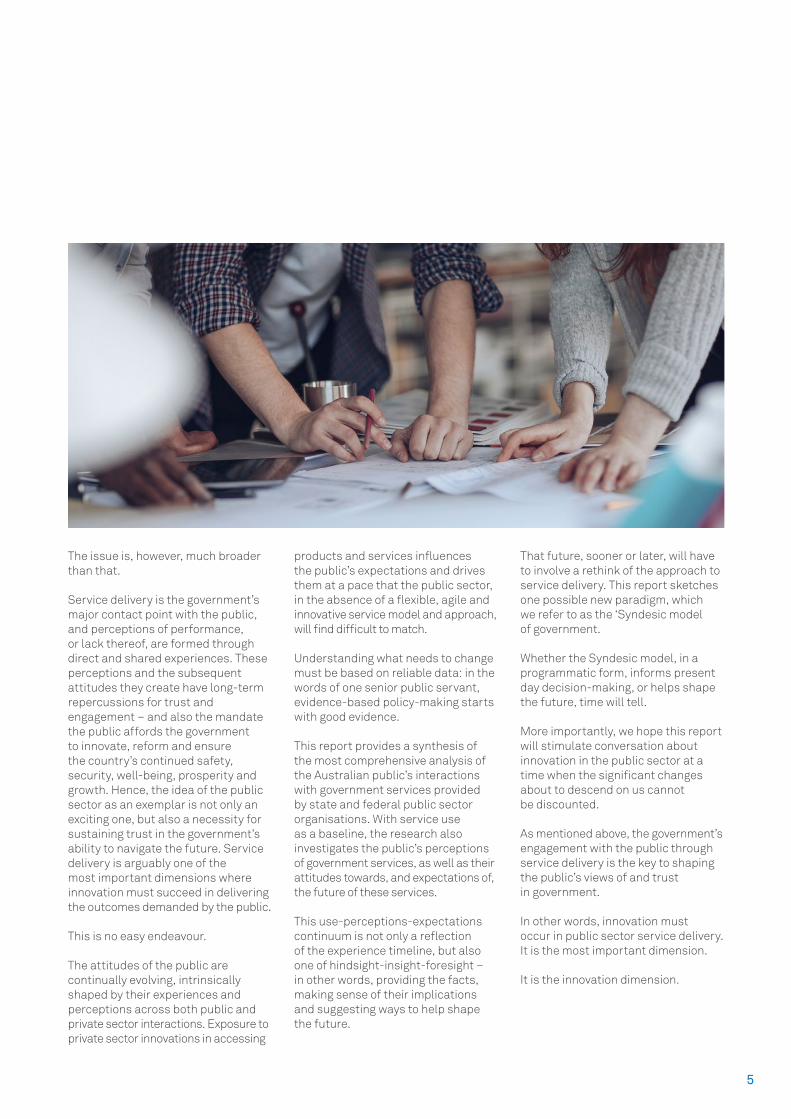
The issue is, however, much broader than that.
Service delivery is the government’s major contact point with the public, and perceptions of performance, or lack thereof, are formed through direct and shared experiences. These perceptions and the subsequent attitudes they create have long-term repercussions for trust and engagement – and also the mandate the public affords the government to innovate, reform and ensure the country’s continued safety, security, well-being, prosperity and growth. Hence, the idea of the public sector as an exemplar is not only an exciting one, but also a necessity for sustaining trust in the government’s ability to navigate the future. Service delivery is arguably one of the most important dimensions where innovation must succeed in delivering the outcomes demanded by the public.
This is no easy endeavour.
The attitudes of the public are continually evolving, intrinsically shaped by their experiences and perceptions across both public and private sector interactions. Exposure to private sector innovations in accessing
products and services influences the public’s expectations and drives them at a pace that the public sector, in the absence of a flexible, agile and innovative service model and approach, will find difficult to match.
Understanding what needs to change must be based on reliable data: in the words of one senior public servant, evidence-based policy-making starts with good evidence.
This report provides a synthesis of the most comprehensive analysis of the Australian public’s interactions with government services provided by state and federal public sector organisations. With service use as a baseline, the research also investigates the public’s perceptions of government services, as well as their attitudes towards, and expectations of, the future of these services.
This use-perceptions-expectations continuum is not only a reflection of the experience timeline, but also one of hindsight-insight-foresight – in other words, providing the facts, making sense of their implications and suggesting ways to help shape the future.
That future, sooner or later, will have to involve a rethink of the approach to service delivery. This report sketches one possible new paradigm, which we refer to as the ‘Syndesic model of government.
Whether the Syndesic model, in a programmatic form, informs present day decision-making, or helps shape the future, time will tell.
More importantly, we hope this report will stimulate conversation about innovation in the public sector at a time when the significant changes about to descend on us cannot be discounted.
As mentioned above, the government’s engagement with the public through service delivery is the key to shaping the public’s views of and trust in government.
In other words, innovation must occur in public sector service delivery. It is the most important dimension.
It is the innovation dimension.
6
EXECUTIVE SUMMARY
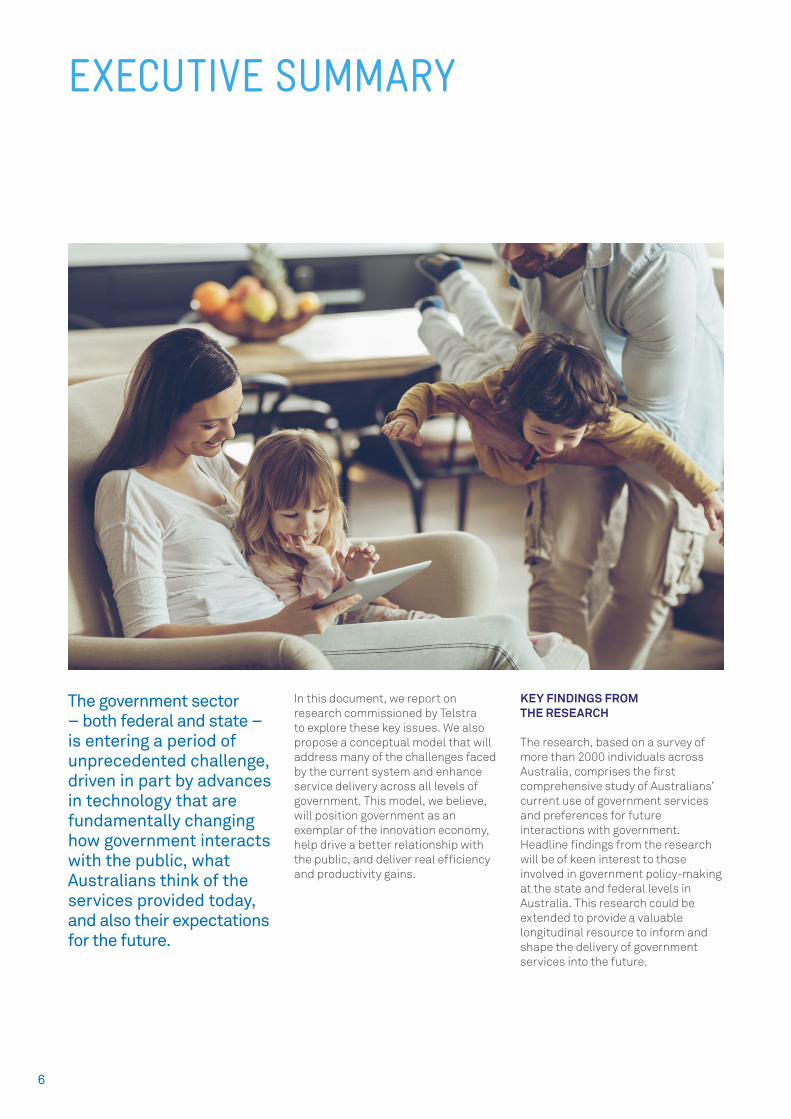
The government sector – both federal and state – is entering a period of unprecedented challenge, driven in part by advances in technology that are fundamentally changing how government interacts with the public, what Australians think of the services provided today, and also their expectations for the future.
In this document, we report on research commissioned by Telstra to explore these key issues. We also propose a conceptual model that will address many of the challenges faced by the current system and enhance service delivery across all levels of government. This model, we believe, will position government as an exemplar of the innovation economy, help drive a better relationship with the public, and deliver real efficiency and productivity gains.
KEY FINDINGS FROM THE RESEARCH
The research, based on a survey of more than 2000 individuals across Australia, comprises the first comprehensive study of Australians’ current use of government services and preferences for future interactions with government. Headline findings from the research will be of keen interest to those involved in government policy-making at the state and federal levels in Australia. This research could be extended to provide a valuable longitudinal resource to inform and shape the delivery of government services into the future.

7
The what, when and how of using government services
Key takeaway: Australians have largely embraced digital services, and would prefer more online services in the future
• Australians’ most frequent interactions with government are claiming rebates for medical expenses from Medicare, purchasing or ‘topping up’ public transport tickets, and seeking assistance from public healthcare providers.
• The two most popular channels for interacting with government are in person and online.
• Almost half (49 per cent) of respondents describe the government information and services currently provided over the Internet as either ‘good’ or ‘very good’.
• In the future, Australians would prefer to conduct more government transactions online, including licence renewals, applying for and claiming pensions and allowances, submitting tax assessments, paying government-issued bills and fines, requesting government information, and claiming rebates on medical expenses.
• More than half (59 per cent) of respondents describe government investment in making information and services available over the Internet as either a ‘high’ or ‘very high’ priority.
• Only five per cent of respondents describe digital government investment as a ‘low’ or ‘very low’ priority.
• Three in four respondents ‘agree’ or ‘strongly agree’ that government departments should share information to deliver better services and that government should embrace delivering services using new technologies.
Preferences, perceptions and expectations for the future
Key takeaway: Digital government services are viewed as convenient, cost-effective and the ‘way of the future’, although concerns remain over privacy and security of information
• Australians view online service delivery as ‘quick’, ‘easy’, ‘environmentally friendly’ and ‘convenient’.
• Service delivery by telephone is viewed as ‘frustrating’, ‘slow’ and a ‘waste of time’, while in person delivery ‘feels local’, ‘gets results’ and is ‘confidential’.
• Three in four respondents ‘agree’ or ‘strongly agree’ that digital government service delivery saves time and is more convenient, while more than 60 per cent ‘agree’ or ‘strongly agree’ that it saves the government money, demonstrates that the government is forward-thinking, and frees up government resources to deal with more complex issues.
• Less than one third (31 per cent) of respondents are concerned that their needs are too complicated to be dealt with online.
• Although almost 60 per cent of respondents trust the government to keep their personal information safe, only 21 per cent do not believe the online transactions involve risks of that information being sold or stolen.
RESEARCH CONCLUSIONS
Our research finds strong support for Australian federal and state governments’ digital government initiatives to date, and enthusiasm for future moves towards online government service delivery. Governments can be heartened by these results, but should note the appetite for innovation among Australian users of government services.
The in-principle support for increased information sharing among government departments and services may provide momentum for greater data transparency, sharing and linkage in aid of centralised, efficient digital government service delivery. That said, governments need to be aware of, and address public concerns about, the risk of data theft, loss and misuse inherent to online transactions.
The increasing attention paid to cybersecurity shows that such risks are taken seriously by government. Telstra’s most recent survey1 into cybersecurity shows that this is important – not only in terms of the potential impact on users, but also the impact of any potential security breach on government productivity levels – and reputation. The government’s recently launched Cyber Security Strategy indicates these considerations are top of mind when it comes to both advancing and protecting Australia’s interests online.
Levels of risk can be mitigated by adoption of the ‘security by design’ principle for all new initiatives, and by allowing individuals to control their personal data, including who it may be shared with and with what conditions and limitations.
1 https://www.telstra.com.au/business-enterprise/campaigns/cyber-security-report
8
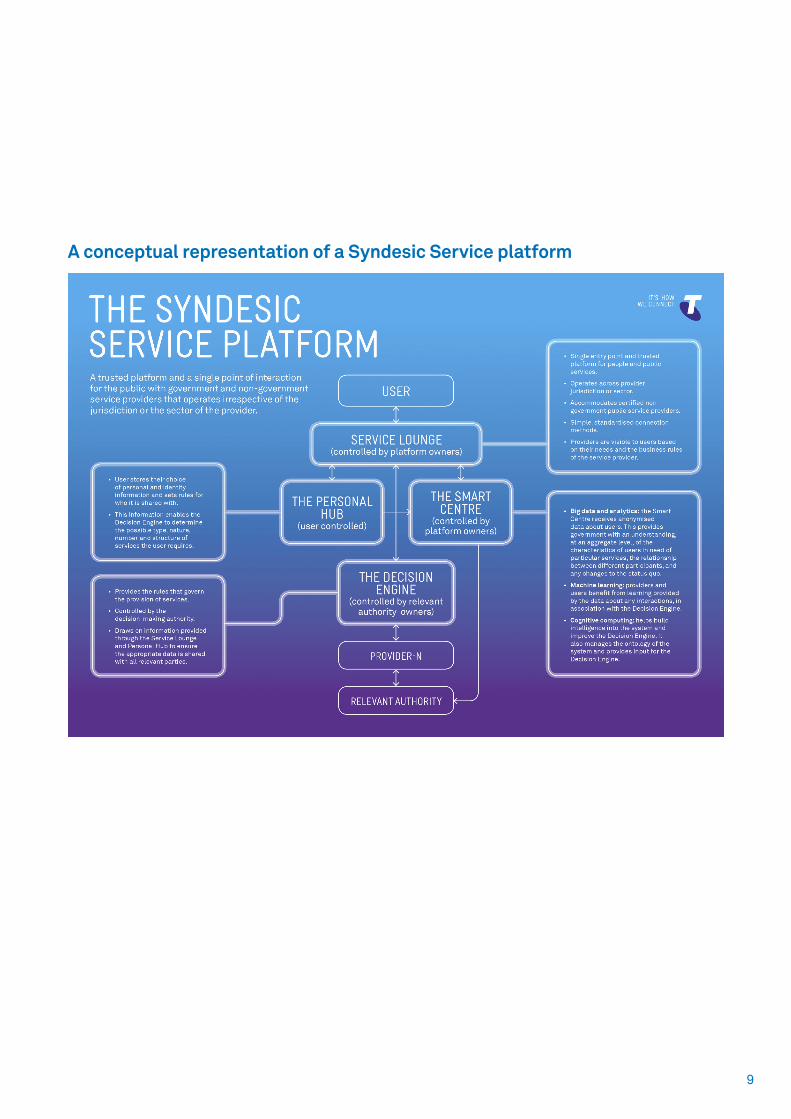
FUTURE DIRECTIONS: THE INNOVATION DIMENSION AND THE SYNDESIC SERVICE MODEL
Successive waves of technology innovation, not the least in the form and reach of the Internet itself, are reshaping how we interact – with each other as individuals, and with government. Some very big changes are also underway – in social values, economics, demographics and more. These will test the way in which government interacts with the public – and the time to start preparing is now.
In this paper, we outline a new user-centric model for the delivery of government services – which, in order to differentiate from other alternatives, we refer to as the Syndesic2 Service Model. This model draws on the latest advances in technology and security to empower government to better perform its role, and also build reputational capital with the public.
The Syndesic Service Model takes an innovative approach to providing services to the public:
• It offers users the ability to control their information;
• It separates the personal information of the user from the aggregate, anonymised data needed for decision-making;
• It separates the decision-making capability from the learning capability, allowing it to be modular and tailored according to the services provided and the organisations providing those services;
• It accounts for different roles and functions of service providers, including dependencies across the private and public sectors and across multiple jurisdictions;
• It enables responsible authorities and service providers to engage on the basis of evidence and insights provided by the learning capability;
• It accommodates modular and agile development, as well as innovative and secure information architectures (such as distributed ledgers), allowing services to be added to the platform as user needs change; and
• It allows a seamless evolution towards increased automation in the provision of services, removing, where possible, the need for user intervention.
The Syndesic Model is, at this stage, a conceptual one despite some advanced digital nations, (such as Estonia3) taking steps in this direction. As such, it is important to highlight a series of governing principles that focus on the user, the provider and the technology as underlying enablers.
Focus on the user
• The model considers the role of user technology, both now and into the future;
• It is user-centric and takes into account the individual, their circumstances (family units, life events, etc.) and their needs (health, welfare, taxation, licensing, information, legal, etc.); and
• The user is in control – they can decide their level of involvement and control their own information.
Focus on the provider
• It acknowledges that public value is created through the optimal interaction of the sectors;
• It accounts for the role of non-government sectors – including private sector agencies, NGOs, etc. in the provision of services; and
• It leverages the strengths of the different sectors: trust in public sector, the agility of private sector, the social values of NGOs and the public purpose shared by all participants.
Focus on the technology
• It is a platform: it brings together the different services provided by all sectors and can evolve over time;
• It is smart: it can learn from the information provided, provide an evidence base for decision-making and develop insights for proactive and preventative service models; and
• It is trusted: security by design offers an inherently resilient architecture.
While the concept of the Syndesic model will evolve over time, it is important to note that redesigning services that support millions of transactions and people is no easy task. In order to have a mature new way of delivering services in a decade, we need to start today.
2 From Greek syndeō (‘to connect’).3 See: https://e-estonia.com/component/x-road/
EXECUTIVE SUMMARY (CONT.)
9
A conceptual representation of a Syndesic Service platform
10
In this section, we look at how and when Australians interact with government service providers (both federal and state).
SECTION 1: USING GOVERNMENT SERVICES
Figure 1: At a glance
Hindsight Insight Foresight
Policy By and large, Australians do not distinguish the level of
government from which they receive services
Coordination across levels of government can provide a
better and more consistent service experience for
Australians
Orchestrating services in line with user needs will affect decision-making
processes and, more broadly, the role and structure of
government organisations
Service Design Most Australians have interacted with government
services in the past 12 months, but these interactions are
regarded as discrete, sporadic events
The experience of accessing different services from
multiple organisations has an impact on the public
engagement with, and trust in, government
Moving from a transaction-based service model to a
relationship and engagement-based model is likely to
significantly improve satisfaction with, and trust in,
government organisations
Service Delivery The vast majority of people’s interactions with government
occur either digitally or in person, with other channels
used as a ‘last resort’ mechanism
Australians have embraced the convenience of digital
channels, unless transactions are regarded as complex or
require attendance in person for identification
A Citizen Digital Identity could provide significant benefits e.g. streamlining the large number of transactions that currently
require ‘in person’ engagement
SO, HOW DO AUSTRALIANS INTERACT WITH GOVERNMENT?
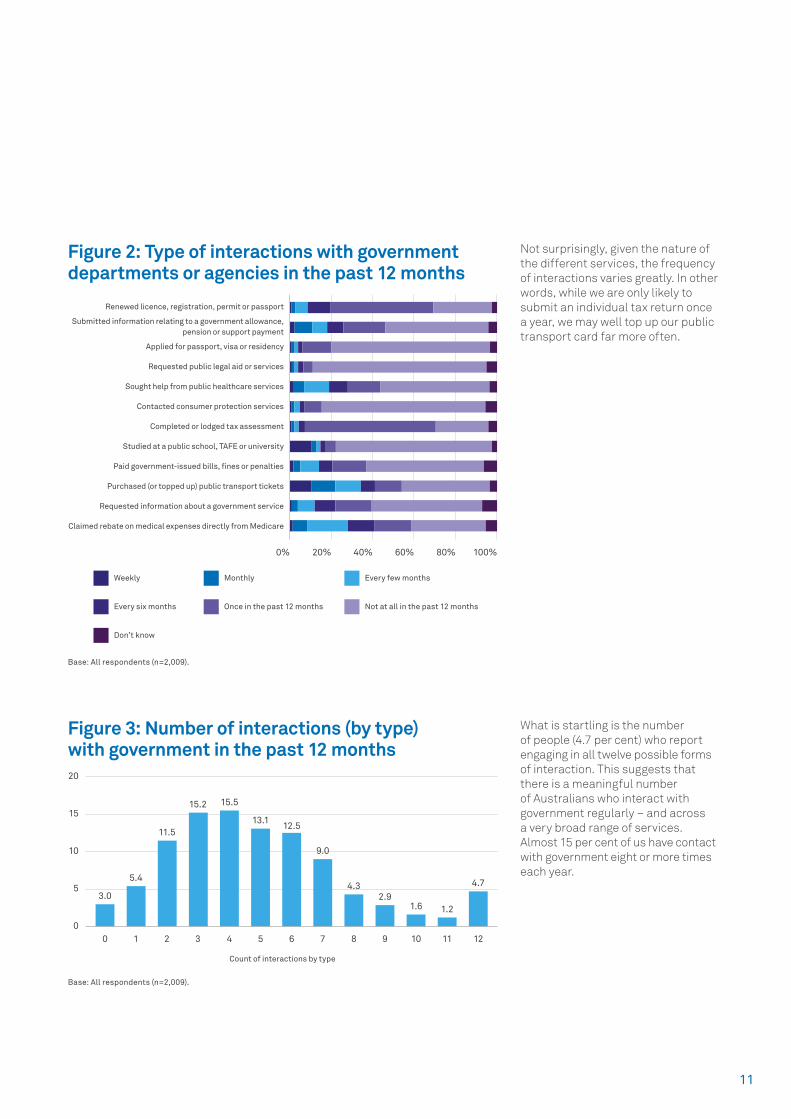
In this ground-breaking research, we measured the use of services provided by both federal and state government organisations.4 The top four (out of twelve options) included:
1) Medicare rebate claims;
2) purchasing or ‘topping up’ public transport tickets;
3) lodging a tax assessment; and
4) licence, and registration, permit or passport renewal.
While the diversity of government services – not to mention the differing needs of individuals – make it hard to generalise, it seems that over one year, the ‘typical’ Australian will renew some kind of licence, do their tax return, pay for public transport and claim at least one Medicare rebate. Almost all (97 per cent) people surveyed report that, in a 12-month period, either they, or someone in their family, took part in at least one of the twelve possible interactions.
4 Services were grouped into twelve categories (e.g. public transport) rather than by specific provider. This choice was validated in our research, which finds that the distinction between levels of government is increasingly blurred in the mind of the Australians seeking to access a particular service.
11
Base: All respondents (n=2,009).
Figure 2: Type of interactions with government departments or agencies in the past 12 months
Renewed licence, registration, permit or passport
Submitted information relating to a government allowance,pension or support payment
Applied for passport, visa or residency
Requested public legal aid or services
Sought help from public healthcare services
Contacted consumer protection services
Completed or lodged tax assessment
Studied at a public school, TAFE or university
Paid government-issued bills, �nes or penalties
Purchased (or topped up) public transport tickets
Requested information about a government service
Claimed rebate on medical expenses directly from Medicare
Weekly Monthly Every few months
Every six months Once in the past 12 months Not at all in the past 12 months
Don’t know
0% 20% 40% 60% 80% 100%
Not surprisingly, given the nature of the different services, the frequency of interactions varies greatly. In other words, while we are only likely to submit an individual tax return once a year, we may well top up our public transport card far more often.
What is startling is the number of people (4.7 per cent) who report engaging in all twelve possible forms of interaction. This suggests that there is a meaningful number of Australians who interact with government regularly – and across a very broad range of services. Almost 15 per cent of us have contact with government eight or more times each year.
Base: All respondents (n=2,009).
Figure 3: Number of interactions (by type) with government in the past 12 months20
15
10
5
0
3.0
0
5.4
1
11.5
2
15.2
3
15.5
4
13.1
5
12.5
6
9.0
7
4.3
8
2.9
9
1.6
10
1.2
11
4.7
12
Count of interactions by type
12
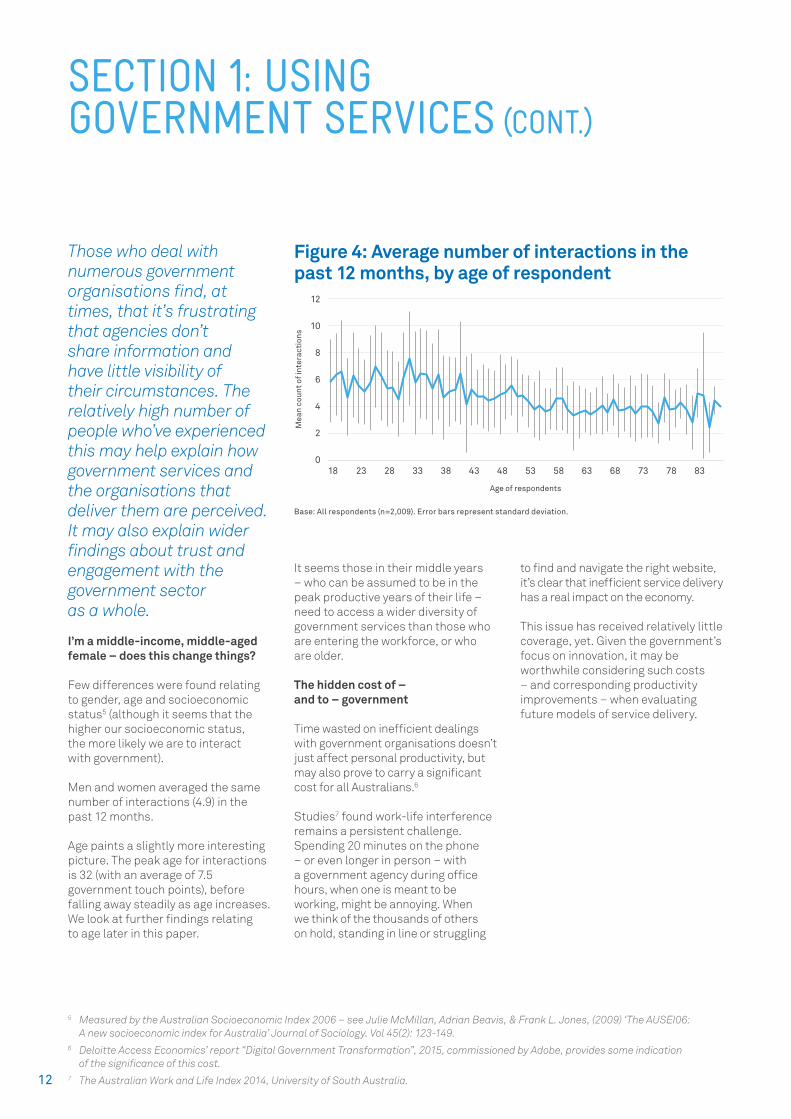
It seems those in their middle years – who can be assumed to be in the peak productive years of their life – need to access a wider diversity of government services than those who are entering the workforce, or who are older.
The hidden cost of – and to – government
Time wasted on inefficient dealings with government organisations doesn’t just affect personal productivity, but may also prove to carry a significant cost for all Australians.6
Studies7 found work-life interference remains a persistent challenge. Spending 20 minutes on the phone – or even longer in person – with a government agency during office hours, when one is meant to be working, might be annoying. When we think of the thousands of others on hold, standing in line or struggling
to find and navigate the right website, it’s clear that inefficient service delivery has a real impact on the economy.
This issue has received relatively little coverage, yet. Given the government’s focus on innovation, it may be worthwhile considering such costs – and corresponding productivity improvements – when evaluating future models of service delivery.
Those who deal with numerous government organisations find, at times, that it’s frustrating that agencies don’t share information and have little visibility of their circumstances. The relatively high number of people who’ve experienced this may help explain how government services and the organisations that deliver them are perceived. It may also explain wider findings about trust and engagement with the government sector as a whole.
I’m a middle-income, middle-aged female – does this change things?
Few differences were found relating to gender, age and socioeconomic status5 (although it seems that the higher our socioeconomic status, the more likely we are to interact with government).
Men and women averaged the same number of interactions (4.9) in the past 12 months.
Age paints a slightly more interesting picture. The peak age for interactions is 32 (with an average of 7.5 government touch points), before falling away steadily as age increases. We look at further findings relating to age later in this paper.
5 Measured by the Australian Socioeconomic Index 2006 – see Julie McMillan, Adrian Beavis, & Frank L. Jones, (2009) ‘The AUSEI06: A new socioeconomic index for Australia’ Journal of Sociology. Vol 45(2): 123-149.
6 Deloitte Access Economics’ report “Digital Government Transformation”, 2015, commissioned by Adobe, provides some indication of the significance of this cost.
7 The Australian Work and Life Index 2014, University of South Australia.
Figure 4: Average number of interactions in the past 12 months, by age of respondent
Mea
n co
unt o
f in
tera
ctio
ns
Age of respondents
12
10
8
6
4
2
018 23 28 33 38 43 48 53 58 63 68 73 78 83
Base: All respondents (n=2,009). Error bars represent standard deviation.
SECTION 1: USING GOVERNMENT SERVICES (CONT.)
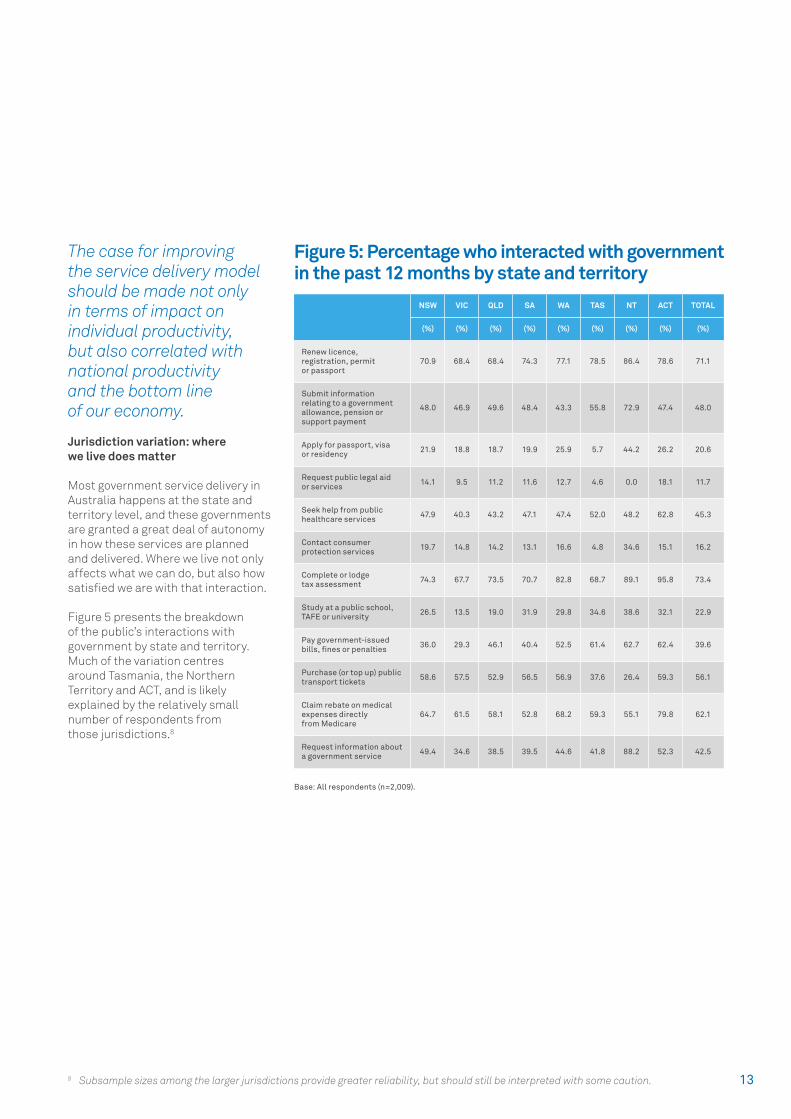
138 Subsample sizes among the larger jurisdictions provide greater reliability, but should still be interpreted with some caution.
Base: All respondents (n=2,009).
Figure 5: Percentage who interacted with government in the past 12 months by state and territory
The case for improving the service delivery model should be made not only in terms of impact on individual productivity, but also correlated with national productivity and the bottom line of our economy.
Jurisdiction variation: where we live does matter
Most government service delivery in Australia happens at the state and territory level, and these governments are granted a great deal of autonomy in how these services are planned and delivered. Where we live not only affects what we can do, but also how satisfied we are with that interaction.
Figure 5 presents the breakdown of the public’s interactions with government by state and territory. Much of the variation centres around Tasmania, the Northern Territory and ACT, and is likely explained by the relatively small number of respondents from those jurisdictions.8
NSW VIC QLD SA WA TAS NT ACT TOTAL
(%) (%) (%) (%) (%) (%) (%) (%) (%)
Renew licence, registration, permit or passport
70.9 68.4 68.4 74.3 77.1 78.5 86.4 78.6 71.1
Submit information relating to a government allowance, pension or support payment
48.0 46.9 49.6 48.4 43.3 55.8 72.9 47.4 48.0
Apply for passport, visa or residency 21.9 18.8 18.7 19.9 25.9 5.7 44.2 26.2 20.6
Request public legal aid or services 14.1 9.5 11.2 11.6 12.7 4.6 0.0 18.1 11.7
Seek help from public healthcare services 47.9 40.3 43.2 47.1 47.4 52.0 48.2 62.8 45.3
Contact consumer protection services 19.7 14.8 14.2 13.1 16.6 4.8 34.6 15.1 16.2
Complete or lodge tax assessment 74.3 67.7 73.5 70.7 82.8 68.7 89.1 95.8 73.4
Study at a public school, TAFE or university 26.5 13.5 19.0 31.9 29.8 34.6 38.6 32.1 22.9
Pay government-issued bills, fines or penalties 36.0 29.3 46.1 40.4 52.5 61.4 62.7 62.4 39.6
Purchase (or top up) public transport tickets 58.6 57.5 52.9 56.5 56.9 37.6 26.4 59.3 56.1
Claim rebate on medical expenses directly from Medicare
64.7 61.5 58.1 52.8 68.2 59.3 55.1 79.8 62.1
Request information about a government service 49.4 34.6 38.5 39.5 44.6 41.8 88.2 52.3 42.5
14
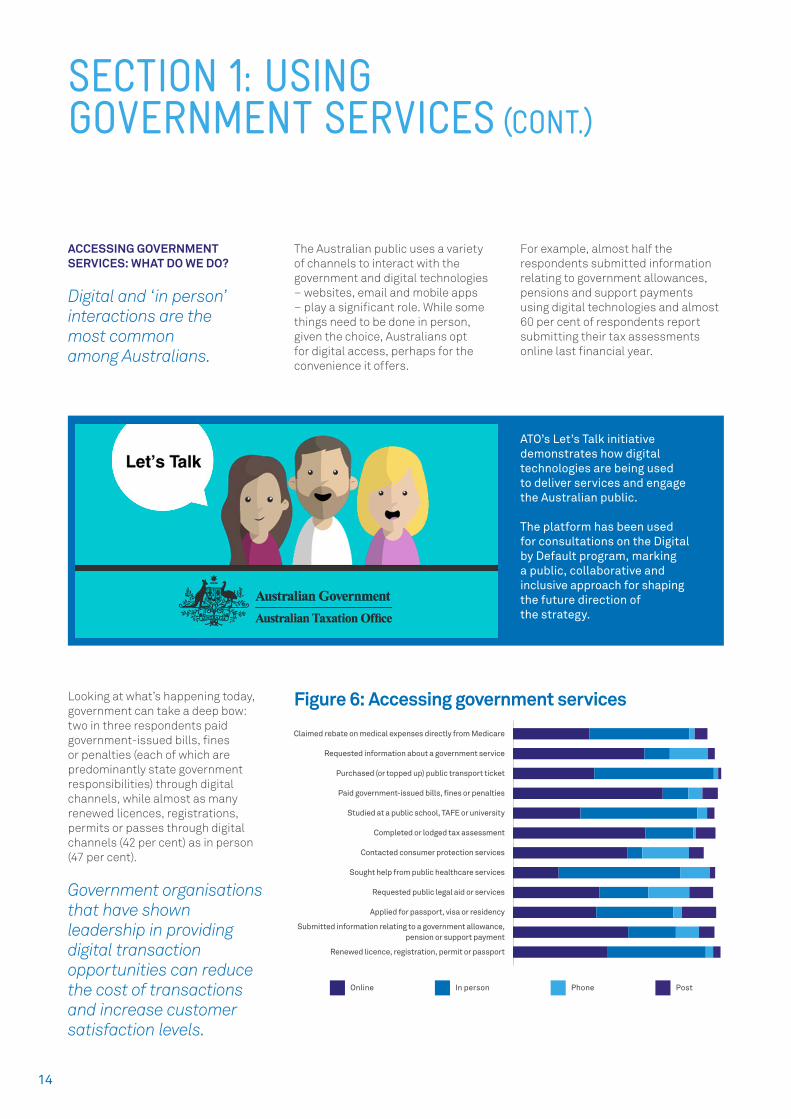
ACCESSING GOVERNMENT SERVICES: WHAT DO WE DO?
Digital and ‘in person’ interactions are the most common among Australians.
The Australian public uses a variety of channels to interact with the government and digital technologies – websites, email and mobile apps – play a significant role. While some things need to be done in person, given the choice, Australians opt for digital access, perhaps for the convenience it offers.
For example, almost half the respondents submitted information relating to government allowances, pensions and support payments using digital technologies and almost 60 per cent of respondents report submitting their tax assessments online last financial year.
SECTION 1: USING GOVERNMENT SERVICES (CONT.)
Claimed rebate on medical expenses directly from Medicare
Requested information about a government service
Purchased (or topped up) public transport ticket
Paid government-issued bills, �nes or penalties
Studied at a public school, TAFE or university
Completed or lodged tax assessment
Contacted consumer protection services
Sought help from public healthcare services
Requested public legal aid or services
Applied for passport, visa or residency
Submitted information relating to a government allowance,pension or support payment
Renewed licence, registration, permit or passport
Online In person Phone Post
Looking at what’s happening today, government can take a deep bow: two in three respondents paid government-issued bills, fines or penalties (each of which are predominantly state government responsibilities) through digital channels, while almost as many renewed licences, registrations, permits or passes through digital channels (42 per cent) as in person (47 per cent).
Government organisations that have shown leadership in providing digital transaction opportunities can reduce the cost of transactions and increase customer satisfaction levels.
ATO’s Let’s Talk initiative demonstrates how digital technologies are being used to deliver services and engage the Australian public.
The platform has been used for consultations on the Digital by Default program, marking a public, collaborative and inclusive approach for shaping the future direction of the strategy.
Figure 6: Accessing government services
15
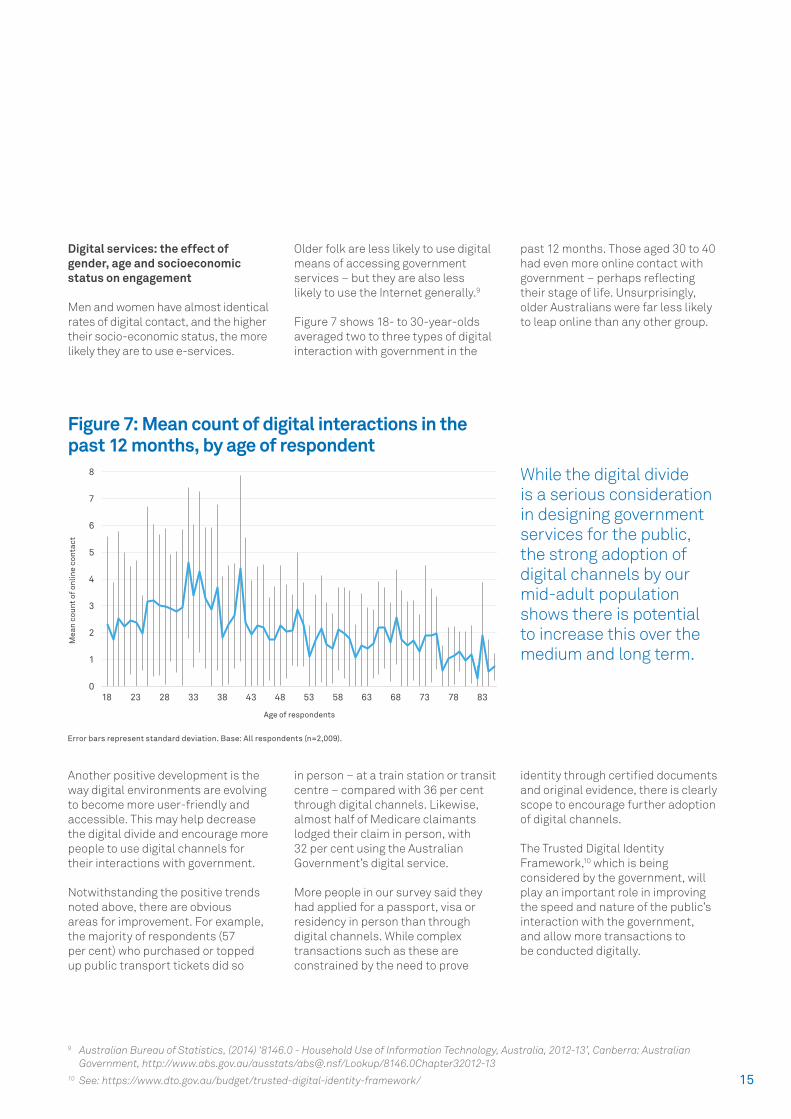
Digital services: the effect of gender, age and socioeconomic status on engagement
Men and women have almost identical rates of digital contact, and the higher their socio-economic status, the more likely they are to use e-services.
Older folk are less likely to use digital means of accessing government services – but they are also less likely to use the Internet generally.9
Figure 7 shows 18- to 30-year-olds averaged two to three types of digital interaction with government in the
past 12 months. Those aged 30 to 40 had even more online contact with government – perhaps reflecting their stage of life. Unsurprisingly, older Australians were far less likely to leap online than any other group.
9 Australian Bureau of Statistics, (2014) ‘8146.0 - Household Use of Information Technology, Australia, 2012-13’, Canberra: Australian Government, http://www.abs.gov.au/ausstats/[email protected]/Lookup/8146.0Chapter32012-13
10 See: https://www.dto.gov.au/budget/trusted-digital-identity-framework/
Mea
n co
unt o
f onl
ine
con
tact
Age of respondents
7
8
6
5
4
3
2
1
018 23 28 33 38 43 48 53 58 63 68 73 78 83
Error bars represent standard deviation. Base: All respondents (n=2,009).
Figure 7: Mean count of digital interactions in the past 12 months, by age of respondent
While the digital divide is a serious consideration in designing government services for the public, the strong adoption of digital channels by our mid-adult population shows there is potential to increase this over the medium and long term.
Another positive development is the way digital environments are evolving to become more user-friendly and accessible. This may help decrease the digital divide and encourage more people to use digital channels for their interactions with government.
Notwithstanding the positive trends noted above, there are obvious areas for improvement. For example, the majority of respondents (57 per cent) who purchased or topped up public transport tickets did so
in person – at a train station or transit centre – compared with 36 per cent through digital channels. Likewise, almost half of Medicare claimants lodged their claim in person, with 32 per cent using the Australian Government’s digital service.
More people in our survey said they had applied for a passport, visa or residency in person than through digital channels. While complex transactions such as these are constrained by the need to prove
identity through certified documents and original evidence, there is clearly scope to encourage further adoption of digital channels.
The Trusted Digital Identity Framework,10 which is being considered by the government, will play an important role in improving the speed and nature of the public’s interaction with the government, and allow more transactions to be conducted digitally.
16 11 Connected Government Program – Quantitative Research of the Australian Public, 2011-2015
SECTION 1: USING GOVERNMENT SERVICES (CONT.)
Requested information about a government service
Paid government-issued bills, �nes or penalties
Completed or lodged tax assessment
Sought help from public healthcare services
Applied for passport, visa or residency
Renewed licence, registration, permit or passport
Mobile app Email Website
0 10 20 30 40 50 60 70
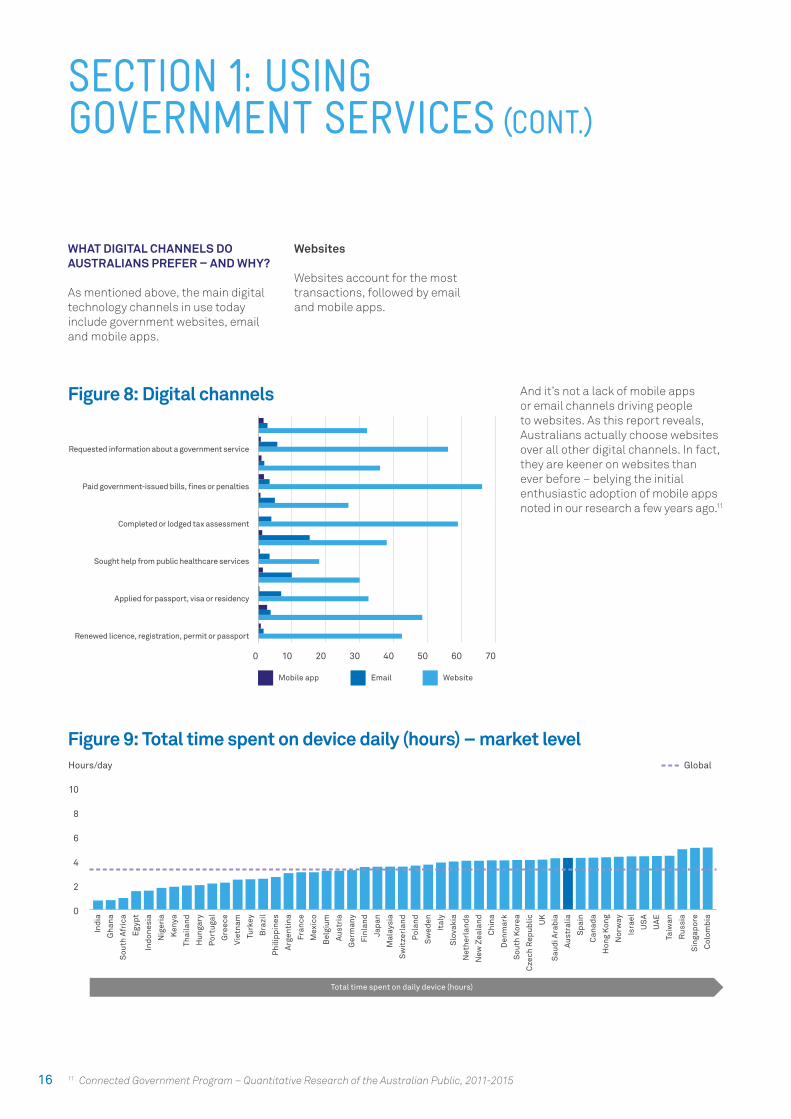
WHAT DIGITAL CHANNELS DO AUSTRALIANS PREFER – AND WHY?
As mentioned above, the main digital technology channels in use today include government websites, email and mobile apps.
Websites
Websites account for the most transactions, followed by email and mobile apps.
And it’s not a lack of mobile apps or email channels driving people to websites. As this report reveals, Australians actually choose websites over all other digital channels. In fact, they are keener on websites than ever before – belying the initial enthusiastic adoption of mobile apps noted in our research a few years ago.11
Figure 8: Digital channels
Ind
ia
Gha
na
Sou
th A
fric
a
Egy
pt
Ind
ones
ia
Nig
eria
Ken
ya
Thai
lan
d
Hun
gary
Por
tuga
l
Gre
ece
Vie
tnam
Turk
ey
Bra
zil
Phi
lipp
ines
Arg
enti
na
Fran
ce
Mex
ico
Bel
gium
Aus
tria
Ger
man
y
Fin
lan
d
Jap
an
Mal
aysi
a
Sw
itze
rlan
d
Pol
and
Sw
eden
Ital
y
Slo
vaki
a
Net
her
land
s
New
Zea
lan
d
Chi
na
Den
mar
k
Sou
th K
orea
Cze
ch R
epub
lic UK
Sau
di A
rab
ia
Aus
tral
ia
Sp
ain
Can
ada
Hon
g K
ong
Nor
way
Isra
el
US
A
UA
E
Taiw
an
Rus
sia
Sin
gap
ore
Col
omb
ia
Hours/day Global
10
8
6
4
2
0
Total time spent on daily device (hours)
Figure 9: Total time spent on device daily (hours) – market level
17
There is a direct correlation between the public’s choice of digital technology to interact with government and their broader use of technology. In a typical day, Australians spend around four hours and 19 minutes on their various devices.12 As a nation, we search for information online several times a day. It’s a routine activity.
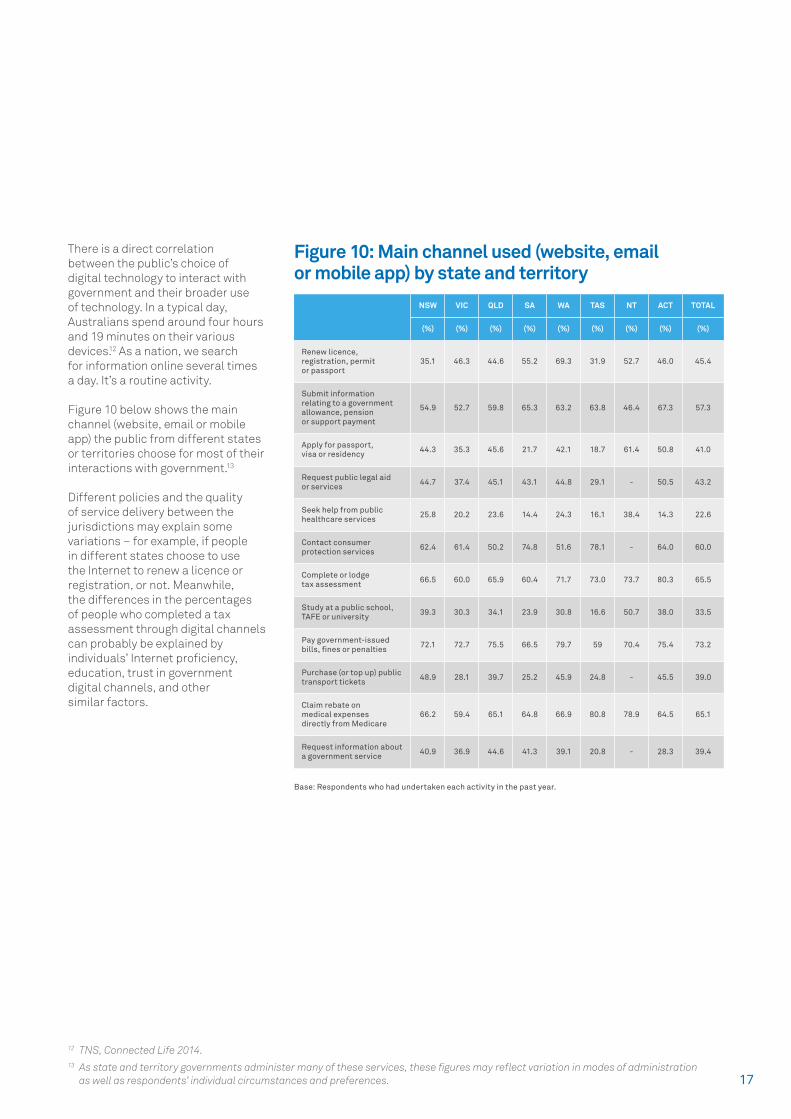
Figure 10 below shows the main channel (website, email or mobile app) the public from different states or territories choose for most of their interactions with government.13
Different policies and the quality of service delivery between the jurisdictions may explain some variations – for example, if people in different states choose to use the Internet to renew a licence or registration, or not. Meanwhile, the differences in the percentages of people who completed a tax assessment through digital channels can probably be explained by individuals’ Internet proficiency, education, trust in government digital channels, and other similar factors.
12 TNS, Connected Life 2014. 13 As state and territory governments administer many of these services, these figures may reflect variation in modes of administration
as well as respondents’ individual circumstances and preferences.
Base: Respondents who had undertaken each activity in the past year.
Figure 10: Main channel used (website, email or mobile app) by state and territory
NSW VIC QLD SA WA TAS NT ACT TOTAL
(%) (%) (%) (%) (%) (%) (%) (%) (%)
Renew licence, registration, permit or passport
35.1 46.3 44.6 55.2 69.3 31.9 52.7 46.0 45.4
Submit information relating to a government allowance, pension or support payment
54.9 52.7 59.8 65.3 63.2 63.8 46.4 67.3 57.3
Apply for passport, visa or residency 44.3 35.3 45.6 21.7 42.1 18.7 61.4 50.8 41.0
Request public legal aid or services 44.7 37.4 45.1 43.1 44.8 29.1 - 50.5 43.2
Seek help from public healthcare services 25.8 20.2 23.6 14.4 24.3 16.1 38.4 14.3 22.6
Contact consumer protection services 62.4 61.4 50.2 74.8 51.6 78.1 - 64.0 60.0
Complete or lodge tax assessment 66.5 60.0 65.9 60.4 71.7 73.0 73.7 80.3 65.5
Study at a public school, TAFE or university 39.3 30.3 34.1 23.9 30.8 16.6 50.7 38.0 33.5
Pay government-issued bills, fines or penalties 72.1 72.7 75.5 66.5 79.7 59 70.4 75.4 73.2
Purchase (or top up) public transport tickets 48.9 28.1 39.7 25.2 45.9 24.8 - 45.5 39.0
Claim rebate on medical expenses directly from Medicare
66.2 59.4 65.1 64.8 66.9 80.8 78.9 64.5 65.1
Request information about a government service 40.9 36.9 44.6 41.3 39.1 20.8 - 28.3 39.4
18
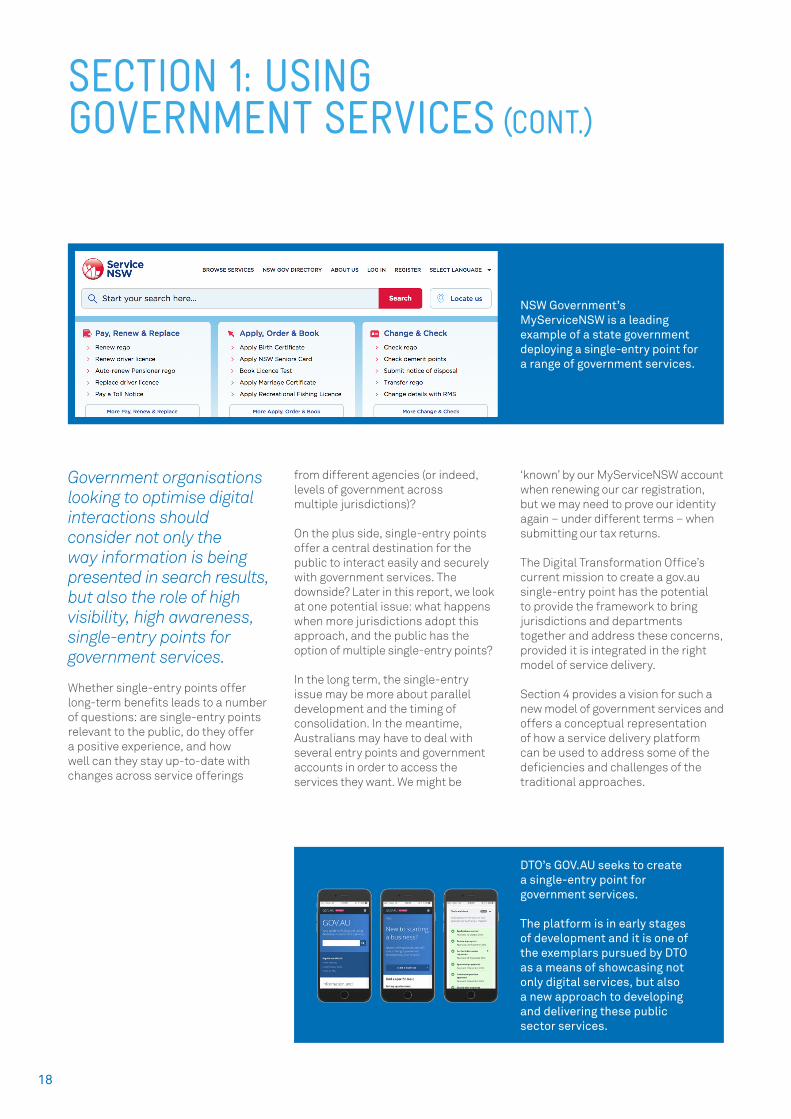
Government organisations looking to optimise digital interactions should consider not only the way information is being presented in search results, but also the role of high visibility, high awareness, single-entry points for government services.
Whether single-entry points offer long-term benefits leads to a number of questions: are single-entry points relevant to the public, do they offer a positive experience, and how well can they stay up-to-date with changes across service offerings
from different agencies (or indeed, levels of government across multiple jurisdictions)?
On the plus side, single-entry points offer a central destination for the public to interact easily and securely with government services. The downside? Later in this report, we look at one potential issue: what happens when more jurisdictions adopt this approach, and the public has the option of multiple single-entry points?
In the long term, the single-entry issue may be more about parallel development and the timing of consolidation. In the meantime, Australians may have to deal with several entry points and government accounts in order to access the services they want. We might be
‘known’ by our MyServiceNSW account when renewing our car registration, but we may need to prove our identity again – under different terms – when submitting our tax returns.
The Digital Transformation Office’s current mission to create a gov.au single-entry point has the potential to provide the framework to bring jurisdictions and departments together and address these concerns, provided it is integrated in the right model of service delivery.
Section 4 provides a vision for such a new model of government services and offers a conceptual representation of how a service delivery platform can be used to address some of the deficiencies and challenges of the traditional approaches.
SECTION 1: USING GOVERNMENT SERVICES (CONT.)
NSW Government’s MyServiceNSW is a leading example of a state government deploying a single-entry point for a range of government services.
DTO’s GOV.AU seeks to create a single-entry point for government services.
The platform is in early stages of development and it is one of the exemplars pursued by DTO as a means of showcasing not only digital services, but also a new approach to developing and delivering these public sector services.

19
Email is the second most popular choice of the Australian public. It is primarily seen as a channel for follow-up activities after an initial government service interaction, as it allows either party to provide additional information and documentation.
A number of government organisations have attempted to use email as an alternative to more
real-time engagement channels, such as call centres and online chat. These attempts have been less successful than expected, mainly due to long turnaround times compared with real-time channels, and the need to clarify information provided in the course of communication.
Apps
Over the last five years, the number of apps developed by public sector organisations has grown significantly.
Given our reliance on mobile devices and apps, public sector organisations have sought to leverage the popularity of this channel of delivery. Unfortunately, the bar is usually set higher for government organisations compared with the private sector. In the private sector, the use of services is usually voluntary and generally there are a number of alternatives. However, in the public sector, the need to accommodate a huge range of needs across multiple platforms make mobile apps a significant effort.
In our increasingly mobile world, trends evolve very fast. The popularity of apps has attracted a significant number of developers – individuals and organisations – all vying for screen real estate. The result is a significant level of competition – and innovation – in the app market. In July 2015, the leading app stores (Google and Apple) listed over 1.5 million apps.14
As a result, users have become very selective in terms of the apps that are granted room on their devices. If an app doesn’t prove useful, it’s swiftly dumped.
Apps are seen to provide more value when repeated transactions occur, when information provided is held by the app to avoid repeat input effort, and when it offers a superior user experience compared with competing digital channels (in particular, the website of the provider). That said, websites are often more easily accessible – especially from a search result – and tend to work across all platforms, whereas the apps may not be available or the same, depending on the platform used (e.g. Apple versus Android).
The success rate of apps provided by government organisations closely reflects this correlation.
How Australians perceive the apps provided by government organisations is covered in more detail in the next section of this report.
14 http://www.statista.com/statistics/276623/number-of-apps-available-in-leading-app-stores/
In February 2016, Australia.gov.au listed 98 apps developed by public sector organisations, up from 71 the year before.
Amongst them, the suite of Express Plus apps developed by the Department of Human Services is one of the most comprehensive.
The suite provides dedicated apps for students, job seekers, seniors and families, as well as dedicated apps for major services such as Medicare, Centrelink and Child Support.
20
DISCRETE DIGITAL SERVICES
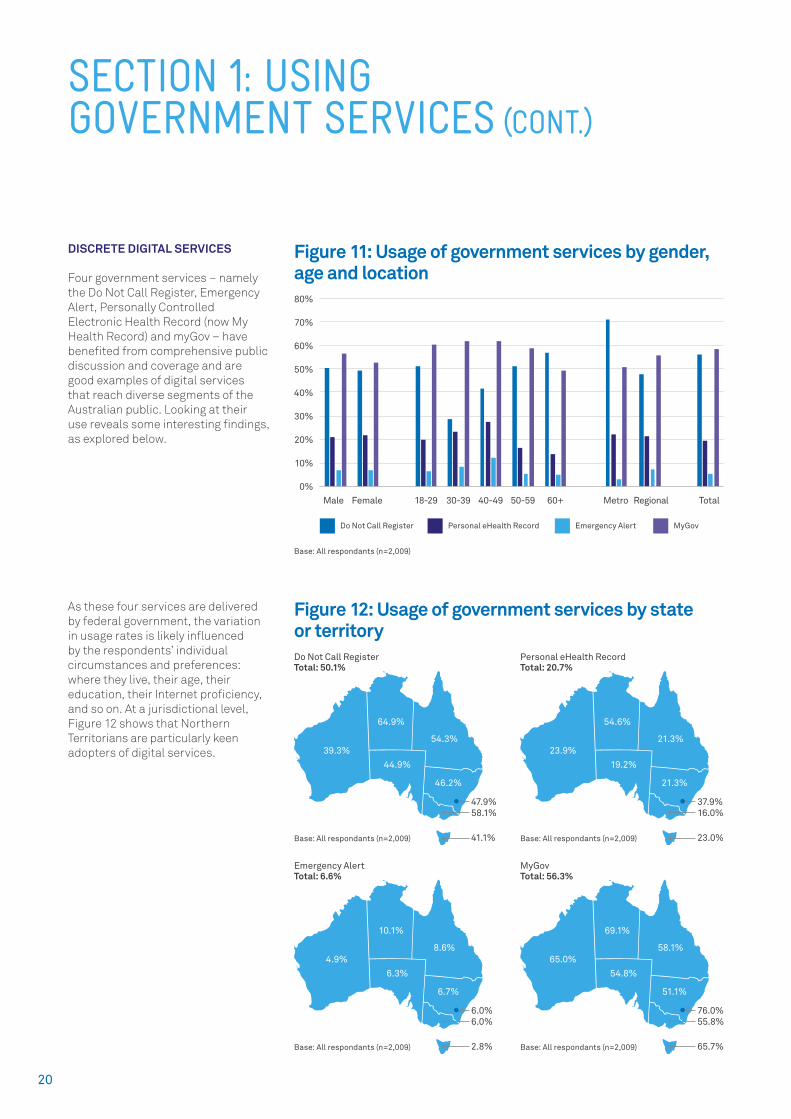
Four government services – namely the Do Not Call Register, Emergency Alert, Personally Controlled Electronic Health Record (now My Health Record) and myGov – have benefited from comprehensive public discussion and coverage and are good examples of digital services that reach diverse segments of the Australian public. Looking at their use reveals some interesting findings, as explored below.
SECTION 1: USING GOVERNMENT SERVICES (CONT.)
Figure 11: Usage of government services by gender, age and location
As these four services are delivered by federal government, the variation in usage rates is likely influenced by the respondents’ individual circumstances and preferences: where they live, their age, their education, their Internet proficiency, and so on. At a jurisdictional level, Figure 12 shows that Northern Territorians are particularly keen adopters of digital services.
Figure 12: Usage of government services by state or territory
Do Not Call Register Personal eHealth Record Emergency Alert MyGov
Male Female 18-29 30-39 40-49 50-59 60+ Metro Regional Total
80%
70%
60%
50%
40%
30%
20%
10%
0%
Base: All respondants (n=2,009)
Do Not Call RegisterTotal: 50.1%
Base: All respondants (n=2,009)
39.3%
64.9%
44.9%
54.3%
46.2%
47.9%58.1%
41.1%
Emergency AlertTotal: 6.6%
Base: All respondants (n=2,009)
4.9%
10.1%
6.3%
8.6%
6.7%
6.0%6.0%
2.8%
Personal eHealth RecordTotal: 20.7%
Base: All respondants (n=2,009)
23.9%
54.6%
19.2%
21.3%
21.3%
37.9%16.0%
23.0%
MyGovTotal: 56.3%
Base: All respondants (n=2,009)
65.0%
69.1%
54.8%
58.1%
51.1%
76.0%55.8%
65.7%
21
It seems likely that these figures reflect the advantages of digital services for those living in remote locations, such as parts of the Northern Territory and Western Australia, where popping down to a departmental office is not an option. It would be worth exploring this issue further.
In 2015, less than one in four of us around the nation had opted-in for a Personally Controlled Electronic Health Record, the precursor of My
Health Record. Those who have are also younger than policymakers may have hoped: 30 per cent of respondents aged between 30 and 39 have used the service, compared with 15 per cent between 50 and 59, and 23 per cent of respondents aged 60 and over.
Older respondents were more likely to have signed up to the ‘Do Not Call’ register to avoid receiving telemarketing phone calls. This may reflect the fact older Australians
are more likely to have landlines, and thus more likely to receive unsolicited calls.
The number of interactions with the Emergency Alert system – i.e. numbers of people who had received an alert in the 12 months prior – reflects where people live in relation to the areas where alerts have been issued, as well as the number of alerts over that time.
Usage of MyGov, the Australian Government’s portal for a range of services including Medicare, the Australian Taxation Office, Centrelink and the Child Support Agency, was high at 56 per cent of respondents. This is likely due to the need to register for MyGov in order to use the Australian Government’s ‘eTax’ system to submit our individual tax assessments online. MyGov usage is highest amongst females, and those aged 49 and younger.
Australians’ high usage of myGov appears to validate the premise that single-entry points have an advantage in delivering government services.
MyGov will offer substantial insights into the complexity, effort and costs of delivering the technical reliability, user accessibility and security standards expected of a platform of this nature. Nevertheless, while financial, technical and service
specifications make the task of evaluating a government-provided service platform easier, it’s how people feel about the experience that determines the success or failure of a government service to provide public value.
The next section of our report examines the perceptions and preferences of the Australian public regarding the services provided by the government, while Section 3 turns the spotlight on the future: what Australians want to see next and how their expectations could be met.
22
SECTION 2: PREFERENCES AND PERCEPTIONS: WHAT DO WE THINK AND WHAT DO WE WANT FROM OUR GOVERNMENT SERVICES?
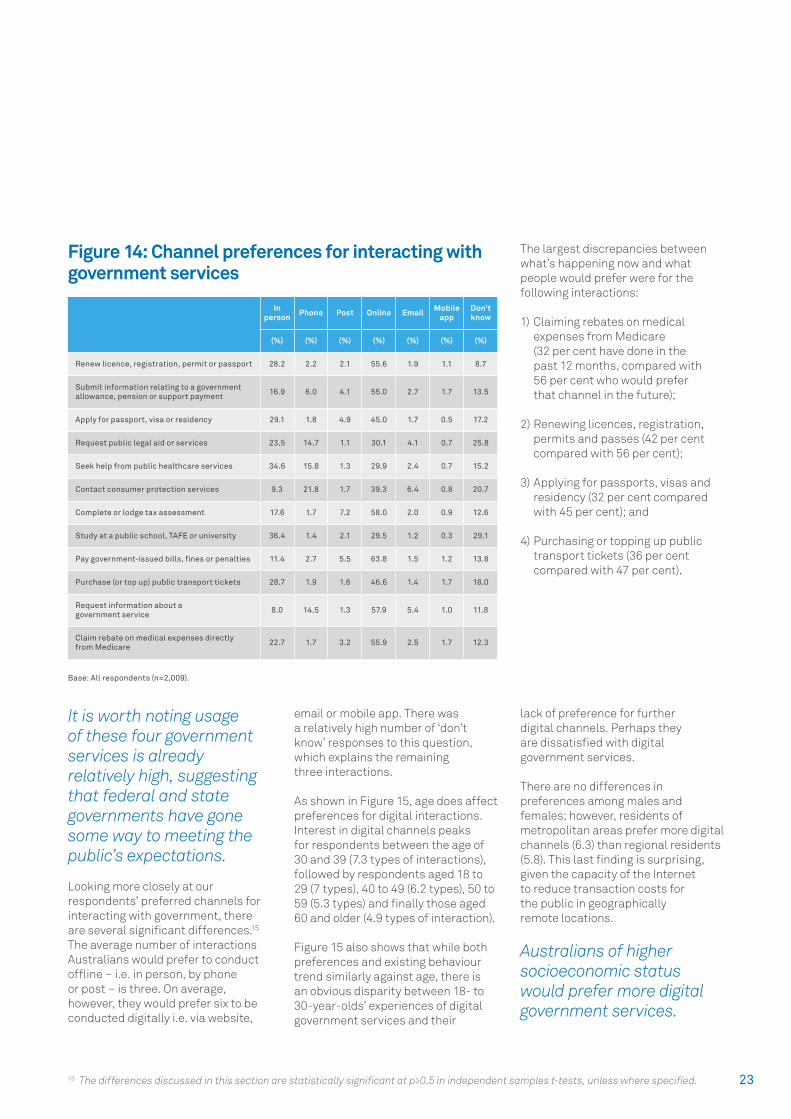
PREFERENCES FOR INTERACTION: WHAT WE WANT
While most respondents’ interactions with government are split almost evenly between in-person and digital, they would prefer to conduct more government business digitally (see Figure 14).
Of the 12 interactions listed, most people would prefer only two of these to be conducted offline: seeking help from public healthcare services, and studying at a public school, TAFE or university. Considering the personal nature of healthcare provision, it is perhaps surprising that as many as 30 per cent would prefer future interactions to happen digitally.
Hindsight Insight Foresight
Policy There is overwhelming expectation of improvements
and support for digital initiatives among the
Australian public
Coordination, alignment and integration across jurisdictions
and sectors can provide a better, more effective and
efficient service experience for Australians
Innovation, transformation and digital initiatives delivering an
approach that reflects the expectations of the public can
provide a visible measure of providers’ engagement and performance improvements
Service Design When comparing services, respondents favour the private
sector over the public sector, and state-based providers
over federal ones
In addition to service quality, the frequency of interactions
and familiarity with interaction channels contribute towards
setting both expectations and perceptions of performance
Designing service models that accommodate integrated
provision across organisations, jurisdictions and sectors can
provide significant performance, quality and
cognitive improvements for the Australian public
Service Delivery The Australian public expresses a strong preference
for digital service channels as the interaction mode of choice for the future
Time-savings and universal accessibility considerations
play an important role in shaping the expectations of the
public for the future
A modular, digitally-enabled and integrated service
platform across service providers can deliver the
accessibility, time and financial savings expected of
government services
KEY FINDINGS
Figure 13: At a glance
23
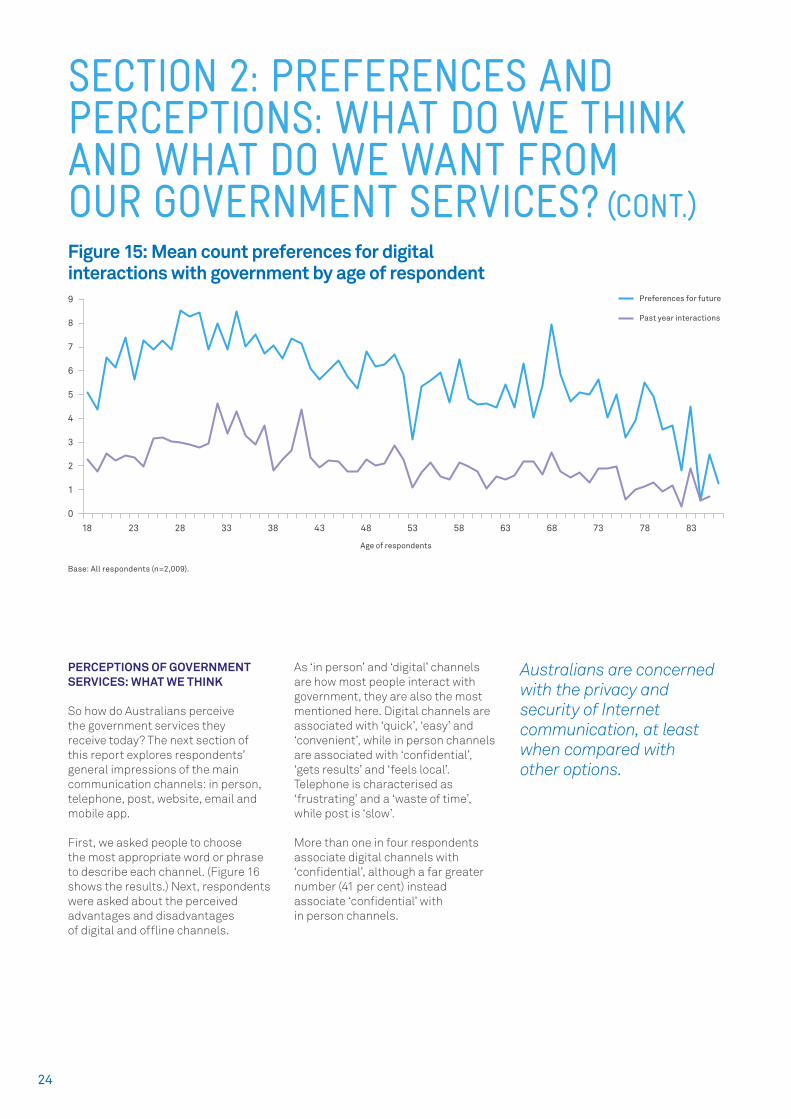
It is worth noting usage of these four government services is already relatively high, suggesting that federal and state governments have gone some way to meeting the public’s expectations.
Looking more closely at our respondents’ preferred channels for interacting with government, there are several significant differences.15 The average number of interactions Australians would prefer to conduct offline – i.e. in person, by phone or post – is three. On average, however, they would prefer six to be conducted digitally i.e. via website,
email or mobile app. There was a relatively high number of ‘don’t know’ responses to this question, which explains the remaining three interactions.
As shown in Figure 15, age does affect preferences for digital interactions. Interest in digital channels peaks for respondents between the age of 30 and 39 (7.3 types of interactions), followed by respondents aged 18 to 29 (7 types), 40 to 49 (6.2 types), 50 to 59 (5.3 types) and finally those aged 60 and older (4.9 types of interaction).
Figure 15 also shows that while both preferences and existing behaviour trend similarly against age, there is an obvious disparity between 18- to 30-year-olds’ experiences of digital government services and their
lack of preference for further digital channels. Perhaps they are dissatisfied with digital government services.
There are no differences in preferences among males and females; however, residents of metropolitan areas prefer more digital channels (6.3) than regional residents (5.8). This last finding is surprising, given the capacity of the Internet to reduce transaction costs for the public in geographically remote locations.
Australians of higher socioeconomic status would prefer more digital government services.
15 The differences discussed in this section are statistically significant at p>0.5 in independent samples t-tests, unless where specified.
Figure 14: Channel preferences for interacting with government services
The largest discrepancies between what’s happening now and what people would prefer were for the following interactions:
1) Claiming rebates on medical expenses from Medicare (32 per cent have done in the past 12 months, compared with 56 per cent who would prefer that channel in the future);
2) Renewing licences, registration, permits and passes (42 per cent compared with 56 per cent);
3) Applying for passports, visas and residency (32 per cent compared with 45 per cent); and
4) Purchasing or topping up public transport tickets (36 per cent compared with 47 per cent).
In person Phone Post Online Email Mobile
appDon’t know
(%) (%) (%) (%) (%) (%) (%)
Renew licence, registration, permit or passport 28.2 2.2 2.1 55.6 1.9 1.1 8.7
Submit information relating to a government allowance, pension or support payment 16.9 6.0 4.1 55.0 2.7 1.7 13.5
Apply for passport, visa or residency 29.1 1.8 4.9 45.0 1.7 0.5 17.2
Request public legal aid or services 23.5 14.7 1.1 30.1 4.1 0.7 25.8
Seek help from public healthcare services 34.6 15.8 1.3 29.9 2.4 0.7 15.2
Contact consumer protection services 9.3 21.8 1.7 39.3 6.4 0.8 20.7
Complete or lodge tax assessment 17.6 1.7 7.2 58.0 2.0 0.9 12.6
Study at a public school, TAFE or university 36.4 1.4 2.1 29.5 1.2 0.3 29.1
Pay government-issued bills, fines or penalties 11.4 2.7 5.5 63.8 1.5 1.2 13.8
Purchase (or top up) public transport tickets 28.7 1.9 1.6 46.6 1.4 1.7 18.0
Request information about a government service 8.0 14.5 1.3 57.9 5.4 1.0 11.8
Claim rebate on medical expenses directly from Medicare 22.7 1.7 3.2 55.9 2.5 1.7 12.3
Base: All respondents (n=2,009).
24
PERCEPTIONS OF GOVERNMENT SERVICES: WHAT WE THINK
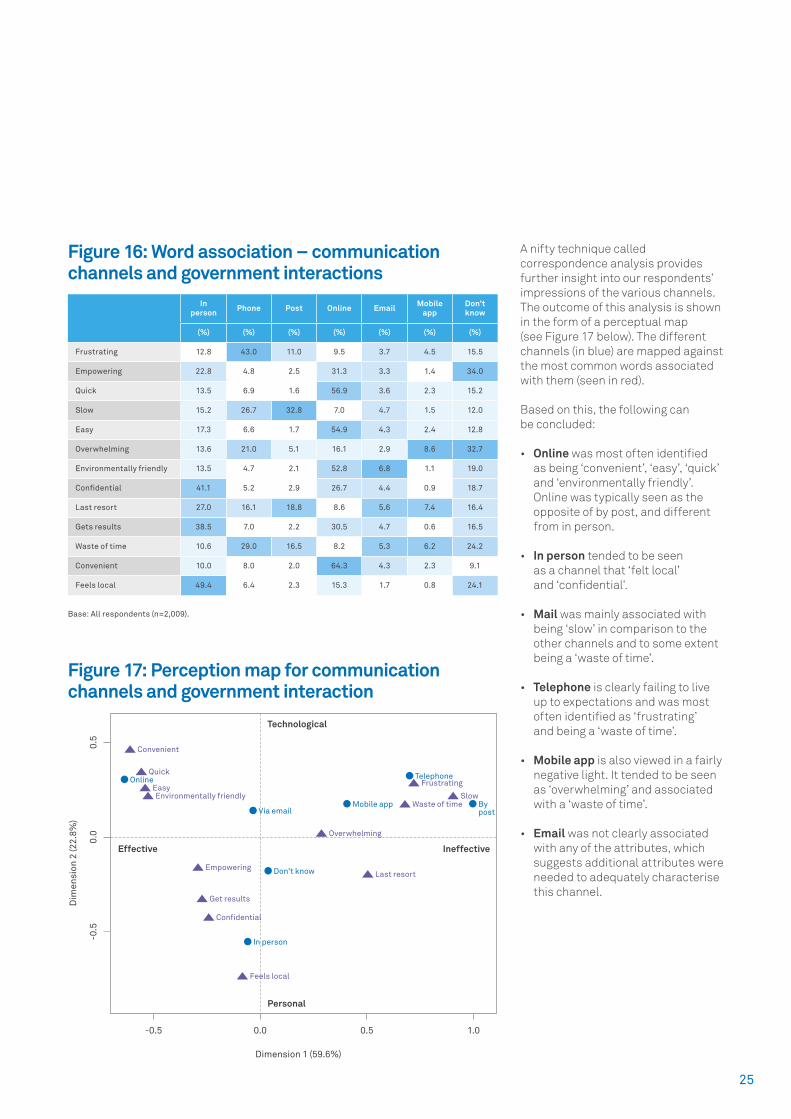
So how do Australians perceive the government services they receive today? The next section of this report explores respondents’ general impressions of the main communication channels: in person, telephone, post, website, email and mobile app.
First, we asked people to choose the most appropriate word or phrase to describe each channel. (Figure 16 shows the results.) Next, respondents were asked about the perceived advantages and disadvantages of digital and offline channels.
As ‘in person’ and ‘digital’ channels are how most people interact with government, they are also the most mentioned here. Digital channels are associated with ‘quick’, ‘easy’ and ‘convenient’, while in person channels are associated with ‘confidential’, ‘gets results’ and ‘feels local’. Telephone is characterised as ‘frustrating’ and a ‘waste of time’, while post is ‘slow’.
More than one in four respondents associate digital channels with ‘confidential’, although a far greater number (41 per cent) instead associate ‘confidential’ with in person channels.
Australians are concerned with the privacy and security of Internet communication, at least when compared with other options.
SECTION 2: PREFERENCES AND PERCEPTIONS: WHAT DO WE THINK AND WHAT DO WE WANT FROM OUR GOVERNMENT SERVICES? (CONT.)
Age of respondents
7
9
8
6
5
4
3
2
1
0
23 28 33 38 43 48 53 58 63 68 73 78 83
Preferences for future
Past year interactions
18
Base: All respondents (n=2,009).
Figure 15: Mean count preferences for digital interactions with government by age of respondent
25
Dimension 1 (59.6%)
Effective
Technological
Personal
Ineffective
Dim
ensi
on 2
(22.
8%)
-0.5 0.0 0.5 1.0
-0.5
0.0
0.5
Last resortDon’t knowEmpowering
In person
Get results
Via email
Con�dential
Telephone
Feels local
Mobile app
Overwhelming
By post
Convenient
OnlineQuick
EasyEnvironmentally friendly
Frustrating
Waste of timeSlow
Figure 17: Perception map for communication channels and government interaction
A nifty technique called correspondence analysis provides further insight into our respondents’ impressions of the various channels. The outcome of this analysis is shown in the form of a perceptual map (see Figure 17 below). The different channels (in blue) are mapped against the most common words associated with them (seen in red).
Based on this, the following can be concluded:
• Online was most often identified as being ‘convenient’, ‘easy’, ‘quick’ and ‘environmentally friendly’. Online was typically seen as the opposite of by post, and different from in person.
• In person tended to be seen as a channel that ‘felt local’ and ‘confidential’.
• Mail was mainly associated with being ‘slow’ in comparison to the other channels and to some extent being a ‘waste of time’.
• Telephone is clearly failing to live up to expectations and was most often identified as ‘frustrating’ and being a ‘waste of time’.
• Mobile app is also viewed in a fairly negative light. It tended to be seen as ‘overwhelming’ and associated with a ‘waste of time’.
• Email was not clearly associated with any of the attributes, which suggests additional attributes were needed to adequately characterise this channel.
Figure 16: Word association – communication channels and government interactions
Base: All respondents (n=2,009).
In person Phone Post Online Email Mobile
appDon’t know
(%) (%) (%) (%) (%) (%) (%)
Frustrating 12.8 43.0 11.0 9.5 3.7 4.5 15.5
Empowering 22.8 4.8 2.5 31.3 3.3 1.4 34.0
Quick 13.5 6.9 1.6 56.9 3.6 2.3 15.2
Slow 15.2 26.7 32.8 7.0 4.7 1.5 12.0
Easy 17.3 6.6 1.7 54.9 4.3 2.4 12.8
Overwhelming 13.6 21.0 5.1 16.1 2.9 8.6 32.7
Environmentally friendly 13.5 4.7 2.1 52.8 6.8 1.1 19.0
Confidential 41.1 5.2 2.9 26.7 4.4 0.9 18.7
Last resort 27.0 16.1 18.8 8.6 5.6 7.4 16.4
Gets results 38.5 7.0 2.2 30.5 4.7 0.6 16.5
Waste of time 10.6 29.0 16.5 8.2 5.3 6.2 24.2
Convenient 10.0 8.0 2.0 64.3 4.3 2.3 9.1
Feels local 49.4 6.4 2.3 15.3 1.7 0.8 24.1
26
Perceptions of digital priority: what’s most important to Australians
Respondents were also asked how high a priority it should be for government departments, agencies and services to invest in making information and services available over the Internet (including email and mobile apps). There is overwhelming support for digital government initiatives among Australians, in principle: five per cent of respondents believe it a ‘very low’ or ‘low’ priority, 23 per cent a ‘medium’ priority, 37 per cent a ‘high’ priority, and 22 per cent a ‘very high’ priority. A further 13 per cent responded that they do not know.
Following this question, respondents were prompted to explain why they
believe digital government initiatives are a priority (or otherwise). More than one in four respondents advised digital services are easier to access and use than other channels (Figure 19). Similarly, 15 per cent felt they provide faster service, saving them time. The same number responded that providing information online has become the norm in customer service. Almost four per cent expressed concern that digital government services are a waste of public money, and the same number reported that they have difficulty accessing or using the Internet.
Smaller numbers of respondents responded they have privacy or security concerns, don’t like to use the Internet, and services are ‘fine the way they are’.
SECTION 2: PREFERENCES AND PERCEPTIONS: WHAT DO WE THINK AND WHAT DO WE WANT FROM OUR GOVERNMENT SERVICES? (CONT.)
Mea
n re
spon
se (1
-5 s
cale
)
Age of respondents
4.5
4
3.5
3
2.5
2
18 23 28 33 38 43 48 53 58 63 68 73 78 83
Satisfaction
Priority
Base: Respondents who have used digital government services (n=1,731).
Figure 18: Mean satisfaction and priority for digital interactions with government by age of respondent
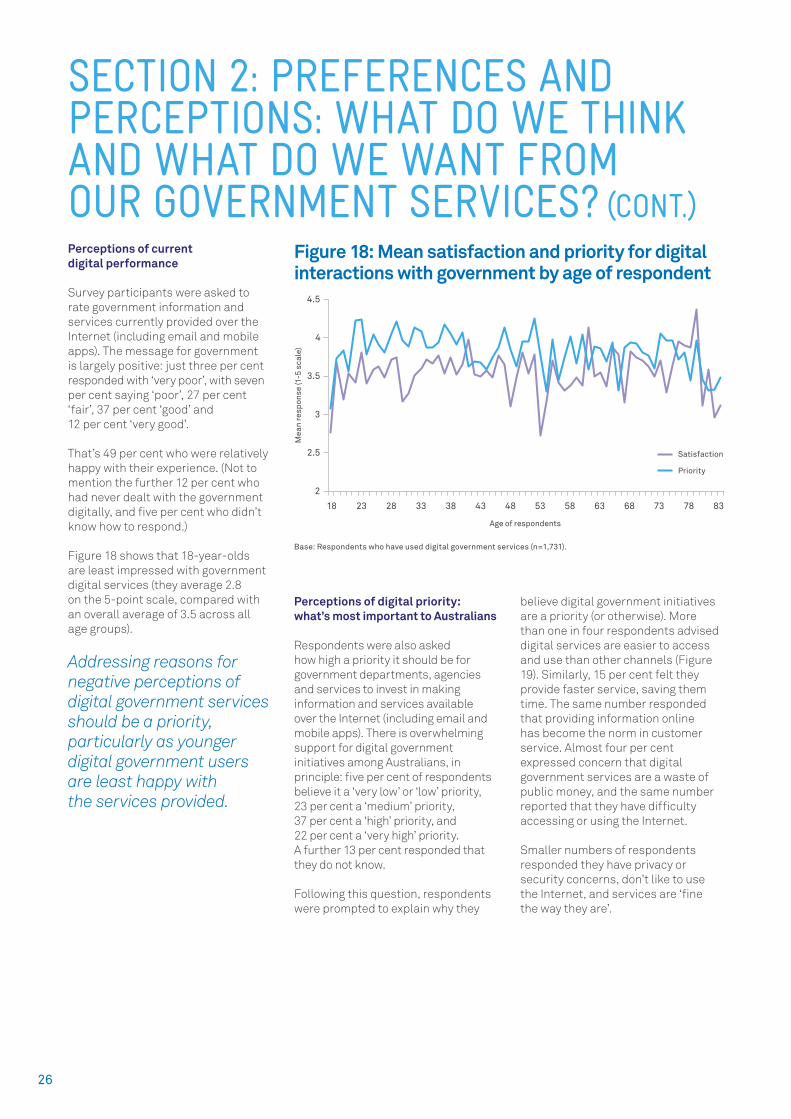
Perceptions of current digital performance
Survey participants were asked to rate government information and services currently provided over the Internet (including email and mobile apps). The message for government is largely positive: just three per cent responded with ‘very poor’, with seven per cent saying ‘poor’, 27 per cent ‘fair’, 37 per cent ‘good’ and 12 per cent ‘very good’.
That’s 49 per cent who were relatively happy with their experience. (Not to mention the further 12 per cent who had never dealt with the government digitally, and five per cent who didn’t know how to respond.)
Figure 18 shows that 18-year-olds are least impressed with government digital services (they average 2.8 on the 5-point scale, compared with an overall average of 3.5 across all age groups).
Addressing reasons for negative perceptions of digital government services should be a priority, particularly as younger digital government users are least happy with the services provided.

27
In person Phone Post Online Email Mobile
app
(%) (%) (%) (%) (%) (%)
Government much worse than private 8.2 10.1 4.8 4.1 4.7 4.0
Government worse than private 20.8 21.6 13.3 15.7 16.6 12.1
About the same 42.1 41.3 48.1 47.4 44.1 24.9
Government better than private 10.5 9.5 9.2 11.5 9.0 5.3
Government much better than private 4.8 3.1 3.6 3.8 3.3 2.8
Not applicable 2.4 2.9 4.2 3.9 5.0 20.5
Don’t know 11.2 11.5 16.9 13.7 17.3 30.4
Sector and jurisdiction comparisons: how does government shape up?
Further insights have been gleaned by asking respondents to compare their experiences dealing with the private sector, federal government and state government through a range of channels.
When comparing government generally with private sector services, respondents are more favourable towards the private sector, although a large number report no difference between the two (see Figure 20).
Government service providers receive their worst rating on ‘in person’ channels, where 29 per cent of respondents rate government as either ‘worse’ or ‘much worse’ than the private sector.
While the private sector is rated more highly than government for online, email and mobile app channels, the differences are not as pronounced.
0% 5% 10% 20%15% 25% 30%
Easier to access/use
Providing information over the Internet is the norm
Faster service/would save time
Convenient
Other
Don't know/no reason stated
More ef�cient (better use of resources)
Providing information over the Internet is the way of the future
General positive statement
Prefer to talk to someone directly
Waste of money/money could be spent elsewhere
Dif�culty accessing or using the Internet
Fine the way it is
Don't use Internet or smartphones/dislike using Internet
Concerns about privacy/security
Good for the environment
Don't use government services
26.6%
15.1%
14.8%
8.4%
8.2%
7.6%
6.4%
6.1%
5.6%
5.4%
3.8%
3.8%
2.9%
2%
0.7%
0.5%
0.3%
Base: Rated digital government as a very low to very high priority (n=1,777).
Figure 19: Reasons for rating digital government initiatives a priority (or otherwise) for government
Base: All respondents (n=2,009).
Figure 20: Dealing with government versus dealing with the private sector (by channel)
28
In person Phone Post Online Email Mobile app
(%) (%) (%) (%) (%) (%)
State much worse than federal 1.8 2.0 1.9 2.0 2.4 2.2
State worse than federal 5.0 4.3 3.7 5.5 4.1 3.5
About the same 53.4 53.7 56.3 51.8 50.4 30.3
State better than federal 14.8 12.2 9.4 12.8 10.6 7.3
State much better than federal 4.0 3.4 2.5 3.1 2.3 2.3
Not applicable 3.0 3.4 3.5 3.8 4.6 19.9
Don’t know 18.0 20.9 22.7 21.0 25.7 34.5
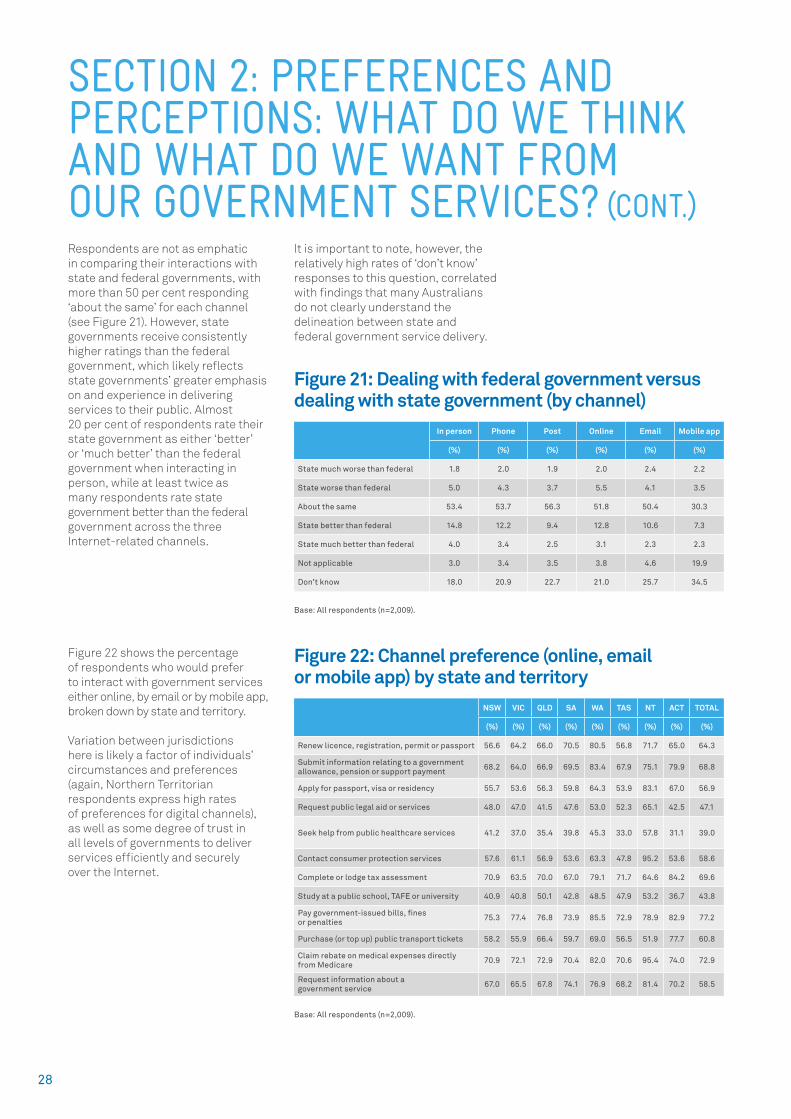
Respondents are not as emphatic in comparing their interactions with state and federal governments, with more than 50 per cent responding ‘about the same’ for each channel (see Figure 21). However, state governments receive consistently higher ratings than the federal government, which likely reflects state governments’ greater emphasis on and experience in delivering services to their public. Almost 20 per cent of respondents rate their state government as either ‘better’ or ‘much better’ than the federal government when interacting in person, while at least twice as many respondents rate state government better than the federal government across the three Internet-related channels.
It is important to note, however, the relatively high rates of ‘don’t know’ responses to this question, correlated with findings that many Australians do not clearly understand the delineation between state and federal government service delivery.
SECTION 2: PREFERENCES AND PERCEPTIONS: WHAT DO WE THINK AND WHAT DO WE WANT FROM OUR GOVERNMENT SERVICES? (CONT.)
Figure 21: Dealing with federal government versus dealing with state government (by channel)
Figure 22: Channel preference (online, email or mobile app) by state and territory
Figure 22 shows the percentage of respondents who would prefer to interact with government services either online, by email or by mobile app, broken down by state and territory.
Variation between jurisdictions here is likely a factor of individuals’ circumstances and preferences (again, Northern Territorian respondents express high rates of preferences for digital channels), as well as some degree of trust in all levels of governments to deliver services efficiently and securely over the Internet.
NSW VIC QLD SA WA TAS NT ACT TOTAL
(%) (%) (%) (%) (%) (%) (%) (%) (%)
Renew licence, registration, permit or passport 56.6 64.2 66.0 70.5 80.5 56.8 71.7 65.0 64.3
Submit information relating to a government allowance, pension or support payment 68.2 64.0 66.9 69.5 83.4 67.9 75.1 79.9 68.8
Apply for passport, visa or residency 55.7 53.6 56.3 59.8 64.3 53.9 83.1 67.0 56.9
Request public legal aid or services 48.0 47.0 41.5 47.6 53.0 52.3 65.1 42.5 47.1
Seek help from public healthcare services 41.2 37.0 35.4 39.8 45.3 33.0 57.8 31.1 39.0
Contact consumer protection services 57.6 61.1 56.9 53.6 63.3 47.8 95.2 53.6 58.6
Complete or lodge tax assessment 70.9 63.5 70.0 67.0 79.1 71.7 64.6 84.2 69.6
Study at a public school, TAFE or university 40.9 40.8 50.1 42.8 48.5 47.9 53.2 36.7 43.8
Pay government-issued bills, fines or penalties 75.3 77.4 76.8 73.9 85.5 72.9 78.9 82.9 77.2
Purchase (or top up) public transport tickets 58.2 55.9 66.4 59.7 69.0 56.5 51.9 77.7 60.8
Claim rebate on medical expenses directly from Medicare 70.9 72.1 72.9 70.4 82.0 70.6 95.4 74.0 72.9
Request information about a government service 67.0 65.5 67.8 74.1 76.9 68.2 81.4 70.2 58.5
Base: All respondents (n=2,009).
Base: All respondents (n=2,009).
29
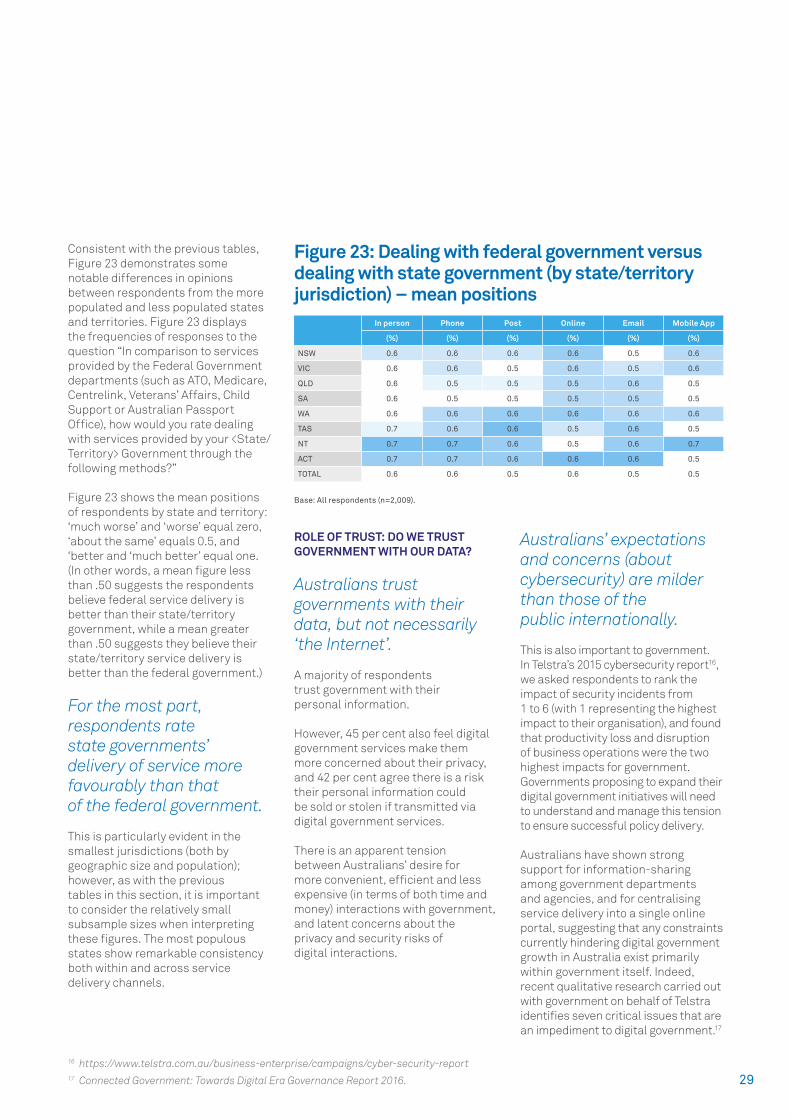
Consistent with the previous tables, Figure 23 demonstrates some notable differences in opinions between respondents from the more populated and less populated states and territories. Figure 23 displays the frequencies of responses to the question “In comparison to services provided by the Federal Government departments (such as ATO, Medicare, Centrelink, Veterans’ Affairs, Child Support or Australian Passport Office), how would you rate dealing with services provided by your <State/Territory> Government through the following methods?”
Figure 23 shows the mean positions of respondents by state and territory: ‘much worse’ and ‘worse’ equal zero, ‘about the same’ equals 0.5, and ‘better and ‘much better’ equal one. (In other words, a mean figure less than .50 suggests the respondents believe federal service delivery is better than their state/territory government, while a mean greater than .50 suggests they believe their state/territory service delivery is better than the federal government.)
For the most part, respondents rate state governments’ delivery of service more favourably than that of the federal government.
This is particularly evident in the smallest jurisdictions (both by geographic size and population); however, as with the previous tables in this section, it is important to consider the relatively small subsample sizes when interpreting these figures. The most populous states show remarkable consistency both within and across service delivery channels.
In person Phone Post Online Email Mobile App
(%) (%) (%) (%) (%) (%)
NSW 0.6 0.6 0.6 0.6 0.5 0.6
VIC 0.6 0.6 0.5 0.6 0.5 0.6
QLD 0.6 0.5 0.5 0.5 0.6 0.5
SA 0.6 0.5 0.5 0.5 0.5 0.5
WA 0.6 0.6 0.6 0.6 0.6 0.6
TAS 0.7 0.6 0.6 0.5 0.6 0.5
NT 0.7 0.7 0.6 0.5 0.6 0.7
ACT 0.7 0.7 0.6 0.6 0.6 0.5
TOTAL 0.6 0.6 0.5 0.6 0.5 0.5
Base: All respondents (n=2,009).
Figure 23: Dealing with federal government versus dealing with state government (by state/territory jurisdiction) – mean positions
16 https://www.telstra.com.au/business-enterprise/campaigns/cyber-security-report17 Connected Government: Towards Digital Era Governance Report 2016.
ROLE OF TRUST: DO WE TRUST GOVERNMENT WITH OUR DATA?
Australians trust governments with their data, but not necessarily ‘the Internet’.
A majority of respondents trust government with their personal information.
However, 45 per cent also feel digital government services make them more concerned about their privacy, and 42 per cent agree there is a risk their personal information could be sold or stolen if transmitted via digital government services.
There is an apparent tension between Australians’ desire for more convenient, efficient and less expensive (in terms of both time and money) interactions with government, and latent concerns about the privacy and security risks of digital interactions.
Australians’ expectations and concerns (about cybersecurity) are milder than those of the public internationally.
This is also important to government. In Telstra’s 2015 cybersecurity report16, we asked respondents to rank the impact of security incidents from 1 to 6 (with 1 representing the highest impact to their organisation), and found that productivity loss and disruption of business operations were the two highest impacts for government. Governments proposing to expand their digital government initiatives will need to understand and manage this tension to ensure successful policy delivery.
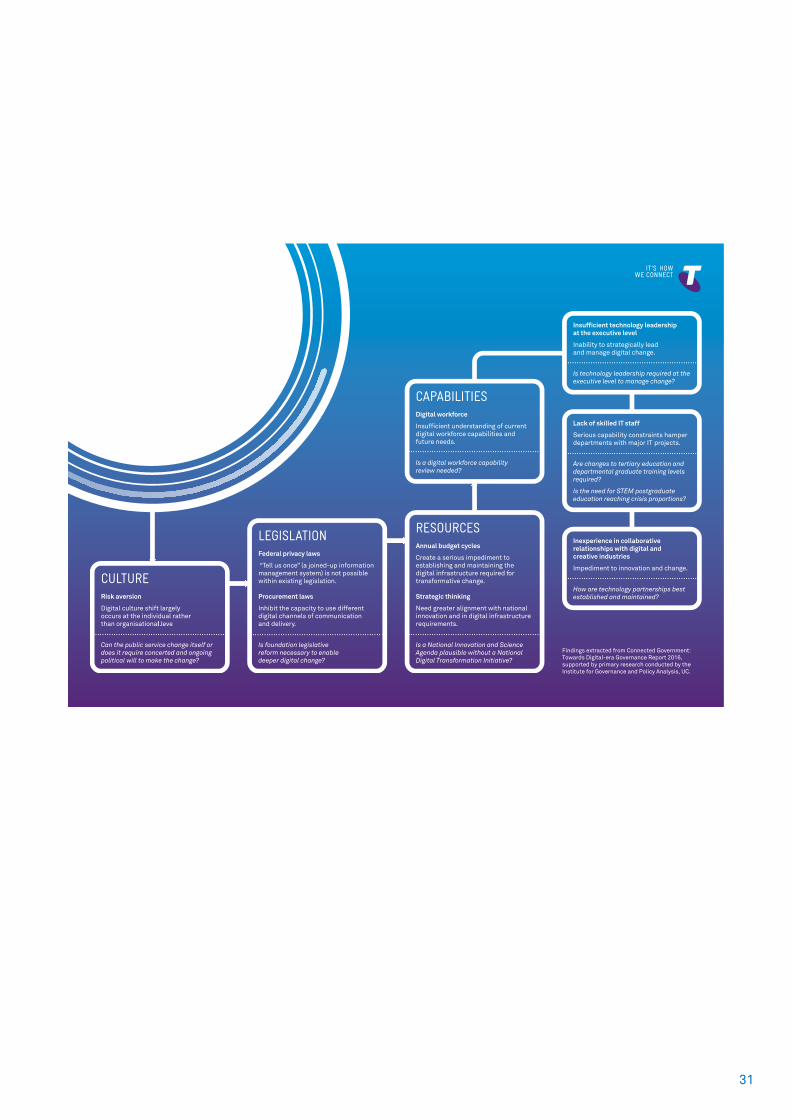
Australians have shown strong support for information-sharing among government departments and agencies, and for centralising service delivery into a single online portal, suggesting that any constraints currently hindering digital government growth in Australia exist primarily within government itself. Indeed, recent qualitative research carried out with government on behalf of Telstra identifies seven critical issues that are an impediment to digital government.17
30
Cultural barriers
1. A ‘wait and see’ approach drives many digital investment and enabling decisions, leading to perceptions of a culture of risk aversion. Digital culture shift has largely occurred at the individual rather than the organisational level. Can the public service change itself or does it require concerted and ongoing political will to make the change?
Legislative barriers
2. “Tell us once” (a joined up information management system) is perceived as not possible within existing privacy laws. A similar problem applies to procurement laws and the capacity to use different digital channels of communication and delivery. Is foundation legislative reform necessary to enable deeper digital change?
Resource barriers
3. Budget rules (e.g. persistence of annual budget cycles) are a serious impediment to establishing and maintaining the necessary digital infrastructure for transformative change. Investment in digital infrastructure requires greater strategic thinking in alignment with national innovation needs. Is a National Innovation and Science Agenda plausible without a National Digital Transformation Initiative?
Capability barriers
4. The Australian public service does not know its digital workforce capability and by implication its present and future workforce needs. Is a digital workforce capability review needed?
5. The Australian public service does not possess sufficient technology leadership at the Executive level service-wide to strategically manage and lead digital change. Is technology leadership required at the Executive level of all departments and agencies to manage change?
6. Departments with major IT projects face serious capability constraints in getting skilled staff, but agencies with modest IT effort report few difficulties. Are profound changes required at the tertiary education and departmental graduate training levels to ensure fit for purpose digital capability? Is the need for STEM postgraduate education reaching crisis proportions?
7. Establishing mutually satisfactory technology partnerships is a throttle to change. Commonwealth government (with some high-profile exceptions) does not know how to work collaboratively with digital industries (defined in the broadest sense to also include creative industries and other sources of collaboration and innovation). How are technology partnerships best established and maintained?
SECTION 2: PREFERENCES AND PERCEPTIONS: WHAT DO WE THINK AND WHAT DO WE WANT FROM OUR GOVERNMENT SERVICES? (CONT.)
31
CULTURERisk aversion
Digital culture shift largely occurs at the individual rather than organisational level.
Can the public service change itself or does it require concerted and ongoing political will to make the change?
LEGISLATIONFederal privacy laws
“Tell us once” (a joined-up information management system) is not possible within existing legislation.
Procurement laws
Inhibit the capacity to use different digital channels of communicationand delivery.
Is foundation legislativereform necessary to enabledeeper digital change?
RESOURCESAnnual budget cycles
Create a serious impediment to establishing and maintaining the digital infrastructure required for transformative change.
Strategic thinking
Need greater alignment with national innovation and in digital infrastructure requirements.
Is a National Innovation and Science Agenda plausible without a National Digital Transformation Initiative?
CAPABILITIESDigital workforce
Insuf� cient understanding of current digital workforce capabilities andfuture needs.
Is a digital workforce capabilityreview needed?
What are the barriers to digital transformation?
EMERGINGCRITICALDILEMMAS
Findings extracted from Connected Government: Towards Digital-era Governance Report 2016, supported by primary research conducted by the Institute for Governance and Policy Analysis, UC.
What are the barriers to digital transformation?
Insuf� cient technology leadershipat the executive level
Inability to strategically leadand manage digital change.
Is technology leadership required at the executive level to manage change?
Lack of skilled IT staff
Serious capability constraints hamper departments with major IT projects.
Are changes to tertiary education and departmental graduate training levels required?
Is the need for STEM postgraduate education reaching crisis proportions?
Inexperience in collaborative relationships with digital andcreative industries
Impediment to innovation and change.
How are technology partnerships best established and maintained?

32
SECTION 3: DELIVERING THE FUTURE OF GREAT EXPECTATIONS
EXPECTATIONS OF THE FUTURE
While our survey has already examined Australians’ interactions with government services, both online and offline, this section explores what they want and expect from digital service delivery in the future.
We provide a vision for the future of government service delivery and a framework that addresses the deficiencies of the current models.
When asked to think about ways government departments or agencies could improve their delivery of services, respondents answer ‘more online/web services’ and a ‘single one-stop shop website offering a range of government services’ are among their most important priorities (see Figure 25). (These responses bring to mind the Australian Government’s existing ‘MyGov’ service.)
Ranked equally important was ‘more call centres/more staff on duty at call centres’, reflecting frustrations with interactions over the phone (and perhaps the preference for future ‘in person’ and digital interactions shown in Figure 25).
Three options stand out as the least important among those listed in Figure 25:
• Service delivery via mobile phone or tablet app;
• More leaflets or information conveyed through letterbox or the community; and
• The use of social media to communicate with the public.
Hindsight Insight Foresight
Policy The Australian public indicates new, innovative ways of
delivering services will improve their view of government
Service experiences affect not only specific government
providers, but whole of jurisdiction and sector
perceptions of performance
A Syndesic, principle-based approach to services focused
on the user and provider (enabled by technology)
can improve services and the public’s perceptions
of the government sector
Service Design The Australian public expects public services to be designed
with users’ needs in mind
Designing services for the future must take into account
of the needs, expectations and environment – including the
technological, social, cognitive dimensions – of the time of
delivery, not the time of design
New approaches to service design that accommodate
a flexible and scalable architecture, that leverage
technical and innovation advances, can deliver a
sustainable improvement in the performance, efficiency
and quality of services
Service Delivery The Australian public believes government organisations should share information to deliver better services
Cross-provider collaboration allows a better and more
integrated view of user needs and a more effective
service delivery
Taking a whole-of-user view to learning about and improving
services can provide efficiency advantages for both service
providers and the public
Figure 24: At a glance
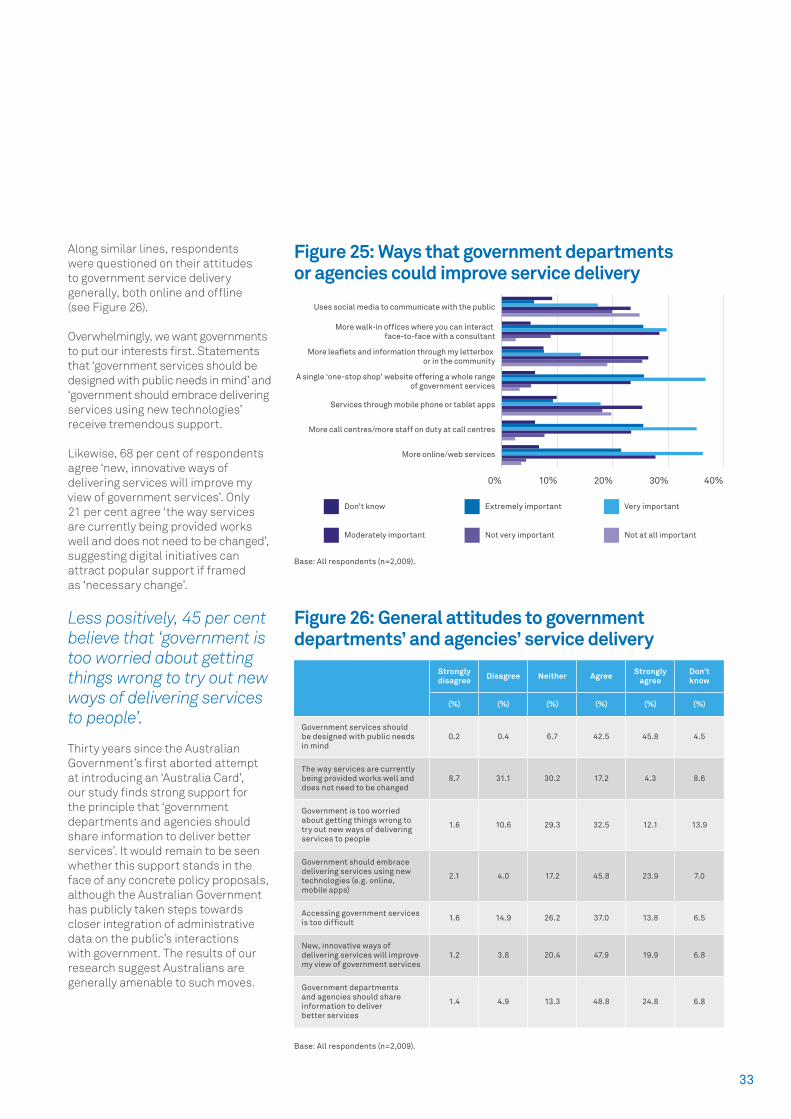
33
Along similar lines, respondents were questioned on their attitudes to government service delivery generally, both online and offline (see Figure 26).
Overwhelmingly, we want governments to put our interests first. Statements that ‘government services should be designed with public needs in mind’ and ‘government should embrace delivering services using new technologies’ receive tremendous support.
Likewise, 68 per cent of respondents agree ‘new, innovative ways of delivering services will improve my view of government services’. Only 21 per cent agree ‘the way services are currently being provided works well and does not need to be changed’, suggesting digital initiatives can attract popular support if framed as ‘necessary change’.
Less positively, 45 per cent believe that ‘government is too worried about getting things wrong to try out new ways of delivering services to people’.
Thirty years since the Australian Government’s first aborted attempt at introducing an ‘Australia Card’, our study finds strong support for the principle that ‘government departments and agencies should share information to deliver better services’. It would remain to be seen whether this support stands in the face of any concrete policy proposals, although the Australian Government has publicly taken steps towards closer integration of administrative data on the public’s interactions with government. The results of our research suggest Australians are generally amenable to such moves.
Strongly disagree Disagree Neither Agree Strongly
agreeDon’t know
(%) (%) (%) (%) (%) (%)
Government services should be designed with public needs in mind
0.2 0.4 6.7 42.5 45.8 4.5
The way services are currently being provided works well and does not need to be changed
8.7 31.1 30.2 17.2 4.3 8.6
Government is too worried about getting things wrong to try out new ways of delivering services to people
1.6 10.6 29.3 32.5 12.1 13.9
Government should embrace delivering services using new technologies (e.g. online, mobile apps)
2.1 4.0 17.2 45.8 23.9 7.0
Accessing government services is too difficult 1.6 14.9 26.2 37.0 13.8 6.5
New, innovative ways of delivering services will improve my view of government services
1.2 3.8 20.4 47.9 19.9 6.8
Government departments and agencies should share information to deliver better services
1.4 4.9 13.3 48.8 24.8 6.8
Figure 26: General attitudes to government departments’ and agencies’ service delivery
Base: All respondents (n=2,009).
Base: All respondents (n=2,009).
Figure 25: Ways that government departments or agencies could improve service delivery
Uses social media to communicate with the public
More walk-in of�ces where you can interact face-to-face with a consultant
More lea�ets and information through my letterbox or in the community
A single ‘one-stop shop’ website offering a whole rangeof government services
Services through mobile phone or tablet apps
More call centres/more staff on duty at call centres
More online/web services
Don’t know Extremely important Very important
Moderately important Not very important Not at all important
40%30%20%10%0%
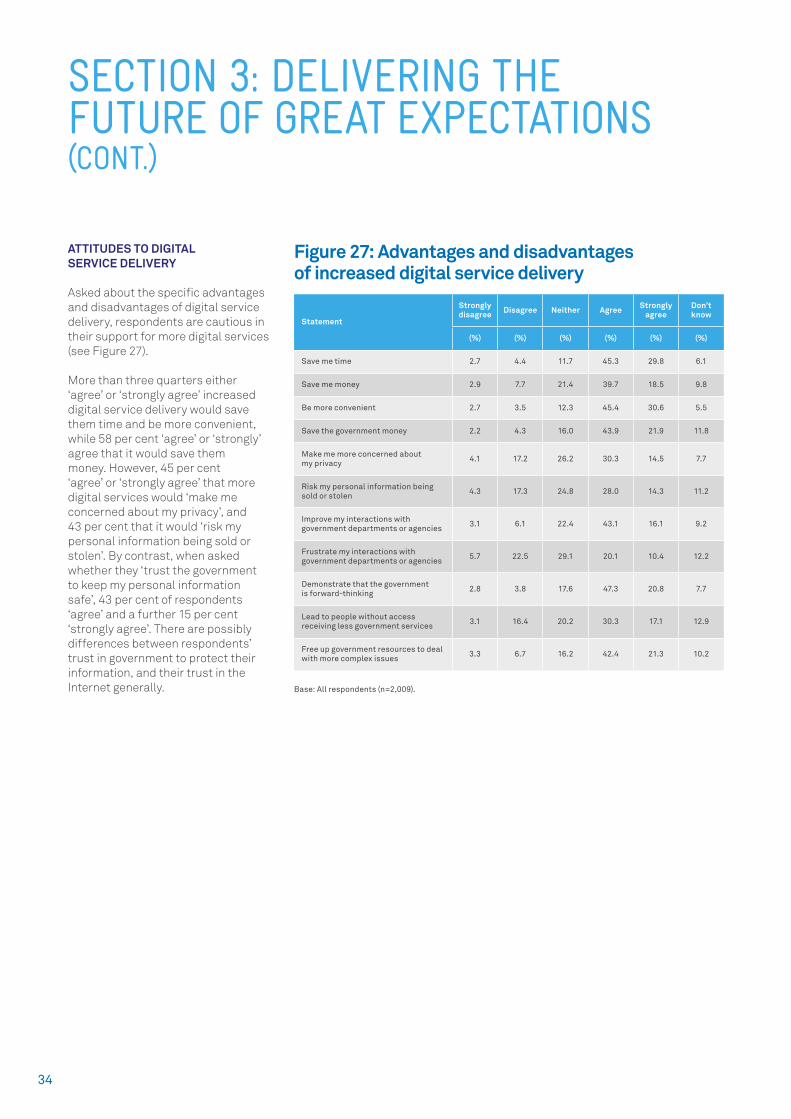
34
ATTITUDES TO DIGITAL SERVICE DELIVERY
Asked about the specific advantages and disadvantages of digital service delivery, respondents are cautious in their support for more digital services (see Figure 27).
More than three quarters either ‘agree’ or ‘strongly agree’ increased digital service delivery would save them time and be more convenient, while 58 per cent ‘agree’ or ‘strongly’ agree that it would save them money. However, 45 per cent ‘agree’ or ‘strongly agree’ that more digital services would ‘make me concerned about my privacy’, and 43 per cent that it would ‘risk my personal information being sold or stolen’. By contrast, when asked whether they ‘trust the government to keep my personal information safe’, 43 per cent of respondents ‘agree’ and a further 15 per cent ‘strongly agree’. There are possibly differences between respondents’ trust in government to protect their information, and their trust in the Internet generally.
SECTION 3: DELIVERING THE FUTURE OF GREAT EXPECTATIONS(CONT.)
Figure 27: Advantages and disadvantages of increased digital service delivery
Base: All respondents (n=2,009).
Statement
Strongly disagree Disagree Neither Agree Strongly
agreeDon’t know
(%) (%) (%) (%) (%) (%)
Save me time 2.7 4.4 11.7 45.3 29.8 6.1
Save me money 2.9 7.7 21.4 39.7 18.5 9.8
Be more convenient 2.7 3.5 12.3 45.4 30.6 5.5
Save the government money 2.2 4.3 16.0 43.9 21.9 11.8
Make me more concerned about my privacy 4.1 17.2 26.2 30.3 14.5 7.7
Risk my personal information being sold or stolen 4.3 17.3 24.8 28.0 14.3 11.2
Improve my interactions with government departments or agencies 3.1 6.1 22.4 43.1 16.1 9.2
Frustrate my interactions with government departments or agencies 5.7 22.5 29.1 20.1 10.4 12.2
Demonstrate that the government is forward-thinking 2.8 3.8 17.6 47.3 20.8 7.7
Lead to people without access receiving less government services 3.1 16.4 20.2 30.3 17.1 12.9
Free up government resources to deal with more complex issues 3.3 6.7 16.2 42.4 21.3 10.2
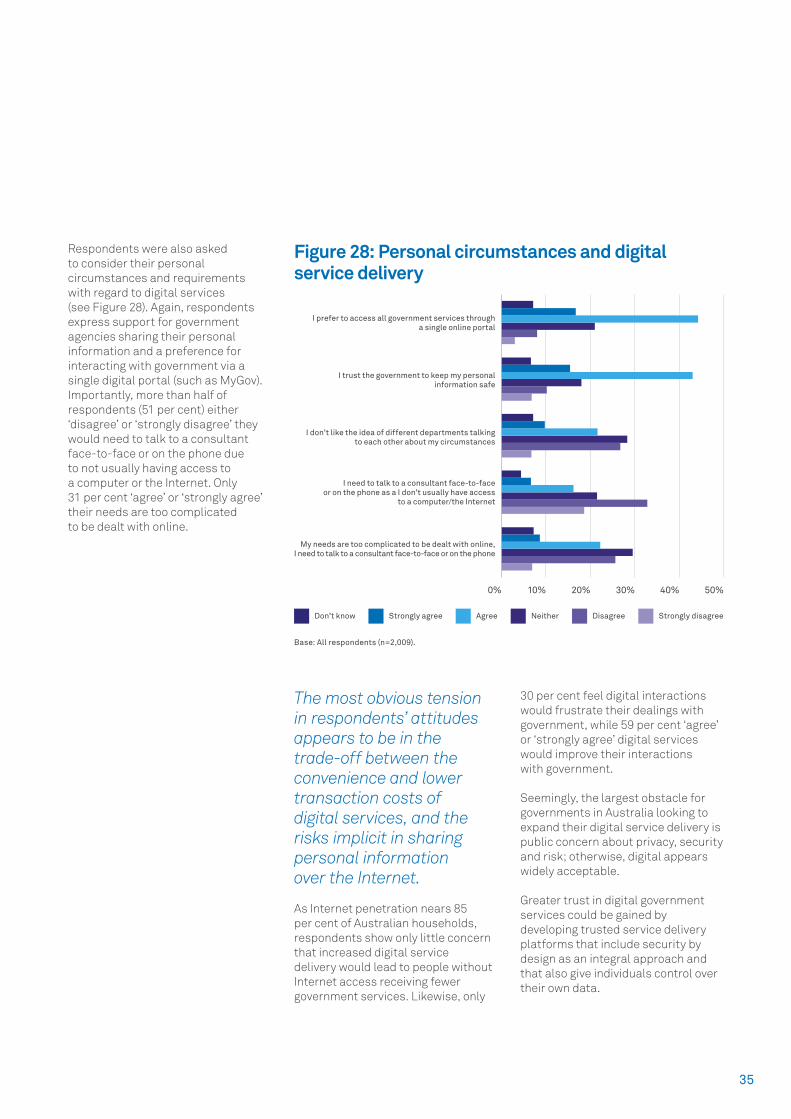
35
Respondents were also asked to consider their personal circumstances and requirements with regard to digital services (see Figure 28). Again, respondents express support for government agencies sharing their personal information and a preference for interacting with government via a single digital portal (such as MyGov). Importantly, more than half of respondents (51 per cent) either ‘disagree’ or ‘strongly disagree’ they would need to talk to a consultant face-to-face or on the phone due to not usually having access to a computer or the Internet. Only 31 per cent ‘agree’ or ‘strongly agree’ their needs are too complicated to be dealt with online.
The most obvious tension in respondents’ attitudes appears to be in the trade-off between the convenience and lower transaction costs of digital services, and the risks implicit in sharing personal information over the Internet.
As Internet penetration nears 85 per cent of Australian households, respondents show only little concern that increased digital service delivery would lead to people without Internet access receiving fewer government services. Likewise, only
30 per cent feel digital interactions would frustrate their dealings with government, while 59 per cent ‘agree’ or ‘strongly agree’ digital services would improve their interactions with government.
Seemingly, the largest obstacle for governments in Australia looking to expand their digital service delivery is public concern about privacy, security and risk; otherwise, digital appears widely acceptable.
Greater trust in digital government services could be gained by developing trusted service delivery platforms that include security by design as an integral approach and that also give individuals control over their own data.
Figure 28: Personal circumstances and digital service delivery
Base: All respondents (n=2,009).
Don’t know Strongly agree Agree Neither Disagree Strongly disagree
50%40%30%20%10%0%
I prefer to access all government services througha single online portal
I trust the government to keep my personalinformation safe
I don’t like the idea of different departments talkingto each other about my circumstances
I need to talk to a consultant face-to-faceor on the phone as a I don’t usually have access
to a computer/the Internet
My needs are too complicated to be dealt with online,I need to talk to a consultant face-to-face or on the phone
36
Our research provides the most up-to-date and comprehensive picture of the Australian public’s current use, perceptions, attitudes and expectations of government services. These results can be used to help inform a better model of service delivery that can address some of the highlighted deficiencies and is better aligned with the evolving expectations and needs of the public.
In designing a better services model, it is important to take into account a number of dimensions that will play an important role in how this future unfolds.
THE TECHNOLOGY DIMENSION
Technology is playing an increasing role in almost every aspect of our everyday lives, underpinning many interactions that were once only possibly ‘in person’ – from shopping
to banking and much more – and also enabling interactions undreamed of in the pre-digital age.
As technology users, we want the experience to be intuitive, simple, effective and ‘better than the alternative’, as anyone who’s ditched the TV guide for a personalised recommendation engine will attest. (Think Netflix and how it recommends films you might enjoy based on both your past viewing behaviour and films with similar content).
Indeed, across many types of interactions, the evolution of technology is allowing for greater personification, with experiences being increasingly tailored to the individual user’s needs:
• Reputation engines (where users rate their experience) establish trust;
• Geolocation capabilities allow for better targeting and increased relevance;
• The increased use of social media and online communities means that user profile information is getting more comprehensive, again leading to better targeting; and
• Services offered to the user are more tailored, contributing to a sense of familiarity and understanding.
The customer experience is the new battleground, and the ongoing quest for differentiation (and market share) in the private sector will continue to drive advances in this field. Future government services will need to match the quality, nature and character of the experiences the public receives from the private sector, to ensure relevance and adoption.
In the section below, we look at what technologies are likely to have an impact on the delivery of government services – and how.
Computing power
The range and pace of innovation over the last decade, fuelled by advances in technology, demonstrates that computing power, grounded in Moore’s Law, is far from reaching its limits.
As early as 1998, predictions of consumer devices reaching the computing power of the human brain by 2020s started to garner attention.18 These days, such predictions have been gathering momentum, with expectations that, within the decade, a $1,000 computer should be capable of 10,000 trillion cycles per second, the equivalent processing speed of the human brain.
SECTION 4: A NEW MODEL FOR GOVERNMENT SERVICE DELIVERY
18 “When will computer hardware match the human brain?”, Hans Moravec, Journal of Evolution and Technology, 1998, Vol 1., http://www.transhumanist.com/volume1/moravec.htm, accessed Oct 14, 2015.
37
Intel Smart Sound Technology
Intel Smart Sound Technology allows devices to understand and process verbal communication from the user.
To put that in perspective, today’s devices are ‘only’ capable of 2-4 billion cycles per second. Already new chipsets from major manufacturers are starting to incorporate special capabilities for ‘hands-free computing’, including voice command recognition.
Access to increased computing power will advance artificial intelligence and deliver innovations as yet unthought of.
Cloud computing
Cloud computing, now a mature and well-accepted way of providing and consuming technology, has given organisations and individuals the ability to access tremendous amounts of storage and computing power when and as needed. In addition to lowering the cost of capital, it will continue to remove barriers to entry for initiatives that require computing power and storage in orders of magnitude far greater than previously feasible, from either a cost or technology perspective.
Big data
Applying the cloud model and resources to data has given rise to big data and data analytics, fields in which a similar factor of scale is applied to collecting and making sense of information.
Big data and data analytics open up a new world of possibility for both individuals and organisations – providing evidence for decision-making, as well inputs for tracking the impact of those decisions.
NSW Data Analytics Centre
NSW Government has created a dedicated Data Analytics Centre, focused on providing insights into public policy based on the evidence collected and analysed from data and sources that can augment the traditional sources of evidence for policy making.
While currently under development, and constrained by the lack of sufficient skills in the marketplace, data analytics has the potential to change decision-making and provide the evidence required for the policy development process to truly reflect the best available knowledge at any one time.
The insights revealed by data analytics, including behavioural patterns, also provide a powerful source of input for machine learning as part of cognitive computing and artificial intelligence.
Smart devices
The increase in computing power, correlated with a reduction in size and cost, means we now have the ability to add computing power to an increasing number of everyday objects, to make them ‘smart’. These can also become input devices for users, collecting data on their behaviours and interactions.
Smart devices help modify user behaviour
Smart toothbrushes can play a role in educating people on the correct way of looking after their teeth, potentially complementing or even taking over a preventative function from the health sector.
Smart devices will play an increasingly important role in our society, and new devices are being created all the time. The last couple of years have seen wearable devices, especially those aimed at the health and fitness sector, move from a niche market into the mainstream.
Devices – from smart watches to fitness bands – increasingly incorporate greater computer power and provide functions and capabilities that were traditionally delivered by larger screens and computing devices, if at all.
In turn, complementary Internet of Things (IoT) devices, including sensors, beacons and similar devices embedded in objects and environments, provide additional sources of data, inputs and information that help create a comprehensive picture of the environment, users, objects, actions and changes of interest.
Connectivity
At the heart of this ecosystem is connectivity, allowing different devices to communicate with each other and with central systems, as well as giving them access to vast amounts of information, computing power and storage.
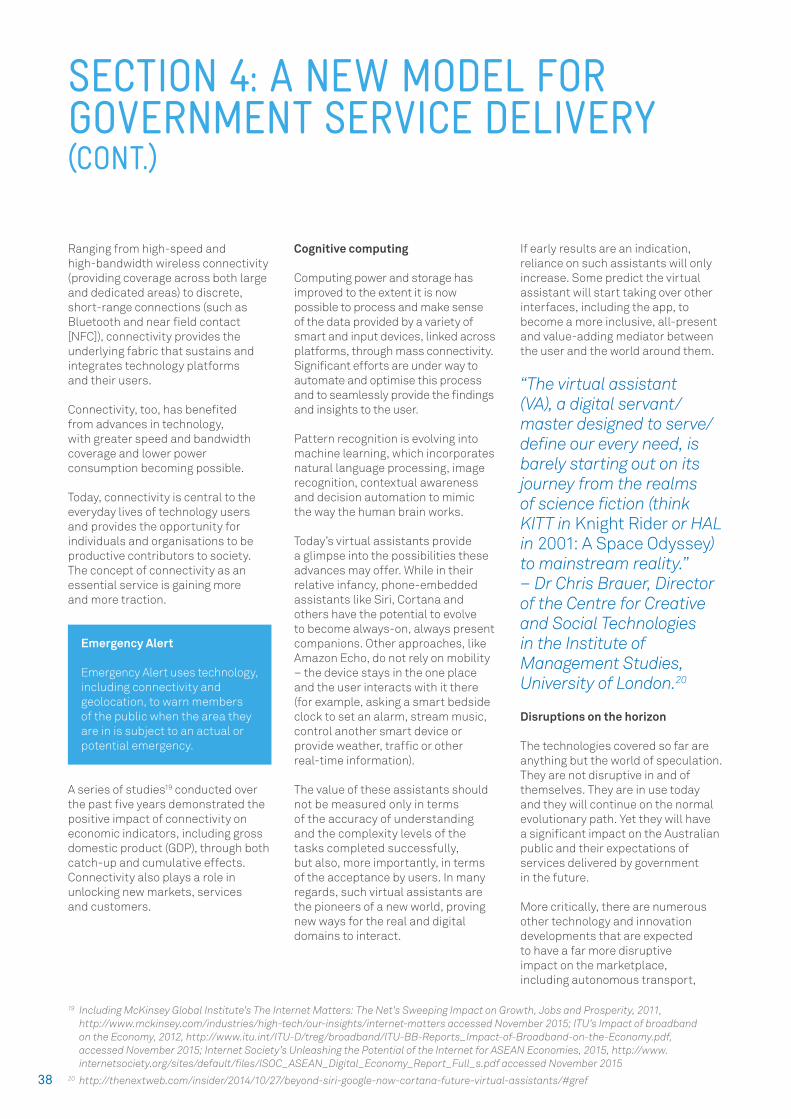
38
Ranging from high-speed and high-bandwidth wireless connectivity (providing coverage across both large and dedicated areas) to discrete, short-range connections (such as Bluetooth and near field contact [NFC]), connectivity provides the underlying fabric that sustains and integrates technology platforms and their users.
Connectivity, too, has benefited from advances in technology, with greater speed and bandwidth coverage and lower power consumption becoming possible.
Today, connectivity is central to the everyday lives of technology users and provides the opportunity for individuals and organisations to be productive contributors to society. The concept of connectivity as an essential service is gaining more and more traction.
Emergency Alert
Emergency Alert uses technology, including connectivity and geolocation, to warn members of the public when the area they are in is subject to an actual or potential emergency.
A series of studies19 conducted over the past five years demonstrated the positive impact of connectivity on economic indicators, including gross domestic product (GDP), through both catch-up and cumulative effects. Connectivity also plays a role in unlocking new markets, services and customers.
Cognitive computing
Computing power and storage has improved to the extent it is now possible to process and make sense of the data provided by a variety of smart and input devices, linked across platforms, through mass connectivity. Significant efforts are under way to automate and optimise this process and to seamlessly provide the findings and insights to the user.
Pattern recognition is evolving into machine learning, which incorporates natural language processing, image recognition, contextual awareness and decision automation to mimic the way the human brain works.
Today’s virtual assistants provide a glimpse into the possibilities these advances may offer. While in their relative infancy, phone-embedded assistants like Siri, Cortana and others have the potential to evolve to become always-on, always present companions. Other approaches, like Amazon Echo, do not rely on mobility – the device stays in the one place and the user interacts with it there (for example, asking a smart bedside clock to set an alarm, stream music, control another smart device or provide weather, traffic or other real-time information).
The value of these assistants should not be measured only in terms of the accuracy of understanding and the complexity levels of the tasks completed successfully, but also, more importantly, in terms of the acceptance by users. In many regards, such virtual assistants are the pioneers of a new world, proving new ways for the real and digital domains to interact.
If early results are an indication, reliance on such assistants will only increase. Some predict the virtual assistant will start taking over other interfaces, including the app, to become a more inclusive, all-present and value-adding mediator between the user and the world around them.
“The virtual assistant (VA), a digital servant/ master designed to serve/ define our every need, is barely starting out on its journey from the realms of science fiction (think KITT in Knight Rider or HAL in 2001: A Space Odyssey) to mainstream reality.” – Dr Chris Brauer, Director of the Centre for Creative and Social Technologies in the Institute of Management Studies, University of London.20
Disruptions on the horizon
The technologies covered so far are anything but the world of speculation. They are not disruptive in and of themselves. They are in use today and they will continue on the normal evolutionary path. Yet they will have a significant impact on the Australian public and their expectations of services delivered by government in the future.
More critically, there are numerous other technology and innovation developments that are expected to have a far more disruptive impact on the marketplace, including autonomous transport,
19 Including McKinsey Global Institute’s The Internet Matters: The Net’s Sweeping Impact on Growth, Jobs and Prosperity, 2011, http://www.mckinsey.com/industries/high-tech/our-insights/internet-matters accessed November 2015; ITU’s Impact of broadband on the Economy, 2012, http://www.itu.int/ITU-D/treg/broadband/ITU-BB-Reports_Impact-of-Broadband-on-the-Economy.pdf, accessed November 2015; Internet Society’s Unleashing the Potential of the Internet for ASEAN Economies, 2015, http://www.internetsociety.org/sites/default/files/ISOC_ASEAN_Digital_Economy_Report_Full_s.pdf accessed November 2015
20 http://thenextweb.com/insider/2014/10/27/beyond-siri-google-now-cortana-future-virtual-assistants/#gref
SECTION 4: A NEW MODEL FOR GOVERNMENT SERVICE DELIVERY(CONT.)
39
additive manufacturing, artificial intelligence, biotechnology and new business models (including demand aggregation, capacity monetisation, crowdsourcing and reputation markets, to name but a few).
These developments have the potential to transform industries and other sectors of the economy. They are also likely to have a major effect on society – on human and financial capital and the distribution of these. With reports21 suggesting that the negative impact on employment and skills could be substantial, government organisations will have to evaluate the role these disruptions will play in the Australian context, and consider them in terms of policy, service design and delivery.
THE TRUST DIMENSION
Research22 conducted over the last five years shows the Australian public has a high degree of trust in public sector organisations. In general, they trust government as an institution to act for the betterment of society as a whole, and for the Australian public.
Key to this is the efficient delivery of government services that genuinely meet people’s needs. It is fair to say the intrinsic value of these services is often trumped by visible value: government service delivery organisations generally only get coverage when things go wrong.
Australians are generally an optimistic lot, with high expectations for things ‘getting better’, and for improvements in technology and other innovations making ‘life easier’. As our research shows, they have the same expectations for services received from government organisations, although some are cautious about future directions in service delivery.
Over the next decade, a number of social and economic challenges will need to be addressed, including likely changes to the balance of financial and human capital. (It should be noted that a possible surplus of capital in the private sector does not necessarily translate to a surplus of capital in the public sector, particularly as forecast population ageing will create new challenges for the delivery of government services.
There is definite scope for a new paradigm of service delivery that brings together the strengths of both the private and public sectors. For example, government campaigns promoting healthier lifestyles can be augmented by private sector apps that encourage behavioural change, and reduce the downward pressure on government budgets.
THE INNOVATION DIMENSION
Government today has a clear focus on innovation. It will be important to maintain this current momentum, particularly as the pace of change continues to accelerate. There is also an expectation in society that the government will – if not actively lead the way – at least provide demonstrable support for the innovations that will be central to the future of this country and its people.
Today’s service delivery framework is already established (with some elements admittedly more effective than others). Now is the time to consider how these services will be delivered in the future. What will tomorrow’s environment look like? What will people want and need? How best can we leverage government’s strengths, and address its weaknesses?
We often hear how short-term horizon thinking hampers efforts to plan for the longer term, and we must recognise that change takes time. Redesigning services that support millions of transactions and people is no easy task; in order to have a mature new way of delivering services in a decade, we need to start today.
We need to start thinking about the service delivery architecture of the future.
In the following sections, we explore the status quo, and the alternative. First, we take a look at the traditional model of service delivery – its failings and challenges. We also look at the benefits offered by the move to Digital Government, and finally propose a new model of service delivery that aims to address the challenges associated with both.
The Transactional Service Model – the tradition
Traditionally, public sector organisations have approached engagement with the public as a series of discrete transactions. Individual government departments – or, in some cases, different parts of the same organisation – deliver services to members of the public (in essence, they share the same customer base, but each department maintains a separate relationship with each customer).
This makes for a clear set of boundaries and responsibilities for the delivering organisation, with benefits including control over the delivery aspects, certainty of budget expenditures and reduced dependencies across multiple government organisations.
21 Including The Future of Jobs Report, World Economic Forum, 2016, http://www3.weforum.org/docs/WEF_Future_of_Jobs.pdf, accessed January 2016; Australia’s Future Workforce, 2015, http://adminpanel.ceda.com.au/FOLDERS/Service/Files/Documents/26792~Futureworkforce_June2015.pdf accessed January 2016.
22 Connected Government Program – Quantitative Research of Australian Public, 2011-2015, Telstra.
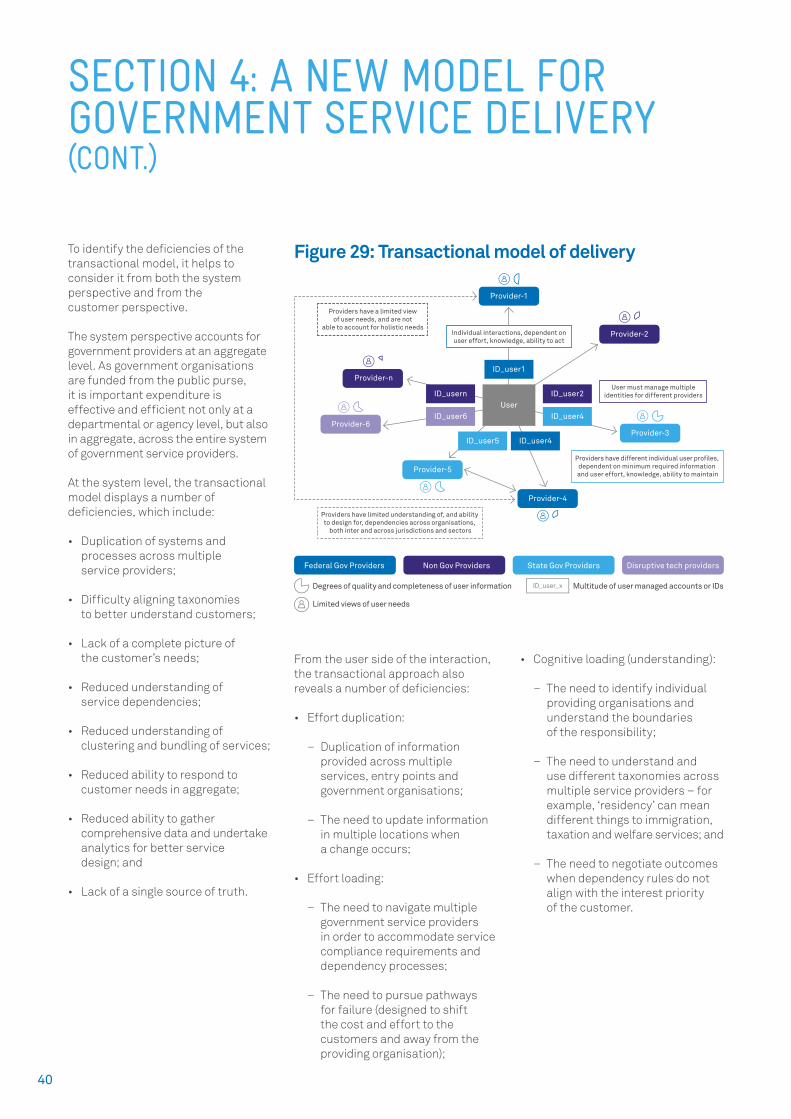
40
To identify the deficiencies of the transactional model, it helps to consider it from both the system perspective and from the customer perspective.
The system perspective accounts for government providers at an aggregate level. As government organisations are funded from the public purse, it is important expenditure is effective and efficient not only at a departmental or agency level, but also in aggregate, across the entire system of government service providers.
At the system level, the transactional model displays a number of deficiencies, which include:
• Duplication of systems and processes across multiple service providers;
• Difficulty aligning taxonomies to better understand customers;
• Lack of a complete picture of the customer’s needs;
• Reduced understanding of service dependencies;
• Reduced understanding of clustering and bundling of services;
• Reduced ability to respond to customer needs in aggregate;
• Reduced ability to gather comprehensive data and undertake analytics for better service design; and
• Lack of a single source of truth.
From the user side of the interaction, the transactional approach also reveals a number of deficiencies:
• Effort duplication:
– Duplication of information provided across multiple services, entry points and government organisations;
– The need to update information in multiple locations when a change occurs;
• Effort loading:
– The need to navigate multiple government service providers in order to accommodate service compliance requirements and dependency processes;
– The need to pursue pathways for failure (designed to shift the cost and effort to the customers and away from the providing organisation);
• Cognitive loading (understanding):
– The need to identify individual providing organisations and understand the boundaries of the responsibility;
– The need to understand and use different taxonomies across multiple service providers – for example, ‘residency’ can mean different things to immigration, taxation and welfare services; and
– The need to negotiate outcomes when dependency rules do not align with the interest priority of the customer.
SECTION 4: A NEW MODEL FOR GOVERNMENT SERVICE DELIVERY(CONT.)
Degrees of quality and completeness of user information Multitude of user managed accounts or IDs
Limited views of user needs
Federal Gov Providers Non Gov Providers State Gov Providers Disruptive tech providers
ID_user_x
Providers have a limited viewof user needs, and are not
able to account for holistic needsIndividual interactions, dependent onuser effort, knowledge, ability to act
User must manage multipleidentities for different providers
Providers have different individual user pro les, dependent on minimum required information and user effort, knowledge, ability to maintain
Providers have limited understanding of, and ability to design for, dependencies across organisations,
both inter and across jurisdictions and sectors
UserID_usern
ID_user6
ID_user2
ID_user4
ID_user1
ID_user4ID_user5
Provider-5
Provider-n
Provider-1
Provider-2
Provider-3Provider-6
Provider-4
Figure 29: Transactional model of delivery
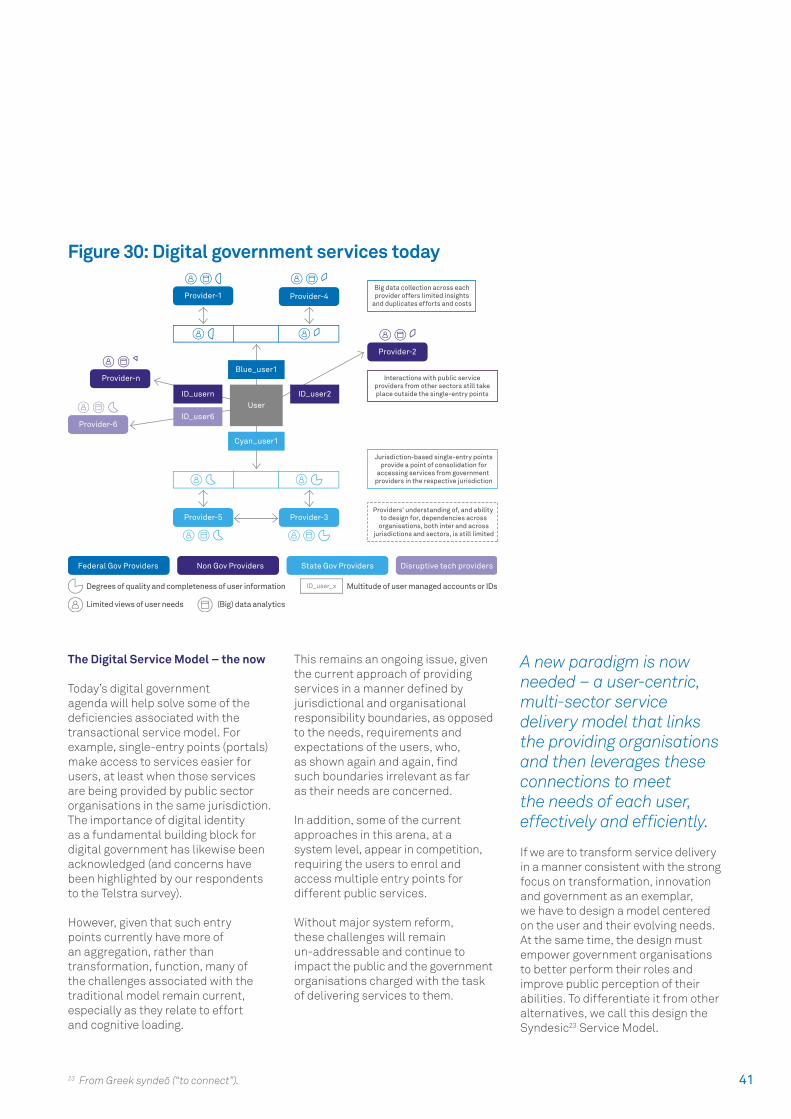
41
The Digital Service Model – the now
Today’s digital government agenda will help solve some of the deficiencies associated with the transactional service model. For example, single-entry points (portals) make access to services easier for users, at least when those services are being provided by public sector organisations in the same jurisdiction. The importance of digital identity as a fundamental building block for digital government has likewise been acknowledged (and concerns have been highlighted by our respondents to the Telstra survey).
However, given that such entry points currently have more of an aggregation, rather than transformation, function, many of the challenges associated with the traditional model remain current, especially as they relate to effort and cognitive loading.
This remains an ongoing issue, given the current approach of providing services in a manner defined by jurisdictional and organisational responsibility boundaries, as opposed to the needs, requirements and expectations of the users, who, as shown again and again, find such boundaries irrelevant as far as their needs are concerned.
In addition, some of the current approaches in this arena, at a system level, appear in competition, requiring the users to enrol and access multiple entry points for different public services.
Without major system reform, these challenges will remain un-addressable and continue to impact the public and the government organisations charged with the task of delivering services to them.
A new paradigm is now needed – a user-centric, multi-sector service delivery model that links the providing organisations and then leverages these connections to meet the needs of each user, effectively and efficiently.
If we are to transform service delivery in a manner consistent with the strong focus on transformation, innovation and government as an exemplar, we have to design a model centered on the user and their evolving needs. At the same time, the design must empower government organisations to better perform their roles and improve public perception of their abilities. To differentiate it from other alternatives, we call this design the Syndesic23 Service Model.
23 From Greek syndeō (“to connect”).
Degrees of quality and completeness of user information Multitude of user managed accounts or IDs
Limited views of user needs
Federal Gov Providers Non Gov Providers State Gov Providers Disruptive tech providers
ID_user_x
Big data collection across eachprovider offers limited insights
and duplicates efforts and costs
Interactions with public serviceproviders from other sectors still takeplace outside the single-entry points
Jurisdiction-based single-entry pointsprovide a point of consolidation for
accessing services from government providers in the respective jurisdiction
Providers’ understanding of, and ability to design for, dependencies across
organisations, both inter and acrossjurisdictions and sectors, is still limited
UserID_usern
ID_user6
ID_user2
Blue_user1
Cyan_user1
(Big) data analytics
Provider-n
Provider-2
Provider-6
Provider-1 Provider-4
Provider-5 Provider-3
Figure 30: Digital government services today
42
The Syndesic Service Model – the future
In considering a new architecture for delivering services to the public, we must not only assess how it can meet a known set of needs, but also how it may continually evolve to meet future purposes.
The Syndesic Service Model takes an innovative approach to providing services to the public:
• It offers the users the ability to control their information;
• It separates the personal information of the user from the aggregate, anonymised data needed for decision-making;
• It separates the decision-making capability from the learning capability, allowing it to be modular and tailored according to the services provided and the organisations providing those services;
• It accounts for the different roles and functions of service providers, including dependencies across the private and public sector and across multiple jurisdictions;
• It enables responsible authorities and service providers to engage on the basis of the evidence and insights provided by the learning capability;
• It accommodates modular and agile development, as well as innovative and secure information architectures (such as distributed ledgers) that allow services to be added to the platform and evolved in line with user needs; and
• It allows a seamless evolution towards increased automation in the provision of services, removing, where possible, the need for user intervention.
The Syndesic Model is, at this stage, a conceptual one despite some advanced digital nations (such as Estonia24) taking steps in this direction. As such, it is important to highlight a series of governing principles that focus on the user, the providers and the technology as underlying enablers.
Focus on the user
• The model considers the role of user technology, both now and into the future;
• It is user-centric and takes into account the individual, their circumstances (family units, life events, etc.) and their needs (health, welfare, taxation, licensing, information, legal, etc.); and
• The user is in control – they can decide their level of involvement and control their own information.
Focus on the provider
• It acknowledges that public value is created through the optimal interaction of the sectors;
• It accounts for the role of non-government sectors – including private sector agencies, NGOs, etc. in the provision of services; and
• It leverages the strengths of the different sectors: trust in public sector, the agility of private sector, the social values of NGOs and the public purpose shared by all participants.
Focus on the technology
• It is a platform: it brings together the different services provided by all sectors and can evolve over time;
• It is smart: it can learn from the information provided, provide the evidence base for decision-making and develop insights for proactive and preventative service models; and
• It is trusted: security by design offers an inherently resilient architecture.
While the concept of the Syndesic Model will evolve over time, it is important to note that redesigning services that support millions of transactions and people is no easy task; in order to have a mature new way of delivering services in a decade, we need to start today.
24 See: https://e-estonia.com/component/x-road/
SECTION 4: A NEW MODEL FOR GOVERNMENT SERVICE DELIVERY(CONT.)
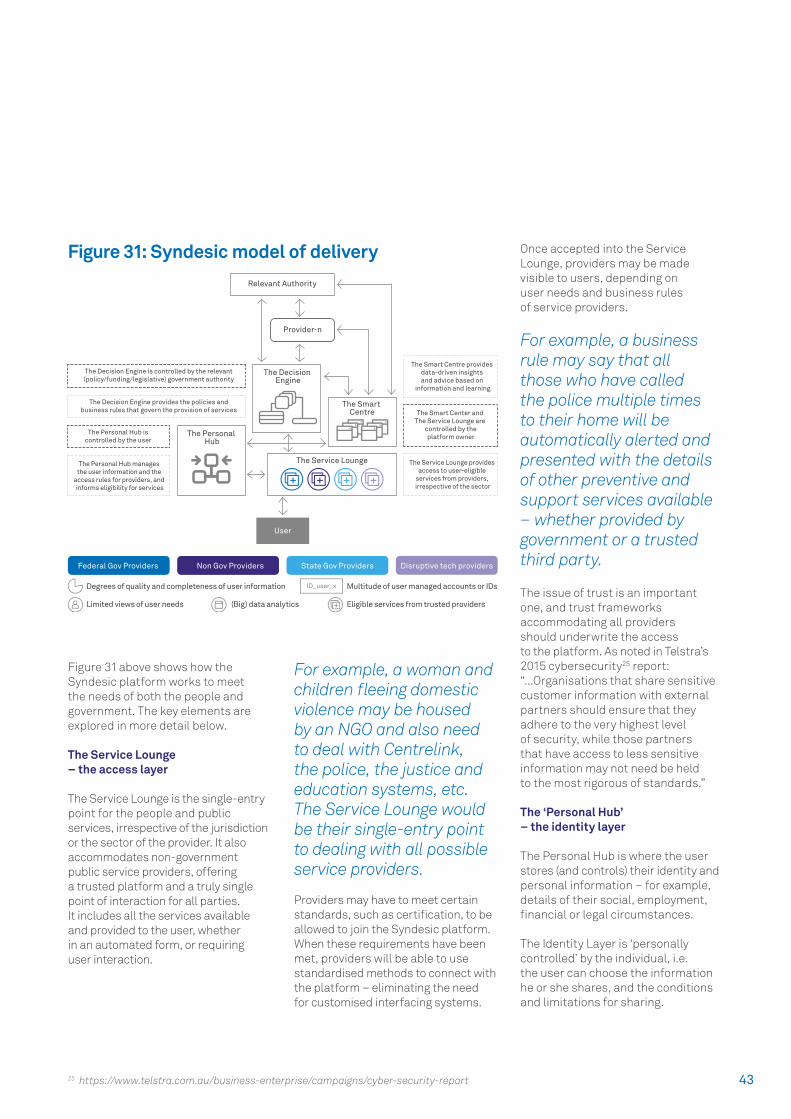
43
Figure 31 above shows how the Syndesic platform works to meet the needs of both the people and government. The key elements are explored in more detail below.
The Service Lounge – the access layer
The Service Lounge is the single-entry point for the people and public services, irrespective of the jurisdiction or the sector of the provider. It also accommodates non-government public service providers, offering a trusted platform and a truly single point of interaction for all parties. It includes all the services available and provided to the user, whether in an automated form, or requiring user interaction.
For example, a woman and children fleeing domestic violence may be housed by an NGO and also need to deal with Centrelink, the police, the justice and education systems, etc. The Service Lounge would be their single-entry point to dealing with all possible service providers.
Providers may have to meet certain standards, such as certification, to be allowed to join the Syndesic platform. When these requirements have been met, providers will be able to use standardised methods to connect with the platform – eliminating the need for customised interfacing systems.
Once accepted into the Service Lounge, providers may be made visible to users, depending on user needs and business rules of service providers.
For example, a business rule may say that all those who have called the police multiple times to their home will be automatically alerted and presented with the details of other preventive and support services available – whether provided by government or a trusted third party.
The issue of trust is an important one, and trust frameworks accommodating all providers should underwrite the access to the platform. As noted in Telstra’s 2015 cybersecurity25 report: “...Organisations that share sensitive customer information with external partners should ensure that they adhere to the very highest level of security, while those partners that have access to less sensitive information may not need be held to the most rigorous of standards.”
The ‘Personal Hub’ – the identity layer
The Personal Hub is where the user stores (and controls) their identity and personal information – for example, details of their social, employment, financial or legal circumstances.
The Identity Layer is ‘personally controlled’ by the individual, i.e. the user can choose the information he or she shares, and the conditions and limitations for sharing.
25 https://www.telstra.com.au/business-enterprise/campaigns/cyber-security-report
Degrees of quality and completeness of user information Multitude of user managed accounts or IDs
Limited views of user needs
Federal Gov Providers Non Gov Providers State Gov Providers Disruptive tech providers
ID_user_x
User
The Smart Centre provides data-driven insights and advice based on
information and learning
The Smart Center and The Service Lounge are
controlled by theplatform owner
The Service Lounge provides access to user-eligible
services from providers, irrespective of the sector
The Service Lounge
The Smart Centre
The Personal Hub
(Big) data analytics Eligible services from trusted providers
The Decision Engine is controlled by the relevant(policy/funding/legislative) government authority
The Decision Engine provides the policies andbusiness rules that govern the provision of services
The Personal Hub iscontrolled by the user
The Personal Hub manages the user information and the
access rules for providers, and informs eligibility for services
The Decision Engine
Provider-n
Relevant Authority
Figure 31: Syndesic model of delivery
44
This ‘Identity Layer’ provides the necessary information to allow the Decision Engine to make determinations relating to the possible type, nature, number and structure of services required by the user.
For example, a domestic violence victim may choose to share information about her legal situation with police, housing and health services, but not with the Department of Transport. Likewise, she may choose to share details of her current address with all – but this will happen only if she trusts that the platform is secure.
The Smart Centre – the cognitive layer
The Smart Centre or Cognitive Layer is where big data analytics, machine learning and cognitive computing come together to fulfil a number of important functions:
• Big data and data analytics: the Smart Centre receives anonymised data about users. This provides government with an understanding, at an aggregate level, of the characteristics of users in need of particular services, the relationship between different participants, and any changes to the status quo. It also offers insights into the impact, effect and results of changes at both user, service and system levels, providing a feedback loop to the Decision Engine (see below);
• Machine learning: providers and users both benefit from the learnings provided by the data about any interactions, in association with the Decision Engine (see below); and
• Cognitive computing: helps build intelligence into the system and improve the Decision Engine. It also manages the ontology of the system and provides input for the Decision Engine.
For example, anonymised data about the woman and her children is combined and compared with suburb, regional and national data to provide government with a full picture of current trends and service requirements.
The Decision Engine – the business rule layer
The Decision Engine or Business Rule Layer provides the policies – or business rules – that govern the provision of services.
The Decision Engine is controlled by the decision-making authority. This may be the provider of services or a combination of the provider and a different funding or policy authority.
The Decision Engine exchanges all relevant information with the ‘Smart Centre’, receiving insights and feedback on the business rules, and providing information on the policies and changes to policies that are driving effects at the user and system levels.
The Decision Engine also relies on the information provided through the Service Lounge and Personal Hub – in the other words, it draws on the data that the user and service providers (of all types) have provided to ensure the appropriate information is shared with all the relevant parties.
For example, on the basis of data on the concentration of domestic violence victims in a certain suburb, the relevant authorities can put in place policies for the presence of law enforcement and support services, decide on targeted preventive and education campaigns, provide incentives for providers to offer safe housing, and measure the impact of these policies and business rules, allowing them to be tailored and adjusted for optimal impact.
SECTION 4: A NEW MODEL FOR GOVERNMENT SERVICE DELIVERY(CONT.)
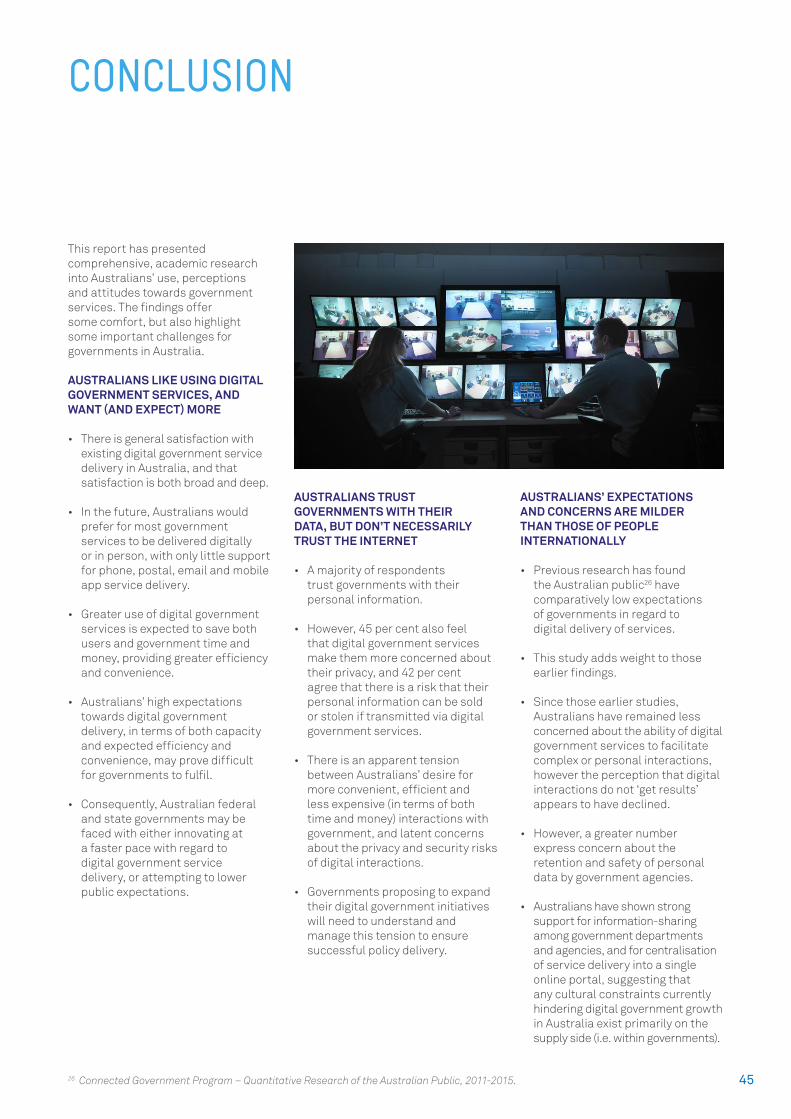
45
This report has presented comprehensive, academic research into Australians’ use, perceptions and attitudes towards government services. The findings offer some comfort, but also highlight some important challenges for governments in Australia.
AUSTRALIANS LIKE USING DIGITAL GOVERNMENT SERVICES, AND WANT (AND EXPECT) MORE
• There is general satisfaction with existing digital government service delivery in Australia, and that satisfaction is both broad and deep.
• In the future, Australians would prefer for most government services to be delivered digitally or in person, with only little support for phone, postal, email and mobile app service delivery.
• Greater use of digital government services is expected to save both users and government time and money, providing greater efficiency and convenience.
• Australians’ high expectations towards digital government delivery, in terms of both capacity and expected efficiency and convenience, may prove difficult for governments to fulfil.
• Consequently, Australian federal and state governments may be faced with either innovating at a faster pace with regard to digital government service delivery, or attempting to lower public expectations.
AUSTRALIANS TRUST GOVERNMENTS WITH THEIR DATA, BUT DON’T NECESSARILY TRUST THE INTERNET
• A majority of respondents trust governments with their personal information.
• However, 45 per cent also feel that digital government services make them more concerned about their privacy, and 42 per cent agree that there is a risk that their personal information can be sold or stolen if transmitted via digital government services.
• There is an apparent tension between Australians’ desire for more convenient, efficient and less expensive (in terms of both time and money) interactions with government, and latent concerns about the privacy and security risks of digital interactions.
• Governments proposing to expand their digital government initiatives will need to understand and manage this tension to ensure successful policy delivery.
AUSTRALIANS’ EXPECTATIONS AND CONCERNS ARE MILDER THAN THOSE OF PEOPLE INTERNATIONALLY
• Previous research has found the Australian public26 have comparatively low expectations of governments in regard to digital delivery of services.
• This study adds weight to those earlier findings.
• Since those earlier studies, Australians have remained less concerned about the ability of digital government services to facilitate complex or personal interactions, however the perception that digital interactions do not ‘get results’ appears to have declined.
• However, a greater number express concern about the retention and safety of personal data by government agencies.
• Australians have shown strong support for information-sharing among government departments and agencies, and for centralisation of service delivery into a single online portal, suggesting that any cultural constraints currently hindering digital government growth in Australia exist primarily on the supply side (i.e. within governments).
26 Connected Government Program – Quantitative Research of the Australian Public, 2011-2015.
CONCLUSION

46
GOVERNMENT SERVICE DELIVERY: AN INNOVATIVE CONCEPTUAL MODEL
It is clear that while the current system of service delivery meets most public expectations today, major reform will be required to address some key areas of concern and the challenges presented by a fast-evolving service landscape.
In this report, Telstra has outlined a high-level conceptual model – the Syndesic Service Model – that puts the user at the heart of the system and links all relevant service providers in a multi-sector delivery framework. The four key elements include:
• The Service Lounge: the single-entry point for people and service providers (both government and non-government), that is irrespective of jurisdiction or level of government;
• The Personal Hub: where the user stores their identity and personal information – for example, details of their social, employment, financial or legal circumstances. The user can choose the information he or she shares and the conditions for sharing;
• The Smart Centre: where big data analytics, machine learning and cognitive computing work together to provide government with anonymised insights into users and services at an aggregate level; and
• The Decision Engine: provides the rules that govern the provision of services, and links together the Service Lounge (entry point for users and trusted service providers) with the Personal Hub (what’s shared) and Smart Centre (data collation and analysis).
We believe that the Syndesic Service Model will address some of the deficiencies and challenges of the traditional, transactional approach and also some of the issues relating to the current digital government agenda.
We also believe that this model will both empower government organisations to better perform their role and also improve the public’s perception of the services they receive from government delivery providers.
Importantly, the inclusion of ‘security by design’ will ameliorate many key concerns over potential data breaches. Individuals will also have full control over their personal data, including how it is used and with whom it is shared.
We often hear how short-term horizon thinking hampers efforts to plan for the longer term, and we must recognise that change takes time. Redesigning services that support millions of transactions and people is no easy task; in order to have a mature new way of delivering services in a decade, we need to start today.
Telstra welcomes the opportunity to discuss this conceptual model in more detail.
47
With over 18 years’ experience in providing advice, influencing and executing technology and business strategies – along with a background in diverse environments, ranging from start-up companies in Europe to academia and large multinationals in Australia – Dr Jack R Dan brings new perspectives to addressing the challenges of the public sector, and ultimately delivering for the public.
Currently, Jack is the National General Manager for Government at Telstra, with responsibility across strategy and thought leadership, capability development, business relationship and engagement for the government sector.
Jack is also leading Telstra’s premier research and thought leadership program, the Connected Government Program, helping government leaders to address challenges in policy development, service delivery, program implementation and government to citizen engagement.
In addition to his executive role, Jack holds non-executive positions and is an active member of several not-for-profit, industry and professional organisations. Jack holds a number of degrees, including a Doctor of Philosophy (PhD) and a Master of Management, both from the Australian National University.
RESEARCH BACKGROUND AND METHODOLOGY
As part of the Connected Government Program, Telstra worked with a number of research organisations to develop the primary research used in this report.
Telstra commissioned the Social Research Centre (SRC), a wholly owned subsidiary of the Australian National University, to undertake a quantitative research study of Australians’ experiences with and attitudes towards digital government services.
The survey was conducted online between 7 and 13 April 2015 via a single opt-in (non-probability) ‘research only’ online panel. The in-scope population was defined as Australian adults aged 18 years. The final sample size for the survey was 2,009.
Given the survey methodology, caution must be applied when drawing wider conclusions about the findings presented in this report.
Telstra also commissioned the Institute for Governance and Policy Analysis, University of Canberra, to undertake a qualitative research study of the opportunities and challenges of the public sector in a digital world.
Thirty-four in-depth interviews were conducted between February and March 2016 with a cross section of public sector leaders from federal and state government organisations.
The full findings of this research are available in the “Connected Government: Towards Digital-Era Governance” report.
ABOUT THE AUTHOR
Dr Jack R Dan

48
©2016 Telstra Corporation Limited. All rights reserved.
No part of this document may be released, distributed, reproduced, copied, stored, or transmitted in any form or by any means, without the prior written permission of Telstra Corporation Limited.
Telstra, the Telstra logo, spectrum device, ™ and ® are trademarks of Telstra Corporation Limited, ABN 33 051 775 556.