connecticut supportive housing demonstration program … · connecticut supportive housing...
TRANSCRIPT
Connecticut Supportive Housing Demonstration Program
May 2002 Final Program Evaluation Report Prepared by: Arthur Andersen LLP University of Pennsylvania Health System Department of Psychiatry Center for Mental Health Policy and Services Research Kay E. Sherwood TWR Consulting Prepared for:
The Corporation for Supportive Housing 129 Church Street, Suite 815 New Haven, CT 06510 Phone: 203-789-0826 www.csh.org This evaluation report was produced with the generous assistance of:
The State of Connecticut The Melville Charitable Trust
TABLE OF CONTENTS Executive Summary Chapter I: The Effect of Supportive Housing on Tenants, Including Utilization and Costs of Services Chapter I Introduction The Housing……………………………………………………………………………… 1 Shelter Plus Care………………………………………………………………………… 2 Services…………………………………………………………………………………… 2 The Evaluation and Data Sources……………………………………………………… 2 The Evaluation Questions………………………………………………………………. 2 Tenant Survey Instruments……………………………………………………………... 3 Secondary Data………………………………………………………….……………….. 4 Expectations………………………………………………………………………………. 5 Findings Tenants’ Demographic Characteristics……………………………….……………….. 5 Other Characteristics of the Tenants Served………………………………………….. 7
Additional Descriptions of Shelter Plus Care Tenants………………………………. 10 Medicaid Services Utilization and Related Costs…………………………………….. 11 Larger Group of Medicaid-covered Service Users………………………….. 11 Service Utilization by S+C tenants…………………………………………… 19 Long-Stay Medicaid Sample of Tenants……………………………………... 23 Outcomes of Tenants in the 36-Month Sample……………………………….……………….. 24 Tenants Who Have Left the Housing………………………………………….……………….. 29 Discussion and Summary………………………………………………………………………… 32 Glossary………………………………………………………………………………..…………… 34 References………………………………………………………………………………………….. 36 Appendix A………………………………………………………………………………………… 38 Chapter II: Project Financial Stability Chapter II The Occupancy and Turnover Rates for Each Project Occupancy Rates…………………………………………………………………………. 1 Comparison to Last Year’s Findings…………………………………………. 2 Turnover Rates…………………………………………………………………………… 3 Comparison to Last Year’s Findings…………………………………………. 3 The Effect of the Following Variables on the Long Term Feasibility of the Projects
Terms of the Subsidies…………………………………………………………….…….. 4 Future Capital Costs………………………………………………………………….…. 5
______________________________________________________________________________________ Connecticut Supportive Housing Demonstration Program Table of Contents Page 1
Chapter II: Project Financial Stability (continued)
Sponsors’ and Property Managers’ Ability to Plan Future Capital Needs………… 7 Potential Changes in Future Funding…………………………………………………. 7
The Consistency of Project Performance The Original Projections…………………………………………………………….…... 11 Liberty Commons………………………………………………………………. 12 Hudson View Commons………………………………………………………. 13 Crescent Apartments…………………………………………………………... 14 Colony Apartments……………………………………………………………. 15 Brick Row Apartments………………………………………………………… 16 Mary Seymour Place…………………………………………………………… 17 Cedar Hill……………………………………………………………………….. 18 Fairfield Apartments…………………………………………………………… 19 Atlantic Park……………………………………………………………………. 20 Future Trends…………………………………………………………………………….. 21
The Impact of the Following Groups on the Financial Performance and Stability of the Projects
Property Management……………………………………………………………….….. 26 Occupancy and Turnover Rates………………………………………………. 26 Bad Debt and Maintenance Expenses………………………………………... 27 Bad Debt Collectability………………………………………………………… 27 Bad Debt Analysis……………………………………………………………… 27 Repairs and Maintenance Analysis…………………………………………... 28
Liberty Commons…………………………………………………………… 28 Hudson View Commons…………………………………………………… 29 Crescent Apartments……………………………………………………….. 30 Colony Apartments…………………………………………………………. 31 Brick Row…………………………………………………………………….. 32 Mary Seymour Place………………………………………………………… 33 Cedar Hill Apartments……………………………………………………… 34 Fairfield Apartments………………………………………………………... 35 Atlantic Park…………………………………………………………………. 36
Social Services Staffing……………………………………………………………….. 37 The Impact of Tenant Mix to the Performance and Stability of Each Project……………….. 38 Comparison to Last Year’s Findings…………………………………………………… 38 Conclusions – Project Financial Stability……………………………………………………….. 39 Final Thoughts…………………………………………………………………………………….. 43 Chapter III: Impact of the Projects on Neighboring Property Values Chapter III Liberty Commons…………………………………………………………………………………. 2 Hudson View Commons…………………………………………………………………………. 4 Crescent Apartments……………………………………………………………………………… 6 The Colony Apartments………………………………………………………………………….. 7
_____________________________________________________________________________________ Page 2 Table of Contents Connecticut Supportive Housing Demonstration Program
Brick Row Apartments……………………………………………………………………………. 8 Mary Seymour Place………………………………………………………………………………. 9 Cedar Hill Apartments……………………………………………………………………………. 10 The Fairfield Apartments…………………………………………………………………………. 11 Atlantic Park……………………………………………………………………………………….. 12 Conclusion…………………………………………………………………………………………. 13 Appendix Appendix
Connecticut Supportive Housing Demonstration Program – The Projects…………………. A The Consultants……………………………………………………………………………………. B
______________________________________________________________________________________ Connecticut Supportive Housing Demonstration Program Table of Contents Page 3
LIST OF TABLES
Chapter I: The Effect of Supportive Housing on Tenants, Including Utilization and Costs of Services
Chapter I Table 1: Demographic Characteristics and Veteran Status of All Tenants and Four
Tenant subgroups………………………………………….…………………………...
7 Table 2: Tenants Historical Characteristics…………………………………………………… 8 Table 3: Self-reported Residential Situations Prior to Entry into the Housing……………. Table 4: 30 Month Sample Behavioral Health Status………………………………………… 24 Table 5: 30 Month Sample Primary Health Status………………..………………………….. 25 Table 6: 30 Month Sample Employment Status………………………………………………. 26 Table 7: 30 Month Sample Income Source……………………………………………………. 26 Table 8: 30 Month Sample Reported Activities and Functioning…………………………... 27 Table 9: 30 Month Sample Reported Problems……………………………………………….. 28 Table 10: 30 Month Satisfaction with Different Aspects of the Projects……………………. 28 Table 11: 30 Month Sample Satisfaction with Housing and Services…………………….… 29 Table 12: Demographic Characteristics and Veteran Status of Exit-Related Tenant
Subgroups……………………………………………………………………………...
30 Table 13: Tenant Turnover Rates by Sites ………………………………………….…………. 30 Table 14: Reasons for Exit by Facility ………………………………………….……………… 31 Table 15: Historical and Current Characteristics of Exit-related Tenant Subgroups……... 32 Chapter II: Project Financial Stability Chapter II Occupancy Rates…………………………………………………………………………………. 2 Turnover Rates…………………………………………………………………………………… 3 Terms of Shelter Plus Care Subsidy……………………………………………………………. 5 Original Replacement Reserve Projections vs. Actual Capital Expenditures and
Replacement Reserve Withdrawals………………………………………………………..
6 Future Capital Needs……………………………………………………………………………. 7 Operating and Replacement Reserves – Projected vs. Actual……………………………….. 8 Additional Funding Received by Projects……………………………………………………... 10 Comparison of Income and Expense Projections with Actual
Liberty Commons…………………………………………………………………………… 12 Hudson View Commons…………………………………………………………………… 13 Crescent Apartments……………………………………………………………………….. 14 Colony Apartments………………………………………………………………………… 15 Brick Row Apartments……………………………………………………………………… 16 Mary Seymour Place………………………………………………………………………… 17 Cedar Hill……………………………………………………………………………………. 18 Fairfield Apartments………………………………………………………………………... 19 Atlantic Park…………………………………………………………………………………. 20
2000 Historical Performance as Compared to 2001 Management Budgets………………… 21 2001 Management Budgets as Compared to NEF’s 2001 Projections………………………. 23 Security Measures and Expenses ……………………………………………………………… 25 Bad Debt Analysis……………………………………………………………………………….. 27
_____________________________________________________________________________________ Page 4 Table of Contents Connecticut Supportive Housing Demonstration Program
LIST OF TABLES (CONTINUED)
Chapter II Repairs and Maintenance Expense
Liberty Commons…………………………………………………………………………… 28 Hudson View Commons…………………………………………………………………… 29 Crescent Apartments……………………………………………………………………….. 30 Colony Apartments.………………………………………………………………………… 31 Brick Row.……………………………………………………………………………………. 32 Mary Seymour Place………………………………………………………………………… 33 Cedar Hill Apartments……………………………………………………………………… 34 Fairfield Apartments………………………………………………………………………... 35 Atlantic Park…………………………………………………………………………………. 36
Comparison of Turnover Rate to Social Service Staffing…………………………………….. 37 Average Cost of a Vacant Unit…………….………………………………………………….… 38
LIST OF FIGURES Chapter I: The Effect of Supportive Housing on Tenants, Including Utilization and Costs of Services
Chapter I Figure 1: Referral Source (S+C Tenants)………………………………………………………. 10 Figure 2: Disabilities (S+C Tenants)……………………………………………………….…... 10 Figure 3: Duration of Homelessness (S+C Tenants)…………………………………………. 11 Figure 4: Average Medicaid Reimbursement for Substance Abuse and Medical
Inpatient Services (Medicaid Covered Tenants)…………………………………...
12 Figure 5: Number of Substance Abuse and Medical Inpatient Service Users (Medicaid
Covered Tenants)……………………………………………………………………...
13 Figure 6: Average Medicaid Reimbursement for Pharmacy, Home Health Care and
Medical Equipment (Medicaid Covered Tenants)…………………………………
14 Figure 7: Number of Pharmacy, Home Health Care and Medical Equipment Users
(Medicaid Covered Tenants)…………………………………………………………
15 Figure 8: Average Medicaid Reimbursement for Ambulatory Substance Abuse,
Medical, Psychiatric and CAM Services (Medicaid Covered Tenants)………….
16 Figure 9: Number of Users of Ambulatory Substance Abuse, Medical, Psychiatric and
CAM Services (Medicaid Covered Tenants)……………………………………….
17 Figure 10: Average Medicaid Reimbursement for Physician Care, Care by Other Health
Providers and Dental Care (Medicaid Covered Tenants)……………………….
18 Figure 11: Number of Users of Physician Care, Care by Other Providers and Dental
Care (Medicaid Covered Tenants)…………………………………………………
18 Figure 12: Average Medicaid Reimbursement for Substance Abuse and Medical
Inpatient Services (S+C Tenants)…………………………………………………..
19 Figure 13: Number of Users of Substance Abuse and Medical Inpatient Services (S+C
Tenants)……………………………………………………………………………….
19 Figure 14: Average Medicaid Reimbursement Pharmacy, Home Health Care and/or
Medical Equipment Services (S+C Tenants)…………………..………………….
20 Figure 15: Number of Users of Pharmacy Services, Home Health Care and Medical
Equipment (S+C Tenants)………………………………………………………….
20 Figure 16: Average Medicaid Reimbursement Substance Abuse, Medical, Psychiatric
and for Ambulatory CAM Services (S+C Tenants)………………………………
21 ______________________________________________________________________________________ Connecticut Supportive Housing Demonstration Program Table of Contents Page 5
_____________________________________________________________________________________ Page 6 Table of Contents Connecticut Supportive Housing Demonstration Program
LIST OF FIGURES (CONTINUED)
Figure 17: Number of Users of Ambulatory Substance Abuse, Medical, Psychiatric and
CAM Services (S+C Tenants) ………………………………………………………
22 Figure 18: Average Medicaid Reimbursement for Physician Care, Care by Other
Providers and Dental Care (S+C Tenants)………………………………………...
22 Figure 19: Number of Users of Physician Care, Care by Other Providers and Dental
Care (S+C Tenants)…………………………………………………………………..
23 Chapter I, Appendix A Figure A-1: Average Medicaid Reimbursement for Substance Abuse and Medical
Inpatient Services (Long-stay, Medicaid-covered tenants)…………………….
38 Figure A-2: Number of Users of Substance Abuse and/or Medical Inpatient Services
(Long-stay, Medicaid-covered tenants)………………………………...………...
38 Figure A-3: Average Medicaid Reimbursement for Pharmacy, Home Health Care or
Medical Equipment Services (Long-stay, Medicaid-covered tenants)…….….
39 Figure A-4: Number of Users of Pharmacy, Home Health Care and/or Medical
Equipment (Long-stay, Medicaid-covered tenants)…………………………….
39 Figure A-5: Average Medicaid Reimbursement for Ambulatory Substance Abuse,
Medical or Psychiatric Services (Long-stay, Medicaid-covered tenants)……..
40 Figure A-6: Number of Users of Physician Care, Dentists and Other Providers (Long-
stay, Medicaid-covered tenants) ………………………………………………….
40 Figure A-7: Average Medicaid Reimbursement for Physician Care, Dentists and Other
Providers (Long-stay, Medicaid-covered tenants)………………………………
41 Figure A-8: Number of Users of Physician Care, Dentists and Other Providers (Long-
stay, Medicaid-covered tenants)…………………………………………………..
41
EXECUTIVE SUMMARY In the early 1990’s, Connecticut was one of many states across the country that experienced a phenomena that stimulated the search for new housing solutions and new community-based services. Homeless shelters were at capacity, hospitals around the State were treating numerous episodes of illness and injury among indigent, often homeless, abusers of alcohol and drugs, and the State of Connecticut had been progressively discharging long-term patients from its three large mental health hospitals for several years. The State of Connecticut (the “State”) and the Corporation for Supportive Housing (CSH”), a national, nonprofit intermediary organization whose mission is to expand the quantity and quality of service-supported, permanent housing for individuals with special needs who are homeless or at risk of becoming homeless, joined forces in June 1992 to design and implement a demonstration program to address the housing issues facing homeless and at-risk populations. The understanding between the parties was that the State would identify the necessary financing and, if this were accomplished, CSH would dedicate $900,000 of its own national funds to the initiative, raise matching funds locally, make equity investment proceeds available to the project, and staff the development of the Program. The production target was 400 units of housing to serve the intended population by bringing together multiple forms of public and private financing, by working through community acceptance and approvals for specific supportive housing projects, by managing the project planning, construction and "rent up" of buildings, and by providing for effective, coordinated operation of both the building properties and the service programs for tenants. The joint initiative became the Connecticut Supportive Housing Demonstration Program (“the Program”), which ultimately produced 281 units of service-enriched permanent housing for homeless and at-risk populations. The concept of supportive housing had been tested on a relatively large scale in New York City, Chicago, and the San Francisco Bay Area by 1992 when the Melville Charitable Trust funded CSH to assess the feasibility of a supportive housing demonstration program in Connecticut. But the concept had not been tested to the same extent in mid-size cities like New Haven and Hartford, or in towns the size of New Britain and Middletown. Although there was a “model” for supportive housing, it would require adaptation to Connecticut's governmental structures and interests and to local conditions and needs. This study is an objective evaluation of that adapted model for supportive housing. The purpose of this study is to perform an objective evaluation of the Program in a number of key areas. One of the primary purposes of the study is to determine if stable housing reduces the need for expensive health and social services over time, enhances the quality of life of its residents, and allows residents to attend to their employment and vocational needs. This determination is being made through an analysis of data on the residents and their service usage over a three-year period. In addition, the study is intended to evaluate the financial stability of the projects participating in the Program over a three-year period. This report is the third and final of three reports that address these two key areas of tenant outcomes and project financial stability. Also included in this year’s study is an additional ______________________________________________________________________________________ Connecticut Supportive Housing Demonstration Program Executive Summary Page 1
chapter that updates from the first year’s report the data regarding the impact of the projects on neighboring property values. The first Program evaluation report, issued in October 1999, also included a financial analysis of the Program’s costs and its cost effectiveness, an assessment of the aesthetic and economic impact of the siting process, and an analysis of the development phase of the Program. Organization of Study This year’s study is divided into four components. The first component, the “Executive Summary”, details the highlights, conclusions, and recommendations of the other components of the report. The second component of the study, entitled “Effect of Supportive Housing on Tenants”, analyzes data derived from surveys that were completed by tenants, property managers, and social services providers. It also analyzes data regarding the use of social services by the tenants and the costs of Medicaid services rendered. The third component of the study, “Project Financial Stability”, evaluates the financial stability of the individual projects using defined and developed methodologies. The fourth component of the study is entitled “The Impact of the Projects on Neighboring Property Values”, and it analyzes the sales values of commercial properties in the projects’ neighborhoods to determine if property values have increased or decreased from the time before the projects were developed to the date of the first study and then through March 1, 2002. The Consultants This year’s evaluation was performed by two separate consultants: Arthur Andersen LLP and The Center for Mental Health Policy and Services Research of the Department of Psychiatry at the University of Pennsylvania Health Care System (“UPENN”). The Center for Mental Health Policy and Services Research of the Department of Psychiatry at the University of Pennsylvania Health Care System was engaged to produce a detailed description of the Program and to determine if the provision of stable housing reduces the need for expensive health and community social services over time. UPENN used both data derived from surveys and secondary data. The survey data came from two sources, tenants and service providers, including property (building) managers, social services directors or supervisors, and case managers/case workers. There were four survey instruments for tenants that were administered at six-month intervals by case managers/case workers as interviews. Property managers, social service supervisors, and case managers completed written survey instruments. Secondary data were obtained from two governmental agencies, the Department of Social Services, Medicaid Unit, and the ABBY client tracking system of the Connecticut Department of Mental Health and Addiction Services. Based on the data obtained, staff at UPENN prepared the chapter entitled “Effect of Supportive Housing on Tenants, Including Utilization and Costs of Services.” Arthur Andersen LLP, a multidisciplinary professional services firm, was engaged to collect and analyze data from project sponsors, property management, and social service providers and from CSH, local municipalities, and the State. In contrast to the first two evaluations, the data used to complete the financial stability analysis in this year’s study were derived from year-end 2000 audited financial statements and supporting documentation, as opposed _____________________________________________________________________________________ Page 2 Executive Summary Connecticut Supportive Housing Demonstration Program
to fourth quarter unaudited Statements of Cash Flow, which are submitted to the Connecticut Housing Finance Authority (“CHFA”) and the State of Connecticut Department of Economic and Community Development (“DECD”); from the original project projections prepared by underwriters at the National Equity Fund; from the 2001 budgets submitted by property management to DECD or CHFA; and from interviews with Program participants. Those data were used by Arthur Andersen to write the chapter of the report entitled “Project Financial Stability”. Data from the first year’s study and the Conn Comps and Warren Group property sales databases were compiled for Arthur Andersen to complete the chapter of the report entitled “The Impact of the Projects on Neighboring Property Values”. The Connecticut Supportive Housing Demonstration Program Statistics related to homelessness and persons at risk bear out the need for supportive housing that the State of Connecticut recognized during the early 1990’s. Forty-one shelters receiving State funding reported that about 15,600 different people used the shelters between October 1992 and September 1993. Approximately half of the shelter residents had been evicted by landlords or family and friends. Data from two years later showed that ninety-two percent of the single-person shelter population was concentrated in three counties - Fairfield, Hartford, and New Haven - although the shelters within the Connecticut Coalition to End Homelessness network were scattered across 25 towns. At the end of 1993, Connecticut had an estimated 25,000 cases of HIV/AIDS and the sixth highest per capita rate of AIDS cases in the nation. Furthermore, over the previous decade, the State had been progressively discharging long-term patients from its three large mental health hospitals, reducing beds in the facilities from 2,358 in 1983 to 1,186 in 1993, a decline of 62%. The Program was designed to provide supportive housing, which is a non-institutional form of housing for people who have special needs but who are able to live independently if they have some assistance. In supportive housing projects, tenants have their own apartments, they enter into rental agreements and pay their own rent, and the housing is intended to be permanent as long as the tenants abide by the terms of their leases. In most supportive housing projects, there is common space for tenants’ social activities and security systems to keep tenants safe and to control access to the project buildings. Although counselors are present during daytime and some evening hours, tenants are not required to obtain assistance from the social services providers – i.e., the utilization of case management services by the tenants is completely voluntary. Unlike the development of most residential programs for people with special needs, the development of supportive housing involves bringing together multiple forms of public and private financing, obtaining community acceptance and approvals for specific supportive housing projects, managing project planning, construction and “rent up,” and providing effective, coordinated operation of both the property and the service program. In addition to the usual housing development tasks of financing and siting, owners and property managers confront, with the advice of the on-site service providers, questions of tenant qualifications and tenant mix (both in terms of ability to pay rent and special needs); structural and other ______________________________________________________________________________________ Connecticut Supportive Housing Demonstration Program Executive Summary Page 3
building accommodations for special needs; tenant screening procedures; on-site staffing; security; eviction policies that would support the revenue needs of the buildings and the needs of vulnerable tenants; and protocols for communication between property managers and service providers.
_____________________________________________________________________________________ Page 4 Executive Summary Connecticut Supportive Housing Demonstration Program
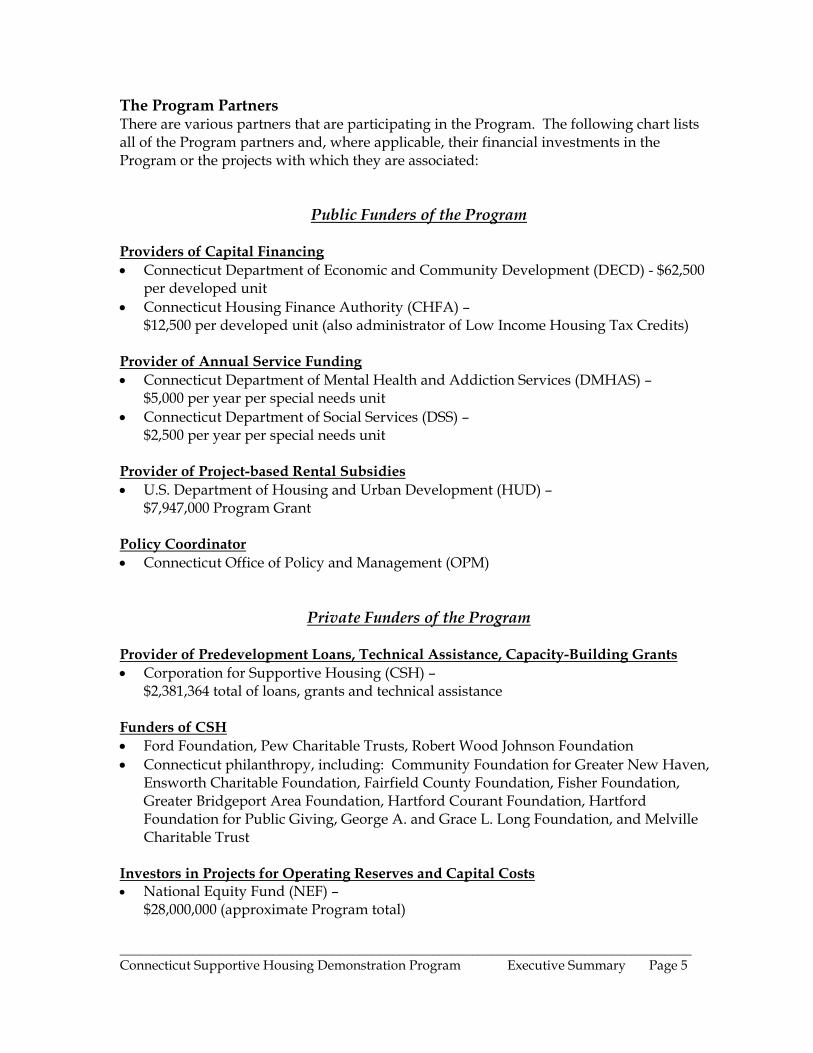
The Program Partners There are various partners that are participating in the Program. The following chart lists all of the Program partners and, where applicable, their financial investments in the Program or the projects with which they are associated:
Public Funders of the Program
Providers of Capital Financing • Connecticut Department of Economic and Community Development (DECD) - $62,500
per developed unit • Connecticut Housing Finance Authority (CHFA) –
$12,500 per developed unit (also administrator of Low Income Housing Tax Credits) Provider of Annual Service Funding • Connecticut Department of Mental Health and Addiction Services (DMHAS) –
$5,000 per year per special needs unit • Connecticut Department of Social Services (DSS) –
$2,500 per year per special needs unit Provider of Project-based Rental Subsidies • U.S. Department of Housing and Urban Development (HUD) –
$7,947,000 Program Grant Policy Coordinator • Connecticut Office of Policy and Management (OPM)
Private Funders of the Program Provider of Predevelopment Loans, Technical Assistance, Capacity-Building Grants • Corporation for Supportive Housing (CSH) –
$2,381,364 total of loans, grants and technical assistance Funders of CSH • Ford Foundation, Pew Charitable Trusts, Robert Wood Johnson Foundation • Connecticut philanthropy, including: Community Foundation for Greater New Haven,
Ensworth Charitable Foundation, Fairfield County Foundation, Fisher Foundation, Greater Bridgeport Area Foundation, Hartford Courant Foundation, Hartford Foundation for Public Giving, George A. and Grace L. Long Foundation, and Melville Charitable Trust
Investors in Projects for Operating Reserves and Capital Costs • National Equity Fund (NEF) –
$28,000,000 (approximate Program total)
______________________________________________________________________________________ Connecticut Supportive Housing Demonstration Program Executive Summary Page 5
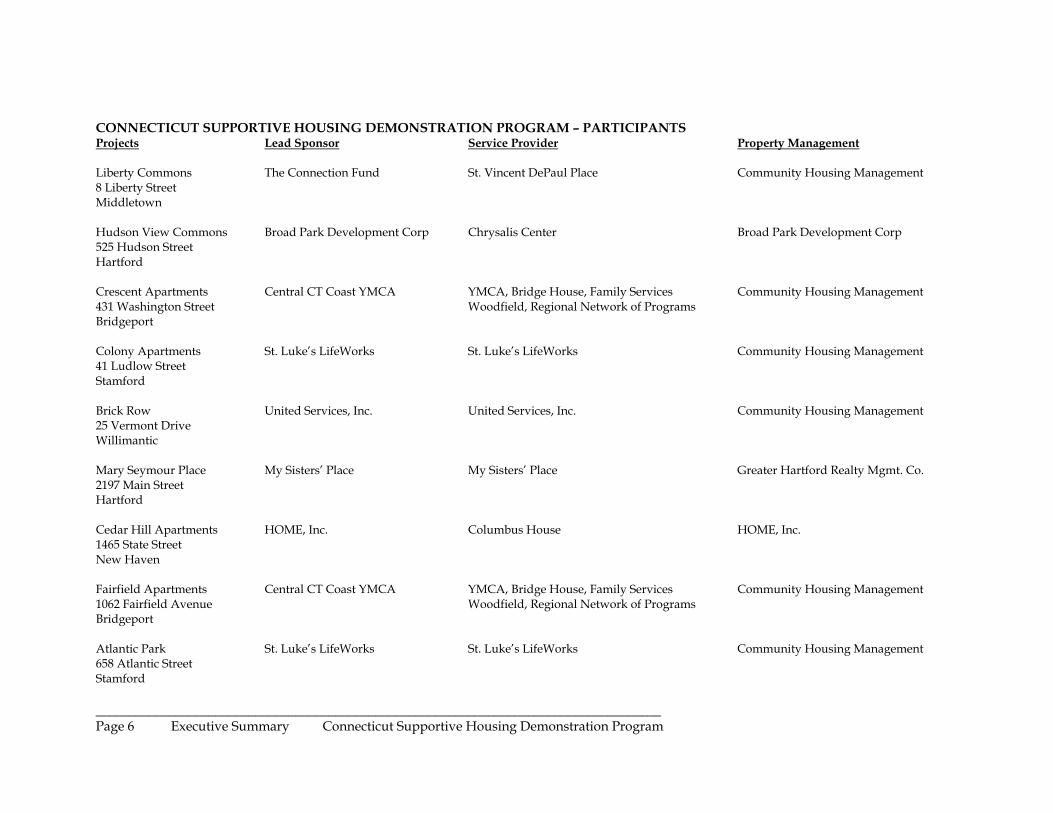
CONNECTICUT SUPPORTIVE HOUSING DEMONSTRATION PROGRAM – PARTICIPANTS Projects Lead Sponsor Service Provider Property Management
Liberty Commons 8 Liberty Street Middletown
The Connection Fund St. Vincent DePaul Place Community Housing Management
Hudson View Commons 525 Hudson Street Hartford
Broad Park Development Corp Chrysalis Center Broad Park Development Corp
Crescent Apartments 431 Washington Street Bridgeport
Central CT Coast YMCA YMCA, Bridge House, Family Services Woodfield, Regional Network of Programs
Community Housing Management
Colony Apartments 41 Ludlow Street Stamford
St. Luke’s LifeWorks St. Luke’s LifeWorks Community Housing Management
Brick Row 25 Vermont Drive Willimantic
United Services, Inc. United Services, Inc. Community Housing Management
Mary Seymour Place 2197 Main Street Hartford
My Sisters’ Place My Sisters’ Place Greater Hartford Realty Mgmt. Co.
Cedar Hill Apartments 1465 State Street New Haven
HOME, Inc. Columbus House HOME, Inc.
Fairfield Apartments 1062 Fairfield Avenue Bridgeport
Central CT Coast YMCA YMCA, Bridge House, Family Services Woodfield, Regional Network of Programs
Community Housing Management
Atlantic Park 658 Atlantic Street Stamford
St. Luke’s LifeWorks St. Luke’s LifeWorks Community Housing Management
_____________________________________________________________________________________ Page 6 Executive Summary Connecticut Supportive Housing Demonstration Program
Given that many State agencies changed names and functions between 1992 and the end of 1995, the remainder of this report will refer to these agencies by their present names and acronyms, except when historic accuracy is called for: DECD - Department of Economic and Community Development – the agency
that was created when the Department of Housing and the Department of Economic Development were consolidated into one agency;
CHFA - Connecticut Housing Finance Authority; DMHAS - Department of Mental Health and Addiction Services – the agency that was created when the Addiction Services Division of the Department of Public Health and Addiction Services and the Department of Mental Health were consolidated into one agency;
DSS - Department of Social Services – the agency that was created when the Department of Human Resources and the Department of Income Maintenance were consolidated into one agency; and
OPM - Office of Policy and Management- the State agency responsible for policy coordination.
In April 1994, a Memorandum of Understanding (“MOU”) was entered into between CSH and six State agencies – OPM, DECD, DMHAS, DSS, CHFA and the Department of Public Health and Addiction Services, which at the time was the State agency responsible for services to people with addictions. In the Memorandum of Understanding the State agreed to provide financial resources through CHFA and DECD for the Program to develop the project sites. DMHAS and DSS agreed to provide annual grants to the Program for on-site supportive services. CSH agreed to provide predevelopment financing to project sponsors and to provide grants to individual sponsors on an as-needed basis for core operating support. An interagency Taskforce chairperson was chosen to facilitate the overall coordination among Taskforce members, to convene meetings of the Taskforce, and to serve as the point person on press issues. The project sponsors are community-based, nonprofit organizations that developed the projects and that serve as the general partners of the partnerships that own the projects. The selection of sponsors began in early 1993 with the publication of a request for qualifications (or “RFQ”) from not-for-profit organizations interested in the development and management of housing and the provision of supportive services to homeless, at-risk and low income individuals. Of the 28 applicants responding to the RFQ, ten organizations were selected to develop a total of 12 projects, two each in Bridgeport, Hartford and Stamford, and single projects in Bristol, Meriden, Middletown, New Britain, New Haven, and Willimantic (Windham) (the projects in Bristol, Meriden and New Britain were never built). Project sponsors then chose property management companies to operate the projects and nonprofit social service providers to provide on-site support services to the tenants. Other partners include the national foundations (Ford Foundation, Pew Charitable Trusts, Robert Wood Johnson Foundation) and Connecticut philanthropy that fund CSH’s efforts to provide predevelopment loans, technical assistance, and capacity-building grants. The U.S.
______________________________________________________________________________________ Connecticut Supportive Housing Demonstration Program Executive Summary Page 7
Department of Housing and Urban Development provides project-based Shelter Plus Care rental subsidies that are administered by DMHAS. Federal Low Income Housing Tax Credits (“LIHTC”) are administered by CHFA and distributed to the projects to stimulate corporate investment. Corporate investment in the projects for operating reserves and capital costs is provided through the National Equity Fund. Interagency Collaboration The Connecticut Supportive Housing Demonstration Program represented a unique arrangement to accomplish a State objective in 1992. It entailed partnerships, collaborative work, and consensus decision-making of many types and at many levels. Among the organizational features that marked the Program as pioneering at the time were: • The involvement of six state agencies in a single initiative with the objective of
providing coordinated, simplified, and expedited development and oversight of the initiative.
• A substantial role for private entities in the initiative - including coordination and
leadership on some aspects. Specifically, the Corporation for Supportive Housing was a partner with the State in developing the Program, and was the primary source of money for pre-development costs of supportive housing projects and of technical assistance to the projects. Also, the National Equity Fund played a key role in Demonstration Program project financing.
• A collaborative grant-making initiative by nine Connecticut foundations to finance
CSH's work in the State and to create a pool of funds for CSH to lend and re-grant to supportive housing sponsors to cover predevelopment and "soft" costs of the projects.
• Formal structures and agreements to join local housing developers and social
service providers in the same projects as well as parameters for project design and service program implementation that encouraged and facilitated a collaborative approach to the day-to-day operation of housing with services.
• Agreements and procedures for one state agency (DSS) to transfer funds for
services in the Demonstration projects to another State agency (DMHAS) and the authority to administer those funds; and agreements and procedures for a single quasi-governmental organization (CHFA) to oversee the development of projects that were financed with its own resources and with the resources of a State agency (DECD).
These unprecedented ways of doing business in the Supportive Housing Demonstration Program were intended to make possible a type of housing that most Program partners believed could only be created by bringing together different professions, different sources of funding, and different regulatory and oversight authorities under an integrated system of some type. To some partners, these new ways of doing public business constituted part of the
_____________________________________________________________________________________ Page 8 Executive Summary Connecticut Supportive Housing Demonstration Program
model for supportive housing generally, or for the Connecticut Demonstration Program specifically. Development of projects was expected to begin in January 1993, with the whole process of site selection, design, bidding and construction to take from 12 to 30 months after that, depending on the specific plans for each project. The nine projects of Connecticut's Supportive Housing Demonstration Program that were built and occupied actually opened their doors between June 1996 and June 1998. Because the development of supportive housing is extraordinarily complex in the best circumstances, and it was untested in Connecticut at the beginning of the Program, the first project opened its doors almost 2 ½ years later than was originally planned. The Financing and Development of Program Projects In the MOU entered into in April 1994, DECD agreed to provide a total of $20 million in taxable bond financing and CHFA agreed to provide a total of $4 million in loan funds from the proceeds of its Investment Trust Fund for the projects developed under the Program. DECD and CHFA provided capital financing in the form of construction and permanent loans at an interest rate of one percent annually. Loan principal is due as a balloon payment upon the earlier of sale or refinancing of the projects or at the end of 30 years. Based on the funding amounts authorized by DECD and CHFA, DECD provided $62,500 in financing per Program unit and CHFA lent $12,500 per unit. Two of the projects received DECD’s financing under the Affordable Housing Program, a third project received its financing through the Community Housing Development Corporation financing program, and the remaining six projects received their DECD funding from the PRIME financing program. In addition to providing the capital financing, the State has incurred the costs of funding on-site supportive services. DSS and DMHAS agreed in the MOU to provide an annual, pooled support service grant of $7,500 per unit reserved for persons with identified special needs. DMHAS disburses the funds and is required to examine the total on an annual basis and to budget additional funds, if needed and available, to cover inflationary escalations in project service costs. The State intends for the grants to be renewed annually during the term of the DECD and CHFA mortgage loans, unless the MOU is terminated. Currently, the cost to the State of funding the on-site supportive services is $1,071,944 per year. The projects were also financed using the Low Income Housing Tax Credit program (LIHTC), which is a Federal program that provides dollar-for-dollar tax credits to owners and investors in low income rental housing. Each project created a fund to finance shortfalls in revenue (which were expected, given the low incomes of the intended tenants) by "selling" the tax credits allocated to the projects by CHFA. The tax credits were syndicated by the National Equity Fund to yield a 15-year stream of investment income for corporate investors, who in turn provided cash to capitalize the operating reserves of the projects and to cover development costs above the $75,000 per unit limit of the loan terms. NEF effectively became a limited partner in the projects, representing the tax credit investors, and the tax credit market tapped by NEF eventually produced about $28 million for this purpose, ranging from
______________________________________________________________________________________ Connecticut Supportive Housing Demonstration Program Executive Summary Page 9
$1.3 to $3.2 million per project, depending on the number of project units. CSH administers the operating reserve funds for the projects, disbursing payments on the basis of DECD- and CHFA-approved budgets. DMHAS administers project-based rental subsidies on behalf of the Program projects for units reserved for people qualified under the U.S. Department of Housing and Urban Development's Shelter Plus Care Program. (These are 5 to 10-year federal subsidies requiring a match of state funds.) The total value of the subsidies to the Program reached approximately $8 million for 138 of the 281 units developed under the Program. Funds to cover predevelopment costs, including fees associated with site control, accounting, appraisal, architectural, engineering, environmental, legal, real estate and other services, insurance, property taxes, and other costs incurred prior to construction loan closing, were provided by CSH to projects through a line of credit averaging $100,000 per project. CSH was repaid by project sponsors out of construction loans (for mortgageable costs) or equity investment proceeds (for non-mortgageable costs such as developers' fees). Some of the project sponsors incurred predevelopment costs that could not be included within the overall costs that were mortgaged by CHFA and DECD. Therefore, those costs were deducted from the sponsors’ developer fees. Furthermore, most of the project sponsors provided or obtained some type of additional financial assistance for the development and operation of the projects. The Program Projects Nine housing projects were developed and are currently in operation under the Program. Each project consists of a single site with 25-40 housing units, generally efficiency and one bedroom apartments, along with common meeting rooms and staff offices. The first project that was developed is in Middletown, two are in Hartford, one is in Willimantic, two are in Bridgeport, one is in New Haven, and two are in Stamford. One of the project sponsors in Hartford, as well as the project sponsors in New Haven and Stamford, serve as managers of the properties, in addition to their roles as the project sponsors. The project sponsors in Willimantic, Bridgeport, Stamford, and one of the Hartford sites also provide the social services at those six locations. Appendix A contains a complete listing and brief description of each of the Program projects. The Program Tenants The tenants participating in the Connecticut Supportive Housing Demonstration Program are all single people with low incomes (at least fifty percent below the median annual income, as determined by HUD). At least seventy percent of the projects’ apartments are reserved for occupancy by individuals who were formerly homeless or at risk of homelessness, and approximately fifty percent are reserved for individuals with identified special needs, such as serious mental illness, chronic substance abuse problems, or HIV/AIDS.
_____________________________________________________________________________________ Page 10 Executive Summary Connecticut Supportive Housing Demonstration Program
The Demonstration Program was designed specifically to serve a population with a high level of need, and it does. Four hundred and forty-four individuals enrolled as tenants between the opening of the first project in June 1996 and the end of February 2001. Of the enrolled tenants, UPenn reported demographic data in this report on the 430 individuals who entered the housing, completed enrollment forms and consented to participate in this evaluation. Seventy-eight percent of the tenants surveyed reported having been homeless at some point in their lives. Only thirty-eight percent had lived independently or with family in the time immediately before settling into the housing. Twenty-three percent of the tenants were living in homeless shelters or on the street in the time immediately before entering the Program. Eighty percent reported having moved at least twice in those two years. Nine percent of the survey respondents had been in foster care as a child, nine percent had been a victim of violence before the age of 18 and 30 percent had been the victim of violence after the age of 18 and in the two years prior to entering the housing. Twenty-three percent reported spending some time in jail or prison in the two years prior to entering the housing and 35 percent reported having been hospitalized for health reasons during that same time period. Thirty-five percent reported receiving mental health treatment in the two years prior to entering the housing and 30 percent received detox services during that time. UPENN also found that of the survey respondents that were living in homeless shelters or on the street immediately before entering the Program, those respondents had spent an average of 15 months in those prior housing situations. Those respondents who lived independently or with family immediately before settling into the Program spent an average of 35 months in their prior living situations. Of the remaining respondents, 13 percent were in congregate living situations, four percent were in hospitals/residential programs, six percent were in unknown or other situations (including transitional housing, correctional facilities, and campgrounds, among other living situations), and 16 percent were missing data regarding their living situations immediately before entering the Program. Fifty-seven percent of the tenant respondents reported never abusing alcohol and 67 percent said that they never abused drugs in the two years prior to tenancy. The term “abuse”, however, is open to interpretation. Of the tenant respondents, 66 percent are men, 45 percent are African-American, a third are European-American, and 12 percent are Hispanic. Five percent responded as veterans and the average age of entry into the housing is approximately 43 years. Staffing at the Projects Project management in each of the nine projects generally has at least one staff person on-site during the day and someone on beeper during evenings and weekends. The on-site staff person may be either the property manager, an assistant to the property manager, or a maintenance superintendent. At least one case manager is also on-site during the day and
______________________________________________________________________________________ Connecticut Supportive Housing Demonstration Program Executive Summary Page 11
sometimes on Saturday. Like property management, the social services staff is accessible by beeper at night and on weekends. Generally, property managers make the decisions about who is accepted for tenancy. There is an application process to get into the housing, which includes an interview and credit check. To be considered for tenancy, applicants must have some housekeeping and cooking skills, must be able to look after themselves, and must have income adequate to pay at least a minimal rent. Reasons for rejecting an applicant include a history of violence, fire setting, and certain drug-related criminal activities. As in most congregate residential settings from condominiums to cooperatives, all of the projects have house rules. Rules about overnight visitors vary from site to site, with most sites allowing overnight visitors for a limited number of nights. Only one site reported not allowing overnight guests at all. The enforcement of the house rules falls to the property managers. Rule violations may result in verbal or written warnings or in Notices to Quit. All projects have case management services available to all tenants. Case management services include linkage with other service providers, help with grocery shopping, and just “being there” as a supportive, caring person. One of the most important roles of the social service providers is to act as an advocate or interested party when a tenant is in danger of being evicted or is facing legal action for nonpayment of rent or for violation of another lease provision. When a tenant is in danger of facing legal action that will affect their housing, social service staff will talk to the tenant to determine the reason(s) why the tenant is not abiding by the provisions of the lease. Social service staff will then attempt to work with the tenant and with property management to remedy the issue. Case managers/case workers all reported having at least an associate degree and several reported having Master’s degrees. Nurse visits and housekeeping services were also delivered on site. Results of UPENN’S Analysis (Chapter 1) This chapter of the evaluation focused on four aspects: 1) a description of the tenants, in terms of both demographic and other characteristics; 2) detailed data on patterns of tenants’ service utilization over five years, from 24 months prior to 36 months following entry into the housing; 3) key outcomes and changes in health from entry to three years later; and 4) findings on turnover and on differences and similarities among all tenants, those who left for good reasons and those who were evicted. UPENN performed its analysis by focusing on five sub-samples of tenants that consisted of the following: 1) 430 tenants who entered the housing, completed enrollment forms and consented to participate in the evaluation, 2) a 30-month evaluation sample of 54 tenants for whom there were enrollment, initial and periodic survey data; 3) the full Medicaid sample of 126 tenants for whom there were five years of Medicaid service utilization data, regardless of whether they remained in the housing for three years; 4) the long-stay Medicaid sample of 79 tenants for whom there were Medicaid data and who stayed in housing for at least three years; 5) and the Shelter plus _____________________________________________________________________________________ Page 12 Executive Summary Connecticut Supportive Housing Demonstration Program
Care sample of 82 tenants who were part of the Shelter Plus Care Program, who agreed to take part in the evaluation (regardless of their length of stay) and for whom there were Medicaid data. Seven major findings highlight the results of this evaluation. First, the Program serves the intended population. As intended, a very large proportion of the tenants have a history of residential instability including being homeless or at risk of homelessness, having moved a great deal and doubling up with others. Smaller, but material proportions of the tenants have significant disabilities, including mental illness, substance abuse or serious physical disabilities that meet the eligibility criteria for the Program. A very important finding revealed positive outcomes. Tenants functioned at high levels, were able to develop goals and direction for themselves, progressed toward greater independence, and were satisfied with most aspects of the Program. While tenants expressed awareness of and concerns about social isolation, overall, the finding suggest that being in the housing is beneficial for the people it is designed to serve. The third major finding is that, as a group, the tenants decreased their utilization of acute and expensive health services, mostly medical inpatient services. The decrease in use of medical inpatient was true for most subgroups. Fourth, there was an increase in tenants’ utilization of necessary on-going health care and support. Utilization increased in services, such as home healthcare and outpatient substance abuse treatment services, that enabled tenants to remain in the community, rather than be hospitalized The fifth finding relates to an increased efficiency in the utilization of healthcare resources by a larger number of people. The average cost of healthcare service utilization decreased for inpatient services and increased for home healthcare and outpatient substance abuse treatment. The number of service users tended to increase (with the exception of inpatient). Comparisons of the tenant subgroups identified the S+C tenants as a most disabled group with the most troubled history. The small number of S+C users of specific services made some comparisons difficult. Overall, however, some utilization (e.g., of home healthcare) was higher for this group. Finally, over the course of four and a half years, approximately 39% of the tenants exited the housing and over a third (36%) of those who departed left under negative circumstances. While the number of negative exits represents 36% of all exits, only 14% of all tenants who entered the housing left for negative reasons. Even this small proportion is a matter of concern, because, as reported above, staying in the housing is related to substantive improvements in a variety of areas. Negative exits seemed to be associated with substance abuse, some aspects of functioning, not working toward goals in life, unemployment and social isolation. These findings, however, must be replicated and/or studied further to allow sound inferences. Overall, the findings were consistent with expectations. They also
______________________________________________________________________________________ Connecticut Supportive Housing Demonstration Program Executive Summary Page 13
support the importance of evaluation and documentation of the impacts of programs and interventions. Clearly, supportive housing presents both opportunities and challenges to policy makers, service providers and tenants. Supportive housing offers affordable housing, linkage to needed services, and is a desirable alternative to high-risk situations. It creates a better social environment, is financially sound and is likely to advance public health. The greatest challenges for supportive housing involve the need to reduce evictions, as well as continued documentation of the value added by supportive housing. Reducing negative exits might require better understanding of the determinants of dropouts and use of such knowledge to improve programs. Documentation of the value of supportive housing is essential for policy development and continued funding. Results of Project Stability Analysis (Chapter 2) This chapter of the study analyzed the financial stability of the nine projects financed by the Program: Liberty Commons in Middletown, Hudson View Commons in Hartford, Crescent Apartments in Bridgeport, Colony Apartments in Stamford, Brick Row in Willimantic, Mary Seymour Place in Hartford, Cedar Hill Apartments in New Haven, Fairfield Apartments in Bridgeport, and Atlantic Park in Stamford. As of December 31, 2000, all nine of the projects had been operating for at least thirty months. Overall, the nine projects appear to be financially stable. All but two of the projects have operating reserve balances that are greater than projected, and the other two projects that are behind their projections (Colony Apartments and Atlantic Park) have incurred security expenses that have been much greater than anticipated. The financial stability of those two projects should not, however, be impaired as long as future expenses are monitored and annual sources of revenue (such as rental income) are sufficient to offset the higher expenses. As with last year’s evaluation of all nine projects, the performance of parties who affect the financial stability of the projects has been commendable. Tenants are still not vacating the units in significant numbers, but when they do, the associated financial impact does not adversely affect the projects’ financial stability. As of December 31, 2000, all nine projects performed satisfactorily on a financial basis and the parties involved in managing the success of the projects continued to do so while under tight budgetary constraints. Some of the key findings of this year’s financial analysis are the following: Turnover and Occupancy Rates
_____________________________________________________________________________________ Page 14 Executive Summary Connecticut Supportive Housing Demonstration Program
As of December 31, 2000, the occupancy rates at each of the projects were high and only varied slightly. The lowest occupancy rate, 88.04 percent, was at Crescent Apartments. The highest occupancy rate, 99.43 percent, was at Colony Apartments. Of the eight projects included in this evaluation, five experienced increases in their occupancy rates since the last evaluation (Liberty Commons, Hudson View Commons, Colony Apartments, Cedar Hill
Apartments, and Atlantic Park). The remaining three projects (Crescent Apartments, Brick Row, and Fairfield Apartments) experienced decreases in occupancy rates ranging from 1.63 to 6.24 percentage points. Decreases in the occupancy rates are attributable to property administration issues and apartments remaining vacant for extended periods of time. The 2000 turnover rates for the eight projects included in this year’s evaluation were again not as consistent as the projects’ occupancy rates. Colony Apartments, which had the highest occupancy rate, also had the lowest turnover rate at 6.9 percent. Crescent Apartments, with the lowest occupancy rate, had the highest turnover rate at 21.1 percent. Of the eight properties analyzed, five of the projects (Liberty Commons, Colony Apartments, Brick Row, Cedar Hill Apartments, and Atlantic Park) experienced decreases in turnover rates. Hudson View Commons had a turnover rate equal to its 1999 rate and Crescent Apartments and Fairfield Apartments experienced increases of 10.6 and 8.8 percentage points, respectively, in their turnover rates. Units turned over for reasons ranging from moving to other housing because they considered supportive housing to be a transitional living arrangement, to evictions for non-payment of rent or other lease violations, to death of the tenant. The Effect of the Terms of the Subsidies on the Long Term Feasibility of the Projects All of the projects receive one subsidy, Shelter Plus Care, for a term of five or 10 years. If any of the projects are able to receive the subsidy for a longer term than forecasted, then the term of the subsidy will have an effect on the long-term feasibility of the project. The terms of the projects’ subsidies have not changed since the projects were underwritten; therefore, the effect of the subsidy on the overall performance of the projects has remained unchanged. In 2000, other developments in Connecticut that had expiring Shelter Plus Care subsidies were able to renew their subsidies for annual terms. The Effect of the Future Capital Costs on the Long Term Feasibility of the Projects Although replacement reserves for all nine projects are adequately funded, none of the nine projects have as yet budgeted the use of those funds for specific capital improvements. Each project has had sufficient funds from the operating reserve withdrawals to cover to-date capital expenditures. The Effect of the Sponsors’ and Property Mangers’ Ability to Plan Future Capital Needs on the Long Term Feasibility of the Projects Property management determines if there is a need for capital projects. Once property management decides if a capital project is necessary, property management approaches the sponsor with bids that management has received from contractors. Before a project can be started, however, the project sponsor must get approval from CHFA to incur the capital expense. None of the nine projects have budgeted replacement reserve funds for potential capital projects and the to-date capital expenditures have not had an effect on what was projected to be sufficient replacement reserves. ______________________________________________________________________________________ Connecticut Supportive Housing Demonstration Program Executive Summary Page 15
The Effect of Potential Changes in Future Funding on the Long Term Feasibility of the Projects The feasibility of the projects after the 15-year tax credit period expires is highly dependent upon the continued receipt of funding beyond tenant rent payments once the existing rent subsidies and operating reserves are exhausted. Greater future funding, in the form of an extension of the terms of the Shelter Plus Care subsidy or greater numbers of Section 8 certificates received by project tenants, may be sufficient to prevent the operating subsidy funds from being exhausted, as forecasted, by the end of the fifteenth year of the projects’ operations. Comparing the operating reserves to the original NEF projections, only two of the properties (Colony Apartments and Atlantic Park) are trailing their original operating reserve projections. Colony Apartments is behind its projections by $116,184 and Atlantic Park is behind by $92,079. Both of those projects also had operating reserve account balances that were significantly lower than NEF’s projections in 1999 due to the high costs of providing adequate security measures at the sites, which continued to be an issue through 2000. The other seven projects are ahead of NEF’s operating reserve account projections by amounts ranging from $10,278 to $232,412. Colony Apartments, Cedar Hill Apartments, and Fairfield Apartments are behind their replacement reserve projections by $737, $6,925, and $298, respectively. Colony Apartments and Fairfield Apartments are behind their replacement reserve projections due to the amount of interest that has been paid on those investment accounts. Cedar Hill is behind its replacement reserve projections due to the timing of the project commencing operations and contributing revenues to the replacement reserve account. The Consistency of Performance Based on Original Projection Assumptions for the Projects As of December 31, 2000, seven of the nine projects continued to exceed their original operating projections and assumptions on a cumulative basis. Colony Apartments and Atlantic Park were again behind their original cumulative operating projections, but by $57,011 and $38,052, respectively, as opposed to by $26,629 and $36,056 in 1999. For the projects that exceeded their cumulative projections and assumptions in 2000, the range of exceeded projections is from $21,412 for Brick Row to $95,064 for Mary Seymour Place. The Consistency of Performance Based on Future Trends The comparison of each project’s actual performance in 2000 to the 2001 operating budgets revealed that property management at all nine projects are creating relatively accurate annual budgets that reflect the needs of the projects, while remaining relatively consistent with prior years and inflation. The 2001 budgets were also compared to the original NEF projections to determine if future budgets are consistent with the original projections. The 2001 budget for each of the nine projects differs from the original projections due to various circumstances. Some projects have projected greater revenues because there are Section 8 subsidies contributing to their revenues or tenants are paying greater portions of their monthly rents than was originally _____________________________________________________________________________________ Page 16 Executive Summary Connecticut Supportive Housing Demonstration Program
anticipated. Expenses at the projects are typically budgeted to be greater than what was projected because projects have had to provide greater security measures than originally anticipated, along with other expenses that are greater than projected by NEF. While the security costs have been greater than expected and projected by NEF, those costs have not had adverse effects on the future operating reserves of seven of the nine projects and property management have been able to adjust those projects’ budgets to accommodate the increased security costs. Colony Apartments and Atlantic Park are the only two projects that are behind their cumulative NEF projections due to the amounts that have been withdrawn from their operating reserve accounts to fund security at their current levels. Although the project sponsor subsidized security costs at both sites using the projects’ DMHAS grants in 2000, additional sources of funds will necessary going forward so that the operating reserves will not be depleted faster than anticipated. Futhermore, for all of the projects, additional future resources will be needed to provide the projects with both adequate 24-hour security measures and adequate building services and amenities. The Impact of Property Management on the Financial Performance and Stability of the Projects Turnover and Occupancy Rates An analysis of turnover rates has demonstrated that property management has been able to retain more of the tenants in 2000 than 1999. The turnover rates range from a low of 6.9 percent to a high of 21.1 percent, opposed to a range of 5.9 percent to 37 percent in 1999. The analysis of the occupancy rates, which range from 88.04 percent to 99.43 percent, has demonstrated that even when a tenant vacates a unit, management is able to fill the unit in a short period of time. Bad Debt Analysis The inability to collect rents should not currently be considered a major issue for any of the nine projects because five of the nine properties have not had any bad debt expenses, nor have eight of the nine projects budgeted for the expense. Liberty Commons had $3,205 of bad debt expenses in 2000, Hudson View Commons had $5,025, Cedar Hill had $5,565, and Atlantic Park had $5,526. Although there is more bad debt reported in 2000 than other years, the expense is not at a level to be considered a major issue for any of the projects. Repairs and Maintenance Analysis An analysis of the 2001 budgeted Repairs and Maintenance expenses compared to the 2000 and 1999 actual expenses revealed that management at all nine of the projects have been budgeting reasonable amounts for said expenses. Although expenses at certain projects are budgeted to increase or decrease by considerable amounts in 2001, those increases/decreases are based on various issues that management has addressed. The actual cumulative Repairs and Maintenance expenses were compared to the budgeted cumulative expenses to determine whether the actual cumulative expenses were less than budgeted. The analysis disclosed that seven of the nine projects have cumulative Repairs
______________________________________________________________________________________ Connecticut Supportive Housing Demonstration Program Executive Summary Page 17
and Maintenance expenses that are less than budgeted. Mary Seymour Place is over its cumulative budget by $9,072 and Atlantic Park is over its cumulative budget $8,943. The Impact of Social Services Staffing on the Financial Performance and Stability of the Projects One of the most important roles of the social service providers is to act as an advocate or interested party when a tenant is in danger of being evicted or facing legal action for nonpayment of rent or for violation of another lease provision. When a tenant is in danger of facing legal action that will affect their housing, social services will talk to the tenant to determine the reason(s) why the tenant is not abiding by the provisions of the lease. Social services will then attempt to work with the tenant and property management to remedy the issue. Although there seemed to be a relationship in 1999 between the number of hours that case managers spend onsite and the retention of tenants, the same correlation cannot be made as of December 31, 2000. The project with the highest turnover rate, Cedar Hill, had case managers onsite for the median number of hours per week. The project with the lowest turnover rate, Colony Apartments, had case managers onsite for the least number of hours per week. In spite of the fact that no conclusion can be reached with regard to the relationship among onsite social service providers, property management, and tenant stability, there is a consensus that having social service providers onsite has proven to be a valuable resource that assists in addressing tenant issues and tenant retention. The Impact of Tenant Mix to the Performance and Stability of Each Project An analysis of the projects’ rent rolls revealed that 50 percent of the tenants at the nine projects are in fact Shelter Plus Care tenants. An analysis of the average cost of a vacant unit revealed that the average cost of a vacant unit is equivalent to two to three months’ rent at four of the nine projects. The average cost of a vacant unit is as such at those locations because most of the units were vacant for periods of time greater than two to three months. Crescent Apartments and Fairfield Apartments continued to have much higher average costs of a vacant unit ($3,610 and $2,916, respectively) because units remained vacant for extended periods of time at those two projects in 2000. Four of the other projects had average costs of a vacant unit that were less than one month’s rent to slightly more than one month’s rent. Disparities in the average costs of a vacant unit were attributable to the period of time that a unit remained vacant and the number of units that were vacated. Impact of the Projects on Neighboring Property Values (Chapter 3) The data collected to assess the impact of the projects on neighboring property values imply that the markets surrounding all but one of the projects improved from the date of our first evaluation, June 25, 1999, through March 1, 2002. Only the values of properties sold in _____________________________________________________________________________________ Page 18 Executive Summary Connecticut Supportive Housing Demonstration Program
______________________________________________________________________________________ Connecticut Supportive Housing Demonstration Program Executive Summary Page 19
Colony Apartments’ neighborhood in Stamford decreased during that time period. The decrease in values, however, was a nominal $1.96 weighted average price per square foot. The neighborhoods that experienced the most notable increases in property values since June 25, 1999 were those of Brick Row in Willimantic, which went from a weighted average price per square foot of $18.80 to $30.67 and Fairfield Apartments in Bridgeport, which went from a weighted average price per square foot of $42.40 to $53.73. The neighborhood surrounding Liberty Commons in Middletown experienced an increase from $22.56 to 31.76 in the weighted average price per square foot; that of Hudson View Commons in Hartford experienced an increase of $15.51 from $10.25 in the weighted average price per square foot; that of Crescent Apartments in Bridgeport increased from $14.21 to 15.36 in the weighted average price per square foot; that of Mary Seymour Place in Hartford increased from $13.13 to $22.13 in the weighted average price per square foot; that of Cedar Hill Apartments in New Haven increased from $28.27 to $31.50 in the weighted average price per square foot; and Atlantic Park’s neighborhood in Stamford experienced an increase of $77.61 from $70.16 in the weighted average price per square foot of the properties sold surrounding the project. From January 1, 1994 through March 1, 2002, values increased steadily in the neighborhoods surrounding Liberty Commons, Crescent Apartments, Brick Row, Mary Seymour Place, Cedar Hill Apartments, and Fairfield Apartments. Values in the neighborhoods surrounding Hudson View Commons and Atlantic Park had originally decreased from January 1, 1994 through June 25, 1999, but then the values in those two neighborhoods increased from of June 26, 1999 through March 1, 2002. The neighborhoods encompassing Liberty Commons, Hudson View Commons, Brick Row, Cedar Hill Apartments, and Atlantic Park all had properties sell both since January 1, 1994, then again as of March 1, 2002. Almost all of the properties in the five neighborhoods were purchased for higher prices once they sold the second time, which is a further implication that the neighboring property values increased since the projects were completed. Final Thoughts and Conclusions As further expressed and illustrated in the following chapters, the Connecticut Supportive Housing Demonstration Program offers affordable housing, linkage to needed services and a desirable alternative to high-risk situations. It creates a better social environment, is financially sound and is likely to advance public health. Tenants decreased their utilization of acute and expensive health services and tenant satisfaction with all aspects of the Program are high. Tenants functioned at high levels, were able to develop goals and direction for themselves and progressed toward greater independence. Occupancy rates are high and turnover rates are low at all nine of the projects and as with prior years’ evaluations, the performance of parties who affect the financial stability of the nine projects has been commendable, while not compromising the level of services and amenities provided to the tenants. Finally, property values in the neighborhoods surrounding the projects have remained steady or increased since the projects were developed.
CHAPTER I THE EFFECT OF SUPPORTIVE HOUSING ON TENANTS, INCLUDING UTILIZATION AND COSTS OF SERVICES Center for Mental Health Policy and Services Research, University of Pennsylvania Edna Kamis-Gould, Ph.D. Introduction
The Connecticut Supportive Housing Demonstration Program, henceforth “the Program”, is a partnership between the Corporation for Supportive Housing and the State of Connecticut to assist nonprofit agencies develop and operate permanent, supportive housing. Supportive housing is affordable, independent housing with a social service component for tenants who need and want such services. Unlike more restrictive, treatment-based settings, tenants of supportive housing choose to live in the housing (rather than being assigned to a bed slot by a service provider); the tenants hold the lease (rather than the service providers holding the lease); and tenants cannot be evicted for non-compliance with social service treatment plans. Nine projects, located in six Connecticut cities, have produced 281 units of supportive housing. The first project opened in June 1996 and the last in June of 1998. At least 70% of the Program units are reserved for occupancy by individuals who were formerly homeless or at risk of homelessness, and approximately 50% are reserved for individuals with identified special needs, defined as HIV/AIDS, mental illness, or a history of chronic substance abuse. Support services are available onsite to all tenants. This document is the final part of a series of reports on the evaluation of the Program. The Housing Tenants find out about the housing through media advertisements, word of mouth, and from social service providers. There is an application process to get into the housing, which includes an interview and credit check. Decision-makers vary from site to site and generally include property managers. To be considered for tenancy, an applicant must have some housekeeping and cooking skills, be able to look after himself/herself and have adequate income to be able to pay at least a minimal rent. Reasons for denying tenancy include a history of violence, fire setting, and certain drug-related criminal activities. The housing consists of apartment units, which are either efficiencies or single bedrooms. Some of the buildings have a combination of both one bedrooms and efficiencies, while other buildings consist entirely of one or the other. Each building also has a common room. Apartment units come equipped with a stove and a refrigerator and most are furnished. Air conditioning is a standard feature in one building. Approximately half of the buildings offer storage space and most, but not all, have pay phones. All nine projects have some form of security system, including security cameras, card keys with computer readouts and, in some cases, a front desk that is staffed 24 hours a day.
________________________________________________________________________Connecticut Supportive Housing Demonstration Program Chapter I Page 1
Shelter Plus Care Close to half of the tenants find their way to the housing through the Shelter Plus Care (S+C) program. S+C is a federal rent subsidy program created as part of the Stewart B. McKinney Homeless Assistance Act. The program provides housing assistance to homeless persons with disabilities, such as serious mental illness, chronic substance abuse disorders, and/or AIDS. Shelter Plus Care funds are distributed by the Department of Housing and Urban Development (HUD) to state and local government applicants who match the HUD funds with an equal amount of funds for supportive services. Services All projects have case management services available to all tenants. Case management services include linkage with other services, assistance with negotiating access to treatment, help with grocery shopping, budgeting and just “being there” as a supportive, caring person. One of the most important roles of the social service providers is to act as an advocate or interested party when a tenant is at risk of being evicted or is facing legal action for nonpayment of rent or for violation of another lease provision. In such situations, social service staff will work with the tenant to determine the reason(s) why the tenant is not abiding by the lease provisions. Social service staff will then attempt to work with the tenant and with property management to remedy the issue. Staff’s caseloads varied between 9 and 28 tenants per case manager, with most caseloads being 18 or less. Nurse visits and housekeeping services are also delivered on site. The Evaluation and Data Sources The Connecticut Supportive Housing Demonstration Program (“the Program”) has been evaluated to produce a detailed description of the tenants, assess the impact of the program on the tenants, and shed light on possible determinants of program dropout. The impact on tenants was examined in terms of changes over time in the need for and use of costly health and social services, and in terms of tenant-specific levels of functioning, employment, income, degree of independence and satisfaction with the Program. Evaluation Questions Prior reports focused on changes in patterns of service utilization and some tenants’ outcomes. This final report was designed to answer three evaluation questions:
1. Was the provision of stable housing associated with reduced need for, and use of, costly health and social services?
2. What was the impact of 30 months of tenancy on tenant-specific outcomes and satisfaction?
3. In what respect were tenants who left the housing similar to or different from the rest of the tenants. What are the implications of these similarities and differences?
The evaluation is based on data derived from both secondary sources data (described below) and from specially conducted surveys. Both types of data were accessed and compiled only for tenants who signed a consent form. Approximately 75% of the tenants consented to take part in this evaluation. Due to the focus on extended stay in the program and its impact on tenants, many analyses in this report are limited to data on those individuals who stayed in the program at least 30 months. ________________________________________________________________________Page 2 Chapter I Connecticut Supportive Housing Demonstration Program
Secondary data are computerized data that have already been collected for different, usually administrative purposes. For instance, the Medicaid Management Information System (MMIS) consists of discrete records of adjudicated and paid bills for services paid by Medicaid. These data are compiled for accounting purposes. However, these same data can be used to track service use over time for a group of people, such as for the tenants of the Program. This evaluation used secondary data from Medicaid and from the Connecticut Department of Mental Health and Addiction Services (DMHAS) to identify tenant-specific service utilization during the two years prior to entry into the housing and during the three years following entry. The data utilized in this evaluation is based, in part, on surveys compiled from and about the tenants. The survey forms were designed to capture information on tenant demographics, quality of life, satisfaction, and other factors, and were formatted for scanning directly into a computerized database. A provider survey was used as a one-time assessment and reported elsewhere. Tenant Survey Instruments There were four survey instruments for tenants. The forms were completed and the data captured during tenants’ interviews conducted by site caseworkers/case managers, with noted exceptions. ♦ Property managers or caseworkers complete the first instrument, referred to as an
enrollment form, for all tenants in all projects at the time of entering the housing. It captured basic demographic and employment information. Four hundred and forty four (444) individuals entered the housing by the end of February of 2001. Enrollment forms were completed for 430 of the tenants and served as the basis for the evaluation. Some parts of this report, however, concern data on a much smaller group of 54 people who entered the housing early and stayed at least 30 months and had the required data, described below. These tenants were selected because their data allow sufficient follow-up and meaningful information.
♦ The second instrument is the initial survey form. It captures information on physical
health, past and present mental health and substance abuse problems; constructs a residential history; collects information on reasons for eligibility; and establishes a base line of information on the tenants’ activities of daily living, need for services, employment status and level of income. The initial survey instrument was completed as soon as possible after a tenant moved into the housing. Tenants who agree to participate in the evaluation of the Program were paid $10 upon the completion of each survey. Three hundred and fifty one (351) respondents completed initial surveys prior to the end of February 2001.
♦ The third instrument was the periodic survey form that followed up on questions asked
in the initial survey. Periodic survey forms were scheduled for completion every six months after program enrollment. In addition to replication of the initial survey questions on employment, income, health and functioning, the periodic survey covered questions about tenant satisfaction with various aspects of their housing. Only those
________________________________________________________________________Connecticut Supportive Housing Demonstration Program Chapter I Page 3
survey forms that were completed within 2 months (plus or minus) of the expected completion target date were used in the evaluation. For example, if the fifth periodic survey was scheduled for completion in the 30th month, but was completed 33 months after entry into the housing, then this periodic form was not included. Thus, this report covers only surveys that were completed on schedule (plus or minus two months), for the duration of 30 months after entry into the housing. Because many tenants were in the housing less than 30 months and/or did not have the required survey forms, some of the data are limited to 54 individuals.
♦ The final survey instrument was the exit form, which was typically filled out by
property managers or caseworkers. This form captures information on reasons for leaving the housing. Exit forms were completed on one hundred sixty six (166) of 173 individuals who have left the housing.
Secondary Data In addition to using survey instruments, the evaluators included secondary data about the tenants’ service use and cost of services from two governmental agencies, the Department of Social Services Medicaid Unit, and the Connecticut Department of Mental Health and Addiction Services (DMHAS). Data were collected for the period beginning two years prior to the tenants’ entry into the housing and up to three years thereafter. Medicaid and DMHAS data were received for tenants who had signed a consent form and DMHAS data included information on the Shelter Plus Care (S+C) program. Because this report focuses on program impacts over time, some of the reported findings from secondary data pertain to people who enrolled prior to 1998. The tenants in this analysis made up the following, partially overlapping subgroups:
126 tenants who used Medicaid-funded services 82 tenants participating in the Shelter Plus Care program 79 tenants who stayed at least 36 months in the housing and used Medicaid-funded
services 54 tenants who stayed at least 30 months in the housing and who completed the
required periodic survey forms DMHAS collects data on the S+C clients as well as on clients within its own system. The DMHAS data were extracted from ABBY, which is a client tracking system developed by Abacus Software, Inc., and is centrally maintained by the DMHAS Information Systems Division (ISD). The data include demographic characteristics and records of services received by each client. This report covers only DMHAS data on tenants referred to the housing by S+C. In October 1999, DMHAS converted its information system from ABBY to Behavioral Health Information System (BHIS), a product of Creative Socio Medics. The shift was necessary since ABBY was not Y2K compliant. Both ABBY and BHIS collect the same type of data. Information for this evaluation is based on the number of units of services reported to DMHAS for the Shelter Plus Care Program in order to capture both DMHAS-funded services as well as services that may be funded by sources other than DMHAS.
________________________________________________________________________Page 4 Chapter I Connecticut Supportive Housing Demonstration Program
Expectations One of the challenges for the evaluation was the heterogeneity of the population in the Program. Some tenants have a serious mental illness; others are HIV positive or have chronic substance abuse diagnosis, while others may have a combination of multiple problems. Some tenants enter the housing because they can receive help when it is needed; other tenants live in the housing simply because it is decent and affordable. One of the strengths of the Program is its capacity to cater to a variety of people with a diverse set of needs. This evaluation embraces the diversity of the Program tenants and examines the effect of housing on service use regardless of the disabilities of the tenants. The sample sizes were not large enough to break the tenant population down into discreet subgroups by diagnoses. The Program evaluators expected six types of findings: 1) a decrease in the utilization (and therefore cost, per tenant) of the most expensive and intensive services, such as inpatient services. This expectation is based on the assumption that homeless and poor people use the restrictive and expensive services because they are not linked with more appropriate and less costly ones; 2) a decrease, for the same reason, in the number of tenants using inpatient services; 3) an increase in utilization and, therefore, average cost of services associated with on-going support, such as outpatient behavioral health services, medical and dental services, that are often underutilized by homeless and poor people and prevent the need for more expensive services, 4) an increase, for the same reason, in the number of tenants using on-going supportive services, 5) high levels of tenant-specific outcomes (for example, functioning) and satisfaction with the Program (for example, the location, the housing, etc.), and 6) differences between tenants who stayed in the program, those who left for positive reasons (e.g., independent living) and those who left for negative reasons, such as evictions. Such differences (for example, high levels of substance abuse by those who left for negative reasons) could serve to identify risk factors for program dropouts. The findings were generally consistent with expectations, but with some exceptions. Findings The evaluation findings and results are organized in four major sections and several subsections. A description of the tenants, in terms of both demographic and other characteristics, is provided at the beginning of this chapter. The next section provides detailed data on patterns of tenants’ service utilization over 5 years, from 24 months prior- to, to 36 months following, entry into the housing. Key outcomes and changes in health from entry to three years later are presented in the next section. The last sections provide findings on turnover and on differences and similarities among all tenants, those who left for good reasons and those who were evicted. Tenants’ Demographic Characteristics Table 1 presents the demographic characteristics of five groups analyzed in this evaluation. The largest group is all tenants who entered the housing, completed enrollment forms and consented to participate in the evaluation. By the end of February 2001, 430 tenants met these criteria. Initial assessment of tenants’ residential and life histories was completed on 351 tenants over the total duration of the program. A significantly smaller number entered ________________________________________________________________________Connecticut Supportive Housing Demonstration Program Chapter I Page 5
the housing prior to 1998, thus allowing an examination of the impact of long-term stay in the program. Approximately one thousand periodic survey forms were completed on 357 individuals. Many of those individuals, however, either lacked enrollment or initial assessment forms, or had the periodic assessment at inappropriate times. Finally, 173 left the program and exit data were compiled on 166 of those who left. These data are sufficient to provide good descriptions and allow comparisons. It should be kept in mind, however, that there is no way to know whether tenants who completed all survey forms are similar to those who did not. The five sub-samples of tenants consist of: 1) 430 tenants with enrollment data, 2) 30-month evaluation sample of 54 tenants for whom there were enrollment, initial and periodic survey data, 3) the full Medicaid sample of 126 tenants for whom there were five years of Medicaid service utilization data, regardless of whether they remained in the housing for three years, 4) the long-stay Medicaid sample of 79 tenants for whom there were Medicaid data and who stayed in housing for at least three years, and 5) the S+C sample of 82 tenants who were part of the Shelter Plus Care Program, who agreed to take part in the evaluation (regardless of their length of stay) and for whom there were Medicaid data. The five groups are neither mutually exclusive, nor identical. In other words, a few tenants were probably referred by S+C, had all required data, stayed for three years and were covered by Medicaid. Others could have been in some, but not all groups. While there are some variations among the groups, for the most part, about two thirds of every sample of tenants (61%-68%) were males, slightly over a quarter to a slightly under half (29% to 45%) were African-Americans, over a third to half (34%-48%) were European Americans, 8%-19% were Hispanics, mostly Puerto Ricans, 5%-10% were veterans, and the average age of the tenants was 42 to 45 years of age. Some categories, e.g., ethnicity, had large proportions of missing data. There were some differences among the groups. For example, the 79 individuals who both stayed 36 months and received Medicaid-covered services had smaller proportions of males and African Americans, and larger proportions of Hispanic. Generally, however, the groups were quite similar and suggested no systematic differences.
________________________________________________________________________Page 6 Chapter I Connecticut Supportive Housing Demonstration Program
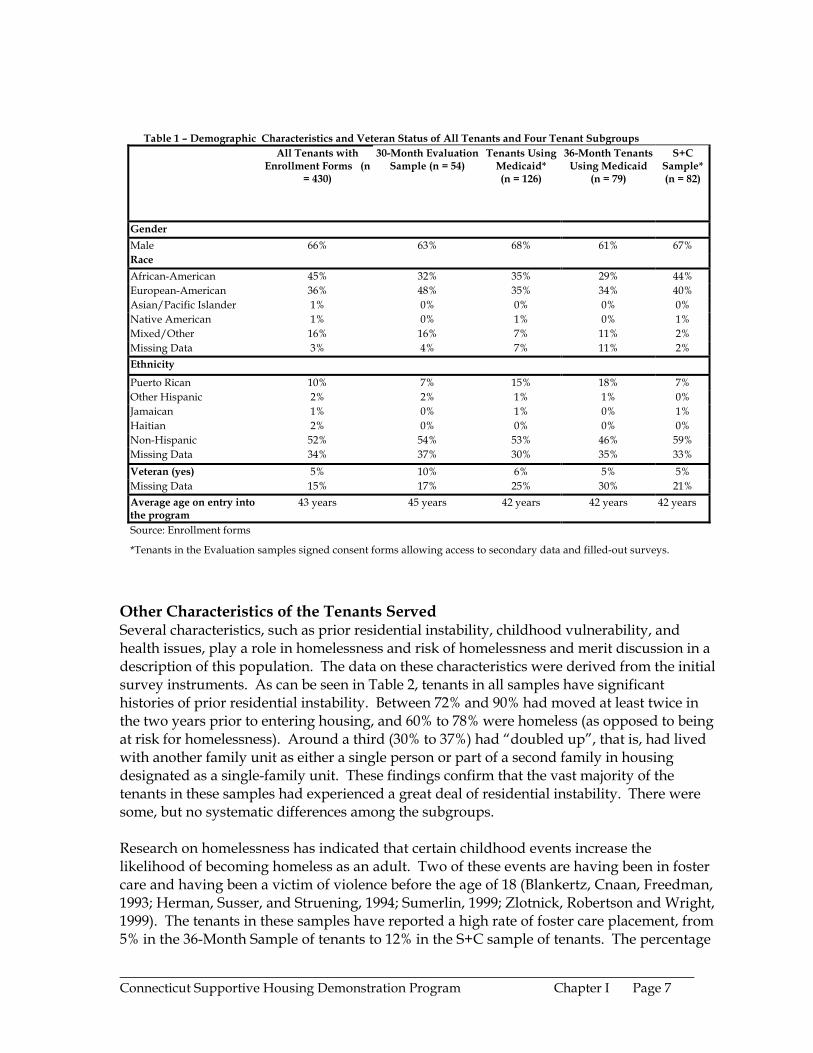
Table 1 – Demographic Characteristics and Veteran Status of All Tenants and Four Tenant Subgroups All Tenants with Enrollment Forms (n
= 430)
30-Month Evaluation Sample (n = 54)
Tenants Using Medicaid* (n = 126)
36-Month Tenants Using Medicaid
(n = 79)
S+C Sample* (n = 82)
Gender Male 66% 63% 68% 61% 67% Race African-American 45% 32% 35% 29% 44% European-American 36% 48% 35% 34% 40% Asian/Pacific Islander 1% 0% 0% 0% 0% Native American 1% 0% 1% 0% 1% Mixed/Other 16% 16% 7% 11% 2% Missing Data 3% 4% 7% 11% 2% Ethnicity
Puerto Rican 10% 7% 15% 18% 7% Other Hispanic 2% 2% 1% 1% 0% Jamaican 1% 0% 1% 0% 1% Haitian 2% 0% 0% 0% 0% Non-Hispanic 52% 54% 53% 46% 59% Missing Data 34% 37% 30% 35% 33% Veteran (yes) 5% 10% 6% 5% 5% Missing Data 15% 17% 25% 30% 21% Average age on entry into the program
43 years 45 years 42 years 42 years 42 years
Source: Enrollment forms *Tenants in the Evaluation samples signed consent forms allowing access to secondary data and filled-out surveys.
Other Characteristics of the Tenants Served Several characteristics, such as prior residential instability, childhood vulnerability, and health issues, play a role in homelessness and risk of homelessness and merit discussion in a description of this population. The data on these characteristics were derived from the initial survey instruments. As can be seen in Table 2, tenants in all samples have significant histories of prior residential instability. Between 72% and 90% had moved at least twice in the two years prior to entering housing, and 60% to 78% were homeless (as opposed to being at risk for homelessness). Around a third (30% to 37%) had “doubled up”, that is, had lived with another family unit as either a single person or part of a second family in housing designated as a single-family unit. These findings confirm that the vast majority of the tenants in these samples had experienced a great deal of residential instability. There were some, but no systematic differences among the subgroups. Research on homelessness has indicated that certain childhood events increase the likelihood of becoming homeless as an adult. Two of these events are having been in foster care and having been a victim of violence before the age of 18 (Blankertz, Cnaan, Freedman, 1993; Herman, Susser, and Struening, 1994; Sumerlin, 1999; Zlotnick, Robertson and Wright, 1999). The tenants in these samples have reported a high rate of foster care placement, from 5% in the 36-Month Sample of tenants to 12% in the S+C sample of tenants. The percentage
________________________________________________________________________Connecticut Supportive Housing Demonstration Program Chapter I Page 7
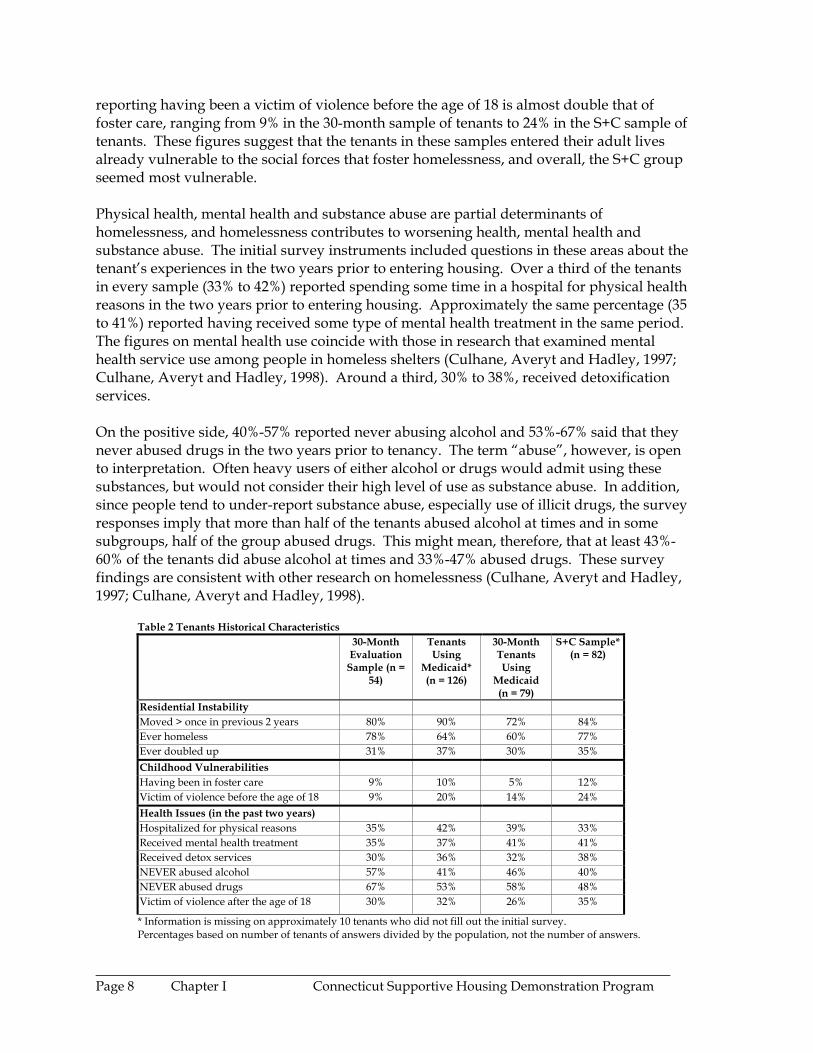
reporting having been a victim of violence before the age of 18 is almost double that of foster care, ranging from 9% in the 30-month sample of tenants to 24% in the S+C sample of tenants. These figures suggest that the tenants in these samples entered their adult lives already vulnerable to the social forces that foster homelessness, and overall, the S+C group seemed most vulnerable. Physical health, mental health and substance abuse are partial determinants of homelessness, and homelessness contributes to worsening health, mental health and substance abuse. The initial survey instruments included questions in these areas about the tenant’s experiences in the two years prior to entering housing. Over a third of the tenants in every sample (33% to 42%) reported spending some time in a hospital for physical health reasons in the two years prior to entering housing. Approximately the same percentage (35 to 41%) reported having received some type of mental health treatment in the same period. The figures on mental health use coincide with those in research that examined mental health service use among people in homeless shelters (Culhane, Averyt and Hadley, 1997; Culhane, Averyt and Hadley, 1998). Around a third, 30% to 38%, received detoxification services. On the positive side, 40%-57% reported never abusing alcohol and 53%-67% said that they never abused drugs in the two years prior to tenancy. The term “abuse”, however, is open to interpretation. Often heavy users of either alcohol or drugs would admit using these substances, but would not consider their high level of use as substance abuse. In addition, since people tend to under-report substance abuse, especially use of illicit drugs, the survey responses imply that more than half of the tenants abused alcohol at times and in some subgroups, half of the group abused drugs. This might mean, therefore, that at least 43%-60% of the tenants did abuse alcohol at times and 33%-47% abused drugs. These survey findings are consistent with other research on homelessness (Culhane, Averyt and Hadley, 1997; Culhane, Averyt and Hadley, 1998).
Table 2 Tenants Historical Characteristics 30-Month
Evaluation Sample (n =
54)
Tenants Using
Medicaid* (n = 126)
30-Month Tenants Using
Medicaid (n = 79)
S+C Sample* (n = 82)
Residential Instability Moved > once in previous 2 years 80% 90% 72% 84% Ever homeless 78% 64% 60% 77% Ever doubled up 31% 37% 30% 35% Childhood Vulnerabilities Having been in foster care 9% 10% 5% 12% Victim of violence before the age of 18 9% 20% 14% 24% Health Issues (in the past two years) Hospitalized for physical reasons 35% 42% 39% 33% Received mental health treatment 35% 37% 41% 41% Received detox services 30% 36% 32% 38% NEVER abused alcohol 57% 41% 46% 40% NEVER abused drugs 67% 53% 58% 48% Victim of violence after the age of 18 30% 32% 26% 35%
* Information is missing on approximately 10 tenants who did not fill out the initial survey. Percentages based on number of tenants of answers divided by the population, not the number of answers.
________________________________________________________________________Page 8 Chapter I Connecticut Supportive Housing Demonstration Program
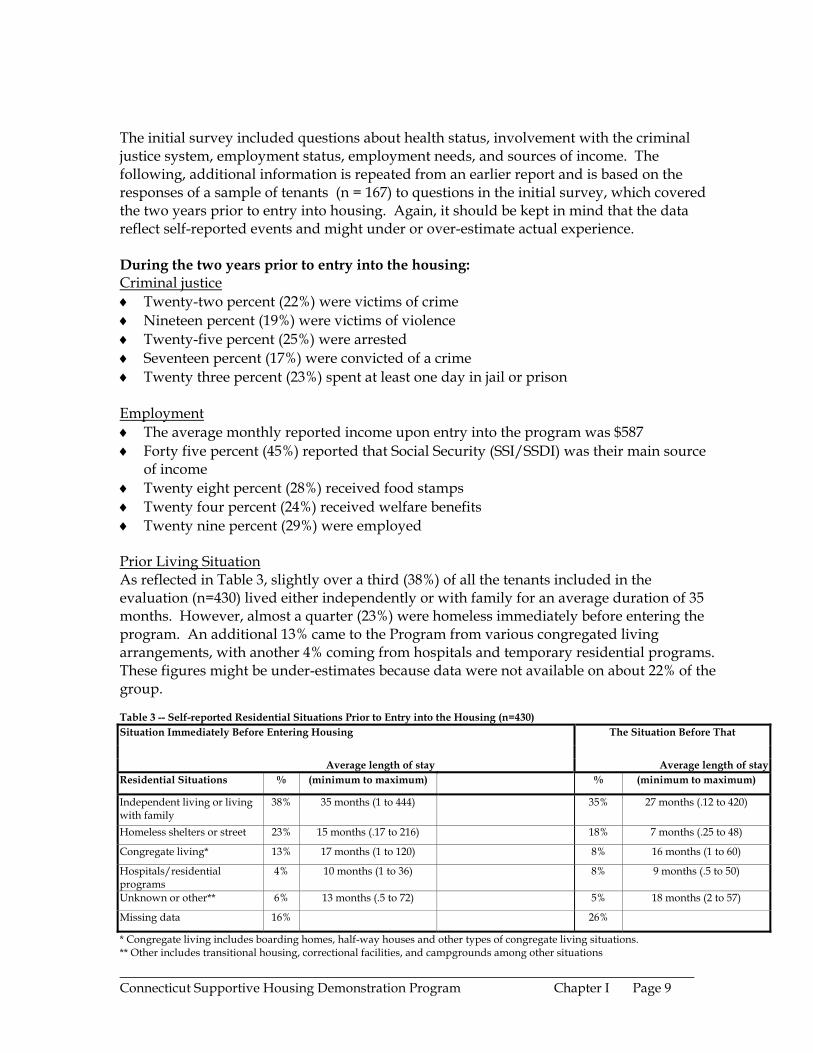
The initial survey included questions about health status, involvement with the criminal justice system, employment status, employment needs, and sources of income. The following, additional information is repeated from an earlier report and is based on the responses of a sample of tenants (n = 167) to questions in the initial survey, which covered the two years prior to entry into housing. Again, it should be kept in mind that the data reflect self-reported events and might under or over-estimate actual experience. During the two years prior to entry into the housing: Criminal justice ♦ Twenty-two percent (22%) were victims of crime ♦ Nineteen percent (19%) were victims of violence ♦ Twenty-five percent (25%) were arrested ♦ Seventeen percent (17%) were convicted of a crime ♦ Twenty three percent (23%) spent at least one day in jail or prison Employment ♦ The average monthly reported income upon entry into the program was $587 ♦ Forty five percent (45%) reported that Social Security (SSI/SSDI) was their main source
of income ♦ Twenty eight percent (28%) received food stamps ♦ Twenty four percent (24%) received welfare benefits ♦ Twenty nine percent (29%) were employed Prior Living Situation As reflected in Table 3, slightly over a third (38%) of all the tenants included in the evaluation (n=430) lived either independently or with family for an average duration of 35 months. However, almost a quarter (23%) were homeless immediately before entering the program. An additional 13% came to the Program from various congregated living arrangements, with another 4% coming from hospitals and temporary residential programs. These figures might be under-estimates because data were not available on about 22% of the group. Table 3 -- Self-reported Residential Situations Prior to Entry into the Housing (n=430) Situation Immediately Before Entering Housing The Situation Before That
Average length of stay Average length of stay
Residential Situations % (minimum to maximum) % (minimum to maximum)
Independent living or living with family
38% 35 months (1 to 444) 35% 27 months (.12 to 420)
Homeless shelters or street 23% 15 months (.17 to 216) 18% 7 months (.25 to 48)
Congregate living* 13% 17 months (1 to 120) 8% 16 months (1 to 60)
Hospitals/residential programs
4% 10 months (1 to 36) 8% 9 months (.5 to 50)
Unknown or other** 6% 13 months (.5 to 72) 5% 18 months (2 to 57)
Missing data 16% 26%
* Congregate living includes boarding homes, half-way houses and other types of congregate living situations. ** Other includes transitional housing, correctional facilities, and campgrounds among other situations
________________________________________________________________________Connecticut Supportive Housing Demonstration Program Chapter I Page 9
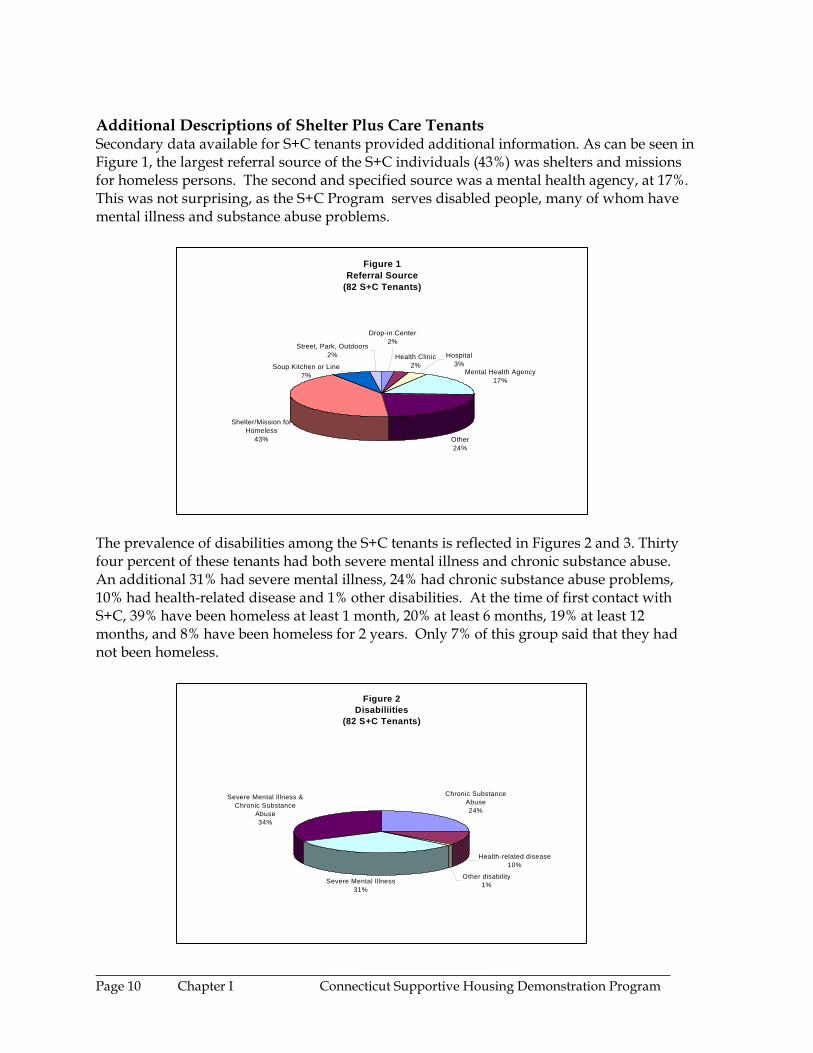
Additional Descriptions of Shelter Plus Care Tenants Secondary data available for S+C tenants provided additional information. As can be seen in Figure 1, the largest referral source of the S+C individuals (43%) was shelters and missions for homeless persons. The second and specified source was a mental health agency, at 17%. This was not surprising, as the S+C Program serves disabled people, many of whom have mental illness and substance abuse problems.
Figure 1Referral Source
(82 S+C Tenants)
Health Clinic2%
Mental Health Agency17%
Other24%
Shelter/Mission for Homeless
43%
Soup Kitchen or Line7%
Street, Park, Outdoors2% Hospital
3%
Drop-in Center2%
The prevalence of disabilities among the S+C tenants is reflected in Figures 2 and 3. Thirty four percent of these tenants had both severe mental illness and chronic substance abuse. An additional 31% had severe mental illness, 24% had chronic substance abuse problems, 10% had health-related disease and 1% other disabilities. At the time of first contact with S+C, 39% have been homeless at least 1 month, 20% at least 6 months, 19% at least 12 months, and 8% have been homeless for 2 years. Only 7% of this group said that they had not been homeless.
(82 S+C Tenants)
Chronic Substance Abuse24%
Health-related disease10%
Other disability1%Severe Mental Illness
31%
Severe Mental Illness & Chronic Substance
Abuse34%
Figure 2Disabiliities
________________________________________________________________________Page 10 Chapter I Connecticut Supportive Housing Demonstration Program
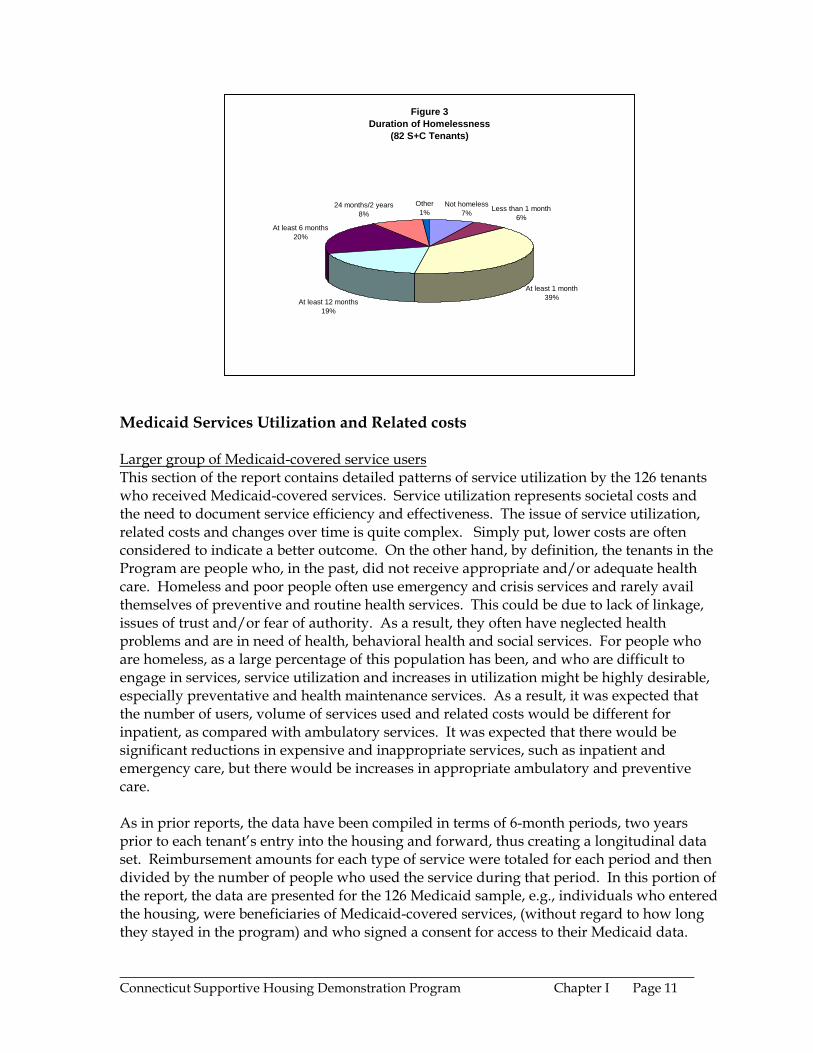
Figure 3Duration of Homelessness
(82 S+C Tenants)
Not homeless7% Less than 1 month
6%
At least 1 month39%At least 12 months
19%
At least 6 months20%
24 months/2 years8%
Other1%
Medicaid Services Utilization and Related costs Larger group of Medicaid-covered service users This section of the report contains detailed patterns of service utilization by the 126 tenants who received Medicaid-covered services. Service utilization represents societal costs and the need to document service efficiency and effectiveness. The issue of service utilization, related costs and changes over time is quite complex. Simply put, lower costs are often considered to indicate a better outcome. On the other hand, by definition, the tenants in the Program are people who, in the past, did not receive appropriate and/or adequate health care. Homeless and poor people often use emergency and crisis services and rarely avail themselves of preventive and routine health services. This could be due to lack of linkage, issues of trust and/or fear of authority. As a result, they often have neglected health problems and are in need of health, behavioral health and social services. For people who are homeless, as a large percentage of this population has been, and who are difficult to engage in services, service utilization and increases in utilization might be highly desirable, especially preventative and health maintenance services. As a result, it was expected that the number of users, volume of services used and related costs would be different for inpatient, as compared with ambulatory services. It was expected that there would be significant reductions in expensive and inappropriate services, such as inpatient and emergency care, but there would be increases in appropriate ambulatory and preventive care. As in prior reports, the data have been compiled in terms of 6-month periods, two years prior to each tenant’s entry into the housing and forward, thus creating a longitudinal data set. Reimbursement amounts for each type of service were totaled for each period and then divided by the number of people who used the service during that period. In this portion of the report, the data are presented for the 126 Medicaid sample, e.g., individuals who entered the housing, were beneficiaries of Medicaid-covered services, (without regard to how long they stayed in the program) and who signed a consent for access to their Medicaid data.
________________________________________________________________________Connecticut Supportive Housing Demonstration Program Chapter I Page 11
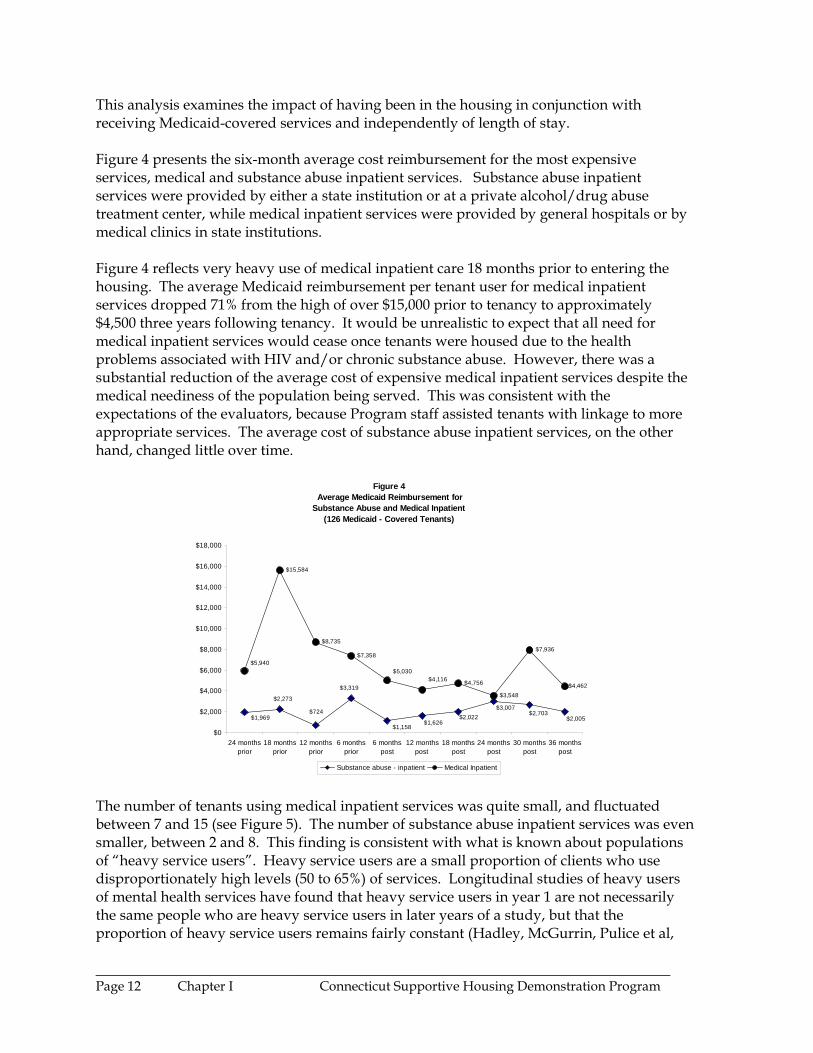
This analysis examines the impact of having been in the housing in conjunction with receiving Medicaid-covered services and independently of length of stay. Figure 4 presents the six-month average cost reimbursement for the most expensive services, medical and substance abuse inpatient services. Substance abuse inpatient services were provided by either a state institution or at a private alcohol/drug abuse treatment center, while medical inpatient services were provided by general hospitals or by medical clinics in state institutions. Figure 4 reflects very heavy use of medical inpatient care 18 months prior to entering the housing. The average Medicaid reimbursement per tenant user for medical inpatient services dropped 71% from the high of over $15,000 prior to tenancy to approximately $4,500 three years following tenancy. It would be unrealistic to expect that all need for medical inpatient services would cease once tenants were housed due to the health problems associated with HIV and/or chronic substance abuse. However, there was a substantial reduction of the average cost of expensive medical inpatient services despite the medical neediness of the population being served. This was consistent with the expectations of the evaluators, because Program staff assisted tenants with linkage to more appropriate services. The average cost of substance abuse inpatient services, on the other hand, changed little over time.
Figure 4 Average Medicaid Reimbursement for
Substance Abuse and Medical Inpatient (126 Medicaid - Covered Tenants)
$15,584
$8,735
$7,358
$4,756
$3,548
$7,936
$4,462
$1,969
$2,273
$724
$3,319
$1,158$1,626
$2,022$3,007
$2,703$2,005
$5,940$5,030
$4,116
$0
$2,000
$4,000
$6,000
$8,000
$10,000
$12,000
$14,000
$16,000
$18,000
24 monthsprior
18 monthsprior
12 monthsprior
6 monthsprior
6 monthspost
12 monthspost
18 monthspost
24 monthspost
30 monthspost
36 monthspost
Substance abuse - inpatient Medical Inpatient
The number of tenants using medical inpatient services was quite small, and fluctuated between 7 and 15 (see Figure 5). The number of substance abuse inpatient services was even smaller, between 2 and 8. This finding is consistent with what is known about populations of “heavy service users”. Heavy service users are a small proportion of clients who use disproportionately high levels (50 to 65%) of services. Longitudinal studies of heavy users of mental health services have found that heavy service users in year 1 are not necessarily the same people who are heavy service users in later years of a study, but that the proportion of heavy service users remains fairly constant (Hadley, McGurrin, Pulice et al,
________________________________________________________________________Page 12 Chapter I Connecticut Supportive Housing Demonstration Program
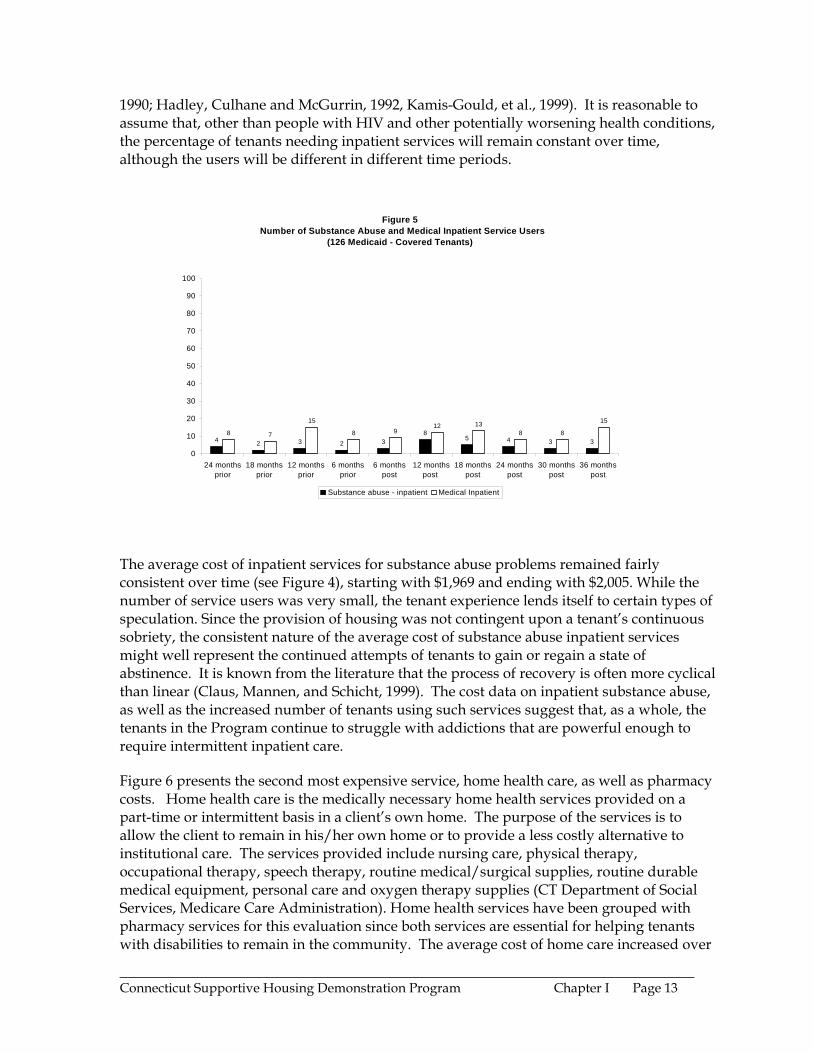
1990; Hadley, Culhane and McGurrin, 1992, Kamis-Gould, et al., 1999). It is reasonable to assume that, other than people with HIV and other potentially worsening health conditions, the percentage of tenants needing inpatient services will remain constant over time, although the users will be different in different time periods.
Figure 5 Number of Substance Abuse and Medical Inpatient Service Users
(126 Medicaid - Covered Tenants)
4 2 3 2 38
5 4 3 38 7
15
8 912 13
8 8
15
0
10
20
30
40
50
60
70
80
90
100
24 monthsprior
18 monthsprior
12 monthsprior
6 monthsprior
6 monthspost
12 monthspost
18 monthspost
24 monthspost
30 monthspost
36 monthspost
Substance abuse - inpatient Medical Inpatient
The average cost of inpatient services for substance abuse problems remained fairly consistent over time (see Figure 4), starting with $1,969 and ending with $2,005. While the number of service users was very small, the tenant experience lends itself to certain types of speculation. Since the provision of housing was not contingent upon a tenant’s continuous sobriety, the consistent nature of the average cost of substance abuse inpatient services might well represent the continued attempts of tenants to gain or regain a state of abstinence. It is known from the literature that the process of recovery is often more cyclical than linear (Claus, Mannen, and Schicht, 1999). The cost data on inpatient substance abuse, as well as the increased number of tenants using such services suggest that, as a whole, the tenants in the Program continue to struggle with addictions that are powerful enough to require intermittent inpatient care. Figure 6 presents the second most expensive service, home health care, as well as pharmacy costs. Home health care is the medically necessary home health services provided on a part-time or intermittent basis in a client’s own home. The purpose of the services is to allow the client to remain in his/her own home or to provide a less costly alternative to institutional care. The services provided include nursing care, physical therapy, occupational therapy, speech therapy, routine medical/surgical supplies, routine durable medical equipment, personal care and oxygen therapy supplies (CT Department of Social Services, Medicare Care Administration). Home health services have been grouped with pharmacy services for this evaluation since both services are essential for helping tenants with disabilities to remain in the community. The average cost of home care increased over
________________________________________________________________________Connecticut Supportive Housing Demonstration Program Chapter I Page 13
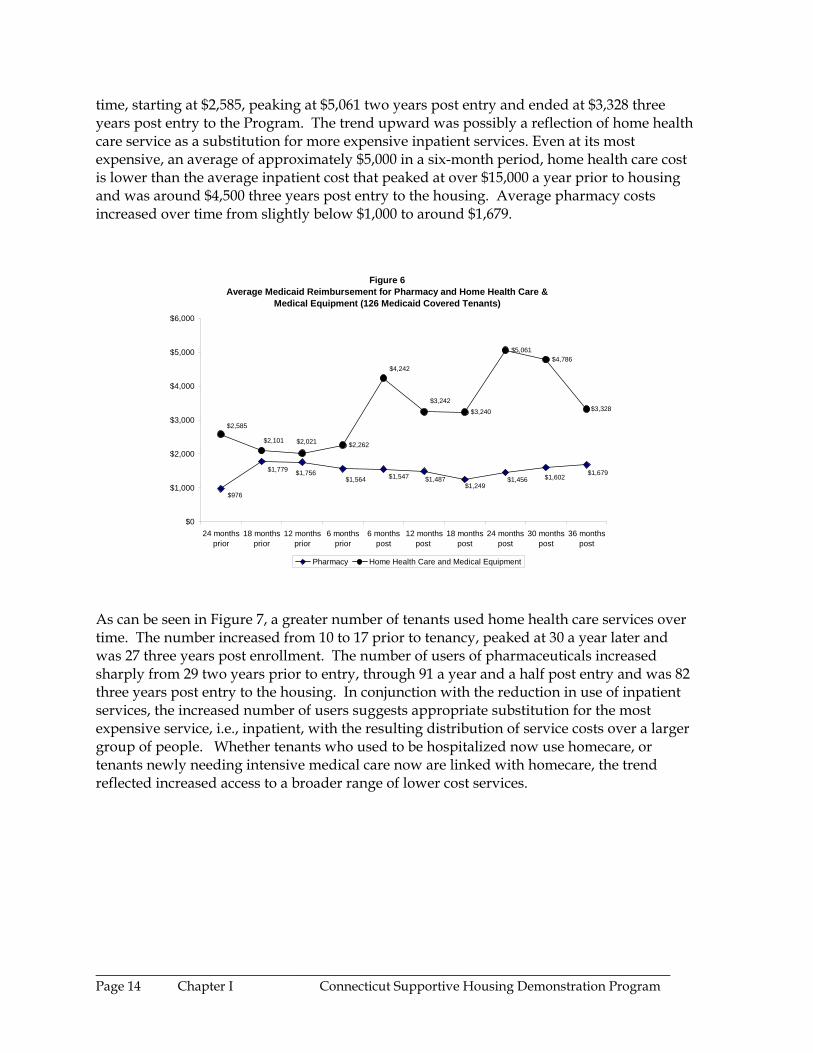
time, starting at $2,585, peaking at $5,061 two years post entry and ended at $3,328 three years post entry to the Program. The trend upward was possibly a reflection of home health care service as a substitution for more expensive inpatient services. Even at its most expensive, an average of approximately $5,000 in a six-month period, home health care cost is lower than the average inpatient cost that peaked at over $15,000 a year prior to housing and was around $4,500 three years post entry to the housing. Average pharmacy costs increased over time from slightly below $1,000 to around $1,679.
Figure 6 Average Medicaid Reimbursement for Pharmacy and Home Health Care &
Medical Equipment (126 Medicaid Covered Tenants)
$2,262
$3,240
$5,061$4,786
$3,328
$976
$1,779 $1,756$1,564 $1,547 $1,487
$1,249$1,456 $1,602 $1,679
$2,021$2,101
$2,585
$4,242
$3,242
$0
$1,000
$2,000
$3,000
$4,000
$5,000
$6,000
24 monthsprior
18 monthsprior
12 monthsprior
6 monthsprior
6 monthspost
12 monthspost
18 monthspost
24 monthspost
30 monthspost
36 monthspost
Pharmacy Home Health Care and Medical Equipment
As can be seen in Figure 7, a greater number of tenants used home health care services over time. The number increased from 10 to 17 prior to tenancy, peaked at 30 a year later and was 27 three years post enrollment. The number of users of pharmaceuticals increased sharply from 29 two years prior to entry, through 91 a year and a half post entry and was 82 three years post entry to the housing. In conjunction with the reduction in use of inpatient services, the increased number of users suggests appropriate substitution for the most expensive service, i.e., inpatient, with the resulting distribution of service costs over a larger group of people. Whether tenants who used to be hospitalized now use homecare, or tenants newly needing intensive medical care now are linked with homecare, the trend reflected increased access to a broader range of lower cost services.
________________________________________________________________________Page 14 Chapter I Connecticut Supportive Housing Demonstration Program
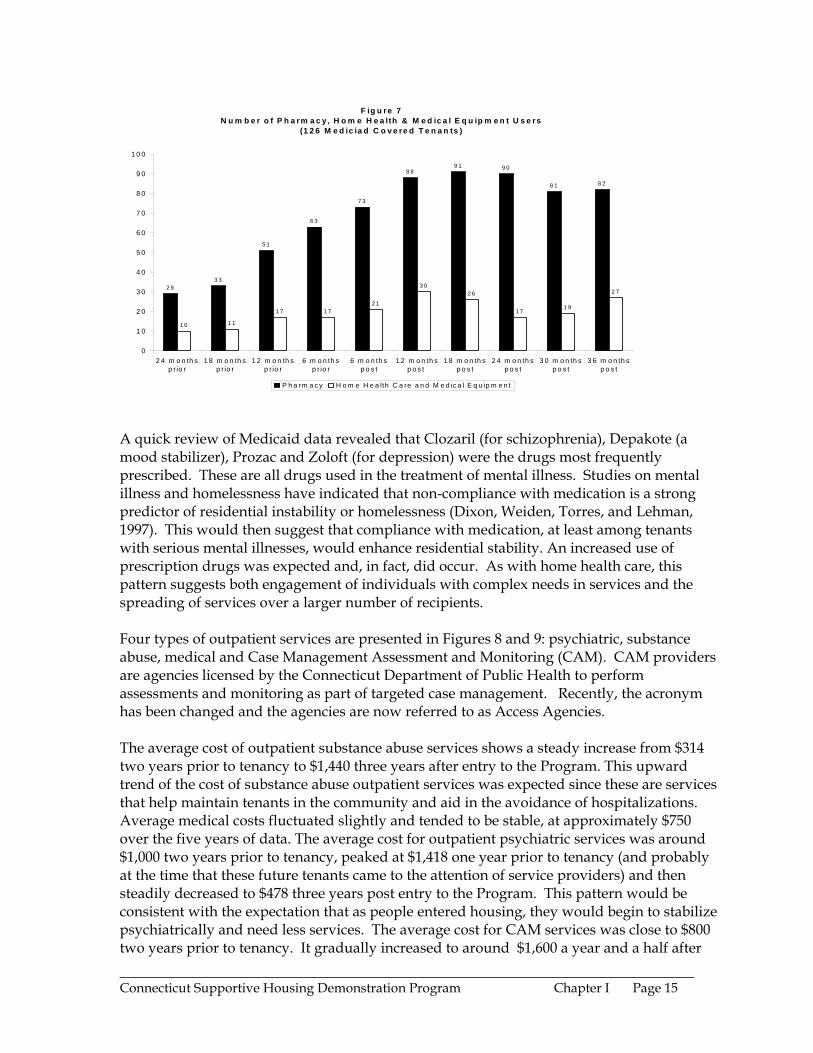
F ig u re 7N u m b e r o f P h a rm a c y , H o m e H e a lth & M e d ic a l E q u ip m e n t U s e rs
(1 2 6 M e d ic ia d C o v e re d T e n a n ts )
2 93 3
5 1
6 3
7 3
8 89 1 9 0
8 1 8 2
1 0 1 1
1 7 1 72 1
3 02 6
1 71 9
2 7
0
1 0
2 0
3 0
4 0
5 0
6 0
7 0
8 0
9 0
1 0 0
2 4 m o n th sp r io r
1 8 m o n th sp r io r
1 2 m o n th sp r io r
6 m o n th sp r io r
6 m o n th sp o s t
1 2 m o n th sp o s t
1 8 m o n th sp o s t
2 4 m o n th sp o s t
3 0 m o n th sp o s t
3 6 m o n th sp o s t
P h a rm a c y H o m e H e a lth C a re a n d M e d ic a l E q u ip m e n t A quick review of Medicaid data revealed that Clozaril (for schizophrenia), Depakote (a mood stabilizer), Prozac and Zoloft (for depression) were the drugs most frequently prescribed. These are all drugs used in the treatment of mental illness. Studies on mental illness and homelessness have indicated that non-compliance with medication is a strong predictor of residential instability or homelessness (Dixon, Weiden, Torres, and Lehman, 1997). This would then suggest that compliance with medication, at least among tenants with serious mental illnesses, would enhance residential stability. An increased use of prescription drugs was expected and, in fact, did occur. As with home health care, this pattern suggests both engagement of individuals with complex needs in services and the spreading of services over a larger number of recipients. Four types of outpatient services are presented in Figures 8 and 9: psychiatric, substance abuse, medical and Case Management Assessment and Monitoring (CAM). CAM providers are agencies licensed by the Connecticut Department of Public Health to perform assessments and monitoring as part of targeted case management. Recently, the acronym has been changed and the agencies are now referred to as Access Agencies. The average cost of outpatient substance abuse services shows a steady increase from $314 two years prior to tenancy to $1,440 three years after entry to the Program. This upward trend of the cost of substance abuse outpatient services was expected since these are services that help maintain tenants in the community and aid in the avoidance of hospitalizations. Average medical costs fluctuated slightly and tended to be stable, at approximately $750 over the five years of data. The average cost for outpatient psychiatric services was around $1,000 two years prior to tenancy, peaked at $1,418 one year prior to tenancy (and probably at the time that these future tenants came to the attention of service providers) and then steadily decreased to $478 three years post entry to the Program. This pattern would be consistent with the expectation that as people entered housing, they would begin to stabilize psychiatrically and need less services. The average cost for CAM services was close to $800 two years prior to tenancy. It gradually increased to around $1,600 a year and a half after ________________________________________________________________________Connecticut Supportive Housing Demonstration Program Chapter I Page 15
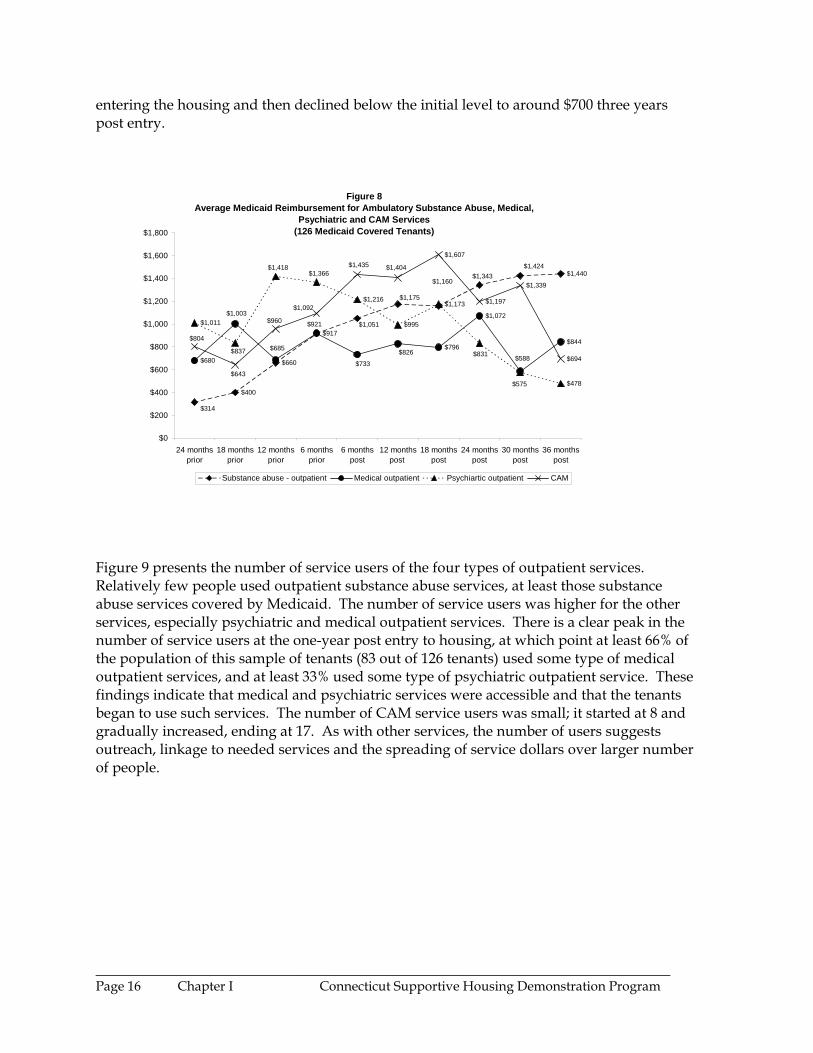
entering the housing and then declined below the initial level to around $700 three years post entry.
Figure 8Average Medicaid Reimbursement for Ambulatory Substance Abuse, Medical,
Psychiatric and CAM Services(126 Medicaid Covered Tenants)
$400
$660
$917
$1,440
$680
$796
$1,072
$844
$1,011
$1,216
$995
$1,173
$478
$1,607
$1,197
$1,339
$694
$1,160
$1,175
$1,343$1,424
$314
$1,051$921$1,003
$733
$826$588
$685$837
$1,418$1,366
$575
$831
$1,404$1,435
$1,092
$960
$643
$804
$0
$200
$400
$600
$800
$1,000
$1,200
$1,400
$1,600
$1,800
24 monthsprior
18 monthsprior
12 monthsprior
6 monthsprior
6 monthspost
12 monthspost
18 monthspost
24 monthspost
30 monthspost
36 monthspost
Substance abuse - outpatient Medical outpatient Psychiartic outpatient CAM
Figure 9 presents the number of service users of the four types of outpatient services. Relatively few people used outpatient substance abuse services, at least those substance abuse services covered by Medicaid. The number of service users was higher for the other services, especially psychiatric and medical outpatient services. There is a clear peak in the number of service users at the one-year post entry to housing, at which point at least 66% of the population of this sample of tenants (83 out of 126 tenants) used some type of medical outpatient services, and at least 33% used some type of psychiatric outpatient service. These findings indicate that medical and psychiatric services were accessible and that the tenants began to use such services. The number of CAM service users was small; it started at 8 and gradually increased, ending at 17. As with other services, the number of users suggests outreach, linkage to needed services and the spreading of service dollars over larger number of people.
________________________________________________________________________Page 16 Chapter I Connecticut Supportive Housing Demonstration Program
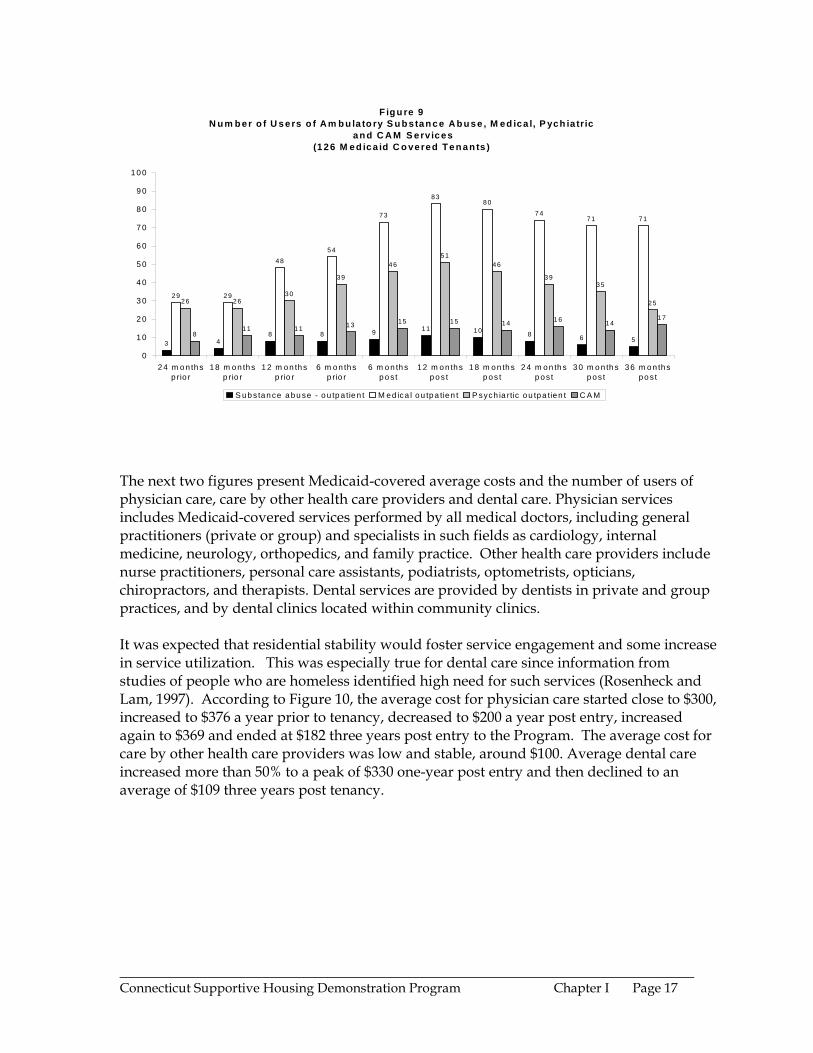
F ig u re 9 N u m b e r o f U s e rs o f A m b u la to ry S u b sta n c e A b u s e , M ed ica l, P ych ia tric
an d C A M S erv ices(1 2 6 M e d ic a id C o ve re d T e n a n ts )
3 48 8 9 11 10 8 6 5
29 29
4854
73
8380
7 471 71
26 2630
39
4651
46
3 935
25
811 11 13 15 15 14 1 6 14
17
0
1 0
2 0
3 0
4 0
5 0
6 0
7 0
8 0
9 0
1 0 0
2 4 m o n th sp rio r
18 m on thsp rio r
1 2 m on thsp rio r
6 m on thsp rio r
6 m o n th spo s t
12 m o n thsp os t
1 8 m on thsp os t
2 4 m on th sp os t
3 0 m o n th sp os t
36 m o n thspo s t
S ub s tan ce a bu se - o u tp a tie n t M ed ica l ou tpa tien t P sych ia rtic ou tpa tien t C A M The next two figures present Medicaid-covered average costs and the number of users of physician care, care by other health care providers and dental care. Physician services includes Medicaid-covered services performed by all medical doctors, including general practitioners (private or group) and specialists in such fields as cardiology, internal medicine, neurology, orthopedics, and family practice. Other health care providers include nurse practitioners, personal care assistants, podiatrists, optometrists, opticians, chiropractors, and therapists. Dental services are provided by dentists in private and group practices, and by dental clinics located within community clinics. It was expected that residential stability would foster service engagement and some increase in service utilization. This was especially true for dental care since information from studies of people who are homeless identified high need for such services (Rosenheck and Lam, 1997). According to Figure 10, the average cost for physician care started close to $300, increased to $376 a year prior to tenancy, decreased to $200 a year post entry, increased again to $369 and ended at $182 three years post entry to the Program. The average cost for care by other health care providers was low and stable, around $100. Average dental care increased more than 50% to a peak of $330 one-year post entry and then declined to an average of $109 three years post tenancy.
________________________________________________________________________Connecticut Supportive Housing Demonstration Program Chapter I Page 17
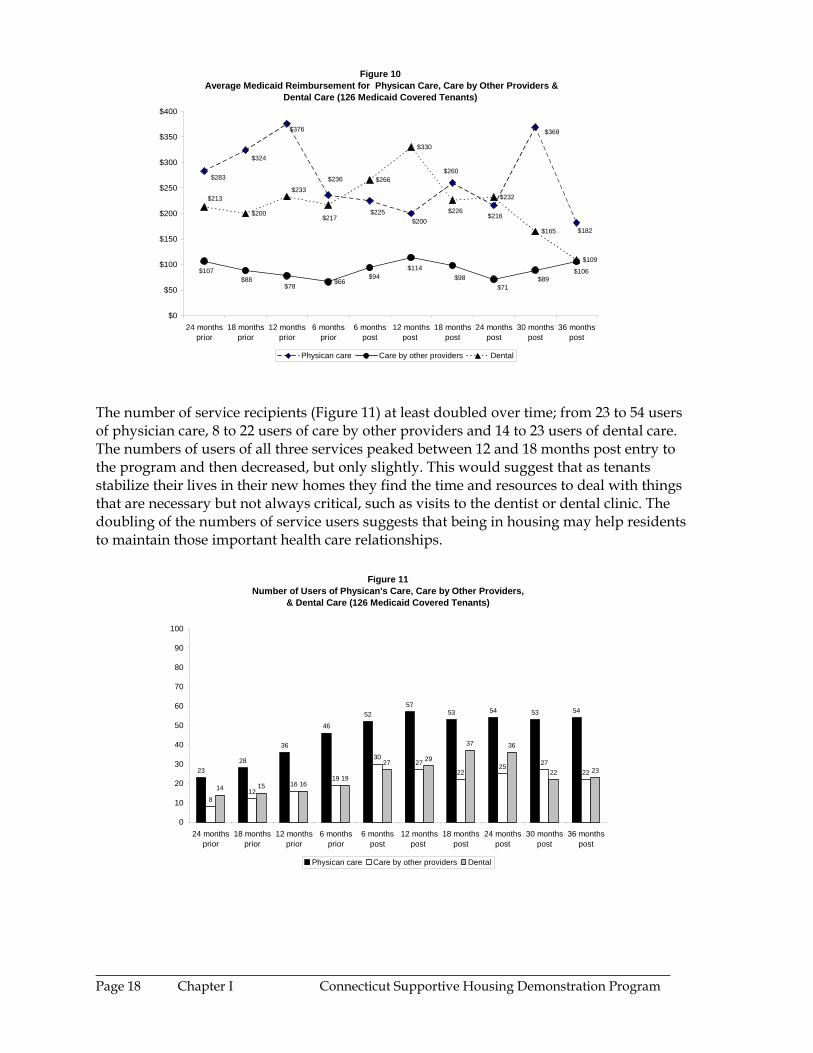
Figure 10 Average Medicaid Reimbursement for Physican Care, Care by Other Providers &
Dental Care (126 Medicaid Covered Tenants)
$66
$200
$266
$330
$232
$165
$109
$182
$369
$216
$260
$200$225
$236
$376
$324
$283
$106$114$94
$107$88
$78 $71$98 $89
$217
$233$213
$226
$0
$50
$100
$150
$200
$250
$300
$350
$400
24 monthsprior
18 monthsprior
12 monthsprior
6 monthsprior
6 monthspost
12 monthspost
18 monthspost
24 monthspost
30 monthspost
36 monthspost
Physican care Care by other providers Dental
The number of service recipients (Figure 11) at least doubled over time; from 23 to 54 users of physician care, 8 to 22 users of care by other providers and 14 to 23 users of dental care. The numbers of users of all three services peaked between 12 and 18 months post entry to the program and then decreased, but only slightly. This would suggest that as tenants stabilize their lives in their new homes they find the time and resources to deal with things that are necessary but not always critical, such as visits to the dentist or dental clinic. The doubling of the numbers of service users suggests that being in housing may help residents to maintain those important health care relationships.
Figure 11Number of Users of Physican's Care, Care by Other Providers,
& Dental Care (126 Medicaid Covered Tenants)
2328
36
46
5257
53 54 53 54
812
1619
3027
2225 27
22
14 15 1619
27 29
37 36
22 23
0
10
20
30
40
50
60
70
80
90
100
24 monthsprior
18 monthsprior
12 monthsprior
6 monthsprior
6 monthspost
12 monthspost
18 monthspost
24 monthspost
30 monthspost
36 monthspost
Physican care Care by other providers Dental
________________________________________________________________________Page 18 Chapter I Connecticut Supportive Housing Demonstration Program
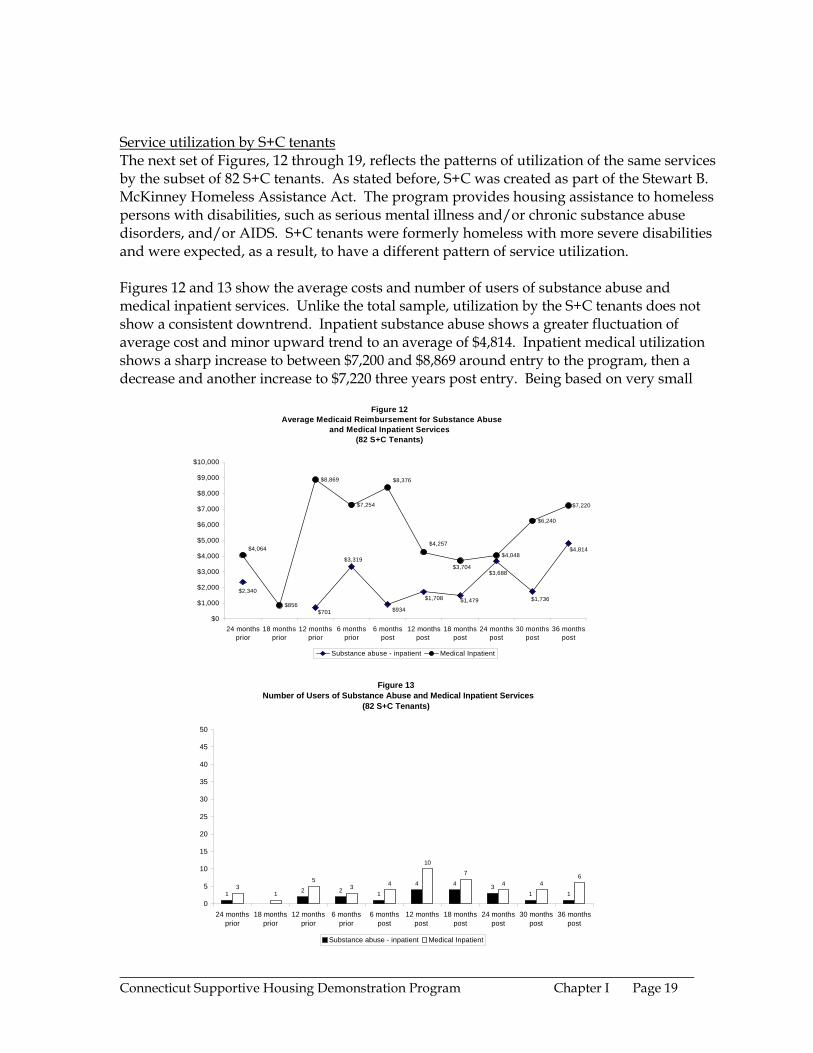
Service utilization by S+C tenants The next set of Figures, 12 through 19, reflects the patterns of utilization of the same services by the subset of 82 S+C tenants. As stated before, S+C was created as part of the Stewart B. McKinney Homeless Assistance Act. The program provides housing assistance to homeless persons with disabilities, such as serious mental illness and/or chronic substance abuse disorders, and/or AIDS. S+C tenants were formerly homeless with more severe disabilities and were expected, as a result, to have a different pattern of service utilization. Figures 12 and 13 show the average costs and number of users of substance abuse and medical inpatient services. Unlike the total sample, utilization by the S+C tenants does not show a consistent downtrend. Inpatient substance abuse shows a greater fluctuation of average cost and minor upward trend to an average of $4,814. Inpatient medical utilization shows a sharp increase to between $7,200 and $8,869 around entry to the program, then a decrease and another increase to $7,220 three years post entry. Being based on very small
Figure 12 Average Medicaid Reimbursement for Substance Abuse
and Medical Inpatient Services(82 S+C Tenants)
$856
$8,869
$7,254
$4,048
$6,240
$7,220
$2,340
$701
$3,319
$934
$1,708 $1,479
$3,688
$1,736
$4,814
$3,704
$4,064
$8,376
$4,257
$0
$1,000
$2,000
$3,000
$4,000
$5,000
$6,000
$7,000
$8,000
$9,000
$10,000
24 monthsprior
18 monthsprior
12 monthsprior
6 monthsprior
6 monthspost
12 monthspost
18 monthspost
24 monthspost
30 monthspost
36 monthspost
Substance abuse - inpatient Medical Inpatient
Figure 13 Number of Users of Substance Abuse and Medical Inpatient Services
(82 S+C Tenants)
1 2 2 1
4 4 31 1
31
53 4
10
7
4 46
0
5
10
15
20
25
30
35
40
45
50
24 monthsprior
18 monthsprior
12 monthsprior
6 monthsprior
6 monthspost
12 monthspost
18 monthspost
24 monthspost
30 monthspost
36 monthspost
Substance abuse - inpatient Medical Inpatient
________________________________________________________________________Connecticut Supportive Housing Demonstration Program Chapter I Page 19
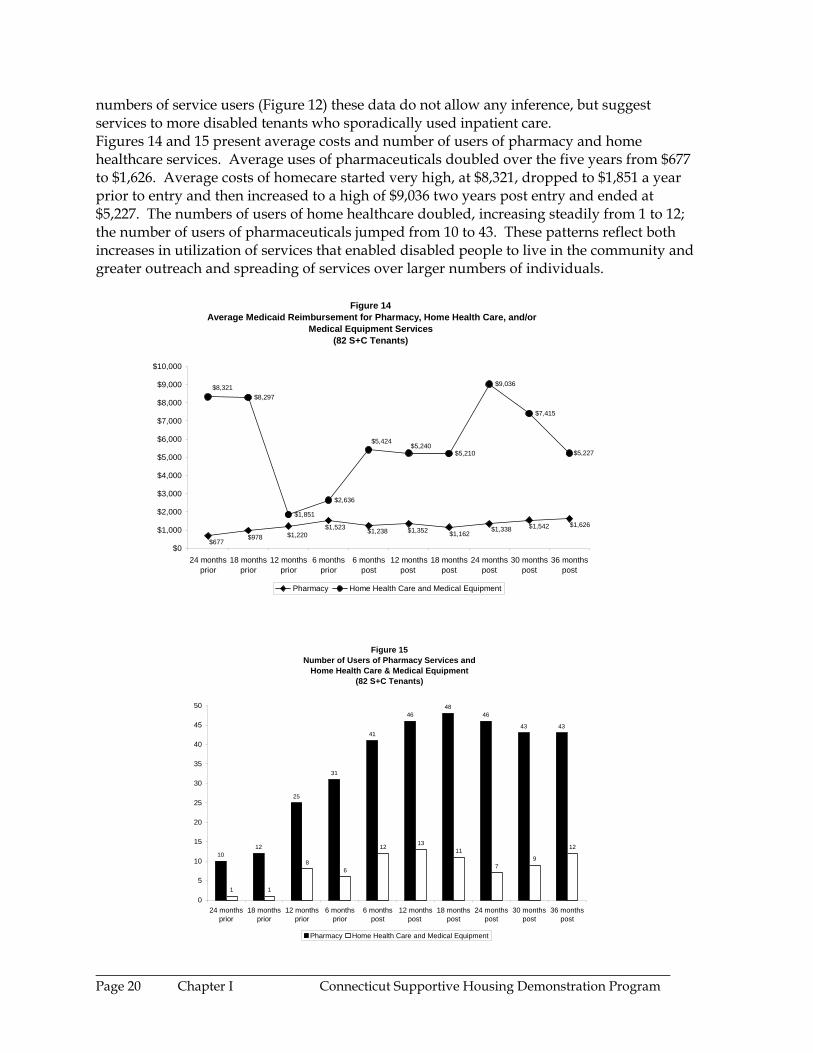
numbers of service users (Figure 12) these data do not allow any inference, but suggest services to more disabled tenants who sporadically used inpatient care. Figures 14 and 15 present average costs and number of users of pharmacy and home healthcare services. Average uses of pharmaceuticals doubled over the five years from $677 to $1,626. Average costs of homecare started very high, at $8,321, dropped to $1,851 a year prior to entry and then increased to a high of $9,036 two years post entry and ended at $5,227. The numbers of users of home healthcare doubled, increasing steadily from 1 to 12; the number of users of pharmaceuticals jumped from 10 to 43. These patterns reflect both increases in utilization of services that enabled disabled people to live in the community and greater outreach and spreading of services over larger numbers of individuals.
$677$978 $1,220
$1,523 $1,238 $1,352 $1,162$1,338 $1,542 $1,626
onthsior
18 monthsprior
12 monthsprior
6 monthsprior
6 monthspost
12 monthspost
18 monthspost
24 monthspost
30 monthspost
36 monthspost
Pharmacy Home Health Care and Medical Equipment
Figure 14 Average Medicaid Reimbursement for Pharmacy, Home Health Care, and/or
Medical Equipment Services(82 S+C Tenants)
$8,297
$1,851
$2,636
$5,210
$9,036
$7,415
$5,227
$8,321
$5,240$5,424
$0
$1,000
$2,000
$3,000
$4,000
$5,000
$6,000
$7,000
$8,000
$9,000
$10,000
24 mpr
Figure 15Number of Users of Pharmacy Services and
Home Health Care & Medical Equipment(82 S+C Tenants)
1012
25
31
41
4648
46
43 43
1 1
86
12 1311
79
12
0
5
10
15
20
25
30
35
40
45
50
24 monthsprior
18 monthsprior
12 monthsprior
6 monthsprior
6 monthspost
12 monthspost
18 monthspost
24 monthspost
30 monthspost
36 monthspost
Pharmacy Home Health Care and Medical Equipment
________________________________________________________________________Page 20 Chapter I Connecticut Supportive Housing Demonstration Program
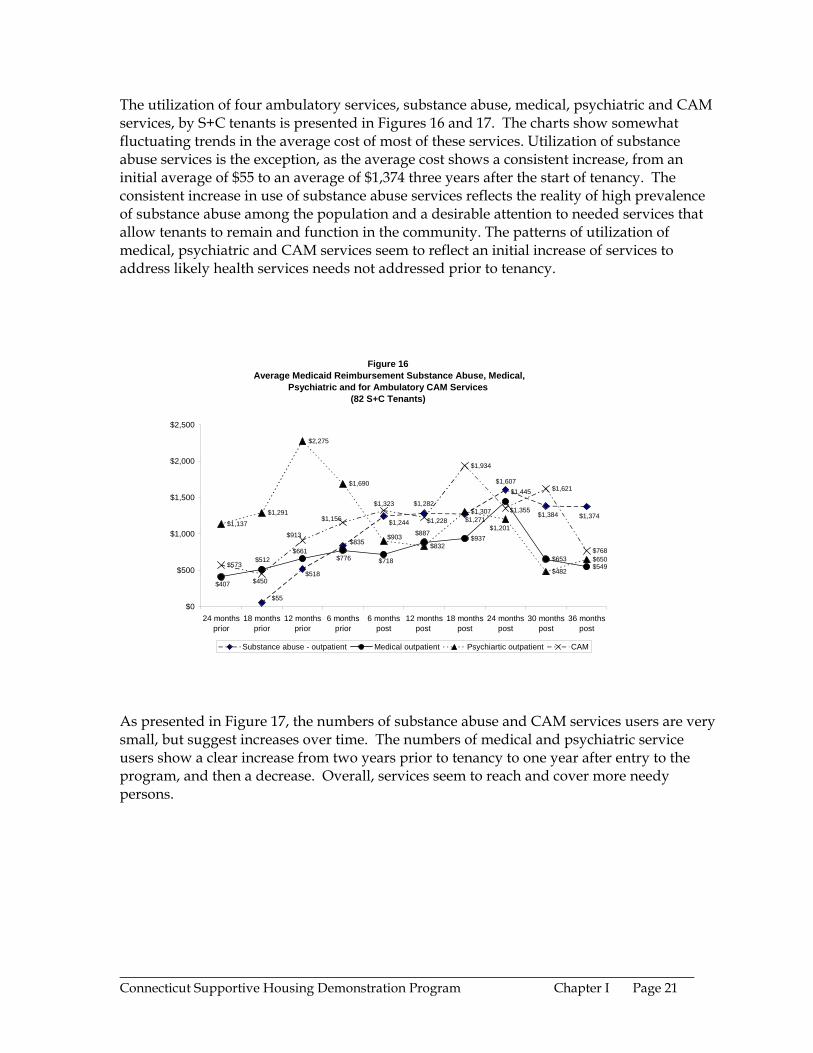
The utilization of four ambulatory services, substance abuse, medical, psychiatric and CAM services, by S+C tenants is presented in Figures 16 and 17. The charts show somewhat fluctuating trends in the average cost of most of these services. Utilization of substance abuse services is the exception, as the average cost shows a consistent increase, from an initial average of $55 to an average of $1,374 three years after the start of tenancy. The consistent increase in use of substance abuse services reflects the reality of high prevalence of substance abuse among the population and a desirable attention to needed services that allow tenants to remain and function in the community. The patterns of utilization of medical, psychiatric and CAM services seem to reflect an initial increase of services to address likely health services needs not addressed prior to tenancy.
Figure 16 Average Medicaid Reimbursement Substance Abuse, Medical,
Psychiatric and for Ambulatory CAM Services(82 S+C Tenants)
$937
$653$549
$1,137$1,291
$2,275
$1,690
$832
$1,307
$482
$650$573
$1,934
$1,621
$768
$55
$518
$835
$1,244
$1,282
$1,271
$1,607
$1,384 $1,374
$1,445
$661$512 $776
$407
$718
$887$1,201
$903$913
$1,156
$1,323$1,355
$1,228
$450
$0
$500
$1,000
$1,500
$2,000
$2,500
24 monthsprior
18 monthsprior
12 monthsprior
6 monthsprior
6 monthspost
12 monthspost
18 monthspost
24 monthspost
30 monthspost
36 monthspost
Substance abuse - outpatient Medical outpatient Psychiartic outpatient CAM
As presented in Figure 17, the numbers of substance abuse and CAM services users are very small, but suggest increases over time. The numbers of medical and psychiatric service users show a clear increase from two years prior to tenancy to one year after entry to the program, and then a decrease. Overall, services seem to reach and cover more needy persons.
________________________________________________________________________Connecticut Supportive Housing Demonstration Program Chapter I Page 21
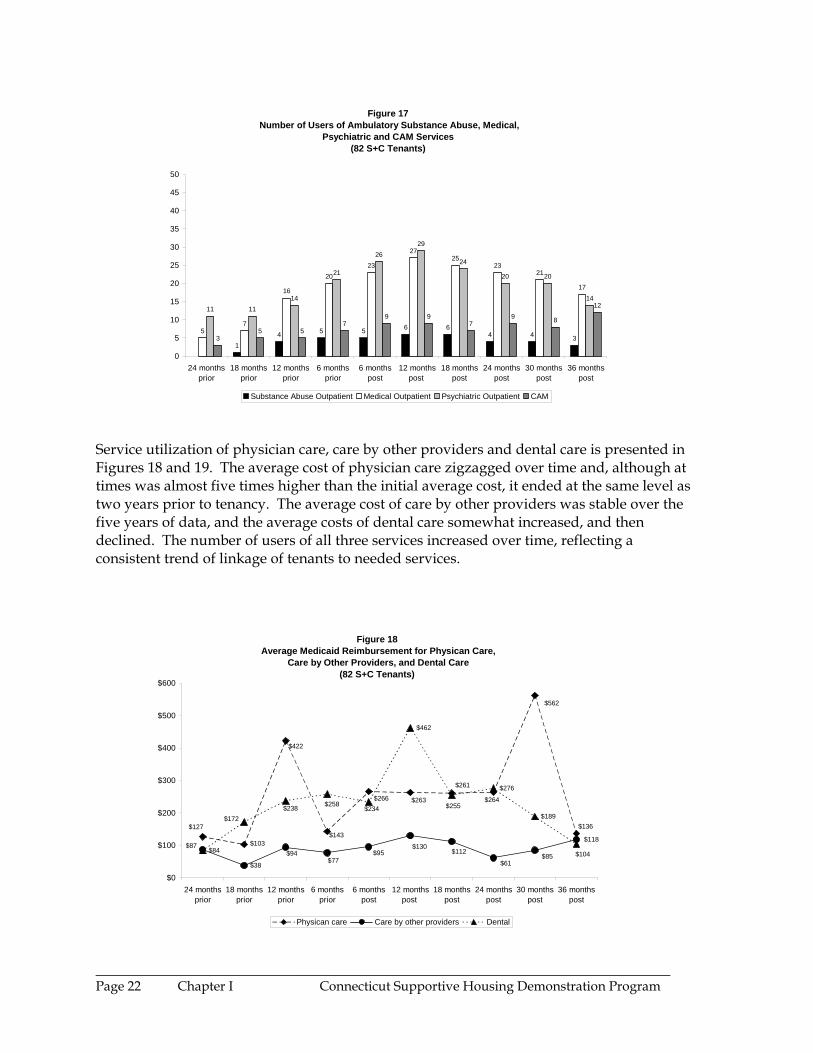
Figure 17 Number of Users of Ambulatory Substance Abuse, Medical,
Psychiatric and CAM Services(82 S+C Tenants)
14 5 5 6 6
4 4 35
7
16
2023
2725
2321
17
11 1114
21
2629
24
20 20
14
35 5
79 9
79 8
12
0
5
10
15
20
25
30
35
40
45
50
24 monthsprior
18 monthsprior
12 monthsprior
6 monthsprior
6 monthspost
12 monthspost
18 monthspost
24 monthspost
30 monthspost
36 monthspost
Substance Abuse Outpatient Medical Outpatient Psychiatric Outpatient CAM
Service utilization of physician care, care by other providers and dental care is presented in Figures 18 and 19. The average cost of physician care zigzagged over time and, although at times was almost five times higher than the initial average cost, it ended at the same level as two years prior to tenancy. The average cost of care by other providers was stable over the five years of data, and the average costs of dental care somewhat increased, and then declined. The number of users of all three services increased over time, reflecting a consistent trend of linkage of tenants to needed services.
Figure 18 Average Medicaid Reimbursement for Physican Care,
Care by Other Providers, and Dental Care(82 S+C Tenants)
$38
$84
$462
$276
$189$136
$562
$264
$261
$263$266
$143
$422
$103
$127
$130$95
$87
$77$94 $112
$61$85
$118
$255$234$258$238
$172
$104
$0
$100
$200
$300
$400
$500
$600
24 monthsprior
18 monthsprior
12 monthsprior
6 monthsprior
6 monthspost
12 monthspost
18 monthspost
24 monthspost
30 monthspost
36 monthspost
Physican care Care by other providers Dental
________________________________________________________________________Page 22 Chapter I Connecticut Supportive Housing Demonstration Program
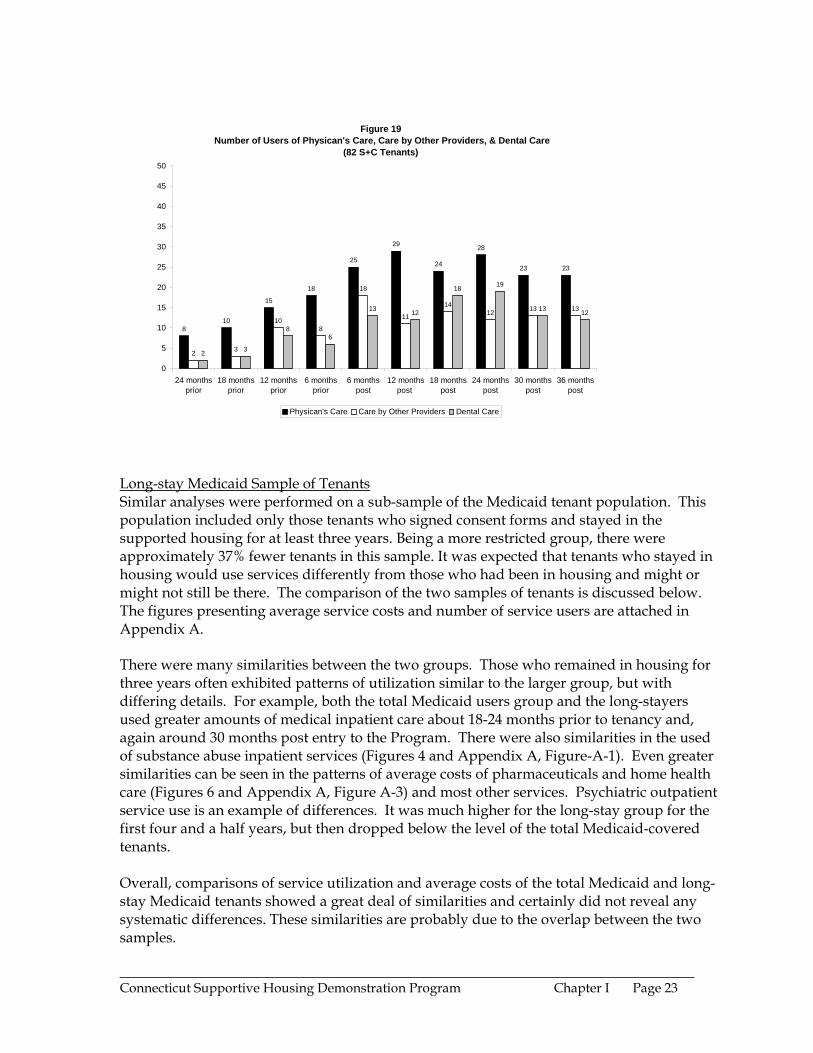
Figure 19 Number of Users of Physican's Care, Care by Other Providers, & Dental Care
(82 S+C Tenants)
810
15
18
25
29
24
28
23 23
2 3
108
18
11
1412 13 13
2 3
86
13 12
18 19
13 12
0
5
10
15
20
25
30
35
40
45
50
24 monthsprior
18 monthsprior
12 monthsprior
6 monthsprior
6 monthspost
12 monthspost
18 monthspost
24 monthspost
30 monthspost
36 monthspost
Physican's Care Care by Other Providers Dental Care
Long-stay Medicaid Sample of Tenants Similar analyses were performed on a sub-sample of the Medicaid tenant population. This population included only those tenants who signed consent forms and stayed in the supported housing for at least three years. Being a more restricted group, there were approximately 37% fewer tenants in this sample. It was expected that tenants who stayed in housing would use services differently from those who had been in housing and might or might not still be there. The comparison of the two samples of tenants is discussed below. The figures presenting average service costs and number of service users are attached in Appendix A. There were many similarities between the two groups. Those who remained in housing for three years often exhibited patterns of utilization similar to the larger group, but with differing details. For example, both the total Medicaid users group and the long-stayers used greater amounts of medical inpatient care about 18-24 months prior to tenancy and, again around 30 months post entry to the Program. There were also similarities in the used of substance abuse inpatient services (Figures 4 and Appendix A, Figure-A-1). Even greater similarities can be seen in the patterns of average costs of pharmaceuticals and home health care (Figures 6 and Appendix A, Figure A-3) and most other services. Psychiatric outpatient service use is an example of differences. It was much higher for the long-stay group for the first four and a half years, but then dropped below the level of the total Medicaid-covered tenants. Overall, comparisons of service utilization and average costs of the total Medicaid and long-stay Medicaid tenants showed a great deal of similarities and certainly did not reveal any systematic differences. These similarities are probably due to the overlap between the two samples.
________________________________________________________________________Connecticut Supportive Housing Demonstration Program Chapter I Page 23
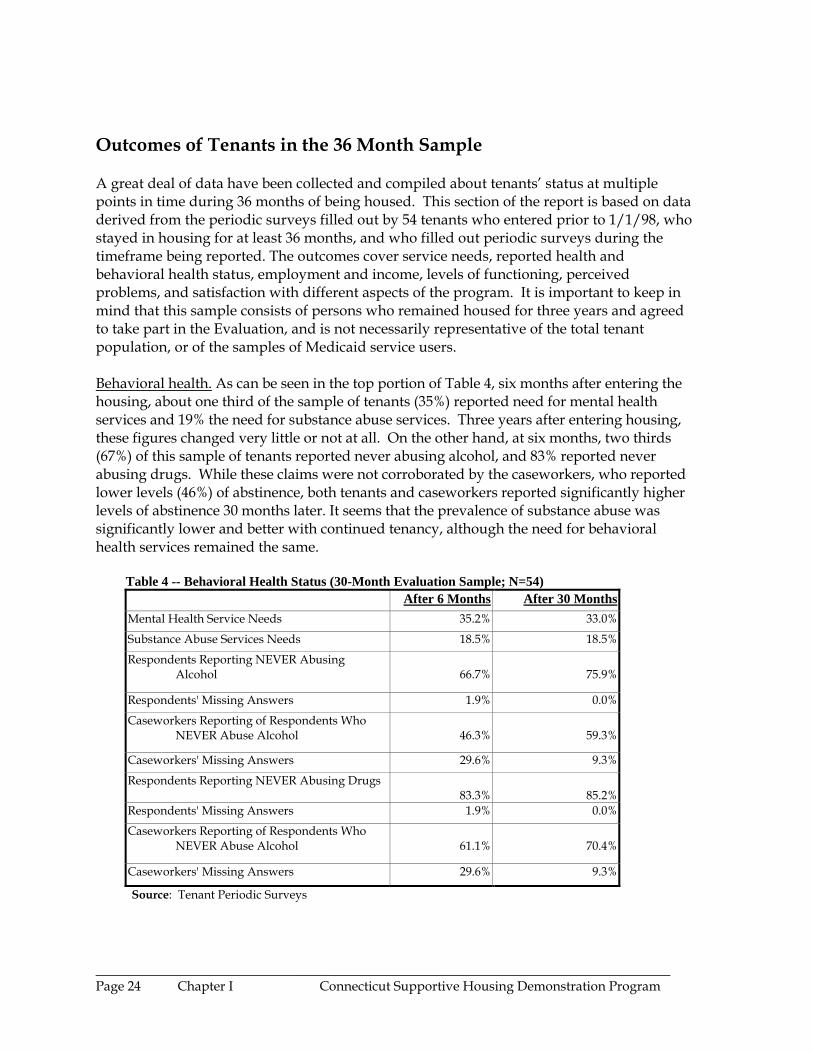
Outcomes of Tenants in the 36 Month Sample A great deal of data have been collected and compiled about tenants’ status at multiple points in time during 36 months of being housed. This section of the report is based on data derived from the periodic surveys filled out by 54 tenants who entered prior to 1/1/98, who stayed in housing for at least 36 months, and who filled out periodic surveys during the timeframe being reported. The outcomes cover service needs, reported health and behavioral health status, employment and income, levels of functioning, perceived problems, and satisfaction with different aspects of the program. It is important to keep in mind that this sample consists of persons who remained housed for three years and agreed to take part in the Evaluation, and is not necessarily representative of the total tenant population, or of the samples of Medicaid service users. Behavioral health. As can be seen in the top portion of Table 4, six months after entering the housing, about one third of the sample of tenants (35%) reported need for mental health services and 19% the need for substance abuse services. Three years after entering housing, these figures changed very little or not at all. On the other hand, at six months, two thirds (67%) of this sample of tenants reported never abusing alcohol, and 83% reported never abusing drugs. While these claims were not corroborated by the caseworkers, who reported lower levels (46%) of abstinence, both tenants and caseworkers reported significantly higher levels of abstinence 30 months later. It seems that the prevalence of substance abuse was significantly lower and better with continued tenancy, although the need for behavioral health services remained the same.
Table 4 -- Behavioral Health Status (30-Month Evaluation Sample; N=54) After 6 Months After 30 Months
Mental Health Service Needs 35.2% 33.0%
Substance Abuse Services Needs 18.5% 18.5%
Respondents Reporting NEVER Abusing Alcohol
66.7% 75.9%
Respondents' Missing Answers 1.9% 0.0%
Caseworkers Reporting of Respondents Who NEVER Abuse Alcohol
46.3% 59.3%
Caseworkers' Missing Answers 29.6% 9.3%
Respondents Reporting NEVER Abusing Drugs 83.3% 85.2%
Respondents' Missing Answers 1.9% 0.0%
Caseworkers Reporting of Respondents Who NEVER Abuse Alcohol
61.1% 70.4%
Caseworkers' Missing Answers 29.6% 9.3%
Source: Tenant Periodic Surveys
________________________________________________________________________Page 24 Chapter I Connecticut Supportive Housing Demonstration Program
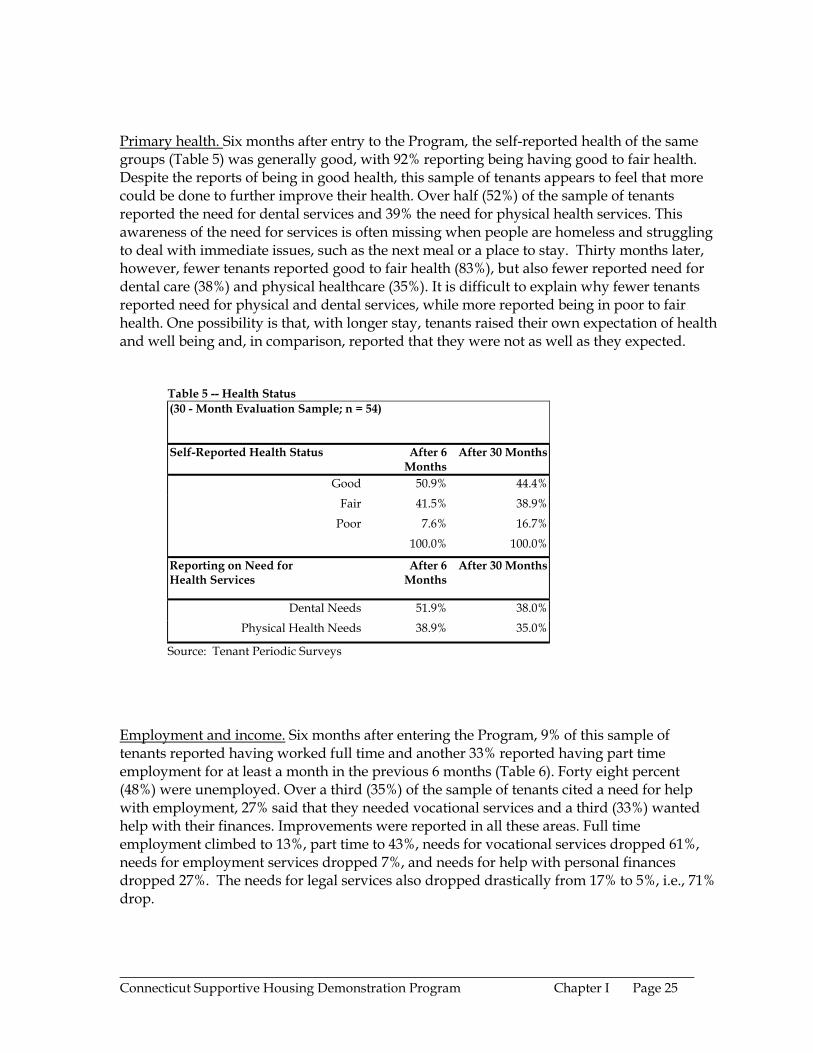
Primary health. Six months after entry to the Program, the self-reported health of the same groups (Table 5) was generally good, with 92% reporting being having good to fair health. Despite the reports of being in good health, this sample of tenants appears to feel that more could be done to further improve their health. Over half (52%) of the sample of tenants reported the need for dental services and 39% the need for physical health services. This awareness of the need for services is often missing when people are homeless and struggling to deal with immediate issues, such as the next meal or a place to stay. Thirty months later, however, fewer tenants reported good to fair health (83%), but also fewer reported need for dental care (38%) and physical healthcare (35%). It is difficult to explain why fewer tenants reported need for physical and dental services, while more reported being in poor to fair health. One possibility is that, with longer stay, tenants raised their own expectation of health and well being and, in comparison, reported that they were not as well as they expected.
Table 5 -- Health Status (30 - Month Evaluation Sample; n = 54)
Self-Reported Health Status After 6 Months
After 30 Months
Good 50.9% 44.4% Fair 41.5% 38.9%
Poor 7.6% 16.7% 100.0% 100.0%
Reporting on Need for Health Services
After 6 Months
After 30 Months
Dental Needs 51.9% 38.0% Physical Health Needs 38.9% 35.0%
Source: Tenant Periodic Surveys
Employment and income. Six months after entering the Program, 9% of this sample of tenants reported having worked full time and another 33% reported having part time employment for at least a month in the previous 6 months (Table 6). Forty eight percent (48%) were unemployed. Over a third (35%) of the sample of tenants cited a need for help with employment, 27% said that they needed vocational services and a third (33%) wanted help with their finances. Improvements were reported in all these areas. Full time employment climbed to 13%, part time to 43%, needs for vocational services dropped 61%, needs for employment services dropped 7%, and needs for help with personal finances dropped 27%. The needs for legal services also dropped drastically from 17% to 5%, i.e., 71% drop.
________________________________________________________________________Connecticut Supportive Housing Demonstration Program Chapter I Page 25
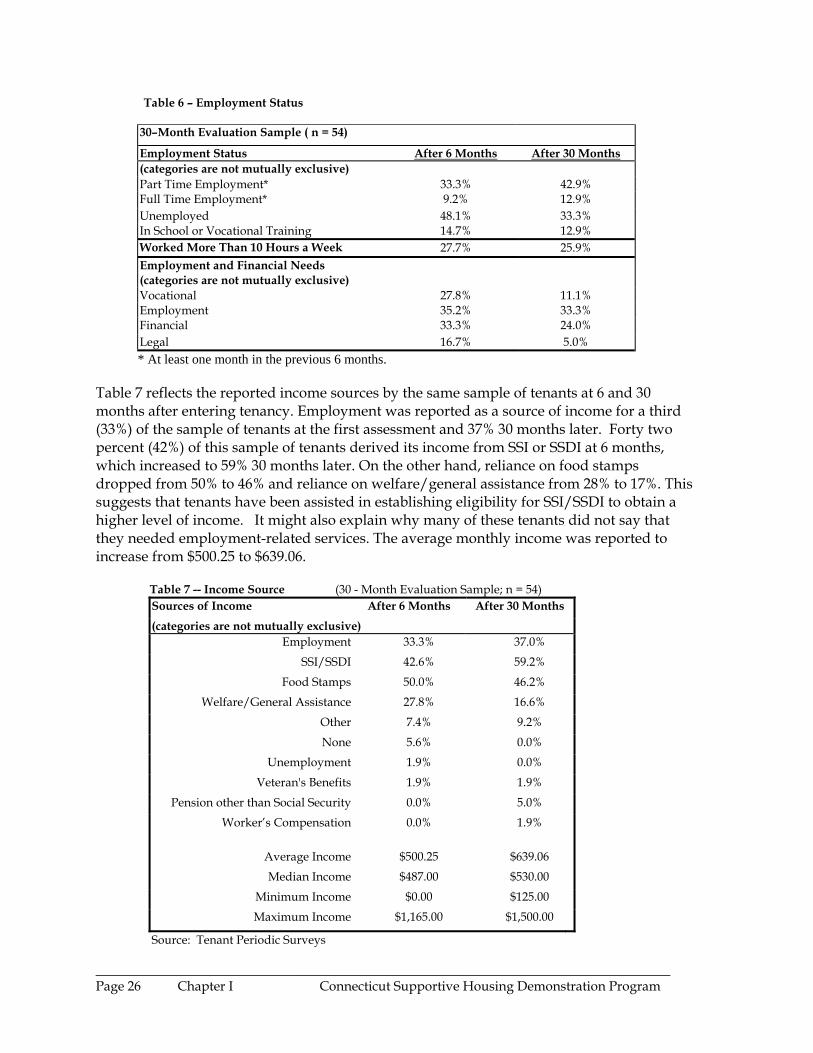
Table 6 – Employment Status
30–Month Evaluation Sample ( n = 54)
Employment Status After 6 Months After 30 Months (categories are not mutually exclusive) Part Time Employment* 33.3% 42.9% Full Time Employment* 9.2% 12.9% Unemployed 48.1% 33.3% In School or Vocational Training 14.7% 12.9% Worked More Than 10 Hours a Week 27.7% 25.9% Employment and Financial Needs (categories are not mutually exclusive) Vocational 27.8% 11.1% Employment 35.2% 33.3% Financial 33.3% 24.0% Legal 16.7% 5.0% * At least one month in the previous 6 months.
Table 7 reflects the reported income sources by the same sample of tenants at 6 and 30 months after entering tenancy. Employment was reported as a source of income for a third (33%) of the sample of tenants at the first assessment and 37% 30 months later. Forty two percent (42%) of this sample of tenants derived its income from SSI or SSDI at 6 months, which increased to 59% 30 months later. On the other hand, reliance on food stamps dropped from 50% to 46% and reliance on welfare/general assistance from 28% to 17%. This suggests that tenants have been assisted in establishing eligibility for SSI/SSDI to obtain a higher level of income. It might also explain why many of these tenants did not say that they needed employment-related services. The average monthly income was reported to increase from $500.25 to $639.06.
Table 7 -- Income Source (30 - Month Evaluation Sample; n = 54) Sources of Income After 6 Months After 30 Months (categories are not mutually exclusive)
Employment 33.3% 37.0% SSI/SSDI 42.6% 59.2%
Food Stamps 50.0% 46.2% Welfare/General Assistance 27.8% 16.6%
Other 7.4% 9.2% None 5.6% 0.0%
Unemployment 1.9% 0.0% Veteran's Benefits 1.9% 1.9%
Pension other than Social Security 0.0% 5.0% Worker’s Compensation 0.0% 1.9%
Average Income $500.25 $639.06 Median Income $487.00 $530.00
Minimum Income $0.00 $125.00 Maximum Income $1,165.00 $1,500.00
Source: Tenant Periodic Surveys
________________________________________________________________________Page 26 Chapter I Connecticut Supportive Housing Demonstration Program
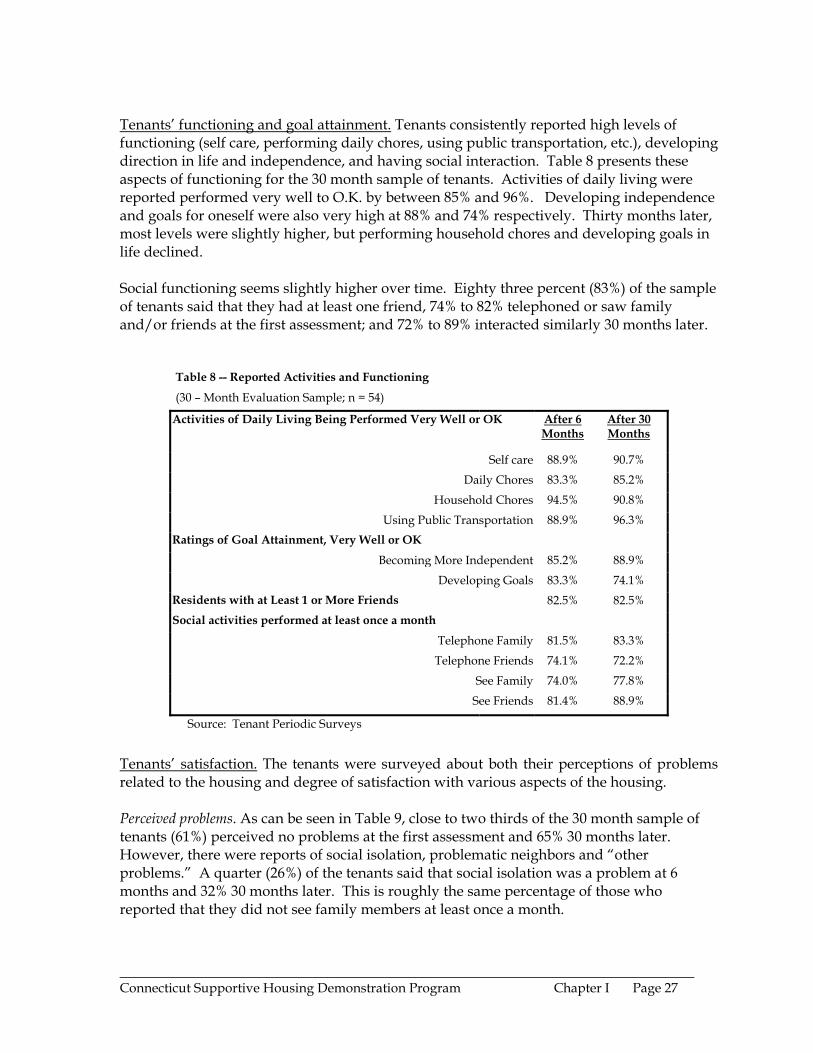
Tenants’ functioning and goal attainment. Tenants consistently reported high levels of functioning (self care, performing daily chores, using public transportation, etc.), developing direction in life and independence, and having social interaction. Table 8 presents these aspects of functioning for the 30 month sample of tenants. Activities of daily living were reported performed very well to O.K. by between 85% and 96%. Developing independence and goals for oneself were also very high at 88% and 74% respectively. Thirty months later, most levels were slightly higher, but performing household chores and developing goals in life declined. Social functioning seems slightly higher over time. Eighty three percent (83%) of the sample of tenants said that they had at least one friend, 74% to 82% telephoned or saw family and/or friends at the first assessment; and 72% to 89% interacted similarly 30 months later.
Table 8 -- Reported Activities and Functioning
(30 – Month Evaluation Sample; n = 54)
Activities of Daily Living Being Performed Very Well or OK After 6 Months
After 30 Months
Self care 88.9% 90.7% Daily Chores 83.3% 85.2%
Household Chores 94.5% 90.8% Using Public Transportation 88.9% 96.3%
Ratings of Goal Attainment, Very Well or OK Becoming More Independent 85.2% 88.9%
Developing Goals 83.3% 74.1% Residents with at Least 1 or More Friends 82.5% 82.5% Social activities performed at least once a month
Telephone Family 81.5% 83.3% Telephone Friends 74.1% 72.2%
See Family 74.0% 77.8% See Friends 81.4% 88.9%
Source: Tenant Periodic Surveys
Tenants’ satisfaction. The tenants were surveyed about both their perceptions of problems related to the housing and degree of satisfaction with various aspects of the housing. Perceived problems. As can be seen in Table 9, close to two thirds of the 30 month sample of tenants (61%) perceived no problems at the first assessment and 65% 30 months later. However, there were reports of social isolation, problematic neighbors and “other problems.” A quarter (26%) of the tenants said that social isolation was a problem at 6 months and 32% 30 months later. This is roughly the same percentage of those who reported that they did not see family members at least once a month.
________________________________________________________________________Connecticut Supportive Housing Demonstration Program Chapter I Page 27
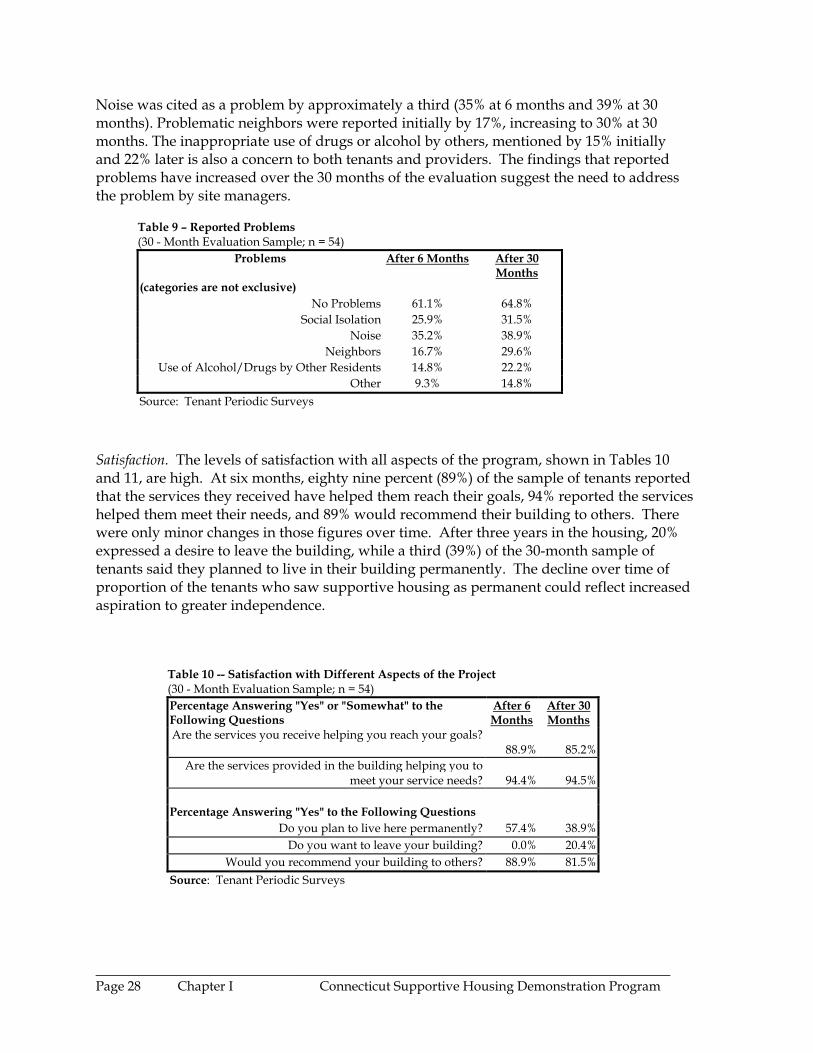
Noise was cited as a problem by approximately a third (35% at 6 months and 39% at 30 months). Problematic neighbors were reported initially by 17%, increasing to 30% at 30 months. The inappropriate use of drugs or alcohol by others, mentioned by 15% initially and 22% later is also a concern to both tenants and providers. The findings that reported problems have increased over the 30 months of the evaluation suggest the need to address the problem by site managers.
Table 9 – Reported Problems (30 - Month Evaluation Sample; n = 54)
Problems After 6 Months After 30 Months
(categories are not exclusive) No Problems 61.1% 64.8%
Social Isolation 25.9% 31.5% Noise 35.2% 38.9%
Neighbors 16.7% 29.6% Use of Alcohol/Drugs by Other Residents 14.8% 22.2%
Other 9.3% 14.8% Source: Tenant Periodic Surveys
Satisfaction. The levels of satisfaction with all aspects of the program, shown in Tables 10 and 11, are high. At six months, eighty nine percent (89%) of the sample of tenants reported that the services they received have helped them reach their goals, 94% reported the services helped them meet their needs, and 89% would recommend their building to others. There were only minor changes in those figures over time. After three years in the housing, 20% expressed a desire to leave the building, while a third (39%) of the 30-month sample of tenants said they planned to live in their building permanently. The decline over time of proportion of the tenants who saw supportive housing as permanent could reflect increased aspiration to greater independence.
Table 10 -- Satisfaction with Different Aspects of the Project (30 - Month Evaluation Sample; n = 54) Percentage Answering "Yes" or "Somewhat" to the Following Questions
After 6 Months
After 30 Months
Are the services you receive helping you reach your goals? 88.9% 85.2%
Are the services provided in the building helping you to meet your service needs?
94.4% 94.5%
Percentage Answering "Yes" to the Following Questions
Do you plan to live here permanently? 57.4% 38.9%Do you want to leave your building? 0.0% 20.4%
Would you recommend your building to others? 88.9% 81.5%Source: Tenant Periodic Surveys
________________________________________________________________________Page 28 Chapter I Connecticut Supportive Housing Demonstration Program
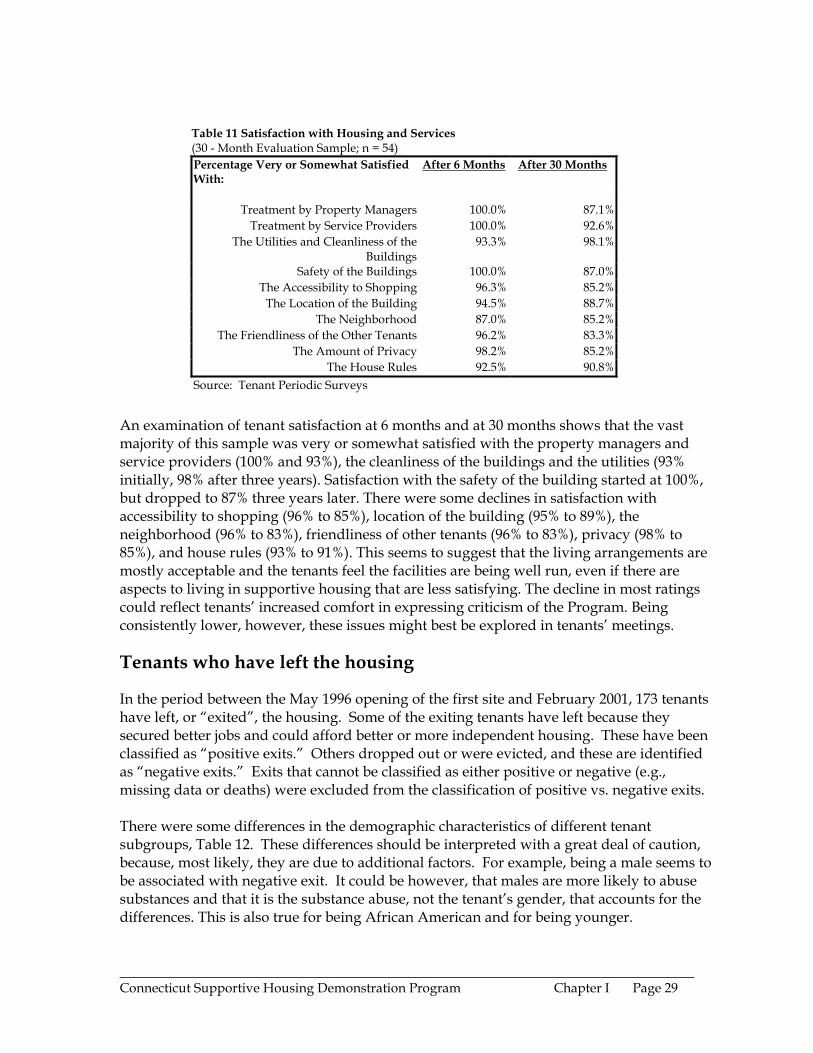
Table 11 Satisfaction with Housing and Services (30 - Month Evaluation Sample; n = 54) Percentage Very or Somewhat Satisfied With:
After 6 Months After 30 Months
Treatment by Property Managers 100.0% 87.1%
Treatment by Service Providers 100.0% 92.6%The Utilities and Cleanliness of the
Buildings 93.3% 98.1%
Safety of the Buildings 100.0% 87.0%The Accessibility to Shopping 96.3% 85.2%
The Location of the Building 94.5% 88.7%The Neighborhood 87.0% 85.2%
The Friendliness of the Other Tenants 96.2% 83.3%The Amount of Privacy 98.2% 85.2%
The House Rules 92.5% 90.8%Source: Tenant Periodic Surveys
An examination of tenant satisfaction at 6 months and at 30 months shows that the vast majority of this sample was very or somewhat satisfied with the property managers and service providers (100% and 93%), the cleanliness of the buildings and the utilities (93% initially, 98% after three years). Satisfaction with the safety of the building started at 100%, but dropped to 87% three years later. There were some declines in satisfaction with accessibility to shopping (96% to 85%), location of the building (95% to 89%), the neighborhood (96% to 83%), friendliness of other tenants (96% to 83%), privacy (98% to 85%), and house rules (93% to 91%). This seems to suggest that the living arrangements are mostly acceptable and the tenants feel the facilities are being well run, even if there are aspects to living in supportive housing that are less satisfying. The decline in most ratings could reflect tenants’ increased comfort in expressing criticism of the Program. Being consistently lower, however, these issues might best be explored in tenants’ meetings. Tenants who have left the housing In the period between the May 1996 opening of the first site and February 2001, 173 tenants have left, or “exited”, the housing. Some of the exiting tenants have left because they secured better jobs and could afford better or more independent housing. These have been classified as “positive exits.” Others dropped out or were evicted, and these are identified as “negative exits.” Exits that cannot be classified as either positive or negative (e.g., missing data or deaths) were excluded from the classification of positive vs. negative exits. There were some differences in the demographic characteristics of different tenant subgroups, Table 12. These differences should be interpreted with a great deal of caution, because, most likely, they are due to additional factors. For example, being a male seems to be associated with negative exit. It could be however, that males are more likely to abuse substances and that it is the substance abuse, not the tenant’s gender, that accounts for the differences. This is also true for being African American and for being younger.
________________________________________________________________________Connecticut Supportive Housing Demonstration Program Chapter I Page 29
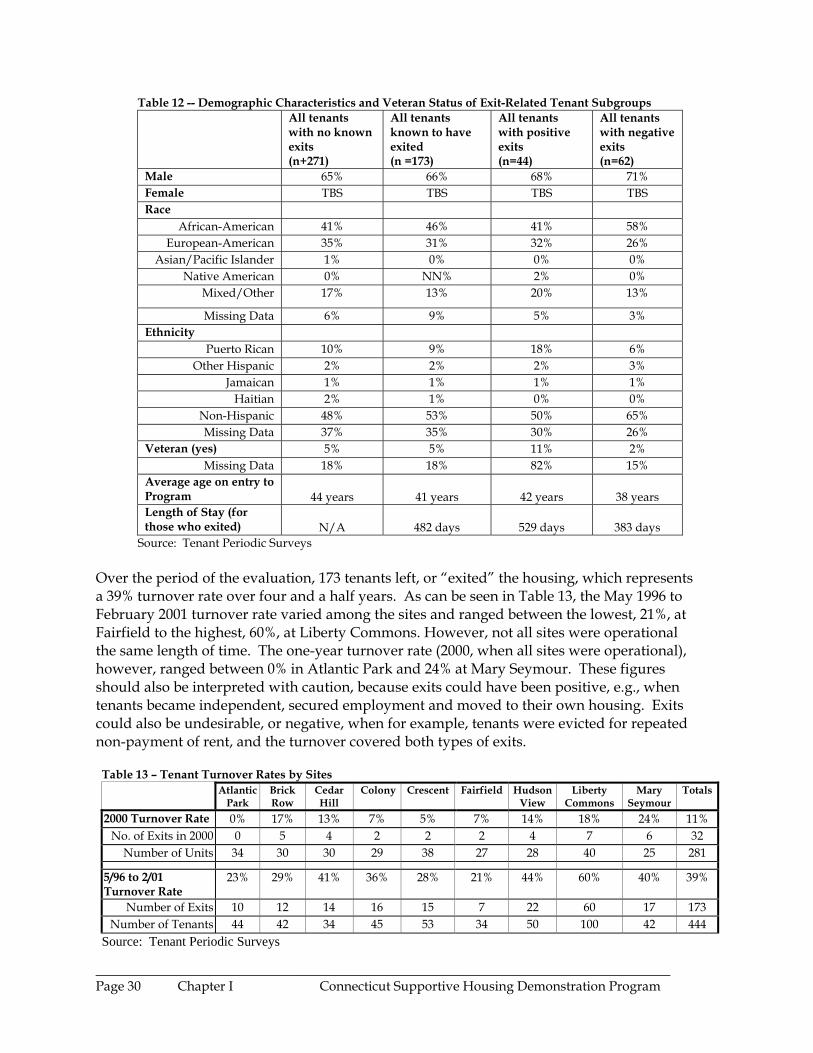
Table 12 -- Demographic Characteristics and Veteran Status of Exit-Related Tenant Subgroups All tenants
with no known exits (n+271)
All tenants known to have exited (n =173)
All tenants with positive exits (n=44)
All tenants with negative exits (n=62)
Male 65% 66% 68% 71% Female TBS TBS TBS TBS Race
African-American 41% 46% 41% 58% European-American 35% 31% 32% 26%
Asian/Pacific Islander 1% 0% 0% 0% Native American 0% NN% 2% 0%
Mixed/Other 17% 13% 20% 13%
Missing Data 6% 9% 5% 3% Ethnicity
Puerto Rican 10% 9% 18% 6% Other Hispanic 2% 2% 2% 3%
Jamaican 1% 1% 1% 1% Haitian 2% 1% 0% 0%
Non-Hispanic 48% 53% 50% 65% Missing Data 37% 35% 30% 26%
Veteran (yes) 5% 5% 11% 2% Missing Data 18% 18% 82% 15%
Average age on entry to Program
44 years
41 years
42 years
38 years
Length of Stay (for those who exited)
N/A
482 days
529 days
383 days
Source: Tenant Periodic Surveys Over the period of the evaluation, 173 tenants left, or “exited” the housing, which represents a 39% turnover rate over four and a half years. As can be seen in Table 13, the May 1996 to February 2001 turnover rate varied among the sites and ranged between the lowest, 21%, at Fairfield to the highest, 60%, at Liberty Commons. However, not all sites were operational the same length of time. The one-year turnover rate (2000, when all sites were operational), however, ranged between 0% in Atlantic Park and 24% at Mary Seymour. These figures should also be interpreted with caution, because exits could have been positive, e.g., when tenants became independent, secured employment and moved to their own housing. Exits could also be undesirable, or negative, when for example, tenants were evicted for repeated non-payment of rent, and the turnover covered both types of exits.
Table 13 – Tenant Turnover Rates by Sites Atlantic
Park Brick Row
Cedar Hill
Colony Crescent Fairfield Hudson View
Liberty Commons
Mary Seymour
Totals
2000 Turnover Rate 0% 17% 13% 7% 5% 7% 14% 18% 24% 11% No. of Exits in 2000 0 5 4 2 2 2 4 7 6 32
Number of Units 34 30 30 29 38 27 28 40 25 281 5/96 to 2/01
Turnover Rate 23% 29% 41% 36% 28% 21% 44% 60% 40% 39%
Number of Exits 10 12 14 16 15 7 22 60 17 173 Number of Tenants 44 42 34 45 53 34 50 100 42 444
Source: Tenant Periodic Surveys
________________________________________________________________________Page 30 Chapter I Connecticut Supportive Housing Demonstration Program
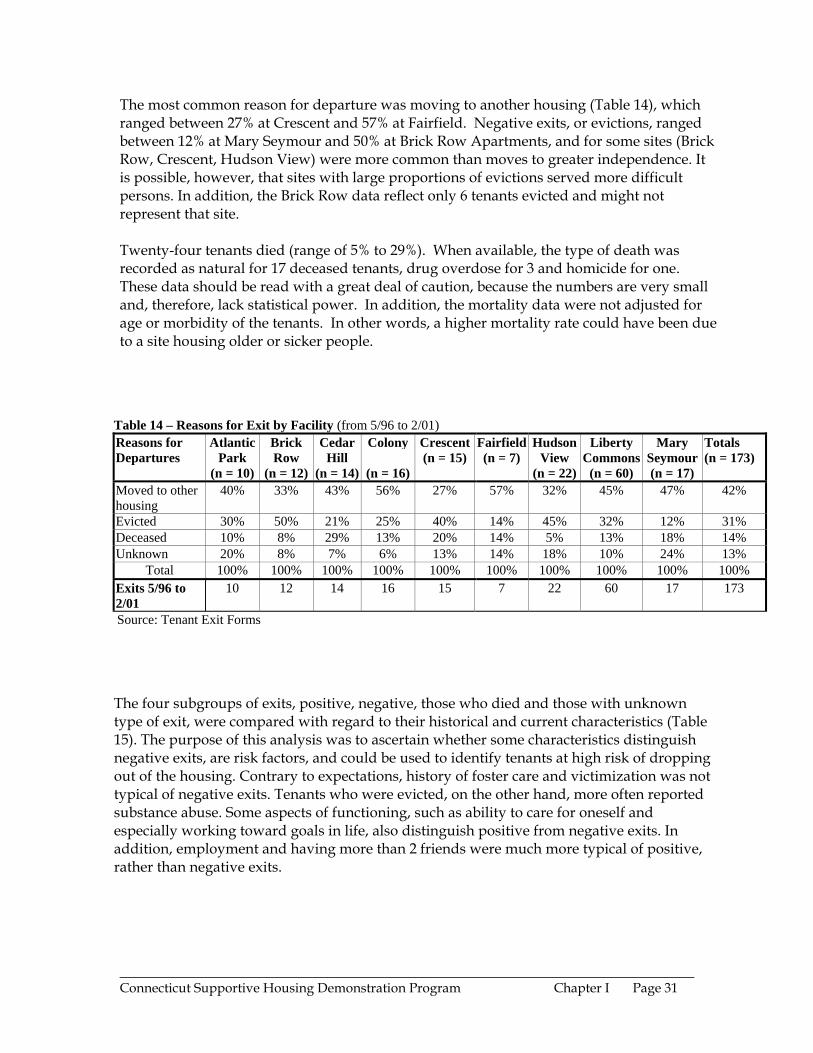
The most common reason for departure was moving to another housing (Table 14), which ranged between 27% at Crescent and 57% at Fairfield. Negative exits, or evictions, ranged between 12% at Mary Seymour and 50% at Brick Row Apartments, and for some sites (Brick Row, Crescent, Hudson View) were more common than moves to greater independence. It is possible, however, that sites with large proportions of evictions served more difficult persons. In addition, the Brick Row data reflect only 6 tenants evicted and might not represent that site. Twenty-four tenants died (range of 5% to 29%). When available, the type of death was recorded as natural for 17 deceased tenants, drug overdose for 3 and homicide for one. These data should be read with a great deal of caution, because the numbers are very small and, therefore, lack statistical power. In addition, the mortality data were not adjusted for age or morbidity of the tenants. In other words, a higher mortality rate could have been due to a site housing older or sicker people.
Table 14 – Reasons for Exit by Facility (from 5/96 to 2/01) Reasons for Departures
Atlantic Park
(n = 10)
Brick Row
(n = 12)
Cedar Hill
(n = 14)
Colony
(n = 16)
Crescent (n = 15)
Fairfield (n = 7)
Hudson View
(n = 22)
Liberty Commons
(n = 60)
Mary Seymour (n = 17)
Totals (n = 173)
Moved to other housing
40% 33% 43% 56% 27% 57% 32% 45% 47% 42%
Evicted 30% 50% 21% 25% 40% 14% 45% 32% 12% 31% Deceased 10% 8% 29% 13% 20% 14% 5% 13% 18% 14% Unknown 20% 8% 7% 6% 13% 14% 18% 10% 24% 13%
Total 100% 100% 100% 100% 100% 100% 100% 100% 100% 100% Exits 5/96 to 2/01
10 12 14 16 15 7 22 60 17 173
Source: Tenant Exit Forms The four subgroups of exits, positive, negative, those who died and those with unknown type of exit, were compared with regard to their historical and current characteristics (Table 15). The purpose of this analysis was to ascertain whether some characteristics distinguish negative exits, are risk factors, and could be used to identify tenants at high risk of dropping out of the housing. Contrary to expectations, history of foster care and victimization was not typical of negative exits. Tenants who were evicted, on the other hand, more often reported substance abuse. Some aspects of functioning, such as ability to care for oneself and especially working toward goals in life, also distinguish positive from negative exits. In addition, employment and having more than 2 friends were much more typical of positive, rather than negative exits.
________________________________________________________________________Connecticut Supportive Housing Demonstration Program Chapter I Page 31
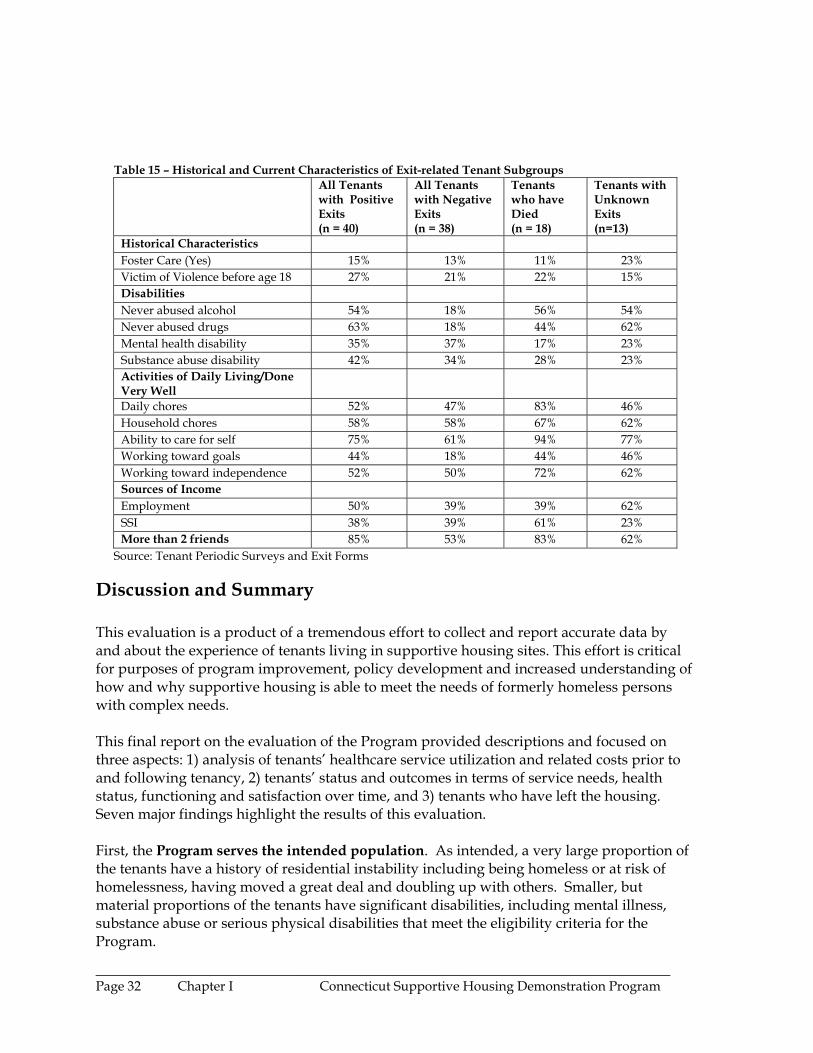
Table 15 – Historical and Current Characteristics of Exit-related Tenant Subgroups All Tenants
with Positive Exits (n = 40)
All Tenants with Negative Exits (n = 38)
Tenants who have Died (n = 18)
Tenants with Unknown Exits (n=13)
Historical Characteristics Foster Care (Yes) 15% 13% 11% 23% Victim of Violence before age 18 27% 21% 22% 15% Disabilities Never abused alcohol 54% 18% 56% 54% Never abused drugs 63% 18% 44% 62% Mental health disability 35% 37% 17% 23% Substance abuse disability 42% 34% 28% 23% Activities of Daily Living/Done Very Well
Daily chores 52% 47% 83% 46% Household chores 58% 58% 67% 62% Ability to care for self 75% 61% 94% 77% Working toward goals 44% 18% 44% 46% Working toward independence 52% 50% 72% 62% Sources of Income Employment 50% 39% 39% 62% SSI 38% 39% 61% 23% More than 2 friends 85% 53% 83% 62%
Source: Tenant Periodic Surveys and Exit Forms
Discussion and Summary
This evaluation is a product of a tremendous effort to collect and report accurate data by and about the experience of tenants living in supportive housing sites. This effort is critical for purposes of program improvement, policy development and increased understanding of how and why supportive housing is able to meet the needs of formerly homeless persons with complex needs. This final report on the evaluation of the Program provided descriptions and focused on three aspects: 1) analysis of tenants’ healthcare service utilization and related costs prior to and following tenancy, 2) tenants’ status and outcomes in terms of service needs, health status, functioning and satisfaction over time, and 3) tenants who have left the housing. Seven major findings highlight the results of this evaluation. First, the Program serves the intended population. As intended, a very large proportion of the tenants have a history of residential instability including being homeless or at risk of homelessness, having moved a great deal and doubling up with others. Smaller, but material proportions of the tenants have significant disabilities, including mental illness, substance abuse or serious physical disabilities that meet the eligibility criteria for the Program.
________________________________________________________________________Page 32 Chapter I Connecticut Supportive Housing Demonstration Program
A very important finding revealed positive outcomes. Tenants functioned at high levels, were able to develop goals and direction for themselves, progressed toward greater independence, and were satisfied with most aspects of the Program. While tenants expressed awareness of and concerns about social isolation, overall, the finding suggest that being in the housing is beneficial for the people it is designed to serve. The third major finding is that, as a group, the tenants decreased their utilization of acute and expensive health services, mostly medical inpatient services. The decrease in use of medical inpatient was true for most subgroups. Fourth, there was an increase in tenants’ utilization of necessary on-going health care and support. Utilization increased in services, such as home healthcare and outpatient substance abuse treatment services, that enabled tenants to remain in the community, rather than be hospitalized The fifth finding relates to an increased efficiency in the utilization of healthcare resources by a larger number of people. The average cost of healthcare service utilization decreased for inpatient services and increased for home healthcare and outpatient substance abuse treatment. The number of service users tended to increase (with the exception of inpatient). Comparisons of the tenant subgroups identified the S+C tenants as a most disabled group with the most troubled history. The small number of S+C users of specific services made some comparisons difficult. Overall, however, some utilization (e.g., of home healthcare) was higher for this group. Finally, over the course of four and a half years, approximately 39% of the tenants exited the housing and over a third (36%) of those who departed left under negative circumstances. The number of negative exits represents 36% of all exits, but only 14% of all who entered the housing. Even this small proportion is a matter of concern, because, as reported above, staying in the housing is related to substantive improvements in a variety of areas. Negative exits seemed to be associated with substance abuse, some aspects of functioning, not working toward goals in life, unemployment and social isolation. These findings, however, must be replicated and/or studied further to allow sound inferences. Overall, the findings were consistent with expectations. They also support the importance of evaluation and documentation of the impacts of programs and interventions. Clearly, supportive housing presents both opportunities and challenges to policy makers, service providers and tenants. Supportive housing offers affordable housing, linkage to needed services, and is a desirable alternative to high-risk situations. It creates a better social environment, is financially sound and is likely to advance public health. The greatest challenges for the housing managers and service providers involve the need to reduce evictions, as well as continued documentation of the value added by supportive housing. Reducing negative exits might require better understanding of the determinants of dropouts and use of such knowledge to improve programs. Documentation of the value of supportive housing is essential for policy development and continued funding.
________________________________________________________________________Connecticut Supportive Housing Demonstration Program Chapter I Page 33
Glossary Inpatient services Medical inpatient services are those provided by general hospitals and medical clinics in state institutions. Substance abuse inpatient services are those covered by Medicaid and provided by either a state institution or at an alcohol/drug abuse center. Outpatient services Psychiatric outpatient services are those covered by Medicaid and provided by a general hospital on an outpatient basis, those covered by a state institution on an outpatient basis or through a state institution’s mental health clinic, a community mental health clinic, or by a psychologist. Substance abuse outpatient services are those covered by Medicaid and provided by a state institution through their alcohol/drug rehabilitation center on an outpatient basis, through the alcohol/drug rehabilitation center, and through the community clinic’s methadone maintenance. Medical outpatient services are those services that are provided on an outpatient basis through general hospitals, state institutions, medical clinics and through community clinics at their dialysis centers, ambulatory surgical center, family planning center, and the rural clinics. Dental services are those services provided by dentists in private and group practices, and by community clinics at their dental clinics. Home health cares are those services provided by the Connecticut Home Health Care Program or those services performed by the Connecticut Home Health Care Performing Providers. Medical supplies are furnished by an approved medical supply company and include both medical and surgical supplies, durable medical goods and orthopedic and prosthetic devices. Pharmacy includes Medicaid-covered prescription drugs, psychotropic as well as other drugs. Physician services includes Medicaid-covered services performed by all medical doctors, including those in general practice (private or group) and specialists, in such fields as cardiology, internal medicine, neurology, orthopedics, and family practice. Other health care providers include nurse practitioners, personal care assistants, podiatrists, ________________________________________________________________________Page 34 Chapter I Connecticut Supportive Housing Demonstration Program
optometrists, opticians, chiropractors, and therapists. Independent laboratory and radiology services include services provided by independent laboratories and radiology services. Medical transport services include Medicaid covered services such as transport by ambulance, taxi, livery, and invalid coach.
________________________________________________________________________Connecticut Supportive Housing Demonstration Program Chapter I Page 35
References
Blankertz, Laura E; Cnaan, Ram A; Freedman, Erica. Childhood risk factors in dually
diagnosed homeless adults. Social Work. Vol 38(5), Sep 1993, 587-596.
Claus, Ronald E; Mannen, R. Kelley; Schicht, William W. Treatment career snapshots:
Profiles of first treatment and previous treatment clients. Addictive Behaviors. Vol
24(4), Jul-Aug 1999, 471-479.
Culhane, Dennis P; Averyt, June M; Hadley, Trevor R. Prevalence of treated behavioral
disorders among adult shelter users: A longitudinal study. American Journal of
Orthopsychiatry. Vol 68(1), Jan 1998, 63-72.
Culhane, Dennis P; Averyt, June M; Hadley, Trevor R. The rate of public shelter admission
among Medicaid-reimbursed users of behavioral health services. Psychiatric Services.
Vol 48(3), Mar 1997, 390-392.
Dixon, Lisa; Weiden, Peter; Torres, Michael; Lehman, Anthony. Assertive community
treatment and medication compliance in the homeless mentally ill. American Journal
of Psychiatry. Vol 154(9), Sep 1997, 1302-1304.
Hadley, T.R, McGurrin, M.C., Pulice, R.T. et al; Using fiscal data to identify heavy service
users. Psychiatric Quarterly , Vol 61, 1990, 41-48.
Hadley, T.R., Culhane, D.P., and McGurrin, M.C. Identifying and tracking heavy users of
acute psychiatric inpatient services. Administration and Policy in Mental Health Vol
19, 1992, 279-290.
Herman, Daniel B; Susser, Ezra S; Struening, Elmer L. Childhood out-of-home care and
current depressive symptoms among homeless adults. American Journal of Public
Health. Vol 84(11), Nov 1994, 1849-1851.
Kamis-Gould E; Snyder F; Hadley T. R: Casey T. Impact of closing a state psychiatric
hospital. Psychiatric Services. Vol 50(10), 1999, 1297-1302.
Rosenheck, Robert; Lam, Julie A. Homeless mentally ill clients' and providers' perceptions
of service needs and clients' use of services. Psychiatric Services. Vol 48(3), Mar 1997,
381-386.
Sumerlin, John R. Cognitive-affective preparation for homelessness: Quantitative and
qualitative analysis of childhood out-of-home placement and child abuse in a sample
of homeless men. Psychological Reports. Vol 85(2), Oct 1999, 553-573. ________________________________________________________________________Page 36 Chapter I Connecticut Supportive Housing Demonstration Program
Zlotnick, Cheryl; Robertson, Marjorie J; Wright, Marguerite A. The impact of childhood
foster care and other out-of-home placement on homeless women and their children.
Child Abuse & Neglect. Vol 23(11), Nov 1999, 1057-1068.
________________________________________________________________________Connecticut Supportive Housing Demonstration Program Chapter I Page 37
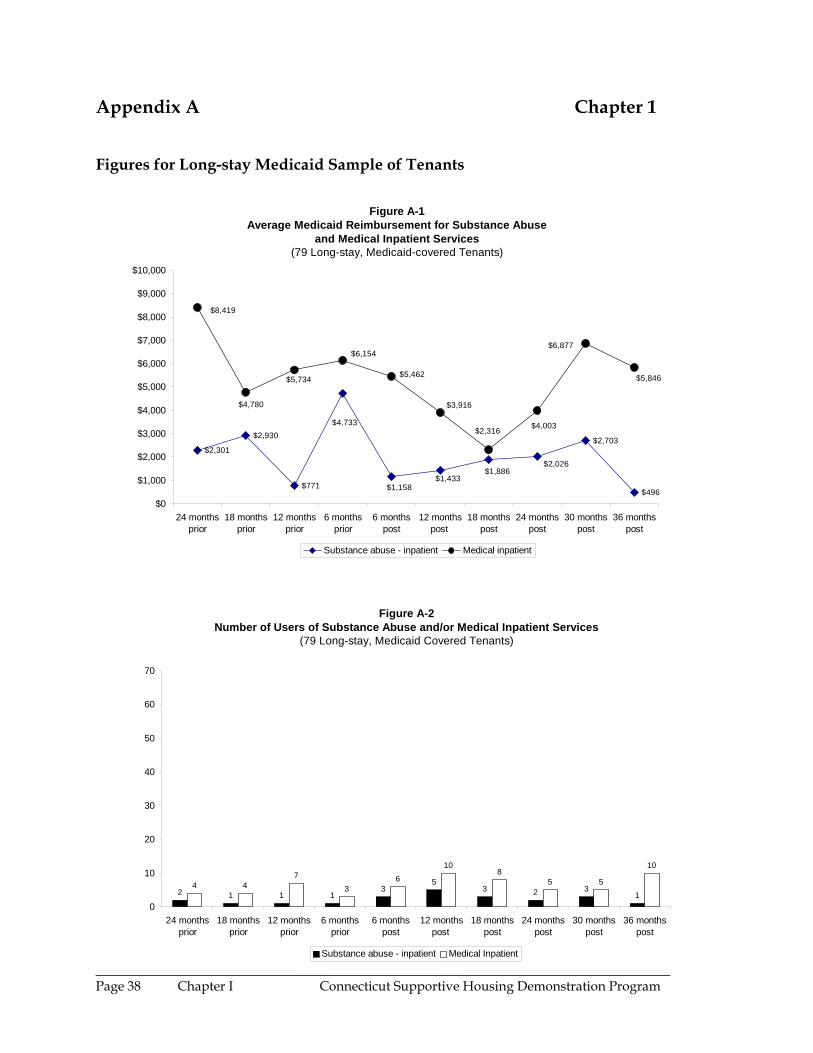
Appendix A Chapter 1
Figures for Long-stay Medicaid Sample of Tenants
Figure A-1Average Medicaid Reimbursement for Substance Abuse
and Medical Inpatient Services(79 Long-stay, Medicaid-covered Tenants)
$2,301
$2,930
$771
$2,703
$496
$2,026$1,886
$1,433$1,158
$4,733
$6,154
$5,462
$2,316
$3,916
$5,846
$6,877
$4,003
$4,780
$5,734
$8,419
$0
$1,000
$2,000
$3,000
$4,000
$5,000
$6,000
$7,000
$8,000
$9,000
$10,000
24 monthsprior
18 monthsprior
12 monthsprior
6 monthsprior
6 monthspost
12 monthspost
18 monthspost
24 monthspost
30 monthspost
36 monthspost
Substance abuse - inpatient Medical inpatient
________________________________________________________________________
Figure A-2Number of Users of Substance Abuse and/or Medical Inpatient Services
(79 Long-stay, Medicaid Covered Tenants)
2 1 1 13
53 2 3
14 4
73
610
85 5
10
0
10
20
30
40
50
60
70
24 monthsprior
18 monthsprior
12 monthsprior
6 monthsprior
6 monthspost
12 monthspost
18 monthspost
24 monthspost
30 monthspost
36 monthspost
Substance abuse - inpatient Medical Inpatient
Page 38 Chapter I Connecticut Supportive Housing Demonstration Program
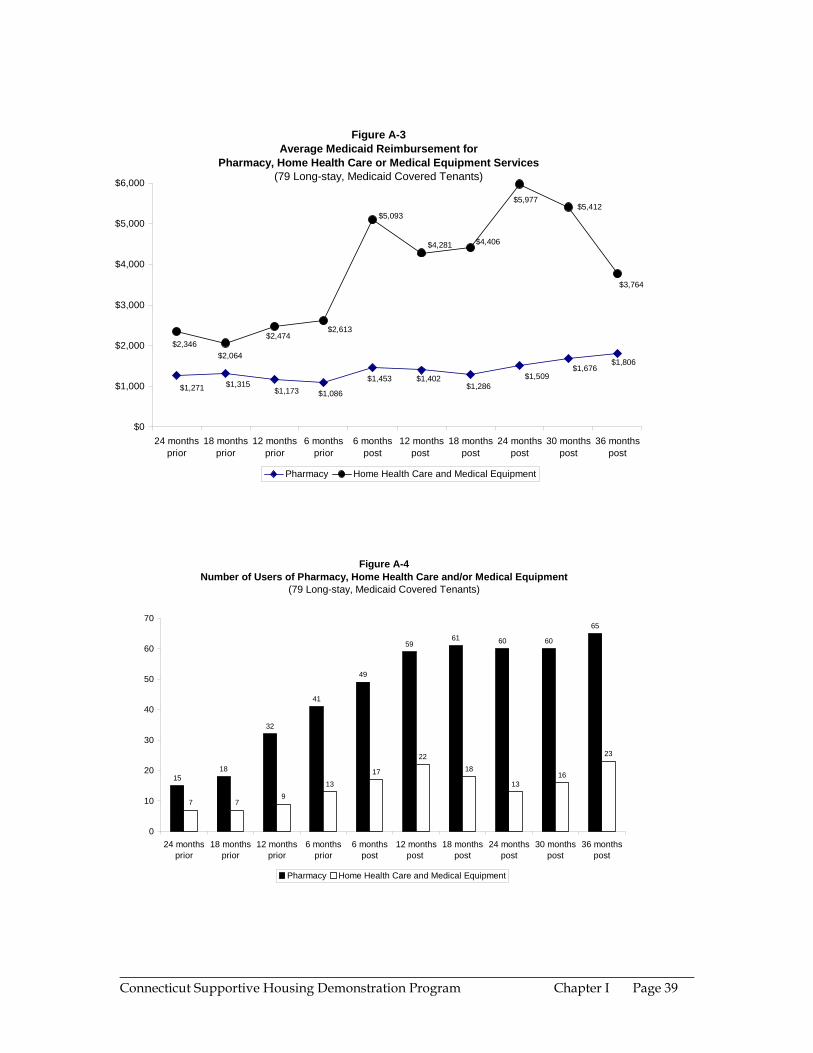
Figure A-3Average Medicaid Reimbursement for
Pharmacy, Home Health Care or Medical Equipment Services(79 Long-stay, Medicaid Covered Tenants)
$1,806$1,676
$1,509
$1,173$1,315$1,271 $1,286
$1,402$1,453
$1,086
$2,613
$5,093
$4,406$4,281
$3,764
$5,412$5,977
$2,064
$2,474$2,346
$0
$1,000
$2,000
$3,000
$4,000
$5,000
$6,000
24 monthsprior
18 monthsprior
12 monthsprior
6 monthsprior
6 monthspost
12 monthspost
18 monthspost
24 monthspost
30 monthspost
36 monthspost
Pharmacy Home Health Care and Medical Equipment
Figure A-4Number of Users of Pharmacy, Home Health Care and/or Medical Equipment
(79 Long-stay, Medicaid Covered Tenants)
1518
32
41
49
5961 60 60
65
7 79
1317
2218
1316
23
0
10
20
30
40
50
60
70
24 monthsprior
18 monthsprior
12 monthsprior
6 monthsprior
6 monthspost
12 monthspost
18 monthspost
24 monthspost
30 monthspost
36 monthspost
Pharmacy Home Health Care and Medical Equipment
________________________________________________________________________Connecticut Supportive Housing Demonstration Program Chapter I Page 39
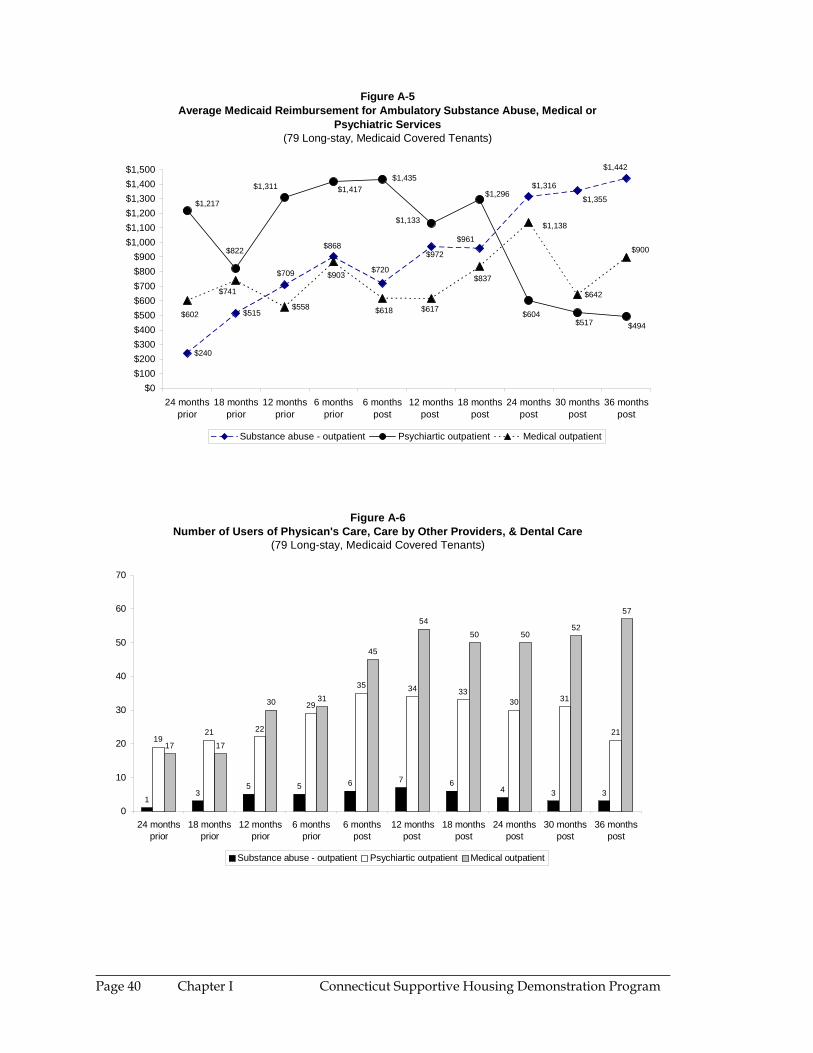
Figure A-5Average Medicaid Reimbursement for Ambulatory Substance Abuse, Medical or
Psychiatric Services(79 Long-stay, Medicaid Covered Tenants)
$240
$515$558
$642
$709
$1,442
$1,355
$1,316
$961
$972
$720$903
$1,417$1,435
$1,296
$1,133
$494$517$604
$822
$1,311
$1,217
$741
$1,138
$837
$617$618
$868
$602
$900
$0$100$200$300$400$500$600$700$800$900
$1,000$1,100$1,200$1,300$1,400$1,500
24 monthsprior
18 monthsprior
12 monthsprior
6 monthsprior
6 monthspost
12 monthspost
18 monthspost
24 monthspost
30 monthspost
36 monthspost
Substance abuse - outpatient Psychiartic outpatient Medical outpatient
Figure A-6Number of Users of Physican's Care, Care by Other Providers, & Dental Care
(79 Long-stay, Medicaid Covered Tenants)
13
5 5 6 7 64 3 3
1921 22
29
35 34 3330 31
2117 17
30 31
45
5450 50
52
57
0
10
20
30
40
50
60
70
24 monthsprior
18 monthsprior
12 monthsprior
6 monthsprior
6 monthspost
12 monthspost
18 monthspost
24 monthspost
30 monthspost
36 monthspost
Substance abuse - outpatient Psychiartic outpatient Medical outpatient
________________________________________________________________________Page 40 Chapter I Connecticut Supportive Housing Demonstration Program
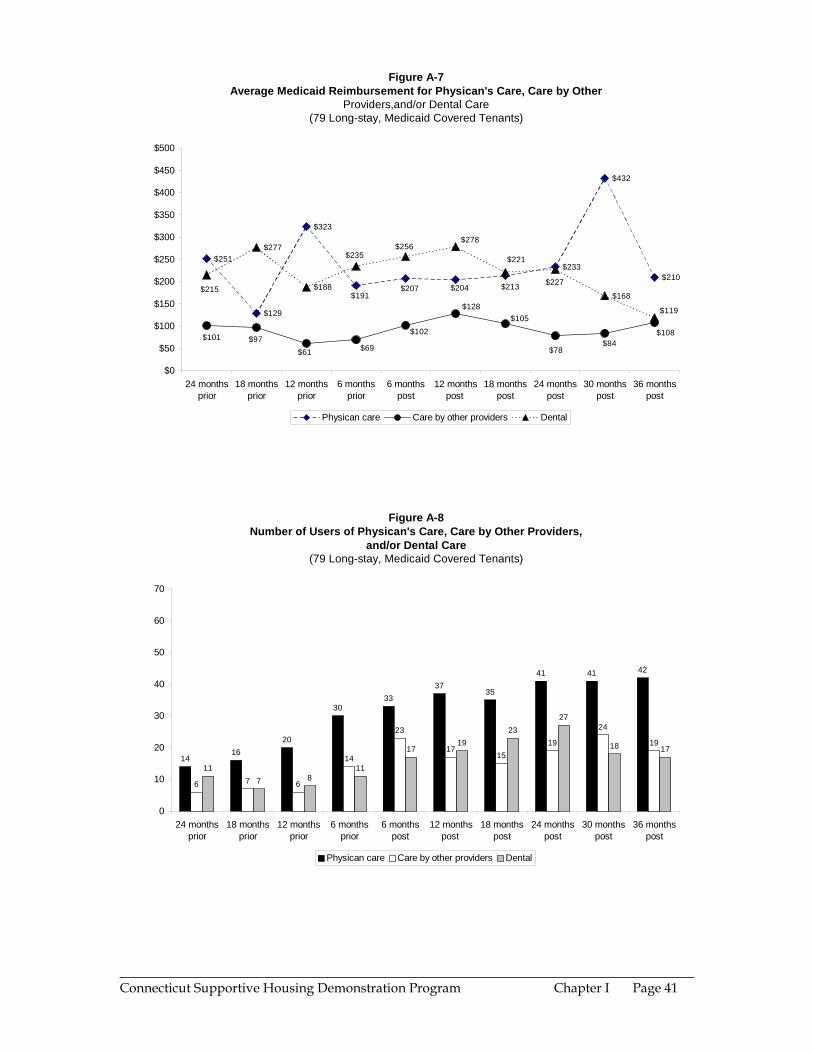
Figure A-7Average Medicaid Reimbursement for Physican's Care, Care by Other
Providers,and/or Dental Care(79 Long-stay, Medicaid Covered Tenants)
$251
$129
$323
$233
$432
$210
$277
$188$168$191
$207 $204 $213
$101
$61$97
$78$84
$108
$128$105
$102
$69
$119
$215
$235$256
$278
$221
$227
$0
$50
$100
$150
$200
$250
$300
$350
$400
$450
$500
24 monthsprior
18 monthsprior
12 monthsprior
6 monthsprior
6 monthspost
12 monthspost
18 monthspost
24 monthspost
30 monthspost
36 monthspost
Physican care Care by other providers Dental
Figure A-8Number of Users of Physican's Care, Care by Other Providers,
and/or Dental Care (79 Long-stay, Medicaid Covered Tenants)
1416
20
3033
3735
41 41 42
6 7 6
14
23
1715
19
24
19
117 8
11
1719
2327
18 17
0
10
20
30
40
50
60
70
24 monthsprior
18 monthsprior
12 monthsprior
6 monthsprior
6 monthspost
12 monthspost
18 monthspost
24 monthspost
30 monthspost
36 monthspost
Physican care Care by other providers Dental
________________________________________________________________________Connecticut Supportive Housing Demonstration Program Chapter I Page 41
CHAPTER II PROJECT FINANCIAL STABILITY Arthur Andersen LLP The objective of Chapter II was to evaluate the financial stability of the individual projects in the Connecticut Supportive Housing Demonstration Program. In order to achieve this objective, Arthur Andersen LLP developed and defined methodologies that measure financial stability. The methodologies were utilized in all three evaluations of the Program, which were conducted in 1999, 2000 and 2001/2002. The financial data that was the basis for the 1999 evaluation was for four of the projects (Liberty Commons, Hudson View Commons, Crescent Apartments, and Colony Apartments) from calendar year 1998, whereas the evaluations in 2000 and 2001/2002 included financial data from calendar years 1999 and 2000 (respectively) for all nine projects. In contrast to the first two evaluations, the data used to complete the following analyses were derived from year-end 2000 audited financial statements and supporting documentation, as opposed to fourth quarter unaudited year-end cash flow reports, submitted by property management to the Department of Economic and Community Development (DECD) or the Connecticut Housing Finance Authority (CHFA); interviews with property management and project sponsors; the original project projections prepared by underwriters at the National Equity Fund; the 2001 budgets submitted by property management to DECD or CHFA; and data compiled by UPENN. The supporting documentation to the year-end 2000 audited financial statements include notes to those financial statements, project balance sheets, and operating reserve data. The Occupancy and Turnover Rates for Each Project Occupancy Rates Occupancy Rates measure how efficiently a unit or project is used during the year. To calculate annual project occupancy, the Total Potential Rental Days and Actual Rental Days first must be determined. Once those variables are determined, the Occupancy Rate can be calculated. The formula for determining Occupancy Rates is as follows:
Total Potential Rental Days = The number of units available multiplied by 365 days (or a lesser number of days if the project was not operating for a full calendar year). Actual Rental Days = Total Potential Rental Days minus Days a unit is vacant. Occupancy Rate = Actual Rental Days divided by Total Potential Rental Days.
_____________________________________________________________________________________ Connecticut Supportive Housing Demonstration Program Chapter II Page 1
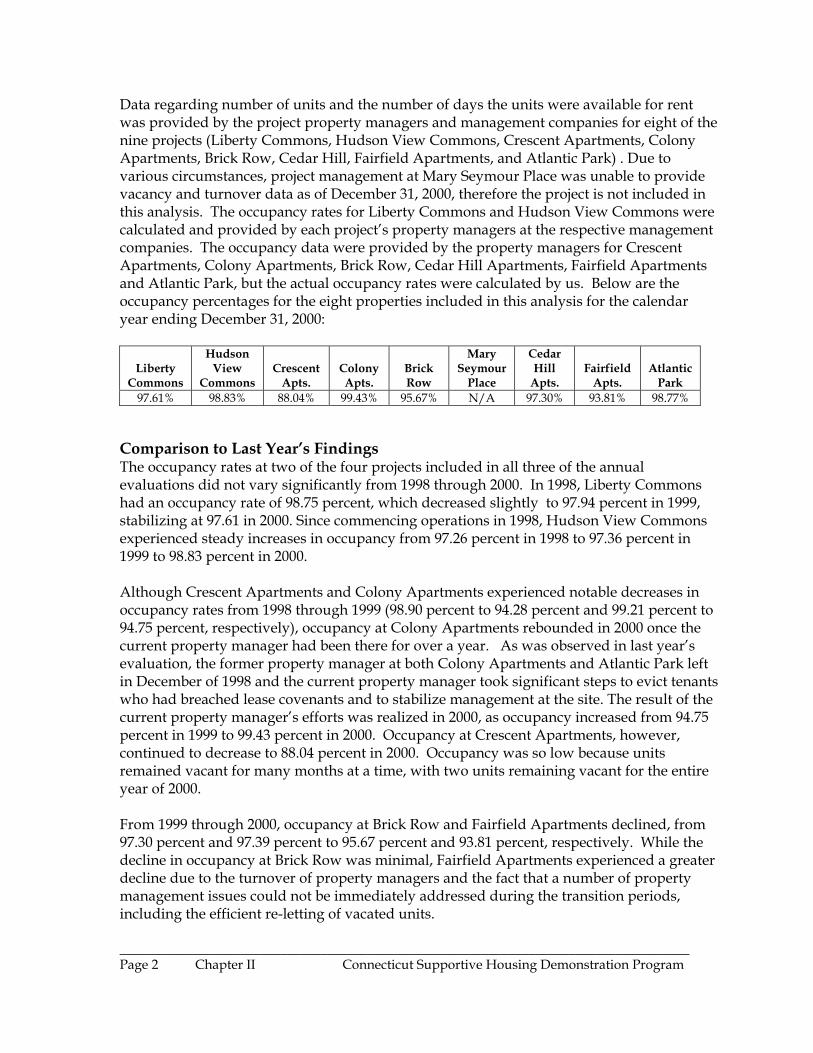
Data regarding number of units and the number of days the units were available for rent was provided by the project property managers and management companies for eight of the nine projects (Liberty Commons, Hudson View Commons, Crescent Apartments, Colony Apartments, Brick Row, Cedar Hill, Fairfield Apartments, and Atlantic Park) . Due to various circumstances, project management at Mary Seymour Place was unable to provide vacancy and turnover data as of December 31, 2000, therefore the project is not included in this analysis. The occupancy rates for Liberty Commons and Hudson View Commons were calculated and provided by each project’s property managers at the respective management companies. The occupancy data were provided by the property managers for Crescent Apartments, Colony Apartments, Brick Row, Cedar Hill Apartments, Fairfield Apartments and Atlantic Park, but the actual occupancy rates were calculated by us. Below are the occupancy percentages for the eight properties included in this analysis for the calendar year ending December 31, 2000:
Liberty
Commons
Hudson View
Commons
Crescent
Apts.
Colony Apts.
Brick Row
Mary Seymour
Place
Cedar Hill
Apts.
Fairfield
Apts.
Atlantic
Park 97.61% 98.83% 88.04% 99.43% 95.67% N/A 97.30% 93.81% 98.77%
Comparison to Last Year’s Findings The occupancy rates at two of the four projects included in all three of the annual evaluations did not vary significantly from 1998 through 2000. In 1998, Liberty Commons had an occupancy rate of 98.75 percent, which decreased slightly to 97.94 percent in 1999, stabilizing at 97.61 in 2000. Since commencing operations in 1998, Hudson View Commons experienced steady increases in occupancy from 97.26 percent in 1998 to 97.36 percent in 1999 to 98.83 percent in 2000. Although Crescent Apartments and Colony Apartments experienced notable decreases in occupancy rates from 1998 through 1999 (98.90 percent to 94.28 percent and 99.21 percent to 94.75 percent, respectively), occupancy at Colony Apartments rebounded in 2000 once the current property manager had been there for over a year. As was observed in last year’s evaluation, the former property manager at both Colony Apartments and Atlantic Park left in December of 1998 and the current property manager took significant steps to evict tenants who had breached lease covenants and to stabilize management at the site. The result of the current property manager’s efforts was realized in 2000, as occupancy increased from 94.75 percent in 1999 to 99.43 percent in 2000. Occupancy at Crescent Apartments, however, continued to decrease to 88.04 percent in 2000. Occupancy was so low because units remained vacant for many months at a time, with two units remaining vacant for the entire year of 2000. From 1999 through 2000, occupancy at Brick Row and Fairfield Apartments declined, from 97.30 percent and 97.39 percent to 95.67 percent and 93.81 percent, respectively. While the decline in occupancy at Brick Row was minimal, Fairfield Apartments experienced a greater decline due to the turnover of property managers and the fact that a number of property management issues could not be immediately addressed during the transition periods, including the efficient re-letting of vacated units.
_____________________________________________________________________________________ Page 2 Chapter II Connecticut Supportive Housing Demonstration Program
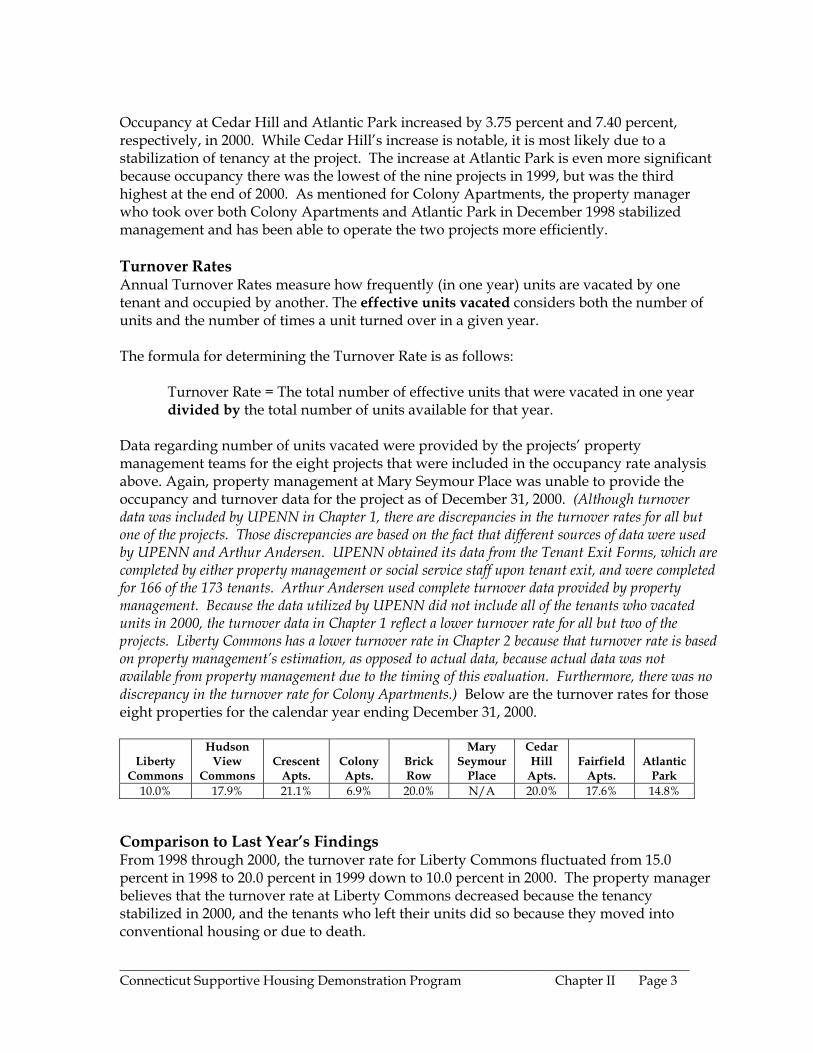
Occupancy at Cedar Hill and Atlantic Park increased by 3.75 percent and 7.40 percent, respectively, in 2000. While Cedar Hill’s increase is notable, it is most likely due to a stabilization of tenancy at the project. The increase at Atlantic Park is even more significant because occupancy there was the lowest of the nine projects in 1999, but was the third highest at the end of 2000. As mentioned for Colony Apartments, the property manager who took over both Colony Apartments and Atlantic Park in December 1998 stabilized management and has been able to operate the two projects more efficiently. Turnover Rates Annual Turnover Rates measure how frequently (in one year) units are vacated by one tenant and occupied by another. The effective units vacated considers both the number of units and the number of times a unit turned over in a given year. The formula for determining the Turnover Rate is as follows:
Turnover Rate = The total number of effective units that were vacated in one year divided by the total number of units available for that year.
Data regarding number of units vacated were provided by the projects’ property management teams for the eight projects that were included in the occupancy rate analysis above. Again, property management at Mary Seymour Place was unable to provide the occupancy and turnover data for the project as of December 31, 2000. (Although turnover data was included by UPENN in Chapter 1, there are discrepancies in the turnover rates for all but one of the projects. Those discrepancies are based on the fact that different sources of data were used by UPENN and Arthur Andersen. UPENN obtained its data from the Tenant Exit Forms, which are completed by either property management or social service staff upon tenant exit, and were completed for 166 of the 173 tenants. Arthur Andersen used complete turnover data provided by property management. Because the data utilized by UPENN did not include all of the tenants who vacated units in 2000, the turnover data in Chapter 1 reflect a lower turnover rate for all but two of the projects. Liberty Commons has a lower turnover rate in Chapter 2 because that turnover rate is based on property management’s estimation, as opposed to actual data, because actual data was not available from property management due to the timing of this evaluation. Furthermore, there was no discrepancy in the turnover rate for Colony Apartments.) Below are the turnover rates for those eight properties for the calendar year ending December 31, 2000.
Liberty
Commons
Hudson View
Commons
Crescent
Apts.
Colony Apts.
Brick Row
Mary Seymour
Place
Cedar Hill
Apts.
Fairfield
Apts.
Atlantic
Park 10.0% 17.9% 21.1% 6.9% 20.0% N/A 20.0% 17.6% 14.8%
Comparison to Last Year’s Findings From 1998 through 2000, the turnover rate for Liberty Commons fluctuated from 15.0 percent in 1998 to 20.0 percent in 1999 down to 10.0 percent in 2000. The property manager believes that the turnover rate at Liberty Commons decreased because the tenancy stabilized in 2000, and the tenants who left their units did so because they moved into conventional housing or due to death.
_____________________________________________________________________________________ Connecticut Supportive Housing Demonstration Program Chapter II Page 3
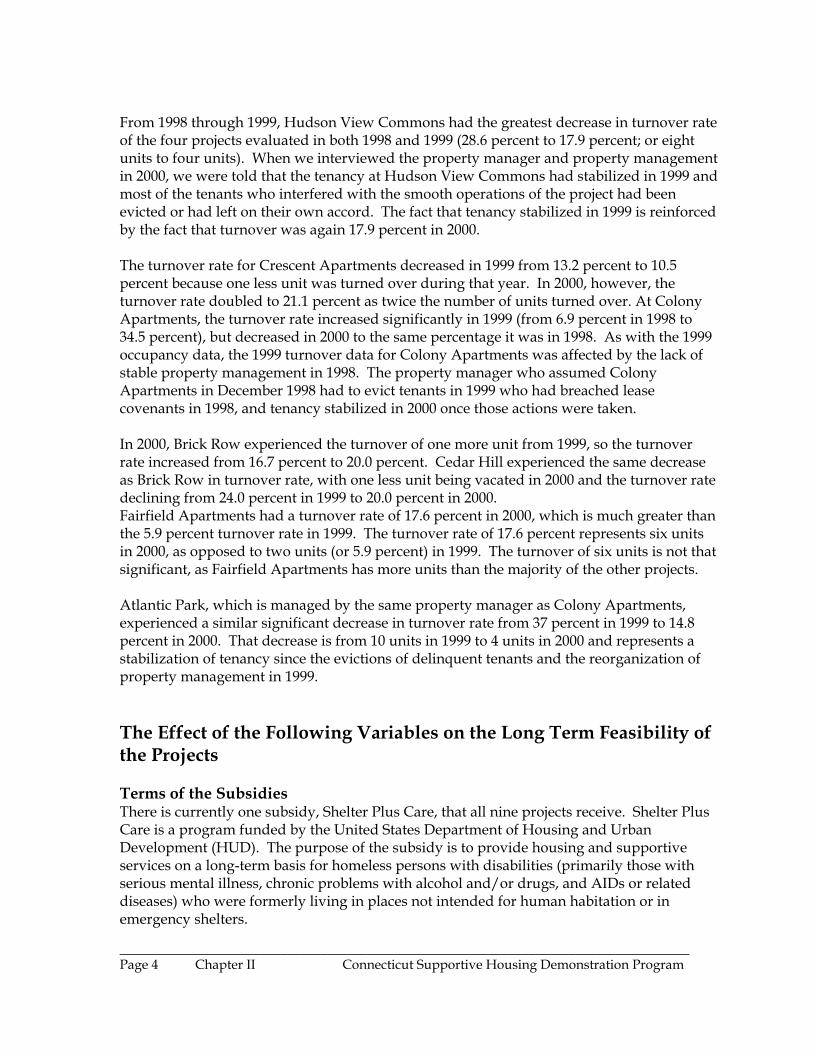
From 1998 through 1999, Hudson View Commons had the greatest decrease in turnover rate of the four projects evaluated in both 1998 and 1999 (28.6 percent to 17.9 percent; or eight units to four units). When we interviewed the property manager and property management in 2000, we were told that the tenancy at Hudson View Commons had stabilized in 1999 and most of the tenants who interfered with the smooth operations of the project had been evicted or had left on their own accord. The fact that tenancy stabilized in 1999 is reinforced by the fact that turnover was again 17.9 percent in 2000. The turnover rate for Crescent Apartments decreased in 1999 from 13.2 percent to 10.5 percent because one less unit was turned over during that year. In 2000, however, the turnover rate doubled to 21.1 percent as twice the number of units turned over. At Colony Apartments, the turnover rate increased significantly in 1999 (from 6.9 percent in 1998 to 34.5 percent), but decreased in 2000 to the same percentage it was in 1998. As with the 1999 occupancy data, the 1999 turnover data for Colony Apartments was affected by the lack of stable property management in 1998. The property manager who assumed Colony Apartments in December 1998 had to evict tenants in 1999 who had breached lease covenants in 1998, and tenancy stabilized in 2000 once those actions were taken. In 2000, Brick Row experienced the turnover of one more unit from 1999, so the turnover rate increased from 16.7 percent to 20.0 percent. Cedar Hill experienced the same decrease as Brick Row in turnover rate, with one less unit being vacated in 2000 and the turnover rate declining from 24.0 percent in 1999 to 20.0 percent in 2000. Fairfield Apartments had a turnover rate of 17.6 percent in 2000, which is much greater than the 5.9 percent turnover rate in 1999. The turnover rate of 17.6 percent represents six units in 2000, as opposed to two units (or 5.9 percent) in 1999. The turnover of six units is not that significant, as Fairfield Apartments has more units than the majority of the other projects. Atlantic Park, which is managed by the same property manager as Colony Apartments, experienced a similar significant decrease in turnover rate from 37 percent in 1999 to 14.8 percent in 2000. That decrease is from 10 units in 1999 to 4 units in 2000 and represents a stabilization of tenancy since the evictions of delinquent tenants and the reorganization of property management in 1999. The Effect of the Following Variables on the Long Term Feasibility of the Projects Terms of the Subsidies There is currently one subsidy, Shelter Plus Care, that all nine projects receive. Shelter Plus Care is a program funded by the United States Department of Housing and Urban Development (HUD). The purpose of the subsidy is to provide housing and supportive services on a long-term basis for homeless persons with disabilities (primarily those with serious mental illness, chronic problems with alcohol and/or drugs, and AIDs or related diseases) who were formerly living in places not intended for human habitation or in emergency shelters.
_____________________________________________________________________________________ Page 4 Chapter II Connecticut Supportive Housing Demonstration Program
All of the projects participating in the Demonstration Program receive the project-based rental assistance for a full five- or ten-year period. Projects that are new construction receive the five-year subsidy and projects that consist of rehabbed buildings receive the ten-year subsidy. The size of the subsidy is calculated by multiplying the number of units reserved for Shelter Plus Care tenants times the appropriate fair market rent (established by HUD) times the length of the subsidy period. The subsidy is provided to assist the projects with meeting their operating expenses. The amount of the subsidy is included in each project’s original projections as a source of rental income. The Shelter Plus Care program has been in existence for approximately five years and the first of such subsidy in Connecticut did not expire until 2001. According to a representative of the Hartford office of HUD, all projects with expiring grants have the option to apply for a renewal of the subsidy. In 2001, renewal grants for some of the first expiring subsidies in Connecticut were awarded. As opposed to the original grants that were awarded for five or ten-year periods, these renewal grants are for one-year periods because HUD cannot guarantee them for longer periods of time. HUD’s process of determining whether funds will be granted to an applicant is based on a rating system contained in §582.200(b) of volume 24 of the Code of Federal Regulations. When HUD reviews applications received from current grant-holders, the agency prioritizes those applications according to the rating system, while also seeking to determine whether the grantee seeking renewal is involved in the continuum of care in its geographic area. Furthermore, HUD also determines whether the grantee seeking renewal is doing well and whether it is doing what it stated it would do on its original grant application. If the grantee seeking renewal meets all of HUD’s rating criteria, then that application may be placed in priority order. Again, however, there is no guarantee that a renewal will be granted. Furthermore, when NEF prepared the projects’ forecast assumptions, it was not assumed that the Shelter Plus Care subsidy would be renewed by any of the projects. Should any of the Demonstration Program projects receive a renewal, then the extended term of the subsidy will have a positive effect on the long-term feasibility of the project(s) because NEF forecasted the projects to be sustainable for 15 years using the current sources of funding. The key terms of the Shelter Plus Care subsidy are as follows: Liberty
Commons Hudson
View Commons
Crescent Apts.
Colony Apts.
Brick Row
Mary Seymour
Place
Cedar Hill
Apts.
Fairfield Apts.
Atlantic Park
Number of Units Covered
20
12
19
14
13
15
13
17
13
Year of Expiration
2006
2006
2007
2002
2008
2003
2008
2003
2008
Future Capital Costs The original project projections were prepared by underwriters at the National Equity Fund (NEF) and include estimates for replacement reserves. In order to assess the impact of future capital costs on long-term feasibility, we have begun with the assumption that the
_____________________________________________________________________________________ Connecticut Supportive Housing Demonstration Program Chapter II Page 5
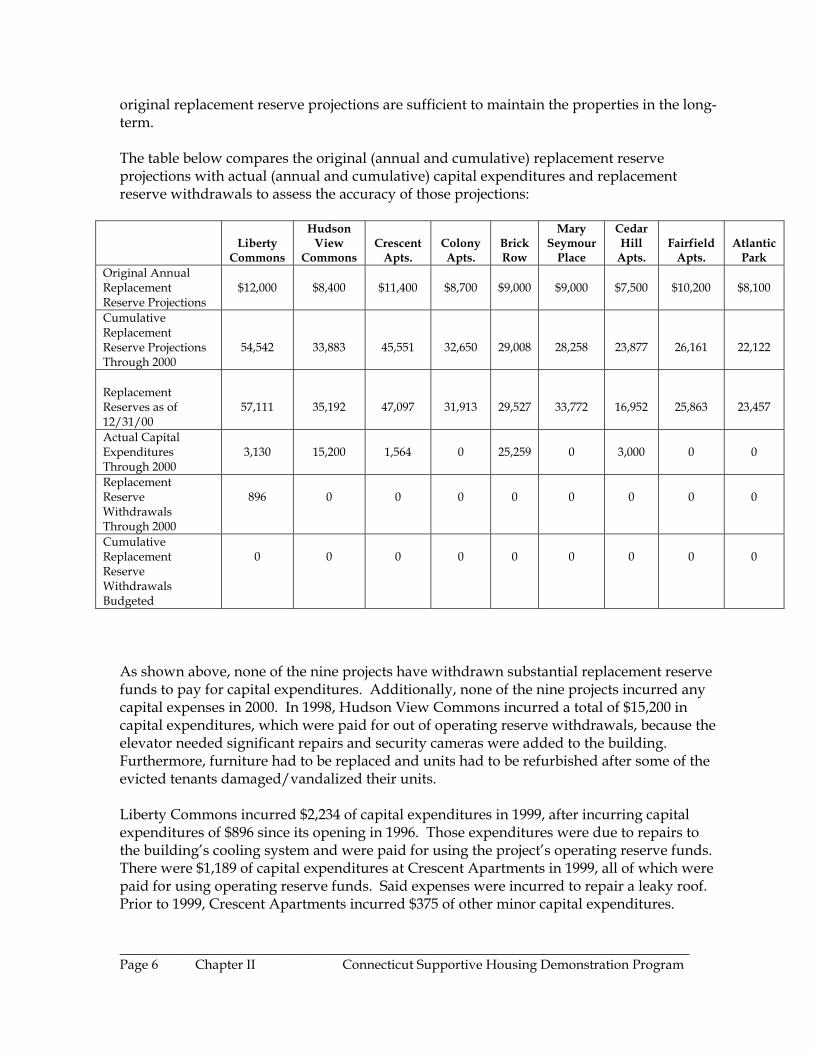
original replacement reserve projections are sufficient to maintain the properties in the long-term. The table below compares the original (annual and cumulative) replacement reserve projections with actual (annual and cumulative) capital expenditures and replacement reserve withdrawals to assess the accuracy of those projections:
Liberty
Commons
Hudson View
Commons
Crescent
Apts.
Colony Apts.
Brick Row
Mary Seymour
Place
Cedar Hill
Apts.
Fairfield
Apts.
Atlantic
Park Original Annual Replacement Reserve Projections
$12,000
$8,400
$11,400
$8,700
$9,000
$9,000
$7,500
$10,200
$8,100
Cumulative Replacement Reserve Projections Through 2000
54,542
33,883
45,551
32,650
29,008
28,258
23,877
26,161
22,122
Replacement Reserves as of 12/31/00
57,111
35,192
47,097
31,913
29,527
33,772
16,952
25,863
23,457
Actual Capital Expenditures Through 2000
3,130
15,200
1,564
0
25,259
0
3,000
0
0
Replacement Reserve Withdrawals Through 2000
896
0
0
0
0
0
0
0
0
Cumulative Replacement Reserve Withdrawals Budgeted
0
0
0
0
0
0
0
0
0
As shown above, none of the nine projects have withdrawn substantial replacement reserve funds to pay for capital expenditures. Additionally, none of the nine projects incurred any capital expenses in 2000. In 1998, Hudson View Commons incurred a total of $15,200 in capital expenditures, which were paid for out of operating reserve withdrawals, because the elevator needed significant repairs and security cameras were added to the building. Furthermore, furniture had to be replaced and units had to be refurbished after some of the evicted tenants damaged/vandalized their units. Liberty Commons incurred $2,234 of capital expenditures in 1999, after incurring capital expenditures of $896 since its opening in 1996. Those expenditures were due to repairs to the building’s cooling system and were paid for using the project’s operating reserve funds. There were $1,189 of capital expenditures at Crescent Apartments in 1999, all of which were paid for using operating reserve funds. Said expenses were incurred to repair a leaky roof. Prior to 1999, Crescent Apartments incurred $375 of other minor capital expenditures.
_____________________________________________________________________________________ Page 6 Chapter II Connecticut Supportive Housing Demonstration Program
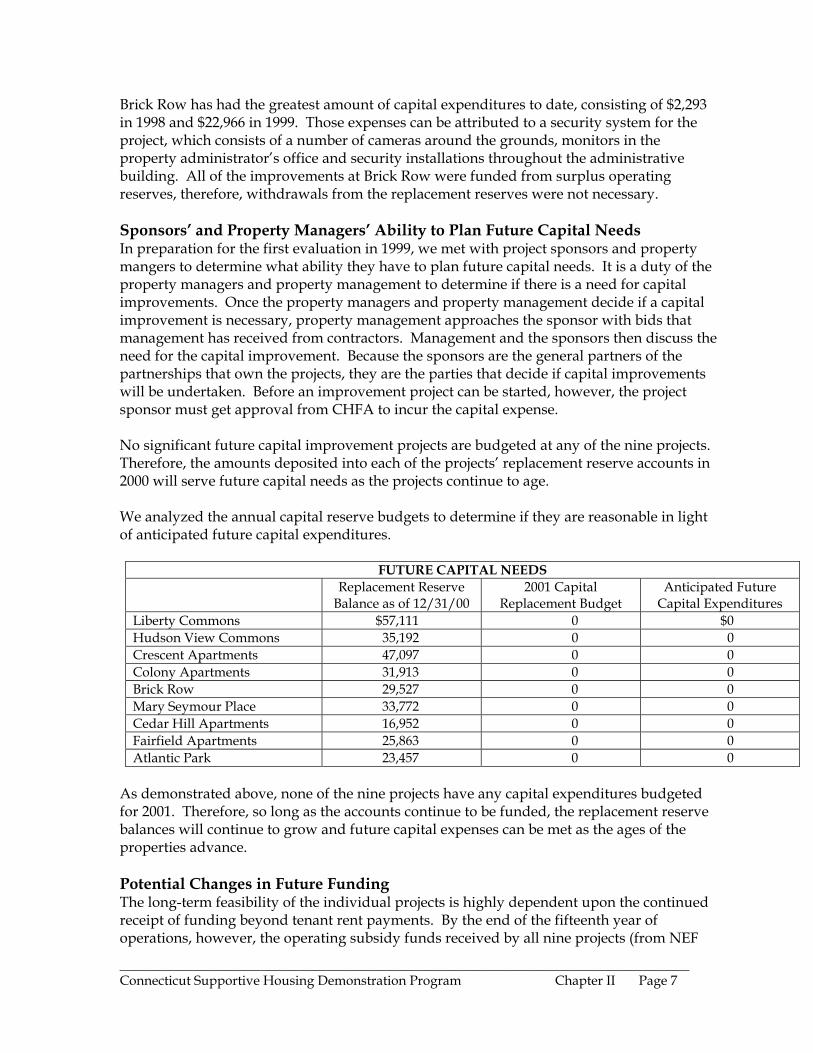
Brick Row has had the greatest amount of capital expenditures to date, consisting of $2,293 in 1998 and $22,966 in 1999. Those expenses can be attributed to a security system for the project, which consists of a number of cameras around the grounds, monitors in the property administrator’s office and security installations throughout the administrative building. All of the improvements at Brick Row were funded from surplus operating reserves, therefore, withdrawals from the replacement reserves were not necessary. Sponsors’ and Property Managers’ Ability to Plan Future Capital Needs In preparation for the first evaluation in 1999, we met with project sponsors and property mangers to determine what ability they have to plan future capital needs. It is a duty of the property managers and property management to determine if there is a need for capital improvements. Once the property managers and property management decide if a capital improvement is necessary, property management approaches the sponsor with bids that management has received from contractors. Management and the sponsors then discuss the need for the capital improvement. Because the sponsors are the general partners of the partnerships that own the projects, they are the parties that decide if capital improvements will be undertaken. Before an improvement project can be started, however, the project sponsor must get approval from CHFA to incur the capital expense. No significant future capital improvement projects are budgeted at any of the nine projects. Therefore, the amounts deposited into each of the projects’ replacement reserve accounts in 2000 will serve future capital needs as the projects continue to age. We analyzed the annual capital reserve budgets to determine if they are reasonable in light of anticipated future capital expenditures.
FUTURE CAPITAL NEEDS Replacement Reserve
Balance as of 12/31/00 2001 Capital
Replacement Budget Anticipated Future
Capital Expenditures Liberty Commons $57,111 0 $0 Hudson View Commons 35,192 0 0 Crescent Apartments 47,097 0 0 Colony Apartments 31,913 0 0 Brick Row 29,527 0 0 Mary Seymour Place 33,772 0 0 Cedar Hill Apartments 16,952 0 0 Fairfield Apartments 25,863 0 0 Atlantic Park 23,457 0 0
As demonstrated above, none of the nine projects have any capital expenditures budgeted for 2001. Therefore, so long as the accounts continue to be funded, the replacement reserve balances will continue to grow and future capital expenses can be met as the ages of the properties advance. Potential Changes in Future Funding The long-term feasibility of the individual projects is highly dependent upon the continued receipt of funding beyond tenant rent payments. By the end of the fifteenth year of operations, however, the operating subsidy funds received by all nine projects (from NEF
_____________________________________________________________________________________ Connecticut Supportive Housing Demonstration Program Chapter II Page 7
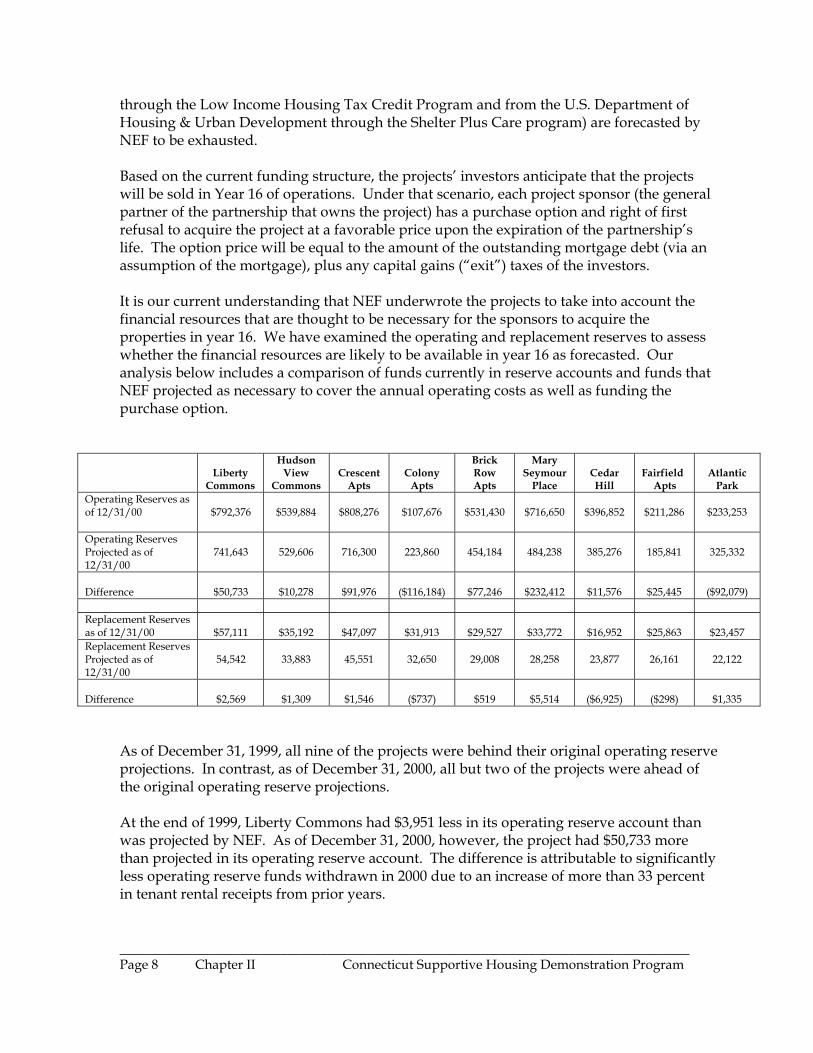
through the Low Income Housing Tax Credit Program and from the U.S. Department of Housing & Urban Development through the Shelter Plus Care program) are forecasted by NEF to be exhausted. Based on the current funding structure, the projects’ investors anticipate that the projects will be sold in Year 16 of operations. Under that scenario, each project sponsor (the general partner of the partnership that owns the project) has a purchase option and right of first refusal to acquire the project at a favorable price upon the expiration of the partnership’s life. The option price will be equal to the amount of the outstanding mortgage debt (via an assumption of the mortgage), plus any capital gains (“exit”) taxes of the investors. It is our current understanding that NEF underwrote the projects to take into account the financial resources that are thought to be necessary for the sponsors to acquire the properties in year 16. We have examined the operating and replacement reserves to assess whether the financial resources are likely to be available in year 16 as forecasted. Our analysis below includes a comparison of funds currently in reserve accounts and funds that NEF projected as necessary to cover the annual operating costs as well as funding the purchase option.
Liberty
Commons
Hudson View
Commons
Crescent
Apts
Colony
Apts
Brick Row Apts
Mary Seymour
Place
Cedar Hill
Fairfield
Apts
Atlantic
Park Operating Reserves as of 12/31/00
$792,376
$539,884
$808,276
$107,676
$531,430
$716,650
$396,852
$211,286
$233,253
Operating Reserves Projected as of 12/31/00
741,643
529,606
716,300
223,860
454,184
484,238
385,276
185,841
325,332
Difference
$50,733
$10,278
$91,976
($116,184)
$77,246
$232,412
$11,576
$25,445
($92,079)
Replacement Reserves as of 12/31/00
$57,111
$35,192
$47,097
$31,913
$29,527
$33,772
$16,952
$25,863
$23,457
Replacement Reserves Projected as of 12/31/00
54,542
33,883
45,551
32,650
29,008
28,258
23,877
26,161
22,122
Difference
$2,569
$1,309
$1,546
($737)
$519
$5,514
($6,925)
($298)
$1,335
As of December 31, 1999, all nine of the projects were behind their original operating reserve projections. In contrast, as of December 31, 2000, all but two of the projects were ahead of the original operating reserve projections. At the end of 1999, Liberty Commons had $3,951 less in its operating reserve account than was projected by NEF. As of December 31, 2000, however, the project had $50,733 more than projected in its operating reserve account. The difference is attributable to significantly less operating reserve funds withdrawn in 2000 due to an increase of more than 33 percent in tenant rental receipts from prior years.
_____________________________________________________________________________________ Page 8 Chapter II Connecticut Supportive Housing Demonstration Program
Hudson View Commons was $10,693 behind NEF’s operating reserve projection in 1999. As of December 31, 2000, however, the project was $10,278 ahead of its projection. As the difference in 1999 was likely due to the investment activity of the operating reserve account, 2000 was a favorable year for investments and the year-end result was a positive impact on the account. The operating reserves for Crescent Apartments were behind NEF’s projection at the end of 1999, but the project was $91,976 ahead of the projection by the end of 2000. The majority of the increase in operating reserves for Crescent Apartments may have been due to the 2000 deposits into the operating reserve account, which were 35 percent greater than the 1999 deposits. As of December 31, 1998, Colony Apartments had $8,733 more in its operating reserve account than was projected by NEF. The surplus reserves were depleted in 1999 and Colony Apartments was $92,946 short of NEF’s projection at the end of the year. Because funds for unanticipated expenses are scarce, and the need for enhanced and expensive security services are great, project management for Colony Apartments was forced to withdraw more funds from the operating reserves in 1999 than was originally anticipated because no additional funds for security were received. As of December 31, 2000, the project had $116,184 less in its operating reserve than was projected by NEF. Albeit this is an increased deficit over 1999’s $92,946 shortfall, Colony Apartments demonstrated a 63 percent increase in operating reserves for the same period and the addition of 2000’s shortfall is only 25 percent of 1999’s shortfall. Thus, while the project appears to have an increasing deficit between reserves and projections, it is evident there is positive recovery after withdrawals for security measures. Brick Row Apartments, Cedar Hill and Fairfield Apartments were behind operating reserves projections by no more than $9,000 as of December 31, 1999. All three projects were able to obtain operating reserves levels that were ahead of NEF projections by $11,576 to $77,246 as of December 31, 2000. Brick Row accomplished this level by significantly increasing 2000 deposits into its operating reserve account, as compared to 1999. The interest accumulated in Cedar Hill’s operating reserve account in 2000 was more than double that received in 1999 and there was also $12,687 of unrealized gain added to the project’s operating reserve account in 2000, which offset the $7,434 of unrealized loss recorded in the operating reserve account in 1999. Those additions to Cedar Hill’s operating reserve account provided for the surplus over NEF’s projection for the year 2000. Fairfield Apartments, however, accomplished the same result by decreasing withdrawals in 2000 and earning nearly triple the amount of interest in 2000 as earned in 1999. The operating reserves for Mary Seymour Place continued to outpace NEF projections in 2000. As of December 31, 1999, the project had $173,780 more in its operating reserve account than was projected by NEF. For the same period in 2000, the project had grown its operating reserves over projections by $232,412. The growth in this difference between NEF’s projection and the operating reserve funds is attributable to healthy deposits and interest recorded in the operating reserve account, coupled with small withdrawal amounts in 2000.
_____________________________________________________________________________________ Connecticut Supportive Housing Demonstration Program Chapter II Page 9
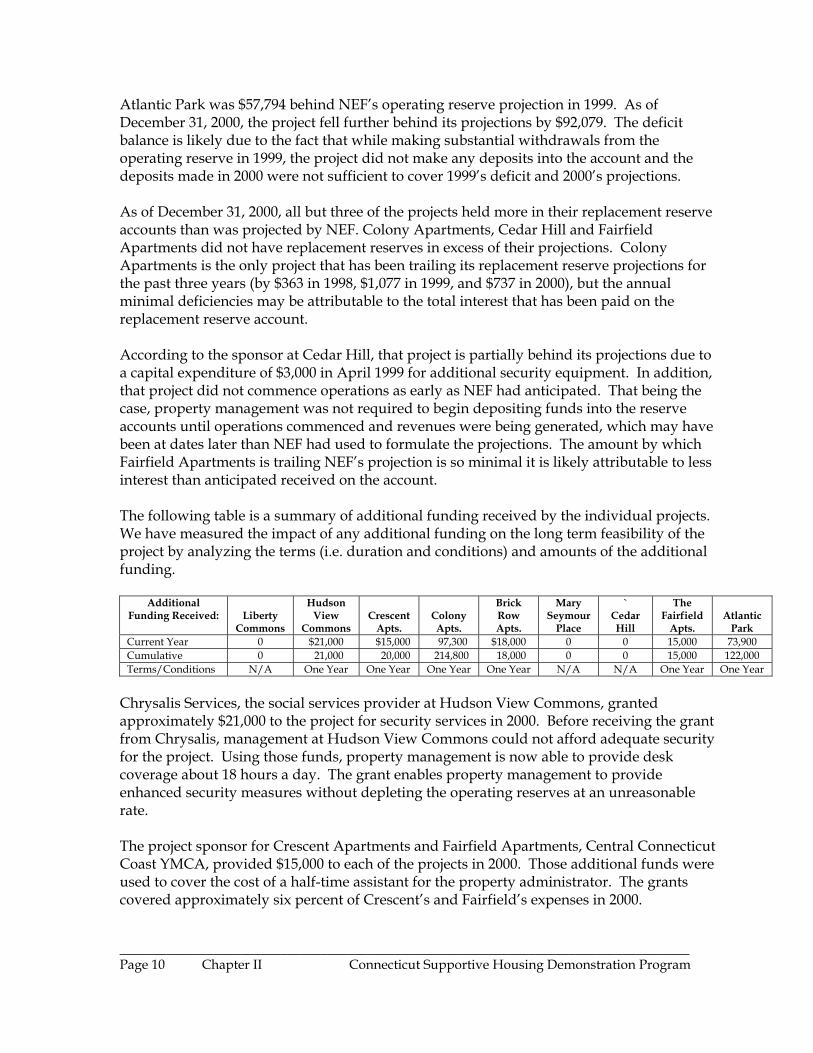
Atlantic Park was $57,794 behind NEF’s operating reserve projection in 1999. As of December 31, 2000, the project fell further behind its projections by $92,079. The deficit balance is likely due to the fact that while making substantial withdrawals from the operating reserve in 1999, the project did not make any deposits into the account and the deposits made in 2000 were not sufficient to cover 1999’s deficit and 2000’s projections. As of December 31, 2000, all but three of the projects held more in their replacement reserve accounts than was projected by NEF. Colony Apartments, Cedar Hill and Fairfield Apartments did not have replacement reserves in excess of their projections. Colony Apartments is the only project that has been trailing its replacement reserve projections for the past three years (by $363 in 1998, $1,077 in 1999, and $737 in 2000), but the annual minimal deficiencies may be attributable to the total interest that has been paid on the replacement reserve account. According to the sponsor at Cedar Hill, that project is partially behind its projections due to a capital expenditure of $3,000 in April 1999 for additional security equipment. In addition, that project did not commence operations as early as NEF had anticipated. That being the case, property management was not required to begin depositing funds into the reserve accounts until operations commenced and revenues were being generated, which may have been at dates later than NEF had used to formulate the projections. The amount by which Fairfield Apartments is trailing NEF’s projection is so minimal it is likely attributable to less interest than anticipated received on the account. The following table is a summary of additional funding received by the individual projects. We have measured the impact of any additional funding on the long term feasibility of the project by analyzing the terms (i.e. duration and conditions) and amounts of the additional funding.
Additional Funding Received:
Liberty
Commons
Hudson View
Commons
Crescent
Apts.
Colony Apts.
Brick Row Apts.
Mary Seymour
Place
` Cedar Hill
The Fairfield
Apts.
Atlantic
Park Current Year 0 $21,000 $15,000 97,300 $18,000 0 0 15,000 73,900 Cumulative 0 21,000 20,000 214,800 18,000 0 0 15,000 122,000 Terms/Conditions N/A One Year One Year One Year One Year N/A N/A One Year One Year
Chrysalis Services, the social services provider at Hudson View Commons, granted approximately $21,000 to the project for security services in 2000. Before receiving the grant from Chrysalis, management at Hudson View Commons could not afford adequate security for the project. Using those funds, property management is now able to provide desk coverage about 18 hours a day. The grant enables property management to provide enhanced security measures without depleting the operating reserves at an unreasonable rate. The project sponsor for Crescent Apartments and Fairfield Apartments, Central Connecticut Coast YMCA, provided $15,000 to each of the projects in 2000. Those additional funds were used to cover the cost of a half-time assistant for the property administrator. The grants covered approximately six percent of Crescent’s and Fairfield’s expenses in 2000.
_____________________________________________________________________________________ Page 10 Chapter II Connecticut Supportive Housing Demonstration Program
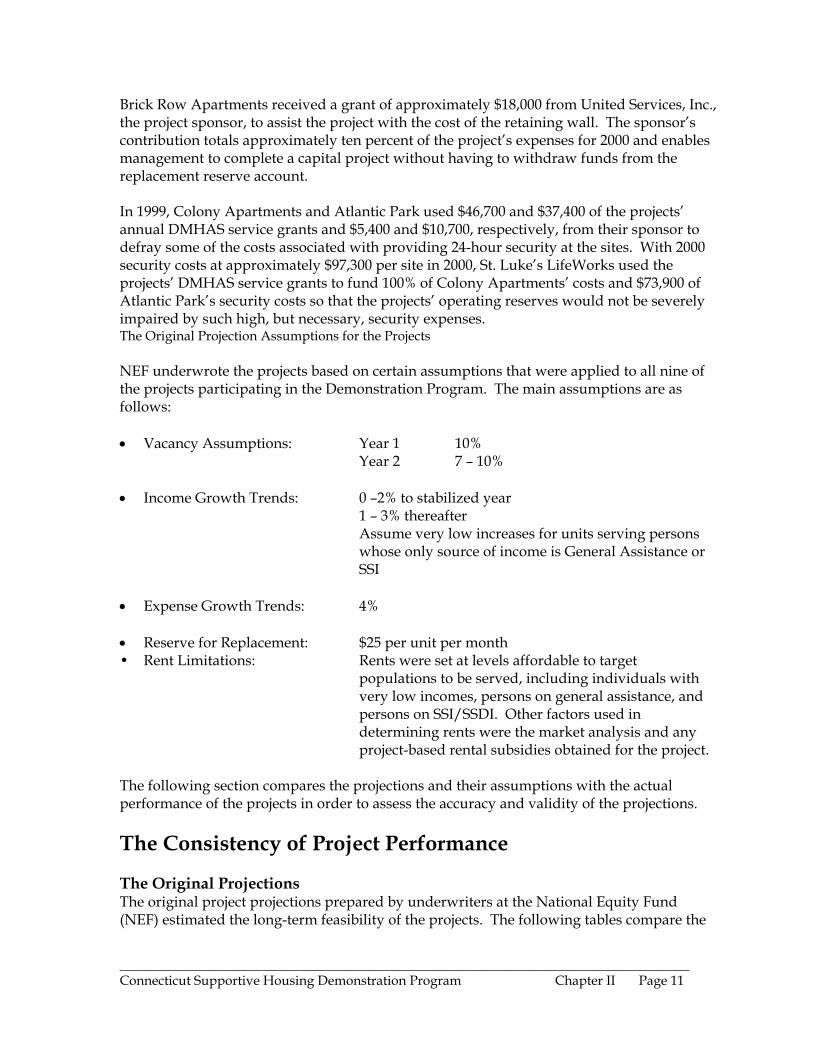
Brick Row Apartments received a grant of approximately $18,000 from United Services, Inc., the project sponsor, to assist the project with the cost of the retaining wall. The sponsor’s contribution totals approximately ten percent of the project’s expenses for 2000 and enables management to complete a capital project without having to withdraw funds from the replacement reserve account. In 1999, Colony Apartments and Atlantic Park used $46,700 and $37,400 of the projects’ annual DMHAS service grants and $5,400 and $10,700, respectively, from their sponsor to defray some of the costs associated with providing 24-hour security at the sites. With 2000 security costs at approximately $97,300 per site in 2000, St. Luke’s LifeWorks used the projects’ DMHAS service grants to fund 100% of Colony Apartments’ costs and $73,900 of Atlantic Park’s security costs so that the projects’ operating reserves would not be severely impaired by such high, but necessary, security expenses. The Original Projection Assumptions for the Projects NEF underwrote the projects based on certain assumptions that were applied to all nine of the projects participating in the Demonstration Program. The main assumptions are as follows: • Vacancy Assumptions: Year 1 10%
Year 2 7 – 10%
• Income Growth Trends: 0 –2% to stabilized year 1 – 3% thereafter Assume very low increases for units serving persons whose only source of income is General Assistance or SSI
• Expense Growth Trends: 4% • Reserve for Replacement: $25 per unit per month • Rent Limitations: Rents were set at levels affordable to target
populations to be served, including individuals with very low incomes, persons on general assistance, and persons on SSI/SSDI. Other factors used in determining rents were the market analysis and any project-based rental subsidies obtained for the project.
The following section compares the projections and their assumptions with the actual performance of the projects in order to assess the accuracy and validity of the projections. The Consistency of Project Performance The Original Projections The original project projections prepared by underwriters at the National Equity Fund (NEF) estimated the long-term feasibility of the projects. The following tables compare the
_____________________________________________________________________________________ Connecticut Supportive Housing Demonstration Program Chapter II Page 11
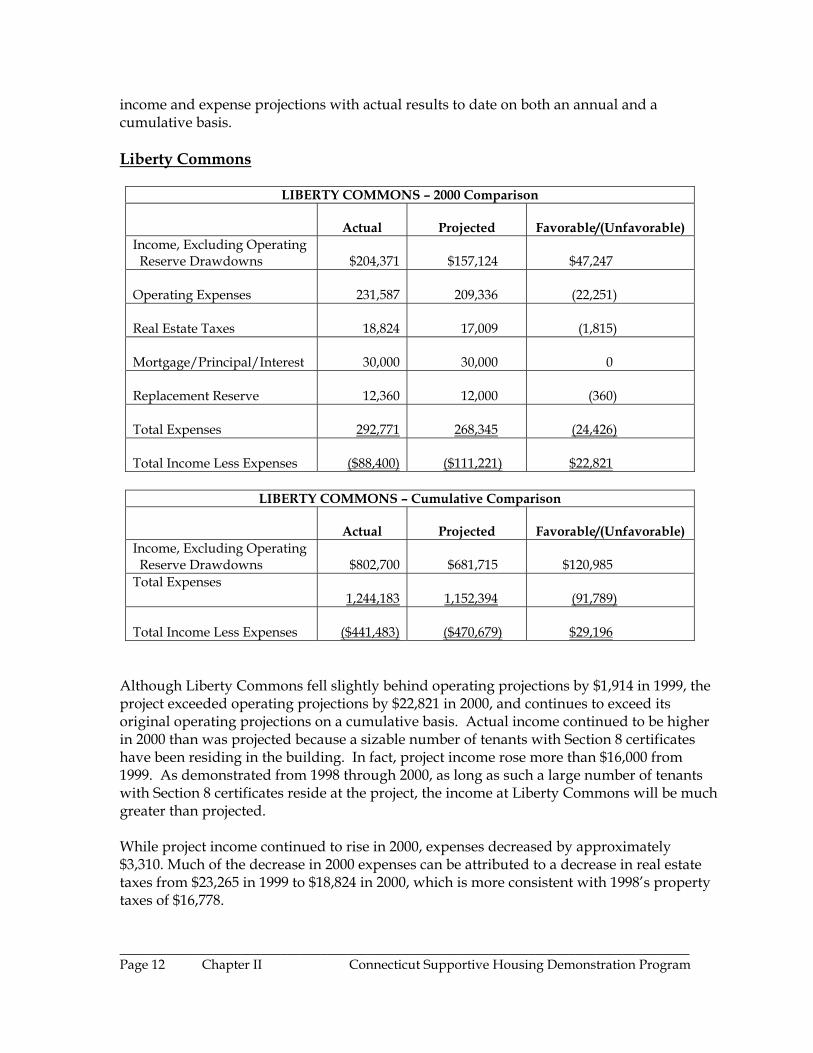
income and expense projections with actual results to date on both an annual and a cumulative basis. Liberty Commons
LIBERTY COMMONS – 2000 Comparison
Actual
Projected
Favorable/(Unfavorable) Income, Excluding Operating Reserve Drawdowns
$204,371
$157,124
$47,247
Operating Expenses
231,587
209,336
(22,251)
Real Estate Taxes
18,824
17,009
(1,815)
Mortgage/Principal/Interest
30,000
30,000
0
Replacement Reserve
12,360
12,000
(360)
Total Expenses
292,771
268,345
(24,426)
Total Income Less Expenses
($88,400)
($111,221)
$22,821
LIBERTY COMMONS – Cumulative Comparison
Actual
Projected
Favorable/(Unfavorable)
Income, Excluding Operating Reserve Drawdowns
$802,700
$681,715
$120,985
Total Expenses 1,244,183
1,152,394
(91,789)
Total Income Less Expenses
($441,483)
($470,679)
$29,196
Although Liberty Commons fell slightly behind operating projections by $1,914 in 1999, the project exceeded operating projections by $22,821 in 2000, and continues to exceed its original operating projections on a cumulative basis. Actual income continued to be higher in 2000 than was projected because a sizable number of tenants with Section 8 certificates have been residing in the building. In fact, project income rose more than $16,000 from 1999. As demonstrated from 1998 through 2000, as long as such a large number of tenants with Section 8 certificates reside at the project, the income at Liberty Commons will be much greater than projected. While project income continued to rise in 2000, expenses decreased by approximately $3,310. Much of the decrease in 2000 expenses can be attributed to a decrease in real estate taxes from $23,265 in 1999 to $18,824 in 2000, which is more consistent with 1998’s property taxes of $16,778.
_____________________________________________________________________________________ Page 12 Chapter II Connecticut Supportive Housing Demonstration Program
Hudson View Commons
HUDSON VIEW COMMONS – 2000 Comparison
Actual
Projected
Favorable/(Unfavorable) Income, Excluding Operating Reserve Drawdowns
$128,975
$106,556
$22,419
Operating Expenses
136,717
114,875
(21,842)
Real Estate Taxes
15,601
38,134
22,533
Mortgage/Principal/Interest
21,000
21,000
0
Replacement Reserve
8,400
8,400
0
Total Expenses
181,718)
182,409
701
Total Income Less Expenses
($52,743)
($75,853)
$23,110
HUDSON VIEW COMMONS – Cumulative Comparison
Actual
Projected
Favorable/(Unfavorable)
Income, Excluding Operating Reserve Drawdowns
$443,192
$409,887
$33,305
Total Expenses 670,836
705,930
35,094
Total Income Less Expenses
($227,644)
($296,043)
$68,399
As of December 31, 2000, Hudson View Commons exceeded its original cumulative operating projections by $68,399. Although in 1999 the project was behind its original annual projections by $10,469, the project exceeded 2000’s projections by $23,110. Revenues at Hudson View Commons increased in 2000 by approximately $29,500, after a $35,800 decrease from 1998 to 1999, and a $55,000 increase from 1997 to 1998. While revenues increased by $29,500 in 2000, expenses actually decreased by approximately $1,700 (from $183,403 to $181,718). Although income has fluctuated between increases and decreases from year to year, cumulative income has exceeded NEF’s projections. Furthermore, actual expenses, while greater for certain line items than projected, are cumulatively less than projected.
_____________________________________________________________________________________ Connecticut Supportive Housing Demonstration Program Chapter II Page 13
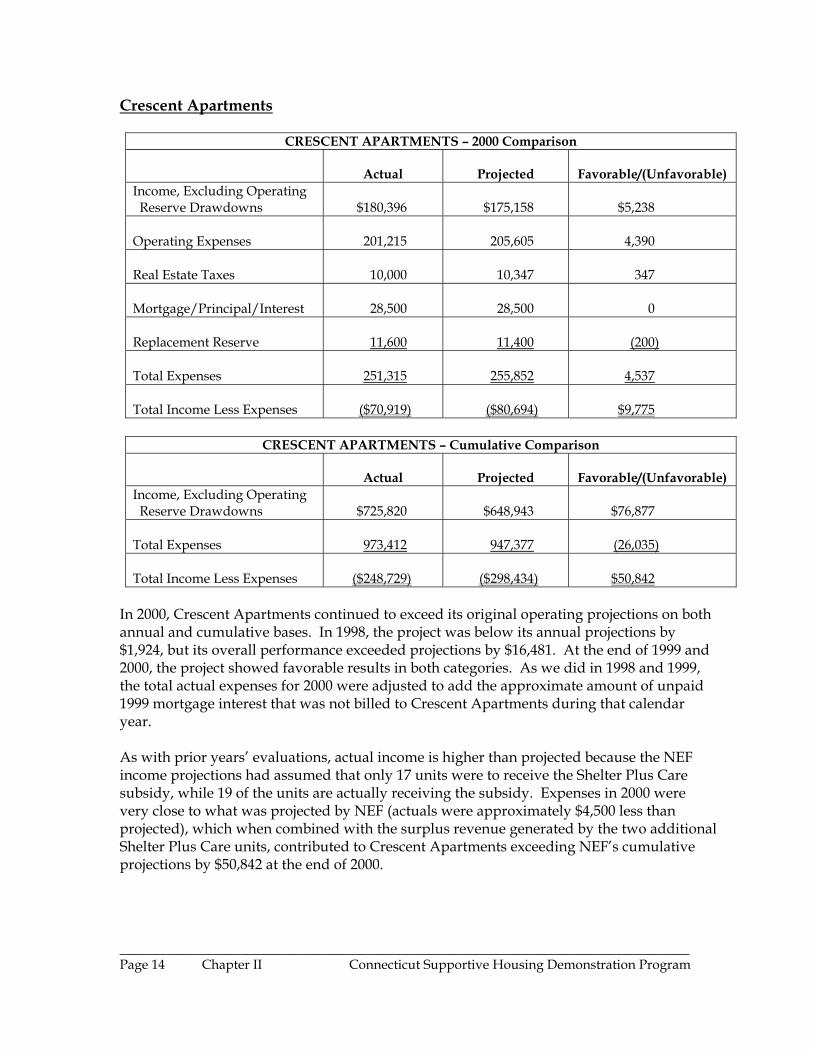
Crescent Apartments
CRESCENT APARTMENTS – 2000 Comparison
Actual
Projected
Favorable/(Unfavorable) Income, Excluding Operating Reserve Drawdowns
$180,396
$175,158
$5,238
Operating Expenses
201,215
205,605
4,390
Real Estate Taxes
10,000
10,347
347
Mortgage/Principal/Interest
28,500
28,500
0
Replacement Reserve
11,600
11,400
(200)
Total Expenses
251,315
255,852
4,537
Total Income Less Expenses
($70,919)
($80,694)
$9,775
CRESCENT APARTMENTS – Cumulative Comparison
Actual
Projected
Favorable/(Unfavorable)
Income, Excluding Operating Reserve Drawdowns
$725,820
$648,943
$76,877
Total Expenses
973,412
947,377
(26,035)
Total Income Less Expenses
($248,729)
($298,434)
$50,842
In 2000, Crescent Apartments continued to exceed its original operating projections on both annual and cumulative bases. In 1998, the project was below its annual projections by $1,924, but its overall performance exceeded projections by $16,481. At the end of 1999 and 2000, the project showed favorable results in both categories. As we did in 1998 and 1999, the total actual expenses for 2000 were adjusted to add the approximate amount of unpaid 1999 mortgage interest that was not billed to Crescent Apartments during that calendar year. As with prior years’ evaluations, actual income is higher than projected because the NEF income projections had assumed that only 17 units were to receive the Shelter Plus Care subsidy, while 19 of the units are actually receiving the subsidy. Expenses in 2000 were very close to what was projected by NEF (actuals were approximately $4,500 less than projected), which when combined with the surplus revenue generated by the two additional Shelter Plus Care units, contributed to Crescent Apartments exceeding NEF’s cumulative projections by $50,842 at the end of 2000.
_____________________________________________________________________________________ Page 14 Chapter II Connecticut Supportive Housing Demonstration Program
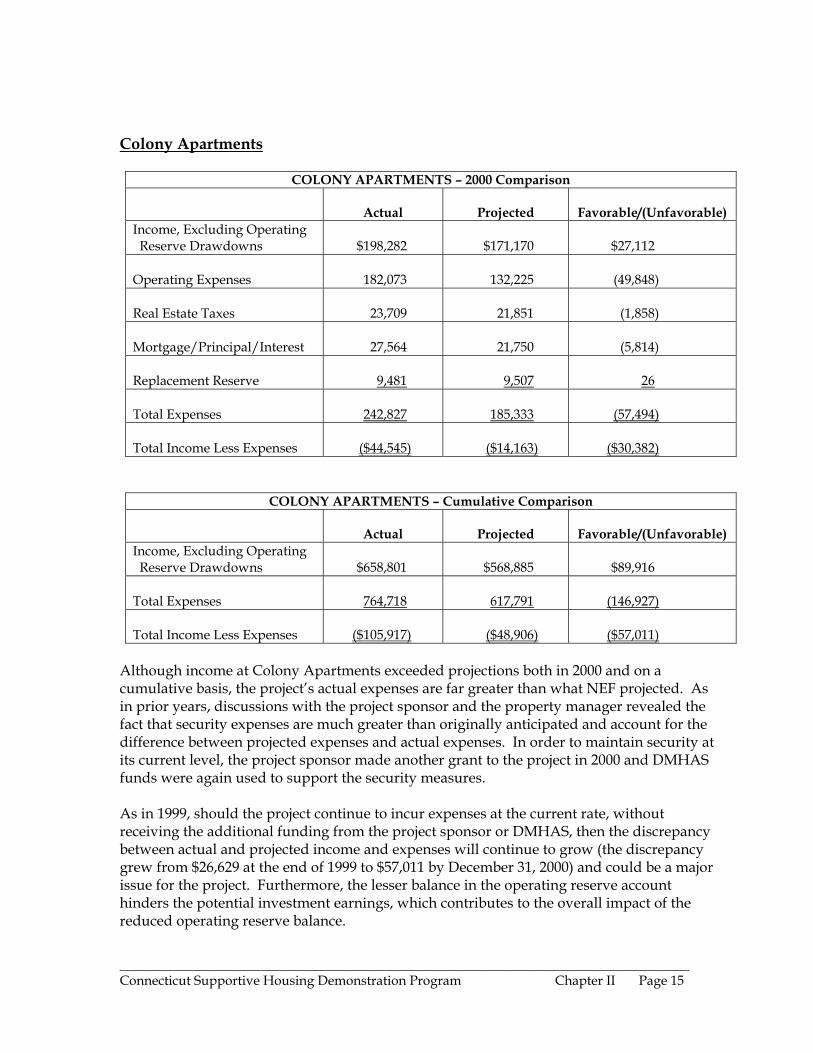
Colony Apartments
COLONY APARTMENTS – 2000 Comparison
Actual
Projected
Favorable/(Unfavorable) Income, Excluding Operating Reserve Drawdowns
$198,282
$171,170
$27,112
Operating Expenses
182,073
132,225
(49,848)
Real Estate Taxes
23,709
21,851
(1,858)
Mortgage/Principal/Interest
27,564
21,750
(5,814)
Replacement Reserve
9,481
9,507
26
Total Expenses
242,827
185,333
(57,494)
Total Income Less Expenses
($44,545)
($14,163)
($30,382)
COLONY APARTMENTS – Cumulative Comparison
Actual
Projected
Favorable/(Unfavorable) Income, Excluding Operating Reserve Drawdowns
$658,801
$568,885
$89,916
Total Expenses
764,718
617,791
(146,927)
Total Income Less Expenses
($105,917)
($48,906)
($57,011)
Although income at Colony Apartments exceeded projections both in 2000 and on a cumulative basis, the project’s actual expenses are far greater than what NEF projected. As in prior years, discussions with the project sponsor and the property manager revealed the fact that security expenses are much greater than originally anticipated and account for the difference between projected expenses and actual expenses. In order to maintain security at its current level, the project sponsor made another grant to the project in 2000 and DMHAS funds were again used to support the security measures. As in 1999, should the project continue to incur expenses at the current rate, without receiving the additional funding from the project sponsor or DMHAS, then the discrepancy between actual and projected income and expenses will continue to grow (the discrepancy grew from $26,629 at the end of 1999 to $57,011 by December 31, 2000) and could be a major issue for the project. Furthermore, the lesser balance in the operating reserve account hinders the potential investment earnings, which contributes to the overall impact of the reduced operating reserve balance.
_____________________________________________________________________________________ Connecticut Supportive Housing Demonstration Program Chapter II Page 15
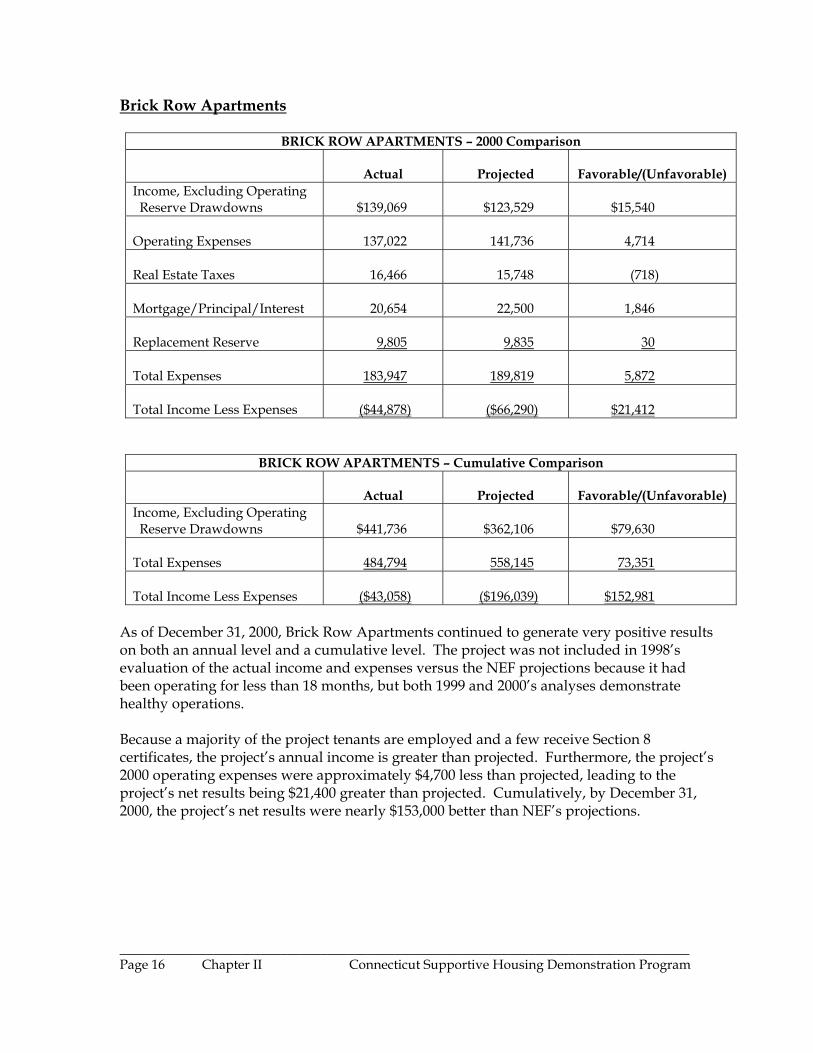
Brick Row Apartments
BRICK ROW APARTMENTS – 2000 Comparison
Actual
Projected
Favorable/(Unfavorable) Income, Excluding Operating Reserve Drawdowns
$139,069
$123,529
$15,540
Operating Expenses
137,022
141,736
4,714
Real Estate Taxes
16,466
15,748
(718)
Mortgage/Principal/Interest
20,654
22,500
1,846
Replacement Reserve
9,805
9,835
30
Total Expenses
183,947
189,819
5,872
Total Income Less Expenses
($44,878)
($66,290)
$21,412
BRICK ROW APARTMENTS – Cumulative Comparison
Actual
Projected
Favorable/(Unfavorable) Income, Excluding Operating Reserve Drawdowns
$441,736
$362,106
$79,630
Total Expenses
484,794
558,145
73,351
Total Income Less Expenses
($43,058)
($196,039)
$152,981
As of December 31, 2000, Brick Row Apartments continued to generate very positive results on both an annual level and a cumulative level. The project was not included in 1998’s evaluation of the actual income and expenses versus the NEF projections because it had been operating for less than 18 months, but both 1999 and 2000’s analyses demonstrate healthy operations. Because a majority of the project tenants are employed and a few receive Section 8 certificates, the project’s annual income is greater than projected. Furthermore, the project’s 2000 operating expenses were approximately $4,700 less than projected, leading to the project’s net results being $21,400 greater than projected. Cumulatively, by December 31, 2000, the project’s net results were nearly $153,000 better than NEF’s projections.
_____________________________________________________________________________________ Page 16 Chapter II Connecticut Supportive Housing Demonstration Program
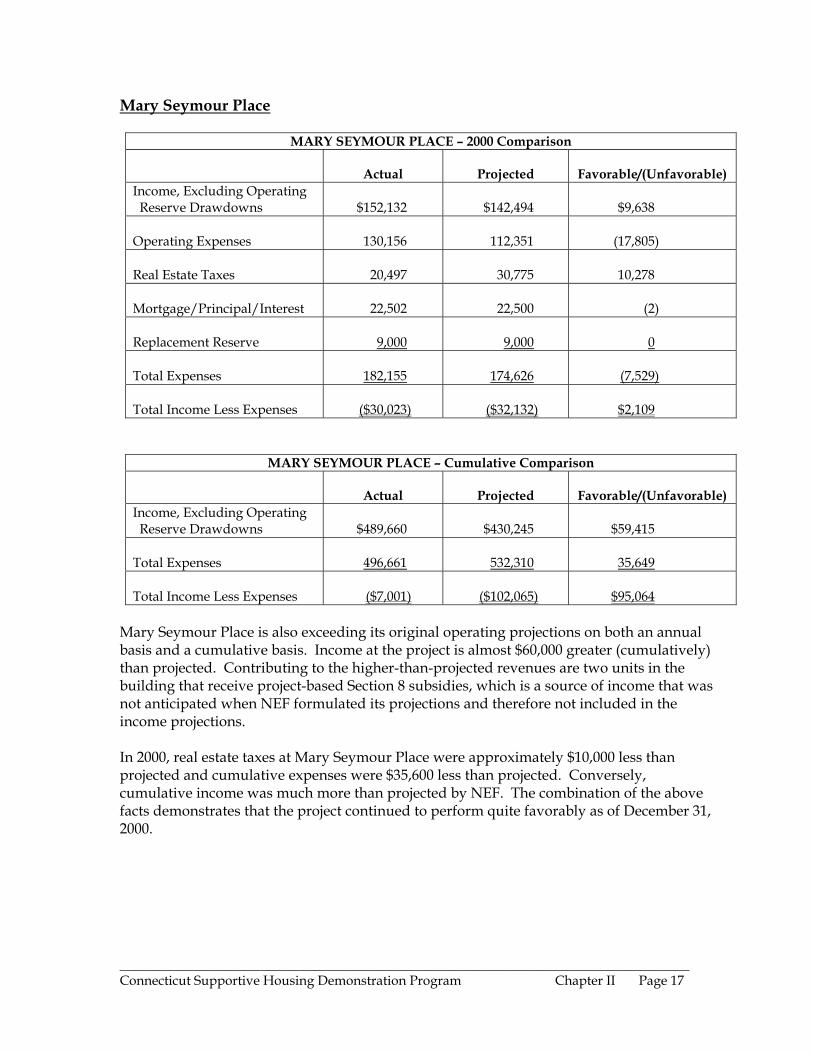
Mary Seymour Place
MARY SEYMOUR PLACE – 2000 Comparison
Actual
Projected
Favorable/(Unfavorable) Income, Excluding Operating Reserve Drawdowns
$152,132
$142,494
$9,638
Operating Expenses
130,156
112,351
(17,805)
Real Estate Taxes
20,497
30,775
10,278
Mortgage/Principal/Interest
22,502
22,500
(2)
Replacement Reserve
9,000
9,000
0
Total Expenses
182,155
174,626
(7,529)
Total Income Less Expenses
($30,023)
($32,132)
$2,109
MARY SEYMOUR PLACE – Cumulative Comparison
Actual
Projected
Favorable/(Unfavorable) Income, Excluding Operating Reserve Drawdowns
$489,660
$430,245
$59,415
Total Expenses
496,661
532,310
35,649
Total Income Less Expenses
($7,001)
($102,065)
$95,064
Mary Seymour Place is also exceeding its original operating projections on both an annual basis and a cumulative basis. Income at the project is almost $60,000 greater (cumulatively) than projected. Contributing to the higher-than-projected revenues are two units in the building that receive project-based Section 8 subsidies, which is a source of income that was not anticipated when NEF formulated its projections and therefore not included in the income projections. In 2000, real estate taxes at Mary Seymour Place were approximately $10,000 less than projected and cumulative expenses were $35,600 less than projected. Conversely, cumulative income was much more than projected by NEF. The combination of the above facts demonstrates that the project continued to perform quite favorably as of December 31, 2000.
_____________________________________________________________________________________ Connecticut Supportive Housing Demonstration Program Chapter II Page 17
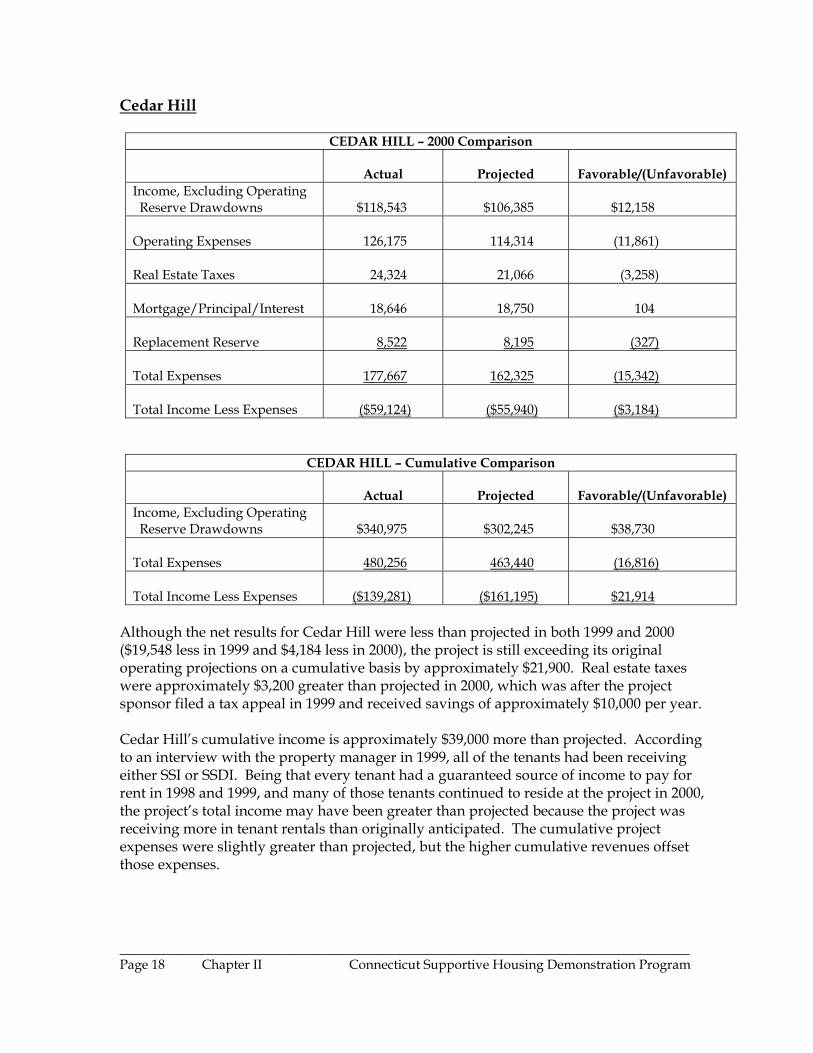
Cedar Hill
CEDAR HILL – 2000 Comparison
Actual
Projected
Favorable/(Unfavorable) Income, Excluding Operating Reserve Drawdowns
$118,543
$106,385
$12,158
Operating Expenses
126,175
114,314
(11,861)
Real Estate Taxes
24,324
21,066
(3,258)
Mortgage/Principal/Interest
18,646
18,750
104
Replacement Reserve
8,522
8,195
(327)
Total Expenses
177,667
162,325
(15,342)
Total Income Less Expenses
($59,124)
($55,940)
($3,184)
CEDAR HILL – Cumulative Comparison
Actual
Projected
Favorable/(Unfavorable) Income, Excluding Operating Reserve Drawdowns
$340,975
$302,245
$38,730
Total Expenses
480,256
463,440
(16,816)
Total Income Less Expenses
($139,281)
($161,195)
$21,914
Although the net results for Cedar Hill were less than projected in both 1999 and 2000 ($19,548 less in 1999 and $4,184 less in 2000), the project is still exceeding its original operating projections on a cumulative basis by approximately $21,900. Real estate taxes were approximately $3,200 greater than projected in 2000, which was after the project sponsor filed a tax appeal in 1999 and received savings of approximately $10,000 per year. Cedar Hill’s cumulative income is approximately $39,000 more than projected. According to an interview with the property manager in 1999, all of the tenants had been receiving either SSI or SSDI. Being that every tenant had a guaranteed source of income to pay for rent in 1998 and 1999, and many of those tenants continued to reside at the project in 2000, the project’s total income may have been greater than projected because the project was receiving more in tenant rentals than originally anticipated. The cumulative project expenses were slightly greater than projected, but the higher cumulative revenues offset those expenses.
_____________________________________________________________________________________ Page 18 Chapter II Connecticut Supportive Housing Demonstration Program
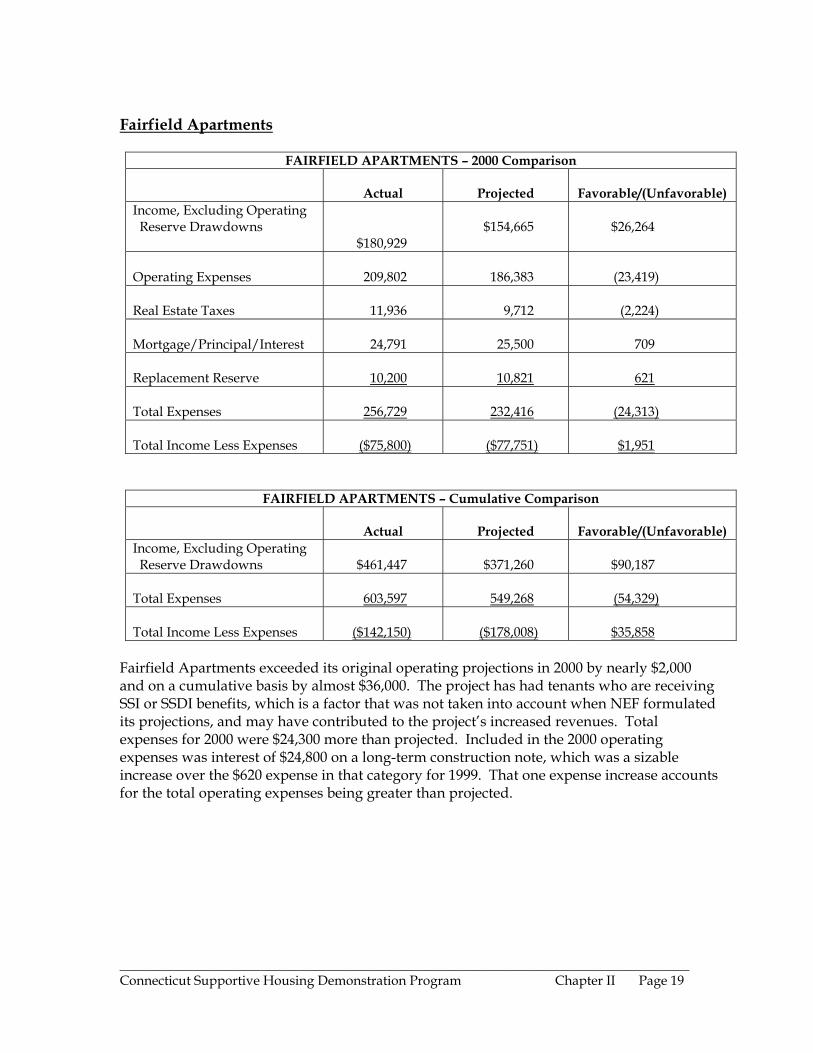
Fairfield Apartments
FAIRFIELD APARTMENTS – 2000 Comparison
Actual
Projected
Favorable/(Unfavorable) Income, Excluding Operating Reserve Drawdowns
$180,929
$154,665
$26,264
Operating Expenses
209,802
186,383
(23,419)
Real Estate Taxes
11,936
9,712
(2,224)
Mortgage/Principal/Interest
24,791
25,500
709
Replacement Reserve
10,200
10,821
621
Total Expenses
256,729
232,416
(24,313)
Total Income Less Expenses
($75,800)
($77,751)
$1,951
FAIRFIELD APARTMENTS – Cumulative Comparison
Actual
Projected
Favorable/(Unfavorable) Income, Excluding Operating Reserve Drawdowns
$461,447
$371,260
$90,187
Total Expenses
603,597
549,268
(54,329)
Total Income Less Expenses
($142,150)
($178,008)
$35,858
Fairfield Apartments exceeded its original operating projections in 2000 by nearly $2,000 and on a cumulative basis by almost $36,000. The project has had tenants who are receiving SSI or SSDI benefits, which is a factor that was not taken into account when NEF formulated its projections, and may have contributed to the project’s increased revenues. Total expenses for 2000 were $24,300 more than projected. Included in the 2000 operating expenses was interest of $24,800 on a long-term construction note, which was a sizable increase over the $620 expense in that category for 1999. That one expense increase accounts for the total operating expenses being greater than projected.
_____________________________________________________________________________________ Connecticut Supportive Housing Demonstration Program Chapter II Page 19
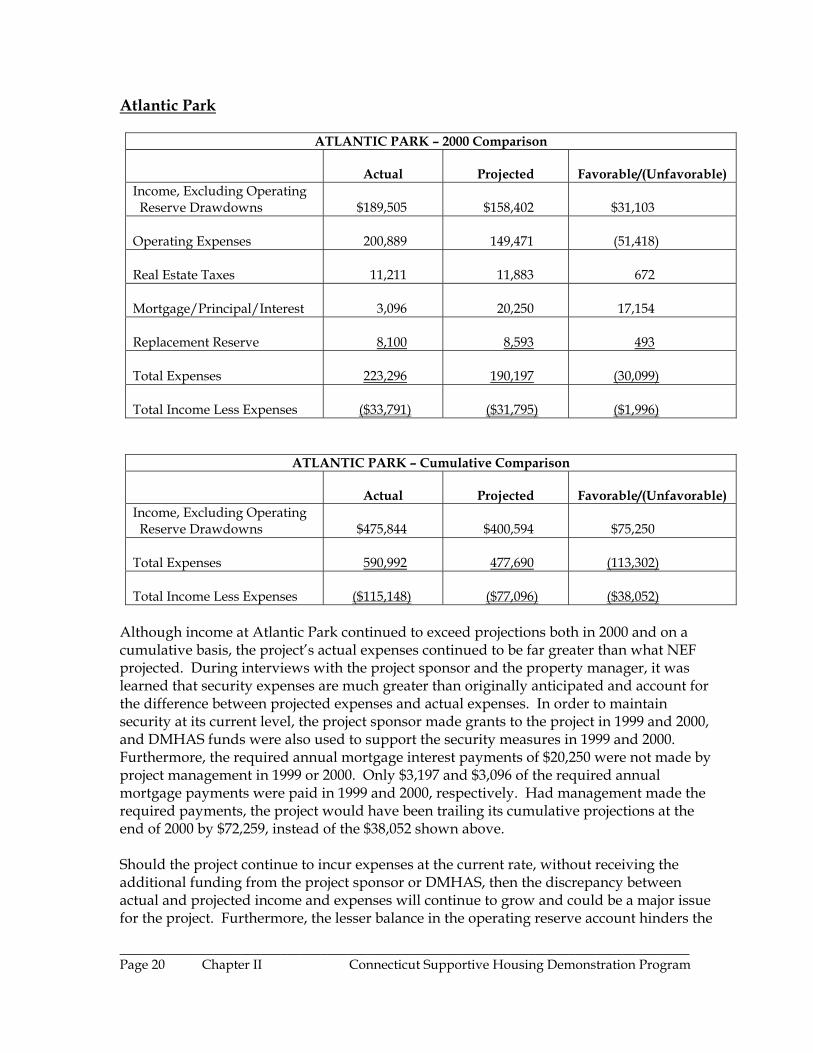
Atlantic Park
ATLANTIC PARK – 2000 Comparison
Actual
Projected
Favorable/(Unfavorable) Income, Excluding Operating Reserve Drawdowns
$189,505
$158,402
$31,103
Operating Expenses
200,889
149,471
(51,418)
Real Estate Taxes
11,211
11,883
672
Mortgage/Principal/Interest
3,096
20,250
17,154
Replacement Reserve
8,100
8,593
493
Total Expenses
223,296
190,197
(30,099)
Total Income Less Expenses
($33,791)
($31,795)
($1,996)
ATLANTIC PARK – Cumulative Comparison
Actual
Projected
Favorable/(Unfavorable) Income, Excluding Operating Reserve Drawdowns
$475,844
$400,594
$75,250
Total Expenses
590,992
477,690
(113,302)
Total Income Less Expenses
($115,148)
($77,096)
($38,052)
Although income at Atlantic Park continued to exceed projections both in 2000 and on a cumulative basis, the project’s actual expenses continued to be far greater than what NEF projected. During interviews with the project sponsor and the property manager, it was learned that security expenses are much greater than originally anticipated and account for the difference between projected expenses and actual expenses. In order to maintain security at its current level, the project sponsor made grants to the project in 1999 and 2000, and DMHAS funds were also used to support the security measures in 1999 and 2000. Furthermore, the required annual mortgage interest payments of $20,250 were not made by project management in 1999 or 2000. Only $3,197 and $3,096 of the required annual mortgage payments were paid in 1999 and 2000, respectively. Had management made the required payments, the project would have been trailing its cumulative projections at the end of 2000 by $72,259, instead of the $38,052 shown above. Should the project continue to incur expenses at the current rate, without receiving the additional funding from the project sponsor or DMHAS, then the discrepancy between actual and projected income and expenses will continue to grow and could be a major issue for the project. Furthermore, the lesser balance in the operating reserve account hinders the
_____________________________________________________________________________________ Page 20 Chapter II Connecticut Supportive Housing Demonstration Program
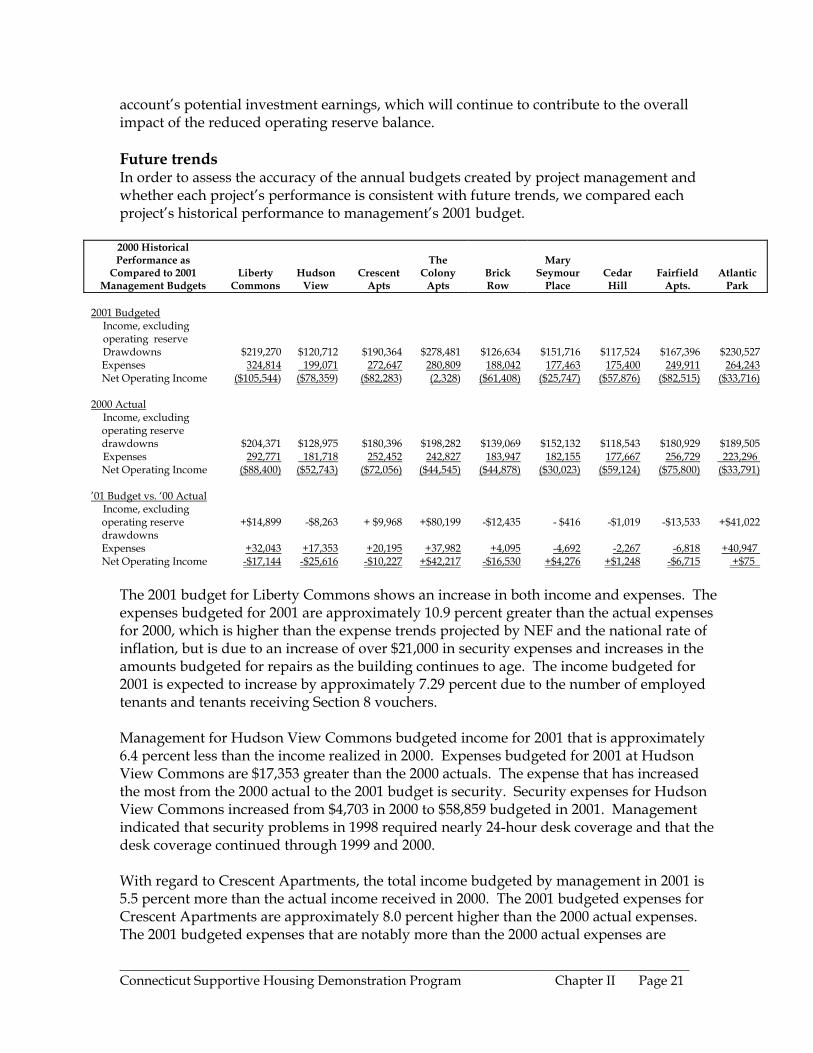
account’s potential investment earnings, which will continue to contribute to the overall impact of the reduced operating reserve balance. Future trends In order to assess the accuracy of the annual budgets created by project management and whether each project’s performance is consistent with future trends, we compared each project’s historical performance to management’s 2001 budget. 2000 Historical Performance as
Compared to 2001 Management Budgets
Liberty Commons
Hudson View
Crescent Apts
The
Colony Apts
Brick Row
Mary
Seymour Place
Cedar Hill
Fairfield Apts.
Atlantic Park
2001 Budgeted
Income, excluding operating reserve Drawdowns
$219,270
$120,712
$190,364
$278,481
$126,634
$151,716
$117,524
$167,396
$230,527 Expenses 324,814 199,071 272,647 280,809 188,042 177,463 175,400 249,911 264,243 Net Operating Income ($105,544) ($78,359) ($82,283) (2,328) ($61,408) ($25,747) ($57,876) ($82,515) ($33,716)
2000 Actual
Income, excluding operating reserve drawdowns
$204,371
$128,975
$180,396
$198,282
$139,069
$152,132
$118,543
$180,929
$189,505 Expenses 292,771 181,718 252,452 242,827 183,947 182,155 177,667 256,729 223,296 Net Operating Income ($88,400) ($52,743) ($72,056) ($44,545) ($44,878) ($30,023) ($59,124) ($75,800) ($33,791)
’01 Budget vs. ‘00 Actual
Income, excluding operating reserve drawdowns
+$14,899
-$8,263
+ $9,968
+$80,199
-$12,435
- $416
-$1,019
-$13,533
+$41,022
Expenses +32,043 +17,353 +20,195 +37,982 +4,095 -4,692 -2,267 -6,818 +40,947 Net Operating Income -$17,144 -$25,616 -$10,227 +$42,217 -$16,530 +$4,276 +$1,248 -$6,715 +$75
The 2001 budget for Liberty Commons shows an increase in both income and expenses. The expenses budgeted for 2001 are approximately 10.9 percent greater than the actual expenses for 2000, which is higher than the expense trends projected by NEF and the national rate of inflation, but is due to an increase of over $21,000 in security expenses and increases in the amounts budgeted for repairs as the building continues to age. The income budgeted for 2001 is expected to increase by approximately 7.29 percent due to the number of employed tenants and tenants receiving Section 8 vouchers. Management for Hudson View Commons budgeted income for 2001 that is approximately 6.4 percent less than the income realized in 2000. Expenses budgeted for 2001 at Hudson View Commons are $17,353 greater than the 2000 actuals. The expense that has increased the most from the 2000 actual to the 2001 budget is security. Security expenses for Hudson View Commons increased from $4,703 in 2000 to $58,859 budgeted in 2001. Management indicated that security problems in 1998 required nearly 24-hour desk coverage and that the desk coverage continued through 1999 and 2000. With regard to Crescent Apartments, the total income budgeted by management in 2001 is 5.5 percent more than the actual income received in 2000. The 2001 budgeted expenses for Crescent Apartments are approximately 8.0 percent higher than the 2000 actual expenses. The 2001 budgeted expenses that are notably more than the 2000 actual expenses are
_____________________________________________________________________________________ Connecticut Supportive Housing Demonstration Program Chapter II Page 21
security and miscellaneous insurance, with almost every other expense budgeted to increase as well. In 1999, several full-time employees were added to the project’s payroll and they receive health and disability insurance, which is the reason for the steady increase in miscellaneous insurance expenses in 1999 and 2000. Security expenses appear greater because the cost of security measures is no longer included under maintenance payroll, but as its own expense line item. For the Colony Apartments, management has budgeted income to increase by 40.4 percent and expenses to increase by approximately 15.6 percent in 2001. The increase in project income is attributable to grants received by project management to fund security expenses. The increase in expenses budgeted for 2001 can be attributed to an increase of approximately $74,000 in security expenses. That increase in security expenses is almost equal to the grant amount received to fund the security measures. In the year 2001, management for Brick Row has budgeted revenues to decline by slightly more than $12,000 from the 2000 actuals, which is a nine percent decrease. Expenses are budgeted to rise by $4,095, or 2.2 percent from the actual expenses for 2000. The decrease in income budgeted is most likely due to the tenant mix and the number of tenants employed and/or receiving SSI or SSDI benefits. Expenses are budgeted to increase at a rate commensurate with inflation. The 2001 budget for Mary Seymour Place differs from the actual 2000 income and expenses by $416 less of revenues budgeted and $4,692 less of expenses. Management appears to have created a 2001 budget that reflects conservative revenue projections (a decrease of less than one percent) and conservative operating expenses (a decrease of 2.5 percent) for Mary Seymour Place, which is consistent with 2000’s budget versus the project’s 1999 actuals. Cedar Hill is budgeted to receive a minimal decrease in project revenues for 2001 (under one percent). Project expenses are budgeted to decrease by approximately 1.3 percent in 2001 because management budgeted for a decrease in bad debts, maintenance payroll and security expenses. Income is budgeted to decrease in 2001 by $13,533 at Fairfield Apartments. Expenses are budgeted to decrease by $6,818 during that same time period. Income is expected to decrease as a result of a lack of security deposit revenues budgeted, which accounted for income of $13,491 in 2000. Real estate taxes are budgeted to decrease in 2001 by $4,804, while miscellaneous finance, which includes expenses including interest on long-term notes payable, is budgeted to decrease $19,350. Management at Atlantic Park budgeted income to increase by $41,022 and expenses to increase by $40,947 in 2001. As at The Colony Apartments, management received a sizable grant to fund security measures at Atlantic Park. The amount of that grant is sufficient to fund the increase in budgeted security costs (which accounts for the overall increase in expenses), as well as fund the majority of the overall budgeted security costs. Based on the above, we determined project management is creating relatively accurate annual budgets that reflect the needs of the projects, while remaining relatively consistent _____________________________________________________________________________________ Page 22 Chapter II Connecticut Supportive Housing Demonstration Program
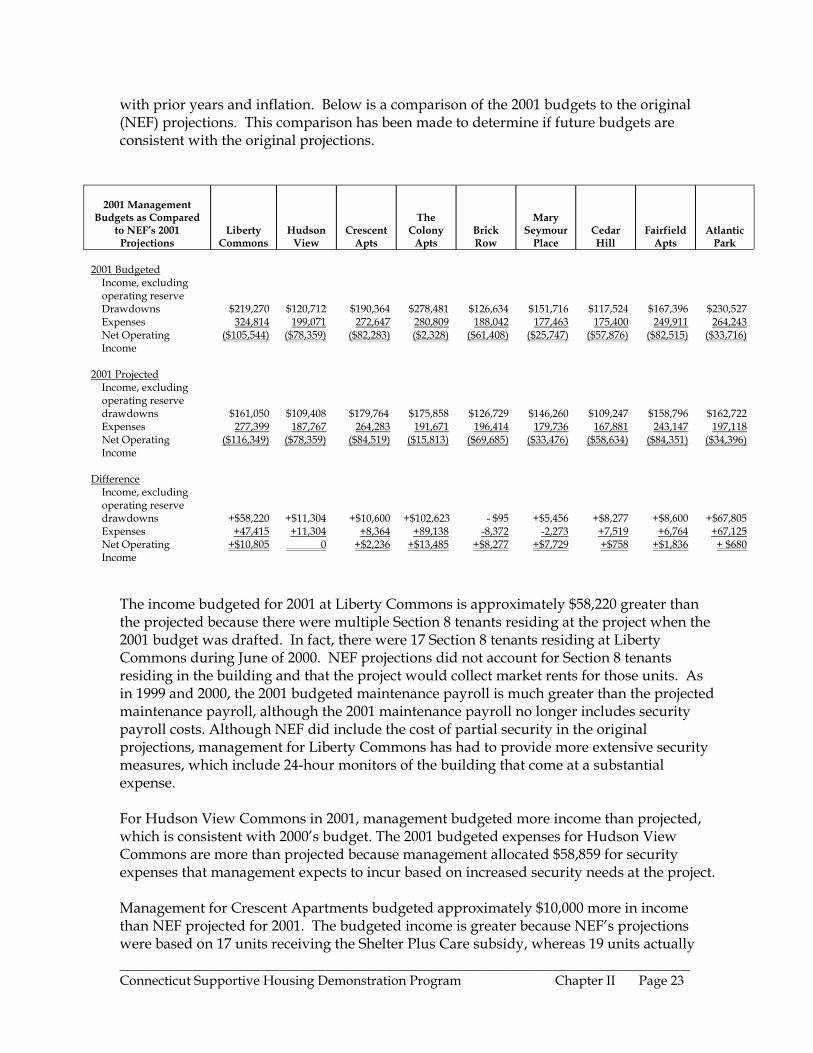
with prior years and inflation. Below is a comparison of the 2001 budgets to the original (NEF) projections. This comparison has been made to determine if future budgets are consistent with the original projections.
2001 Management
Budgets as Compared to NEF’s 2001
Projections
Liberty Commons
Hudson View
Crescent Apts
The Colony
Apts
Brick Row
Mary Seymour
Place
Cedar Hill
Fairfield Apts
Atlantic Park
2001 Budgeted
Income, excluding operating reserve Drawdowns
$219,270
$120,712
$190,364
$278,481
$126,634
$151,716
$117,524
$167,396
$230,527 Expenses 324,814 199,071 272,647 280,809 188,042 177,463 175,400 249,911 264,243 Net Operating Income
($105,544) ($78,359) ($82,283) ($2,328)
($61,408) ($25,747) ($57,876) ($82,515) ($33,716)
2001 Projected
Income, excluding operating reserve drawdowns
$161,050
$109,408
$179,764
$175,858
$126,729
$146,260
$109,247
$158,796
$162,722 Expenses 277,399 187,767 264,283 191,671 196,414 179,736 167,881 243,147 197,118 Net Operating Income
($116,349) ($78,359) ($84,519) ($15,813) ($69,685) ($33,476) ($58,634) ($84,351) ($34,396)
Difference
Income, excluding operating reserve drawdowns
+$58,220
+$11,304
+$10,600
+$102,623
- $95
+$5,456
+$8,277
+$8,600
+$67,805 Expenses +47,415 +11,304 +8,364 +89,138 -8,372 -2,273 +7,519 +6,764 +67,125 Net Operating Income
+$10,805 0 +$2,236 +$13,485 +$8,277 +$7,729 +$758 +$1,836 + $680
The income budgeted for 2001 at Liberty Commons is approximately $58,220 greater than the projected because there were multiple Section 8 tenants residing at the project when the 2001 budget was drafted. In fact, there were 17 Section 8 tenants residing at Liberty Commons during June of 2000. NEF projections did not account for Section 8 tenants residing in the building and that the project would collect market rents for those units. As in 1999 and 2000, the 2001 budgeted maintenance payroll is much greater than the projected maintenance payroll, although the 2001 maintenance payroll no longer includes security payroll costs. Although NEF did include the cost of partial security in the original projections, management for Liberty Commons has had to provide more extensive security measures, which include 24-hour monitors of the building that come at a substantial expense. For Hudson View Commons in 2001, management budgeted more income than projected, which is consistent with 2000’s budget. The 2001 budgeted expenses for Hudson View Commons are more than projected because management allocated $58,859 for security expenses that management expects to incur based on increased security needs at the project. Management for Crescent Apartments budgeted approximately $10,000 more in income than NEF projected for 2001. The budgeted income is greater because NEF’s projections were based on 17 units receiving the Shelter Plus Care subsidy, whereas 19 units actually _____________________________________________________________________________________ Connecticut Supportive Housing Demonstration Program Chapter II Page 23
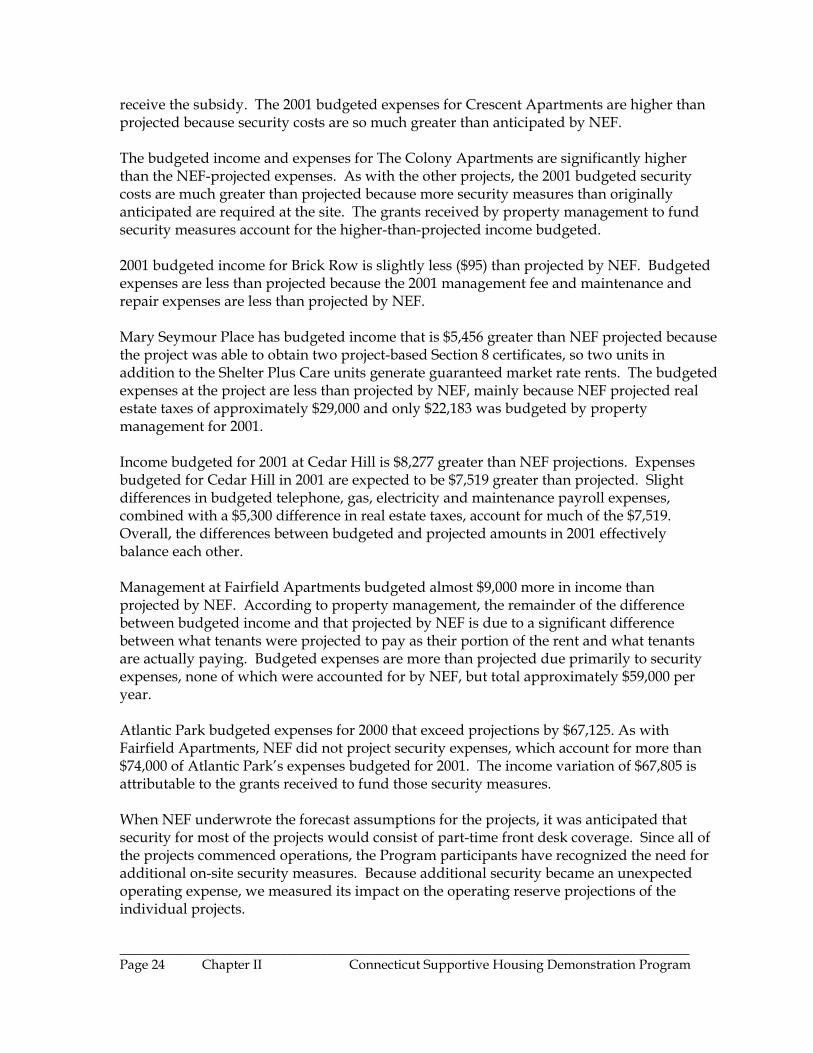
receive the subsidy. The 2001 budgeted expenses for Crescent Apartments are higher than projected because security costs are so much greater than anticipated by NEF. The budgeted income and expenses for The Colony Apartments are significantly higher than the NEF-projected expenses. As with the other projects, the 2001 budgeted security costs are much greater than projected because more security measures than originally anticipated are required at the site. The grants received by property management to fund security measures account for the higher-than-projected income budgeted. 2001 budgeted income for Brick Row is slightly less ($95) than projected by NEF. Budgeted expenses are less than projected because the 2001 management fee and maintenance and repair expenses are less than projected by NEF. Mary Seymour Place has budgeted income that is $5,456 greater than NEF projected because the project was able to obtain two project-based Section 8 certificates, so two units in addition to the Shelter Plus Care units generate guaranteed market rate rents. The budgeted expenses at the project are less than projected by NEF, mainly because NEF projected real estate taxes of approximately $29,000 and only $22,183 was budgeted by property management for 2001. Income budgeted for 2001 at Cedar Hill is $8,277 greater than NEF projections. Expenses budgeted for Cedar Hill in 2001 are expected to be $7,519 greater than projected. Slight differences in budgeted telephone, gas, electricity and maintenance payroll expenses, combined with a $5,300 difference in real estate taxes, account for much of the $7,519. Overall, the differences between budgeted and projected amounts in 2001 effectively balance each other. Management at Fairfield Apartments budgeted almost $9,000 more in income than projected by NEF. According to property management, the remainder of the difference between budgeted income and that projected by NEF is due to a significant difference between what tenants were projected to pay as their portion of the rent and what tenants are actually paying. Budgeted expenses are more than projected due primarily to security expenses, none of which were accounted for by NEF, but total approximately $59,000 per year. Atlantic Park budgeted expenses for 2000 that exceed projections by $67,125. As with Fairfield Apartments, NEF did not project security expenses, which account for more than $74,000 of Atlantic Park’s expenses budgeted for 2001. The income variation of $67,805 is attributable to the grants received to fund those security measures. When NEF underwrote the forecast assumptions for the projects, it was anticipated that security for most of the projects would consist of part-time front desk coverage. Since all of the projects commenced operations, the Program participants have recognized the need for additional on-site security measures. Because additional security became an unexpected operating expense, we measured its impact on the operating reserve projections of the individual projects. _____________________________________________________________________________________ Page 24 Chapter II Connecticut Supportive Housing Demonstration Program
Our analysis of the security expenses includes a chart detailing the security measures undertaken by the individual projects. The chart includes the amount expended in 2000 by the projects for the security measures.
Liberty
Commons
Hudson
View
Crescent
Apts.
The Colony Apts.
Brick Row
Mary Seymour
Place
Cedar Hill
Fairfield
Apts.
Atlantic
Park Security Measures:
Yes Yes Yes Yes Yes Yes Yes Yes Yes Service Contracts for Cameras
Yes
Yes
Yes
Yes
Yes
Yes
Yes
Yes
Yes
Security Locks Yes Yes Yes Yes No Yes Yes Yes Yes Front Desk Staff Yes Yes Yes Yes No Yes Yes Yes Yes Security Expenses:
2000 NEF Projections
$37,856
$0
$24,635
$1,125
$0
$337
$10,816
$21,632
$17,306
Approximate 2000 Cost of Security
62,500
55,000
54,000
75,000
532
595
18,435
55,000
75,000
Effect on Future Operating Reserves
None
None
None
Yes
None
None
None
None
Yes
Cameras
As demonstrated in the preceding section entitled, “The Consistency of Project Performance – The Original Projections,” seven of the projects are ahead of their cumulative projections (Liberty Commons, Hudson View Commons, Crescent Apartments, Brick Row, Mary Seymour Place, Cedar Hill Apartments and Fairfield Apartments). Therefore, while security costs have been greater than expected and projected for the seven projects, those costs have not had an adverse effect on the future operating reserves because project management has not had to withdraw more of the operating reserve funds than was projected. At Mary Seymour Place, the costs associated with having front desk staff are paid out of the DMHAS support services grants received by My Sisters’ Place and the security staff work directly for My Sisters’ Place. Property management is only responsible for paying the costs associated with the maintenance of the project’s security cameras. Colony Apartments and Atlantic Park received grants from their sponsor, St. Luke’s LifeWorks, in 2000 to assist with the projects’ annual security costs. Security expenses have not exceeded the amounts available at seven of the nine projects because property managers have limited all expenses to keep them within the tight scope of the available funds. In the future, however, additional resources will be necessary to provide the projects with both adequate 24-hour security measures and adequate building services and amenities. The only two projects that are behind their cumulative projections are Colony Apartments and Atlantic Park. Colony Apartments is now trailing NEF’s projections by $57,011, which is an increase of $30,382 from 1999, and Atlantic Park is now lagging by $38,052, which is $1,996 greater than 1999. As mentioned above, however, if Atlantic Park had made its
_____________________________________________________________________________________ Connecticut Supportive Housing Demonstration Program Chapter II Page 25
required mortgage interest payments in 1999 and 2000, the project would be trailing NEF’s projections by $72,259 as of December 31, 2000. Based on interviews with property management in 1999, it was known then that additional funds would have to be withdrawn from the operating reserve accounts to fund security at its current level. For 2000, security at Colony Apartments is fully subsidized by St. Luke’s, with a portion of the funds allocated from the project’s DMHAS support service grant. Property management at Atlantic Park is responsible for $23,400 of the project’s security costs in 2000, with St. Luke’s subsidizing the remainder of the project’s security expenses using a portion of the project’s DMHAS support service grant. Should the projects desire to maintain their levels of security, additional sources of funds will have to be provided annually. If additional sources of funds are not provided, then the operating reserves will be depleted faster than anticipated and the projects’ financial stability will be in question. The Impact of the Following Groups on the Financial Performance and Stability of the Projects Property Management One of the roles of property management is to create realistic budgets that conform to the forecast assumptions and projected annual cash flows that were underwritten by NEF. The property managers are then expected to keep income and expenses within those budgets by ensuring that rents are collected, subsidies are received, and expenses do not exceed the budget. Management is also expected to enforce the rules of the projects and the covenants contained in the tenant leases. When a tenant does not follow the rules or breaches a covenant, property management is expected to address the issue. We have measured property management’s impact on financial performance by interviewing the property managers and property management companies to determine if rents were collected, subsidies were received, and expenses were within budget. We also reviewed occupancy and turnover rates that were established in the first section of this evaluation. In addition to analyzing the occupancy and turnover rates, we analyzed line items on the projects’ financial statements. Line items that we analyzed on the projects’ financial statements are bad debt and repairs and maintenance. Occupancy and Turnover Rates An analysis of occupancy and turnover rates helps to determine if management has been able to retain tenants and expediently fill units as they are vacated. As discussed in the above section addressing occupancy and turnover rates, occupancy rates measure how efficiently a unit or project is used during the year and annual turnover rates measure how frequently in one year units are vacated by one tenant and occupied by another. The occupancy rates continue to be high for the eight projects included in this year’s evaluation, especially when they are considered in conjunction with the turnover rates. Crescent Apartments had the highest turnover rate at 21.1 percent in 2000, but management was able to keep the units occupied for 88 percent of the year.
_____________________________________________________________________________________ Page 26 Chapter II Connecticut Supportive Housing Demonstration Program
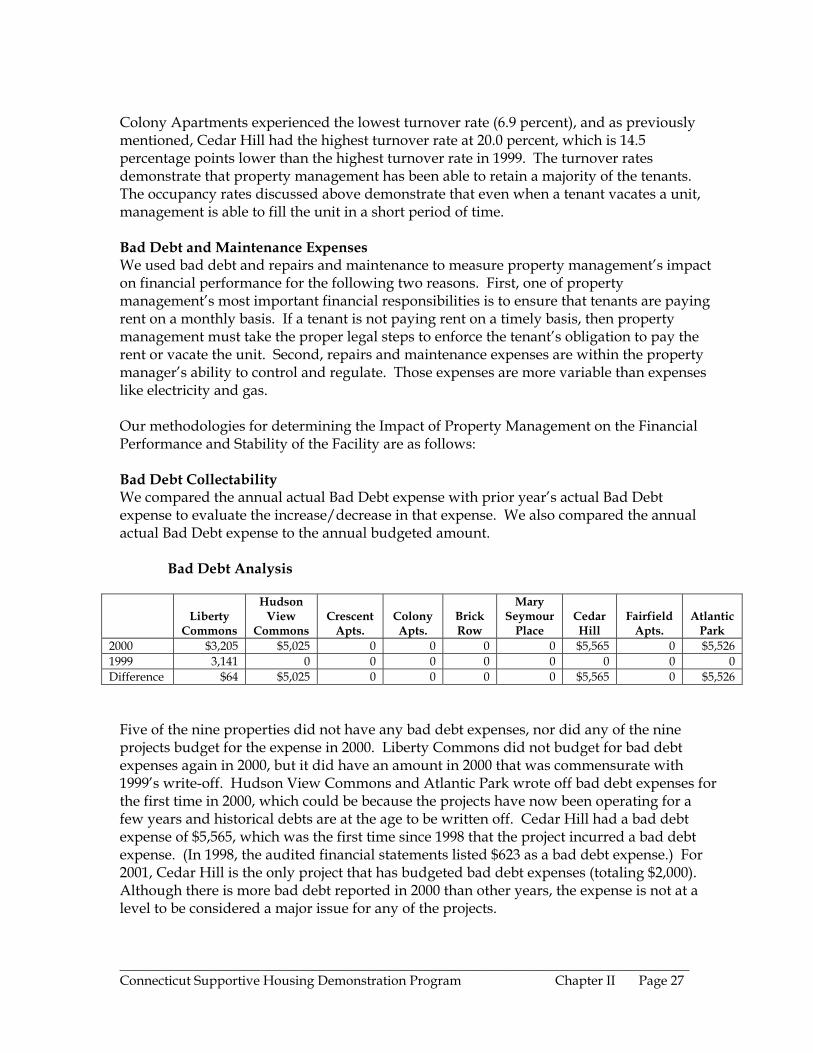
Colony Apartments experienced the lowest turnover rate (6.9 percent), and as previously mentioned, Cedar Hill had the highest turnover rate at 20.0 percent, which is 14.5 percentage points lower than the highest turnover rate in 1999. The turnover rates demonstrate that property management has been able to retain a majority of the tenants. The occupancy rates discussed above demonstrate that even when a tenant vacates a unit, management is able to fill the unit in a short period of time. Bad Debt and Maintenance Expenses We used bad debt and repairs and maintenance to measure property management’s impact on financial performance for the following two reasons. First, one of property management’s most important financial responsibilities is to ensure that tenants are paying rent on a monthly basis. If a tenant is not paying rent on a timely basis, then property management must take the proper legal steps to enforce the tenant’s obligation to pay the rent or vacate the unit. Second, repairs and maintenance expenses are within the property manager’s ability to control and regulate. Those expenses are more variable than expenses like electricity and gas. Our methodologies for determining the Impact of Property Management on the Financial Performance and Stability of the Facility are as follows: Bad Debt Collectability We compared the annual actual Bad Debt expense with prior year’s actual Bad Debt expense to evaluate the increase/decrease in that expense. We also compared the annual actual Bad Debt expense to the annual budgeted amount. Bad Debt Analysis
Liberty
Commons
Hudson View
Commons
Crescent
Apts.
Colony Apts.
Brick Row
Mary Seymour
Place
Cedar Hill
Fairfield
Apts.
Atlantic
Park 2000 $3,205 $5,025 0 0 0 0 $5,565 0 $5,526 1999 3,141 0 0 0 0 0 0 0 0 Difference $64 $5,025 0 0 0 0 $5,565 0 $5,526
Five of the nine properties did not have any bad debt expenses, nor did any of the nine projects budget for the expense in 2000. Liberty Commons did not budget for bad debt expenses again in 2000, but it did have an amount in 2000 that was commensurate with 1999’s write-off. Hudson View Commons and Atlantic Park wrote off bad debt expenses for the first time in 2000, which could be because the projects have now been operating for a few years and historical debts are at the age to be written off. Cedar Hill had a bad debt expense of $5,565, which was the first time since 1998 that the project incurred a bad debt expense. (In 1998, the audited financial statements listed $623 as a bad debt expense.) For 2001, Cedar Hill is the only project that has budgeted bad debt expenses (totaling $2,000). Although there is more bad debt reported in 2000 than other years, the expense is not at a level to be considered a major issue for any of the projects.
_____________________________________________________________________________________ Connecticut Supportive Housing Demonstration Program Chapter II Page 27
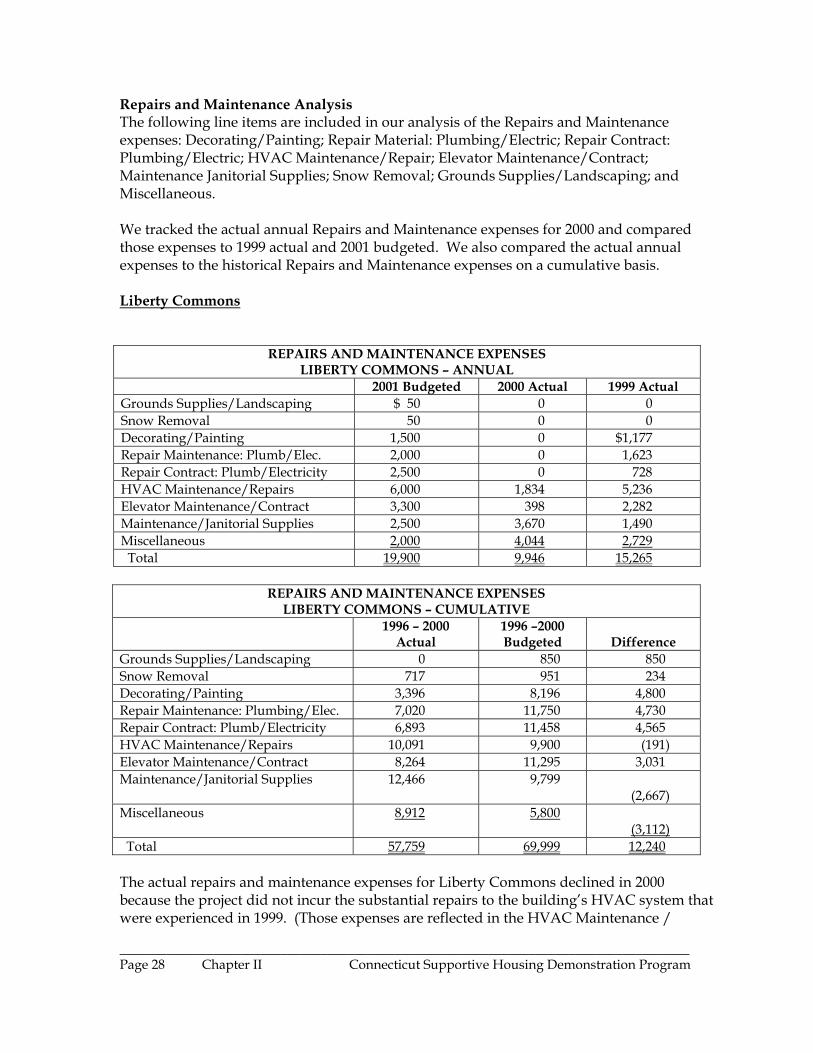
Repairs and Maintenance Analysis The following line items are included in our analysis of the Repairs and Maintenance expenses: Decorating/Painting; Repair Material: Plumbing/Electric; Repair Contract: Plumbing/Electric; HVAC Maintenance/Repair; Elevator Maintenance/Contract; Maintenance Janitorial Supplies; Snow Removal; Grounds Supplies/Landscaping; and Miscellaneous. We tracked the actual annual Repairs and Maintenance expenses for 2000 and compared those expenses to 1999 actual and 2001 budgeted. We also compared the actual annual expenses to the historical Repairs and Maintenance expenses on a cumulative basis. Liberty Commons
REPAIRS AND MAINTENANCE EXPENSES LIBERTY COMMONS – ANNUAL
2001 Budgeted 2000 Actual 1999 Actual Grounds Supplies/Landscaping $ 50 0 0 Snow Removal 50 0 0 Decorating/Painting 1,500 0 $1,177 Repair Maintenance: Plumb/Elec. 2,000 0 1,623 Repair Contract: Plumb/Electricity 2,500 0 728 HVAC Maintenance/Repairs 6,000 1,834 5,236 Elevator Maintenance/Contract 3,300 398 2,282 Maintenance/Janitorial Supplies 2,500 3,670 1,490 Miscellaneous 2,000 4,044 2,729 Total 19,900 9,946 15,265
REPAIRS AND MAINTENANCE EXPENSES LIBERTY COMMONS – CUMULATIVE
1996 – 2000 Actual
1996 –2000 Budgeted
Difference
Grounds Supplies/Landscaping 0 850 850 Snow Removal 717 951 234 Decorating/Painting 3,396 8,196 4,800 Repair Maintenance: Plumbing/Elec. 7,020 11,750 4,730 Repair Contract: Plumb/Electricity 6,893 11,458 4,565 HVAC Maintenance/Repairs 10,091 9,900 (191) Elevator Maintenance/Contract 8,264 11,295 3,031 Maintenance/Janitorial Supplies 12,466 9,799
(2,667) Miscellaneous 8,912 5,800
(3,112) Total 57,759 69,999 12,240 The actual repairs and maintenance expenses for Liberty Commons declined in 2000 because the project did not incur the substantial repairs to the building’s HVAC system that were experienced in 1999. (Those expenses are reflected in the HVAC Maintenance /
_____________________________________________________________________________________ Page 28 Chapter II Connecticut Supportive Housing Demonstration Program
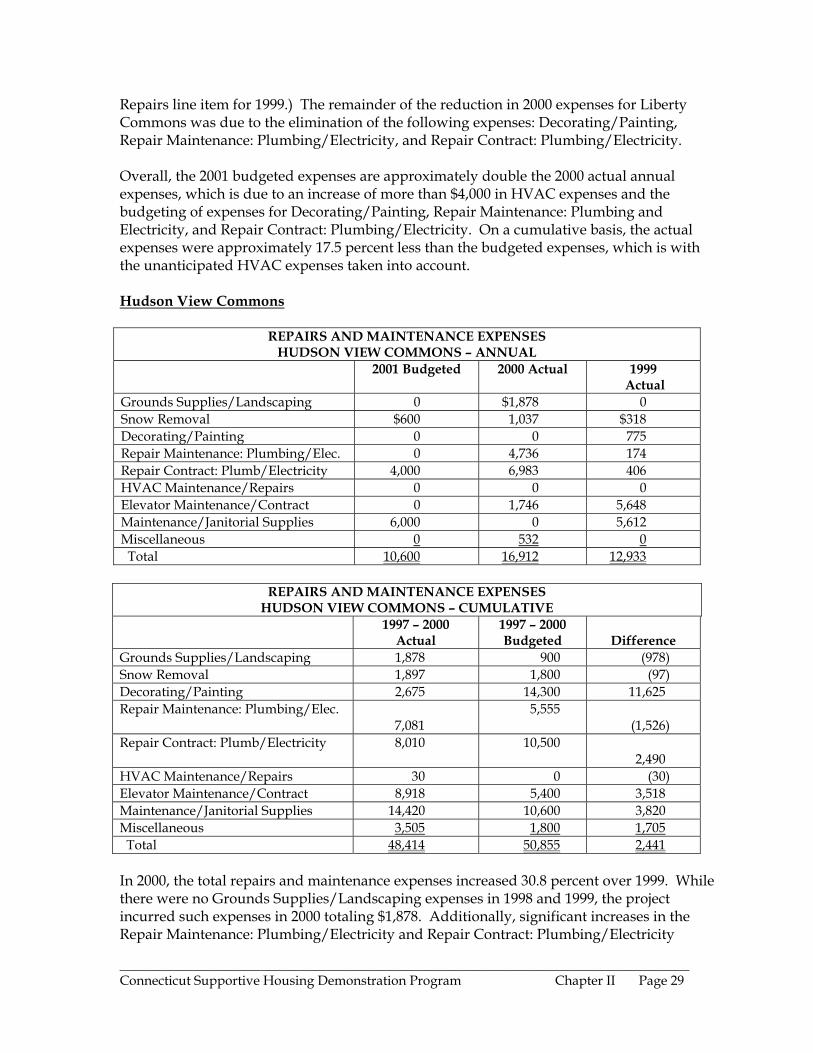
Repairs line item for 1999.) The remainder of the reduction in 2000 expenses for Liberty Commons was due to the elimination of the following expenses: Decorating/Painting, Repair Maintenance: Plumbing/Electricity, and Repair Contract: Plumbing/Electricity. Overall, the 2001 budgeted expenses are approximately double the 2000 actual annual expenses, which is due to an increase of more than $4,000 in HVAC expenses and the budgeting of expenses for Decorating/Painting, Repair Maintenance: Plumbing and Electricity, and Repair Contract: Plumbing/Electricity. On a cumulative basis, the actual expenses were approximately 17.5 percent less than the budgeted expenses, which is with the unanticipated HVAC expenses taken into account. Hudson View Commons
REPAIRS AND MAINTENANCE EXPENSES HUDSON VIEW COMMONS – ANNUAL
2001 Budgeted 2000 Actual 1999 Actual
Grounds Supplies/Landscaping 0 $1,878 0 Snow Removal $600 1,037 $318 Decorating/Painting 0 0 775 Repair Maintenance: Plumbing/Elec. 0 4,736 174 Repair Contract: Plumb/Electricity 4,000 6,983 406 HVAC Maintenance/Repairs 0 0 0 Elevator Maintenance/Contract 0 1,746 5,648 Maintenance/Janitorial Supplies 6,000 0 5,612 Miscellaneous 0 532 0 Total 10,600 16,912 12,933
REPAIRS AND MAINTENANCE EXPENSES HUDSON VIEW COMMONS – CUMULATIVE
1997 – 2000 Actual
1997 – 2000 Budgeted
Difference
Grounds Supplies/Landscaping 1,878 900 (978) Snow Removal 1,897 1,800 (97) Decorating/Painting 2,675 14,300 11,625 Repair Maintenance: Plumbing/Elec.
7,081 5,555
(1,526) Repair Contract: Plumb/Electricity 8,010 10,500
2,490 HVAC Maintenance/Repairs 30 0 (30) Elevator Maintenance/Contract 8,918 5,400 3,518 Maintenance/Janitorial Supplies 14,420 10,600 3,820 Miscellaneous 3,505 1,800 1,705 Total 48,414 50,855 2,441 In 2000, the total repairs and maintenance expenses increased 30.8 percent over 1999. While there were no Grounds Supplies/Landscaping expenses in 1998 and 1999, the project incurred such expenses in 2000 totaling $1,878. Additionally, significant increases in the Repair Maintenance: Plumbing/Electricity and Repair Contract: Plumbing/Electricity
_____________________________________________________________________________________ Connecticut Supportive Housing Demonstration Program Chapter II Page 29
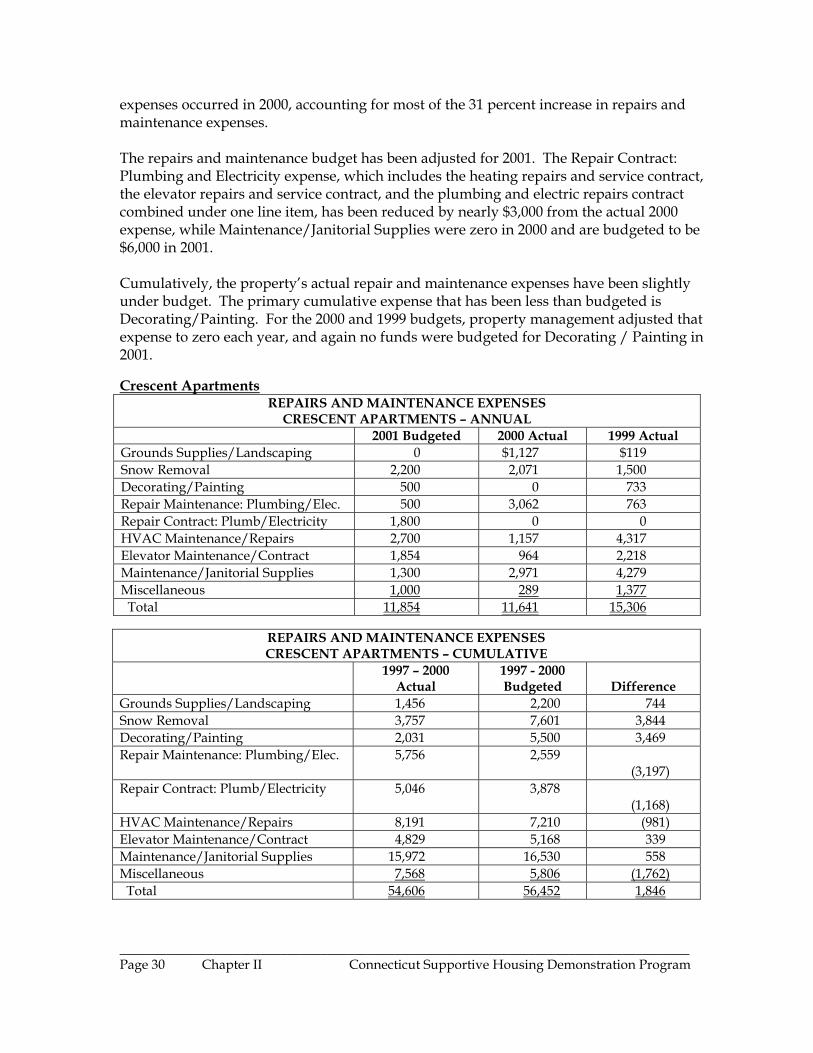
expenses occurred in 2000, accounting for most of the 31 percent increase in repairs and maintenance expenses. The repairs and maintenance budget has been adjusted for 2001. The Repair Contract: Plumbing and Electricity expense, which includes the heating repairs and service contract, the elevator repairs and service contract, and the plumbing and electric repairs contract combined under one line item, has been reduced by nearly $3,000 from the actual 2000 expense, while Maintenance/Janitorial Supplies were zero in 2000 and are budgeted to be $6,000 in 2001. Cumulatively, the property’s actual repair and maintenance expenses have been slightly under budget. The primary cumulative expense that has been less than budgeted is Decorating/Painting. For the 2000 and 1999 budgets, property management adjusted that expense to zero each year, and again no funds were budgeted for Decorating / Painting in 2001. Crescent Apartments
REPAIRS AND MAINTENANCE EXPENSES CRESCENT APARTMENTS – ANNUAL
2001 Budgeted 2000 Actual 1999 Actual Grounds Supplies/Landscaping 0 $1,127 $119 Snow Removal 2,200 2,071 1,500 Decorating/Painting 500 0 733 Repair Maintenance: Plumbing/Elec. 500 3,062 763 Repair Contract: Plumb/Electricity 1,800 0 0 HVAC Maintenance/Repairs 2,700 1,157 4,317 Elevator Maintenance/Contract 1,854 964 2,218 Maintenance/Janitorial Supplies 1,300 2,971 4,279 Miscellaneous 1,000 289 1,377 Total 11,854 11,641 15,306
REPAIRS AND MAINTENANCE EXPENSES CRESCENT APARTMENTS – CUMULATIVE
1997 – 2000 Actual
1997 - 2000 Budgeted
Difference
Grounds Supplies/Landscaping 1,456 2,200 744 Snow Removal 3,757 7,601 3,844 Decorating/Painting 2,031 5,500 3,469 Repair Maintenance: Plumbing/Elec. 5,756 2,559
(3,197) Repair Contract: Plumb/Electricity 5,046 3,878
(1,168) HVAC Maintenance/Repairs 8,191 7,210 (981) Elevator Maintenance/Contract 4,829 5,168 339 Maintenance/Janitorial Supplies 15,972 16,530 558 Miscellaneous 7,568 5,806 (1,762) Total 54,606 56,452 1,846
_____________________________________________________________________________________ Page 30 Chapter II Connecticut Supportive Housing Demonstration Program
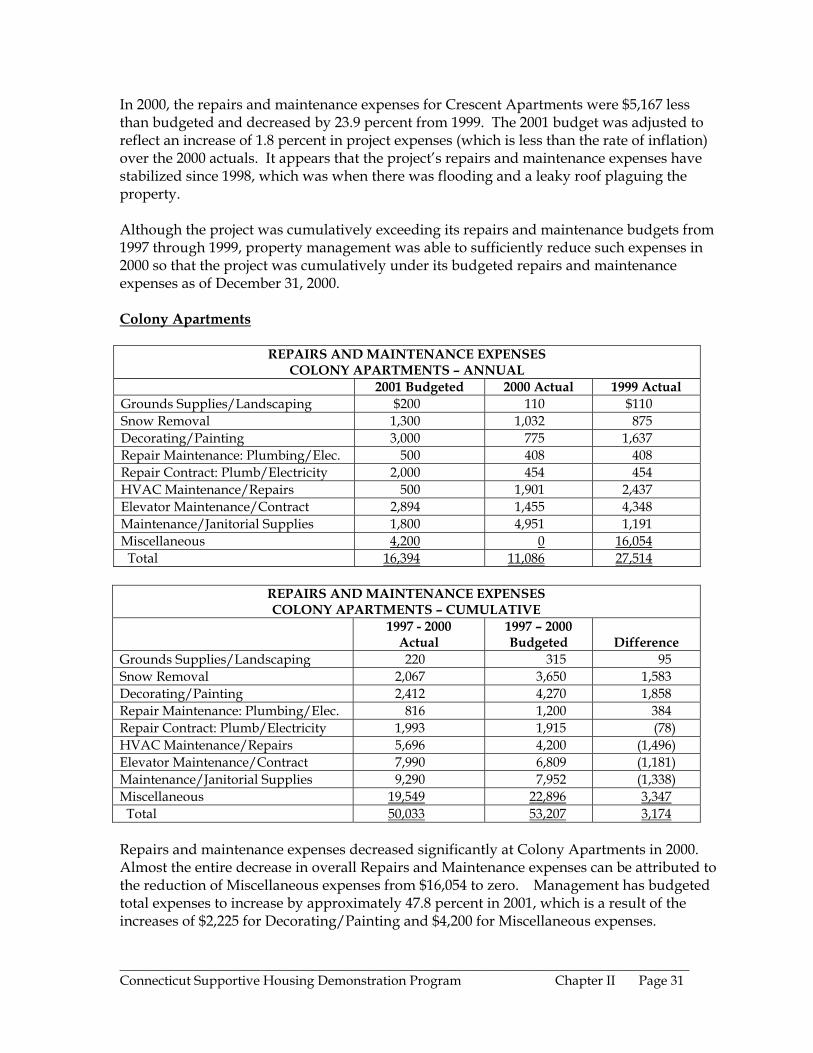
In 2000, the repairs and maintenance expenses for Crescent Apartments were $5,167 less than budgeted and decreased by 23.9 percent from 1999. The 2001 budget was adjusted to reflect an increase of 1.8 percent in project expenses (which is less than the rate of inflation) over the 2000 actuals. It appears that the project’s repairs and maintenance expenses have stabilized since 1998, which was when there was flooding and a leaky roof plaguing the property. Although the project was cumulatively exceeding its repairs and maintenance budgets from 1997 through 1999, property management was able to sufficiently reduce such expenses in 2000 so that the project was cumulatively under its budgeted repairs and maintenance expenses as of December 31, 2000. Colony Apartments
REPAIRS AND MAINTENANCE EXPENSES COLONY APARTMENTS – ANNUAL
2001 Budgeted 2000 Actual 1999 Actual Grounds Supplies/Landscaping $200 110 $110 Snow Removal 1,300 1,032 875 Decorating/Painting 3,000 775 1,637 Repair Maintenance: Plumbing/Elec. 500 408 408 Repair Contract: Plumb/Electricity 2,000 454 454 HVAC Maintenance/Repairs 500 1,901 2,437 Elevator Maintenance/Contract 2,894 1,455 4,348 Maintenance/Janitorial Supplies 1,800 4,951 1,191 Miscellaneous 4,200 0 16,054 Total 16,394 11,086 27,514
REPAIRS AND MAINTENANCE EXPENSES COLONY APARTMENTS – CUMULATIVE
1997 - 2000 Actual
1997 – 2000 Budgeted
Difference
Grounds Supplies/Landscaping 220 315 95 Snow Removal 2,067 3,650 1,583 Decorating/Painting 2,412 4,270 1,858 Repair Maintenance: Plumbing/Elec. 816 1,200 384 Repair Contract: Plumb/Electricity 1,993 1,915 (78) HVAC Maintenance/Repairs 5,696 4,200 (1,496) Elevator Maintenance/Contract 7,990 6,809 (1,181) Maintenance/Janitorial Supplies 9,290 7,952 (1,338) Miscellaneous 19,549 22,896 3,347 Total 50,033 53,207 3,174 Repairs and maintenance expenses decreased significantly at Colony Apartments in 2000. Almost the entire decrease in overall Repairs and Maintenance expenses can be attributed to the reduction of Miscellaneous expenses from $16,054 to zero. Management has budgeted total expenses to increase by approximately 47.8 percent in 2001, which is a result of the increases of $2,225 for Decorating/Painting and $4,200 for Miscellaneous expenses.
_____________________________________________________________________________________ Connecticut Supportive Housing Demonstration Program Chapter II Page 31
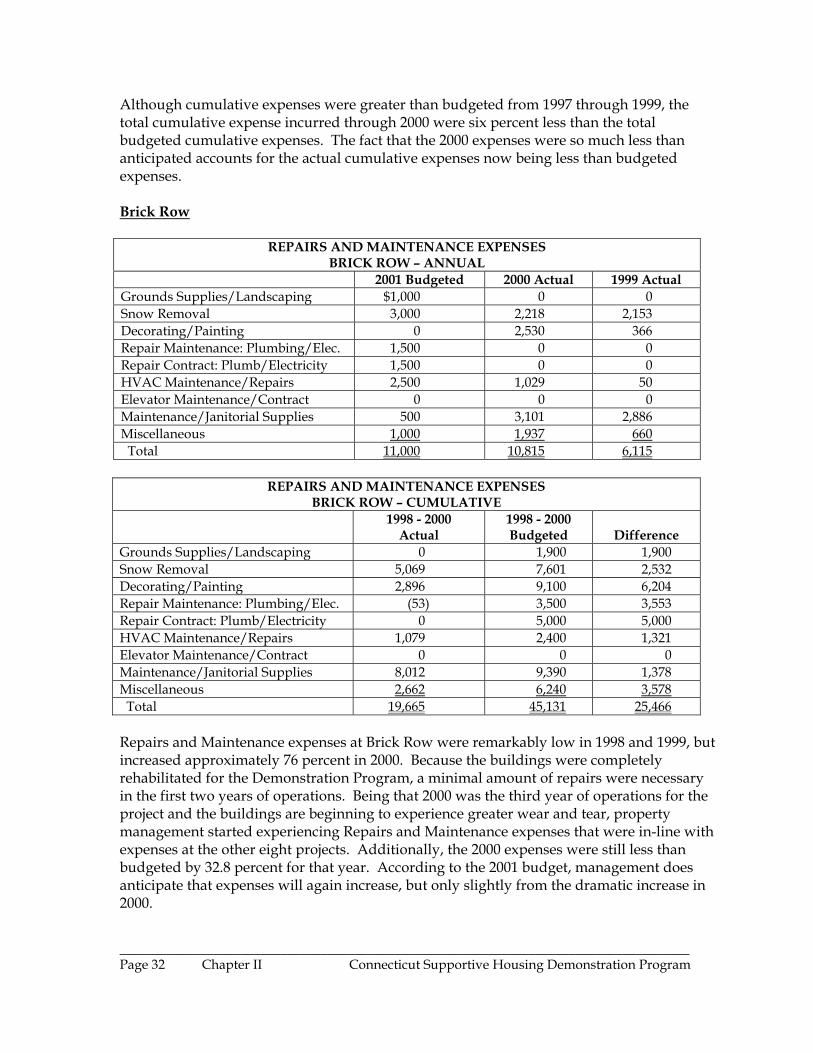
Although cumulative expenses were greater than budgeted from 1997 through 1999, the total cumulative expense incurred through 2000 were six percent less than the total budgeted cumulative expenses. The fact that the 2000 expenses were so much less than anticipated accounts for the actual cumulative expenses now being less than budgeted expenses. Brick Row
REPAIRS AND MAINTENANCE EXPENSES BRICK ROW – ANNUAL
2001 Budgeted 2000 Actual 1999 Actual Grounds Supplies/Landscaping $1,000 0 0 Snow Removal 3,000 2,218 2,153 Decorating/Painting 0 2,530 366 Repair Maintenance: Plumbing/Elec. 1,500 0 0 Repair Contract: Plumb/Electricity 1,500 0 0 HVAC Maintenance/Repairs 2,500 1,029 50 Elevator Maintenance/Contract 0 0 0 Maintenance/Janitorial Supplies 500 3,101 2,886 Miscellaneous 1,000 1,937 660 Total 11,000 10,815 6,115
REPAIRS AND MAINTENANCE EXPENSES BRICK ROW – CUMULATIVE
1998 - 2000 Actual
1998 - 2000 Budgeted
Difference
Grounds Supplies/Landscaping 0 1,900 1,900 Snow Removal 5,069 7,601 2,532 Decorating/Painting 2,896 9,100 6,204 Repair Maintenance: Plumbing/Elec. (53) 3,500 3,553 Repair Contract: Plumb/Electricity 0 5,000 5,000 HVAC Maintenance/Repairs 1,079 2,400 1,321 Elevator Maintenance/Contract 0 0 0 Maintenance/Janitorial Supplies 8,012 9,390 1,378 Miscellaneous 2,662 6,240 3,578 Total 19,665 45,131 25,466 Repairs and Maintenance expenses at Brick Row were remarkably low in 1998 and 1999, but increased approximately 76 percent in 2000. Because the buildings were completely rehabilitated for the Demonstration Program, a minimal amount of repairs were necessary in the first two years of operations. Being that 2000 was the third year of operations for the project and the buildings are beginning to experience greater wear and tear, property management started experiencing Repairs and Maintenance expenses that were in-line with expenses at the other eight projects. Additionally, the 2000 expenses were still less than budgeted by 32.8 percent for that year. According to the 2001 budget, management does anticipate that expenses will again increase, but only slightly from the dramatic increase in 2000.
_____________________________________________________________________________________ Page 32 Chapter II Connecticut Supportive Housing Demonstration Program
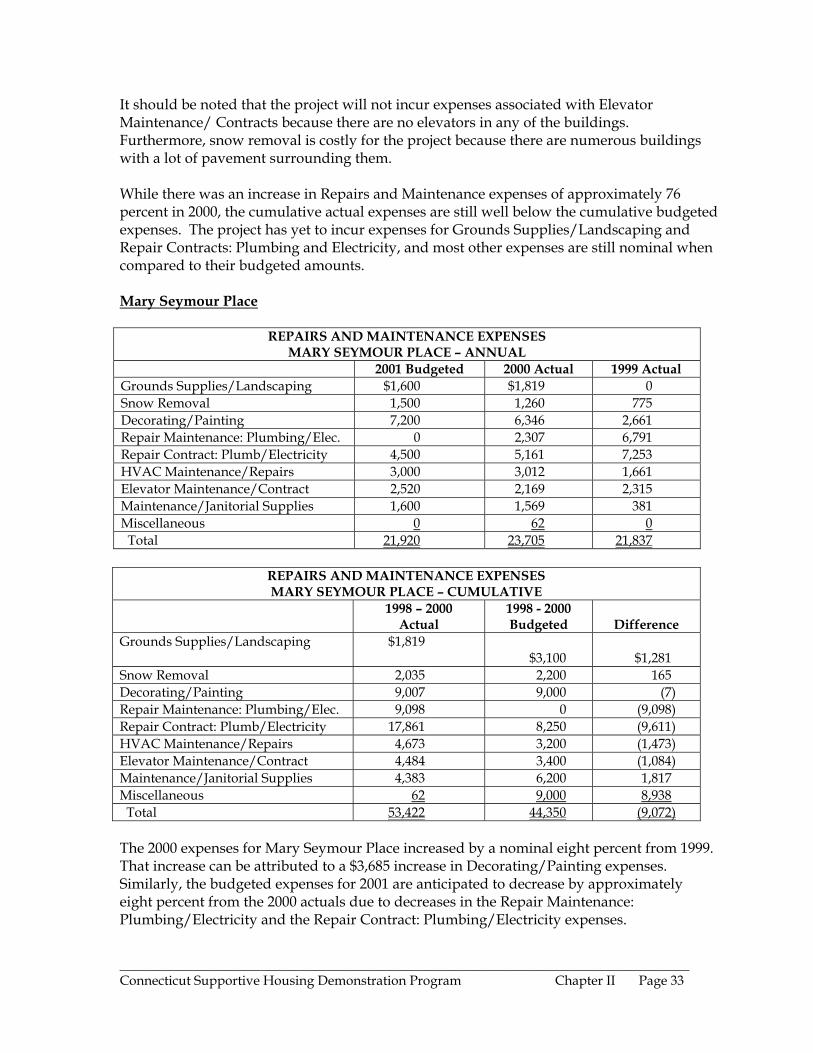
It should be noted that the project will not incur expenses associated with Elevator Maintenance/ Contracts because there are no elevators in any of the buildings. Furthermore, snow removal is costly for the project because there are numerous buildings with a lot of pavement surrounding them. While there was an increase in Repairs and Maintenance expenses of approximately 76 percent in 2000, the cumulative actual expenses are still well below the cumulative budgeted expenses. The project has yet to incur expenses for Grounds Supplies/Landscaping and Repair Contracts: Plumbing and Electricity, and most other expenses are still nominal when compared to their budgeted amounts. Mary Seymour Place
REPAIRS AND MAINTENANCE EXPENSES MARY SEYMOUR PLACE – ANNUAL
2001 Budgeted 2000 Actual 1999 Actual Grounds Supplies/Landscaping $1,600 $1,819 0 Snow Removal 1,500 1,260 775 Decorating/Painting 7,200 6,346 2,661 Repair Maintenance: Plumbing/Elec. 0 2,307 6,791 Repair Contract: Plumb/Electricity 4,500 5,161 7,253 HVAC Maintenance/Repairs 3,000 3,012 1,661 Elevator Maintenance/Contract 2,520 2,169 2,315 Maintenance/Janitorial Supplies 1,600 1,569 381 Miscellaneous 0 62 0 Total 21,920 23,705 21,837
REPAIRS AND MAINTENANCE EXPENSES MARY SEYMOUR PLACE – CUMULATIVE
1998 – 2000 Actual
1998 - 2000 Budgeted
Difference
Grounds Supplies/Landscaping $1,819 $3,100
$1,281
Snow Removal 2,035 2,200 165 Decorating/Painting 9,007 9,000 (7) Repair Maintenance: Plumbing/Elec. 9,098 0 (9,098) Repair Contract: Plumb/Electricity 17,861 8,250 (9,611) HVAC Maintenance/Repairs 4,673 3,200 (1,473) Elevator Maintenance/Contract 4,484 3,400 (1,084) Maintenance/Janitorial Supplies 4,383 6,200 1,817 Miscellaneous 62 9,000 8,938 Total 53,422 44,350 (9,072) The 2000 expenses for Mary Seymour Place increased by a nominal eight percent from 1999. That increase can be attributed to a $3,685 increase in Decorating/Painting expenses. Similarly, the budgeted expenses for 2001 are anticipated to decrease by approximately eight percent from the 2000 actuals due to decreases in the Repair Maintenance: Plumbing/Electricity and the Repair Contract: Plumbing/Electricity expenses.
_____________________________________________________________________________________ Connecticut Supportive Housing Demonstration Program Chapter II Page 33
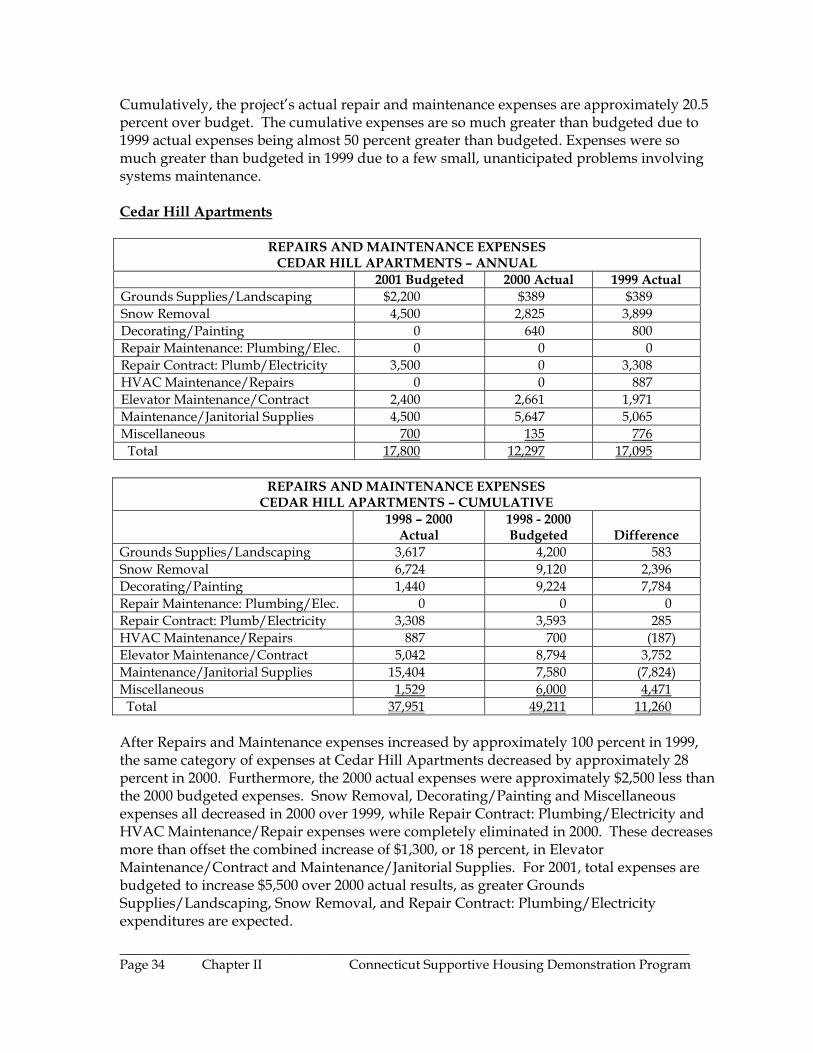
Cumulatively, the project’s actual repair and maintenance expenses are approximately 20.5 percent over budget. The cumulative expenses are so much greater than budgeted due to 1999 actual expenses being almost 50 percent greater than budgeted. Expenses were so much greater than budgeted in 1999 due to a few small, unanticipated problems involving systems maintenance. Cedar Hill Apartments
REPAIRS AND MAINTENANCE EXPENSES CEDAR HILL APARTMENTS – ANNUAL
2001 Budgeted 2000 Actual 1999 Actual Grounds Supplies/Landscaping $2,200 $389 $389 Snow Removal 4,500 2,825 3,899 Decorating/Painting 0 640 800 Repair Maintenance: Plumbing/Elec. 0 0 0 Repair Contract: Plumb/Electricity 3,500 0 3,308 HVAC Maintenance/Repairs 0 0 887 Elevator Maintenance/Contract 2,400 2,661 1,971 Maintenance/Janitorial Supplies 4,500 5,647 5,065 Miscellaneous 700 135 776 Total 17,800 12,297 17,095
REPAIRS AND MAINTENANCE EXPENSES CEDAR HILL APARTMENTS – CUMULATIVE
1998 – 2000 Actual
1998 - 2000 Budgeted
Difference
Grounds Supplies/Landscaping 3,617 4,200 583 Snow Removal 6,724 9,120 2,396 Decorating/Painting 1,440 9,224 7,784 Repair Maintenance: Plumbing/Elec. 0 0 0 Repair Contract: Plumb/Electricity 3,308 3,593 285 HVAC Maintenance/Repairs 887 700 (187) Elevator Maintenance/Contract 5,042 8,794 3,752 Maintenance/Janitorial Supplies 15,404 7,580 (7,824) Miscellaneous 1,529 6,000 4,471 Total 37,951 49,211 11,260 After Repairs and Maintenance expenses increased by approximately 100 percent in 1999, the same category of expenses at Cedar Hill Apartments decreased by approximately 28 percent in 2000. Furthermore, the 2000 actual expenses were approximately $2,500 less than the 2000 budgeted expenses. Snow Removal, Decorating/Painting and Miscellaneous expenses all decreased in 2000 over 1999, while Repair Contract: Plumbing/Electricity and HVAC Maintenance/Repair expenses were completely eliminated in 2000. These decreases more than offset the combined increase of $1,300, or 18 percent, in Elevator Maintenance/Contract and Maintenance/Janitorial Supplies. For 2001, total expenses are budgeted to increase $5,500 over 2000 actual results, as greater Grounds Supplies/Landscaping, Snow Removal, and Repair Contract: Plumbing/Electricity expenditures are expected.
_____________________________________________________________________________________ Page 34 Chapter II Connecticut Supportive Housing Demonstration Program
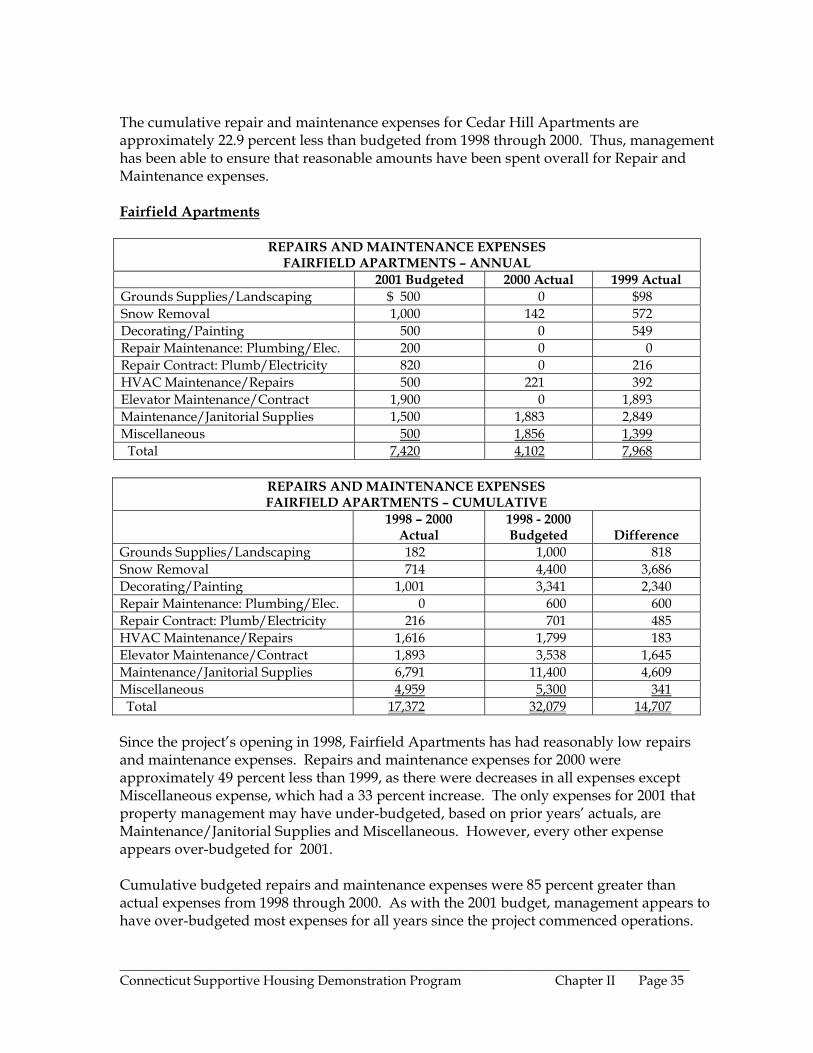
The cumulative repair and maintenance expenses for Cedar Hill Apartments are approximately 22.9 percent less than budgeted from 1998 through 2000. Thus, management has been able to ensure that reasonable amounts have been spent overall for Repair and Maintenance expenses. Fairfield Apartments
REPAIRS AND MAINTENANCE EXPENSES FAIRFIELD APARTMENTS – ANNUAL
2001 Budgeted 2000 Actual 1999 Actual Grounds Supplies/Landscaping $ 500 0 $98 Snow Removal 1,000 142 572 Decorating/Painting 500 0 549 Repair Maintenance: Plumbing/Elec. 200 0 0 Repair Contract: Plumb/Electricity 820 0 216 HVAC Maintenance/Repairs 500 221 392 Elevator Maintenance/Contract 1,900 0 1,893 Maintenance/Janitorial Supplies 1,500 1,883 2,849 Miscellaneous 500 1,856 1,399 Total 7,420 4,102 7,968
REPAIRS AND MAINTENANCE EXPENSES FAIRFIELD APARTMENTS – CUMULATIVE
1998 – 2000 Actual
1998 - 2000 Budgeted
Difference
Grounds Supplies/Landscaping 182 1,000 818 Snow Removal 714 4,400 3,686 Decorating/Painting 1,001 3,341 2,340 Repair Maintenance: Plumbing/Elec. 0 600 600 Repair Contract: Plumb/Electricity 216 701 485 HVAC Maintenance/Repairs 1,616 1,799 183 Elevator Maintenance/Contract 1,893 3,538 1,645 Maintenance/Janitorial Supplies 6,791 11,400 4,609 Miscellaneous 4,959 5,300 341 Total 17,372 32,079 14,707 Since the project’s opening in 1998, Fairfield Apartments has had reasonably low repairs and maintenance expenses. Repairs and maintenance expenses for 2000 were approximately 49 percent less than 1999, as there were decreases in all expenses except Miscellaneous expense, which had a 33 percent increase. The only expenses for 2001 that property management may have under-budgeted, based on prior years’ actuals, are Maintenance/Janitorial Supplies and Miscellaneous. However, every other expense appears over-budgeted for 2001. Cumulative budgeted repairs and maintenance expenses were 85 percent greater than actual expenses from 1998 through 2000. As with the 2001 budget, management appears to have over-budgeted most expenses for all years since the project commenced operations.
_____________________________________________________________________________________ Connecticut Supportive Housing Demonstration Program Chapter II Page 35
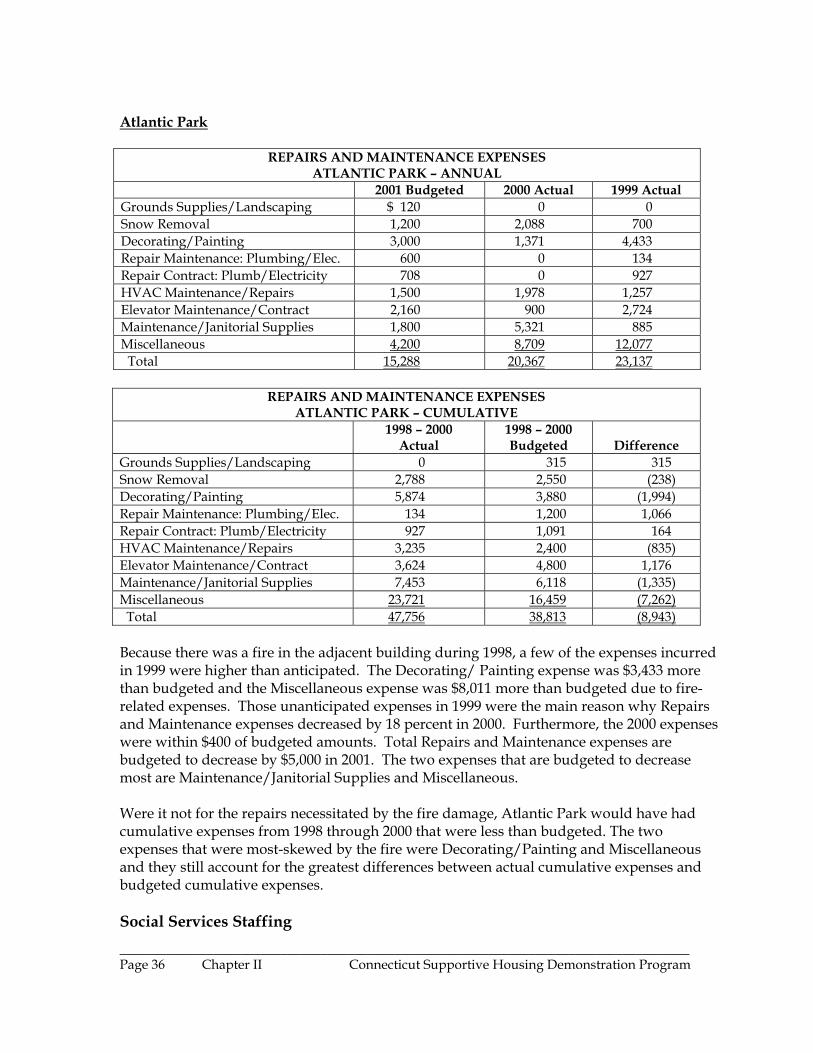
Atlantic Park
REPAIRS AND MAINTENANCE EXPENSES ATLANTIC PARK – ANNUAL
2001 Budgeted 2000 Actual 1999 Actual Grounds Supplies/Landscaping $ 120 0 0 Snow Removal 1,200 2,088 700 Decorating/Painting 3,000 1,371 4,433 Repair Maintenance: Plumbing/Elec. 600 0 134 Repair Contract: Plumb/Electricity 708 0 927 HVAC Maintenance/Repairs 1,500 1,978 1,257 Elevator Maintenance/Contract 2,160 900 2,724 Maintenance/Janitorial Supplies 1,800 5,321 885 Miscellaneous 4,200 8,709 12,077 Total 15,288 20,367 23,137
REPAIRS AND MAINTENANCE EXPENSES ATLANTIC PARK – CUMULATIVE
1998 – 2000 Actual
1998 – 2000 Budgeted
Difference
Grounds Supplies/Landscaping 0 315 315 Snow Removal 2,788 2,550 (238) Decorating/Painting 5,874 3,880 (1,994) Repair Maintenance: Plumbing/Elec. 134 1,200 1,066 Repair Contract: Plumb/Electricity 927 1,091 164 HVAC Maintenance/Repairs 3,235 2,400 (835) Elevator Maintenance/Contract 3,624 4,800 1,176 Maintenance/Janitorial Supplies 7,453 6,118 (1,335) Miscellaneous 23,721 16,459 (7,262) Total 47,756 38,813 (8,943) Because there was a fire in the adjacent building during 1998, a few of the expenses incurred in 1999 were higher than anticipated. The Decorating/ Painting expense was $3,433 more than budgeted and the Miscellaneous expense was $8,011 more than budgeted due to fire-related expenses. Those unanticipated expenses in 1999 were the main reason why Repairs and Maintenance expenses decreased by 18 percent in 2000. Furthermore, the 2000 expenses were within $400 of budgeted amounts. Total Repairs and Maintenance expenses are budgeted to decrease by $5,000 in 2001. The two expenses that are budgeted to decrease most are Maintenance/Janitorial Supplies and Miscellaneous. Were it not for the repairs necessitated by the fire damage, Atlantic Park would have had cumulative expenses from 1998 through 2000 that were less than budgeted. The two expenses that were most-skewed by the fire were Decorating/Painting and Miscellaneous and they still account for the greatest differences between actual cumulative expenses and budgeted cumulative expenses. Social Services Staffing _____________________________________________________________________________________ Page 36 Chapter II Connecticut Supportive Housing Demonstration Program
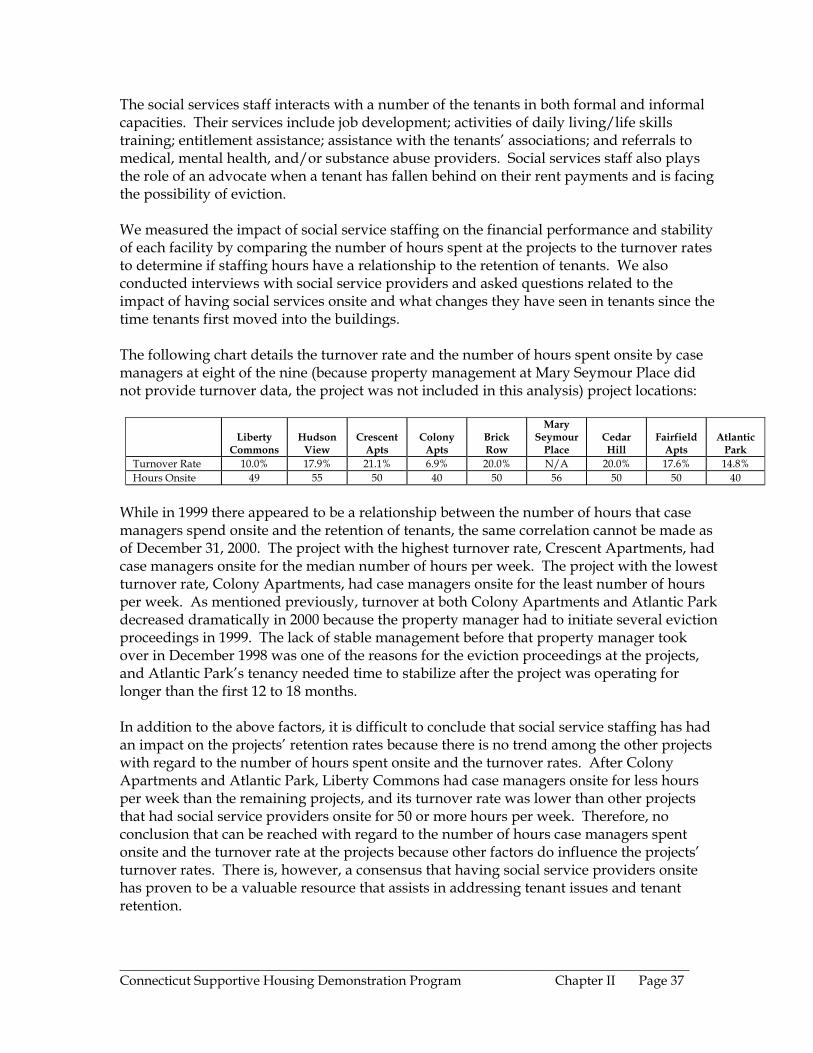
The social services staff interacts with a number of the tenants in both formal and informal capacities. Their services include job development; activities of daily living/life skills training; entitlement assistance; assistance with the tenants’ associations; and referrals to medical, mental health, and/or substance abuse providers. Social services staff also plays the role of an advocate when a tenant has fallen behind on their rent payments and is facing the possibility of eviction. We measured the impact of social service staffing on the financial performance and stability of each facility by comparing the number of hours spent at the projects to the turnover rates to determine if staffing hours have a relationship to the retention of tenants. We also conducted interviews with social service providers and asked questions related to the impact of having social services onsite and what changes they have seen in tenants since the time tenants first moved into the buildings. The following chart details the turnover rate and the number of hours spent onsite by case managers at eight of the nine (because property management at Mary Seymour Place did not provide turnover data, the project was not included in this analysis) project locations:
Liberty
Commons
Hudson
View
Crescent
Apts
Colony
Apts
Brick Row
Mary Seymour
Place
Cedar Hill
Fairfield
Apts
Atlantic
Park Turnover Rate 10.0% 17.9% 21.1% 6.9% 20.0% N/A 20.0% 17.6% 14.8% Hours Onsite 49 55 50 40 50 56 50 50 40
While in 1999 there appeared to be a relationship between the number of hours that case managers spend onsite and the retention of tenants, the same correlation cannot be made as of December 31, 2000. The project with the highest turnover rate, Crescent Apartments, had case managers onsite for the median number of hours per week. The project with the lowest turnover rate, Colony Apartments, had case managers onsite for the least number of hours per week. As mentioned previously, turnover at both Colony Apartments and Atlantic Park decreased dramatically in 2000 because the property manager had to initiate several eviction proceedings in 1999. The lack of stable management before that property manager took over in December 1998 was one of the reasons for the eviction proceedings at the projects, and Atlantic Park’s tenancy needed time to stabilize after the project was operating for longer than the first 12 to 18 months. In addition to the above factors, it is difficult to conclude that social service staffing has had an impact on the projects’ retention rates because there is no trend among the other projects with regard to the number of hours spent onsite and the turnover rates. After Colony Apartments and Atlantic Park, Liberty Commons had case managers onsite for less hours per week than the remaining projects, and its turnover rate was lower than other projects that had social service providers onsite for 50 or more hours per week. Therefore, no conclusion that can be reached with regard to the number of hours case managers spent onsite and the turnover rate at the projects because other factors do influence the projects’ turnover rates. There is, however, a consensus that having social service providers onsite has proven to be a valuable resource that assists in addressing tenant issues and tenant retention.
_____________________________________________________________________________________ Connecticut Supportive Housing Demonstration Program Chapter II Page 37
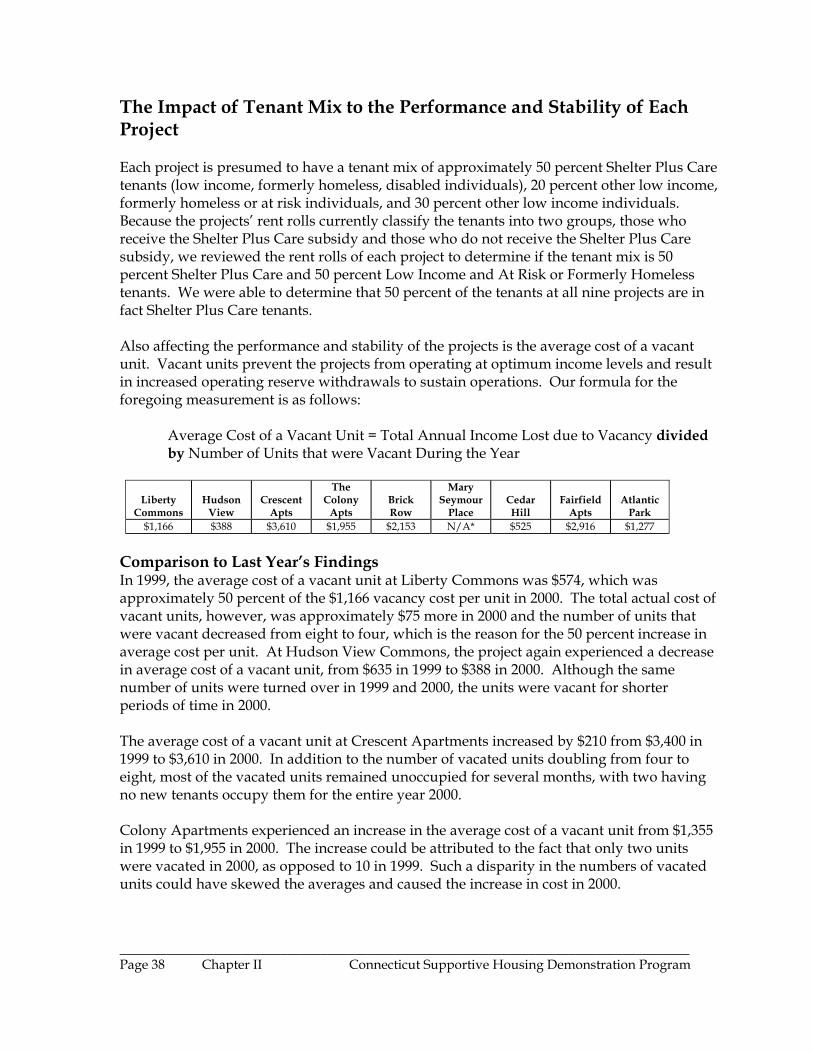
The Impact of Tenant Mix to the Performance and Stability of Each Project Each project is presumed to have a tenant mix of approximately 50 percent Shelter Plus Care tenants (low income, formerly homeless, disabled individuals), 20 percent other low income, formerly homeless or at risk individuals, and 30 percent other low income individuals. Because the projects’ rent rolls currently classify the tenants into two groups, those who receive the Shelter Plus Care subsidy and those who do not receive the Shelter Plus Care subsidy, we reviewed the rent rolls of each project to determine if the tenant mix is 50 percent Shelter Plus Care and 50 percent Low Income and At Risk or Formerly Homeless tenants. We were able to determine that 50 percent of the tenants at all nine projects are in fact Shelter Plus Care tenants. Also affecting the performance and stability of the projects is the average cost of a vacant unit. Vacant units prevent the projects from operating at optimum income levels and result in increased operating reserve withdrawals to sustain operations. Our formula for the foregoing measurement is as follows:
Average Cost of a Vacant Unit = Total Annual Income Lost due to Vacancy divided by Number of Units that were Vacant During the Year
Liberty Commons
Hudson
View
Crescent
Apts
The Colony
Apts
Brick Row
Mary Seymour
Place
Cedar Hill
Fairfield
Apts
Atlantic
Park $1,166 $388 $3,610 $1,955 $2,153 N/A* $525 $2,916 $1,277
Comparison to Last Year’s Findings In 1999, the average cost of a vacant unit at Liberty Commons was $574, which was approximately 50 percent of the $1,166 vacancy cost per unit in 2000. The total actual cost of vacant units, however, was approximately $75 more in 2000 and the number of units that were vacant decreased from eight to four, which is the reason for the 50 percent increase in average cost per unit. At Hudson View Commons, the project again experienced a decrease in average cost of a vacant unit, from $635 in 1999 to $388 in 2000. Although the same number of units were turned over in 1999 and 2000, the units were vacant for shorter periods of time in 2000. The average cost of a vacant unit at Crescent Apartments increased by $210 from $3,400 in 1999 to $3,610 in 2000. In addition to the number of vacated units doubling from four to eight, most of the vacated units remained unoccupied for several months, with two having no new tenants occupy them for the entire year 2000. Colony Apartments experienced an increase in the average cost of a vacant unit from $1,355 in 1999 to $1,955 in 2000. The increase could be attributed to the fact that only two units were vacated in 2000, as opposed to 10 in 1999. Such a disparity in the numbers of vacated units could have skewed the averages and caused the increase in cost in 2000.
_____________________________________________________________________________________ Page 38 Chapter II Connecticut Supportive Housing Demonstration Program
At Brick Row Apartments, the average cost of a vacant unit was $2,153 in 2000, as compared to $1,109 in 1999. The increase in average costs is due to units remaining vacant longer in 2000. Average costs for a vacant unit at Cedar Hill decreased from $977 in 1999 to $525 in 2000. The decrease at Cedar Hill meant that the average cost of a vacant unit was less than one month’s rent because the units did not remain vacant for more a month or longer. In 2000, Fairfield Apartments and Atlantic Park both experienced increases in average costs of vacant units. Fairfield Apartments experienced an increase from $2,556 to $2,916 and Atlantic Park’s average costs increased from $868 to $1,277. As at Colony Apartments, there was a disparity in the number of units vacated from 1999 through 2000 at both Fairfield Apartments and Atlantic Park. The number of units vacated at Fairfield Apartments decreased from five to two, whereas Atlantic Park experienced an increase in vacancies from four to 10 units. Those disparities could have cause the average costs per vacant unit to be skewed, as the numbers from which the averages were derived were quite different in 2000 compared to 1999. * Because property management at Mary Seymour Place was unable to provide vacancy data, the project was not included in this analysis. Conclusions – Project Financial Stability Occupancy and Turnover Rates for Each Project As of December 31, 2000, the occupancy rates at each of the projects were high and only varied slightly. The lowest occupancy rate, 88.04 percent, was at Crescent Apartments. The highest occupancy rate, 99.43 percent, was at Colony Apartments. Of the eight projects included in this evaluation, five experienced increases in their occupancy rates since the last evaluation (Liberty Commons, Hudson View Commons, Colony Apartments, Cedar Hill Apartments, and Atlantic Park). The remaining three projects (Crescent Apartments, Brick Row, and Fairfield Apartments) experienced decreases in occupancy rates ranging from 1.63 to 6.24 percentage points. Decreases in the occupancy rates are attributable to property administration issues and apartments remaining vacant for extended periods of time. The 2000 turnover rates for the eight projects included in this year’s evaluation were again not as consistent as the projects’ occupancy rates. Colony Apartments, which had the highest occupancy rate, also had the lowest turnover rate at 6.9 percent. Crescent Apartments, with the lowest occupancy rate, had the highest turnover rate at 21.1 percent. Of the eight properties analyzed, five of the projects (Liberty Commons, Colony Apartments, Brick Row, Cedar Hill Apartments, and Atlantic Park) experienced decreases in turnover rates. Hudson View Commons had a turnover rate equal to its 1999 rate and Crescent Apartments and Fairfield Apartments experienced increases of 10.6 and 8.8 percentage points, respectively, in their turnover rates. Units turned over for reasons ranging from moving to other housing because they considered supportive housing to be a transitional living arrangement, to evictions for non-payment of rent or other lease violations, to death of the tenant.
_____________________________________________________________________________________ Connecticut Supportive Housing Demonstration Program Chapter II Page 39
The Effect of the Terms of the Subsidies on the Long Term Feasibility of the Projects All of the projects receive one subsidy, Shelter Plus Care, for a term of five or 10 years. If any of the projects are able to receive the subsidy for a longer term than forecasted, then the term of the subsidy will have an effect on the long-term feasibility of the project. The terms of the projects’ subsidies have not changed since the projects were underwritten; therefore, the effect of the subsidy on the overall performance of the projects has remained unchanged. In 2000, other developments in Connecticut that had expiring Shelter Plus Care subsidies were able to renew their subsidies for annual terms. The Effect of the Future Capital Costs on the Long Term Feasibility of the Projects Although replacement reserves for all nine projects are adequately funded, none of the nine projects have as yet budgeted the use of those funds for specific capital improvements. Each project has had sufficient funds from the operating reserve withdrawals to cover to-date capital expenditures. The Effect of the Sponsors’ and Property Mangers’ Ability to Plan Future Capital Needs on the Long Term Feasibility of the Projects Property management determines if there is a need for capital projects. Once property management decides if a capital project is necessary, property management approaches the sponsor with bids that management has received from contractors. Before a project can be started, however, the project sponsor must get approval from CHFA to incur the capital expense. None of the nine projects have budgeted replacement reserve funds for potential capital projects and the to-date capital expenditures have not had an effect on what was projected to be sufficient replacement reserves. The Effect of Potential Changes in Future Funding on the Long Term Feasibility of the Projects The feasibility of the projects after the 15-year tax credit period expires is highly dependent upon the continued receipt of funding beyond tenant rent payments once the existing rent subsidies and operating reserves are exhausted. Greater future funding, in the form of an extension of the terms of the Shelter Plus Care subsidy or greater numbers of Section 8 certificates received by project tenants, may be sufficient to prevent the operating subsidy funds from being exhausted, as forecasted, by the end of the fifteenth year of the projects’ operations. Comparing the operating reserves to the original NEF projections, only two of the properties (Colony Apartments and Atlantic Park) are trailing their original operating reserve projections. Colony Apartments is behind its projections by $116,184 and Atlantic Park is behind by $92,079. Both of those projects also had operating reserve account balances that were significantly lower than NEF’s projections in 1999 due to the high costs of providing adequate security measures at the sites, which continued to be an issue
_____________________________________________________________________________________ Page 40 Chapter II Connecticut Supportive Housing Demonstration Program
through 2000. The other seven projects are ahead of NEF’s operating reserve account projections by amounts ranging from $10,278 to $232,412. Colony Apartments, Cedar Hill Apartments, and Fairfield Apartments are behind their replacement reserve projections by $737, $6,925, and $298, respectively. Colony Apartments and Fairfield Apartments are behind their replacement reserve projections due to the amount of interest that has been paid on those investment accounts. Cedar Hill is behind its replacement reserve projections due to the timing of the project commencing operations and contributing revenues to the replacement reserve account. The Consistency of Performance Based on Original Projection Assumptions for the Projects As of December 31, 2000, seven of the nine projects continued to exceed their original operating projections and assumptions on a cumulative basis. Colony Apartments and Atlantic Park were again behind their original cumulative operating projections, but by $57,011 and $38,052, respectively, as opposed to by $26,629 and $36,056 in 1999. For the projects that exceeded their cumulative projections and assumptions in 2000, the range of exceeded projections is from $21,412 for Brick Row to $95,064 for Mary Seymour Place. The Consistency of Performance Based on Future Trends The comparison of each project’s actual performance in 2000 to the 2001 operating budgets revealed that property management at all nine projects are creating relatively accurate annual budgets that reflect the needs of the projects, while remaining relatively consistent with prior years and inflation. The 2001 budgets were also compared to the original NEF projections to determine if future budgets are consistent with the original projections. The 2001 budget for each of the nine projects differs from the original projections due to various circumstances. Some projects have projected greater revenues because there are Section 8 subsidies contributing to their revenues or tenants are paying greater portions of their monthly rents than was originally anticipated. Expenses at the projects are typically budgeted to be greater than what was projected because projects have had to provide greater security measures than originally anticipated, along with other expenses that are greater than projected by NEF. While the security costs have been greater than expected and projected by NEF, those costs have not had adverse effects on the future operating reserves of seven of the nine projects and property management have been able to adjust those projects’ budgets to accommodate the increased security costs. Colony Apartments and Atlantic Park are the only two projects that are behind their cumulative NEF projections due to the amounts that have been withdrawn from their operating reserve accounts to fund security at their current levels. Although the project sponsor subsidized security costs at both sites using the projects’ DMHAS grants in 2000, additional sources of funds will necessary going forward so that the operating reserves will not be depleted faster than anticipated. Futhermore, for all of the projects, additional future resources will be needed to provide the projects with both adequate 24-hour security measures and adequate building services and amenities.
_____________________________________________________________________________________ Connecticut Supportive Housing Demonstration Program Chapter II Page 41
The Impact of Property Management on the Financial Performance and Stability of the Projects Turnover and Occupancy Rates An analysis of turnover rates has demonstrated that property management has been able to retain more of the tenants in 2000 than 1999. The turnover rates range from a low of 6.9 percent to a high of 21.1 percent, as opposed to a range of 5.9 percent to 37 percent in 1999. The analysis of the occupancy rates, which range from 88.04 percent to 99.43 percent, has demonstrated that even when a tenant vacates a unit, management is able to fill the unit in a short period of time. Bad Debt Analysis The inability to collect rents should not currently be considered a major issue for any of the nine projects because five of the nine properties have not had any bad debt expenses, nor have eight of the nine projects budgeted for the expense. Liberty Commons had $3,205 of bad debt expenses in 2000, Hudson View Commons had $5,025, Cedar Hill had $5,565, and Atlantic Park had $5,526. Although there is more bad debt reported in 2000 than other years, the expense is not at a level to be considered a major issue for any of the projects. Repairs and Maintenance Analysis An analysis of the 2001 budgeted Repairs and Maintenance expenses compared to the 2000 and 1999 actual expenses revealed that management at all nine of the projects have been budgeting reasonable amounts for said expenses. Although expenses at certain projects are budgeted to increase or decrease by considerable amounts in 2001, those increases/decreases are based on various issues that management has addressed. The actual cumulative Repairs and Maintenance expenses were compared to the budgeted cumulative expenses to determine whether the actual cumulative expenses were less than budgeted. The analysis disclosed that seven of the nine projects have cumulative Repairs and Maintenance expenses that are less than budgeted. Mary Seymour Place is over its cumulative budget by $9,072 and Atlantic Park is over its cumulative budget $8,943. The Impact of Social Services Staffing on the Financial Performance and Stability of the Projects One of the most important roles of the social service providers is to act as an advocate or interested party when a tenant is in danger of being evicted or facing legal action for nonpayment of rent or for violation of another lease provision. When a tenant is in danger of facing legal action that will affect their housing, social services will talk to the tenant to determine the reason(s) why the tenant is not abiding by the provisions of the lease. Social services will then attempt to work with the tenant and property management to remedy the issue. Although there seemed to be a relationship in 1999 between the number of hours that case managers spend onsite and the retention of tenants, the same correlation cannot be made as of December 31, 2000. The project with the highest turnover rate, Cedar Hill, had case managers onsite for the median number of hours per week. The project with the lowest
_____________________________________________________________________________________ Page 42 Chapter II Connecticut Supportive Housing Demonstration Program
_____________________________________________________________________________________ Connecticut Supportive Housing Demonstration Program Chapter II Page 43
turnover rate, Colony Apartments, had case managers onsite for the least number of hours per week. In spite of the fact that no conclusion can be reached with regard to the relationship among onsite social service providers, property management, and tenant stability, there is a consensus that having social service providers onsite has proven to be a valuable resource that assists in addressing tenant issues and tenant retention. The Impact of Tenant Mix to the Performance and Stability of Each Project An analysis of the projects’ rent rolls revealed that 50 percent of the tenants at the nine projects are in fact Shelter Plus Care tenants. An analysis of the average cost of a vacant unit revealed that the average cost of a vacant unit is equivalent to two to three months’ rent at four of the nine projects. The average cost of a vacant unit is as such at those locations because most of the units were vacant for periods of time greater than two to three months. Crescent Apartments and Fairfield Apartments continued to have much higher average costs of a vacant unit ($3,610 and $2,916, respectively) because units remained vacant for extended periods of time at those two projects in 2000. Four of the other projects had average costs of a vacant unit that were less than one month’s rent to slightly more than one month’s rent. Disparities in the average costs of a vacant unit were attributable to the period of time that a unit remained vacant and the number of units that were vacated. Final Thoughts Overall, the nine projects appear to be financially stable. Only two projects, Colony Apartments and Atlantic Park, are behind their operating reserve projections because those projects have incurred much greater security expenses than anticipated. The financial stability of those two projects should not, however, be impaired as long as future expenses are monitored and annual sources of revenue are sufficient to offset the higher expenses. As with prior years’ evaluations, the performance of parties who affect the financial stability of the nine projects has been commendable. Tenants are still not vacating the units in significant numbers, but when they do, the associated financial impact does not adversely affect the projects’ financial stability. As of December 31, 2000, all nine projects have performed satisfactorily and the parties involved in managing the success of the projects have continued to do so effectively while under tight budgetary constraints.
CHAPTER III IMPACT OF THE PROJECTS ON NEIGHBORING PROPERTY VALUES Arthur Andersen LLP
The objective of Chapter 3 was to measure and assess each project’s impact on neighboring property values. We reviewed sales of commercial buildings in each of the subject’s immediate areas, including apartment, retail, and office properties that occurred from 1994 to date. Sales data was considered instead of appraised values or property listings because the information is publicly available, reliable, and most indicative of fair market value, which is the value at which a property would change hands between a willing buyer and a willing seller. We attempted to identify instances where individual properties within each project’s neighborhood sold either both before and after the development of the project or both before and after the date of our first evaluation. Instances where a single property sold either both before and after the development of a project or both before and after the date of our first evaluation is considered a “paired sale.” These transactions are used as illustrations of the general trends in a given project’s neighborhood. It is important to note, however, that a number of factors contribute to the sales price of a property, including, but not limited to, conditions of sale, location, building size, building age and condition, and construction quality. This information is not meant to imply that the development of the project caused or alone was responsible for an increase or decrease in the market. It is to be used only as an indication of market trends. In addition to searching for and analyzing paired sales in a project’s neighborhood, we also analyzed the “non-paired” sales in the neighborhood. In comparison to a “paired sale,” as defined above, the sale of a building before or after development of a project (but not both) or since the date of our first evaluation and within the project’s neighborhood was considered a “non-paired” sale. From this data, we created one composite of sales that occurred before a project’s development, another composite of sales that occurred after development, and a third composite of sales since the first evaluation as of June 25, 1999. We then calculated the weighed average per square foot sales price of each composite to identify trends in sales prices in the neighborhood. As mentioned above, this information is not meant to imply that the development of a project caused or was solely responsible for an increase or decrease in the market. It is to be used only as an indication of market trends.
_______________________________________________________________________________________ Connecticut Supportive Housing Demonstration Program Chapter III Page 1
Liberty Commons 8 Liberty Street Middletown, Connecticut Liberty Commons was initially constructed in 1910. It is situated on a highly visible site in downtown Middletown, on the corner of Liberty and Main Streets. Historically, the property was a hotel and rooming house operating under the name, “The Arriwani Hotel.” The former owner of the property operated it as a rooming house and the property was financed by CHFA. In the mid-1990’s, the former owner was unable to meet its debts and CHFA foreclosed on its mortgage and took possession of the site. The building was vacant for approximately one year, until CHFA was able sell the property to Liberty Place Limited Partnership, which is now the current owner of record. Liberty Place Limited Partnership purchased the property on December 31, 1994. The development of the Partnership project consisted of substantial rehabilitation of the building, including the creation of 40 units and the redevelopment of the property’s street level retail space. The project was completed in June 1996. In order to assess the indirect impact of the project on surrounding property values, we reviewed property sales in the neighborhood. The project is located in the “North End” section of Middletown, which is considered to be the area north of Washington Street and west of Main Street. The project is located next to St. Vincent DePaul Place Soup Kitchen, which is operated by the same St. Vincent DePaul Place that provides the onsite social services at Liberty Commons. There is also a gas station and some retail properties in the property’s neighborhood. As of the date of our first evaluation, the Community Development Specialist for the town indicated that the development transformed the neighborhood by drawing new businesses, such as a coffeehouse, and apartments for artists. Although the property values may not have indicated the development’s effect, the clientele of the location and surrounding area improved dramatically. Since the date of the first evaluation, the project has appeared to have had a continued positive effect on the neighborhood. For the purposes of this analysis, we considered property sales located on Grand, High, Liberty, Lincoln, Main, Pearl and Washington Streets in proximity to the subject. We identified two properties that were sold both before and after the development of the subject property. The increase in the value of these two properties, expressed in terms of a compound annual growth rate, was 5.7 percent and 9.6 percent over the prior sale prices. We also identified a third property that sold twice since the project was developed. That property experienced a compound annual growth rate of –0.9 percent, as it sold for $75,000 in March of 1998, then again for $73,000 in May of 2001. We also calculated the weighted average price per square foot per year of sales in the neighborhood defined above. For this analysis, we identified seven transfers of properties in the defined neighborhood prior to the development of the project from January 1, 1994 through May 24, 1996. These seven sales transacted at a weighted average price per square foot of $12.75. We then identified 14 property sales in the defined neighborhood that occurred between July 15, 1996 and June 25, 1999 subsequent to the completion of the project and as of
________________________________________________________________________________________ Page 2 Chapter III Connecticut Supportive Housing Demonstration Program
the date of the first evaluation. These 14 sales encompassed 578,789 square feet that sold at a weighted average sales price per square foot of $22.56, a growth of $9.81 since May 24, 1996 and after the property became a supportive housing site. Since the sales analyzed in the first evaluation, property values have increased again by $9.20 from $22.56 in the first evaluation to $31.76 as of March 1, 2002. Therefore, the data presented implies that the market in the area surrounding Liberty Commons improved steadily from the time before the development of the project (starting March 14, 1994) to the most recent period ending March 1, 2002.
_______________________________________________________________________________________ Connecticut Supportive Housing Demonstration Program Chapter III Page 3
Hudson View Commons 525 Hudson Street Hartford, Connecticut Hudson View Commons was constructed during the 1960’s as an apartment complex. It is situated on 0.462 acres in the South Green neighborhood of Hartford. The project was rehabilitated in October 1996, and contains 28 efficiency and one-bedroom units. Until the mid-1990’s, the site containing Hudson View Commons, its parking lot, and the neighboring parcel was improved with four separate apartment buildings on the land. Broad-Park-Hudson Limited Partnership purchased the four buildings and the land as part of a package deal from Freddie Mac on December 30, 1994 for $166,000. The four buildings suffered from disrepair at the time of the purchase. The sponsor decided to keep both the building that is now Hudson View Commons and the adjacent building. The two other buildings were sold to the neighboring owner and both of those buildings, along with the other building kept by the sponsor, were demolished and the land was developed into parking lots. Broad Park kept the building that was rehabilitated into Hudson View Commons because the number of units and the layout most closely resembled what the sponsor had planned for the project. Furthermore, the remaining building had an elevator and was the building that came closest to complying with the American with Disabilities Act. In order to assess the indirect impact of the project on surrounding property values, we reviewed property sales in the neighborhood. The project is located within the South Green section of Hartford. The majority of the properties in the neighborhood are mixed residential and commercial use. Hartford Hospital, a State office building, and another low-income housing development are located within a three-block radius of the project. The State of Connecticut recently purchased another building in the neighborhood, which it will renovate for its own use. In assessing the impact of the project on neighboring property values, we reviewed recent sales in the vicinity of the subject property. For the purposes of this analysis, we considered property sales located on Hudson, Jefferson, Park, and Seymour Streets in proximity to the subject. We identified two properties that were transferred both before and after the development of the subject property. One of the properties experienced a compound annual growth rate of –4.7 percent as it sold for $531,000 on May 2, 1994, then again for $410,000 on October 5, 1999. The second property’s compound annual growth rate was 5.0 percent because it sold for $75,000 on November 15, 1995, and again for $97,000 on March 9, 2001. A third property sold twice after the development of the project and it experienced an annual compound growth rate of 29.6 percent as it sold for $65,000 on September 15, 1997 and then again for $130,000 on May 18, 2000. We also calculated the weighted average price per square foot of sales in the neighborhood defined above. We identified nine transfers of properties in the neighborhood of the subject property prior to the development of the project. These nine sales transacted at a weighted average price per square foot of $11.10. We then identified six property sales in the defined
________________________________________________________________________________________ Page 4 Chapter III Connecticut Supportive Housing Demonstration Program
neighborhood the occurred after the development of the project through June 25, 1999, the date of the first evaluation. The weighted average price per square foot of those six sales was $10.25. Finally, we identified 11 sales since our first evaluation through March 1, 2002. Those 11 sales encompassed 178,885 square feet that sold at a weighted average sales price per square foot of $15.51, a growth of $5.26 since the date of our first evaluation. While the data implies that market values in Hudson View Commons’ neighborhood decreased from the period starting on January 1, 1994 through the date of the first evaluation, it also implies that the market values improved from the date of the first evaluation through March 1, 2002.
_______________________________________________________________________________________ Connecticut Supportive Housing Demonstration Program Chapter III Page 5
Crescent Apartments 431 Washington Avenue Bridgeport, Connecticut Crescent Apartments is an historic building initially constructed in 1889 as individually owned upscale rowhouses. The project is situated on 0.740 acres in Bridgeport’s “Hollow” neighborhood. At the turn of the century, the property was considered to be the premier address in Bridgeport. The building is listed on the National Register of Historic Places. Prior to its renovation, the property had been vacant for a number of years. As a result of the vacancy, the property had been stripped, burned, and overgrown. The property was acquired by Crescent Limited Partnership in December 1995 for $159,914. During the renovation, careful attention was paid to restoring the building to its original splendor. For example, the exterior doors are all mahogany and the distinctive copper “onion domes” were replaced with fiberglass replicas. The project was completed in December 1996, and now contains 38 efficiency and one-bedroom units. In order to assess the indirect impact of the project on surrounding property values, we reviewed property sales in the neighborhood. As already mentioned, the project is located within the Hollow section of Bridgeport. The neighborhood consists predominantly of apartment buildings. Route 8, a major thoroughfare, runs alongside the neighborhood. In assessing the impact of the project on neighboring property values, we reviewed recent sales in the vicinity of the subject property. For the purposes of this analysis, we considered property sales located on Washington Avenue, Courtland, Pequonnock, and Calhoun Place in proximity to the subject. We did not identify any properties that were transferred both before and after the development of the subject property. We calculated the weighted average price per square foot of sales in the neighborhood defined above. We identified three transfers of properties in the subject property’s neighborhood prior to the development of the project. These three sales transacted at a weighted average price per square foot of $6.68. We identified two suitable property sales in the defined neighborhood that occurred between December 1996 and February 2, 1998, subsequent to the project’s completion. The two properties sold at a weighted average sales price per square foot of $14.21, which is a $7.53 increase since the period of time before the project was developed. Since our first evaluation in June 1999, we identified two additional sales in the subject neighborhood as of March 1, 2002. The weighted average sales price per square foot for those two properties was $15.36, for an $8.68 per square foot increase in overall values since our first evaluation. While the data implies that the market did improve from the period starting on January 1, 1994 through March 1, 2002, it may not represent a sufficient sample size to permit reliance upon the conclusion.
________________________________________________________________________________________ Page 6 Chapter III Connecticut Supportive Housing Demonstration Program
The Colony Apartments 41 Ludlow Street Stamford, Connecticut The Colony Apartments is a building that was newly constructed for use as a low-income housing project. The property is situated in the South End neighborhood of Stamford. Ludlow Limited Partnership purchased the land on May 1, 1996 for $251,914. At the time of sale, the property consisted of two parcels. One parcel was improved with a vacant, dilapidated single family house. The other parcel was vacant land. Upon purchase, Ludlow Limited Partnership demolished the vacant house and consolidated the two parcels. The parcel now consists of a newly-constructed apartment building with 29 efficiency units. The project was completed in May 1997. In order to assess the indirect impact of the project on surrounding property values, we reviewed property sales in the neighborhood. The project is located within the South End neighborhood in Stamford. The majority of the properties in the neighborhood are of mixed residential and commercial use. Pitney Bowes’ headquarters, St. Luke’s LifeWorks, and its housing facilities for homeless individuals are located within a three-block radius of the project. In assessing the impact of the project on neighboring property values, we reviewed recent sales in the vicinity of the subject property. For the purposes of this analysis, we considered property sales located on Ludlow, Cedar, Pacific, and Woodland Streets in proximity to the subject property. We did not identify any properties that were transferred both before and after the development of the subject property. We calculated the weighted average price per square foot per year of sales in the neighborhood defined above. We identified four transfers of properties in the subject property’s neighborhood prior to the development of the project. These four sales transacted at a weighted average price per square foot of $34.24. We identified two suitable property sales in the defined neighborhood that occurred between January 14, 1998 and September 16, 1998 subsequent to the project’s completion. The two properties sold at a weighted average sales price per square foot of $47.67, which is a $13.43 increase since before the project was developed. Since June 25, 1999, the date of our first evaluation, we identified five additional sales in the subject neighborhood as of March 1, 2002. The weighted average sales price per square foot for those five properties was $45.71, for a $1.96 per square foot decrease in overall values since our first evaluation. While the data implies that the market did improve from the period starting on January 1, 1994 and ending as of our first evaluation and then declined from the date of our first evaluation through March 1, 2002, it may not represent a sufficient sample size to permit reliance upon the conclusion.
_______________________________________________________________________________________ Connecticut Supportive Housing Demonstration Program Chapter III Page 7
Brick Row Apartments 25 Vermont Drive Windham (Willimantic), Connecticut The Brick Row Apartments were initially constructed during the mid to late 19th century as housing for the City’s mill workers. The property is situated on 1.2 acres in Windham, which serves the greater Willimantic area. Most recently, the property was a row of dilapidated apartment buildings. The buildings were vacant immediately preceding Brick Row Limited Partnership’s purchase of the property in May of 1996 for $180,000. The redevelopment project consisted of the substantial rehabilitation of the former 1890’s mill housing. The rehabilitation was completed in October 1997 and the project consists of 30 one-bedroom and efficiency apartments with individual entrances. In order to assess the indirect impact of the project on surrounding property values, we reviewed property sales in its neighborhood in Windham. The property is located within an old mill neighborhood and across the street from multi-family homes. There are also railroad docks for the local businesses and a new building being constructed to house office space and apartments. In assessing the impact of the project on neighboring property values, we reviewed recent sales in the vicinity of the subject property. For the purposes of this analysis, we considered property sales located on Vermont Drive and Main, Tingley, and Windham Streets in proximity to the subject property. We identified one property that was transferred both before and after the development of the subject property and two that transferred twice after the project was completed. The property that sold both before and after the development of Brick Row Apartments experienced a compound growth rate per square foot of 66.5 percent as it sold for $30,000 on March 21, 1997 and again for $120,000 on December 9, 1999. One of the other two properties experienced a negative compound annual growth rate of 23.5 percent, as it sold for $312,000 on January 28, 2000, then again for $260,000 on October 2, 2000. Positive compound annual growth of 52.5 percent was the result for the other property that sold for $26,000 on September 8, 1998, then again for $89,900 on August 16, 2001. We also calculated the weighted average price per square foot per year of sales in the neighborhood defined above. We identified 15 transfers of properties in the neighborhood of the subject property prior to the development of the project. These 15 sales transacted at a weighted average price per square foot of $17.80. We identified five property sales in the defined neighborhood that occurred after the development of the project until the date of our first evaluation, which was June 25, 1999. Those sales were at a weighted average per square foot of $18.80. Furthermore, from the date of our first evaluation until March 1, 2002, there were 13 sales with a weighted average sales price of $30.67 per square foot. This value per square foot is significantly greater than the values of $17.80 and $18.80 per square foot before the development of the project and after the development as of the date of our first evaluation. Hence, the data implies that the market did improve from the period starting on January 1, 1994 and ending on March 1, 2002.
________________________________________________________________________________________ Page 8 Chapter III Connecticut Supportive Housing Demonstration Program
Mary Seymour Place 2197 Main Street Hartford, Connecticut Mary Seymour Place was constructed on a vacant parcel situated in the Capen Street neighborhood, a revitalization zone in Hartford’s North End. The subject property was a vacant parcel when MSP Housing Limited Partnership purchased the property and another vacant parcel of land on May 18, 1995 for $169,179. The development project consisted of new construction on the vacant parcel of land. The other parcel of vacant land that MSP Housing Limited Partnership purchased was paved, and serves as parking for people associated with the project. The project was completed in December 1997 and contains 30 one-bedroom apartments. The property is the jewel of the neighborhood and has won an architectural award. The neighborhood consists predominantly of apartment buildings, but there is another vacant lot on an adjacent corner. In order to assess the indirect impact of the project on surrounding property values, we reviewed property sales in the neighborhood. For the purposes of this analysis, we considered property sales located on Main, Capen, Crane, Sanford, and Elmer Streets in proximity to the subject property. We did not identify any properties that were transferred both before and after the development of the subject property. We did calculate the weighted average price per square foot per year of sales in the neighborhood defined above. We identified six transfers of properties in the neighborhood of the subject property prior to the development of the project. These six sales transacted at a weighted average price per square foot of $4.69. We then identified four property sales in the defined neighborhood that occurred between July 1, 1998 after the project was completed and June 25, 1999, the date of our first evaluation. Those four properties sold at a higher weighted average sales price per square foot of $13.13. From June 28, 1999 through March 1, 2002, we identified another five applicable sales of properties in the neighborhood. The weighted average sales price per foot increased by another $9.00 to $22.13. While the data implies that the market did steadily improve from the period starting on January 1, 1994 and ending on March 1, 2002, it may not represent a sufficient sample size to permit reliance upon the implied conclusion.
_______________________________________________________________________________________ Connecticut Supportive Housing Demonstration Program Chapter III Page 9
Cedar Hill Apartments 1465 State Street New Haven, Connecticut Cedar Hill Apartments was constructed on a parcel of land in the Cedar Hill neighborhood of New Haven. Most recently, the property was a Polish Club. Cedar Hill Apartments Limited Partnership purchased the property on December 12, 1996 for $175,000. At the date of purchase, the building on the parcel was seriously dilapidated. The development project consisted of demolishing the dilapidated building and constructing a 25-unit complex. The project was completed in December 1997 and contains 25 one-bedroom apartments. In order to assess the indirect impact of the project on surrounding property values we reviewed property sales in the neighborhood, which consists of multi-family houses, a factory next door, and undeveloped land. We reviewed recent sales in the vicinity of the subject property, including sales located on State, Ferry, Lyman, Rock, and Grace Streets. One property was identified that sold both before and after the development of Cedar Hill Apartments. The first time the property sold was on June 5, 1997 for $123,000. It sold again on August 17, 2001 for $200,000, for a compound annual growth rate of 12.1 percent. A second property sold three times since the project was developed, with two of those sales occurring after the date of our first evaluation. That property sold on October 25, 1999, May 3, 2001, and January 16, 2002 for $100,000, $37,000, and $125,000, respectively. It appears that the second sale on May 3, 2001 may not have been an arm’s length transaction, hence the very low sale price. If that second sale had not transpired, the compound annual growth rate would have been 10.5 percent from October 25, 1999 to January 16, 2002. We also calculated the weighted average price per square foot per year of sales in the neighborhood defined above. We identified 13 transfers of properties in the neighborhood of the subject property prior to the development of the project. These 13 sales transacted at a weighted average price per square foot of $15.39. We also identified four property sales in the defined neighborhood that occurred between March 25, 1998 and June 25, 1999, the date of our first evaluation. The weighted average sales price per square foot for those properties was $28.27. Since our first evaluation through March 1, 2002, we identified an additional 13 sales with a weighted average sales price of $31.50 per square foot. Therefore, the data implies that the market did steadily improve from the period starting on January 1, 1994 and ending on March 1, 2002.
________________________________________________________________________________________ Page 10 Chapter III Connecticut Supportive Housing Demonstration Program
The Fairfield Apartments 1062 Fairfield Avenue Bridgeport, Connecticut The Fairfield Apartments was newly constructed on a parcel of land situated in the West End neighborhood of Bridgeport. Most recently, the property was a vacant parcel of land. Bridgeport Supportive Housing Limited Partnership purchased the property on Month, Day, Year for $100,000. The project was completed in May 1998 and contains 34 one-bedroom apartments In order to assess the indirect impact of the project on surrounding property values, we reviewed property sales in the neighborhood. The property is located within the West End neighborhood of Bridgeport. The neighborhood consists of a newer multi-family housing project, a homeless shelter, and a former home used for commercial office space. The Town Assessor’s office indicated that the property is very well maintained and has had a positive impact on the neighborhood. In assessing the impact of the project on neighboring property values, we reviewed recent sales in the vicinity of the subject property. For the purposes of this analysis, we considered property sales located on Fairfield Avenue, Norman, Yale, and Freemont Streets in proximity to the subject property. We did not identify any properties that were transferred both before and after the development of the subject property. We calculated the weighted average price per square foot of sales in the neighborhood defined above. We identified sixteen transfers of properties in the subject property’s neighborhood prior to the development of the project. These sixteen sales transacted at a weighted average price per square foot of $39.00. We then identified two property sales in the defined neighborhood that occurred between May 1998 and October 30, 1998, subsequent to the project’s completion. The two properties sold at a weighted average sales price per square foot of $42.40, which is a $3.40 increase since the period of time before the project was developed. Since our first evaluation in June 1999, we identified twenty-three additional sales in the subject neighborhood as of March 1, 2002. The weighted average sales price per square foot for those twenty-three properties was $53.73, for a $14.73 per square foot increase in overall values since our first evaluation. Henceforth, the data implies that the market did improve from the period starting on January 1, 1994 through March 1, 2002.
_______________________________________________________________________________________ Connecticut Supportive Housing Demonstration Program Chapter III Page 11
Atlantic Park 658 Atlantic Street Stamford, Connecticut Atlantic Park’s development consisted of the substantial rehabilitation of two of four historic apartment buildings in the South End neighborhood. The four buildings are listed on the National Register of Historic Places. They initially served to house the workers at the adjacent industrial buildings (some now vacant). South End Atlantic Limited Partnership purchased two of the three buildings on November 22, 1996 for $473,474. They were not able to purchase the third building. Prior to the partnership’s purchase of the two buildings, the properties were used as apartment buildings. The project consisted of rehabilitation of the two buildings, which are now connected via a hallway on the first and second floors. The project was completed in March 1998 and contains 27 efficiency units. Since the completion of the project, of the two buildings that the sponsor was unable to acquire, the one adjacent to Atlantic Park was totally gutted by fire. The adjacent exterior wall of the subject property was slightly damaged by the fire. The owner of the third building intends to rehabilitate the property, consistent with the historical architecture of Atlantic Park. In order to assess the indirect impact of the project on surrounding property values, we reviewed property sales in the neighborhood. The property is located within the South End neighborhood of Stamford. The neighborhood consists predominately of dilapidated industrial buildings. For the purposes of this analysis, we considered property sales located on Atlantic and Henry Streets, and Rockland Place in proximity to the subject property. We identified five properties that were transferred both before and after the development of the subject property. The compound annual growth rate of these properties ranged from 12.2 percent to 27.9 percent over the prior sale prices. None of the five properties experienced negative compound annual growth rates. We also calculated the weighted average price per square foot per year of sales in the neighborhood defined above. We identified 13 transfers of properties in the neighborhood of the subject property prior to the development of the project. These 13 sales transacted at a weighted average price per square foot of $74.81. We then identified two property sales in the defined neighborhood that occurred between May 1, 1998 and April 28, 1999, subsequent to the project’s completion. These two sales had a weighted average sales price per square foot of $70.16. From June 25, 1999, the date of our first evaluation, through March 1, 2002, we identified eight relevant sales with a weighted average sales price per square foot of $77.69. While the data implies that the market experienced a slight decrease from the period starting on January 1, 1994 through April 28, 1999, it also implies that the market thereafter improved as of March 1, 2002.
________________________________________________________________________________________ Page 12 Chapter III Connecticut Supportive Housing Demonstration Program
_______________________________________________________________________________________ Connecticut Supportive Housing Demonstration Program Chapter III Page 13
Conclusion – Impact of the Projects on Neighboring Property Values The data collected to assess the impact of the projects on neighboring property values implied that the markets surrounding all but one of the projects improved from the date of our first evaluation, June 25, 1999, through March 1, 2002. Only the values of properties sold in Colony Apartments’ neighborhood in Stamford decreased during that time period. The decrease in values, however, was a nominal $1.96 weighted average price per square foot. The neighborhoods that experienced the most notable increases in property values since June 25, 1999 were those of Brick Row in Willimantic, which went from a weighted average price per square foot of $18.80 to $30.67 and Fairfield Apartments in Bridgeport, which went from a weighted average price per square foot of $42.40 to $53.73. The neighborhood surrounding Liberty Commons in Middletown experienced an increase from $22.56 to 31.76 in the weighted average price per square foot; that of Hudson View Commons in Hartford experienced an increase of $15.51 from $10.25 in the weighted average price per square foot; that of Crescent Apartments in Bridgeport increased from $14.21 to 15.36 in the weighted average price per square foot; that of Mary Seymour Place in Hartford increased from $13.13 to $22.13 in the weighted average price per square foot; that of Cedar Hill Apartments in New Haven increased from $28.27 to $31.50 in the weighted average price per square foot; and Atlantic Park’s neighborhood in Stamford experienced an increase of $77.61 from $70.16 in the weighted average price per square foot of the properties sold surrounding the project. From January 1, 1994 through March 1, 2002, values increased steadily in the neighborhoods surrounding Liberty Commons, Crescent Apartments, Brick Row, Mary Seymour Place, Cedar Hill Apartments, and Fairfield Apartments. Values in the neighborhoods surrounding Hudson View Commons and Atlantic Park had originally decreased from January 1, 1994 through June 25, 1999, but then the values in those two neighborhoods increased from of June 26, 1999 through March 1, 2002. The neighborhoods encompassing Liberty Commons, Hudson View Commons, Brick Row, Cedar Hill Apartments, and Atlantic Park all had properties sell both since January 1, 1994, then again as of March 1, 2002. Almost all of the properties in the five neighborhoods were purchased for higher prices once they sold the second time, which is a further implication that the neighboring property values increased since the projects were completed.
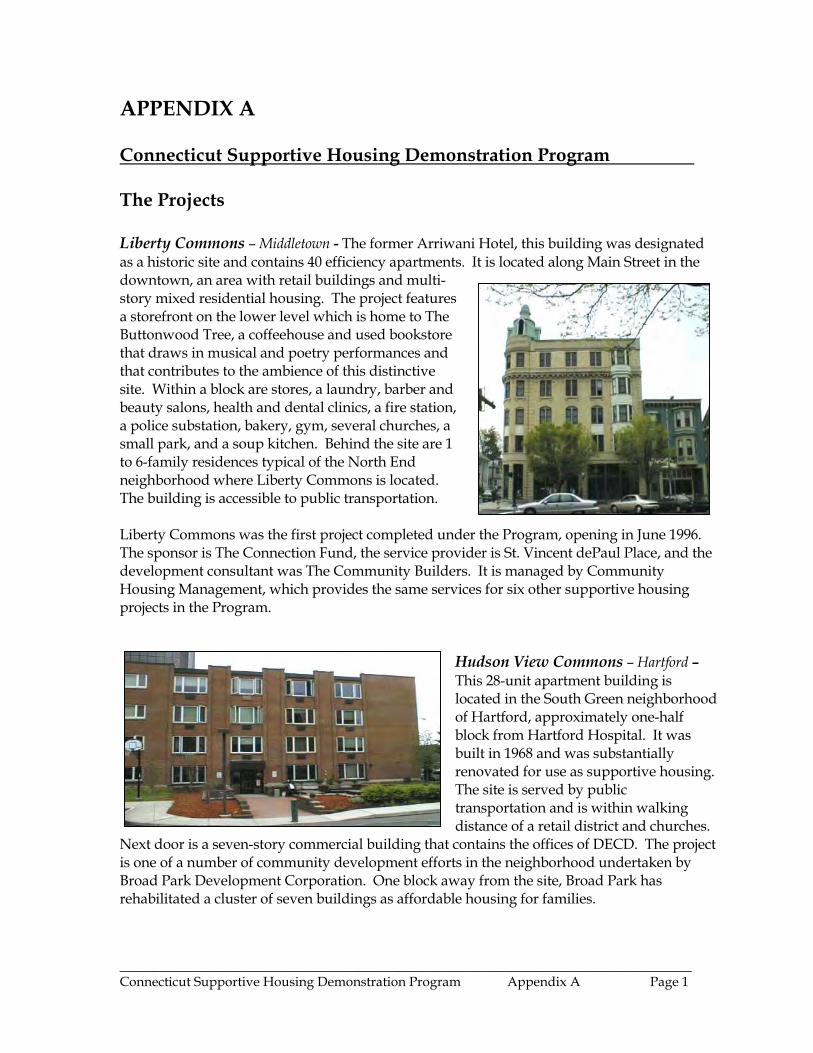
APPENDIX A Connecticut Supportive Housing Demonstration Program The Projects Liberty Commons – Middletown - The former Arriwani Hotel, this building was designated as a historic site and contains 40 efficiency apartments. It is located along Main Street in the downtown, an area with retail buildings and multi-story mixed residential housing. The project features a storefront on the lower level which is home to The Buttonwood Tree, a coffeehouse and used bookstore that draws in musical and poetry performances and that contributes to the ambience of this distinctive site. Within a block are stores, a laundry, barber and beauty salons, health and dental clinics, a fire station, a police substation, bakery, gym, several churches, a small park, and a soup kitchen. Behind the site are 1 to 6-family residences typical of the North End neighborhood where Liberty Commons is located. The building is accessible to public transportation. Liberty Commons was the first project completed under the Program, opening in June 1996. The sponsor is The Connection Fund, the service provider is St. Vincent dePaul Place, and the development consultant was The Community Builders. It is managed by Community Housing Management, which provides the same services for six other supportive housing projects in the Program.
Hudson View Commons – Hartford – This 28-unit apartment building is located in the South Green neighborhood of Hartford, approximately one-half block from Hartford Hospital. It was built in 1968 and was substantially renovated for use as supportive housing. The site is served by public transportation and is within walking distance of a retail district and churches.
Next door is a seven-story commercial building that contains the offices of DECD. The project is one of a number of community development efforts in the neighborhood undertaken by Broad Park Development Corporation. One block away from the site, Broad Park has rehabilitated a cluster of seven buildings as affordable housing for families.
______________________________________________________________________________________ Connecticut Supportive Housing Demonstration Program Appendix A Page 1
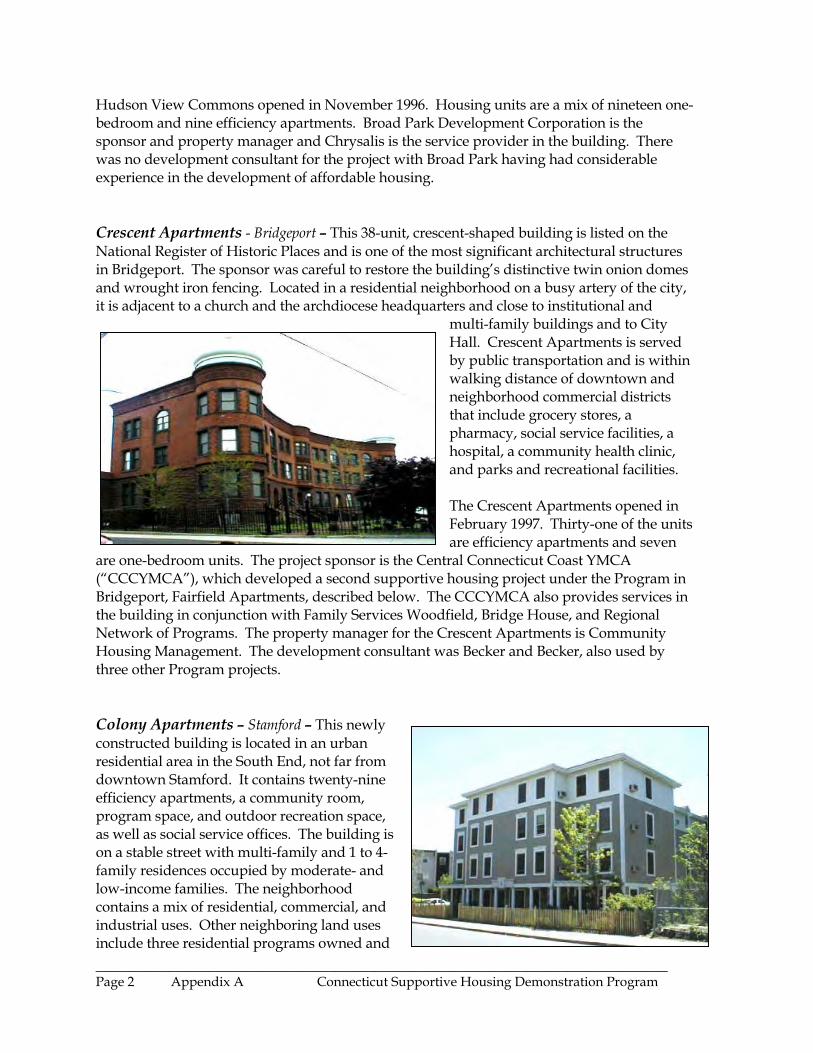
Hudson View Commons opened in November 1996. Housing units are a mix of nineteen one-bedroom and nine efficiency apartments. Broad Park Development Corporation is the sponsor and property manager and Chrysalis is the service provider in the building. There was no development consultant for the project with Broad Park having had considerable experience in the development of affordable housing. Crescent Apartments - Bridgeport – This 38-unit, crescent-shaped building is listed on the National Register of Historic Places and is one of the most significant architectural structures in Bridgeport. The sponsor was careful to restore the building’s distinctive twin onion domes and wrought iron fencing. Located in a residential neighborhood on a busy artery of the city, it is adjacent to a church and the archdiocese headquarters and close to institutional and
multi-family buildings and to City Hall. Crescent Apartments is served by public transportation and is within walking distance of downtown and neighborhood commercial districts that include grocery stores, a pharmacy, social service facilities, a hospital, a community health clinic, and parks and recreational facilities. The Crescent Apartments opened in February 1997. Thirty-one of the units are efficiency apartments and seven
are one-bedroom units. The project sponsor is the Central Connecticut Coast YMCA (“CCCYMCA”), which developed a second supportive housing project under the Program in Bridgeport, Fairfield Apartments, described below. The CCCYMCA also provides services in the building in conjunction with Family Services Woodfield, Bridge House, and Regional Network of Programs. The property manager for the Crescent Apartments is Community Housing Management. The development consultant was Becker and Becker, also used by three other Program projects. Colony Apartments – Stamford – This newly constructed building is located in an urban residential area in the South End, not far from downtown Stamford. It contains twenty-nine efficiency apartments, a community room, program space, and outdoor recreation space, as well as social service offices. The building is on a stable street with multi-family and 1 to 4-family residences occupied by moderate- and low-income families. The neighborhood contains a mix of residential, commercial, and industrial uses. Other neighboring land uses include three residential programs owned and ______________________________________________________________________________________ Page 2 Appendix A Connecticut Supportive Housing Demonstration Program
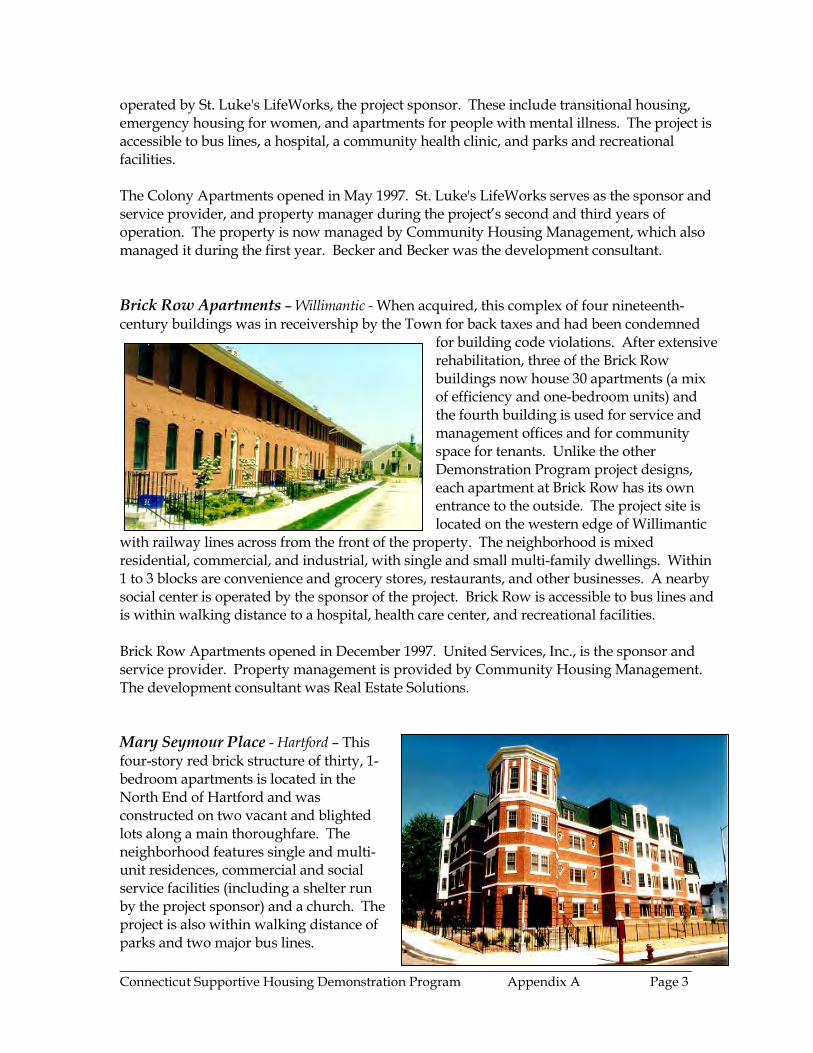
operated by St. Luke's LifeWorks, the project sponsor. These include transitional housing, emergency housing for women, and apartments for people with mental illness. The project is accessible to bus lines, a hospital, a community health clinic, and parks and recreational facilities. The Colony Apartments opened in May 1997. St. Luke's LifeWorks serves as the sponsor and service provider, and property manager during the project’s second and third years of operation. The property is now managed by Community Housing Management, which also managed it during the first year. Becker and Becker was the development consultant. Brick Row Apartments – Willimantic - When acquired, this complex of four nineteenth-century buildings was in receivership by the Town for back taxes and had been condemned
for building code violations. After extensive rehabilitation, three of the Brick Row buildings now house 30 apartments (a mix of efficiency and one-bedroom units) and the fourth building is used for service and management offices and for community space for tenants. Unlike the other Demonstration Program project designs, each apartment at Brick Row has its own entrance to the outside. The project site is located on the western edge of Willimantic
with railway lines across from the front of the property. The neighborhood is mixed residential, commercial, and industrial, with single and small multi-family dwellings. Within 1 to 3 blocks are convenience and grocery stores, restaurants, and other businesses. A nearby social center is operated by the sponsor of the project. Brick Row is accessible to bus lines and is within walking distance to a hospital, health care center, and recreational facilities. Brick Row Apartments opened in December 1997. United Services, Inc., is the sponsor and service provider. Property management is provided by Community Housing Management. The development consultant was Real Estate Solutions. Mary Seymour Place - Hartford – This four-story red brick structure of thirty, 1-bedroom apartments is located in the North End of Hartford and was constructed on two vacant and blighted lots along a main thoroughfare. The neighborhood features single and multi-unit residences, commercial and social service facilities (including a shelter run by the project sponsor) and a church. The project is also within walking distance of parks and two major bus lines. ______________________________________________________________________________________ Connecticut Supportive Housing Demonstration Program Appendix A Page 3
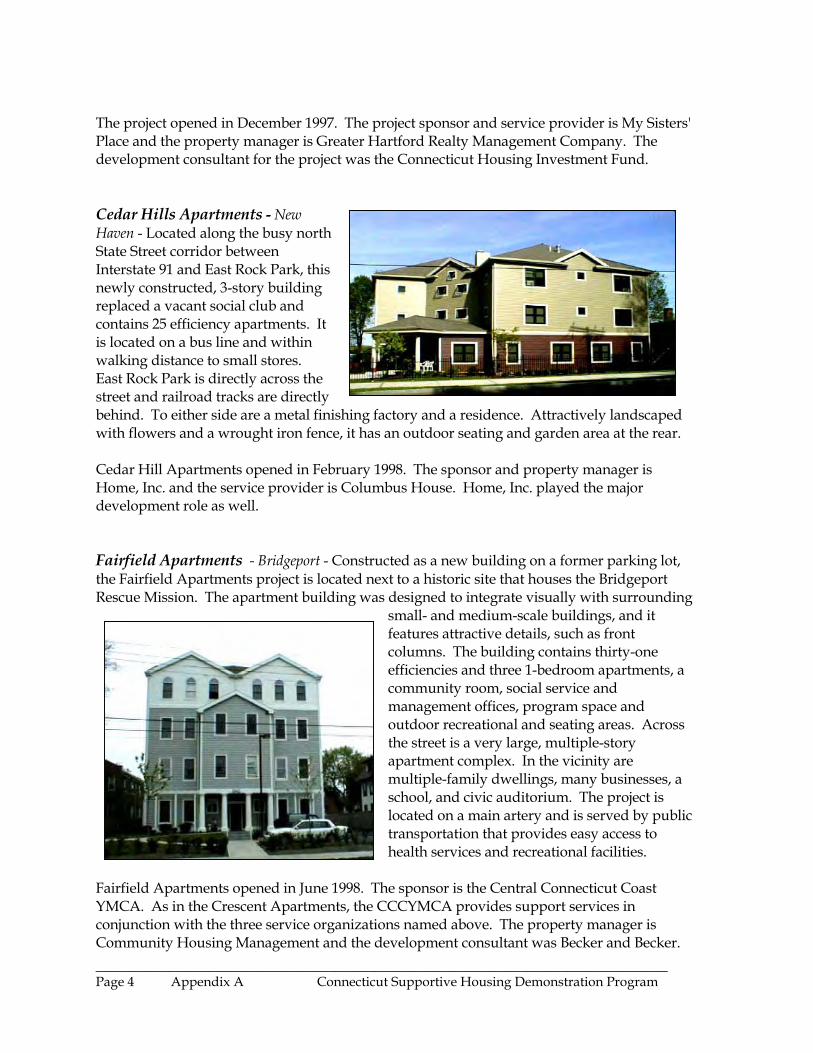
The project opened in December 1997. The project sponsor and service provider is My Sisters' Place and the property manager is Greater Hartford Realty Management Company. The development consultant for the project was the Connecticut Housing Investment Fund. Cedar Hills Apartments - New Haven - Located along the busy north State Street corridor between Interstate 91 and East Rock Park, this newly constructed, 3-story building replaced a vacant social club and contains 25 efficiency apartments. It is located on a bus line and within walking distance to small stores. East Rock Park is directly across the street and railroad tracks are directly behind. To either side are a metal finishing factory and a residence. Attractively landscaped with flowers and a wrought iron fence, it has an outdoor seating and garden area at the rear. Cedar Hill Apartments opened in February 1998. The sponsor and property manager is Home, Inc. and the service provider is Columbus House. Home, Inc. played the major development role as well. Fairfield Apartments - Bridgeport - Constructed as a new building on a former parking lot, the Fairfield Apartments project is located next to a historic site that houses the Bridgeport Rescue Mission. The apartment building was designed to integrate visually with surrounding
small- and medium-scale buildings, and it features attractive details, such as front columns. The building contains thirty-one efficiencies and three 1-bedroom apartments, a community room, social service and management offices, program space and outdoor recreational and seating areas. Across the street is a very large, multiple-story apartment complex. In the vicinity are multiple-family dwellings, many businesses, a school, and civic auditorium. The project is located on a main artery and is served by public transportation that provides easy access to health services and recreational facilities.
Fairfield Apartments opened in June 1998. The sponsor is the Central Connecticut Coast YMCA. As in the Crescent Apartments, the CCCYMCA provides support services in conjunction with the three service organizations named above. The property manager is Community Housing Management and the development consultant was Becker and Becker. ______________________________________________________________________________________ Page 4 Appendix A Connecticut Supportive Housing Demonstration Program
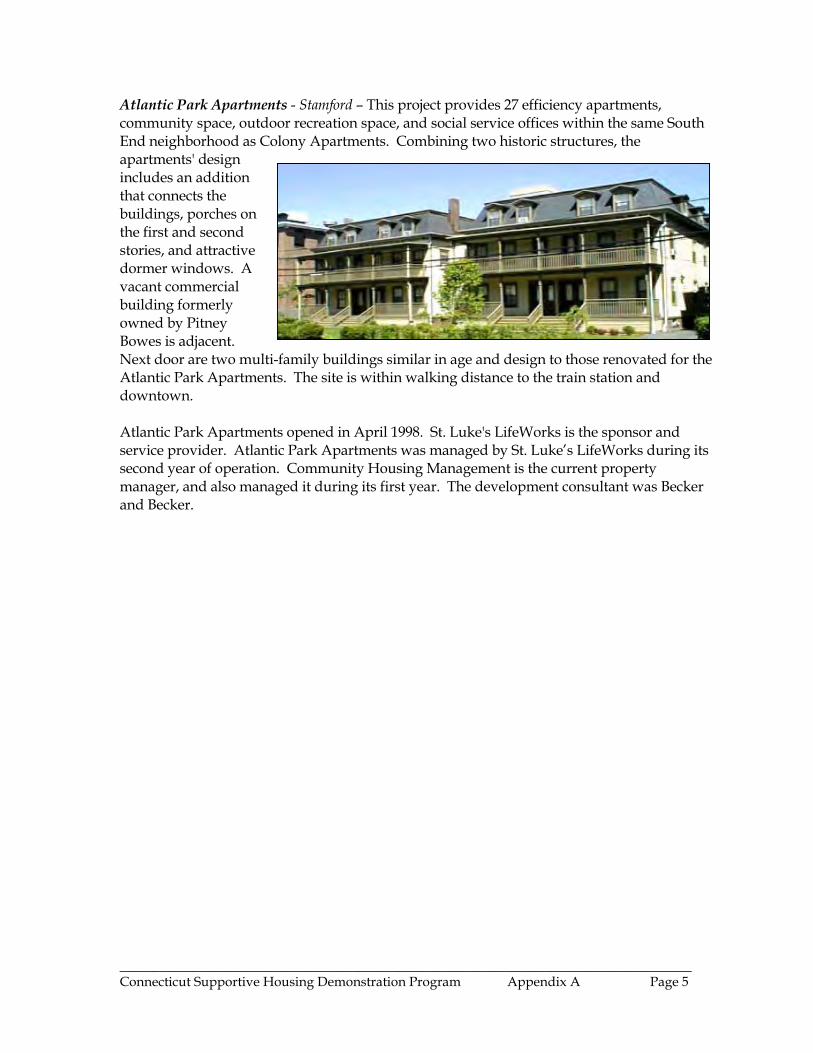
Atlantic Park Apartments - Stamford – This project provides 27 efficiency apartments, community space, outdoor recreation space, and social service offices within the same South End neighborhood as Colony Apartments. Combining two historic structures, the apartments' design includes an addition that connects the buildings, porches on the first and second stories, and attractive dormer windows. A vacant commercial building formerly owned by Pitney Bowes is adjacent. Next door are two multi-family buildings similar in age and design to those renovated for the Atlantic Park Apartments. The site is within walking distance to the train station and downtown. Atlantic Park Apartments opened in April 1998. St. Luke's LifeWorks is the sponsor and service provider. Atlantic Park Apartments was managed by St. Luke’s LifeWorks during its second year of operation. Community Housing Management is the current property manager, and also managed it during its first year. The development consultant was Becker and Becker.
______________________________________________________________________________________ Connecticut Supportive Housing Demonstration Program Appendix A Page 5
APPENDIX B The Consultants Arthur Andersen LLP Arthur Andersen LLP is a multidisciplinary firm with a long history of work in the state of Connecticut that includes an extensive and ongoing market re-use analysis of the former Fairfield Hills Hospital campus for the Connecticut Office Policy and Management. Most recently, the firm completed an extensive study of the State Moderate Rental Housing Program for the Connecticut Department of Economic and Community Development as it relates to two projects in Hartford. Arthur Andersen’s team of experts is uniquely positioned to assist in providing feasibility studies in the state and have extensive knowledge of various Connecticut State agencies. The team’s knowledge of housing markets, development, and sustainability is well recognized nationally. The firm has worked with agencies such as the United States Department of Housing and Urban Development, Housing Authority of Baltimore City, Idaho Housing Authority, and the New Orleans Housing Authority. Center for Mental Health Policy and Services Research University of Pennsylvania Health System The Center for mental Health Policy and Services Research (CMHPSR) was established in 1986 and is one of 13 centers in the department of Psychiatry of the University of Pennsylvania’s Medical Center, an international research institution. The psychiatry faculty at Penn is among the most creative and productive in the university and ranks second among departments of psychiatry in America in competition for National Institutes of Health research funding. The CMHPSR consists of a group of multidisciplinary faculty and staff interested in the public behavioral health care system. The goal of the Center is “To improve the quality and performance of behavioral health for public sector clients through research, evaluation, and education.” The CMHPSR researches the organization, financing, and management structure of mental health care systems and the delivery of mental health services and provides consultation and technical support to those individuals and programs involved in implementing system change. The Center has attempted to use the results of its research and evaluation efforts to inform the decision making of public policy makers at local, state, and national levels. The Centers research efforts are enhanced through a comprehensive program in consultation and training for mental health, drug and alcohol, and geriatric service providers. The objective is to link the best research and evaluation findings to policy decisions, and the delivery and implementation of services. The consultant/technical assistance function of the Center supports the planning activities of service providers and aids in the implementation of system change.
Connecticut Supportive Housing Demonstration Program Appendix B Page 1
Page 2 Appendix B Connecticut Supportive Housing Demonstration Program
TWR Consulting TWR Consulting was established in 1989 to address the needs of urban communities, non-profit organizations, educational institutions, and state and local government. TWR provides social and behavioral science research; education; technical assistance on project design, implementation and evaluation; strategic planning; grant writing; and meeting facilitation. Since 1990 Dr. Todd W. Rofuth has been an associate professor of social work at Southern Connecticut State University, specializing in management, social policy and research. In the past six years Dr. Rofuth and his team have completed 26 research studies that included a wide variety of social policy topics including a National Science Foundation project to institutionalize an environmental field education program in all Connecticut high schools; and an “Early Childhood Education and Violence Counseling Project” funded by the Federal Department of Education. Dr. Rofuth has worked with HUD funded programs on assisting youth from economically disadvantaged areas in obtaining GEDs and carpentry skills and is currently engaged in research on welfare reform, economic development, HIV/AIDS, housing policy and family day care. Kay E. Sherwood Kay E. Sherwood has been working as a private consultant since 1993. Her experience with working around social and public policy issues spans the past 25 years during which over a dozen of her articles and reports on a wide variety of topics have been published. Her expertise includes policy analysis, writing, and organizational development consulting to non-profit organizations, small businesses, foundations and governmental agencies. As a senior member of the Manpower Demonstration Research Corporation staff from 1982 through 1993, one of her essential responsibilities was to create the optimum conditions in human service programs for successful experimental tests both for credible, problem free research and for positive measured results. She has done extensive writing on administering service programs, including employment initiatives.