connecticut’s dental health partnership: entering a …€¢integration of oral health into other...
TRANSCRIPT

1
Connecticut’s Dental Health Partnership: Entering A Decade of
National Leadership

Shared Values and Priorities
Dental Health Partnership:
Consistent improvement based upon core values:
• Mission focus
• Good oral health for all
• Focus on Prevention
Prioritizing:
• Comprehensive Medicaid dental coverage in a timely manner and with geographically proximate access to oral health care
• Integration of oral health into other health systems
• Adequate reimbursement for the provider network
2
Mission Focus
DSS Mission Statement
Guided by shared belief in human potential, we aim to increase the security and well- being of Connecticut individuals, families and communities.
3

Medicaid and Population Well - being
• gives them access to a broader array of services and supports than any private health care plan;
• provides financial security from the catastrophic costs of a serious health condition;
• improved mental health by removing a significant stressor; and
• keeps people well and working.
4
Medicaid eligibility expansion contributes to the overall economic security of the entire state by promoting individual’s financial security and well-being. Connecting thousands and thousands of new people to Medicaid:

Care Coordination
Covering kids promotes both their security and the state’s future. Health care coverage to children supports not just their health status, but also aids their growth and development, school readiness and their ability to become actively engaged citizens in the future. We cover one in five Connecticut children.
5
Care Coordination
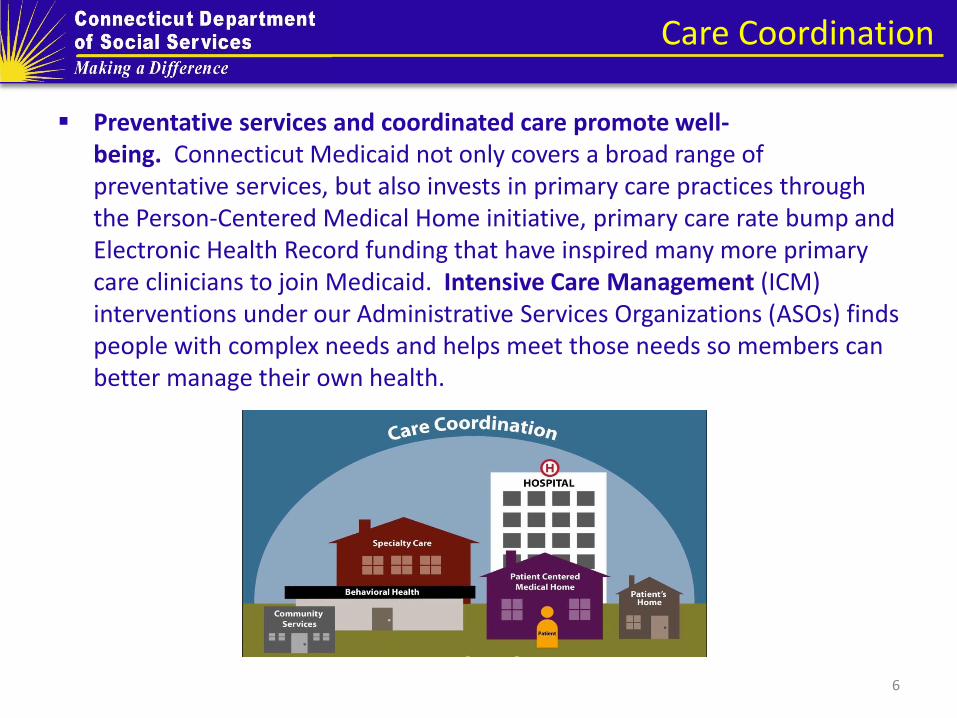
Preventative services and coordinated care promote well-being. Connecticut Medicaid not only covers a broad range of preventative services, but also invests in primary care practices through the Person-Centered Medical Home initiative, primary care rate bump and Electronic Health Record funding that have inspired many more primary care clinicians to join Medicaid. Intensive Care Management (ICM) interventions under our Administrative Services Organizations (ASOs) finds people with complex needs and helps meet those needs so members can better manage their own health.
6

7
HUSKY Health Overview
• Serves adults, working families, their children, their parents and their loved ones with disabilities.
• Covers an extensive array of preventative services (primary care through Person-Centered Medical Homes, dental and behavioral health coverage) as well as care coordination.
• Successful in improving quality, satisfaction and independence through prevention and integration.
HUSKY Health (Medicaid and CHIP) is a critical source of
economic security and well-being to over 780,000 individuals (21% of the
population of Connecticut).
• Maintains a fully integrated set of claims data for all covered individuals and all covered services.
• Uses data analytics to direct policy-making, program development and operations.
• Employs predictive modeling to identify both those in present need of care coordination, and those who will need it in the future.
HUSKY Health is data driven.
• Administrative costs are 3.0%. Total staffing (148 individuals) has held relatively constant while the number of individuals served has dramatically increased.
• 59% of Connecticut Medicaid and 88% of CHIP (HUSKY B) expenditures are federally reimbursed.
• Health expenditures (74% of department budget) are increasing based on caseload growth, but trends in per person costs are stable and quality outcomes have improved.
HUSKY Health is already doing more with less.

Reform Agenda
The HUSKY Health reform agenda includes the following key objectives:
Creation of a simplified administrative structure that effectively supports and empowers both members and providers
Use of a nationally recognized, fully integrated claims data set to illuminate needs, influence policy direction, ensure accountability and support cost savings
Development of a robust system of preventative care
Integration of health (medical, behavioral, dental) and social services
Achievement of a long-term services and supports system that enables true choice and integration
8

But in the end,
it is all about our members.
Two stories:
9

Mary’s Story
Mary lost her home and was in a long-term care facility when she lost her dentures. She began to have difficulty eating and lost weight. Soon her weight loss became significant and she dropped to only 89 pounds.
A Dental Health Care Specialist from the Connecticut Dental Health Partnership worked with her, Catholic Charities and the Long-Term Care Ombudsman to find a caring dentist who reconstructed her dentures and helped her to regain her independence.
Mary is now living in the community, has regained her weight and said of what happened:
“There are no words – powerful, happy or relieved - to express my gratitude … The last thing I expected was some caring women would go to bat for me.”
10

Juanita’s Story Juanita grew up without any dental care and enrolled
in HUSKY D after high school. Because of her widespread dental decay and missing teeth she was embarrassed and did not smile. CTDHP helped her find a dentist nearby who could help her.
Her new dentist developed an extensive treatment plan. He noticed that she was withdrawn and mumbled when she spoke. Her condition was so severe that he said that it was childhood neglect. He hoped to help restore her confidence.
Staff worked with the dentist to approve the necessary services and to improve her oral hygiene.
She reported that it was like we gave her a whole new outlook on life. "I am so happy" she said. Juanita now has a job and will be attending a local community college in the upcoming academic year.
11

Oral Health Agenda
Oral health services and strategies under the CT Dental Health Partnership (CTDHP) are an integral part of the HUSKY Health reform agenda:
Timely and proximate access for members
A focus on increasing overall utilization and use of preventive services
Referral and intensive care management supports for members
Integration of oral health in primary care settings
Improved outcomes and controlled costs
12

A Brief Retrospective
Timeline of Select Events
September 2007: CT ranked 29 nationally in children’s utilization
September 2008: CTDHP was launched!
August 2009: 1,000 provider partners milestone
August 2009: CTDHP outreach program to members begins
September 2011: CT ranked 2nd nationally in children’s utilization
June 2012: 1,500 provider partners milestone
September 2012: Awarded $700K HRSA grant for PIOHQI Project
September 2014: CT ranked 1st nationally in children’s utilization
December 2014: 2,000 provider partners milestone reached
September 2016: 6th consecutive year ranked #1 or #2 nationally
13

Provider Access from ADA/HPI
Measuring What Matters - A New Way of Measuring Geographic Access to Dental Care Services1
2017 Analysis by the American Dental Association (ADA), Health Policy Institute (HPI), every state measured
Connecticut: “99% of Medicaid/CHIP children live within 15 minutes of a Medicaid/CHIP dentist”
Quotes by Marko Vujicic, Chief Economist and Vice President, ADA HPI, from the webinar presenting the study results:
“This state [Connecticut] by far has one of the best geographic coverages and densities of Medicaid or CHIP dentists [in the country]”.
“There are ‘a lot’ of Medicaid and CHIP providers for each Medicaid or CHIP enrollee [in Connecticut]”
1 Measuring What Matters - A New Way of Measuring Geographic Access to Dental Care Services (May 2017 webinar); American Dental Association, Health Policy Institute, Marko Vujicic, Chief Economist and Vice President, https://www.ada.org/en/science-research/health-policy-institute/publications/webinars/measuring-access-to-dental-care-in-every-state, (30:30 time mark) accessed 2/12/2018.
14

Provider Access, Current Network
15
County Endo General Dentists
Oral Surgeons
Ortho Pediatric Dentists
Perio Hygienists Total
FAIRFIELD 6 471 41 48 63 3 19 651
HARTFORD 14 495 59 51 67 9 30 725
LITCHFIELD - 47 6 3 5 - 6 67
MIDDLESEX - 66 3 12 9 - 5 95
NEW HAVEN 5 412 87 43 60 1 24 632
NEW LONDON 1 75 9 9 12 - 3 109
TOLLAND - 23 2 3 2 - - 30
WINDHAM - 41 1 4 - - 3 49
Out of State - 58 - 4 8 - - 70
Total 26 1,688 208 177 226 13 90 2,428
Source: CTDHP Internal Reporting as of December 31, 2017. Individual practitioners may be counted more than once within a county if they work at multiple independent practices.
The network above is spread over 1,040 different service locations throughout Connecticut.

Provider Access from ADA/HPI
16
American Dental Association, Health Policy Institute Medicaid Provider Access Study
Source: American Dental Association Health Policy Institute, http://www.ada.org/en/science-research/health-policy-institute/geographic-access-to-dental-care

Mystery Shopper measures provider availability
• Since CY2010 we have used United Way 2-1-1 (UW211) to perform an independent mystery shopper
• UW211 calls every provider in the CTDHP network
• UW211 measures ability to get an appointment with a PCD and the wait time for that appointment
• In CY2017 we measured provider availability for adults for the first time
2009 2010 2011 2012 2013 2014 2015 2016 2017
Children PCD Appointment Success 93% 93% 91% 91% 87%
Average Time for PCD Appt (days) 14.4 11.2 6.8 9.1 8.3
Closed Panels (as of 12/31) 18.2% 16.8% 14.5% 13.7% 13.4% 11.9% 10.8% 9.6% 9.5%
Adults PCD Appointment Success 81%
Average Time for PCD Appt (days) 6.8
Closed Panels (as of 12/31) 22.9% 22.5% 18.2% 16.8% 16.1% 14.4% 12.3% 11.4% 10.9%
Net Network Growth year over year 32.3% 18.7% 13.2% 17.6% 12.7% 9.7% 10.0% 7.0% 3.0%
Provider Availability from UW211
2/11/2016 Department of Social Services 17
Utilization
18
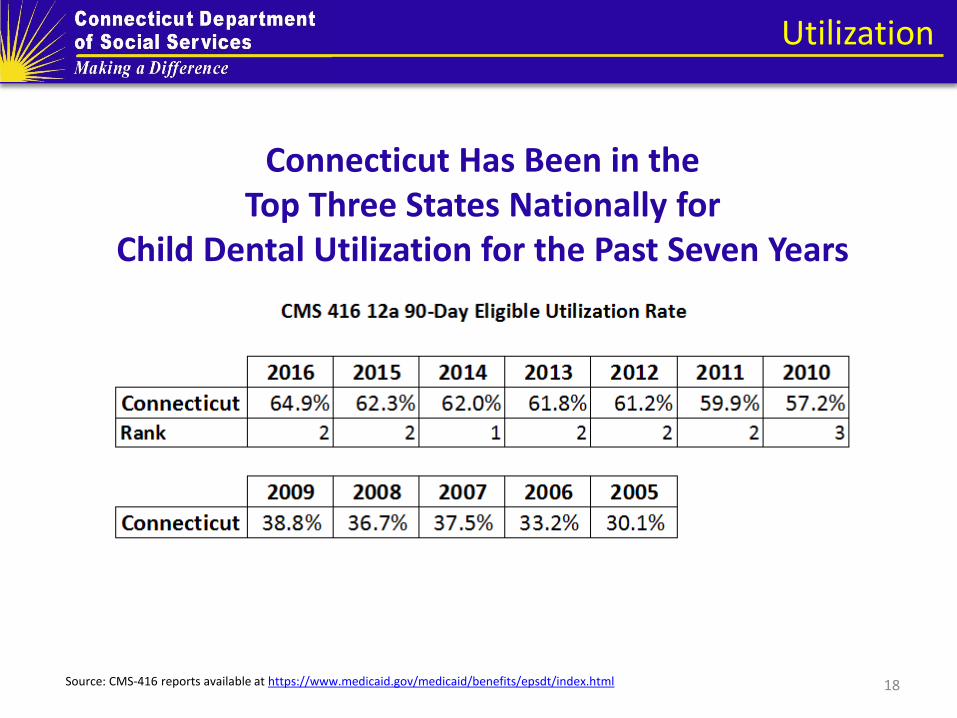
Connecticut Has Been in the Top Three States Nationally for
Child Dental Utilization for the Past Seven Years
Source: CMS-416 reports available at https://www.medicaid.gov/medicaid/benefits/epsdt/index.html
Utilization continued
19
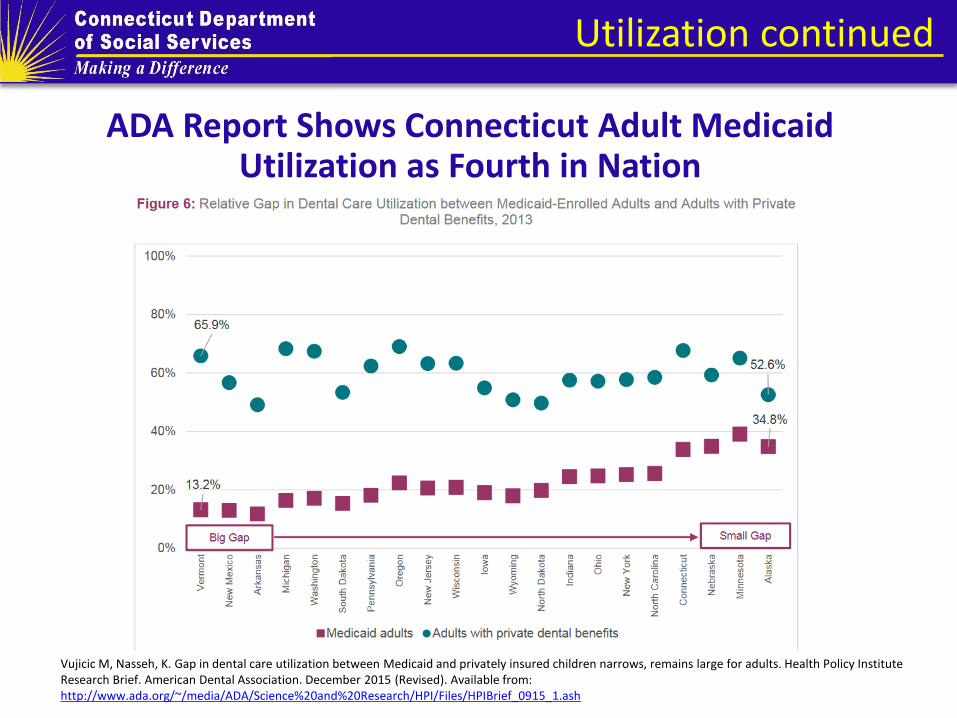
ADA Report Shows Connecticut Adult Medicaid Utilization as Fourth in Nation
Vujicic M, Nasseh, K. Gap in dental care utilization between Medicaid and privately insured children narrows, remains large for adults. Health Policy Institute Research Brief. American Dental Association. December 2015 (Revised). Available from: http://www.ada.org/~/media/ADA/Science%20and%20Research/HPI/Files/HPIBrief_0915_1.ash

Utilization Continued
20
28.2%
50.6% 50.1%
47.7%
20.0%
30.0%
40.0%
50.0%
60.0%
2005 2010 2014 2015
Perinatal Dental Utilization Percentage of Women Accessing Care
Perinatal Women *
All Adult Women **
* Continuously enrolled, any dental care 12 months after the birth ** Continuously enrolled, any dental care in the calendar year Source: 2005 & 2010 - Dental Care for New Mothers in HUSKY A, Baseline for Perinatal and Infant Oral Health Quality Improvement Project, October 1, 2014, Mary Alice Lee PhD, Senior Policy Fellow, Connecticut Voices for Children; 2014 & 2015 - CTDHP Internal Report
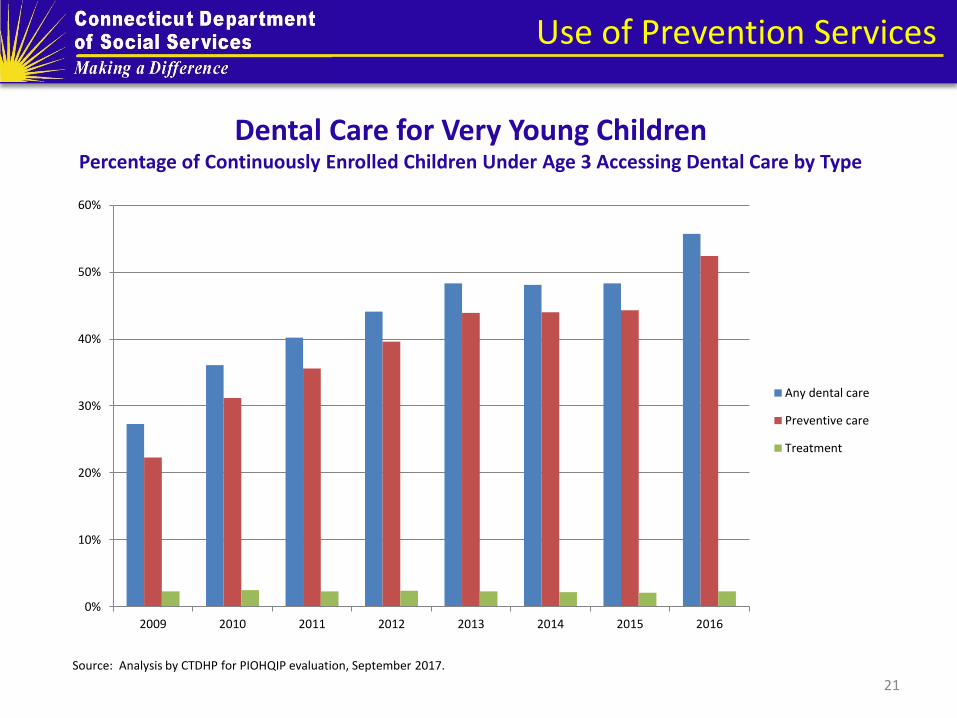
Use of Prevention Services
21
0%
10%
20%
30%
40%
50%
60%
2009 2010 2011 2012 2013 2014 2015 2016
Any dental care
Preventive care
Treatment
Dental Care for Very Young Children Percentage of Continuously Enrolled Children Under Age 3 Accessing Dental Care by Type
Source: Analysis by CTDHP for PIOHQIP evaluation, September 2017.

Utilization and Prevention
22 Source: Connecticut DSS CMS-416 as submitted to CMS, ever enrolled population, 12a/1a, 12b/1a, 12c/1a
0.00%
10.00%
20.00%
30.00%
40.00%
50.00%
60.00%
70.00%
2006 2007 2008 2009 2010 2011 2012 2013 2014 2015 2016 2017
Dental Services for All Medicaid Children CMS 416 Measurements by FFY (Ever Enrolled Population)
AnyDental Prevention Treatment Prevention Trend Treatment Trend

ED/Urgent Care Case Management
2/11/2016 Department of Social Services 23
489
9 3
88
322
12 2 32
0
100
200
300
400
500
600
HUSKY A HUSKY B HUSKY C HUSKY D
CY 2016
CY 2017
$121,222
$103,173
$90,000
$95,000
$100,000
$105,000
$110,000
$115,000
$120,000
$125,000
CY 2016 CY 2017
ED Dental Costs by Children Ages 0-20 Years, Caries and Infection Diagnoses
For all ED/Urgent Care Charts Paid Claims for Outpatient General Emergency Room Visits and Urgent Care Visits only, For Children Ages 0 to 20 Years; For the Period 1/1/2016 – 12/31/2017; for the following diagnosis codes: K029 Dental caries unspecified, K0381 Cracked tooth, K040 Pulpitis, K044 Acute apical periodontitis of pulpal origin, K047 Periapical abscess without sinus, K0500 Acute gingivitis, plaque induced, K088 Other specified disorders of teeth and supporting structures, K122 Cellulitis and abscess of mouth, K131 Cheek and lip biting, K134 Granuloma and granuloma-like lesions of oral mucosa, K136 Irrigative hyperplasia of oral mucosa, K1370 Unspecified lesions of oral mucosa, K1379 Other lesions of oral mucosa
ED Dental Visits by Children Ages 0-20 Years, Caries and Infection Diagnoses
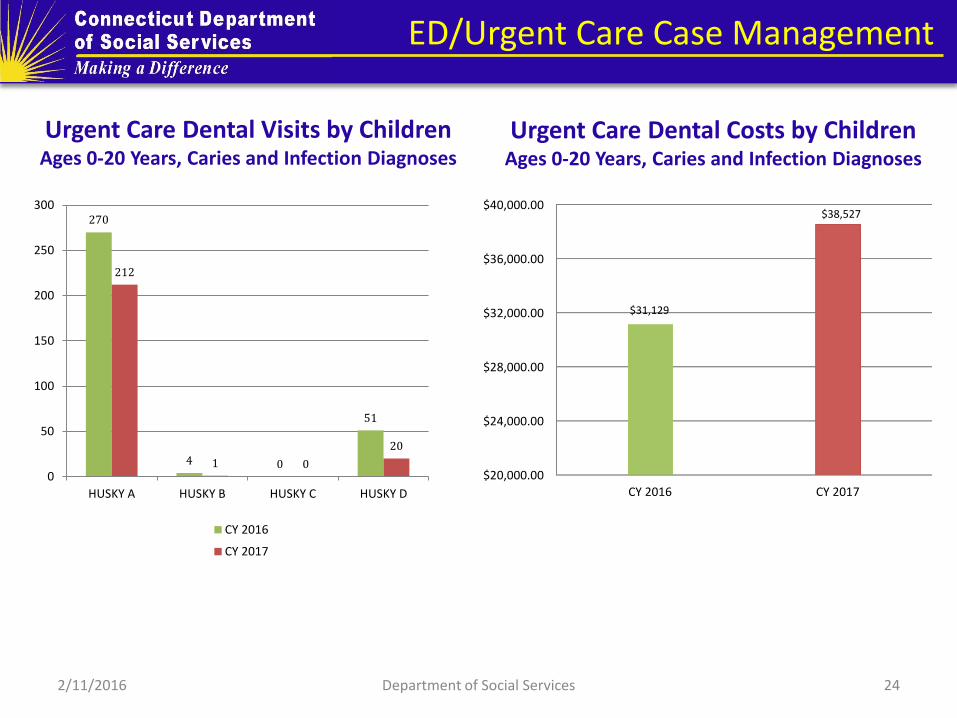
ED/Urgent Care Case Management
2/11/2016 Department of Social Services 24
270
4 0
51
212
1 0
20
0
50
100
150
200
250
300
HUSKY A HUSKY B HUSKY C HUSKY D
CY 2016
CY 2017
$20,000.00
$24,000.00
$28,000.00
$32,000.00
$36,000.00
$40,000.00
CY 2016 CY 2017
$31,129
$38,527
Urgent Care Dental Visits by Children Ages 0-20 Years, Caries and Infection Diagnoses
Urgent Care Dental Costs by Children Ages 0-20 Years, Caries and Infection Diagnoses

ED/Urgent Care Case Management
2/11/2016 Department of Social Services 25
196 179
88
50 68
122
54 47
0
50
100
150
200
250
Periapical abscess without sinus Other specified disorders of teethand supporting structures
Dental caries, unspecified Other lesions of oral mucosa
ED Visit
Urgent Care Visit
160
95
58
23 20
85
62
42
14 16
0
20
40
60
80
100
120
140
160
180
Periapical abscess withoutsinus
Dental caries, unspecified Other lesions of oral mucosa Cellulitis and abscess ofmouth
Unspecified lesions of oralmucosa
ED Visits
Urgent Care Visits
Top Five Diagnoses for ED/Urgent Care Visits Among Children 0-20 in 2017
Top Four Diagnoses for ED/Urgent Care Visits Among Children 0-20 Years in 2016

95.7%
94.8%
96.4%
93.0%
96.0%
96.8%
98.0%
97.1%
98.2% 98.2%
88.0%
90.0%
92.0%
94.0%
96.0%
98.0%
100.0%
2013 2014 2015 2016 2017
Call Center KPI by Year Grade of Service and First Call Resolution
Calls Answered in 45 Seconds
First Call Resolution Rate
Key Performance Indicators
26

Key Performance Indicators
27
0.0%
1.0%
2.0%
3.0%
4.0%
5.0%
0
2
4
6
8
10
12
14
16
2013 2014 2015 2016 2017
Call Center KPI by Year Average Call Length, Time to Answer and Abandonment Rate
Average Call Length(in minutes)
Average Time to Answer(in seconds)
Abandon Rate

Member Supports
28
Direct Outreach
2,000 welcome calls are made monthly to new enrollee households Over 350,000 outreach calls are made annually to non-utilizing
clients Annually 100,000 calls are received by CTDHP call center Call center has bilingual capacity (English and Spanish) and
supports other language needs through Language Service Associates, Inc.
Approximately 9,000 visitors per month access www.ctdhp.com An e-newsletter is sent to over 100,000 client households, reaching
about 200,000 members

Member Supports continued
29
Eight Dental Health Care Specialists are doing targeted and community outreach in partnership with trusted persons in many types of community- based organizations.
Six live and work in six regions of the state, close to their communities; one supports members with special needs statewide; one supports direct telephone outreach
Outreach is focused on specific groups:
Perinatal women and infants Members who use ED for dental issues Children who are screened in the community as high risk Members referred from the community

Member Supports continued
30
First Tooth Bib
Oral Health Kit
Spanish language materials

Integration with Primary Care
31
Access for Baby Care to Dental (ABCD)
National movement to implement an evidence-based strategy
Launched in Connecticut in 2008 by partners including the American Academy of Pediatrics, UCONN School of Dental Medicine, DPH Office of Oral Health, Child Health and Development Institute (CHDI) EPIC Program and the DSS/CTDHP
Pediatric PCP offices provide oral health care during well-child visit including oral evaluation (D0145) and fluoride varnish application (D1206)

Integration with Primary Care
32
2/9/2018 Department of Social Services
1,993
10,399
4,310
15,990
0
2,000
4,000
6,000
8,000
10,000
12,000
14,000
16,000
18,000
2012 2013 2014 2015 2016 2017
Fluoride Varnish
Oral Assessments
ABCD: Access to Baby Care Program Total Number of Oral Assessments and Fluoride Varnish Applications
Source: CTDHP Internal Report as of February 2018
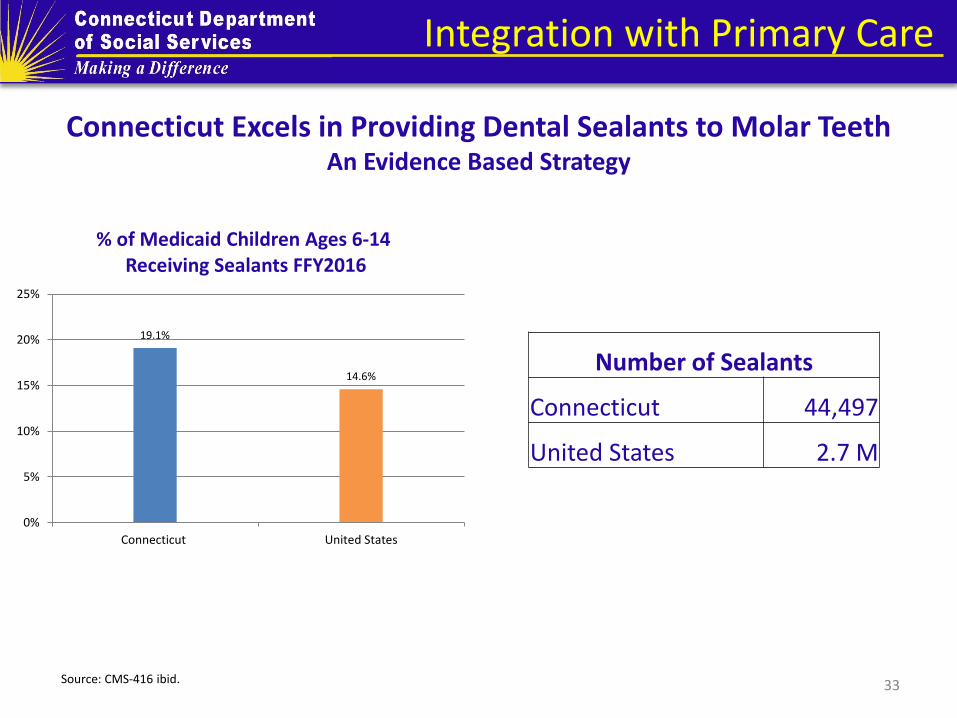
Integration with Primary Care
33
Connecticut Excels in Providing Dental Sealants to Molar Teeth An Evidence Based Strategy
19.1%
14.6%
0%
5%
10%
15%
20%
25%
Connecticut United States
% of Medicaid Children Ages 6-14 Receiving Sealants FFY2016
Source: CMS-416 ibid.
Number of Sealants
Connecticut 44,497
United States 2.7 M

Outcomes
HUSKY Health is improving outcomes while controlling costs.
Health outcomes and care experience are improving. We are enabling independence and choice for people who need long-term
services and supports.
Coordinating the care with sequencing of the appropriate services at the right time.
Provider participation has increased.
Enrollment is up, but per member per month costs are stable.
The federal share of HUSKY Health costs has increased.
34
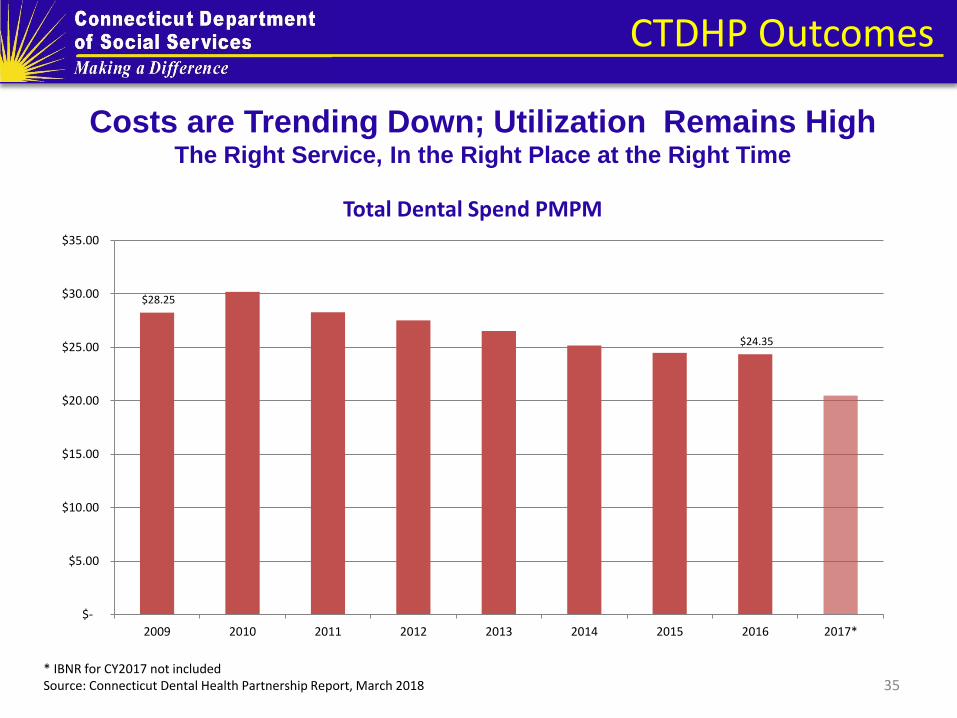
CTDHP Outcomes
35
Costs are Trending Down; Utilization Remains High The Right Service, In the Right Place at the Right Time
$28.25
$24.35
$-
$5.00
$10.00
$15.00
$20.00
$25.00
$30.00
$35.00
2009 2010 2011 2012 2013 2014 2015 2016 2017*
Total Dental Spend PMPM
* IBNR for CY2017 not included Source: Connecticut Dental Health Partnership Report, March 2018

Adult Benefit Maximum
2/11/2016 Department of Social Services 36
January 1, 2018 the State legislature mandated a $1,000 annual maximum limit for adult dental services (section 49 of P.A. 17-2, the budget bill)
Preservation of comprehensive adult dental benefit Projected to impact <5% of the adult population Example services available in one year:
With prior authorization and medical necessity, services above $1,000 can be provided
To date, ~2,300 clients have used >$500 in benefits
Example 1 Example 2 Example 3
Exam Exam Exam
Full mouth series Bitewings Bitewings
Cleaning Cleaning Cleaning
Root canal therapy Six amalgam restorations Two surgical extractions
Crown Upper denture

Contact
37
If you or your staff are contacted by a HUSKY Health member regarding dental benefits or any
concerns, please have them contact us.
855-CT-DENTAL Monday-Friday, 8AM-5PM
www.CTDHP.com