connecting low-income families to good jobs · kevin jordan bon secours foundation diane bell...
TRANSCRIPT
Connecting Low-IncomeFamilies to Good Jobs:A Policy Road Map for Maryland
Job Opportunities Task Force2004

StaffDeborah PovichExecutive Director
Chauna BrochtResearch Associate
Doha MelhemProgram Assistant
Kevin Griffin MorenoCommunications Director/Program Manager
Jessica TraskeyOffice Manager
Contact InformationJOB OPPORTUNITIES TASK FORCE
2 East Read Street, 6th Floor
Baltimore, Maryland 21202
(410) 234-8040
(410) 234-8929 fax
www.jotf.org
Board of DirectorsPresidentJoanne Nathans
Vice PresidentPhil C. HolmesGoodwill Industries of the Chesapeake
SecretaryAvis Ransom SSC Employment Agency, Inc.
TreasurerKevin JordanBon Secours Foundation
Diane BellEmpower Baltimore Management Corp.
Patrice CromwellOpen Society Institute – Baltimore
David KandelThe Algebra Project
John KortecampHome Builders Assoc. of MD
Brian LyghtAnnie E. Casey Foundation
Constance MaddoxEBMC Advisory Council
Pat McLaughlin, SSNDCaroline Center
Lynda MeadeCatholic Charities
Michael Mitchell, Chesapeake Habitat for Humanity
Ralph Moore Jr.St. Frances Academy Community Center
Molly NashSt. Jude’s Employment Center
Pamela PaulkJohns Hopkins Hospital
Marion PinesJHU Institute for Policy Studies
Don ScheelerEducate, Inc.
Scott StevensModu-Tech, Inc.
Melanie StylesAbell Foundation

Hundreds of thousands of Marylanders work hard and pay taxes – but nonetheless
struggle every day to provide for their families and build a secure future. These Marylanders
deserve a true commitment from the state to help them increase their employment
opportunities and become more financially stable. This report is designed to inform
policymakers about the conditions facing low-income workers and to recommend
changes in state policy that can improve those conditions.
executiveSummaryConnecting Low-income families to good jobs
A Policy Road Map for Maryland
Despite its relative affluence, Maryland has
a large population of low-income families who
work in jobs with inadequate wages, benefits and
prospects for advancement.
■ More than 100,000 working families
in Maryland are struggling to get by.
■ More than 384,000 Marylanders earned
less than a poverty-level wage of $8.61 an
hour in 2002.
■ Pockets of economic distress exist in
many parts of the state: seven counties in
Maryland have more than 9 percent
of families in poverty.
It is in the best interest of the state and its
employers to help low-income workers do well in
the workplace. With some assistance, low-income
workers can develop skills, move up in the work-
ing world, and become full contributors to
Maryland’s economic success. Maryland employ-
ers often have difficulty finding adequately
trained workers; a more skilled workforce will
ease their burden.
Maryland is missing important opportunities
to help workers who want to improve their skills:
■ 614,000 adults have less than a high
school diploma, and 86,000 foreign-born
workers have limited English skills. Yet
Maryland only serves 4 percent of those
in need of adult education.
■ Although college tuition in Maryland
continues to increase, only about half
of Maryland’s financial assistance grants
target needy students. Furthermore,
Maryland’s financial assistance
programs rely too heavily on loans.
Programs designed to help low-income
Maryland workers do not focus enough on
training:
■ Workforce Investment Act Adult
Training programs served 628 people,
less than 1 percent of working age
adults without a high school credential.
■ Due to work requirements, only 3.7
percent of welfare recipients participated
in education and training activities.
■ Although any inmate in the Maryland
correctional system without a high
school credential is entitled to have
1Connecting Low-Income Families to Good Jobs: A Policy Road Map for Maryland

access to adult education, only 6.9 percent
of eligible inmates participated in adult
education programs.
The state has not made creating good jobs
for low-income workers a priority:
■ State economic development and work-
force development officials have not
gone far enough in coordinating their
efforts.
■ The state does not adequately track
whether economic development efforts
result in good jobs for low-income
workers.
■ The state’s largest skill enhancement
and productivity programs do not assist
low-income workers.
State policies – ranging from income taxes
and transportation to childcare and health insur-
ance – have a significant impact on the lives of
low-income workers. The state should improve
these policies.
RecommendationsTo address these findings, this report outlines
a policy road map summarized below. The body
of the report fleshes out these broad policy goals
with specific suggestions for change.
Education & Training (Chapter 2)
■ Increase opportunities for low-income
working adults to upgrade their
education through basic adult education.
■ Improve welfare recipients’ long-term
earning capacity by providing increased
educational and training opportunities.
2 Job Opportunities Task Force
■ Remove financial barriers for low-
income working adults seeking to
upgrade their skills through post-
secondary education.
Economic & Workforce Development (Chapter 3)
■ Ensure economic development funds are
used to create family-supporting jobs by
increasing public accountability.
■ Increase funding for training programs
for low-income workers. Emphasize
training that meets the needs of employ-
ers in high-demand industries.
Policies to Foster Financial Independence
(Chapter 4)
■ Support working low-income
parents by subsidizing childcare.
■ Continue to provide income support
to working parents through the state
Earned Income Tax Credit.
■ Expand access to health care for low-
income working parents and children.
■ Revise the unemployment insurance
program to increase eligibility and
provide adequate benefits to workers
who lose their jobs through no fault of
their own.
■ Reduce the impact of a criminal record
on employment.
■ Increase outreach and simplify access to
work-support programs for which
working low-income families are eligible.

Executive Summary . . . . . . . . . . . . . . . . . . . . . . . . . . . . . . . . . . . . . . . . . . . . . . . . . . . . . . . . . . . . . . . .1
Introduction . . . . . . . . . . . . . . . . . . . . . . . . . . . . . . . . . . . . . . . . . . . . . . . . . . . . . . . . . . . . . . . . . . . . .4
Chapter 1: Falling Behind in Maryland . . . . . . . . . . . . . . . . . . . . . . . . . . . . . . . . . . . . . . . . . . . . . . . . .5
Chapter 2: Building the Foundation . . . . . . . . . . . . . . . . . . . . . . . . . . . . . . . . . . . . . . . . . . . . . . . . . .11
Chapter 3: Creating Good Jobs . . . . . . . . . . . . . . . . . . . . . . . . . . . . . . . . . . . . . . . . . . . . . . . . . . . . . .23
Chapter 4: Fostering Financial Security . . . . . . . . . . . . . . . . . . . . . . . . . . . . . . . . . . . . . . . . . . . . . . . .31
Conclusion . . . . . . . . . . . . . . . . . . . . . . . . . . . . . . . . . . . . . . . . . . . . . . . . . . . . . . . . . . . . . . . . . . . .39
Glossary . . . . . . . . . . . . . . . . . . . . . . . . . . . . . . . . . . . . . . . . . . . . . . . . . . . . . . . . . . . . . . . . . . . .40
Acknowledgements . . . . . . . . . . . . . . . . . . . . . . . . . . . . . . . . . . . . . . . . . . . . . . . . . . . .inside back cover
List of Tables
Table 1: Working Families in Poverty in Maryland . . . . . . . . . . . . . . . . . . . . . . . . . . . . . . . . . . . . . .6
Table 2: Family Poverty Rates by County . . . . . . . . . . . . . . . . . . . . . . . . . . . . . . . . . . . . . . . . . . . .7
Table 3: Educational / Skills Attainment in Maryland . . . . . . . . . . . . . . . . . . . . . . . . . . . . . . . . . . .12
Table 4: Education by Race in Maryland . . . . . . . . . . . . . . . . . . . . . . . . . . . . . . . . . . . . . . . . . . . .13
Table 5: Unmet Adult Education and Training Needs in Maryland . . . . . . . . . . . . . . . . . . . . . . . . . .16
Table 6: Unemployment Rates by County . . . . . . . . . . . . . . . . . . . . . . . . . . . . . . . . . . . . . . . . . . .24
Table 7: State of the Workforce in Maryland . . . . . . . . . . . . . . . . . . . . . . . . . . . . . . . . . . . . . . . . . .24
Table 8: Labor Force Participation Rates by County . . . . . . . . . . . . . . . . . . . . . . . . . . . . . . . . . . . .25
List of Maps & Charts
Map 1: Economic Disparities in Maryland . . . . . . . . . . . . . . . . . . . . . . . . . . . . . . . . . . . . . . . . . . . .7
Chart 1: The Self-Sufficiency Standard for One Adult, One Preschooler
and One School-Age Child, 2001 . . . . . . . . . . . . . . . . . . . . . . . . . . . . . . . . . . . . . . . . . . . .8
Chart 2: Median Weekly Earnings of Full-Time Wage and Salary Workers
Age 25 and Over by Educational Attainment and Sex, 2002 . . . . . . . . . . . . . . . . . . . . . . . .12
Chart 3: Value of the Minimum Wage, 1962-2002 . . . . . . . . . . . . . . . . . . . . . . . . . . . . . . . . . . . . . .32
Chart 4: Maryland State and Local Taxes Shares of Family Income
for Non-Elderly Taxpayers, 2002 . . . . . . . . . . . . . . . . . . . . . . . . . . . . . . . . . . . . . . . . . . .32
Chart 5: Private Sector Employer-Sponsored Health Insurance, United States, 2000 . . . . . . . . . . . . .33
Table of contents
3Connecting Low-Income Families to Good Jobs: A Policy Road Map for Maryland

This report is designed to inform policy
makers about the conditions facing low-income
working families in Maryland, to assess the effec-
tiveness of state policies and programs that assist
low-income workers, and to recommend policy
and program changes that will improve outcomes
for these workers.
By many measures, Maryland is thriving.
The state boasts high average incomes, a largely
well-educated workforce and an unemployment
rate lower than those of many states. Look close-
ly at the picture, though, and you will discern
that a large segment of our population is not
sharing in the prosperity. This report focuses on
the conditions facing more than 100,000 low-
income Marylanders who work hard and pay
taxes – but nonetheless struggle every day to pro-
vide for their families and build a secure future.
These low-skill workers face a tight job market
that still has not fully recovered from the recent
recession. The number of jobs created in
Maryland has not kept pace with the number
of new people looking for work, and economic
restructuring and productivity gains have resulted
in a significant loss of lower-skill jobs that pay
good wages, particularly in manufacturing.
Nearly one out of five workers who have found
jobs earn wages too low to support a family at
a decent standard of living.
Many workers in the state need additional
education or training to advance in the work-
force; others are leaving welfare and taking their
first steps in paid employment. In either case,
most of these Marylanders are not prepared to
participate fully in an evolving and increasingly
information-based economy. Instead, they find
themselves stuck in jobs that pay less than an
adequate wage and that lack important benefits.
This report rests on three premises. First,
those who work hard and play by the rules
deserve financial security; second, the state
should remove certain obstacles that prevent
workers from increasing their skills to meet
the demands of the new economy; and third,
the state must take into account the needs of
low-income workers in its job creation and
expansion efforts.
Employers often complain that they have
difficulty finding appropriately educated and
trained workers to fill openings. At the same
time, certain areas of Maryland have high rates
of unemployment. With revised policies, the state
can better meet the needs of both employers and
job seekers, satisfying the demand for skilled
workers while fine-tuning the supply.
Each chapter of this report addresses a key
aspect of the conditions affecting the lives of
low-income workers. ■
4 Job Opportunities Task Force
introduction

Signs of affluence in Maryland are easy to
see – from Baltimore marinas jammed with pleas-
ure boats to sprawling mansions dotting the sub-
urban landscape. Statistics tend to bear out the
visual evidence that our state is faring well. The
median household income in the state in 2002
was $55,650, the fourth highest among the
states, while the 2002 average personal income in
Maryland was $36,298, also the fourth highest.i
But these statistics mask another reality.
While many families in Maryland are enjoying a
comfortable standard of living, more than
100,000 working families are struggling to get by.
Who are these workers? They are the men
and women who clean office buildings, wash
dishes, cook in restaurants,
take care of our elderly loved
ones or work in countless
other positions that fail to pay
a family-supporting wage.
Often they have few other
options. The working world
does not have enough jobs
paying a family-supporting
wage for low-skill workers.
And these workers are often
shut out of jobs that offer the
promise of career development
because they lack certain credentials.
These low-income workers have an impact
on the economy, their neighborhoods and their
families. They often live in concentrated areas,
creating low-income neighborhoods with few
resources to address social problems. These
workers have little disposable income, making it
difficult for their communities to support viable
business districts. And they are hard-pressed to
provide family members with economic security
or to meet the demands of a society that increas-
ingly charges fees for school supplies, field trips,
and after-school activities.
Many of these workers suffer from limited
education; some are immigrants still learning
English, while others are trying to make it on
their own after leaving welfare. Some are ex-
offenders trying to turn their lives around; others
are simply down on their luck but determined to
win back their self-reliance.
In many cases, these low-wage workers are
also parents who work, pay taxes and strive for
an important goal – to provide for their children.
But for many that goal
remains as elusive as the
yachts cruising the
Chesapeake Bay. It is these
lower-income working
families that are the focus
of this report.
In 2001 in Maryland,
almost 26,500 families with a
working parent had incomes
that fell below the federal
poverty threshold (see Table
1). That represented 4 percent
of all working families in the state, meaning that
a substantial number of Maryland parents remain
in official poverty status despite having jobs.
More than three out of four of these families
have parents in their prime working years – ages
25 to 54 – the span during which a worker has
the greatest earning potential. The fact that so
many breadwinners fall below the poverty line
CHAPTER 1
5Connecting Low-Income Families to Good Jobs: A Policy Road Map for Maryland
■ Nearly 26,500 working families in Maryland were in poverty in 2001.
■ In 2001, nearly 118,000 working families had incomes below twice the poverty threshold (a more realistic measure of the cost of raising a family). This is 17.4 percent of all working families.
■ Despite its relative prosperity, Maryland suffers from significant income disparities.
Falling Behind in Maryland

spend more than a third
of their income on
housing – a warning
sign that housing costs
are eating up too much
of a family’s budget.iii
These families, even
though they work, must
routinely grapple with
threats to their basic
way of life, perhaps
being evicted or having
their car repossessed.
They have problems shared by the
middle class. They rely on family and friends
for childcare, juggle bill payments, try to reduce
school expenses and search, often without success,
for affordable housing in safe neighborhoods.
But while middle-class Marylanders typically
have the financial wherewithal to cope with
these challenges, low-income workers living on
the margins do not.
Low-income workers face other obstacles.
They are more likely than those earning higher
incomes to go without health insurance – either
because it is not available from their employer or
is unaffordable.iv More than four out of 10 of
these working families (almost 11,000 families)
with sub-poverty incomes had at least one parent
without any health insurance.v They also pay a
larger proportion of their wages on unavoidable
basics such as heat and electricity.
Furthermore, many low-income workers live
in neighborhoods that have been abandoned by
mainstream institutions such as grocery stores
and banks, replaced by “convenience” stores that
charge higher prices, and predatory lending and
check-cashing outlets that charge exorbitant fees.
Low-income residents of inner cities pay up to 22
percent more than the U.S. Department of
during their prime
earning years suggests
the need for policy
interventions.
Furthermore, in 2002
there were over
126,000 unemployed
workers in the state.
However, the num-
bers cited above do not
include the entire pop-
ulation of working
families struggling to
get by. Indeed, many experts consider the federal
poverty thresholds to be an unrealistic measure
of financial sufficiency (see box on page 8).
Many researchers suggest that doubling the fed-
eral poverty thresholds provides a better stan-
dard for assessing the financial situation of low-
wage workers and their families. Doubling the
2001 federal poverty standard would establish a
minimum income of $35,920 for a family of
four. In 2001, Maryland had almost 118,000
families with a working parent whose income fell
below that standard – or 17.6 percent of all
working families.
Even at that level – earning an income that is
twice the official poverty line – families have
financial problems. According to a study by the
Economic Policy Institute, two-thirds of
American families with incomes below that stan-
dard experience economic hardships – missing
rent or mortgage payments or relying on emer-
gency rooms for medical care.ii A significant
number of Maryland families, despite having a
working parent, must deal with this kind of
financial distress on a regular basis.
These are our working families living on the
edge. About two-thirds of working families with
incomes below the federal poverty threshold
6 Job Opportunities Task Force

Agriculture-recommended
budget for basic food items.vi
Rent-to-own furniture stores
do well among low-income
workers who cannot afford to
buy basic household furniture
outright. Those same stores,
however, charge interest rates
that drive up the cost of such
items dramatically over time.
These working families
live from paycheck to pay-
check, and tend not to have
savings accounts or emergency funds. One emer-
gency, whether it is a pro-
longed illness or an unexpect-
ed layoff, can be disastrous.
Buying a home to develop the
kind of homeowner equity
relied on for long-term securi-
ty by so many middle- and
upper-class families is all but
impossible.
These are real, daunting
obstacles. Far too many
Marylanders have little chance
of overcoming them to achieve
financial stability, no matter how hard they work.
7
least concentration of poverty viii
moderateconcentrationof poverty
severe concentrationof poverty
Connecting Low-Income Families to Good Jobs: A Policy Road Map for Maryland
ECONOMIC DISPARITIES IN MARYLAND Concentrations of Persons Below Poverty — Census 2000
In 1999, the last year for which county-level
figures are available, over 83,000 Maryland families
(or nearly 438,700 people, including those not living in
families) had incomes under the federal poverty line.vii This
represents 6.1 percent of all families in the state, and includes
working and non-working families with and without children.
The poverty rates vary dramatically from jurisdiction to
jurisdiction. The highest concentration was found in Baltimore
City, with 18.8 percent of its families, or 143,500 people, living under
the federal poverty line (see Table 2). Other large concentrations were found
in rural counties, including Somerset (15.0 percent), Dorchester (10.1 percent),
Garrett (9.8 percent), Allegany (9.7 percent), Kent (9.3 percent), and Caroline (9.0 percent).
Howard County had a 2.5 percent poverty rate, the lowest in the state.
As this map makes clear, even within counties there are pockets of extreme financial
distress scattered amid areas of affluence.
Source: U.S. Census Bureau, 2000 Census, Summary File 3. Prepared by the Maryland Department of Planning, Planning Data Services.
continued on page 10

DEFINING POVERTY REALISTICALLY
Since 1959, the federal government has calculated “poverty thresholds” that establish the minimum annual
incomes needed to support families of various sizes. For 2001, the thresholds establish the “poverty line” at $9,214
for a single person and $17,960 for a family of two parents and two children – throughout the 48 contiguous states.
Families with incomes below these levels are considered to be living in poverty. The poverty guidelines are used to
establish funding for a variety of federal programs, including food stamps, energy assistance and child healthcare.
Many experts consider the federal thresholds to be unrealistic. The poverty standards, for example, are not
adjusted to reflect the dramatically different costs of living from one area to the next, particularly for housing. Nor
has the government updated the thresholds to account for significant expenses faced by most families, including
childcare and out-of-pocket health
care spending. They also do not
take into account major public
support programs, such as the
Earned Income Tax Credit.
Several government pro-
grams for low-income families
recognize the inadequacy of the
federal thresholds and peg their
eligibility at 1.5 or 2 times the
federal poverty levels.
More realistic measures are
the Self-Sufficiency Standards
developed by Wider Opportuni-
ties for Women (WOW) and pub-
lished in Maryland by the Center
for Poverty Solutions and
Advocates for Children and
Youth.ix While the federal poverty thresholds set a minimum income necessary for survival, the Self-Sufficiency
Standards establish a minimum level at which families can achieve a safe, decent standard of living.
The Self-Sufficiency Standards calculate the actual minimum costs of living for families – including housing, child-
care, healthcare, food, transportation and taxes. They take into account actual costs of living in specific areas. In the
case of a single mother raising a preschooler and one school-aged child, the federal poverty thresholds’ minimum
income for such a family is $14,269 throughout the 48 states. Making a more realistic appraisal of what it costs to
raise two children, the WOW standards peg the necessary income for the family at $36,767 in Baltimore City,
$27,819 in Allegany County or $49,014 in Montgomery County. (see Chart 1)
The federal government seems unlikely to update its poverty calculations in the near future. Addressing the
financial plight of so many working families should not wait.
8 Job Opportunities Task Force

ADJUSTING TO MEET THE NEED IN ST. MARY’S COUNTY
9Connecting Low-Income Families to Good Jobs: A Policy Road Map for Maryland
CHARLES
MONTGOMERY
HOWARD
ANNEARUNDEL
PRINCE GEORGE'S
CALVERT
ST. MARY'S
DORCHESTERWICOMICO
WORCESTERSOMERSET
TALBOT
KENT
QUEEN ANNE'S CAROLINE
CECILHARFORD
BALTIMORECARROLL
FREDERICK
WASHINGTONALLEGANY
GARRETT
Annapolis
Baltimore
St. Mary’s County at Maryland’s southern tip enjoys a
strong economic base, due in large part to the Navy. Both
the U.S. Naval Air Systems Command and the Naval Air
Warfare Center Aircraft Division are located in the county, as
are more than 200 defense contractors – a nexus that has
created many good-paying jobs in aviation-related fields.
During the 1990s, the county’s average household income
increased by more than $17,500, to $54,706, the second
largest percentage increase of any county in Maryland.
But a sizeable group of St. Mary’s County families are
not sharing in this economic expansion. More than 1,100
families in St. Mary’s – or five percent of the total – have
incomes below the federal poverty threshold. And more than
12 percent of all families in the county had incomes below
$25,000 in 1999, according to the U.S. Census.
By and large, wage-earners in these families lack the
education or training to compete for Navy-associated jobs,
which generally offer good wages, benefits and chances for
career advancement.
“Most of the work done on the Navy base requires a
high level of sophistication,” says Ella May Russell, director of
the county’s Department of Social Services (DSS).
As the once-rural county has developed in recent years,
the agencies assisting these low-income families have also
had to evolve. The St. Mary’s DSS has refocused its efforts
to involve the entire community in helping families become
self-sufficient.
“It became imperative that we restructure the delivery
of our services around the needs of the people we serve,”
Russell said. “We took the bold step of integrating staff from
different programs to work together as a team to focus on
the needs of a particular section of the community.”
For instance, the department opened a satellite office in
Lexington Park, which had a large concentration of low-
income residents. The department also helped rejuvenate
the St. Mary’s County Community Development
Corporation and teamed with it to set up a workforce pro-
gram called the Jobs Connection in Lexington Park, which
supplements the only other employment office, 11 miles
away in Leonardtown.
The jobs program provides workforce assistance to
businesses and helps workers with skills training and job
searches. Classes for adults looking to obtain a GED are also
available, and the agencies helped establish a much-needed
daycare center at St. Mary’s Hospital.
The department even helped set up a local branch of
the national Dress for Success program, which provides
donated suits to low-income women who need them for job
interviews or for work.
Much of the funding for the initiatives comes through
the Department of Human Resources’ Program 10, which
allows local social service directors to use federal TANF
funds in flexible ways to help former welfare recipients gain
and maintain employment. P-10 funds are awarded to local
DSS agencies that use those funds to develop innovative and
effective programs that meet the unique challenges and
opportunities in the local subdivisions.
Russell knows that she and the entire St. Mary’s
Community must continue to be flexible as they help low-
income county residents. Complicating their work are budget
cuts in Annapolis, which forced the closing, for example, of
the county’s only family support center in the spring of 2003.
“This,” says Russell, “is a constant work in progress.” ■

POCKETS OF DISTRESSWhere are these families?
Many are clustered in parts of
Baltimore City, the Eastern
Shore and Western Maryland,
but there are pockets of pover-
ty in every county of the state
(see map on page 7).
Minorities account for a disproportionate
share of Maryland’s low-income families. More
than 68 percent of Maryland’s working families
with incomes below the poverty line have at least
one minority parent (see Table 1). Overall, 6.2
percent of Maryland families with at least one
minority parent have incomes below the poverty
line, compared to 2.2 percent of non-minority
families. As will be shown in later chapters, sev-
eral measures make clear that African-Americans
in Maryland have lower educational attainment
and higher unemployment rates than others in
the state.
Another way of examining the situation of
low-wage Marylanders is to see how their earn-
ings compare to those of their more prosperous
neighbors. In Maryland, there is a large gap
between the incomes brought home by the poor-
est families and middle-income families. On aver-
age, middle-income families (the middle 20 per-
cent) earned three times as much as the poorest
20 percent of families.x This is the third most
disparate ratio of all 50 states. The figure sug-
gests that moving out of the lowest-wage jobs
into middle-income jobs entails making a signifi-
cant jump for Marylanders. Consider, for exam-
ple, a worker earning $6 an hour – slightly more
than the federal and state minimum wage of
$5.15. Working full-time, that person earns
$12,480 a year. Merely to reach the median
income level of $36,298xi, that worker would
have to triple his or her income.
The data show that
Maryland, despite its affluence,
remains a place where more
than 100,000 families are
struggling to make it on their
own. And even as the economy
may be turning the corner, not
all of the state’s citizens are benefiting.
Through its programs and policies, the state
plays a key role. The state has the power to set
minimum wages and employment conditions,
and to target resources to improve the prospects
of low-income working families. Financial securi-
ty for working families should be a basic goal.
The state must help all its citizens reach it. ■
FOOTNOTES — CHAPTER 1
Falling Behind in Maryland
i U.S. Census Bureau. American Community Survey, 2002.
ii Boushey, Heather, Chauna Brocht, Bethney Gunderson, andJared Bernstein. Hardships in America. Washington: EconomicPolicy Institute, 2001.
iii Population Reference Bureau analysis of 2001 AmericanCommunity Survey data.
iv Boushey et. al., 2001.
v Population Reference Bureau analysis of Current PopulationSurvey data, three year average (2000-2002).
vi Food Research and Action Center. “Thrifty Food Plan Issues.”Washington: Food Research and Action Center, 2002; and Notar,Beth, et al. “Food Pricing in Hartford, Connecticut: Supplementto the Self-Sufficiency Study.” Hartford: Trinity College Centerfor Neighborhoods, 2002.
vii U.S. Census Bureau. “Table 16: Poverty Status in 1999:2000,” Maryland: 2000 Summary Social, Economic and HousingCharacteristics. Washington: U.S. Census Bureau, 2003.
viii Least concentration of poverty: Less than 20% below povertyand less than 200 people below poverty; Moderate concentrationof poverty: Over 20% below poverty OR 200 people or morebelow poverty; Severe concentration of poverty: Over 20% belowpoverty AND 200 people or more below poverty.
ix Pearce, Diana with Jennifer Brooks. “The Self-SufficiencyStandard for Maryland.” Baltimore: Advocates for Children andYouth and the Center for Poverty Solutions, 2001.
x Population Reference Bureau analysis of 2001 AmericanCommunity Survey data.
xi U.S. Census Bureau. American Community Survey, 2002.
While many families in Maryland
are enjoying a comfortable
standard of living, more than
one hundred thousand
working families are
struggling to get by.
10 Job Opportunities Task Force
continued from page 7

CHAPTER 2building the foundation
ings will reach $292,750. If she earns a high
school diploma or GED, her earnings will
increase to $606,795. With a college degree, her
lifetime earnings will reach an average of
$1,114,420.i
Not all workers need a four-year college
degree to earn a family-supporting wage; there is
demand for workers with post-secondary training
and industry-specific certifications. In the
Baltimore region in 2000, for
example, there were 107,392
jobs that required either
vocational or post-secondary
training or an associate’s
degree. These jobs, the
majority of which pay more
than $11.25 an hour, made
up 9 percent of the job
openings in the Baltimore
region in 2000.ii
Educational DisparityMaryland, by many
measures, is one of the best-
educated states in the nation,
thanks in part to a strong
system of public higher edu-
cation supplemented by pri-
vate institutions. In
Maryland, 43.4 percent of
people ages 25-54 have at
least an associate’s degree;
only three states have a high-
er proportion (see Table 3).
At the other end of the spectrum, a substan-
tial number of Maryland adults suffer from a
Just as a carpenter cannot build a house
without tools, a Maryland worker cannot move
ahead in today’s economy without the right
skills. It has never been more important for the
state to help workers develop skills they need to
qualify for well-paying jobs. Indeed, education
and training are the foundation for the skilled
workforce needed for a strong state economy.
Some Marylanders need assistance obtaining
a high school diploma or a
GED. For others the next step
is vocational training at a local
community college. And for a
distressingly large number of
adults in the state, the first task
is literacy instruction to
strengthen their reading and
arithmetic skills. Without these
kinds of assistance, we are con-
signing a large number of the
state’s residents to low-wage
jobs that offer little chance of
advancement.
Nationally, the average
wages of workers with a high
school diploma or GED are 46
percent higher than wages of
workers without that credential
(see Chart 2). Similarly, the
average wages of workers with
a two-year associate’s degree or
some college are 19 percent
higher than the wages of work-
ers with only a high school
diploma. Consider a young woman who drops
out of high school: on average, her lifetime earn-
■ Almost 614,000 adults – or 16 percent of the adult population – lack a high school degree or GED.
■ 913,000 adults –28 percent of the adult population – have only a high school degree or GED.
■ Tuition for Maryland’s community colleges was the 11th highest in the nation in 2001-2002.
■ Of $76.4 million in state scholarships in 2002, only 53 percent was given `out on the basis of financial need.
■ Maryland’s adult education system serves only four percent of those in need of services.
■ Three-quarters of those who took part in WIA programs in Maryland did not go through training.
■ In Maryland, only 3.7 percent of people receiving Temporary Cash Assistance (TCA) took part in approved education and training activities in 2001.
11Connecting Low-Income Families to Good Jobs: A Policy Road Map for Maryland

white or Hispanic counterparts. The 2003 high
school graduation rate for blacks in Maryland
was 77 percent, compared to 88 percent for
whites and 86 percent for Hispanics.iv
In addition, Maryland is home to 86,000
people who were born in foreign countries and
who have limited English skills.v Not surprising-
ly, that lack of English competency often trans-
lates directly into a lower standard of living. An
immigrant with limited English-speaking skills
earns 24 percent less than an immigrant worker
who is fluent in English.vi
According to figures from 1992 (the most
recent survey available), 20 percent of
Marylanders aged 16 and older read at the low-
est level measured by the National Adult Literacy
Survey.vii That means that these adults read at
less than a 4th grade level and cannot handle
such routine tasks as understanding instructions
on an appliance warranty or locating an intersec-
tion on a street map. That percentage is higher
in certain jurisdictions. For example, 33 percent
of adults in Somerset County read at this
elementary-school level.viii
Another 25 percent of the state’s adults read
at the second literacy level – roughly an 8th
grade level. Literacy
experts say these adults
are not likely to be pre-
pared to study for a
GED examination and
are generally unable to
help their children learn
to read.ix
It bears repeating
that those who cannot
read, write or do math
are ill-prepared to enter
and advance in today’s
workforce. That is par-
lack of education that does not prepare them for
advancement in the job market. In all, almost
614,000 adults in the state – 16 percent of the
adult population – have neither a high school
degree nor a GED.iii Given the numbers, it is not
surprising that a large number of Maryland
adults are in limbo – in need of a basic educa-
tion but without the money or opportunity to
obtain it.
While it is not the focus of this report, it is
important to call atten-
tion to school dropout
rates. Overall, 85 percent
of Maryland’s high
school students graduate.
However, that figure is
substantially lower in
certain areas, particularly
Baltimore City where the
graduation rate is 54 per-
cent. And African-
American students are
more likely to drop out
of high school than their
12 Job Opportunities Task Force

education statistics, that figure is higher among
new high school graduates in Baltimore City and
other pockets of the state. At Baltimore City
Community College (BCCC) an astonishing 96
percent of the students require developmental
education in one or more subjects.xii
Statewide in the 2001-2002 school year, 84
percent of recent African-American high school
graduates and 80 percent of Hispanic graduates
required developmental instruction as they
began college – compared to 68 percent of
whites (See Table 4).xiii Minority students also
had lower college graduation rates. At the com-
munity college level, 17 percent of black stu-
dents graduated or transferred within four years
of beginning, compared to
32 percent of all students.
Similarly, at four-year col-
leges, 43 percent of black
students graduated, com-
pared to 58 percent of all
students.xiv
More minorities
between the ages of 18 and
54, 14 percent of minori-
ties versus 10 percent of
whites, are enrolled in
post-secondary education
in Maryland.xv Despite
their higher enrollments,
minorities are less likely to
achieve a degree: 37 per-
cent of minorities ages 25
to 54 have an associate’s
degree or higher, compared
to 48 percent of whites.xvi
These figures suggest that minorities in Maryland
are motivated to obtain a college degree, but are
hindered by their need for developmental educa-
tion when they arrive at college.
ticularly true given the technological advances
under-girding the new economy, advances that
require workers to have higher levels of educa-
tion and training.
Preparing for CollegeAcross the state, a total of 913,000 adults –
representing 28 percent of the adult population –
have only a high school degree or GED, a pro-
portion slightly below the national average (see
Table 3).
While a high school diploma or GED is a
crucial achievement for many people looking to
work and build a career, it is by no means a
guarantee of success – particularly in Maryland.
Of the state’s working fami-
lies with incomes under the
federal poverty line, more
than 62 percent had at least
one parent whose highest
level of education attain-
ment was a high school
diploma or GED.x
Nationally, that figure is 56
percent. Because many
Marylanders have post-sec-
ondary levels of education,
competition is stiff enough
that workers with only a
high school diploma are
more likely to obtain only
low-wage jobs.
Many low-wage workers
who are eager to continue
their education in college are
not adequately prepared. Of new high school
graduates enrolling in a state community college,
72 percent required developmental education
(or remedial education) in math, reading or
writing – or in all three.xi As with so many
13Connecting Low-Income Families to Good Jobs: A Policy Road Map for Maryland

BCCC, must focus more rigorously on develop-
mental education at both BCCC and other com-
munity colleges.
College accessMarylanders understand that post-secondary
education provides a key tool for low-income
workers to develop the skills they need to move
ahead in the workforce. Almost 328,000 adults
between the ages of 18 and 54 were enrolled in
post-secondary institutions in 2001.xix However,
Maryland has not taken adequate steps to make
higher education affordable for many of its
lower-income residents.
The least expensive option for many
Marylanders is a community college – which
offers both degree and certificate programs that
prepare students for a vocation. But even com-
munity college remains out of reach for many
working families. Tuition for Maryland’s commu-
nity colleges was the 11th highest in the nation in
2001-2002.xx Consider a low-wage worker
attempting to go to community college part-time.
With the average cost of a three-credit course
and mandatory fees at a Maryland community
college in 2002 totaling $243xxi, a part-time stu-
dent taking four courses a year would spend an
average of $972. Transportation and childcare
costs, as well as books, would be in addition to
that. For low-wage workers, $1,000 a year can
be prohibitive without financial assistance.
At the same time, Maryland does not devote
enough scholarship money to need-based aid
programs. Of the $76.4 million the state provid-
ed in grants for financial assistance in 2002, only
53 percent was given out on the basis of financial
need.xxii The balance was distributed based on
merit and through grants for students studying in
specified fields or to students selected by state
legislators. The Educational Assistance Grant, the
The Maryland Department of Education
reported in 1998 that several issues contributed
to the disparity in minority academic achieve-
ment, including funding inequities, problems
of accountability, inadequate teacher qualifica-
tions, class size, instructional materials, and
parental involvement, as well as the broad
impact of poverty and school or classroom
homogeneity. Despite the fact that Maryland has
become more diverse, schools have remained
homogeneous with minority students generally
segregated in remedial programs that come with
lower expectations than programs offered to
white students.xvii These low levels of academic
achievement by minorities in elementary and
high school will affect both their post-secondary
achievement and their future earnings.
The high number of students needing devel-
opmental education creates demands on the
state’s community colleges. The Community
College of Baltimore County has been recognized
for its innovative developmental services for
poorly prepared students. In contrast BCCC is
struggling to provide what amounts to extra
years of high school for a substantial majority of
its student body. Pass rates for developmental
classes are low, which forces many students to
repeat classes.xviii For students attempting to jug-
gle jobs, school and families, repeating classes
can become overwhelming. On a more practical
level, repeating classes can quickly exhaust finan-
cial aid for students already struggling to pay for
childcare and transportation. Without that help,
many low-income students have few options but
to drop out.
BCCC is well aware of the challenges
involved with its large developmental program
and is taking steps to improve the program’s
effectiveness. However, the state, which operates
14 Job Opportunities Task Force

state’s primary need-based
grant for undergraduate stu-
dents, has a waiting list of
more than 9,000 students.xxiii
The state is increasingly
relying on loans instead of
direct need-based grants for
college students. Between 1992
and 2002, the primary source of financial
assistance shifted significantly. Loans increased
from 31 to 48 percent of financial aid at public
institutions, while grants shrunk from 37 to 30
percent.xxiv The trend toward increasing reliance
on loans does not support the goal of increasing
access and affordability for low-income students.
Loans can pose a significant burden to cash-
strapped families and can contribute to these
students’ future credit and debt problems.
The largest source of need-based college aid
is the federal Pell grant program, and it is
instructive to measure how Maryland’s support
of low-income students compares to federal
expenditures and that of other states. Maryland’s
contribution to need-based aid is 42 percent of
the amount received by low-income residents
through federal Pell grants.xxv By comparison, 12
other states contribute 50 percent or more of the
Pell grant expenditure.
The issue of need-based scholarships in
Maryland has arisen often in recent years. Most
prominently, in November 2003 the state’s policy-
making board in higher education issued a unani-
mous call for more need-based aid and for limited
tuition increases at the state’s public campuses.
“We call on institutions to direct more of
their institutional aid to needy students and make
every effort to moderate tuition increases by
operating as efficiently and effectively as possi-
ble,” the Maryland Higher Education
Commission said in its resolution.xxvi
The Commission issued its
resolution in the wake of
recent significant tuition
increases at the state’s public
campuses, increases that only
exacerbate the problem facing
low-income Marylanders.
Maryland does provide
funding for other programs to help low-wage
workers to continue their education. For exam-
ple, it is one of only three states that pay for
non-credit career classes as part of their funding
formulas for community colleges, in effect lower-
ing the cost to the student for such classes.
In addition, Maryland provides grants to
part-time college students, and the Jack F.
Tolbert Memorial scholarship program assists
some students attending private career schools.
Both of these programs provide crucial help for
lower-income workers. However, both have
experienced funding reductions. In 2002, the
Tolbert program provided $297,000 to help 989
students at private career schools.xxvii Funding
for that program was cut by more than 6 per-
cent in fiscal year 2004. State funding for part-
time student scholarships dropped from $2.8
million in fiscal year 2002 to $1.35 million in
the current budget.xxviii This is particularly dis-
tressing because part-time students are not eligi-
ble for the much larger Educational Assistance
Grant program cited above.
Similarly, the state’s calculations for financial
aid eligibility do not accurately measure the
financial costs incurred by commuter students.
For example, commuter students cannot now
count childcare expenses as part of their higher
education expenses.
Maryland’s system of data collection does
not adequately measure the performance of low-
income students as required by the federal
Maryland has not taken adequate
steps to make higher education
affordable for many of its
lower-income residents.
15Connecting Low-Income Families to Good Jobs: A Policy Road Map for Maryland
ing increased. Between 1990 and 2002, the share
of federal funds used for these adult education
classes in Maryland increased from 58 percent of
the total budget to 88 percent.xxxii Maryland
grew far too reliant on federal support for this
crucial but under-funded task.
The state increased its contribution in fiscal
year 2003 to $2.3 million. That level held steady
in fiscal year 2004. However, that figure equals
only about $60 per person enrolled in adult edu-
cation programs.xxxiii Massachusetts, on the
other hand, spent $1,056 per student in
2002.xxxiv
Maryland’s adult education instruction also
tends to be insufficient in length. While research
indicates that students require between 100 and
150 hours of instruction to make significant
gains, students here receive an average of 69
hours of instruction.xxxv
It is clear the state must devote additional
money to adult education programs. At the
same time, the state should look for new incen-
tives to encourage employers to establish their
own workplace education programs. Workplace
education, defined as adult education classes
offered in the workplace and related to the work-
place context, are crucial to improving the skills
of the low-wage workforce. The majority of peo-
ple in need of adult education (people without a
Perkins Act, which supports vocational and tech-
nical education. In fiscal year 2002, Maryland
allocated 35 percent of the federal money it
received through the Perkins program to post-
secondary education, with the remainder going
to secondary education.xxix However, the state
co-mingles its Perkins grant with other funds,
making tracking the impact of the funds on dis-
advantaged students difficult.
The state also does not track the types of
jobs, career advancement and wages of students
completing community college and certificate
programs. These kinds of data would be valuable
to policymakers and education leaders as they
develop future guidelines.
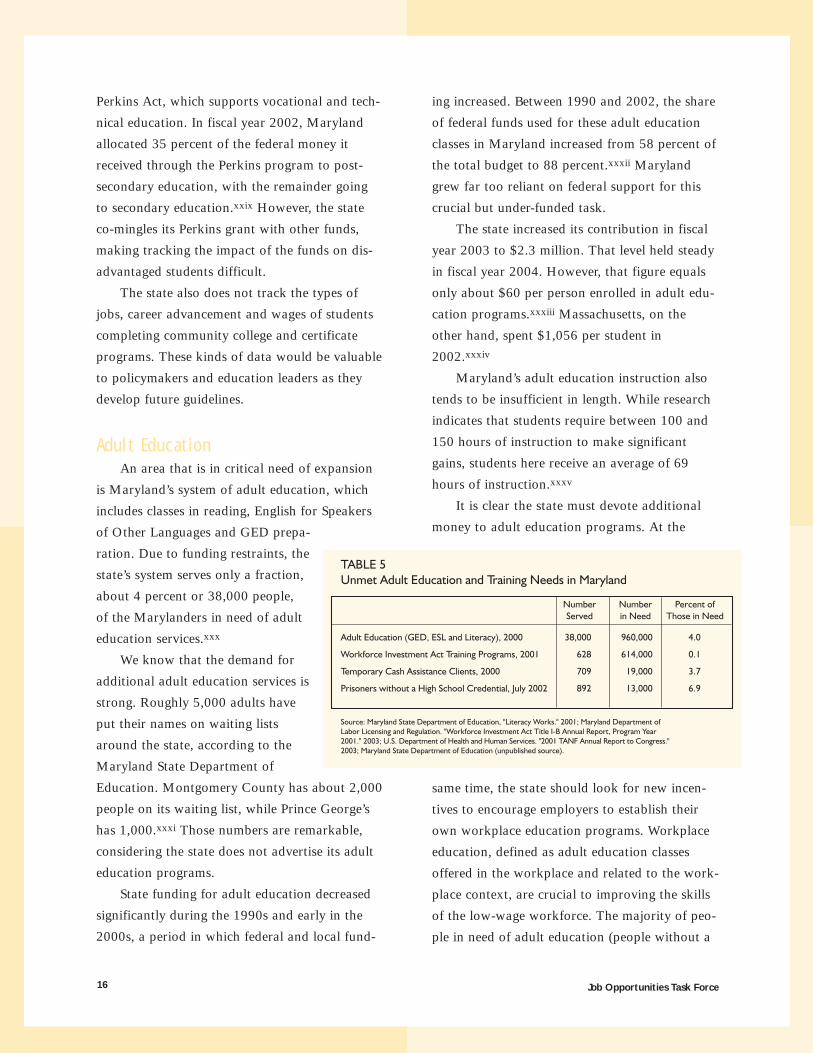
Adult EducationAn area that is in critical need of expansion
is Maryland’s system of adult education, which
includes classes in reading, English for Speakers
of Other Languages and GED prepa-
ration. Due to funding restraints, the
state’s system serves only a fraction,
about 4 percent or 38,000 people,
of the Marylanders in need of adult
education services.xxx
We know that the demand for
additional adult education services is
strong. Roughly 5,000 adults have
put their names on waiting lists
around the state, according to the
Maryland State Department of
Education. Montgomery County has about 2,000
people on its waiting list, while Prince George’s
has 1,000.xxxi Those numbers are remarkable,
considering the state does not advertise its adult
education programs.
State funding for adult education decreased
significantly during the 1990s and early in the
2000s, a period in which federal and local fund-
16 Job Opportunities Task Force

In program year 2003,
the state received $28.7
million in federal Workforce
Investment Act (WIA) fund-
ing, the main source of sup-
port for workforce develop-
ment in Maryland.xxxvii The
majority of WIA funds were used to provide
job placement services but not job training.
While valuable, these job placement services do
not provide the skill enhancement that can help
low-wage workers qualify for more demanding,
better-paying jobs.
Three-quarters of those who took part in WIA
programs in Maryland did not go through train-
ing.xxxviii In 2001, 628 adults took part in training
services paid for through WIA.xxxix An additional
1,084 laid-off workers also took part in WIA
training. Those receiving training represented less
than 1 percent of all working-age adults without a
high school diploma or GED, and only about 6.5
percent of the state’s unemployed workers.
The low participation numbers are doubly
discouraging given the results these training pro-
grams have produced. Of disadvantaged adults
who participated in WIA-funded training pro-
grams in 2001, 87 percent obtained both a job
and a credential. In addition, of the workers who
went through a training program and got a job,
almost 97 percent stayed employed for at least 6
months after exiting the training program.xl
Under federal regulations, states can devote
as much as 30 percent of their WIA adult educa-
tion and training dollars to areas with high con-
centrations of poverty or unemployment. While
Maryland does not use an alternative allocation
formula for high poverty, high unemployment
areas, five other states do – Arizona, Florida,
Iowa, Virginia and Wisconsin.xli The state should
consider whether using an alternative funding
high school credential, with low
English language skills or with
low literacy skills) are already
employed.xxxvi
Some innovative employers
in Maryland, including the
Johns Hopkins Hospital and
Marriott Corporation, have established educa-
tion programs in the workplace. Employers
benefit when employees increase their basic
skills. Research shows that adult education
results in increased productivity, improved
employee teamwork and morale, and an
increased pool of more qualified workers for
more advanced positions.
Workers benefit from workplace education
when they become eligible for higher paying
positions within the same company. Workplace
education is convenient for workers, who are
often balancing work and family responsibilities.
Participation in adult education increases when
employers provide paid time off to participate in
educational activities.
Workforce Development For low-income workers looking to move
ahead, continuing their education is only part
of the battle. In many cases they require help
with childcare or transportation to be able to
participate in training programs that provide
qualifications for job openings. Workforce devel-
opment programs, some of which use federal
workforce funds and are guided by state and
local Workforce Investment Boards, can provide
crucial assistance to low-income workers seeking
better jobs. Statistics show that such programs
are effective, but inadequate funding has meant
that only a small percentage of eligible workers
in Maryland are being helped.
The majority of people
in need
of adult education
are already employed.
17Connecting Low-Income Families to Good Jobs: A Policy Road Map for Maryland

2001, compared to a national
average of 6.3 percent.xliv One
key reason that rate is low is
that Maryland policy requires
TCA recipients to work at
least 20 hours a week before
they can enroll in an education
program that would count as part of their man-
dated work activity. This policy should be revised
so that for TCA recipients who lack a GED or
high school diploma, adult literacy programs
would count as a work activity.
The legislature has taken some steps to
help former welfare recipients. The Job Skills
Enhancement Program funded by the Depart-
ment of Human Resources supports additional
training for former welfare recipients who are
employed. The state provided $157,749 in fund-
ing for this program in fiscal year 2004, a reduc-
tion from $691,951 in fiscal year 2002, when the
program began.xlv
Acknowledging how hard it is for low-wage
workers to develop financial security, the
General Assembly in 2001 created a five-year
pilot program in which the state partially
matches savings earned by low-income workers
and placed in Individual Development
Accounts. The program received $100,000 in
state funds in its first year and offered a promis-
ing means for workers to build assets that could
be used for home ownership, small-business
investments and other eligible expenditures.
Due to budget problems, the state stopped fund-
ing the program after the first year.
Preparing Prisoners for WorkOne group of Marylanders in dire need of
special attention is the state’s prison inmates.
Maryland prisons house about 24,000 inmates.
The vast majority of prisoners will eventually be
formula that gives priority to
high poverty and unemploy-
ment areas would improve out-
comes for low-wage workers
and job seekers.
Leaving Welfare Like many other states, Maryland is strug-
gling with ramifications of the 1996 federal wel-
fare reform laws. That year, Congress replaced
the Aid to Families with Dependent Children
with the Temporary Assistance for Needy
Families program. The TANF program provides
financial assistance to families in need and helps
low-income parents become more self-sufficient.
As of September 2003, more than 71,000 people
in Maryland were receiving welfare, down from
approximately 225,000 in 1996.xlii
As part of that reform, welfare recipients’
benefits are linked to work approved activities.
This approach has reduced the welfare rolls, but
has not resulted in moving these families into
economic self-sufficiency. There are some statisti-
cal indications of the major challenges faced by
former welfare recipients. One study that tracked
Maryland women who left welfare between 1996
and 2003 found that only half were employed in
Maryland a year after they stopped receiving
benefits.xliii (Others who were employed outside
of Maryland were not tracked.) Of those who
were working in Maryland, their median quarter-
ly earnings were $2,779, well below the federal
quarterly poverty standard of $3,815 for a family
of three. While an exact analysis is not possible
given the available data, it is apparent that a sub-
stantial number of these families were living in
poverty one year after leaving the welfare rolls.
In Maryland, 3.7 percent of people receiving
Temporary Cash Assistance (TCA) took part in
approved education and training activities in
Many low-wage workers
who are eager to continue
their education in college
are not
adequately prepared.
continued on page 20
18 Job Opportunities Task Force

Training & Support = Jobs and Opportunity
For 23 years, the employees at the Occupational
Training Center at the Community College of Baltimore
County have been helping low-wage workers improve their
skills. Over time, the Center has learned that it takes a wide-
ranging approach to prepare these workers for better-paying
jobs and a steady career in the workforce.
At its core, the Center offers courses in an array of
fields with high demand for workers – such as commercial
trucking, information technology and surgical technology.
The Center works closely with local employers to ensure
that it is training students for available employment. And
for those without a high school diploma, the Center offers
courses leading to a GED, a key prerequisite for many
entry-level jobs.
Knowing that their students’ lives do not always con-
form to the traditional academic schedule, the Center
allows students to begin and progress through courses at
their own pace.
In 2002, of the students that enrolled in vocational pro-
grams, the Center helped place 81 percent in jobs in such
fields as bookkeeping, network cabling and automated manu-
facturing. Those 126 students’ average starting wage was
$12.25 an hour.
Funding for the Center comes from a variety of
sources, including Workforce Investment Act funds, federal
Pell grants, local government and employers who want to
provide training for their employees.
Technical and academic training at the Center is crucial.
So too is its attention to other issues that affect students’ job
prospects. Counselors at the Center help students cope with
the personal and financial demands of re-entering or staying
in the workforce. That may mean finding suitable clothes
for the workplace, helping arrange childcare or explaining
to a student how to purchase a bus pass. Sometimes it
even means taking the employee to a transit office to buy
a bus pass.
“We will help them put things into place so these barri-
ers do not exist,” says Marguerite Walsh, Dean of the Center.
One goal is to provide a supportive environment for
students who have often struggled in school and on the job.
Staff members at the Center make a point each month of
holding an awards ceremony to celebrate the progress of
students, whether it is finishing a course or finding a job.
“The message is, ‘You have value,’” Walsh says. “They
have had so many experiences that have told them, you don’t
have value.” ■
19Connecting Low-Income Families to Good Jobs: A Policy Road Map for Maryland

20 Job Opportunities Task Force
POLICY RECOMMENDATIONS
1) Remove financial barriers for low-income working adults seeking to upgrade their skills
through post-secondary education.
■ Allocate a larger portion of existing financial aid funds to need-based aid.
■ Change requirements for all need-based aid to allow part-time students to be eligible.
■ Update the cost-of-living allowance for commuter students, including allowing childcare to
be a counted expense.
2) Increase opportunities for low-income working adults to upgrade their education through adult
education and training.
■ Over three years, increase the percentage of the eligible population who receive adult education.
Use a funding formula that increases the target population being served by 5 percent each
year, while also accounting for growth in the target population.
■ Establish a 50/50 matching grant program for employers who provide workplace
education programs.
■ Increase funding for correctional adult education programs.
3) Assist welfare recipients to improve their long-term earnings capacity by providing increased
education and training opportunities.
■ Allow adult education to count as a Family Investment Program core activity for Temporary
Cash Assistance recipients, as allowed by federal provisions.
released. Securing employment is difficult enough
with a criminal record; for those without ade-
quate education or training, the task is much
more difficult.
State law requires the state to provide devel-
opmental education for inmates who lack a high
school diploma or GED. However, the state has
not committed the funding needed to fulfill this
mandate. In July 2002, only 6.9 percent of the
13,000 inmates who should have been receiving
adult education offerings were doing so; hun-
dreds more were on waiting lists.xlvi The prisons’
certified occupational skills training courses were
also under-funded; in 2002, only 6.6 percent of
eligible inmates were receiving occupational
training.
In the fall of 2003, Gov. Robert L. Ehrlich, Jr.
announced a plan to increase funding for inmate
education and training programs. This is a prom-
ising step that deserves support from legislators
and policy-makers. Programs to help inmates earn
a GED or high school diploma have a good com-
pletion rate; more than three out of five inmates
who begin such a program complete it. This cre-
dential is valuable when ex-prisoners return to
their communities and seek employment. ■
continued from page 18

21Connecting Low-Income Families to Good Jobs: A Policy Road Map for Maryland
i Sum, Andrew as cited in Job Opportunities Task Force.“Baltimore’s Choice: Workers and Jobs for a Thriving Economy.”Baltimore: Job Opportunities Task Force, 2003 (p. 46-47).
ii Job Opportunities Task Force. “Baltimore’s Choice: Workersand Jobs for a Thriving Economy.” Baltimore: Job OpportunitiesTask Force, 2003.
iii Maryland State Department of Education. “Literacy Works:Moving from the Margins to the Mainstream.” Baltimore:Maryland State Department of Education, 2001.
iv Maryland State Department of Education. “2003 PerformanceReport.” Baltimore: Maryland State Department of Education,2003.
v Maryland State Department of Education “Literacy Works,”2001.
vi MassINC. “New Skills for a New Economy.” Boston:MassINC, 2000.
vii Reder, Stephen. “State of Literacy in America.” Washington:National Institute for Literacy, 1996.
viii Ibid.
ix Maryland State Department of Education, “Literacy Works,”2001.
x Population Reference Bureau analysis of 2001 AmericanCommunity Survey data.
xi Maryland Higher Education Commission analysis prepared forauthors. Developmental education was formerly known as reme-dial education.
xii The Abell Foundation. “Baltimore City Community College atthe Crossroads.” Baltimore: The Abell Foundation, March 2002.
xiii Maryland Higher Education Commission analysis preparedfor authors.
xiv Maryland Higher Education Commission. “2003 DataBook.” Annapolis: Maryland Higher Education Commission,2003.
xv Population Reference Bureau analysis of 2001 AmericanCommunity Survey data.
xvi Ibid.
xvii Maryland State Department of Education. “MinorityAchievement in Maryland: the State of the State.” Annapolis:Maryland State Department of Education, 1998.
xviii The Abell Foundation, 2002.
xix Population Reference Bureau analysis of 2001 AmericanCommunity Survey data.
xx National Center for Education Statistics. “Digest of EducationStatistics, 2002.” Washington: U.S. Department of Education,2002.
xxi Maryland Higher Education Commission. “2003 TrendBook.” Annapolis: Maryland Higher Education Commission,2003.
xxii Maryland Higher Education Commission. “Office of StudentFinancial Assistance FY2002 Annual Report.” Annapolis:Maryland Higher Education Commission, 2003.
xxiii University System of Maryland, Maryland Higher EducationCommission and Maryland Association of Community Colleges.“Ability of Higher Education to Meet Enrollment Growth andWorkforce Demands.” Memo to Senator Ulysses Currie andDelegate Howard (Pete) Rawlings, Maryland General Assembly,November 2003.
xxiv Ibid.
FOOTNOTES — CHAPTER 2 — BUILDING THE FOUNDATION
continued on next page
Additional Data Are Needed to Assess Program Outcomes In conducting research for this report, we found several instances where data needed to assess
the impact of state programs on low-income working families are not collected by state agencies.
We recommend that state agencies develop systems to track the following information:1. Timely statistics measuring literacy in Maryland.2. The effect that adult education programs have on workers’ incomes.3. The effect that a community college degree or technical certificate has on students’ incomes.4. The impact that post-secondary programs funded with Perkins money have on
students’ incomes.4. The effect that WIA training programs have on workers’ incomes.5. The amount of WIA funding devoted to training statewide and by Workforce
Investment Area. 6. The income of former welfare recipients after they leave cash assistance programs.

xxv National Center for Public Policy and Higher Education,“Losing Ground: A National Status Report on the Affordabilityof American Higher Education,” San Jose: National Center forPublic Policy and Higher Education, 2002.
xxvi MacGillis, Alec. “Panel Rebukes Colleges for RisingTuition.” The Baltimore Sun. November 19, 2003.
xxvii Maryland Higher Education Commission. “Office ofStudent Financial Assistance FY2002 Annual Report.” Annapolis:Maryland Higher Education Commission, 2003.
xxviii Maryland Higher Education Commission. “Office ofStudent Financial Assistance FY2002 Annual Report,” 2003 andMaryland Department of Budget and Management. “FY2004Operating Budget Detail.” Annapolis: Maryland Department ofBudget and Management, 2003.
xxix U.S. Department of Education, Office of Vocational andAdult Education.
xxx Maryland State Department of Education. “Literacy Works.”2001.
xxxi Maryland Association for Adult Community and ContinuingEducation (unpublished).
xxxii Maryland State Department of Education. “LiteracyWorks.” 2001.
xxxiii Author’s analysis based on enrollment and funding levelsfor fiscal year 2004 (data provided by Maryland StateDepartment of Education).
xxxiv Maryland State Department of Education. “LiteracyWorks.” 2001.
xxxv Ibid.
xxxvi MassInc. “New Skills for a New Economy.” 2000.
xxxvii Maryland Department of Labor, Licensing and Regulation.“Workforce Investment Field Instruction, (WIFI) No. 5-02,Change 1.” Baltimore: Maryland Department of Labor, Licensingand Regulation, 2003.
xxxviii Author’s communication with the Maryland Departmentof Labor, Licensing and Regulation.
xxxix Maryland Department of Labor, Licensing and Regulation.“Workforce Investment Act Title I-B Annual Report, ProgramYear 2001.” Submitted to the U.S. Department of Labor. January21, 2003.
xl Ibid.
xli National Governors Association. “Workforce Investment ActImplementation: Strategic Plans of Final 30 States.” Washington:National Governors Association, 2001.
xlii Family Investment Administration. “Monthly StatisticalReport, September 2003.” Baltimore: Maryland Department ofHuman Resources, 2003.
xliii Ovwigho, Pamela, et al. “Life After Welfare: Eighth Report.”Baltimore: Family Welfare Research and Training Group, 2003.
xliv U.S. Department of Health and Human Services. “2001TANF Annual Report to Congress.” Washington: U.S.Department of Health and Human Services, 2003.
xlv Maryland Department of Human Resources (unpublishedcommunication).
xlvi Maryland State Department of Education (unpublished com-munication).
22 Job Opportunities Task Force
continued from previous page

Education and skills enhancement serve as
cornerstones for low-wage workers seeking to
advance and grow in their careers. However, edu-
cation and skills enhancement will be of limited
value if there are not enough jobs with good pay
and benefits. Maryland needs a well-rounded
approach, one that strives both to prepare work-
ers for better-paying jobs and to attract and
strengthen employers that create those jobs.
Maryland recognizes that helping businesses
recruit, create and retain jobs plays an important
role in maintaining a healthy state economy. In
Fiscal Year 2003, Maryland’s Department of
Business and Economic Development (DBED)
spent $74.3 million on loans, grants, bond guar-
antees and equity investments to spur job cre-
ation in the state (this amount
does not include the value of
“tax expenditures,” or rev-
enue lost through tax breaks).i
These programs are available
to both start-up businesses
and those looking to expand.
The state has also established
programs aimed at specific
sectors of the economy, pro-
viding special assistance in the
areas of manufacturing, film
and tourism, software devel-
opment, advanced technology
and biotechnology.
The Ehrlich administra-
tion is making some efforts to
better integrate economic development and
workforce development programs. But DBED’s
two employee skill and productivity enhancement
programs are not focused on upgrading skills for
low-wage workers. This chapter recommends
ways to use resources in DBED and the
Maryland Department of Labor, Licensing and
Regulation (DLLR) to better help low-income
workers acquire skills and obtain jobs that pro-
vide family-supporting wages.
Unemployment in MarylandIn discussing job-development efforts, it is
instructive to review Maryland’s unemployment
statistics. In November 2003, Maryland’s official
unemployment rateii was 4.1 percent, compared
to 5.6 percent for the nation.iii Although
Maryland’s economy appears stronger than most
states’, there is still cause for concern. The state’s
unemployment rate remains
higher than it was at the start
of the most recent recession,
even though the state’s econo-
my shows signs of recovery.
And a 2003 analysis by the
Economic Policy Institute
shows that job creation in
Maryland has not kept pace
with the number of new people
entering the labor force.iv
While the statewide official
unemployment figure is rela-
tively low, pockets of the state
suffer from much higher unem-
ployment. In November 2003,
six counties in central and
southern Maryland – Calvert, Carroll, Frederick,
Howard, Montgomery and St. Mary’s – had
unemployment rates lower than 3 percent. Other
Creating Good Jobs CHAPTER 3
23Connecting Low-Income Families to Good Jobs: A Policy Road Map for Maryland
■ Parents in many Maryland families work in jobs with inadequate wages.
■ More than 180,000 Marylanders – 6.7 percent of the workforce – held more than one job to support their families.
■ Over 384,000 Marylanders in 2002 earned less than a poverty-level wage of $8.61 per hour.
■ Maryland has not made creating good jobs for low-income workers a priority.
■ The state’s largest skill enhance-ment and productivity programs do not assist low-income workers.

jurisdictions – Baltimore City
and Dorchester, Somerset and
Worcester counties on the
Eastern Shore – had rates
above 6 percent (see Table 6).
African-Americans are
hardest hit, with unemploy-
ment rates that are typically at
least twice as high as those for
white Marylanders. In 2002
(the most recent year for
which data are available by
race), the state unemployment
rate was 8.2 percent for black
men and 7.1 percent for black women, compared
to 2.9 percent for white men and 3.2 percent
for white women.v The official unemployment
rate represents an undercount of those without
a job because the federal definition of unemploy-
ment is so narrow it does not include many
working age individuals who can work but are
without employment.
Another important measure of economic
well-being is the percent of the population in the
labor force. On that
score, Maryland per-
forms better than the
country as a whole. In
2000, 67 percent of the
civilian, non-institution-
al population over the
age of 15 in Maryland
was in the labor force –
meaning they were
either working or look-
ing for work (see Table
7 for labor force partici-
pation by race). The
national average is
63.4 percent.vi
However, the labor partic-
ipation rate varies significantly
from region to region within
Maryland. In 2000, such
counties as Anne Arundel,
Calvert, Carroll, Charles,
Frederick, Harford, Howard,
Montgomery, Prince George’s
and St. Mary’s had labor force
participation rates of over 70
percent, while Allegany,
Baltimore City, Garrett and
Somerset had rates under 60
percent. (See Table 8). In
Somerset County, for instance, half of the popula-
tion was not working or looking for work.
Even many of those who are employed strug-
gle economically. In 2002 more than 182,000
Maryland workers – 6.7 percent of the work-
force – held more than one job to support their
families.vii And more than 384,000 Marylanders
earned less than a poverty-level wage of $8.61
per hour that year, the amount a full-time worker
needs to earn to keep a family of four above the
federal poverty line,
adjusted for regional
cost of living.viii
Against that back-
drop, creating good jobs
for entry-level workers
and helping them
improve their skills
should be priorities for
state government.
Some state policies
do focus on low-wage
workers. Companies in
designated Enterprise
Zones are eligible for tax
credits for employing dis-
24 Job Opportunities Task Force

advantaged workers, those who have recently left
welfare or who meet certain low-income criteria.
The Employment Opportunity Tax Credit offers
credits to companies that employ former welfare
recipients.ix However, both of these promising
programs are underutilized. State records show
that no more than 96 employers, less than 1 per-
cent of all of the state’s employers, claimed either
one of the credits in 2000.x In all, those compa-
nies employed fewer than 1,000 workers who fit
the criteria in the law. Further
study of the tax credits and
businesses’ failure to claim
them is needed.
Maryland has taken an
important step in joining 42
other states that set a mini-
mum wage standard for jobs
created by businesses that
receive some state economic
development assistance.xi The
tax credit programs cited
above, as well as the Job
Creation Tax Credit, require
that companies claiming the
credit must pay at least 150 percent of the mini-
mum wage, $7.73 per hour, for the new jobs
they create.
By setting the wage standard for these eco-
nomic development programs at 150 percent of
the regular minimum wage, the state has aimed
low. That wage is not enough to keep a family
above the federal poverty line.
Targeted Training Maryland’s main workforce development
program designed to assist low-wage workers
become economically self-sufficient is the STEP
(Skills-Based Training for Employment
Promotion) program, which is funded through
DLLR. The General Assembly created the pro-
gram in 2001 and appropriated $1 million a year
for grants to local agencies to establish pilot pro-
grams.xii This program is designed to increase the
skills of incumbent workers whose incomes fall
below 200 percent of the federal poverty level
while also addressing the state’s critical manpow-
er shortages in health care, technology and trans-
portation sectors. The STEP program pays for
the workers’ training, transportation, training
supplies and childcare. It
leverages private funds by
requiring employers who par-
ticipate in the program to
match the state’s expendi-
tures, often in the form of
wages paid to workers while
they are in training.
Companies and workers
in Baltimore City, Prince
George’s County, Montgomery
County and Southern
Maryland have benefited from
STEP, chiefly in health care
occupations. In the Baltimore
City STEP program, participants’ average annual
incomes increased by $5,800.xiii That is real eco-
nomic advancement for low-income working fami-
lies. However, funding for the program was cut to
$500,000 in fiscal year 2004 and faces possible
elimination in the coming budget year.
A new program, Maryland Business Works,
began in 2003 with a federally funded budget of
$1 million. It awards grants to businesses that
match the grants and use the proceeds to train
their existing employees. The program focuses on
small businesses and companies in the healthcare
industry. However, this program is not targeted
toward assisting low-wage workers achieve
financial security.
25Connecting Low-Income Families to Good Jobs: A Policy Road Map for Maryland

Under the federal WIA
program, the governor controls
distribution of 15 percent of
the WIA funds in a “discre-
tionary fund,” which amount-
ed to more than $4 million last
year. These funds have been
used to maintain and disseminate lists of train-
ing programs, cover shortfalls in local WIB
budgets, provide incentives when WIA stan-
dards are met, and develop a centralized infor-
mation management system. As the state grap-
ples with tight economic times, it should dedi-
cate half of the discretionary WIA funds to
training programs for low-income workers and
job seekers. These funds could help maintain
the STEP program or create an industry-led
version of this program.
Strengthening Businesses Two DBED training programs, the Maryland
Industrial Training Program (MITP) and the
Partnership for Workforce Quality (PWQ), are
designed to help businesses improve the skills of
their current employees.
Neither program focuses on low-wage
workers. The budgets for these two training
programs dwarf STEP’s, which does focus on
lower-wage employees.
MITP, which was created in 1969, provides
grants to companies for training costs associated
with new or expanded operations.xiv To be eligi-
ble for assistance, companies must create jobs
that pay at least 150 percent of the minimum
wage. While that guarantees a certain wage for
new hires, MITP makes no demands about
improving skills of workers at the low end of the
wage scale.xv The PWQ grant program does not
set a minimum wage for new jobs created by
companies receiving training assistance.xvi
A 2002 national study
found that employers devoted
the smallest share of their
training expenditures to “basic
skills” training – only 2 percent
of their training budget. State
programs that subsidize train-
ing should fill the gaps in the private sector, not
replace expenditures that employers are willing
to make to train higher-level employees.
The state’s grant and loan programs fail to
require businesses that benefit from state support
to create a certain number of jobs.xviii While loan
recapture provisions exist if businesses do not
meet job creation goals, they are not consistently
enforced. The General Assembly can change state
policy to require all businesses that access public
benefits to repay those benefits if a minimum
number of new jobs is not created.
The terms of some state loans require busi-
nesses to pay a $7.73 per hour minimum wage for
new jobs. In some cases, the state sets a higher
wage standard, but in others the state has waived
the standard entirely.xix Loans to businesses to
improve their facilities generally do not carry any
requirements for wages paid to their workers.
Better CoordinationMaryland could better coordinate its eco-
nomic development and workforce development
efforts to benefit low-wage workers. This would
require a commitment from ranking state offi-
cials that training low-wage workers to fill high-
er-skill jobs in high-demand sectors is necessary
and makes economic sense.
Today, workforce development programs
involving low-wage workers are handled by
DLLR. Economic development and important
industrial training programs are part of DBED.
DBED serves businesses, while DLLR serves
Education and skills enhancement
will be of limited value
if there are not enough jobs
with good pay and benefits.
26 Job Opportunities Task Force

workers, including unemployed
and disadvantaged workers.
The missions of these two agen-
cies are not mutually exclusive,
and the needs of businesses and
workers often converge.
Improved coordination between
these agencies can address the issues of employers
who need a stable, trained workforce, and work-
ers who want increased economic opportunities.
Businesses will grow and increase productivity
with a trained workforce; workers can increase
wages by upgrading their skills.
The Governor’s Workforce Investment Board
(GWIB) Sub-cabinet, which is composed of every
state agency that has a workforce program, is a
natural mechanism for improving coordination
between the two departments. The Sub-cabinet
has shown its ability to focus on specific work-
force sector issues, most recently on labor short-
ages in the health care industry. The Sub-cabinet
participated in a much-needed summit of
employers, policymakers and others to discuss
the problem.xx There is no reason it could not
play a similar role again with a focus on other
growth industries – and on training programs
needed within those sectors.
Public DisclosureOne key concern about Maryland’s economic
development efforts involves a lack of public
awareness of results in the job creation arena.
The state, in short, does not adequately disclose
the results of its loans and grants – in particular,
the caliber of jobs, including wages and benefits,
created by companies receiving state assistance.
State business loans and grants include
requirements about job creation. Companies that
fail to fulfill those requirements can be penalized
by being forced to repay certain state assistance.
In 2003, the Baltimore Sun
reported that the state required
seven companies to repay more
than $2 million after failing to
meet job creation targets.xxi
DBED projects the number
of new and retained jobs likely
to result from its grant and loan programs.
However, legislative auditors have called into
question the accuracy of those projections. In its
audit, the Department of Legislative Services
found that DBED “did not have comprehensive
quality control procedures to ensure the accuracy
of the reported results.”xxii
Aside from the accuracy issues, there are two
major shortcomings of the available data from
DBED. First, the department reports only projec-
tions of jobs, not actual jobs created. Second, the
job projections are not company specific. Rather,
the department presents the data only in the
aggregate, which makes it impossible to track the
number and quality of jobs created through a
subsidy to a specific company. In one published
article, a company that received a $1 million
state subsidy did not come close to creating the
types of jobs it had promised.xxiii
Second, the department has failed to investi-
gate and report the number and types of jobs
that are actually created with state assistance.
This creates an information vacuum.
State agencies must take steps to make this
kind of information easily available to the public
so it can gauge the effectiveness of state economic
development expenditures. At a minimum, state
agencies should track and report the types of jobs
and the wages and benefits for these positions.
At the same time, the state legislature must
play a more prominent role in monitoring these
expenditures to ensure that the funds are being
spent effectively and responsibly. ■
Businesses will grow and increase
productivity with a trained
workforce; workers can increase
wages by upgrading their skills.
27Connecting Low-Income Families to Good Jobs: A Policy Road Map for Maryland

POLICY RECOMMENDATIONS
1) Ensure that economic development funds are used to create family-supporting jobs by
increasing public accountability.
■ Adopt a comprehensive disclosure law that requires each company that receives a state
funded economic development subsidy (such as a loan, tax incentive, or grant) to report
annually on the number of jobs created or retained, and the wages, healthcare benefits, and
full or part-time status of those jobs. Require that this information be made available to the
public on a company-specific basis, with information on the dollar value of the subsidy
received by the company.
2) Ensure that low-wage workers are trained for jobs in growth industries by increasing training
funds and coordinating economic development and workforce development activities.
■ Increase funding for workforce training to upgrade the skills of entry-level and incumbent
workers according to industry standards. Target half of the Governor’s discretionary WIA
funds for customized training programs for low-income workers and job seekers.
■ DBED regional staff should promote workforce development programs to employers
relocating or expanding in the state. DLLR officials should be included in negotiations
when economic development deals are structured.
■ Permit and encourage employers to use MITP and PWQ skill enhancement funds for adult
basic education for their employees.
Additional Data Are Needed to Assess Program Outcomes In conducting research for this report, we found several instances where the data needed to
assess the impact of state programs on low-income working families were not collected by state
agencies. We recommend that state agencies develop systems to track the following information:
1. The impact that job training programs have on participants’ incomes.
2. The impact that economic development programs have on workers’ wages.
28 Job Opportunities Task Force

Like most health-care providers, Mercy Medical Center
in Baltimore has struggled to find qualified workers for many
positions. But a three-year-old state training program has
provided valuable help in filling those employment gaps.
The Skills-Based Training for Employment Promotion
program, or STEP, was created by the Maryland General
Assembly in 2001. Local grant recipients team with employ-
ers in selected fields to provide training for certain job cate-
gories. The cost is shared: the STEP program pays for the
actual training while the employer pays the wages of workers
being trained, or provides support such as transportation and
child care.
For many low-skill workers, this solves a crucial prob-
lem. Many low-wage workers do not have the time or finan-
cial means to enroll in many weeks or even months of voca-
tional training. STEP allows these workers to be paid while
they train.
At Mercy, more than 90 low-skill workers have taken
part, preparing to take jobs as nurse extenders, surgical tech-
nicians or medical coders through training a few blocks from
the hospital at Baltimore City Community College.
Working with Business to Fill the Gaps
The average worker who has gone through STEP train-
ing at Mercy has seen his or her wage increase by about
$2.50 an hour – to $10.50 – a significant advancement.
Denise Phelps, director of training programs at Mercy,
says the STEP program has produced “outstanding results.”
“First, it has served to increase the economic develop-
ment of our community,” Phelps says. “Second, it has provid-
ed us with a trained workforce for positions which typically
can be difficult to fill with qualified candidates.”
Phelps adds: “Because we are able to observe the
incumbents during the training, we have a good idea of the
trainees’ qualifications and fit for the organization.”
Due to budget constraints, the Baltimore STEP program
can help only a small number of employers. There is, to be
sure, a large unmet need for this type of training.
“There are a great number of low-wage parents out
there. I get at least two calls a day from parents who have
heard about STEP,” says Dawn Martin, program manager for
STEP in Baltimore. “The market is out there. It would be
nice to have more money to meet the need.” ■
29Connecting Low-Income Families to Good Jobs: A Policy Road Map for Maryland
i Hancock, Jay. “Illinois Shines Light into the GatewayQuagmire.” The Baltimore Sun. August 27, 2003.
ii The unemployment rate represents the number of individualswho are currently not working, would like to work, are able towork and have actively sought employment in the last four weeksthrough means such as visiting a potential employer or respond-ing to a help-wanted advertisement, divided by the number ofpeople in the labor force. This figure does not count discouragedworkers, those who have even temporarily given up looking for ajob.
iii Maryland Department of Labor, Licensing and Regulation,"Monthly Labor Review, November 2003." Baltimore: MarylandDepartment of Labor, Licensing and Regulation, 2003.
iv Economic Policy Institute, October 2003. www.jobwatch.org.
v Bureau of Labor Statistics. “Geographic Profile of Employmentand Unemployment, 2002.” Washington: Bureau of LaborStatistics, 2003.
vi U.S. Census Bureau. “Census 2000, Summary File 3(Employment Profile 1).” Washington, U.S. Census Bureau, 2002.
vii Population Reference Bureau analysis of 2002 CurrentPopulation Survey data.
viii Ibid.
ix Comptroller of Maryland. “ A Guide to Business Tax Credits.”Annapolis: Comptroller of Maryland, 2001.
x Comptroller of Maryland. “Business Tax Credits, Tax Year2000.” Annapolis: Comptroller of Maryland, 2002.
xi Purinton, Anna, et al. “The Policy Shift to Good Jobs.”Washington: Good Jobs First, 2003.
xii Maryland Governor’s Workforce Investment Board.“Maryland STEPs Up for Working Parents.” Baltimore: TheGovernor’s Workforce Investment Board, 2003.
xiii Ibid.
xiv Maryland Department of Business and EconomicDevelopment. “Business Investment Programs – StrategicInvestments in Maryland.” Baltimore: Maryland Department ofBusiness and Economic Development, 2003.
xv Author’s communication with Maryland Department ofBusiness and Economic Development.
xvi Ibid.
xvii Thompson, Chris, et. al. “Training for the “Next” Economy:An ASTD State of the Industry Report on Trends in Employer-Provided Training in the United States.” Alexandria: AmericanSociety for Training and Development, 2002.
xviii Author’s communication with Maryland Department ofBusiness and Economic Development.
xix Ibid.
xx Author’s communication with Maryland Governor’sWorkforce Investment Board.
xxi Hancock, Jay. “Illinois Shines Light into the GatewayQuagmire.” The Baltimore Sun. August 27, 2003.
xxii Office of Legislative Audits. “Managing for Results – FiscalYear 2001 Performance Measures, Department of Business andEconomic Development.” Annapolis: Department of LegislativeServices, Maryland General Assembly, 2002.
xxiii Hancock, Jay. “Company Denies Giving False Data in AidRequest; Wages End up Below Levels Set in Application.” TheBaltimore Sun. Oct. 13, 1999.
FOOTNOTES — CHAPTER 3 — CREATING GOOD JOBS
30 Job Opportunities Task Force

CHAPTER 4Fostering Financial Security
The actions of state government affect all
Marylanders, but to varying degrees. Middle-
income and affluent residents are generally less
buffeted by changes in state policy, but decisions
made at the state level can have a profound effect
on the lives of low-income workers, by either
bolstering or hindering their efforts to improve
their employment opportunities, achieve a decent
standard of living, access health care and obtain
financial security.
It is worth repeating that 16 percent of jobs
in Maryland pay, on average, less than a poverty-
level wage. On its face, that
statistic means that such wage
earners cannot adequately
support a family – and yet
many Marylanders struggle to
do just that. One solution is to
create more good-paying jobs,
as discussed in Chapter 3.
However, the state must also
embrace other approaches.
Maryland’s minimum
wage law is the same as the
federal standard of $5.15 an
hour. As advocates know, that
minimum has not changed
since 1995 and yields an
income that is below the poverty line, even for a
single adult. Adjusted for inflation, the value of
the federal minimum wage has actually decreased
28 percent since 1979 (see Chart 3). Eleven states
and the District of Columbia have chosen to set a
state minimum wage that is higher than the fed-
eral minimum.i Those state minimum wages
range from $6.15 to $7.15 per hour.
While there does not appear to be a major
push in 2004 to increase the minimum wage in
Maryland, it is worth pointing out the benefits to
low-income workers and the state’s economy if
the state increased the minimum wage by $1.50
per hour, to $6.65. More than 107,000 workers,
most of them adults, would receive a raise.ii
There is no evidence of job loss due to the most
recent increase in the federal minimum wage or
to recent state minimum wage increases.iii In fact,
because low-income workers are more likely to
spend money than save it, money flows directly
back into the community.
Maryland has taken
important steps on another
workplace protection, the
“living wage.”iv Three local
jurisdictions in Maryland –
Baltimore City and Prince
George’s and Montgomery
counties – have enacted ordi-
nances that set a minimum
wage for employees of compa-
nies that have contracts with
the local jurisdiction. In
Baltimore, the current wage is
$8.70 an hour and the two
counties have set the wage at
$10.50 per hour. The state has not yet adopted a
similar living wage standard.
Taxes To provide state revenues, the Maryland
budget relies on sales and excise taxes, which
tend to fall heavily on low-wage workers. The
state’s income tax structure is also highly regres-
■ State policies – ranging from incometaxes to childcare and health insur-ance – have significant impact on thelives of low-income workers.
■ The minimum wage, set at $5.15 an hour, has declined 24 percent since 1979 when adjusted for inflation.
■ In Maryland in 2002, more than 405,000 workers did not have health insurance.
■ The state’s childcare subsidy program has a waiting list of more than 11,400 children.
31Connecting Low-Income Families to Good Jobs: A Policy Road Map for Maryland

sive, with a top tax rate of 4.75 percent that
applies to all income above $3,000. Studies show
that these tax policies create a substantial burden
for working families. For the 20 percent of fami-
lies with the lowest incomes in Maryland, state
and local taxes take 9.4 percent of their incomes.
By contrast, Maryland’s most affluent residents –
the top 1 percent in income – pay 5.1 percent of
their income in state and local taxes after the
federal offset.v
Maryland has attempted to address this situ-
ation in one aspect of its tax policy. Along with
15 other states and the District of Columbia,
Maryland has adopted a state supplement to the
federal Earned Income Tax Credit.vi Established
in 1975, the EITC is considered one of the most
effective mechanisms for helping low-income
families move out of poverty. Maryland’s EITC
gives low-income workers relief
from the state income tax and is
partially refundable, meaning these
workers are eligible to receive a
payment from the state to offset
other taxes that fall hard on work-
ing families, such as payroll levies
and the sales tax. Twelve states
have these types of refundable
EITC programs (five additional
states offer non-refundable credits).
Outreach efforts by advocates
have helped increase the number
of people claiming the EITC.
Nationally, an estimated 85 percent
of those who are eligible claim the
credit.vii It is crucial that state and
federal lawmakers preserve and enhance this
important program.
The Maryland legislature may consider tax
increases in the near future. Among the proposals
being discussed is an increase or broadening of
32 Job Opportunities Task Force

the state’s 5 percent sales tax. Lawmakers should
carefully consider the impact that any such
change would have on low-wage workers.
Health Insurance Despite being one of the wealthiest states in
the nation, Maryland is grappling with a serious
public health problem – widespread lack of
health insurance. State policymakers have begun
serious consideration of reform and the issue is
likely to be prominent during the 2004 General
Assembly session. The lack of health insurance
creates major strains and inefficiencies on the
healthcare system, as those without insurance
often rely on emergency rooms for treatment. It
also poses grave problems for the uninsured, who
often go without primary
care or preventive meas-
ures. For low-income
workers, who often can-
not afford treatment, the
problems are the most
pronounced.
Traditionally, most
Americans have relied on
their employers for health
insurance coverage. But in
Maryland in 2002, more
than 405,000 workers
ages 18 to 64 did not have
health insurance of any
kind,viii and studies show
that low-wage workers
are less likely to have employer-sponsored health
insurance than those earning higher incomes. In
2000, only a third of workers in the bottom 20
percent of wage earners had employer-provided
health insurance. For workers in the top 20 per-
cent of incomes, more than eight out of 10 had
it.ix Even when employers offer health insurance
to low-wage workers, their coverage often
includes higher co-payments, deductibles and pre-
miums than the plans of higher-wage employers.x
The Maryland Children’s Health Insurance
Program, which is funded by the federal and
state governments, has significantly reduced the
number of uninsured children and pregnant
women in Maryland. But for uninsured workers,
Maryland’s efforts to provide coverage lag
behind those of many other states. In Maryland,
a working parent qualifies for the state-adminis-
tered Medicaid program only if his or her annual
family income does not exceed 43 percent of the
federal poverty level – or about $6,000.xi This is
one of the lowest income eligibility figures in the
nation. Nine states offer Medicaid assistance to
adults earning up to 150
to 200 percent of poverty.
Not surprisingly, in 2001
there were only 27,000
working adults over the
age of 21 who received
Medicaid in Maryland.xii
Several proposals that
address the problem of
the uninsured are under
discussion in Annapolis.
Some propose systemic
changes that would lead
to universal coverage in
Maryland; others suggest
incremental improve-
ments. As the debate
unfolds, it is crucial that
lawmakers consider the impacts – both positive
and negative – that these proposals hold for low-
income workers.
33Connecting Low-Income Families to Good Jobs: A Policy Road Map for Maryland

ChildcareMany low-income working
parents face the daunting chal-
lenge of finding someone to
provide childcare while they
earn a living. While relatives
sometimes provide care at no
or low cost, most working families pay market
rate for childcare. However, paying the market
rate for childcare is simply unaffordable for
many families. In Baltimore City in 1999, the
average annual cost of childcare in a childcare
center was $4,359, higher than the annual cost
that year of in-state college tuition.xiii Maryland’s
way of helping these families has been the
Purchase of Care (POC) program, which has
been considered a model program. Families on
welfare and low-wage workers not receiving wel-
fare benefits were eligible, with parents paying a
sliding fee based on their income.
However, a recent major cut in funding for
the POC program has curtailed its ability to help
working parents. Now, only families that are cur-
rently receiving Temporary Cash Assistance or
that received it within the past year are eligible
for the subsidized childcare. The result: as of
December 2003, the program had a waiting list
of more than 11,400 children.xiv While the state
budget crunch requires fiscal discipline, policy-
makers should consider increases for the POC
program. Helping working families pay for child-
care is an important use of state funds, one that
brings a financial return on investment achieved
through sustained employment.
Unemployment InsuranceThe unemployment insur-
ance system in Maryland pro-
vides an important safety net
for laid-off workers. Unemploy-
ment insurance was designed to
assist workers who lost their
jobs through no fault of their own by lightening
the burden of unemployment, “which often falls
with a crushing force on the unemployed worker
and the family of the unemployed worker.”xv
Unemployment insurance benefits give those
workers a financial cushion while they search
for a new job, and help stimulate the economy
during economic downturns. Unfortunately, the
current system does not cover many workers
earning the smallest incomes.
To be eligible for the minimum benefit of
$25 a week, a laid-off worker must have earned
$900 in the previous calendar year, and have
earned at least $600 of that in one quarter to
qualify for unemployment benefits. When deter-
mining eligibility, the formula counts only the
first four of the last five completed quarters. A
worker earning the minimum wage of $5.15 an
hour must work 175 hours in order to qualify
for benefits. A worker earning $10 an hour must
work 90 hours to qualify.xvi Unemployed work-
ers must also be actively looking for full-time
work, and must be unemployed due to no fault
of their own.
Maryland’s policy tends to be more restric-
tive than those in other states. In the fourth quar-
ter of 2002, 61 percent of unemployed workers
in Maryland did not receive unemployment bene-
fits, compared to 57 percent nationally.xvii
National statistics show that low-wage workers
are even less likely to receive unemployment
insurance; 80 percent of low-wage workers did
not receive benefits.xviii
Despite being one of the
wealthiest states in the nation,
Maryland is grappling with a serious
public health problem – widespread
lack of health insurance.
34 Job Opportunities Task Force

In Maryland, a key prob-
lem lies in the rules governing
eligibility. The rules provide
that workers who have been
employed less than a year are
not eligible for benefits. A
Maryland worker must have
worked in at least two calendar quarters in
the base period, and have base period earnings
at least 1.5 times their earnings in the highest
quarter. Some states have less restrictive eligi-
bility criteria.
In Maryland, many part-time workers are
also excluded from benefits because the rules
require that workers who are laid off must be
seeking full-time jobs. However, many people can
only work part-time – because they are in school
or have childcare or eldercare responsibilities, to
cite two main reasons. Employers pay taxes for
part-time workers and these workers often meet
the minimum-earnings requirements. The exclu-
sion is also unrealistic, given the economy’s
dependence on part-time workers. Nationally,
approximately 20 percent of jobs are part-time.xix
Finally, Maryland’s benefits are inadequate
for many families. The maximum benefit is $310
a week for a maximum of 26 weeks; that repre-
sents only 42 percent of the average weekly wage
in Maryland.xx Maryland unemployment insur-
ance fails to provide financial security for many
workers who lose their jobs through no fault of
their own, and it does not reflect the nature of the
modern workforce. Maryland needs to reform
this insurance system to ensure
that it provides an appropriate
level of economic security.
Worker ProtectionsMaryland has two groups
of workers who need more
attention – day laborers and ex-prisoners. There
is evidence that day laborers face serious prob-
lems in the workforce, including unsafe working
conditions and excessive charges for meals,
transportation, equipment and check cashing.
Maryland law provides few legal protections for
these workers and should be strengthened to
prevent these abuses.
Ex-prisoners also face major challenges as
they try to re-enter the workforce. One obstacle
is the state’s law governing criminal records. For
example, it is legal for Maryland employers to
discriminate against a job applicant because of
his or her criminal record – even if the criminal
charges have no relevance to the job the ex-
prisoner is seeking. Similarly, state law makes it
difficult to expunge records of arrests – even if
the arrest did not lead to a conviction. Arrest
records often prevent applicants from securing
jobs. The legislature should consider reforms that
will make it easier for ex-prisoners to become
economically self-sufficient. ■
Maryland unemployment insurance
fails to provide financial security
for many workers who lose
their jobs through no fault of their
own, and it does not reflect the
nature of the modern workforce.
35Connecting Low-Income Families to Good Jobs: A Policy Road Map for Maryland

Flora Gee, the owner of the
Greenbelt Children’s Center in Prince
George’s County, routinely receives calls
from parents who need childcare but
cannot afford the rates charged at her
licensed facility.
Full-time care for a four-year old in a licensed facility will
typically cost more than $6,000 a year, out of reach for many
low-income workers.
Without some help from the state, these parents must
turn to friends, relatives or unlicensed providers.
“For parents who need childcare, a lot of them are
working in low-income jobs, and they’re in desperate
straits,” Gee says. “Think about the parents that need to
work, especially single parents. It’s not a choice for them;
they must work. What in the world are they going to do if
they can’t afford childcare?”
Currently, the state of Maryland helps the parents of
about 30,000 children with Purchase of Care vouchers that
are used to help pay for childcare. Families pay a portion of
the cost, with a family’s share based on its income.
At Gee’s center, eight of the 60 children are from fami-
lies receiving POC vouchers. A single parent heads each fam-
ily, including a man whose wife died of cancer and who is
now raising his twin boys. Another voucher recipient, a single
mother, completed high school recently and is working at
Helping Working Parents
Wal-Mart. Another young single mother
is using the voucher for childcare while
she works and goes to college.
The money for the POC program
comes from a combination of state and
federal funds. The program took a major hit in 2003, when
state budget problems led to a $25 million cut in funding for
the vouchers. The state established a waiting list for families
in need of vouchers and as of December 2003, the list had
swelled to include more than 11,450 children.
Beth Giordano, public policy coordinator with the
Maryland Committee for Children, says the state voucher
program provides many important benefits. Having quality
childcare allows working parents to hold down jobs and
become reliable employees not distracted by childcare
problems.
It is imperative that children be cared for in safe settings
that help them prepare to enter school, Giordano says. “For
children, quality childcare means they come to school ready
to learn,” she notes.
Flora Gee points out that the lack of adequate funding
for childcare conflicts with the goal of helping former welfare
recipients and others enter the workforce.
“We’re supposed to be helping these people become
independent,” she says. ■
Job Opportunities Task Force 36 Job Opportunities Task Force

FOOTNOTES — CHAPTER 4FOSTERING FINANCIAL SECURITY
i U.S. Department of Labor, http://www.dol.gov/esa/minwage/ameri-ca.htm.
ii Rassell, Edith, Jared Bernstein and Heather Boushey. “Step Up,Not Out.” Washington, DC: Economic Policy Institute, 2001.
iii Bernstein, Jared and John Schmitt. “Making Work Pay: theImpact of the 1996-97 Minimum Wage Increase.” Washington:Economic Policy Institute, 1998 and Card, David and Alan Krueger.1995. Myth and Measurement: The New Economics of theMinimum Wage. Princeton, N.J.: Princeton University Press.
iv Jurisdictions have defined a living wage in various ways, butmany are based on what families of various sizes would need to earnto be above the federal poverty line. While none of the living wagesare high enough for a family to achieve economic security, it is astep in the right direction.
POLICY RECOMMENDATIONS
1) Support the work activities of low-income parents by subsidizing childcare.
■ Restore most of the $25 million cut from the Purchase of Care childcare program in the
last fiscal year.
2) Continue to provide income supports to working parents through the state Earned
Income Tax Credit.
■ Maintain the state Earned Income Tax Credit program at the current level.
3) Promote the health of low-income working parents through the expansion of health
insurance so that they can continue to work and support their families.
■ As Maryland engages in debates about expanding health insurance coverage, make sure that
the needs of low-income working parents are addressed.
4) Update the unemployment insurance program to allow part-time workers who lose their jobs
to access benefits; increase the maximum benefit level to track wage increases.
5) Allow certain criminal records to be expunged to reduce the impact a criminal record has on
future employment.
6) Increase outreach and simplify access to work-support programs for which working low-
income families are eligible.
Additional Data Are Needed to Assess Program Outcomes In conducting research for this report, we found several instances where the data needed to
assess the impact of state programs on low-income working families were not collected by state
agencies. We recommend that state agencies develop systems to track the following information:
1. The percent of eligible families that claim the Earned Income Tax Credit.
v McIntyre, Robert, et. al. “Who Pays: A Distributional Analysis ofthe Tax Systems in All 50 States, 2nd Edition.” Washington:Institute on Taxation and Economic Policy, 2003.
vi Johnson, Nicholas, et. al. “A Hand Up: How State Earned IncomeTax Credits Help Working Families Escape Poverty in 2003.”Washington: Center on Budget and Policy Priorities, 2003.
vii Scholz, John-Karl. “The Earned Income Tax Credit:Participation, Compliance, and Anti-poverty Effectiveness.”National Tax Journal. Vol. 47. No. 1. (1994): 59-81.
viii Population Reference Bureau analysis of 2002 CurrentPopulation Survey data.
ix Mishel, Lawrence et. al. The State of Working America2002/2003. Ithaca, NY: Cornell University Press, 2003.
x Boushey, Heather et. al. Hardships in America. Washington:Economic Policy Institute, 2001.
37Connecting Low-Income Families to Good Jobs: A Policy Road Map for Maryland
continued on next page
38 Job Opportunities Task Force
xi Guyer, Jocelyn. “Congress has a $28 Billion Opportunity toExpand Coverage for Low-Income Working Families withChildren.” Washington: Center on Budget and Policy Priorities,2001.
xii Author’s communication with the Maryland Department ofHealth and Mental Hygiene.
xiii Schulman, Karen. “The High Cost of Child Care Puts QualityCare Out of Reach for Many Families.” Washington: Children’sDefense Fund, 2000.
xiv Author’s communication with the Maryland Department ofHuman Resources, Child Care Administration.
xv Maryland Unemployment Insurance Law, Section 8-102.Legislative findings and policy.
xvi Economic Policy Institute. “Unemployment Insurance Facts ata Glance: Maryland.” www.epinet.org
xvii Brandon Roberts and Associates analysis of data provided bythe Office of Workforce Security, Employment and TrainingAdministration, U.S. Department of Labor, “State Financial Data:UI Financial and Labor Force Data, Recipiency Rate, 4th Quarter2002.”
xviii Economic Policy Institute. “Unemployment InsuranceFrequently Asked Questions.” www.epinet.org.
xix Ibid.
xx Emsellem, Maurice, et. al. “Failing the Unemployed: A Stateby State Evaluation of Unemployment Insurance Systems.”Washington, DC: Economic Policy Institute, 2002.
continued from previous page

Maryland’s policies and programs can do
more to help working poor families become
economically self-sufficient. Too many Maryland
families work and pay taxes, but do not earn
enough to provide a decent standard of living for
themselves and their children. While the state has
some programs in place that assist low-wage
workers, the numbers served are too small to
make a significant difference.
The families left behind are disproportionate-
ly African-American and are concentrated in
urban and rural areas. Without targeted outreach
and increased investments, the legacy of unequal
access to economic opportunities will continue.
Good intentions are not enough. Investment
must follow intention if the state hopes to pro-
vide opportunities for all families.
The recommendations in this report focus on
increasing the skills, employment opportunities
and wages of low-income workers. Although
some additional public investments are needed,
we have resisted developing a long list of sugges-
tions for additional public moneys. Rather, when
at all possible, we recommend re-orienting cur-
rent programs to get better outcomes from exist-
ing dollars – targeting more of our post second-
ary aid to students with financial need, creating
flexibility in financial aid programs to meet the
need of working parents, attracting jobs that pro-
vide career opportunities for low-wage workers,
linking economic development and workforce
development programs for maximum effective-
ness, and allocating discretionary workforce dol-
lars to training programs for low-wage workers.
The state lacks effective evaluation standards
for many programs. Too often state agencies do
not collect the data needed to determine the effi-
cacy of programs that can and should benefit
low-wage workers. Data collection on the impact
of post-secondary training, adult education, pub-
lic assistance and economic development pro-
grams is crucial to learning the return on invest-
ment that effective programs can bring. Without
a strong evaluation component that assesses the
impact public dollars have on low-income fami-
lies, too many workers will remain poor while
businesses complain about the lack of skilled
applicants for job openings.
Many workers need assistance improving
their basic educational attainment, upgrading
job-specific skills, becoming proficient in English
or finding a higher wage job with benefits. The
state can provide that assistance. Real benefits
will redound to Maryland’s families, the state
and local tax base and the business community
if public dollars are focused on improving out-
comes for low-wage workers. The chief question
is not a matter of resources but of our political
interest and will to help low-income families
improve their economic future. ■
conclusion
39Connecting Low-Income Families to Good Jobs: A Policy Road Map for Maryland

40 Job Opportunities Task Force
Family: A married couple or a single parent with at least one child under age 18.
Family A family with an income below the threshold for poverty as defined
in poverty: by the U.S. Census Bureau.
Income: Money income only, non-cash benefits not included.
Labor Force: Persons 16 or older with a job or without a job and actively seeking one.
Low-Wage: A wage below the full-time, full-year wage required to keep a family of four out of
poverty. In 2001, a family of four required $18,104 to stay out of poverty (at least
$8.70/hr. on a full-time, full-year basis); in 2002, $18,390 was required (at least 8.84/hr.).
For the Percent of Workers in Low-Wage Jobs measure, the national low-wage figure is
adjusted by the state’s cost of living index (0.97 for Maryland), as published in Annual
Federal Budget and the States by the Taubman Center for State and Local Government,
Kennedy School of Government, Harvard University.
Minority: A person who does not classify himself or herself as white, non-Hispanic.
Unemployed: Persons 16 years and over who had no employment during the reference week, were
available for work, except for temporary illness, and had made specific efforts to find
employment sometime during the 4-week period ending with the reference week. Persons
who were waiting to be recalled to a job from which they had been laid off need not have
been looking for work to be classified as unemployed.
Working A family where all family members age 15 and over have a combined work effort of
Family: 39 or more weeks in the last 12 months or all family members age 15 and over have a
combined work effort of 26 or more weeks in the last 12 months and one currently
unemployed parent looked for work in the previous four weeks. The federal government
defines family income as income of all family members age 15 and over.
glossary

Connecting Low-Income Families to Good
Jobs is part of an initiative supported by the Annie
E. Casey Foundation and the Ford Foundation to
assess state efforts to aid low-income working
families in achieving economic security. We are
grateful to the Open Society Institute - Baltimore
and the France-Merrick Foundation for their gen-
erous financial support of this project.
This report was made possible through the
hard work of a dedicated team of people.
Brandon Roberts, Andrew Reamer and Sara Rab
of Brandon Roberts + Associates provided the
indicators framework and invaluable assistance
along the way. Kerri Rivers of the Population
Reference Bureau provided the analysis of U. S.
Census data used in this report. Chauna Brocht
was the lead researcher on the project and
Tom Waldron wrote the report. Joanne Nathans
and Kevin Griffin Moreno edited several drafts.
Anne Clewell designed the finished product.
Deborah Povich was the glue that held the
whole project together.
This report would not have been possible
without the assistance of the Maryland agencies
who so patiently answered our requests for
information. The staff of the Department of
Labor, Licensing and Regulation, the Depart-
ment of Business and Economic Development,
the Department of Human Resources, the
Maryland State Department of Education, and
the Maryland Higher Education Commission
were particularly helpful.
Finally, we are grateful to our State Work-
force Indicators Advisory Committee, who
provided early input into the project and
reviewed our drafts. Their participation in this
project is not an endorsement of our findings
or recommendations.
State Workforce Indicators Advisory Committee
Diane BellCEO/PresidentEmpower Baltimore Management Corporation
Bernard BerkowitzPresident, Lexington Market Inc.
Dunbar BrooksDirector, Metro Research DivisionBaltimore Metropolitan Council
Patrice CromwellAssociate Director, Open Society Institute – Baltimore
Loretta FisherDirector of Human ResourcesBaltimore Renaissance Harborplace Hotel
Brad KellerMaryland Association for Adult Community andContinuing Education
Dr. Irving McPhailChancellor, Community College of Baltimore County
Lynda MeadeDirector of Social Concerns, Catholic Charities
Joanne NathansPresident, Job Opportunities Task Force
Lisbeth PettengillVice President, Greater Baltimore Committee
Deborah PovichExecutive Director, Job Opportunities Task Force
Sally J. ScottProgram Officer, Goldseker Foundation
Dr. David StevensExecutive Director, Jacob France InstituteUniversity of Baltimore
Melanie StylesProgram Officer, Abell Foundation
Dr. Chris ThompsonSenior Research AssociateJohn Hopkins Institute for Policy Studies
acknowledgements

The Job Opportunities Task Force
works in the Baltimore region to develop and advocate policies and programs,
forge partnerships and leverage investments that increase the marketable skills,
income and economic opportunities of low-skill, low-income workers and job seekers.
For more information about this report or JOTF contact:
JOB OPPORTUNITIES TASK FORCE
2 East Read Street
6th Floor
Baltimore, MD 21202
Phone: 410-234-8040
www.jotf.org
e-mail: [email protected]