connecting poverty and ecosystem services
TRANSCRIPT

Focus on Tanzania
Connecting poverty
&ecosystemservices
A series of seven country scoping studies

© 2005 United Nations Environment Programme and the International Institute for Sustainable Development
Published for the United Nations Environment Programme by the International Institute for Sustainable Development
United Nations Environment Programme
The mission of the United Nations Environment Programme (UNEP) is to provide leadership and to encourage partner-ships in caring for the environment by inspiring, informing and enabling nations and peoples to improve their quality of lifewithout compromising that of future generations.
Division of Policy Development and Law (DPDL)
The objective of DPDL, a division within UNEP, is to enable members of the international community to develop integratedand coherent policy responses to environmental problems and to strengthen environmental law as well as to improve com-pliance with and enforcement of legal instruments.
The Poverty-Environment Unit
Within DPDL, the Poverty-Environment Unit is responsible for coordination of policy review, analysis and development aswell as for the promotion of regional and national environmental policy development. It fosters partnerships with UN agen-cies, donors, the private sector and civil society to promote policy development in areas such as water, land-use, drylands,urban environment, poverty and environment linkages, health and environment, climate change and energy.
United Nations Environment ProgrammeUnited Nations Avenue, GigiriPO Box 30552Nairobi, KenyaTel: (254-2) 621234Fax: (254-2) 624489/90E-mail: [email protected] site: http://www.unep.org
International Institute for Sustainable Development
The International Institute for Sustainable Development contributes to sustainable development by advancing policy rec-ommendations on international trade and investment, economic policy, climate change, measurement and assessment, andnatural resources management. Through the Internet, we report on international negotiations and share knowledge gainedthrough collaborative projects with global partners, resulting in more rigorous research, capacity building in developing coun-tries and better dialogue between North and South.
IISD’s vision is better living for all—sustainably; its mission is to champion innovation, enabling societies to live sustainably.IISD is registered as a charitable organization in Canada and has 501(c)(3) status in the United States. IISD receives coreoperating support from the Government of Canada, provided through the Canadian International Development Agency(CIDA), the International Development Research Centre (IDRC) and Environment Canada; and from the Province ofManitoba. The institute receives project funding from numerous governments inside and outside Canada, United Nationsagencies, foundations and the private sector.
International Institute for Sustainable Development161 Portage Avenue East, 6th Floor Winnipeg, ManitobaCanada R3B 0Y4 Tel: +1 (204) 958-7700 Fax: +1 (204) 958-7710 E-mail: [email protected] Web site: http://www.iisd.org/
Authors: Carissa Wong, Marlene Roy, Dr. Anantha Kumar Duraiappah
The views and interpretations reflected in this document are those of the author and do not necessarily reflect the views orpositions of the United Nations Environment Programme or the International Institute for Sustainable Development. Allinformation in this paper was current at time of publication.
Connecting poverty and ecosystem services: A series of seven country scoping studies
ii
Focus on Tanzania

Ecosystems provide more than the resources neededfor material welfare and livelihoods. In addition tosupporting all life and regulating natural systems,they specifically provide health and cultural benefitsto people. Moreover, their loss is a significant barrierto the achievement of the Millennium DevelopmentGoals related to reduction of poverty, hunger and dis-ease. The Millennium Ecosystem Assessment (MA),1released in 2005, reported, though, that 15 of the 23ecosystem services assessed were being degraded orused unsustainably.
In light of these findings, this report sets out to pro-vide a preliminary review of ecosystem services inTanzania and the corresponding constituents anddeterminants of well-being related to the availabilityof these services. This paper is one of seven scopingstudies prepared by the International Institute forSustainable Development for the United NationsEnvironment Programme. Other countries examinedin this series are Kenya, Mali, Mauritania,Mozambique, Rwanda and Uganda. All of the papersare available online at http://www.iisd.org/economics/
The objective of the series is not to provide a detailedassessment of the poverty-environment linkages, butto identify the regions within the countries wherecritical ecosystem services for human well-being arestressed, signalling the need for immediate attention.This information is expected to inform and guide theselection of potential areas where a more detailedlocal-scale integrated assessment of the links betweenecosystem services and human well-being can be car-ried out.
These reports do not cover previous policy interven-tions, as the local-scale integrated assessment wouldgather such information and report on the impactsthese polices have had in the past. Lessons learned canthen be used together with new knowledge gatheredon the links between ecosystem services and humanwell-being to design more finely-tuned interventionstrategies that would seek to promote the reduction ofpoverty and improve well-being while protecting andenhancing vital ecosystem services.
Connecting poverty and ecosystem services: A series of seven country scoping studies
1
Background
Focus on Tanzania
1 The Millennium Ecosystem Assessment was a four-year study requested by the United Nations Secretary General in 2001 to pro-vide an overview of the state of the global ecosystems and the consequences of ecosystem changes on human well-being.

1. Tanzanians are experiencing pervasive water scarci-ty and inability to earn an adequate livelihood,as both are threatened in all mainland regions.These two constituents are mutually reinforcingas over 80 per cent of the population achieveslivelihood through subsistence farming.
2. Regions experiencing deterioration in food andfibre provision, also face serious problems inmeeting adequate nourishment levels.
3. Morogoro Region stands out as it is experienc-ing stress in all four ecosystem services and well-being constituents, which suggests that itshould be a priority region for developmentefforts.
4. Biodiversity is now under threat in severalregions, a loss that is particularly distressing, as
Tanzania has had a long tradition of conservingbiodiversity.
5. The main problem confronting most regions isthe management of water with most of the pop-ulation facing difficulty accessing water. Thelack of appropriate technology for managingwater, coupled with the increasing loss of forestsand vegetative cover has increased the rate ofrunoff and precipitation capture. This is furthercompounded by population growth of five percent annually.
6. Declining food yields are caused by decreasingsoil fertility and by farmers working the landmore intensively, compounded with a lack ofexpertise in using fertilizers and decreasing sup-ply of natural fertilizers from cattle.
Ecosystem services and constituents of well-being: degrees of threat by region
Maintenance Food Water Energy Adequately Clean Energy for Earnof production supply resources nourished water warmth livelihood
biodiversity and cooking
Arusha X X X O X X X X
Dar es Salaam O X X O O X X X
Dodoma X X X O X X X X
Iringa X X X O O X O X
Kagera X O X X O X X X
Kigoma X X X O O X O X
Kilimanjaro O X X O X X X X
Lindi X X O X X X X X
Manyara X O O O X X O X
Mara O X X O X X O X
Mbeya O X X O O X O X
Morogoro X X X X X X X X
Mtwara O X O O O X O X
Mwanza O X X O O X O X
Pemba North N/A N/A N/A N/A O X O X
Connecting poverty and ecosystem services: A series of seven country scoping studies
2
Executive Summary
Focus on Tanzania

Ecosystem servicesThe literature review of Tanzania’s ecosystem servicesrevealed four critically stressed ecosystem services:maintenance of biodiversity; food and fibre provision;water supply, purification and regulation; and fuelprovision.
Maintenance of biodiversity
Tanzania boasts a vast array of biodiversity and someof Africa’s richest and most diverse flora is found inTanzania. Tanzania’s protected areas equal the per-centages of land under protection in North Americaand Europe. However, despite the levels of protec-tion, biodiversity is steadily declining with populationgrowth and movement leading to deforestation,encroachment and habitat change. Invasive species,such as the water hyacinth, have also had negativeimpacts on biodiversity.
Food and fibre provision
In Tanzania, food crops account for 85 per cent ofland under agricultural cultivation. Tanzania is one ofAfrican’s largest cattle and milk producers with meatand manure used for food and fertilizer. The fisheriesare also a vital source of income and nourishment,however, they are currently not suffering. The popu-lation increase in Tanzania has degraded the agro-
ecosystem such that its ability to support productiveagriculture and large livestock numbers has declined.
Water supply regulation and purification
Agriculture is the primary use for water and is respon-sible for 89 per cent of water withdrawals and, as aresult of inconsistent supply, only 45 per cent of thepopulation has access to safe water. Water supply andquality are decreasing due to human populationgrowth as well as a loss of vegetation cover.Inappropriate farming practices and deforestation havecaused soil erosion and reduced water regulation serv-ices leading to increased flooding. In addition, unregu-lated water extraction, human migration and haphaz-ard development threaten access to clean water.
Fuel provision
The main sources of energy in Tanzania are fuel woodand charcoal from both natural and plantationforests, which constitutes a vital provisioning serviceoffered by ecosystems. Deforestation and subsequentwood shortages are caused by land conversion to agri-culture, livestock grazing and wood resources. Whenfuel wood is not available, households rely on cowdung and crop residue. Compounding biologicalissues, there is a lack of clear policies and regulationsguiding competition for land resources thus encour-
Connecting poverty and ecosystem services: A series of seven country scoping studies
3
Focus on Tanzania
Ecosystem services and constituents of well-being: degrees of threat by region (continued)
Maintenance Food Water Energy Adequately Clean Energy for Earnof production supply resources nourished water warmth livelihood
biodiversity and cooking
Pemba South N/A N/A N/A N/A O X O X
Pwani X X O X X X X X
Rukwa O X X O O X O X
Ruvuma N/A N/A N/A N/A O X O X
Shinyanga O X O O X X X X
Singida O X X O X X X X
Tabora O X O O X X O X
Tanga X X X O X X O X
• X indicates an ecosystem service or well-being constituent under threat in the particular region.• O indicates that an ecosystem services or well-being constituent is not under threat.• Bold highlights those areas of immediate priority.

aging free access to land and poor tenure arrange-ments. Gender-balanced forest management, inade-quate technological innovation and inefficient wood-based industry are also contributing factors to poorforest management.
Human well-beingHuman well-being is multi-dimensional with manyconstituents and is closely linked with the state ofecosystem services. This report focuses on those well-being determinants which are affected by the state ofecosystems services which include: ability to be ade-quately nourished; ability to access adequate cleanwater; ability to have energy and to keep warm; andability to earn a livelihood.
Ability to be adequately nourished
The main factor underpinning poor nourishment isthe inability to grow enough food. Food supply is char-acterized by a corresponding decline in ecosystem serv-ices with decreasing agricultural production due toinadequate distribution and quantity of rainfall, deser-tification and a lack of economic entitlements. Thehigh prices of staple foods are also a contributing factorin the ability to purchase food. Commonly, peoplewith little access to livestock or alternative means ofgenerating income have turned to illegal bush meathunting which can either provide food or income.
Ability to have adequate and cleandrinking water
Fifty per cent of Tanzanians are without sustainableaccess to an improved water source and increases in
urban populations have stressed the infrastructureservicing urban areas. Availability and level of use ofwater is influenced by several other factors such ascost, wealth of the household, number of people perhousehold, etc. Water availability is also influenced bywater supply and purification services such as season-ality of rainfall, increased sediment loads in rivers dueto deforestation and soil erosion, pollution and over-grazing.
Ability to have energy to keep warmand cook
Currently, fuel wood is being consumed faster than itis being replaced and Tanzania faces enormous energyproblems; people have to go longer distances toobtain firewood; woodfuel is becoming scarcerrequiring the use of low quality biomass fuels; and theneed to buy wood, which was formerly a free com-modity. The ability of this ecosystem service to con-tinue to provide Tanzanians with energy is highlycompromised.
Ability to earn a livelihood
Tanzania’s economic entitlements are very low and 42per cent of the population lives below the povertyline. While most agriculture in Tanzania is for subsis-tence, there are some cash crops earning exportincome. Given the high rates of poverty and lack ofimprovement in garnering better livelihoods for mostTanzanians, all regions of Tanzania are experiencingan inability to earn an adequate livelihood.
Connecting poverty and ecosystem services: A series of seven country scoping studies
4
Focus on Tanzania

Table of Contents
Background 1
Executive Summary 2
Introduction 6
1. Tanzania in Brief 7
1.1 Physical geography and natural environment 7
1.2 Demographics 8
1.3 Economy: Observable constraints 8
2. State of Ecosystem Services 10
2.1 Maintenance of biodiversity 10
2.2 Food and fibre provision 12
2.3 Water supply, purification and regulation 14
2.4 Fuel provision 16
2.5 Summary of ecosystem services stressed 17
3. State of Human Well-being 18
3.1 Ability to be adequately nourished 18
3.2 Ability to have adequate clean drinking water 19
3.3 Ability to have energy to keep warm and cook 20
3.4 Ability to earn a livelihood 20
3.5 Summary of constituents of well-being under threat 22
4. Linking Ecosystem Services to Human Well-being 24
References 27
Connecting poverty and ecosystem services: A series of seven country scoping studies
5
Focus on Tanzania

The primary objective of this report is to identifyregions within Tanzania where critical ecosystem serv-ices for human well-being are stressed. These regionswere identified through an extensive literature reviewand research which spatially connected ecosystemservices and human well-being within Tanzania. Theframework of ecosystem services and human well-being categories developed by the MillenniumEcosystem Assessment, illustrated in Figure 1, wasused (Alcamo et al. 2003; Duraiappah 2002; Daily1997). This review does not intend to be an exhaus-tive description of all ecosystem services. Instead, itidentifies those ecosystem services in Tanzania foundto be deteriorating or in danger of deteriorating in thenear future—in other words, ecosystem services thatare stressed. Furthermore, when considering humanwell-being, we broaden our attention beyond the tra-ditional constituent of material wealth (economicgrowth and livelihood) to also include other con-stituents: the ability to be adequately nourished; theability to have access to freshwater; and the ability tohave access to energy to keep warm and to cook,among others (Duraiappah 2004). Like ecosystemservices, we only report on human well-being con-stituents directly or indirectly related to ecosystemservices and, hence, this report should not be viewedas a comprehensive survey of all constituents ofhuman well-being.
While not exhaustive, this overview does point outwhat ecosystem services and constituents of humanwell-being are most in need of attention and wherethey are located at the regional level. By taking thisunique approach and using a finer spatial lens, areaswhere well-being and ecosystems are stressed emergeand clarify difficult trade-offs being made at the locallevel.
This report is organized into four sections with thefirst briefly describing the people and landscape ofTanzania, thus providing a backdrop for the rest ofthe overview. Section 2 scopes out the main ecologi-cal services stressed and pinpoints their locations.
Section 3 then discusses the related constituents ofwell-being that are increasingly being threatened bythese deteriorating ecosystem services, and, as withecosystem services, locates them. The concluding sec-tion co-locates those regions where ecosystem servic-es are stressed with those where the constituents ofhuman well-being are threatened and then brieflyoutlines the more outstanding trade-offs being made.
Figure 1. The links among ecosystem servicesand human well-being
(Source: Duraiappah 2002)
Connecting poverty and ecosystem services: A series of seven country scoping studies
6
Introduction
Focus on Tanzania

The borders of Tanzania define an amazingly diversecountry. In addition to being located in Africa’s GreatLakes Region, it is home to the Serengeti Plains where“some of the largest concentrations of wildlife in theworld can be found (White 1983 in Aryeetey-Attoh2003, 39). Tanzania also contains mountains, such aswell-known Mount Kilimanjaro, and ocean coastlinesalong the Indian Ocean, and includes the exotic, off-shore islands of Zanzibar and Pemba. The people ofTanzania reflect their diverse landscape; there aremore than 100 tribal groups, mainly of Bantu origin,Masaii in the northeast and people of Arab ancestryin Zanzibar and Pemba.
Map 1: Tanzania Regions2 (Tanzania 2002b)
Tanzania: Area and RegionsTotal area: 942,784 sq kmLand area: 881,289 sq km (includes the islands ofMafia, Pemba and Zanzibar)Water area: 61,495 sq km
Administrative regions: Tanzania consists of 26regions: Arusha, Dar es Salaam, Dodoma, Iringa,Kagera, Kigoma, Kilimanjaro, Lindi, Manyara, Mara,Mbeya, Morogoro, Mtwara, Mwanza, Pemba North,Pemba South, Pwani, Rukwa, Ruvuma, Shinyanga,Singida, Tabora, Tanga, Zanzibar Central/South,Zanzibar North, Zanzibar Urban/West.
1.1 Physical geography andnatural environment
Tanzania is a relatively large, coastal country at the south-eastern edge of Sub-Saharan Africa. Tropical rainforestand moist forest systems follow the lowland coast andthe western border from where the land rises in rollingplains to a central plateau. “To the west, this plateaudrops sharply to Lake Tanganyika,” while volcanicmountains and steep hills rise up from it in the north-east (FAO Forestry Department). The mountain linebifurcates with one branch going southward intoMalawi and the other curving northwestward to theUfipa Highlands, and here “a series of hills is contiguousto Rwanda and Burundi” (FAO Forestry Department).There are four distinct ecosystem types: namely, forest,covering 27 per cent the of total land area; cropland/nat-ural vegetation mosaic covering 39 per cent; shrub lands,savannah and grasslands covering 27 per cent; and wet-lands or water bodies covering the remaining seven percent (World Resources Institute 2003b).
Climate
Average precipitation is 937 mm per year, but about50 per cent of the country receives less than 750 mmwith total rainfall declining north to south (FAO1995). The central plateau receives 200–600 mm andis classified as semi-arid, while the coastal zone andsouthern and northern highlands receive abundantrainfall, between 1,400 and 2,000 mm annually(ODA in Quinn 2003, 111; Encyclopedia.com2005). The dry season lasts four to six months, but isshorter and less severe in the northeast than in thesouth (Sawatt and Mollel 2000).
Topography
Tanzania consists of coastal plains in the east, high-lands in the north and south, and a central plateauwhich is divided into two branches by the Great RiftValley (Encyclopedia.com 2005). Highland moun-tains cover 100,000 sq km of the mainland and reacha maximum elevation of 5,894 m at MountKilimanjaro (PLDPT 1984 in Sawatt and Mollel2000; United States Central Intelligence Agency
Connecting poverty and ecosystem services: A series of seven country scoping studies
7
1.Tanzania in Brief
Focus on Tanzania
2 Regional Census Data and District Maps available by clicking on Map Region. http://www.tanzania.go.tz/census/regions.htm

2005). In contrast, the central plateau consists ofsloping plains and undulating hills with an averageelevation of 1,070–1,370 m (Kerario 1995, 4;Encyclopedia.com 2005).
Hydrology
There are five major drainage basins: Indian Oceandrainage system, comprised of Lake Nyasa and therivers Pangani, Wami, Ruvu, Rufiji and Ruvuma; theLake Eyasi basin in the North; the Lake Rukwa basinin the southwest; Malagarasi basin flowing into LakeTanganyika; and the Lake Victoria basin which drainsvia the Nile River (Kerario 1995, 4). The westernbranch of the Great Rift Valley contains LakeTanganyika, while the eastern branch runs throughcentral Tanzania, merging with the western branchjust north of Lake Nyasa (Encyclopedia.com 2005).Tanzania’s water systems cover 61,500 sq km andinclude about 50 lakes (Vanden Bossche andBernacsek 1990 in Chenje and Johnson 1996, 100).
Arable land
Tanzania has 43 million ha of land suitable for agri-culture and of this 7,710,304 ha were cultivated in2003–2004 (Majule 2004; World Resources Institute2003; Tanzania Ministry of Agriculture and FoodSecurity 2003).
1.2 DemographicsSince independence in 1967, the population ofTanzania has grown from 12,313,469 to 34,569,232in 2002 (Tanzania 2002c). Kigoma Region, at 4.8 per
cent, is experiencing the highest average annual pop-ulation growth rate, while Lindi is experiencing theleast at 1.4 per cent. In addition, Tanzania has longbeen host to thousands of refugees from neighbour-ing countries; currently more than 400,000 live in 13camps, many situated near the Burundi border, andare almost entirely dependent on foreign aid (UnitedStates Committee for Refugees 2005).
1.3 Economy: Observableconstraints
During the period 1996–1999, Tanzania recorded anaverage real growth rate of 4.9 per cent per annumand per capita real growth of around 1.2 per cent(Tanzania 2000). This trend continued in 2000, withreal GDP rising to 5.1 per cent, but per capita realgrowth remaining relatively consistent at 1.1 per centfrom 2000 to 2002 (OECD 2002, 281; NorwegianUN Association et al. 2002). Overall GDP growthwas hindered by the agricultural sector which reporteda lower rate of growth—three per cent—compared
to 4.6 per cent in 1999, mainly due to a decline incash crop production (OECD 2002, 281). This wasoffset, however, by a pickup in industrial productionand substantial increase in output of minerals, led bygold. Oil and gas exploration and development alsocontributed to this growth (United States CentralIntelligence Agency 2005).
Connecting poverty and ecosystem services: A series of seven country scoping studies
8
Focus on Tanzania
Box 1. Tanzania: demographics (2004)
Population: Total: 34,443,603 0–14 years: 44.2% 15–64 years: 53.2%65 years and over (2004 est.): 2.6%
Life expectancy at birth: Average: 44.39 years Male: 43.20 yearsFemale (2004 est.): 45.61 years
Fertility rate (2000–2005): Number of births per woman: 5.1
Annual population growth rate (1975–2002):Per cent per year: 3.0%
Population density (per sq km), 2002: Average: 39Most dense region: Dar es Salaam (DSM) Region 1,793Least dense region: Lindi: 12
Ethnic groups: Mainland – native African 99% (of which 95% areBantu consisting of more than 130 tribes), other 1%(consisting of Asian, European, and Arab); Zanzibar -Arab, native African, mixed Arab and native African
Languages: Kiswahili and English
(Tanzania 2002b; United Nations Development Programme2004; United States Central Intelligence Agency 2005)
Tanzania is one of the poorest countries in the world.Having not made sufficient progress towards itsMillennium Development Goals, it was identified asone of the “top priority” countries in this year’sHuman Development Report (Amani, Kessy and Macha 2004, 155). Its total external debt is US$7,705million, and debt service is 16.6 per cent of exportearnings (World Resources Institute 2003a). Recent banking reforms, however, have helped increase private
sector growth and investment with the net inflow offoreign direct investment increasing to US$193 mil-lion in 2000 and international tourism receipts earningUS$313 million from 1995 to 1997 (World ResourcesInstitute 2003a). Continued donor assistance and solidmacro-economic policies supported real GDP growthof more than 5.2 per cent in 2004 (United StatesCentral Intelligence Agency 2005).
Connecting poverty and ecosystem services: A series of seven country scoping studies
9
Focus on Tanzania
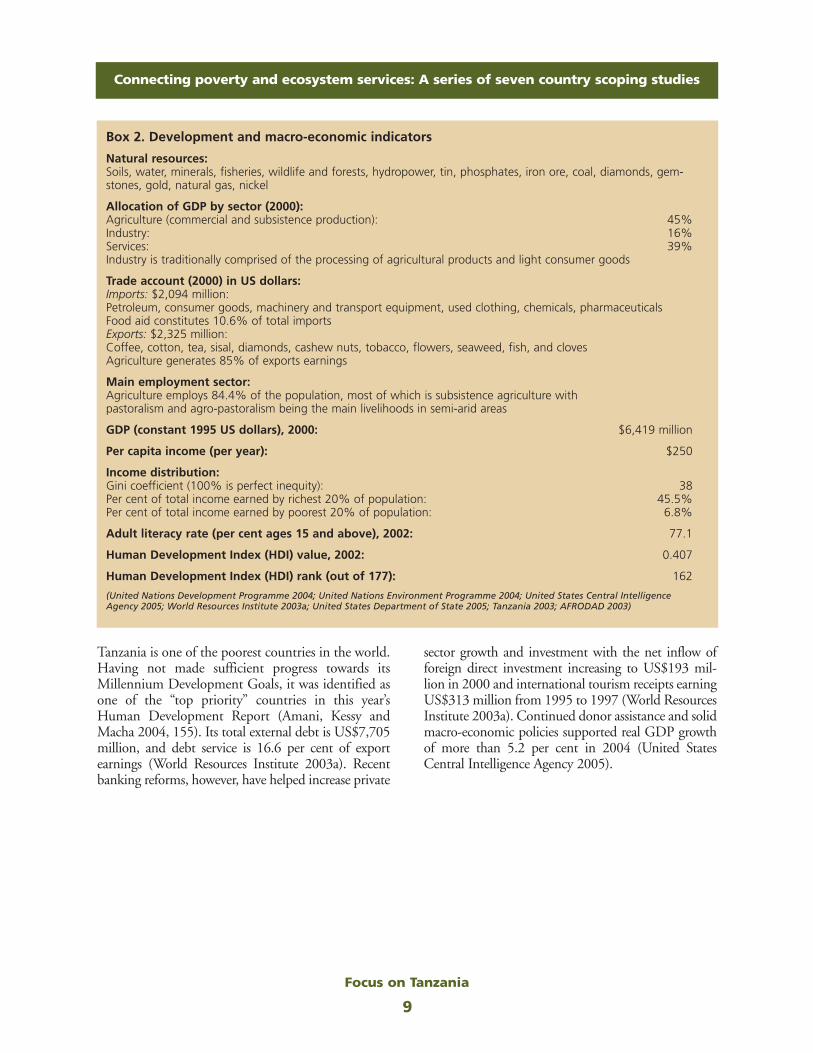
Box 2. Development and macro-economic indicators
Natural resources: Soils, water, minerals, fisheries, wildlife and forests, hydropower, tin, phosphates, iron ore, coal, diamonds, gem-stones, gold, natural gas, nickel
Allocation of GDP by sector (2000):Agriculture (commercial and subsistence production): 45%Industry: 16%Services: 39%Industry is traditionally comprised of the processing of agricultural products and light consumer goods
Trade account (2000) in US dollars:Imports: $2,094 million: Petroleum, consumer goods, machinery and transport equipment, used clothing, chemicals, pharmaceuticals Food aid constitutes 10.6% of total importsExports: $2,325 million: Coffee, cotton, tea, sisal, diamonds, cashew nuts, tobacco, flowers, seaweed, fish, and cloves Agriculture generates 85% of exports earnings
Main employment sector:Agriculture employs 84.4% of the population, most of which is subsistence agriculture with pastoralism and agro-pastoralism being the main livelihoods in semi-arid areas
GDP (constant 1995 US dollars), 2000: $6,419 million
Per capita income (per year): $250
Income distribution:Gini coefficient (100% is perfect inequity): 38 Per cent of total income earned by richest 20% of population: 45.5%Per cent of total income earned by poorest 20% of population: 6.8%
Adult literacy rate (per cent ages 15 and above), 2002: 77.1
Human Development Index (HDI) value, 2002: 0.407
Human Development Index (HDI) rank (out of 177): 162
(United Nations Development Programme 2004; United Nations Environment Programme 2004; United States Central IntelligenceAgency 2005; World Resources Institute 2003a; United States Department of State 2005; Tanzania 2003; AFRODAD 2003)

The literature review identified maintenance of bio-diversity, food and fibre provision, water supply,purification and regulation, and energy resources asthe four critical ecosystem services deteriorating inTanzania. We discuss each in detail below, outlinesome of the main factors influencing their deteriora-tion and, where possible, identify the regions inwhich they are declining. We start with biodiversityloss, as it is maintained by ecosystems and unpinsecosystem functioning and hence availability ofecosystem services overall.
2.1 BiodiversityOnly very recently, theoretical and empirical work hasidentified linkages between changes in biodiversityand the way ecosystems function (Schulze andMooney 1993; Loreau, Naeem and Inchausti 2002).The common perception of the value of biodiversityis limited to specific uses of a limited number of spe-cific species for human use. However, there is increas-ing theoretical and empirical evidence of a muchmore complex relationship between biodiversity—defined as the variability among living organisms; thisincludes diversity within species, between species andof ecosystems—and ecosystem services. Species per-form numerous services for ecosystems; for example,in many ecosystems, there are a variety of species thatfix nitrogen in the soil. The importance of the com-position of the species is determined by how much aloss in the ecosystem service is experienced when oneor more of the species is lost. The lower the impact ofa loss in species to ecosystem functions, the higher isthe level of redundancy in the system.
Status of biodiversity
Tanzania boasts a vast array of biodiversity, withmuch of it being endemic and is home to numerousspecies including 20 primates; 34 antelope; 290 rep-tile; 40 amphibian, and many fish (Tanzania.c). Inaddition, Africa’s richest and most diverse flora isfound in Tanzania in the Zambezian regional centreof endemism (Tanzania.c). Overall, there are six bio-logical hotspots that have value as centres of highspecies diversity and high levels of endemism, namelythe Eastern Arc old block mountain forests, thecoastal forests, the great lakes for Cichlid fishes, the
ecosystems of the alkaline Rift Valley lakes, and thegrassland savannahs for large mammals (Tanzania VicePresident’s Office 2001, 12). In addition, wetlandscover about 10 per cent of the country’s total surfaceand are home to a multitude of aquatic flora and fauna(Tanzania Vice President’s Office 2001, 17).
Currently, 13 million ha, or 11.5 per cent, ofTanzanian lands are under protection, an amountthat is twice the average percentage under protectionfor sub-Saharan Africa, and approximately equal tothe percentage protected in Europe, North Americaand Australia (IUCN 1994 in Mwamfupe 1998). Inaddition to the 12 National Parks, there are 28 gamereserves, 38 game controlled areas and theNgorongoro Conservation Area, which togethercover 38.8 per cent of the country’s total area(Tanzania Vice President’s Office 2001, 5). Tanzania’sprotected areas include: Ngorongoro ConservationArea (in Arusha Region); Serengeti National Park (inMara, Arusha and Shinyanga regions); Maswa GameReserve (on the southwestern border of SerengetiNational Park (Shinyanga Region); Ruaha NationalPark (in Mbeya and Ingringa regions); Selous GameReserve (in the Coastal, Morogoro, Lindi, Mtwaraand Ruvuma regions); and Pugu and KazimzumbwiForest Reserves (in Pwani Region) (Mwamfupe1998). Tanzania protects 3,233 sq km of mangroveforests, housing 10 mangrove species and seven sea-grass species and has 57 genera of scleractina coral,nine of which are protected (World ResourcesInstitute 2004).
However, in spite of the large area of protected areas,biodiversity is steadily declining. Tanzania has 43plant and 123 animal species that are critically endan-gered or endangered, including 19 threatened fresh-water fish species (IUCN 2004; World ResourcesInstitute 2003c). Even though the Eastern ArcMountains forest is a biodiversity hotspot, by 1998 asmuch as 77 per cent of the original cover had beenconverted to other uses (Newmark 1998). In addi-tion, the miombo woodlands which cover about 90per cent of forest reserves are being degraded at a rateof 300,000–400,000 ha per year (Barrow, Gichohiand Infield 2000, 11).
Connecting poverty and ecosystem services: A series of seven country scoping studies
10
2.State of Ecosystem Services
Focus on Tanzania

Factors influencing biodiversity loss
Population growth and movement are having a devas-tating impact on biodiversity. Population growth hasincreased the demand for fuel wood and other forestproducts and land for cultivation and grazing, leadingto deforestation and encroachment into protected andsteep sloped areas (Mwamfupe 1998). This situationwill undoubtedly be exacerbated by future populationgrowth; Tanzania’s population is expected to doublefrom 30 to 60 million by the year 2020 (Mwamfupe1998). In the short term, though, human migration ishaving dramatic, short-term impacts on the environ-ment and on biodiversity through habitat change(Mwamfupe 1998). Pastoral groups with expertise inthe sustainable use of grazing lands have migrated fromthe north and central regions to regions where theyhave adopted crop cultivation practices but with littleecological knowledge on how to manage the soil for thecultivation of crops (Mwamfupe 1998). In addition, aslivestock and human populations grow, demand forcultivatable land grows causing further pressure on bio-diversity (Ngailo et al. 2001). Some changes have led tothe intensification of agriculture and introduction ofnew mono-cropping species3 but, in general, the over-exploitation of plants and animals has reduced theagro-ecosystem and natural forest diversity (Ngailo etal. 2001).
Another source of concern is the increasing negativeimpact of invasive species caused by growing humanpopulation. One major invasive, non-native speciesaffecting Tanzania is the water hyacinth, a floatingaquatic weed that clogs waterways and depletes fish bio-diversity (Pest CABweb 1997). In Tanzania’s portion ofLake Victoria, water hyacinth covers 2,000 ha4 and italso occurs in the Kagera, Sigi and Pangani rivers, instreams and ponds around Dar-es-Salaam, and nearLake Victoria (Mailu 2001). Invasive fish species arealso increasing in number as people have been supple-menting fish fauna in Lake Tanganyika (IUCN 2004).
Park managers also find that poaching and illegalhunting of endangered species for bush meat and forsport is a perennial problem. Ultimately, the lack ofpublic understanding of the importance of wildlifeand of baseline data, inadequate rural user rights, andlimited human and financial resources plague wildlife(Tanzania.c.).
Regions most affected by biodiversityloss
In Tanzania, the most egregious biodiversity lossoccurs in areas with high biodiversity, rapid popula-tion growth/migration and drastic land cover change,particularly on steep slopes. In many cases, areas ofhigh biodiversity are close to areas of rapid humanpopulation growth. For example, the Eastern Arcmountain system (Morogoro, Dodoma, Iringa,Manyara, Arusha regions) and the Zanzibar-Inhambane coastal region of coral reefs and mangroveforests are the most genetically rich areas in the coun-try (United Nations Environment Programme 2004;Tanzania 2002a). Within this area, Urban West, Dares Salaam, Arusha and Manyara regions have thehighest population growth rates in the country (4.5per cent; 4.3 per cent; 4.0 per cent; and 3.8 per centrespectively) second only to Kigoma (Tanzanian2002a). Clearly, Pugu and Kazimzumbwi ForestReserves, Pwani’s tiny, highly diverse coastal forests inthe peri-urban zone of Dar es Salaam face immenserisk (Mwamfupe 1998).
Furthermore, land cover change on sloped landquickly alters soil erosion, nutrient balances and,thus, biodiversity. On Mount Meru, Arusha NationalPark, near Ng’iresi, Olgilai, Moshono and Kiserianvillages, slopes can be as steep as 30–50 per cent.Here, forest cover was once thick but, currently, mostplant and animal species are extinct and only a fewisolated patches of the forest cover remain (Ngailo etal. 2001).
In the north, human migration is a problem for bio-diversity. Refugees that flooded the Kagera Regionpoached wildlife heavily in the surrounding gamereserves (Tanzania 2003a). Due to in-migration, theMaasai population surrounding NgorongoroConservation Area (Arusha Region) has been growingat two to three per cent per year (Mwamfupe 1998).
• Arusha: Deforestation; population growth
• Dodoma: Deforestation
• Iringa: Deforestation
• Kagera: Refugees cutting trees for fuel woodand construction
Connecting poverty and ecosystem services: A series of seven country scoping studies
11
Focus on Tanzania
3 In recent years, however, the introduction of non-traditional cash crops such as flowers, cabbage and round potatoes, and plantingtrees for soil conservation has helped to maintain agro-diversity (Ngailo et al. 2001).
4 However, increased weed stunting and disintegration of existing mats indicates that the water hyacinth is suffering stress, in partfrom the weevils released into the lake (Mailu 2001).

• Kigoma: Refugees cutting trees for fuelwood and construction
• Lindi: Deforestation
• Manyara: Deforestation
• Morogoro: Deforestation
• Pwani: Pugu and Kazimzumbwe ForestReserves due to population growth; man-grove and wetland conversion, especiallyRufiji River forests, woodland and wetlands
• Tanga: Forest reserve encroachment anddeforestation
(Tanzania Vice President’s Office 2001)
2.2 Food and fibre provisionEcosystems provide the medium for growing the foodon which humans and domesticated animals aredependent; this includes the vast range of food prod-ucts derived from plants, animals and microbes. If thecultivation of plants for food and livestock is to suc-ceed, then natural factors such as fertile soils, ade-quate soil moisture, suitable climatic conditions and arich source of plant and animal species are necessary.Deficiencies in some of these elements or attributescan be augmented by technology through the use offertilizers, irrigation, high-yield seeds and domesticatedanimals over the short term and for longer periods ifmanaged sustainably.
State of food and fibre provision services
In Tanzania, agriculture is dominated by small-hold-er farmers “cultivating an average farm size of between0.9 hectares and 3.0 hectares each” (Tanzania 2003).Food crops account for 85 per cent of land underagricultural cultivation with the main subsistencecrops being maize covering 24–26 per cent of culti-vated land, beans covering roughly 18 per cent, whilefinger millet and numerous cash crops each coverabout eight to nine per cent (Tanzania 2003; Ngailoet al. 2001).
Tanzanians obtain much of their protein throughbeans, supplemented by fish, livestock and bushmeat, with fish and fish products accounting forabout 30 per cent of national animal protein intake(Tanzania.c). Fisheries are a vital source of income aswell, as 21 per cent of Tanzania’s population liveswithin 200 km of the coast with approximately80,000 people being permanently employed by fish-
ing (World Resources Institute 2004; Tanzania.c).Annual exports in fish and fish products are up astaggering 14,098 per cent since 1980, and currentlyworth US$58,069,000 (World Resources Institute2004). The main lakes in Tanzania (lakes Tanganyika,Nyasa, Victoria, Eyasi and Rukwa) also support fish-eries with Lake Tanganyika alone directly employing100,000 (IUCN 2004). In addition to agriculture,aquaculture is a quickly growing source of food andexport earnings. Aquaculture production (includingfreshwater fish) increased from 35 metric tons in1987 to 250 metric tons 10 years later (WorldResources Institute 2004).
Tanzania is one of Africa’s largest cattle and milk pro-ducers with meat and manure from cattle and goatsbeing used for food and fertilizer (OECD 2002;Ngailo et al. 2001). Pastoralists raise around 16 mil-lion cattle and 15 million sheep and goats on an esti-mated 600,000 sq km of grazing land (FAO 1999).Livestock density is highest in Mwanza and Mararegions at over 75–100, and >100 animals per sq kmrespectively (FAO Forestry Department).Commercial ranching accounts for only two per centof Tanzania’s total cattle herd, however, livestock pro-duction accounts for approximately 30 per cent of theagricultural GDP (Tanzania.a). In the Mara andShinyanga regions, bush meat is an important sourceof protein and potential income for those living alongthe western boundary of Serengeti National Park.Here, villagers rely primarily on meat from animalsthat they did not husband: 92.3 per cent purchaselivestock meat, 82 per cent purchase bush meat, andover a third consume bush meat caught by a familymember (Loibooki et al. 2001).
Despite the variety of food sources available, severalnatural factors constrain food production. In manyareas of the country, rainfall is not effective for agri-culture, even in places that receive high average rain-fall because its reliability is low (PLDPT 1984 inSawatt and Mollel 2000). Erratic rainfall and coldstress risk limit agricultural production in Arusha,Shinyanga and Kilimanjaro regions in the north,Dodoma Region and Iringa, Mbeya and Rukwaregions in the south and west (FAO ForestryDepartment). As well, in the semi-arid northern andcentral regions, evapo-transpiration is very high, soilmoisture is hard to maintain and there is a high riskof desertification (PLDPT 1984 in Sawatt and Mollel2000). In these areas, drought is a major limitation tolivestock production, especially in Arusha, Dodoma,Singida, Shinyanga, Tabora and Mwanza regions
Connecting poverty and ecosystem services: A series of seven country scoping studies
12
Focus on Tanzania

(Sawatt and Mollel 2000). In addition, low soil suit-ability affects scattered areas in Lindi, Ruvuma,Morogoro, Iringa and Mbeya regions in the south,Rukwa and Kigoma regions in the Lake Tangunyikabasin, as well as Arusha Region in the north (FAOForestry Department).
Fibre production (cash crops)
A wide range of commercial and cash crops are alsogrown, providing an important source of income forlocal farmers and accounting for the majority of exportearnings (FAO 1999; United States Department ofState 2005). Coffee alone earns 17 per cent ofTanzania’s foreign exchange and covers approximately13.6 per cent of cultivated area (Ngailo et al. 2001).Farmers also grow cash crops such as tea, cotton,cashew nuts, sisal, cloves and pyrethrum (insecticidemade from chrysanthemums) to generate income(United States Department of State 2005).
Factors influencing food and fibre provision
Since the late 1970s, average per capita food produc-tion in Tanzania has declined by 32 per cent com-pared to 11 per cent for Sub-Saharan Africa. In 1999,maize production was 228,000 tonnes, roughly 60per cent lower than the previous year and 40 per centbelow the long-term average (FAO 1999). Accordingto a 1999 government report, an estimated 61 percent of the country faces desertification and localizedland degradation (Tanzania Vice President’s Office1999, 3). Factors contributing to soil loss and deser-tification are: inappropriate cultivation techniques,growing human population, growing energy require-ments, over stocking and insecure land tenure(Tanzania 2002).
Population increase in Tanzania has degraded the agro-ecosystem such that its capacity to support productiveagriculture and large livestock numbers has declined(Ngailo et al. 2001). In densely populated highlandregions, the average farm size has decreased and gener-ally fallow periods have become shorter, not allowingsufficient time for regeneration and recovery of soil fer-tility (Tanzania 2002). Currently, the majority of farm-ers in high altitudes, such as those in Arumeru District,Arusha Region, cannot support sufficient numbers ofcattle and goats, and are usually limited to two perhousehold (Ngailo et al. 2001). In general, livestock
production has not kept pace with population increase,and the average Tanzanian only drinks half the quanti-ty of milk drunk by his or her Kenyan neighbour(Agriculturist 2003).
Another confounding factor is the prevalence of tsetsefly infestation in 60 per cent of the grazing land, thusconcentrating livestock in the semi-arid centre andnorth of the country in Arusha, Shinyanga andMwanza regions (PLDPT 1984 in Sawatt and Mollel2000; Tanzania 2002; Agriculturist 2003). The resulthas been overstocking, such as in Shinyanga andArusha regions where livestock stocking excess is over200 per cent (Tanzania 2002).
Desertification is also having a major impact in thecountry, adversely affecting the quality of grazing landsand livestock which in turn limits agricultural outputand compounds other environmental problems(PLDPT 1984 in Sawatt and Mollel 2000). One exam-ple is increased soil acidification due to the excessive useof nitrogenous fertilizers particularly in maize fields insouthern coastal Tanzania (Lindi, Mtwara), as well as inSongea District of Iringa Region (Majule 2004).
In contrast to agriculture and livestock, fishery pro-duction as a whole is currently not suffering. Fishingpressure varies within the country and although fish-ing is managed sustainably in some areas, there is along-term trend of over-fishing overall (Jiddawi andOhman 2002). In Lake Tanganyika, damaging fish-ing practices are starting to deplete fish stocks,adversely affecting food supply in Rukwa andKigoma regions (IUCN 2004a). In addition, over-fishing is a problem along the main coast of the Dares Salaam Region (Pronker 2002).
Regions most affected by deteriorationin food and fibre provision
The trend since 1994–1995 to the present shows anannual 0.8 per cent fall “in the ability of farmers tomeet food and non-food requirements in Tanzania,”though a shorter trend line over the past four yearsshows gains (Tanzania Ministry of Agriculture andFood Security 2004; Tanzania 2003b, 13). The “self-sufficiency ratio” measured as a percentage, is used tocalculate the ability of food produced to meetdemand for food and other food-related requirementsin a particular area5 (Tanzania Minstry of Agricultureand Food Security 2004). By using this measure,
Connecting poverty and ecosystem services: A series of seven country scoping studies
13
Focus on Tanzania
5 This is based on crop production.

regional-level trends dating from 2000–2001 showthat Arusha, Dar es Salaam, Dodoma, Kilimanjaro,Manyara, Pwani (Coast) Shinyanga, Singida andTabora are not able to produce enough food three ormore of the five years analyzed (Tanzania Ministry ofAgriculture and Food Security 2004). Furthermore,Arusha, Dar es Salaam, Kilimanjaro, Manyara, Pwani(Coast) and Shinyanga are food deficient for2004–2005.
• Arusha: High risk of desertification andsevere localized land degradation; over-stocking of cattle
• Dar es Salaam: Fish catch deteriorating
• Dodoma: High risk of desertification andsuffer severe localized land degradation
• Iringa: Low soil suitability and soil acidifi-cation
• Kigoma: Fish catch deteriorating
• Kilimanjaro: Soil degradation
• Linidi: Soil degradation
• Mara: Over-stocking of cattle; soil degrada-tion
• Mbeya: Low soil suitability and soil acidifi-cation
• Morogoro: Low soil suitability and soilacidification
• Mtwari: Soil acidification
• Mwanza: High risk of desertification andsuffer severe localized land degradation;over-stocking of cattle
• Pwani: Soil degradation
• Rukwa: Fish catch deteriorating
• Shinyanga: High risk of desertification andsuffer severe localized land degradation;over-stocking of cattle
• Singida: High risk of desertification andsuffer severe localized land degradation
• Tabora: High risk of desertification and suf-fer severe localized land degradation
• Tanga: Soil degradation
(Tanzania Vice President’s Office 1999, 3; FAO Land andWater Development Division 2004; FAO ForestryDepartment; Tanzania 2002).
2.3 Water supply, purification and regulation
Ecosystems play a key role in the provisioning ofclean freshwater and regulating the flow of water. Theeffectiveness of ecosystems to provide these services isdetermined largely by the quality of the country’swatersheds (see Box 3).
Box 3. What is a watershed?
A watershed is the area of land that catches rain andsnow (if applicable) and drains or seeps these into amarsh, stream, river, lake or groundwater. Their pri-mary function is to capture, store and safely releasewater. This function is indicated by The InternalRenewable Water Resource (IRWR). For example, assnow melts on mountain peaks in the spring, muchof the water soaks into the ground, replenishing soilmoisture and groundwater. This water will be asource of flow to local streams and rivers during dryseasons. Healthy soils and vegetation in the water-shed are essential to proper watershed functioning(Donaldson and Swanson 2001).
Tanzania’s main source of water is precipitation andthis ranges significantly among regions. Tanzaniashares three major lakes (Victoria, Tanganyika andMalawi) as well as the Rovuma River along the bor-der with Mozambique (FAO 1995). On average thecountry receives 82 cu km per year internal renewablewater resource from precipitation (World ResourcesInstitute 2003c). This provides 2,227 cu m freshwa-ter per capita, which is about half the per capita aver-age for Sub-Saharan Africa, but still sufficient to covercurrent withdrawals (World Resources Institute2003c). Due to uneven distribution of rainfall, a pro-longed dry season and arid/semi-arid conditions, sur-face water is limited most of the year (Tanzania2002). Worthy of note are the ecosystem services pro-vided by two catchment forest reserves in theUluguru Mountains in Morogoro and Pwani regions;they are the source of water for Dar es Salaam (WorldRainforest Movement 2002). Groundwater rechargeoccurs mainly through rainfall and potential usevaries widely. Groundwater development has mainlyfocused on shallow wells for domestic purposes, butsome localities have high potential for irrigation(Majule 2004).
Connecting poverty and ecosystem services: A series of seven country scoping studies
14
Focus on Tanzania

State of freshwater supply, purificationand regulation service
Agriculture is the primary use for water and is respon-sible for 89 per cent of water withdrawals, followedby industry at two per cent and domestic use at nineper cent (World Resources Institute 2003c). The totalwithdrawal rate is 1.2 cu km of freshwater per year, or39 cu m per capita, which is only 1.6 per cent of actualrenewable resources (World Resources Institute2003c). As a result of inconsistent supply, however,approximately 45 per cent of the population hasaccess to safe water and Tanzania is expected to fallinto water stress by 2025 and scarcity by 2050(Tanzania Research and Analysis Working Group2002, 75; FAO 1995; United Nations 1994;Stockholm Environment Institute 1997).
Not only is water supply a growing concern, but so iswater quality. Tanzania produces roughly 10,000,000cu m of wastewater annually and pollution fromdomestic and industrial waste is increasing (FAO1995; IUCN 2004a). Lake Tangunyika supports 10million Tanzanians in its basin, but recently, waterintake for Kigoma City, Kigoma revealed substantialamounts of hydrogen-sulfide producing bacteria,likely resulting from domestic wastewater (O’Reillyand Muller 2002). One stream supplying water toDar es Salaam was found to be contaminated withmercury and lead coming mostly from small indus-trial plants discharging untreated waste directly intothe river (Dickinson 2003).
Factors influencing water use, regulation and purification
Water supply and quality are decreasing due tohuman population growth as well as loss of vegetationcover. Inappropriate farming practices and deforesta-tion have caused soil erosion and reduced water regu-lation services leading to increased flooding after rainsand reduced water flow between rains, particularly inMorogoro Region (Paavola 2004). AlthoughTanzania protects 1.6 out of 13 million ha of forestunder water catchment management strategies, par-ticularly on steep slopes, rapid clearing of forest coverin some protected areas has affected soil retention andwater flow regulation (Mwamfupe 1998; Tanzania.c;FAO Forestry Department 2003). In SerengetiNational Park, water quality has also decreased in thelower regions, possibly due to wetland degradationand destruction fringing the Seronera River and thishas impacts for downstream human populations in
the Lake Victoria River basin in the Mara andMwanza regions (Gereta, Mwangomo and Wolanski2004).
In addition, unregulated water extraction, humanmigration and haphazard development threatenaccess to clean water (UNEP.net 2002; IUCN 2004).Uncontrolled and unplanned development is respon-sible for domestic and industrial waste in many fresh-water bodies. For instance, breweries, abattoirs, paintindustry and battery manufacturers north ofTanzania, as well as many smaller cities around LakeTanganyika including Burundi’s capital, Bujumbura,are releasing untreated water directly into the lake(IUCN 2004). Rapid population growth and uncon-trolled industrial development in Arusha and Moshicities have lead to domestic, agricultural and industrialwastewater pollution in the Pangani River catchment,which supplies water to Arusha, Kilimanjaro andTanga regions (Mwanuzi 2000). In another instance,approximately 500 tonnes of obsolete fertilizer storedin rural areas is slowly leaking into the water table(Dickinson 2003). The influx of 600,000 refugeesfrom Burundi and Rwanda for over a decade has cre-ated a water supply and sanitation problem in KageraRegion and large volumes of sediment are beingdeposited into Lake Tanganyika from surroundingdeforestation and tillage practices (IUCN 2004;Tanzania 2003a).
Regions most affected by deteriorationin freshwater supply, purification andregulation
• Arusha: Water shortages and drought; waterquality
• Dar es Salaam: Water quality
• Dodoma: Water shortages and drought
• Iringa: Water shortages and drought
• Kagera: Water shortages and drought; waterquality
• Kigoma: Water shortages and droughtregions; water quality
• Kilimanjaro: Water shortages and drought;water quality; siltation
• Mara: Water quality
• Mbeya: Water shortages and drought
• Morogoro: Flooding
Connecting poverty and ecosystem services: A series of seven country scoping studies
15
Focus on Tanzania

• Mwanza: Water quality
• Rukwa: Water quality
• Singida: Water shortages and drought
• Tanga: Flooding; water quality6
(Majule 2004; Paavola 2004)
2.4 Fuel provisionThe main sources of energy in Tanzania are fuel woodand charcoal from both natural and plantation forests,which together account for 93 per cent of total energyconsumption and constitute a vital provisioning serviceoffered by ecosystems (Tanzania). Of this, wood, asource of energy on which more than 90 per cent of thepopulation depends, accounts for 90 per cent of totalenergy consumption, (Tanzania 2002). Fuel wood isharvested from the approximately 38.8 million ha offorests and woodlands, and 97 per cent of all woodtaken from these forests is used for fuel (Tanzania VicePresident’s Office 2001, 5; World Resources Institute2003b; Tanzania.c).
State of fuel as ecosystem service
Despite the naturally abundant forests, deforestation isa serious threat. Only 29 per cent of the current forestresource is protected and FAO estimates that the cur-rent rate of deforestation of 130,000 to 500,000 ha perannum, is having a devastating impact on biodiversityand ecosystem functioning (FAO 2003). Overall, thecountry’s forest area has declined from 44,300,000 ha,or 50 per cent of total land area, in 1938 to 33,096,000ha, or 43 per cent of total land area, in 1987. However,more wood is now being harvested from plantations;for example, in 1999, a total of 127,202.11 cu m wereharvested from plantations and 26,269.78 cu m fromnatural forests (FAO 2003).
In some cases, when fuel wood is not available, house-holds rely on cow dung and crop residue for energy(Tanzania National Forest Program 2004). The sup-ply of these biological resources depends on the num-ber of livestock and availability of crop residue afterharvest. In addition, the search for scarce fuel woodtakes women away from important activities like fam-ily care and tending to agriculture. In urban areas,fuel wood and charcoal are very expensive, thus com-pelling some families to reduce the number of mealsper day (Tanzania National Forest Program 2004).
Factors influencing the decline in biological fuel services
Deforestation and subsequent wood shortages arecaused by land conversion to agriculture, livestockgrazing and wood resources (including fuel7). Bothagricultural expansion and free-range pastoralismhave resulted in vegetation loss throughout the coun-try (FAO 2003). As well, forests are cleared foruncontrolled development, industry and mining(Tanzania 2002; FAO 2003). Unfortunately, twothirds of Tanzania’s forest is natural woodlands onpublic lands with inadequate management and thereis a lack of clear policies and regulations guiding com-petition for land resources, thus encouraging freeaccess to land and poor tenure arrangements (FAO2003; Tanzania.c).
Several other factors contribute to poor forest man-agement and forest depletion including a significantlack of gender-balanced forest management involvingwomen, inadequate technological innovation, ineffi-cient wood-based industry and poor infrastructure(Tanzania 2004; FAO 2003). Insufficient forestryextension services and a lack of baseline data for con-servation, management and utilization of availableforest resources also hamper effective resource use(Tanzania.c; FAO 2003).
Commercial fuel wood extraction for charcoal pro-duction is no less destructive; it requires large volumesof wood and causes high tree stock depletion, i.e.,deforestation (Monela et al. 1999). Charcoal is oftenhauled for more than 300 km, but little data exist onthe actual extent of deforestation due to urban char-coal use (FAO 1999a; Monela et al. 1999).
Regions most affected by deteriorationin fuel services
The miombo woodlands, the primary source of fuelwood and charcoal, constitute roughly 90 per cent ofTanzania’s 33.35 million ha of forest and woodlandsand are being degraded at a rate of 300,000–400,000ha per year (Barrow 2000, 11; Monela et al. 1999).They occupy the central plateau in the north(Morogoro Region), and in the southeast (LindiRegion) (FAO, Forest Department). Charcoal pro-duction in this region, specifically in Kitulangalo,Morogoro, Mbwewe and Pwani, is responsible for 75per cent of woodland degradation (Monela et al.
Connecting poverty and ecosystem services: A series of seven country scoping studies
16
Focus on Tanzania
6 Map of Precipitation, FAO http://www.fao.org/countryprofiles/Maps/TZA/06/pp/index.html
7 Domestic fuel consumption accounts for 94 per cent of the total 38,193,000 cu m of roundwood harvested annually (WRI 2004).

1999). In Kagera Region, refugee settlement and fuelwood demand has caused “colossal” deforestation(Tanzania Government 2003). In general, the south-ern regions have the most intact and closed forest.8 Assuch, Lindi Region, one of the most heavily forestedregions in Tanzania with much intact miombo wood-land, is under increasing threat of new expansion anddevelopment (Mpingo Conservation Project).
• Kagera: Refugees
• Lindi: Miombo woodland degradation
• Morogoro: Miombo woodland degradation
• Pwani: Miombo woodland degradation
2.5 Summary of ecosystemservices stressed
The survey of ecosystem services stressed focused onthe 21 regions that are on the Tanzanian mainland, aslittle information was found on the islands ofZanzibar and Pemba. Of the 21 mainland regions, 20were found to have ecosystem services that are deteri-orating with Ruvuma being the only exception. Thisdoes not mean, however, that ecosystem services inRuvuma are not under threat, but rather this resultshould be cautiously interpreted as a data gap.
Almost all of the remaining regions (18 out of 20) wereexperiencing declining food production, while 14 werealso water stressed. Biodiversity was found to be threat-ened in 10. One region, namely Morogoro, was foundto have all four ecosystem services stressed, pointing tothe need for further investigation. Arusha, Kagera,Kigoma, Lindi, Pwani and Tanga regions each wereexperiencing deterioration in three of the four ecosystemservices, and several of these same regions are facing thedouble challenges of deteriorating food and fibre provi-sion and water supply, regulation and quality services.
Table 1. Summary: Ecosystem services stressedby region
Region Ecosystem services stressed
Arusha BiodiversityFood productionWater supply, purification and regulation
Dar es Salaam Food productionWater supply, purification and regulation
Dodoma BiodiversityFood productionWater supply, purification and regulation
Region Ecosystem services stressed
Iringa BiodiversityFood productionWater supply, purification and regulation
Kagera BiodiversityWater supply, purification and regulationFuel (energy)
Kigoma BiodiversityFood productionWater supply, purification and regulation
Kilimanjaro Food productionWater supply, purification and regulation
Lindi BiodiversityFood productionFuel (energy)
Manyara Biodiversity
Mara Food productionWater supply, purification and regulation
Mbeya Food productionWater supply, purification and regulation
Morogoro BiodiversityFood productionWater supply, purification and regulationFuel (energy)
Mtwari Food production
Mwanza Food productionWater supply, purification and regulation
Pwani BiodiversityFood productionFuel (energy)
Rukwa Food productionWater supply, purification and regulation
Shinyanga Food production
Singida Food productionWater supply, purification and regulation
Tabora Food production
Tanga BiodiversityFood productionWater supply, purification and regulation
Connecting poverty and ecosystem services: A series of seven country scoping studies
17
Focus on Tanzania
8 Map of Forest Cover, FAO http://www.fao.org/forestry/foris/webview/forestry2/index.jsp?siteId=2181&sitetreeId=5966&langId=1&geoId=19

Human well-being is multi-dimensional with manyconstituents and determinants closely determined bythe state of ecosystem services (Duraiappah 2004).However, not all constituents may be under seriousthreat in a country and not all of these constituentsare directly dependent on the state of ecosystem serv-ices. Therefore, as emphasized in the beginning, onlyconstituents and/or determinants of well-beingdirectly affected by the state of ecosystem services arecovered in this report. Our preliminary review identi-fied the following critical constituents which appearto be under serious threat among many social groupswithin Tanzania.
3.1 Ability to be adequatelynourished
The ability to be adequately nourished is dependenton two factors; the ability to grow food and the abil-ity to buy food. While the supply of food is critical,economic entitlements that individuals are able tosecure, such as income from non-farm labor, are alsoimportant (Sen 1990). There are several measures ofthe ability to be adequately nourished including thatof food (in)security as well as incidence of malnutri-tion, among others.
State of the ability to be adequatelynourished
As subsistence crop production dominates the agri-cultural economy, as well as the Tanzanian economyas a whole, the main factor underpinning poor nour-ishment is inability to grow enough food. Food sup-ply is characterized by declining agricultural produc-tion due to inadequate distribution and quantity ofrainfall, desertification and lack of economic entitle-ments. As a result of poor rainfall, planting areas andyield have fallen sharply and maize production is sig-nificantly below average (FAO 1999). In 2001, 43per cent of the population was undernourished, upfrom 35 per cent in 1990 and the average per capitaconsumption is merely 1,940 kcal per day, comparedto the world average of 2,808 kcal (United NationsDevelopment Programme 2004; Amani, Kessy andMacha 2004, 162). Malnourishment from inade-quate nutrient (vitamins and minerals) intake is wide-
spread, particularly among young infants and adoles-cent girls and women (Amani, Kessy and Macha2004, 162).
The ability to be adequately nourished not onlydepends on food supply but also on the economicentitlements to buy food. High staple food prices area problem. Reflecting low supply, maize prices con-tinued to rise in several markets, aggravating thefood-security situation of a large number of people(FAO Economic and Social Department 2004). Aprice comparison of the staple commodities maizeand sorghum in Dodoma, Shinyanga, Mwanza, Maraand Singida regions shows that prices have increasedsince 2000 (Famine Early Warning System 2004).Inappropriate pricing and unreliable cash flow tofarmers continue to aggravate the agricultural sector(United States Department of State 2005). Althoughtrends in maize price vary across markets, theirabsolute level is a concern for poor households inurban areas and isolated rural areas where poor cropproduction forces farmers to depend on marketsrather than their own food production (Famine EarlyWarning System 2004). About 80 per cent of foodvulnerable persons are in regions where maize pricesapproach or exceed the maize price level of TShs15,000–18,000 per 100 kg (Famine Early WarningSystem 2004).
Commonly, people with little access to livestock oralternative means of generating income have turnedto illegal bush meat hunting which can either providefood or income (Loibooki et al. 2002). For those inurban areas, urban agriculture is flourishing as peoplelook for ways to cope with rising costs of living(Tanzania 2003). In Tanzanian towns and cities, pro-ducers of vegetables, milk, meat and eggs are selling toprivate households, as well as schools, hospitals,hotels, bars, cafes and restaurants (Tanzania 2003).
Regions most affected
• Arusha: Crops failed due to drought
• Dodoma: Food shortages
• Kilimanjaro: Crops failed due to drought;maize loss due to recent drought was 100per cent
Connecting poverty and ecosystem services: A series of seven country scoping studies
18
3.State of Human Well-being
Focus on Tanzania

• Lindi: Food shortages
• Mara: Crops failed due to drought
• Morogoro: Food shortages
• Manyara: Food shortages
• Mwanza: Crops failed due to drought
• Pwani: Food shortages
• Shinyanga: Food shortages; crops failed dueto drought
• Singida: Food shortages
• Tabora: Crops failed due to drought
• Tanga: Crops failed due to drought
(FAO Economic and Social Department. 2004; FamineEarly Warning System 2004)
3.2 Ability to have adequate and cleandrinking water
Access to adequate and clean drinking water isessential for a healthy life. The minimum standardset by the United Nations as required by an individ-ual to satisfy human needs is 1,000 cu m per year(Biggs et al. 2004, 13). Clean water can be providedin a number of ways. Filtration plants using moderntechnology provide clean water, but watersheds inpristine condition can offer the same quality ofwater. In a well known example, the city of NewYork was able to provide clean water to its habitantsby restoring and preserving the Catskill watershedwhich basically captures, stores, purifies and releaseswater. The cost saved by preserving the watershedvis-à-vis building a modern water filtration plantwas in the region of about $4 billion (Daily andEllison 2002; Duraiappah 2005).
State of ability to have adequate andclean drinking water
Coverage rates for water that were collected in 2000show that 80 per cent of urban and 42 per cent ofrural Tanzanians have access to water (Mujwahuzi2002, 8). Overall, 50 per cent of the population iswithout sustainable access to improved water sourcesand barely 65 per cent of urban and 43 per cent ofrural residents have access to potable water within400 metres (United Nations DevelopmentProgramme 2004; Tanzania 2002). Despite efforts bythe government to provide people with easy access to
water sources there has been a decrease in per capitawater use during the past 30 years; for example, themean per capita water use in piped households hasdeclined from 141.8 litres per day in 1966 to 80.2litres per day in the mid-nineties (Mujwahuzi 2002,45). This does not hold, however, for mainly ruralunpiped households who saw an increase in mean percapita water use from 13.5 litres to 18.6 litres per day(Mujwahuzi 2002, 45).
Factors influencing the ability to haveadequate and clean drinking water
Mujwahuzi (2002, 45) listed several factors influenc-ing the decrease in mean per capita water use forpiped households as being: “the ageing of the watersupply infrastructure; lack of adequate maintenance;and increased pressure on the existing inadequateinfrastructure due to increased industrial and domes-tic demand.” Much of this is attributed to increases inurban populations. Despite an overall increase inwater use in rural areas, the much lower daily percapita water use here can largely be attributed todrought conditions, as water has to be carried forlonger distances and there are long waiting times atthe water point to fill water containers resulting in lesswater being carried home (Mujwahuzi 2002, 48).
Availability and level of use of water is influenced byseveral other factors such as cost, relative wealth of thefamily, the number of people in the household(amount of water for each member decreases as thenumber of people increases), the proportion of chil-dren and, in the case of piped households, the num-ber of hours of service that make water available, andin the cases of the unpiped householder, the locationof the water source (Mujwahuzi 2002, 57–60). Wateravailability is also influenced by environmental fac-tors such as seasonality of rainfall, increased sedimentloads in rivers due to deforestation and soil erosion,pollution and overgrazing due to increasing numbersof livestock that use the same water sources ashumans, and human population increase (Mujwahuzi2002, 61–62).
Regions most affected by inability tohave adequate and clean drinkingwater
According to data in Kivugo (1995, 42) water cover-age for all mainland regions ranged from 28.2 percent in Shinyanga to 84.7 per cent in Mtwara. Noneprovided 100 per cent coverage. This finding is sup-ported by later data, collected in 2002, which show
Connecting poverty and ecosystem services: A series of seven country scoping studies
19
Focus on Tanzania

the percentage of the rural population with access tosafe water ranges from 11 per cent in Lindi to 75 percent in Kilimanjaro (Tanzania Research and AnalysisWorking Group 2002, 69). Even though the two datasets are not identical, they both show that no onemainland region provided access to safe water to all oftheir population.
3.3 Ability to have energyto keep warm and cook
A reliable source of energy is a necessary componentof human well-being, as it is required for daily activi-ties like cooking and keeping warm. The most impor-tant source of energy in Tanzania is fuel wood, whichcomprises approximately 93 per cent of its energysupply (Tanzania; Monela et al. 1999). And, the mostenergy consuming task at the household level is cook-ing, which accounts for 90 per cent of fuel use inTanzania (Ndekuka 1999).
State of ability to have energy to keepwarm and cook
Currently, fuel wood is being consumed more quicklythan it can be replaced. In 1988, there was already adeficit of almost 21 million cu m of wood per yearand consumption rates are still increasing (FAO1999a.). Both the total and per capita woodfuel con-sumption (47,945,000 cu m; 1.027 mt/capita/year)and household and per capita charcoal consumption(409,000 cu m; 0.017 ton/capita) have increasedsince 1992 (FAO 1999a).
Tanzania faces enormous energy problems: people haveto go longer distances to obtain firewood; woodfuel isbecoming scarcer requiring the use of low quality bio-mass fuels like cow dung, which also causes hazardousindoor pollution; reliance on inefficient biomass ener-gy technologies; and the need to buy wood which wasformerly a free commodity (Ndekuka 1999).
Now that fuel wood has entered the market economyand is increasingly scarce, farmers near urban areas areshifting away from farming to trading in charcoal(FAO 1999a.). A 50–60 kg bag of charcoal is worthbetween US$4–5 and $6–7 in the rainy season inurban areas (FAO 1999a.).
Regions most affected by inability tohave energy to keep warm and cook
Women are the main users and collectors of house-hold fuel and are the most vulnerable to energy prob-
lems. Fuel wood scarcity directly affects women, par-ticularly those in Shinyanga, Arusha, the Kilimanjarolowlands, Dodoma and Singida regions (TanzaniaNational Forest Program 2004). In these regions,women must walk at least six to 10 km to collect fuelwood (Tanzania National Forest Program 2004). Aswell, agro-pastoralists in Shinyanga’s Meatu districtare experiencing a shortage of fuel wood and dry-sea-son livestock fodder (Kamwenda, G. J. 2002).
As urban populations are growing more rapidly thanrural ones, fuel demand is also higher in these areas(FAO 1999a.). The average consumption of woodfuelper capita in five urban centres was 1.03 cu m (Dar esSalaam 0.6 cu m, Mbeya 0.99 cu m, Dodoma 0.9 cum, Arusha 1.86 cu m, and Mwanza 0.81 cu m)(Ishengoma and Ngaga in FAO 1999a).
• Arusha
• Dar es Salaam
• Dodoma
• Kagera: Refugees (Section 2.4)
• Kilimanjaro
• Lindi: Miombo woodland degradation(Section 2.4)
• Morogoro: Miombo woodland degradation(Section 2.4)
• Pwani: Miombo woodland degradation(Section 2.4)
• Shinyanga
• Singida
3.4 Ability to earn a livelihood
The ability to earn a livelihood is essential to humanwell-being and is measured using various indicatorssuch as per capita GDP, household consumption lev-els and so on. In efforts to identify those needing gov-ernment supports, poverty lines are established usingan estimate of the cost of food and non-food basicneeds for individuals and families. For example,Tanzania developed a socio-economic database using2002 data from which a “human development index”was compiled using four indicators: life expectancy atbirth, knowledge measured using the adult literacyrate, primary gross enrolment ratio, and mean monthlyconsumption expenditure per capita (TanzaniaResearch and Analysis Working Group 2002).
Connecting poverty and ecosystem services: A series of seven country scoping studies
20
Focus on Tanzania

Connecting poverty and ecosystem services: A series of seven country scoping studies
21
Focus on Tanzania
State of ability to earn a livelihood
Tanzania’s economic entitlements are low. In fact,41.6 per cent of the population lives below thepoverty line with 19.9 per cent of the population liv-ing on less than $1 a day, and 59.7 per cent living onless than $2 a day (World Resources Institute 2003a).During the 1990s, employment in the governmentand parastatal sectors declined from three per cent totwo per cent and 1.7 per cent to 0.5 per cent respec-tively, while employment in the private formal sectorincreased from three per cent to five per cent alongwith a small increase in the informal sector/self-employment (Tanzania Research and AnalysisWorking Group 2002, 19–20). There was also adecline from 84 per cent to 81 per cent in traditionalagriculture, though it remains as the main source oflivelihood for the majority of the population(Tanzania Research and Analysis Working Group2002, 19). Unemployment is highest in urban areas,particularly Dar es Salaam.
While most agriculture in Tanzania is for subsistence,there are some cash crops earning export income. Of
these, coffee is the primary one and it is grown by400,000 small-scale and mostly poor farmers whogenerally each own fewer than five acres of land(Technoserve 2004). Once a good export earner,income from coffee exports has steadily fallen since1995 (World Bank 2004). Coffee is produced in theMatengo highland regions of Kilimanjaro, Mbeyaand Mbinga where most of the coffee trees are loweryielding older trees; these 70-year-old trees yield .25kg per tree while neighbouring Kenya produces up tofour kg per tree (Technoserve 2004). Tanzania’s sec-ond most valuable cash crop, cotton, earned the sameas coffee in 2003 (World Bank 2004).
In Zanzibar, the economy is based chiefly on the pro-duction of cloves which are the main foreignexchange earner (90 per cent grown on the island ofPemba) (United States Department of State 2005).Tourism is an increasingly promising sector for for-eign earnings, recording over US$500 million annu-ally (Tanzania 2000). In recent years, a number ofnew hotels and resorts have been built as well (UnitedStates Department of State 2005).
Table 2. Human Development Index (HDI)
(Tanzania Research and Analysis Working Group 2002, 73).

Even though Tanzania has a well-developed tourismindustry and mature coffee and cotton exports,70–75 per cent of the population, mainly living inrural areas are income poor (Department forInternational Development 1999 in Quinn 2003,111). In rural areas, 39 per cent of the population fallsbelow the basic needs poverty line, while in urbanDar es Salaam 18 per cent of population falls belowthe poverty level (Amani, Kessy and Macha et al.2004, 162).
Region most affected by inability toearn a livelihood (income poverty)
The majority of Tanzanians have not seen a reductionof income poverty during the previous 10–15 years,though there has been a slight decline in urban areas(Tanzania Research and Analysis Working Group2002, 12). Given the high rates of poverty and lack ofimprovement in garnering better livelihoods for mostTanzanians, one can conclude that all regions ofTanzania are experiencing an inability to earn an ade-quate livelihood. This finding is supported by a “basicneed poverty headcount” done for the 2000–2001Household Budget Survey, which shows those notable to meet their basic needs range between 17.6 percent in Dar es Salaam to 55.0 per cent in Singida(Tanzania Research and Analysis Working Group2002, 68; Tanzania Bureau of Statistics 2002). When
calculated using the human development index, thefive regions with the lowest HDI are Kagera,Mwanza, Lindi, Shinyanga and Rukwa. Table 2shows the complete ranking for regions based on thehuman development index.
3.5 Summary of constituentsof well-being underthreat
Constituents of well-being were found to be threat-ened in all 23 of the mainland regions. Of these, eightregions, namely Arusha, Dodoma, Kilimanjaro,Lindi, Morogoro, Pwani, Shinyanga and Singida,were experiencing distress for all four constituentsexamined, which translates into a large number ofpeople not able to meet their basic daily needs foradequate nourishment, clean drinking water, energyfor cooking and warmth, and earning a livelihood. Anadditional six regions were found to have three con-stituents threatened, while the remainder had twothreatened constituents. One of the most strikingaspects of this breakdown is pervasive water scarcityand inability to earn an adequate livelihood, as bothconstituents are threatened in all mainland regions;they are undoubtedly connected and mutually rein-forcing since over 80 per cent of the populationachieves a livelihood through subsistence farming.
Connecting poverty and ecosystem services: A series of seven country scoping studies
22
Focus on Tanzania

Connecting poverty and ecosystem services: A series of seven country scoping studies
23
Focus on Tanzania
Region Constituent of well-being under threat
Arusha Adequately nourishedAdequate and clean drinking waterEnergyEarn a livelihood
Dar es Salaam Adequate and clean drinking waterEnergyEarn a livelihood
Dodoma Adequately nourishedAdequate and clean drinking waterEnergyEarn a livelihood
Iringa Adequate and clean drinking waterEarn a livelihood
Kagera Adequate and clean drinking waterEnergyEarn a livelihood
Kigoma Adequate and clean drinking waterEarn a livelihood
Kilimanjaro Adequately nourishedAdequate and clean drinking waterEnergyEarn a livelihood
Lindi Adequately nourishedAdequate and clean drinking waterEnergyEarn a livelihood
Manyara Adequately nourishedAdequate and clean drinking waterEarn a livelihood
Mara Adequately nourishedAdequate and clean drinking waterEarn a livelihood
Mbeya Adequate and clean drinking waterEarn a livelihood
Region Constituent of well-being under threat
Morogoro Adequately nourishedAdequate and clean drinking waterEnergyEarn a livelihood
Mtwara Adequate and clean drinking waterEarn a livelihood
Mwanza Adequate and clean drinking waterEarn a livelihood
Pemba North Adequate and clean drinking waterEarn a livelihood
Pemba South Adequate and clean drinking waterEarn a livelihood
Pwani Adequately nourishedAdequate and clean drinking waterEnergyEarn a livelihood
Rukwa Adequate and clean drinking waterEarn a livelihood
Ruvuma Adequate and clean drinking waterEarn a livelihood
Shinyanga Adequately nourishedAdequate and clean drinking waterEnergyEarn a livelihood
Singida Adequately nourishedAdequate and clean drinking waterEnergyEarn a livelihood
Tabora Adequately nourishedAdequate and clean drinking waterEarn a livelihood
Tanga Adequately nourishedAdequate and clean drinking waterEarn a livelihood
Table 3. Constituents of well-being under threat/region

In Table 4, ecosystem services stressed and con-stituents of well-being threatened are listed for eachregion. In many instances there is a high correlationbetween the ecosystem services and constituents ofwell-being that are stressed. Regions experiencingdeterioration in food and fibre provision also faceserious problems in meeting adequate nourishmentlevels. Furthermore, the regions facing drops in foodproduction in most cases also experience problems inwater supply.
Morogoro Region stands out, as it is the only regionthat has all four ecosystem services stressed and con-stituents of well-being threatened, suggesting that itshould be a priority region for development efforts. In
addition to Morogoro, eight regions, namely Arusha,Dodoma, Kilimanjaro, Lindi, Mara, Pwani, Singidaand Tanga, are identified as having food produc-tion—inadequate nourishment and deterioratingwater supply—inadequate access to safe water, high-lighting a state that needs immediate action.Biodiversity is now under threat in several regions, aloss that is particularly distressing, as Tanzania hashad a long tradition of conserving biodiversity, main-ly through an extensive network of protected areas.No doubt this biodiversity loss is having a negativeimpact on ecosystem functioning. This is the case inKilimanjaro where deforestation is contribution tosoil erosion and sediment loading in rivers.
Table 4. Ecosystem services stressed and constituents of well-being threatened, by region
Region HDI rank Ecosystem services stressed Constituent of well-being under threatand value
Arusha 4 Biodiversity Adequately nourished0.539 Food production Adequate and clean drinking water
Water supply, purification and regulation EnergyEarn a livelihood
Dar es Salaam 1 Food production Adequate and clean drinking water0.734 Water supply, purification and regulation Energy
Earn a livelihood
Dodoma 14 Biodiversity Adequately nourished0.425 Food production Adequate and clean drinking water
Water supply, purification and regulation EnergyEarn a livelihood
Iringa 5 Biodiversity Adequate and clean drinking water0.514 Food production Earn a livelihood
Water supply, purification and regulation
Kagera 16 Biodiversity Adequate and clean drinking water0.416 Water supply, purification and regulation Energy
Fuel (energy) Earn a livelihood
Kigoma 15 Biodiversity Adequate and clean drinking water0.420 Food production Earn a livelihood
Water supply, purification and regulation
Connecting poverty and ecosystem services: A series of seven country scoping studies
24
Focus on Tanzania
4.Linking Ecosystem Services to
Human Well-being

Connecting poverty and ecosystem services: A series of seven country scoping studies
25
Focus on Tanzania
Region HDI rank Ecosystem services stressed Constituent of well-being under threatand value
Kilimanjaro 2 Food production Adequately nourished0.603 Water supply, purification and regulation Adequate and clean drinking water
EnergyEarn a livelihood
Lindi 18 Biodiversity Adequately nourished0.407 Food production Adequate and clean drinking water
Fuel (energy) EnergyEarn a livelihood
Manyara n/a Biodiversity Adequately nourishedAdequate and clean drinking waterEarn a livelihood
Mara 13 Food production Adequately nourished0.447 Water supply, purification and regulation Adequate and clean drinking water
Earn a livelihood
Mbeya 3 Food production Adequate and clean drinking water0.540 Water supply, purification and regulation Earn a livelihood
Morogoro 10 Biodiversity Adequately nourished0.463 Food production Adequate and clean drinking water
Water supply, purification and regulation EnergyFuel (energy) Earn a livelihood
Mtwara 7 Food production Adequate and clean drinking water0.488 Earn a livelihood
Mwanza 17 Food production Adequate and clean drinking water0.414 Water supply, purification and regulation Earn a livelihood
Pemba North n/a Adequate and clean drinking waterEarn a livelihood
Pemba South n/a Adequate and clean drinking waterEarn a livelihood
Pwani 11 Biodiversity Adequately nourished0.449 Food production Adequate and clean drinking water
Fuel (energy) EnergyEarn a livelihood
Rukwa 20 Food production Adequate and clean drinking water0.390 Water supply, purification and regulation Earn a livelihood
Ruvuma 6 Adequate and clean drinking water0.502 Earn a livelihood
Shinyanga 19 Food production Adequately nourished0.394 Adequate and clean drinking water
EnergyEarn a livelihood

The main problem most regions confront is the man-agement of water. Although the internal waterrecharge rate is sufficient to meet present withdrawalrates, most of the population still faces difficultyaccessing water. The lack of appropriate technologyfor managing water resources is a major constraint inthe sustainable management of water resources.However, technology by itself would not be suffi-cient. The increasing loss of forests and vegetativecover has increased the rate of run-off and less captureof precipitation. Over time, this can only imply adeterioration in the internal water recharge rate andsubsequently the supply of water available. This is fur-ther compounded by an increasing demand for waterby a population which is growing at an unsustainableannual rate of five per cent.
Although water is a major factor in declining foodyields, other factors also contribute to the trend.Decreasing soil fertility caused by decreasing fallowperiods is another main contributing factor. Smaller
farms caused by increasing population forces farmersto work the land more intensively to meet subsistenceneeds. Allowing land to remain fallow and regain pro-ductivity is now considered a luxury. Lack of expert-ise in using fertilizers and a decreasing supply of nat-ural fertilizers from cattle has contributed to decreas-ing land productivity. Another factor in the pastoralareas is the growing herd size which has put greaterpressure on grazing resources.
Although much information has been gathered inthis review, much remains to be learnt before inter-vention strategies can be developed. A locally-basedintegrated assessment, whereby more detailed infor-mation on the links between ecosystem services andwell-being and the type of trade-offs and synergiesthat occur among these links, will provide policy-makers in Tanzania the necessary information tomake the necessary intervention to achieve some, ifnot most, of the Millennium Development Goals.
Connecting poverty and ecosystem services: A series of seven country scoping studies
26
Region HDI rank Ecosystem services stressed Constituent of well-being under threatand value
Singida 9 Food production Adequately nourished0.468 Water supply, purification and regulation Adequate and clean drinking water
EnergyEarn a livelihood
Tabora 8 Food production Adequately nourished0.486 Adequate and clean drinking water
Earn a livelihood
Tanga 12 Biodiversity Adequately nourished0.447 Food production Adequate and clean drinking water
Water supply, purification and regulation Earn a livelihood
Focus on Tanzania

African Forum and Network on Debt andDevelopment (AFRODAD). 2003. Debt Profile,Tanzania. http://www.afrodad.org/debt/tanzania.htm
Africans Fighting Malaria (AFM). 2004.http://www.fightingmalaria.org/news.php?ID=297
Agrawala, Shardul et al. 2003. Development and climate change in Tanzania: focus on MountKilimanjaro. Paris: OECD EnvironmentDirectorate. 71 p.
Agriculturist. 2003. http://www.new-agri.co.uk/03-3/countryp.html
Alcamo, Joseph et al. 2003. Ecosystems and humanwell-being: a framework for assessment. Washington,D.C.: Island Press, 2003, xiv, 245 p.
Amani, H. et al. 2004. Public expenditure review ofenvironment financial year 2004, final report.Tanzania: Vice Presidents Office. 120 p.
Amani, Haidari K. R., Flora Lucas Kessy andDeogratias Macha. 2004. “Tanzania country study.”In Millennium Development Goals Needs Assessment:country case studies of Bangladesh, Cambodia, Ghana,Tanzania and Uganda. Working paper draft 17January 2004, by Jeffrey Sachs et al. MillenniumProject, pp. 154–176.
Armitage, Derek R. 1996. “Environmental manage-ment and policy in a dryland ecozone: the Eyasi-Yaeda Basin, Tanzania.” Ambio 25 (6, 1996).
Aryeetey-Attoh, Samuel, ed. 2003. Geography ofSub-Saharan Africa. 2nd. ed. Upper Saddle River,NJ: Prentice Hall. 460 p.
Barrow, Edmund, Helen Gichohi and Mark Infield.2000. Rhetoric of reality? A review of community con-servation policy and practice in East Africa. Nairobi:IUCN East Africa Regional Office. 175 p.
Biggs, R. et al. 2004. Nature supporting people: thesouthern African millennium ecosystems assessment:integrated report. Harare: Southern African SubGlobal Assessment, SAfMA, 2004. 68 p.
Chenje, Munyaradzi and Phyllis Johnson, eds. 1996.Water in Southern Africa. [s.l.]:SADC/IUCN/SARDC. 238 p.
Daily, Gretchen C. 1997. Nature’s services: societaldependence on natural ecosystems. Washington, DC:Island Press, 1997, xx, 392 p.
Daily, Gretchen C. and Katherine Ellison. 2002.The new economy of nature: the quest to make conser-vation profitable. Washington, D.C.: Island Press,2002. 260 p.
Dickenson, Daniel. 2003. “Tanzania fears toxicwater apocalypse.” BBC World News (Thursday, May22, 2003). http://news.bbc.co.uk/1/hi/world/africa/3050537.stm
Duraiappah, A. K. 2002. Poverty and ecosystems: aconceptual framework. UNEP Division of Policy andLaw paper. Nairobi: UNEP. 49 p.
Duraiappah, Anantha Kumar. 2004. Exploring thelinks: human well-being, poverty & ecosystem services.Winnipeg, MB: IISD/UNEP-DPDL, 2004, 44 p.
Duraiappah, A. K. 2005. An economic approach forevaluating health and environment linkages. Geneva:WHO/UNEP. 40 p.
Encyclopedia.com. 2005. Tanzania. Retrieved fromthe World Wide Web, March 21, 2005.http://www.encyclopedia.com/html/section/tanzania_landandpeople.asp
FAO. 1993. Sustainable development of drylands andcombating desertification. http://www.fao.org/documents/show_cdr.asp?url_file=/docrep/v0265e/V0265E01.htm
FAO 1995, “L’irrigation en Afrique en chiffres” FAOCorporate Document Repository.http://www.fao.org/documents/show_cdr.asp?url_file=/docrep/V8260B/V8260B1m.htm
FAO. 1999. FAO/WFP crop and food supply assess-ment mission to Tanzania, 15 February 1999. Paris:FAO. Retrieved from the World Wide Web, March2005. http://www.fao.org/documents/show_cdr.asp?url_file=/docrep/004/x1490e/x1490e00.htm
Connecting poverty and ecosystem services: A series of seven country scoping studies
27
References
Focus on Tanzania
Connecting poverty and ecosystem services: A series of seven country scoping studies
28
Focus on Tanzania
FAO, 1999a. Non-Wood Forest Products in Tanzania.Corporate Document Repository.http://www.fao.org/documents/show_cdr.asp?url_file=/DOCREP/003/X6700E/X6700E01.htm
FAO. Economic and Social Department. 1999.Food Supply situation and crop prospects in Sub-Saharan Africa, April 1999. http://www.fao.org/documents/show_cdr.asp?url_file=/docrep/004/x1652e/ctry/af990443.htm
FAO. Economic and Social Department. 2004.“Country reports: Tanzania.” Foodcrops and shortages(February 1, 2004). Retrieved from the World WideWeb, March 2005. http://www.fao.org/documents/show_cdr.asp?url_file=/docrep/006/J1757e/J1757e00.htm
FAO. Forestry department. Country profile:Tanzania: geography. Retrieved from the World WideWeb, March 21, 2005. http://www.fao.org/forestry/foris/webview/forestry2/index.jsp?siteId=5081&sitetreeId=18927&langId=1&geoId=0
FAO Forestry Department. 2003. Country Profile,General Information, 2003 – Key Issues in the forestrysector. http://www.fao.org/forestry/foris/webview/forestry2/index.jsp?siteId=4621&sitetreeId=16218&langId=1&geoId=19
FEW.Net map http://www.fews.net/centers/current/monthlies/report/?f=r2&m=1001370&l=en
Famine Early Warning System. 2004. “FEWSTanzania Food Security update Dec. 2004: late rainsworry farmers.” Relief Web (Dec. 31, 2004).http://wwwnotes.reliefweb.int/w/rwb.nsf/0/00d86eec588d6f4149256f86000883c4?OpenDocument
GEF/UNDP: Ministry of Natural Resources andTourism, Conservation and Management of theEastern Arc Mountain Forests: Eastern ArcMountains Strategy (GEF/UNDP: 00015426)Terms of Reference for Hydrological Analysis for theEastern Arc Mountains.
Gereta, Emmanuel, Ephraim Mwangomo and EricWolanski. 2004. “The influence of wetlands in regu-lating water quality in the Seronera River SerengetiNational Park, Tanzania.” Australian Institute ofMarine Science. http://www.aims.gov.au/ibm/pages/news/2004041305-wetlands-snp.html
Hella, J. P. and F. T. Kamuzora. 1998. “Climatechange and agricultural planning beyond the 21st.Century: a case study of the Morogoro District.”AGREST Proceedings, pp. 203-215.
IUCN 2004. 2004 IUCN Red List of ThreatenedSpecies. <www.redlist.org>. Downloaded onFebruary 18, 2005.
IUCN. 2004a. Water and nature initiative: LakeTanyanika. Retrieved from the World Wide Web,March 2005. http://www.waterandnature.org/1e.html
James, Robert, Ntengua Mdoe and FulgenceMishili. 2002. Tanzanian rural livelihoods: towards amore enabling institutional environment. LADDERworking paper 13. Draft. London: DFID. 36 p.
Jiddawi, N. S. and Ohman, M. C., “Marine Fisheriesin Tanzania.” Ambio. 2002. Dec., 31 (7–8): 518-27.http://www.ncbi.nlm.nih.gov/entrez/query.fcgi?cmd=Retrieve&db=PubMed&list_uids=12572817&dopt=Citation
Kamwenda, G. J. 2002. “Ngitili agrosilvipastoralsystems in the United Republic of Tanzania.”Unasylva 53 (211, 2002/4). http://www.fao.org/documents/show_cdr.asp?url_file=/docrep/005/y4450e/y4450e14.htm
Kato. 2001. http://jambo.africa.kyoto-u.ac.jp/kiroku/asm_normal/abstracts/pdf/22-2/73-91.pdf
Kerario, E. J. C. 1995. Development of land use plan-ning and land tenure systems in Tanzania: “the envi-ronment component.” FAO. 124 p.
Kivugo, Mrisho M. 1995. Water and sanitation inTanzania: a report for the Human DevelopmentInitiative (HDI). Dar es Salaam: The initiative. 64 p.
Loreau, Michel, Shahid Naeem and Pablo Inchausti.2002. Biodiversity and ecosystem functioning: synthesisand perspectives. Oxford: Oxford University Press.306 p.
Mailu, A. M. 2001. “Preliminary assessment of thesocial, economic and environmental impact of waterhyacinth in the Lake Victoria Basin and the status ofcontrol.” In M. H. Julien et al. eds. Biological andintegrated control of water hyacinth, Eichhornia cras-sipes. ACIAR proceedings 102. Canberra: AustralianCentre for International Agricultural Research.http://www.aciar.gov.au/web.nsf/doc/JFRN-5J4725/$file/PR102%20chapter%2021.pdf
Majule, 2004. Tanzania. Rome: FAO. Retrievedfrom the World Wide Web, March 2005.http://www.fao.org/ag/agl/swlwpnr/reports/y_sf/z_tz/tz.htm#waterr

Mpingo Conservation Project.http://www.sbcomp.demon.co.uk/tanzania.html
Monela, G. C. et al. 1999. Socio-economics of char-coals extraction in Tanzania: A Cast of Eastern PartTanzania. Stockholm Environment Institute. 14 p.http://www.sei.se/chaposa/documents/socio_econ_Tanzania.pdf
Mujwahuzi, Mark R. 2002. Drawers of water II: 30years of change in domestic water use and environmen-tal health in East Africa: Tanzania country study.London: IIED. 89 p.
Mwamfupe, Davis. “Demographic impacts on pro-tected areas in Tanzania and options for action.”Parks: the international journal for protected areamanagers 8 (February 1, 1998): 3–14.http://www.iucn.org/themes/wcpa/pubs/pdfs/PARKS/Parks_Feb98.pdf
Mwanuzi, Fredrick L. Assessment of water qualityfor Pangani River in Tanzania using QUAL2E win-dows version. WARFSA/WaterNet Symposium:Sustainable Use of Water Resources; Maputo,November 1–2, 2000. http://www.iwsd.co.zw/Papers%5CMwanuzi.pdf
Ndekuka, Leah. 1999. Tanzania. Dar es Salaam,Tanzania. http://www.scholar.google.com/scholar?hl=en&lr=&safe=off&q=cache:Vx49iCvL3RQJ:www.energia.org/resources/1199wshop/lndekuka.pdf+fuel+tanzania+
Newmark, W. D. 1998. Forest area,fragmentation and loss in the Eastern ArcMountains: implications for the conservation of bio-logical diversity. In Burgess, N. D. et al. (eds.)“Biodiversity and Conservation of the Eastern ArcMountains of Tanzania and Kenya.” Journal of EastAfrican Natural History. 87 (1/2): 29–36.http://www4.ncsu.edu/unity/users/s/shear/public/halperin.htm
Ngailo, J. A. et al. 2001. Land Use Changes andTheir Impact on Agricultural Biodiversity in Arumeru,Tanzania. Tokyo: United Nations University People,Land Management and Ecosystem Conservation.http://www.unu.edu/env/plec/clusters/Eastafrica/nov2001/Ngailo.pdf
Norwegian UN Association et al. 2002. Globalis –Tanzania: gdp per capita. http://globalis.gvu.unu.edu/indicator_detail.cfm?IndicatorID=19&Country=TZ
O’Reilly and Muller. 2002. An examination of micro-biological water quality in Kigoma, Tanzania using atest for the presence of H2S-producing bacteria.http://www.geo.arizona.edu/nyanza/Muller.pdf
OECD. 2002. “Tanzania.” African economic outlook.Paris: OECD. http://www.oecd.org/dataoecd/49/2/1826462.pdf
Paavola, Jouni. 2004. Livelihoods, Vulnerability andAdaptation to Climate Change, Morogoro Region,Tanzania. http://www.uea.ac.uk/env/cserge/pub/wp/edm/edm_2004_12.pdf
Pest CABWEB. 1997. “Pest of the month: waterhyacinth.: PEST CABweb features in 1997. Retrievedfrom the World Wide Web, March 2005.http://pest.cabweb.org/Archive/Pestofmonth/pest9704.htm
Pronker, Annelies. 2002. Utilization of seagrass, man-grove and other bay habitats by commercially impor-tant fish species, Chwaka Bay, Zanzibar, Tanzania.Department of Animal Ecology and Eco-physiology.University of Nijmegen, Netherlands.http://www.pronker.com/pages/verslag%20Z’bar.pdf
Quinn, Claire H. et al. “Local perceptions of risk tolivelihood in semi-arid Tanzania.” Journal ofEnvironmental Management 68 (2003): 111–119.
Rohde, Rick and Thea Hilhorst. 2001. A profile ofenvironmental change in the Lake Manyara Basin,Tanzania. Drylands Programme issue paper 109.London: IIED. 27 p.
Sawatt, Sebastian and Esther Mollel. 2000.Grassland and pasture crops: country pasture/forageresource profiles: United Republic of Tanzania.http://www.fao.org/WAICENT/FAOINFO/AGRICULT/AGP/AGPC/doc/Counprof/tanz.htm#3.%20CLIMATE%20AND%20AGROECOLOGICAL
Schulze, E.-D. and H. A. Mooney. 1993. Ecosystemfunction of biodiversity: a summary. Pages 497–510in E.-D. Shulze and H. A. Mooney, editors.Biodiversity and ecosystem function. Springer-verlag,Berlin, Germany.
Science in Africa. http://www.scienceinafrica.co.za/2001/september/wsp.htm.
Sen, A. “Food entitlements and economic chains.”In Hunger in history, edited by L.F. Newman.Cambridge, MA: Basil Blackwell, pp. 374–385.
Connecting poverty and ecosystem services: A series of seven country scoping studies
29
Focus on Tanzania

South Africa Malaria Control.http://www.malaria.org.zw/countries/tanzania.htm
Stockholm Environment Institute. 1997.Comprehensive assessment of the freshwater resources ofthe world. Stockholm Environmental Institute,Sweden.
Tanzania. Energy. Retrieved from the World WideWeb, March 2005. http://www.tanzania.go.tz/energy.html
Tanzania.a. Livestock. Retrieved from the WorldWide Web, March 2005http://www.tanzania.go.tz/livestock.html
Tanzania.b. National website: regional and districtprofiles. Retrieved from the World Wide Web,March 2005. http://www.tanzania.go.tz/districts/
Tanzania.c. Natural Resources. Retrieved from theWorld Wide Web, March 2005. http://www.tanzania.go.tz/naturalresources.html
Tanzania. 2000. Economy. Retrieved from the WorldWide Web, March 2005. http://www.tanzania.go.tz/economy.html#Human%20Development
Tanzania. 2002. Johannesburg Summit 2002: UnitedRepublic of Tanzania country profile. United Nations.45 pp.
Tanzania. 2002a. Population Density by Region Table,2002. http://www.tanzania.go.tz/census/table2.htm
Tanzania. 2002b. Population and Housing CensusMap. Retrieved from the World Wide Web, March2005. http://www.tanzania.go.tz/census/map2.htm
Tanzania. 2002c. 2002 population and housing cen-sus: general report. Retrieved from the World WideWeb, March 21, 2005.http://www.tanzania.go.tz/census/census/figures.htm
Tanzania. 2003. Agriculture. Retrieved from theWorld Wide Web, March 2005. http://www.tanzania.go.tz/agriculture.html
Tanzania. 2003a. Kagera Region. http://www.tanzania.go.tz/regions/kagera/
Tanzania. 2003b. Poverty human development report.162 p. http://www.povertymonitoring.go.tz/downloads/outputsoftwgs/ra/phdr_2003.pdf
Tanzania. Centre of the National EnvironmentManagement Council. 1998b. An environmentalprofile for Coast Region, Tanzania. The Centre. 52 p.
Tanzania. Centre of the National EnvironmentManagement Council. 1998. An environmental pro-file for Kagera Region, Tanzania. The Centre. 45 p.
Tanzania. Ministry of Agriculture and Food Security.2003. The 2003/04 preliminary food crop productionforecast for 2004/05 food security [html]. Retrievedfrom the World Wide Web, April 2005.http://www.agriculture.go.tz/#
Tanzania. Ministry of Natural Resources andTourism. 2004. “Impact of Dissertation on Womenin Tanzania.” National Forest Programme.http://www.nfp.co.tz/newsletter/desertification.htm
Tanzania. Ministry of Water and LivestockDevelopment et al. 2002. Water and sanitation inTanzania: poverty monitoring for the sector usingnational surveys. [s.l]: The Ministry. 76 p.http://www.povertymonitoring.go.tz/downloads/outputsoftwgs/ra/watsan_report.pdf
Tanzania. National Bureau of Statistics. 2002.Household budget survey 2000/01. Dar es Salaam:National Bureau of Statistics. 188 p. http://www.tanzania.go.tz/hbs/HomePage_HBS.html
Tanzania. Research and Analysis Working Group.2002. Tanzania: poverty and human developmentreport. Draft. [s.l.] The Working Group. 119 p.http://www4.worldbank.org/afr/poverty/pdf/internal/docnav/03511.pdf
Tanzania. Vice President’s Office. 1999. Proposednational action programme to combat desertification.Tanzania. 59 p.
Tanzania. Vice President’s Office. 2001. Nationalreport on the implementation of the Convention onBiological Diversity. Dar es Salaam: Tanzania. 38 p.http://www.biodiv.org/doc/world/tz/tz-nr-01-en.pdf
Technoserve 2004. TechnoServe and the CoffeeIndustry. http://www.technoserve.org/africa/tanzan-coffee.html
Turpie, Jane K. 2000. Executive summary. In Theuse and value of natural resources of the RufijiFloodplain and delta, Tanzania. Rondebosch, SouthAfrica: Ecological and Resource EconomicsConsulting. i-ix pp.
Connecting poverty and ecosystem services: A series of seven country scoping studies
30
Focus on Tanzania

United Nations. 1994. World Population Prospects:the 1994 Revision. United Nations, New York.
United Nations Development Programme. 2004.Human development report. New York: UNDP.
United Nations Department of PeacekeepingOperations. Cartographic Section. 2004.http://www.un.org/Depts/Cartographic/map/profile/tanzania.pdf
UNESCO. 2005.http://whc.unesco.org/pg.cfm?cid=31&id_site=199
United Nations Environment Programme. 2004.Tanzania: National Environment Outlook. UNEP.net.http://www.unep.net/profile/index.cfm?countrycode=TZ,
USAID. 2005. http://www.usaid.gov/stories/tanzania/cs_tanzania_malaria.html
United States Committee for Refugees. 2004.“Contrary to international law, Tanzania continuesto forcible return of Burundian refugees.” Relief WebFebruary 3, 2005. http://www.reliefweb.int/rw/RWB.NSF/db900SID/KHII-69A3BZ?OpenDocument
United States Central Intelligence Agency. 2005.World Fact Book: Tanzania. http://www.cia.gov/cia/publications/factbook/geos/tz.html
United States. Department of State. 2005.Background note: Tanzania.http://www.state.gov/r/pa/ei/bgn/2843.htm
WorldAtlas.com. Africa: Tanzania.http://www.graphicmaps.com/aatlas/africa/maps/tanzania.htm
World Bank. 2004. Tanzania at a Glance.http://www.worldbank.org/data/countrydata/aag/tza_aag.pdf World Development Indicators is includ-ed on this CD-ROM. Copyright © InternationalBank for Reconstruction and Development/TheWorld Bank 1997. http://www.alsagerschool.co.uk/subjects/sub_content/geography/Gpop/HTMLENH/stats/wat.htm
World Energy/FAO. http://www.worldenergy.org/wec-geis/global/downloads/FAOdata.pdf
World Rainforest Movement, Bulletin No. 63,October 2002. Tanzania: Joint and Community-based Forest Management in the Uluguru Mountains.http://www.wrm.org.uy/bulletin/63/Tanzania.html
World Resources Institute. 2003. EarthtrendsCountry Profiles: agriculture and food: Tanzania.http://earthtrends.wri.org/pdf_library/country_profiles/Agr_cou_834.pdf
World Resources Institute. 2003a. EarthtrendsCountry Profiles: Economic Indicators, Tanzania.http://earthtrends.wri.org/pdf_library/country_profiles/Eco_cou_834.pdf
World Resources Institute. 2003b. EarthtrendsCountry Profile: Forests, Grasslands and Drylands:Tanzania. http://earthtrends.wri.org/pdf_library/country_profiles/For_cou_834.pdf
World Resources Institute. 2003c. EarthtrendsCountry Profiles: Water Resources and FreshwaterEcosystems – Tanzania. http://earthtrends.wri.org/pdf_library/country_profiles/wat_cou_834.pdf
World Resources Institute. 2004. EarthtrendsCountry Profile: Coastal and Marine Ecosystems:Tanzania. http://earthtrends.wri.org/text/coastal-marine/country-profile-178.html
Yanda, P. Z., A. E. Majule and A. G. Mwakaje.2001. Resource poor environment and poverty allevia-tion in Mbinga District: a case of Malonga and NgoroSystems of land resource management in MatengoHighlands, a paper presented at the Sixth REPOAResearch Workshop held at Dar es Salaam, TanzaniaApril 18–19, 2001. [The authors]. 22 p.
Connecting poverty and ecosystem services: A series of seven country scoping studies
31
Focus on Tanzania