connecting strengths, - national university of...
TRANSCRIPT
LeedenThe Integration Specialist for Welding, Gas and Safety
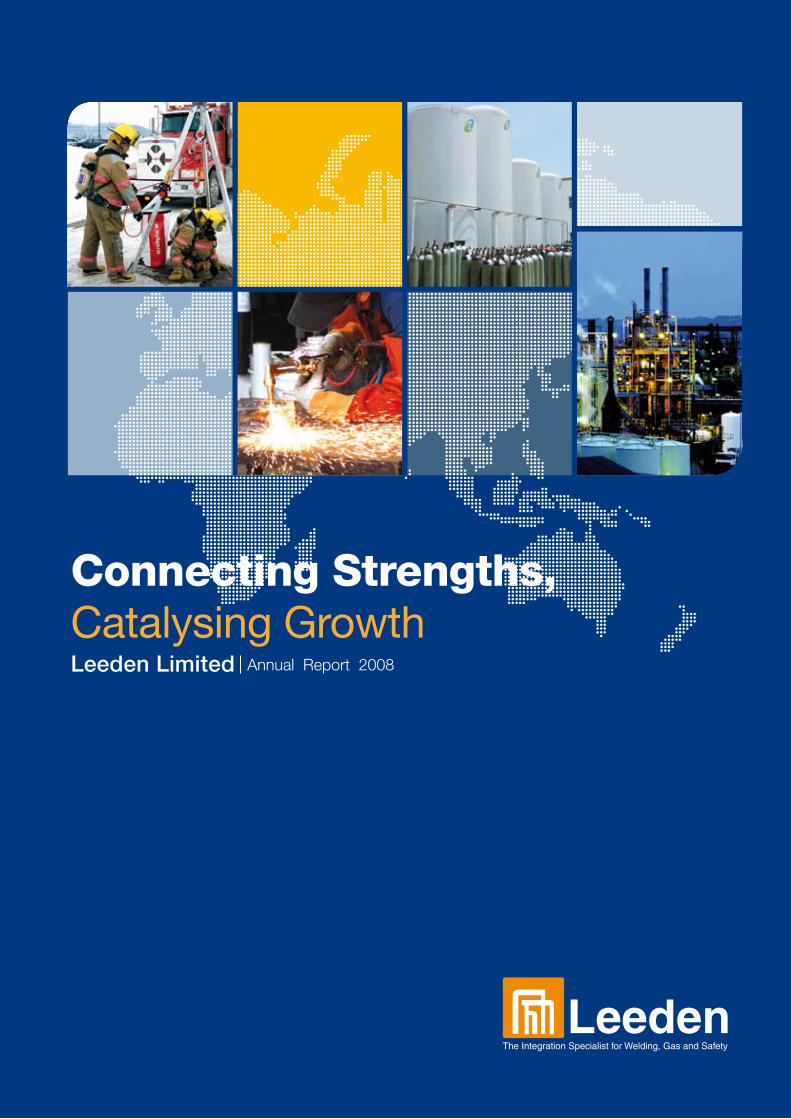
Connecting Strengths, Catalysing Growth
Annual Report 2008Leeden Limited

01
02
05
08
09
10
12
13
22
29
30
31
32
34
37
39
100
101
102
103
To be accepted as Asia’s foremost integration
specialist in welding, gas and safety
Achieve market leadership in Asia’s marine, oil & gas industries
Ensure customer value by providing integrated services & solutions for welding, gas and safety
Build a company of repute to attract and nurture people of high performance
Our Vision
Our Mission
About Us
Chairman & CEO’s Message
Operations Review
Financial Highlights
Financial Overview
Board of Directors
Management Team
Corporate Governance Report
Directors’ Report
Statement by Directors
Independent Auditors’ Report
Consolidated Income Statement
Balance Sheets
Consolidated Statements of Changes in Equity
Consolidated Cash Flow Statement
Notes to the Financial Statements
Shareholding Statistics
Substantial Shareholders
Warrantholding Statistics
Notice of Annual General Meeting
Proxy Form
Contents

01Annual Report 2008
Since our incorporation in 1964, we have progressed from a reputable distributor of welding and safety products as well as
downstream industrial gas manufacturer and distributor to become a value added integration specialist for our customers in the
marine, oil & gas industries.
Our customers include major oil and gas companies and contractors, shipbuilding and ship repair yards, oil rig, platform, jacket
and floating production storage offloading (FPSO) systems as well as steel and pipeline fabricators from across Asia.
Our customers’ success is fundamental to the way we conduct our business. In fulfilling and anticipating the dynamic business
needs of our customers, we expertly strategise to ensure success in our partnerships. We believe that through proximity to our
customers, premium quality service can be delivered at all times.
Our achievements attest to our consistent delivery of product quality, value and service excellence. We’ve received the Spring
Singapore National Model Company award and accreditations like ISO9001:2000. We’ve also garnered recognition from the
brands we represent, including:
• Evac International Pte Ltd (Licensed Distributor 2006 – 2009)
• Red Wing International (Exclusive Distributor)
• DBI SALA By Capital Safety Group Asia (Top Asia Distributor Award 2008)
• Weiler (Sales Excellence Award 2008)
• Hobart (Outstanding Sales Achievement 2008)
• Miller (Outstanding Sales Achievement 2008)
• OTC Daihen (Sales Achievement Award for OTC XD-500 Welding Machine and OTC Arc Welding Robot 2007 and
First Half 2008)
• Bortech Corporation (Top Performance Award – Number One Distributor in the Asia Pacific Region)
We continue to be a strong and progressive Welding, Gas and Safety integration company; one that cares for the success of its
customers, business partners, staff and shareholders.
About Us

Dear Shareholders
In spite of the global slow down as foreshadowed in my previous
Annual Peport, Leeden Limited achieved its fourth consecutive year of
unprecedented earnings growth in 2008 on the back of strong marine
and offshore, oil and gas activities. The Group’s turnover jumped 53%
to a record of S$157.2 million in FY2008 while the net profit after tax
more than doubled to S$13.6 million in FY2008.
I would like to emphasize that, FY2008 was a challenging year to
operate in as the sub-prime crisis escalated into a full blown global
recession and news of order book cancellations and delays plagued
the marine and offshore industries. Nevertheless, I am very happy to
report that through careful planning and strategic M&A activities, the
Group has successfully navigated through the storm and emerged to
achieve all time high sales and profits.
Our success to date would not have been possible without human
capital, an extremely important element in our business model. I would
like to take the opportunity to applaud our management, marketing
communications, technical product and sales teams who have done
a fantastic job in their consistent efforts to build the ‘Leeden’ brand by
delivering quality customized integrated solutions in our core business
of welding, gas and safety.
...through careful planning and strategic M&A activities, the
Group has successfully navigated through the storm and
emerged to achieve all time high sales and profits. Our success
to date would not have been possible without human capital,
an extremely important element in our business model.
“ “
02
Chairman and CEO’sMessage
03
The Group also made some strategic acquisitions during
the year to enhance its presence in the region and further
complement its industrial operations. Leeden acquired a 55%
stake in Eversafe Extinguisher Sdn Bhd, a well established
Malaysian company which specializes in fire protection
products. The Group also acquired a 75% stake in Power
Weld Sdn Bhd, which is in the business of manufacturing
and distributing quality welding electrodes and welding wires.
By leveraging on Leeden’s established distribution network,
Leeden and its subsidiaries can benefit from mutual synergies
to effectively increase the Group’s presence in Asia.
During the year, the Group also increased its stake in strategic
associate companies, making them subsidiaries, notably
National Industrial Gases Pte Ltd and NIG Industrial Gases Sdn
Bhd.
Moving ForwardAs the global recession deepens, market conditions have
never been more uncertain and trying. However, we still see
opportunities amidst the crisis and have formulated plans and
strategies to face the new challenging environment.
With worries of dwindling global demand, flow of work for new
builds in the offshore and marine segment may see a slow
down. On the other hand, we anticipate yards to do more
conversion and repair jobs and we will tailor our product range
accordingly to service this segment while adding mid-range
products to help customers save costs. Riding on this, we will
continue to penetrate new and existing markets, while growing
our geographical reach in Thailand, Vietnam and Indonesia.
With the recent spate of announcements on fiscal stimulus
plans, the budget for infrastructure spending by governments
across the region has increased tremendously. Hence, we will
expand our revenue streams by broadening our sales channels
to penetrate the infrastructure industry as well. Currently, 40%
of our revenue is derived from our safety and gas products, out
of which, 50% is servicing industries outside the marine and
offshore.
As mentioned, our rich human capital has helped the Group to
grow over the years. Consequently, we will continue to build
the team at Leeden and intend to increase the current team
of management, sales and technical product executives in
line with our expansion plans. On top of this, the Group will
set up new training facilities to upgrade skills of staff to ensure
the provision of world class customer service pertinent to our
success.
Besides working on organic growth, we will also be on the
lookout for more M&A opportunities which may arise amidst
the economic turmoil. Leeden will continue to focus on its core
competencies to be Asia’s leading integration specialist for
welding, gas and safety. At the same time, creating value for
its customers through more comprehensive ‘one-stop’ solution
for welding, gas and safety product needs.
As part of our efforts to focus on what we do best, the property
business will be discontinued subsequent to the completion of
the Paterson Linc project by early 2010.
In AppreciationIn appreciation of the support shown by shareholders, an
interim dividend of net 1 cent per share was declared and
paid on 10 September 2008, doubling the dividend amount
declared and paid in FY2007. The Board does not recommend
a final dividend to be declared for the year ended 31 December
2008.
I would like to thank our longstanding stakeholders, namely
our shareholders, our business associates, loyal customers,
my colleagues on the Board, the management and staff, for
their dedication and support. I sincerely look forward to your
continuous support as we march into the Leeden era with
renewed focus and zeal in the industrial business.
Steven ThamChairman & Chief Executive Officer
7 April 2009
Annual Report 2008

Connecting Expertise and Experience At Leeden, our wealth of expertise and experience gives us the competitive edge as we continue to provide our clients with excellent one-stop services and solutions. The delivery of integrated solutions, together with our commitment towards client satisfaction, has contributed not only to the growth of Leeden, but also to the progress of our customers.
With the winning synergy of expertise and experience, we are able to strengthen Leeden’s foothold in the marine, oil and gas industries.

Welding DivisionOver the years, Leeden has established itself as a leading
integrated solutions provider and consultant in the welding,
gas and safety arena. The Group’s competitive position is
maintained through its provision of value-added welding
products and services, making the business more resilient
through economic downturn.
In spite of the negative business sentiments, the Group
has recognized the crisis as an opportunity to expand its
presence in the region. During the year, Leeden acquired
Power Weld, a leading electrode manufacturer in Malaysia
to further expand its filler metal product range, providing the
Group with an assured source of supply for quality welding
electrodes and welding wires.
The Group has also been awarded a number of new agencies,
one of which is from the FSH Welding Group, specifically
for its welding electrodes under the SelectArc Industries
brand. Other new agencies obtained during the year include
CompAir, a leading manufacturer of compressors in the UK,
Procut, a supplier of high quality carbide burrs and ATA
Tools for it’s range of air and pneumatic tools.
The sale of welding equipments and consumables will
continue to play a major role in the Group’s core business.
Notwithstanding the challenges ahead, the Group will
continue to leverage on its strengths and develop synergies
from its acquisitions in order to better serve our customers.
05
Operations Review
Gas DivisionThe right mix of gases ensures effective welding solutions.
That is why Leeden’s Gas Division is a vital component to
Leeden’s integrated welding solutions. The Group’s gas
business in Singapore, Malaysia and Batam is operated
through the National Industrial Gases Group (NIG Group), a
joint venture with National Oxygen Pte Ltd, which is a wholly
owned subsidiary of Taiyo Nippon Sanso Corporation.
In FY2008, Leeden increased its stake in NIG resulting in the
group of companies operating the gas business, becoming
indirect subsidiaries of the Leeden Group.
As one of the largest downstream industrial gas
manufacturers and distributors in Singapore, Malaysia and
Batam, NIG Group provides the most comprehensive range
of gas and gas-related products and services, including
specialized industrial gases, gas cylinders, gas control
apparatus and gas systems & engineering consultancy
services.
The NIG Group has the largest dissolved acetylene
production capabilities in Singapore, Malaysia and Batam
region. In Malaysia, the NIG Group has an extensive
distribution network with branches spanning from Penang
to Johor Bahru, offering NIG operations in Malaysia
the business agility and efficiency as a key competitive
advantage over other competitors.
Annual Report 2008

06
Safety DivisionAs part of the Group’s vision of providing integrated services,
Leeden also provides comprehensive safety solutions to
meet clients’ needs. The range of products is classified into
Personal Safety, Fall Protection, Environmental Protection
and Emergency Response equipments. The provision
of safety solutions are supported by expert consultancy
services that cover on-site assessment, system installation,
pre and post installation assessment, maintenance and
recertification.
The Safety Division’s growth during the year was fuelled
by increased awareness and continued emphasis on
workplace safety. The buoyant marine, oil & gas industries
continued to drive demand for the Group’s safety products
and services, helping Leeden’s Personal Safety and Fall
Protection products achieve record sales. Market leading
brands such as DBI SALA (Fall Protection) and Red Wing
Shoes (Personal Safety) continued to post strong growth
this year.
Finally, as part of the Group’s expansion efforts, the
strategic acquisition of Eversafe added a new dimension to
the Group’s existing range of safety products and solutions,
Eversafe’s firefighting products enabled the Group to gain
exposure to the growing market of fire fighting systems.
Technological improvements made in 2008 have played a
big part in keeping NIG Group competitive. For the past
year, NIG Group has invested resources into developing
relevant technologies to further improve the quality of
our services and product offerings. Technologies such as
Cylinder Maintenance System (CMS) and Vehicle Monitoring
System (VMS) have allowed NIG Group to operate more
effectively and efficiently, as well as to offer better services
to its customers. Looking forward, NIG Group anticipates a
challenging yet exciting year ahead.
During these difficult times, NIG Group will seek to focus on
its fundamental capabilities to provide reliable and quality
gas-related products and services to new and existing
customers. In addition to maintain the existing distribution
network, NIG Group will also continue with its strategy
of developing the Group’s infrastructure through capital
expenditure projects in 2009. Having recently acquired
plots of land in Bintan, Shah Alam, Kuantan and Penang,
NIG Group will allocate resources to expand and strengthen
its manufacturing and distribution bases in these locations.
Operations Review
During the year, Leeden participated in international trade
events such as the OS+H Asia 6th Occupational Safety
& Health Exhibition (held at Suntec Convention Centre
in September 2008) and Offshore South East Asia Oil &
Gas Show (“OSEA” held at Suntec Convention Centre in
December 2008) to help market welding and safety brands
under the Group. Such events served as a platform to
showcase the latest products & offerings of the Industrial
Business, gaining visibility and market share for the Group.

Catalysing Growth and ExcellenceAt Leeden, we constantly seize opportunities to enhance our business segments and deepen our regional network, thus maintaining our position as one of the leading solutions provider in Asia. Alongside growth opportunities, synergistic acquisitions made in FY2008 will continue to boost growth and excellence for Leeden, as well as accelerate progress for our customers.
By making the most of every opportunity, Leeden is able to catalyse growth and excellence.
FinancialHighlights
Profit Before and After Tax (S$’000)Sales Turnover (S$’000)
Earnings Per Share and Dividends Per Share (Cents)
8.0
6.0
4.0
2.0
-2005 2006 2007 2008
0.41.3
4.5
6.1
EPS DPS (net)
0.36 0.5 1.0
Net Asset Value Per Share (Cents)
40.0
35.0
30.0
25.0
26.227.1
31.1
35.3
NAV per share
2005 2006 2007 2008
PBTPAT
1,58
8
621
3,15
2
1,88
8
8,73
6
6,60
3
16,800
13,582
200720062005 2008
08
Property & others Industrial
47,524
25,783
69,277
16,789
140,54
9
16,690
96,706
6,18
6
200720062005 20080
30,000
60,000
90,000
120,000
150,000
0
4,000
8,000
12,000
16,000
20,000
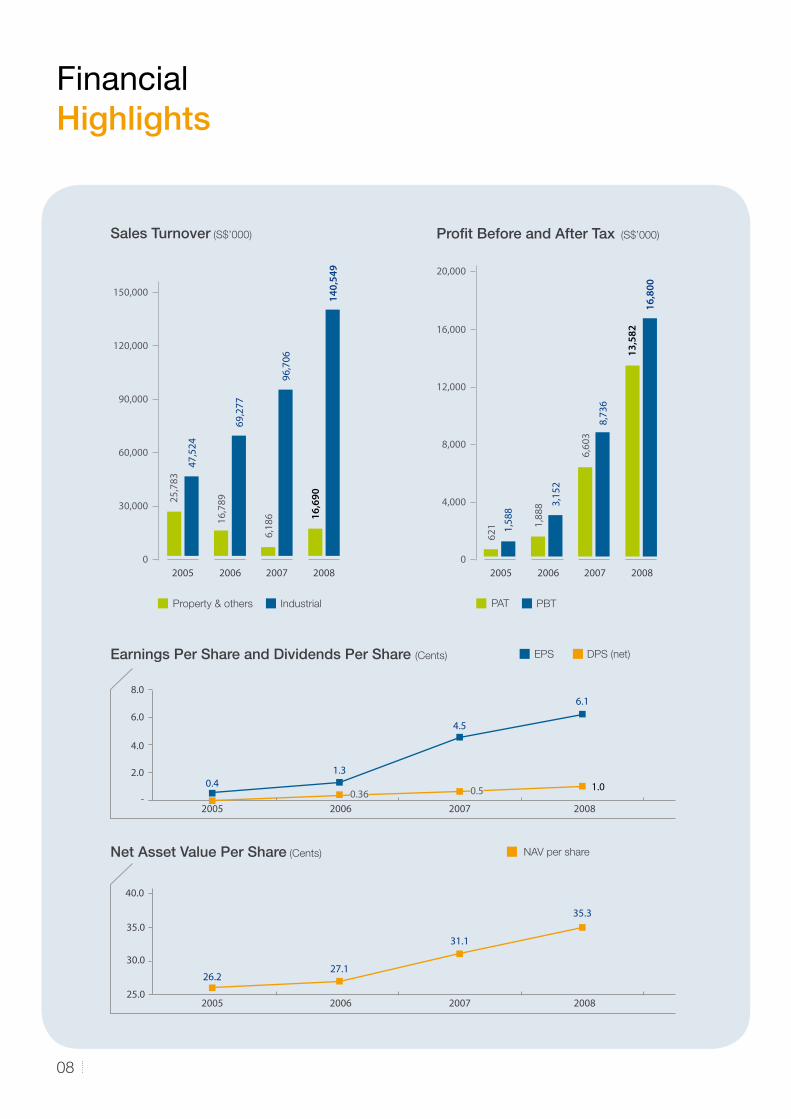
In 2008, the Leeden Group continued its growth momentum
to register another year of excellent performance. The Group
achieved a record turnover of S$157.2 million in FY2008, which
is a 53% jump from FY2007 turnover of S$102.9 million.
The Group’s Industrial Business (made up of the welding,
gas, and safety divisions) registered a significant increase in
turnover of 45% from S$96.7 million in FY2007 to S$140.5
million in FY2008 on the back of strong marine and offshore
activities and contribution of S$45.1 million from newly
acquired subsidiaries. Turnover from other businesses, mainly
property development, grew from S$6.2 million in FY2007 to
S$16.7 million in FY2008.
In spite of the challenging economic conditions, overall gross
profit margin remained strong at 28%, with overall gross profit
increasing 49% to S$44.1 million in FY2008.
In line with increased sales revenue, distribution costs grew
38% from S$12.5 million in FY2007 to S$17.2 million. However,
distribution costs as a percentage of sales decreased from 12%
to 11% as a result of economies of scale. While administrative
costs grew 55% from S$5.8 million in FY2007 to S$9.0 million
in FY2008, administrative costs remained constant at 6% of
sales over both years.
Other costs increased by S$1.0 million to S$4.5 million in
FY2008 as the Group adopted a conservative stance on
its profitability and provided a higher allowance for doubtful
debts and stock obsolescence of S$1.8 million in FY2008
as compared to S$0.3 million in FY2007. In addition, there
was an unrealized derivative loss of S$0.7 million recorded in
FY2008, out of which S$0.5 million relates to a USD option
contract that has expired in January 2009 and the unrealized
losses have since been reversed. Other costs as a percentage
of sales remained constant at 3% in both years.
A negative goodwill of S$0.8 million was recognized due to
the acquisition of Eversafe Extinguisher Sdn Bhd (“Eversafe”)
and Power Weld Sdn Bhd (“Power Weld”). Share of profits
from associated companies was 225% higher in FY2008 at
S$1.3 million.
Leeden achieved another year of record earnings with a 106%
jump in profit after taxation to S$13.6 million in FY2008. Profit
attributable to equity holders of the Company grew 59% to
S$10.4 million.
Balance SheetWith the acquisition of new subsidiaries Eversafe, Power
Weld, National Industrial Gas Ptd Ltd (“NIG”), and NIG
Industrial Gases Sdn Bhd (“NIB”), there was a consolidation
of the Group’s balance sheet items as of 31 December 2008,
whereas revenue from these new subsidiaries were recognized
only for the remaining period of the financial year after the
acquisitions.
The Group’s non-current assets grew from S$19.1 million as
at 31 December 2007 to S$60.0 million as at 31 December
2008 mainly due to the acquisition of new subsidiaries which
resulted in higher property, plant and equipment, intangible
assets and goodwill.
Current assets also increased from S$63.5 million as at
31 December 2007 to S$120.8 million as at 31 December
2008 due to a higher stock level which grew from S$17.7
million as at 31 December 2007 to S$46.2 million as at 31
December 2008. The increase in stocks was due to S$12.2
million of stocks held by newly acquired subsidiaries and higher
stock holding was also necessary to provide better services
and prompt deliveries to customers. As such, stock turnover
increased from 93 days in FY2007 to 123 days in FY2008.
Trade debtors also increased from S$28.8 million as at
31 December 2007 to S$48.5 million as at 31 December 2008
due to the acquisition of new subsidiaries which accounted for
S$20.7 million of the trade debts. Trade debtors’ turnover days
improved from 102 days in FY2007 to 86 days in FY2008.
The Group’s current liabilities grew from S$33.3 million as
at 31 December 2007 to S$81.0 million as at 31 December
2008, while non-current liabilities increased from S$3.5 million
as at 31 December 2007 to S$16.5 million as at 31 December
2008. The increase in total liabilities was mainly due to the
consolidation of newly acquired subsidiaries which resulted in
higher amount due to bankers and long-term loans by S$40.8
million to S$51.9 million as at 31 December 2008.
Leeden’s total equity improved from S$45.8 million as at
31 December 2007 to S$83.3 million as at 31 December 2008.
Cash FlowAs at 31 December 2008, the Group had cash and cash
equivalents of S$15.6 million, a 3% improvement from 31
December 2007. As the Group stocked up during the year
to ensure better service and prompt delivery to customers,
net cash provided by operating activities declined from S$14.3
million in FY2007 to S$0.8 million in FY2008.
Due to the Group’s acquisition activities, net cash provided by
financing activities rose to S$20.0 million, while net cash used
in investing activities was S$20.4 million.
FinancialReview
09Annual Report 2008
Board of Directors
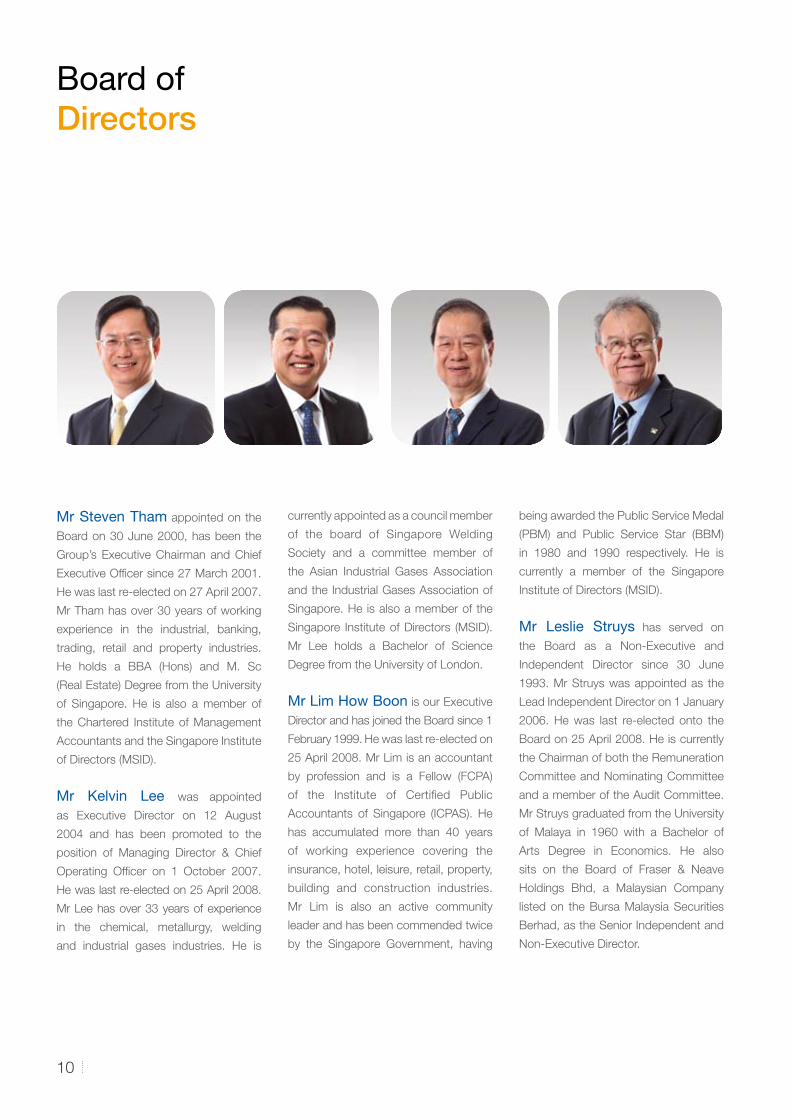
Mr Steven Tham appointed on the
Board on 30 June 2000, has been the
Group’s Executive Chairman and Chief
Executive Officer since 27 March 2001.
He was last re-elected on 27 April 2007.
Mr Tham has over 30 years of working
experience in the industrial, banking,
trading, retail and property industries.
He holds a BBA (Hons) and M. Sc
(Real Estate) Degree from the University
of Singapore. He is also a member of
the Chartered Institute of Management
Accountants and the Singapore Institute
of Directors (MSID).
Mr Kelvin Lee was appointed
as Executive Director on 12 August
2004 and has been promoted to the
position of Managing Director & Chief
Operating Officer on 1 October 2007.
He was last re-elected on 25 April 2008.
Mr Lee has over 33 years of experience
in the chemical, metallurgy, welding
and industrial gases industries. He is
currently appointed as a council member
of the board of Singapore Welding
Society and a committee member of
the Asian Industrial Gases Association
and the Industrial Gases Association of
Singapore. He is also a member of the
Singapore Institute of Directors (MSID).
Mr Lee holds a Bachelor of Science
Degree from the University of London.
Mr Lim How Boon is our Executive
Director and has joined the Board since 1
February 1999. He was last re-elected on
25 April 2008. Mr Lim is an accountant
by profession and is a Fellow (FCPA)
of the Institute of Certified Public
Accountants of Singapore (ICPAS). He
has accumulated more than 40 years
of working experience covering the
insurance, hotel, leisure, retail, property,
building and construction industries.
Mr Lim is also an active community
leader and has been commended twice
by the Singapore Government, having
being awarded the Public Service Medal
(PBM) and Public Service Star (BBM)
in 1980 and 1990 respectively. He is
currently a member of the Singapore
Institute of Directors (MSID).
Mr Leslie Struys has served on
the Board as a Non-Executive and
Independent Director since 30 June
1993. Mr Struys was appointed as the
Lead Independent Director on 1 January
2006. He was last re-elected onto the
Board on 25 April 2008. He is currently
the Chairman of both the Remuneration
Committee and Nominating Committee
and a member of the Audit Committee.
Mr Struys graduated from the University
of Malaya in 1960 with a Bachelor of
Arts Degree in Economics. He also
sits on the Board of Fraser & Neave
Holdings Bhd, a Malaysian Company
listed on the Bursa Malaysia Securities
Berhad, as the Senior Independent and
Non-Executive Director.
10
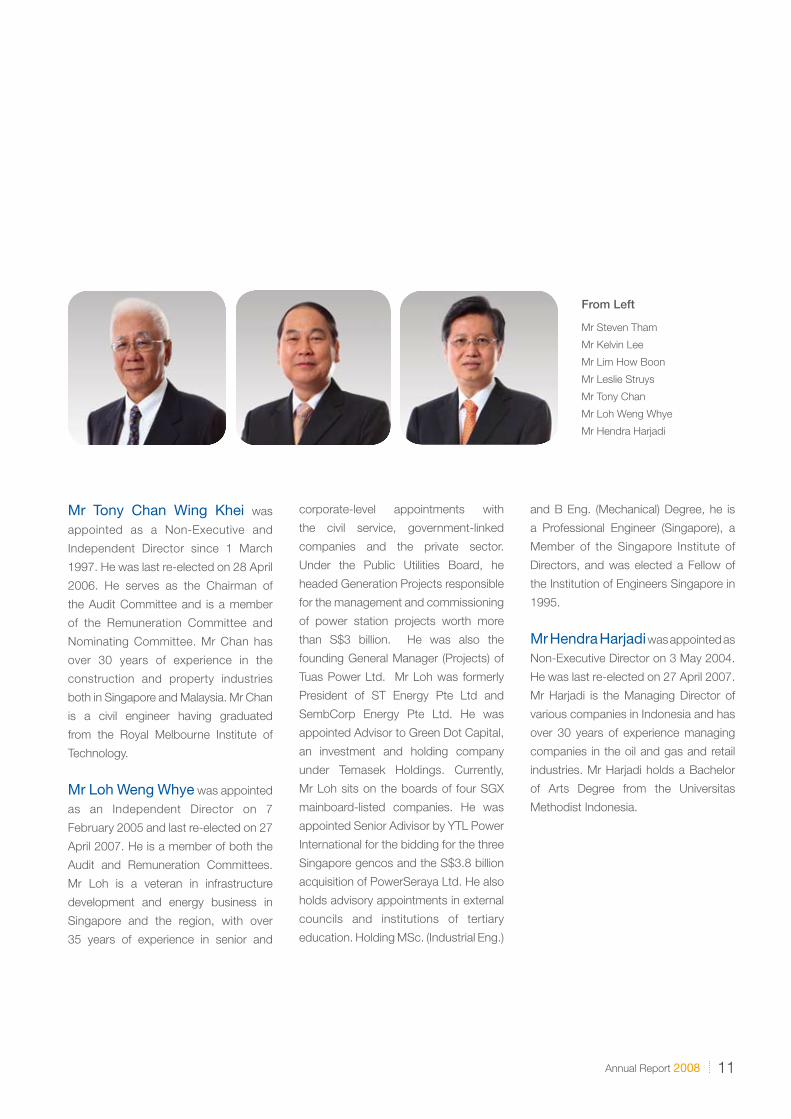
Mr Tony Chan Wing Khei was
appointed as a Non-Executive and
Independent Director since 1 March
1997. He was last re-elected on 28 April
2006. He serves as the Chairman of
the Audit Committee and is a member
of the Remuneration Committee and
Nominating Committee. Mr Chan has
over 30 years of experience in the
construction and property industries
both in Singapore and Malaysia. Mr Chan
is a civil engineer having graduated
from the Royal Melbourne Institute of
Technology.
Mr Loh Weng Whye was appointed
as an Independent Director on 7
February 2005 and last re-elected on 27
April 2007. He is a member of both the
Audit and Remuneration Committees.
Mr Loh is a veteran in infrastructure
development and energy business in
Singapore and the region, with over
35 years of experience in senior and
corporate-level appointments with
the civil service, government-linked
companies and the private sector.
Under the Public Utilities Board, he
headed Generation Projects responsible
for the management and commissioning
of power station projects worth more
than S$3 billion. He was also the
founding General Manager (Projects) of
Tuas Power Ltd. Mr Loh was formerly
President of ST Energy Pte Ltd and
SembCorp Energy Pte Ltd. He was
appointed Advisor to Green Dot Capital,
an investment and holding company
under Temasek Holdings. Currently,
Mr Loh sits on the boards of four SGX
mainboard-listed companies. He was
appointed Senior Adivisor by YTL Power
International for the bidding for the three
Singapore gencos and the S$3.8 billion
acquisition of PowerSeraya Ltd. He also
holds advisory appointments in external
councils and institutions of tertiary
education. Holding MSc. (Industrial Eng.)
and B Eng. (Mechanical) Degree, he is
a Professional Engineer (Singapore), a
Member of the Singapore Institute of
Directors, and was elected a Fellow of
the Institution of Engineers Singapore in
1995.
Mr Hendra Harjadi was appointed as
Non-Executive Director on 3 May 2004.
He was last re-elected on 27 April 2007.
Mr Harjadi is the Managing Director of
various companies in Indonesia and has
over 30 years of experience managing
companies in the oil and gas and retail
industries. Mr Harjadi holds a Bachelor
of Arts Degree from the Universitas
Methodist Indonesia.
11Annual Report 2008
From Left
Mr Steven Tham
Mr Kelvin Lee
Mr Lim How Boon
Mr Leslie Struys
Mr Tony Chan
Mr Loh Weng Whye
Mr Hendra Harjadi
12
Management Team
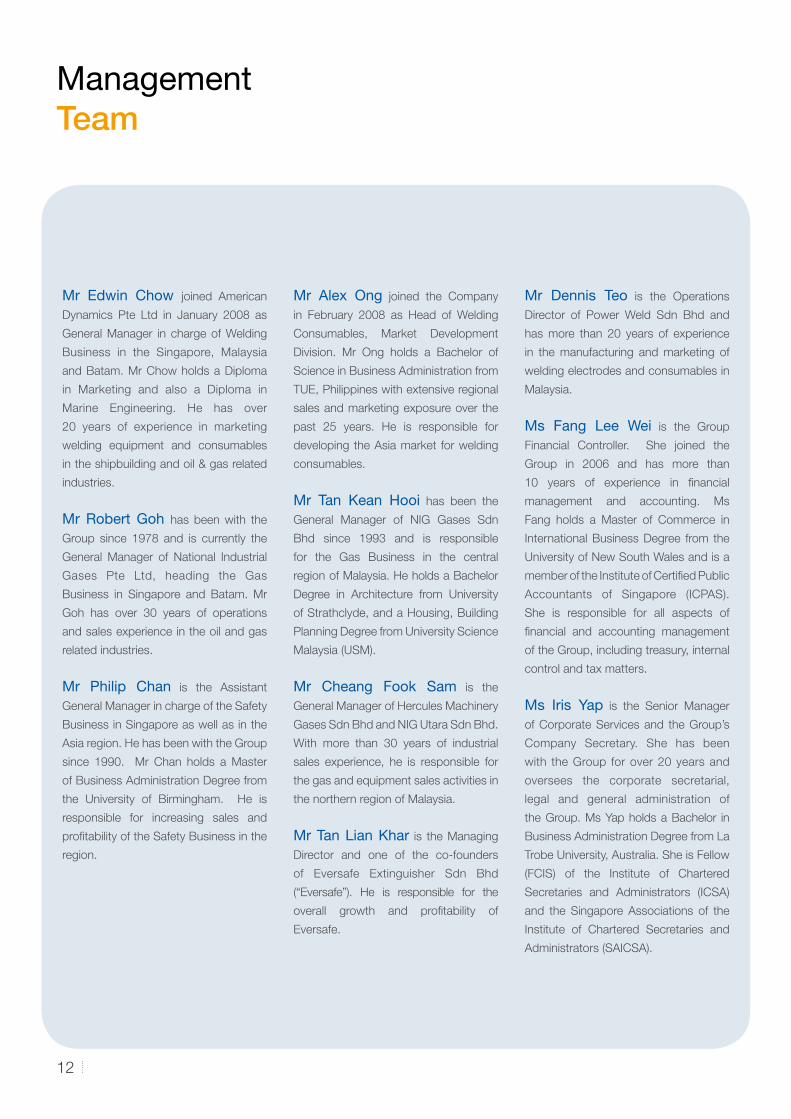
Mr Edwin Chow joined American
Dynamics Pte Ltd in January 2008 as
General Manager in charge of Welding
Business in the Singapore, Malaysia
and Batam. Mr Chow holds a Diploma
in Marketing and also a Diploma in
Marine Engineering. He has over
20 years of experience in marketing
welding equipment and consumables
in the shipbuilding and oil & gas related
industries.
Mr Robert Goh has been with the
Group since 1978 and is currently the
General Manager of National Industrial
Gases Pte Ltd, heading the Gas
Business in Singapore and Batam. Mr
Goh has over 30 years of operations
and sales experience in the oil and gas
related industries.
Mr Philip Chan is the Assistant
General Manager in charge of the Safety
Business in Singapore as well as in the
Asia region. He has been with the Group
since 1990. Mr Chan holds a Master
of Business Administration Degree from
the University of Birmingham. He is
responsible for increasing sales and
profitability of the Safety Business in the
region.
Mr Alex Ong joined the Company
in February 2008 as Head of Welding
Consumables, Market Development
Division. Mr Ong holds a Bachelor of
Science in Business Administration from
TUE, Philippines with extensive regional
sales and marketing exposure over the
past 25 years. He is responsible for
developing the Asia market for welding
consumables.
Mr Tan Kean Hooi has been the
General Manager of NIG Gases Sdn
Bhd since 1993 and is responsible
for the Gas Business in the central
region of Malaysia. He holds a Bachelor
Degree in Architecture from University
of Strathclyde, and a Housing, Building
Planning Degree from University Science
Malaysia (USM).
Mr Cheang Fook Sam is the
General Manager of Hercules Machinery
Gases Sdn Bhd and NIG Utara Sdn Bhd.
With more than 30 years of industrial
sales experience, he is responsible for
the gas and equipment sales activities in
the northern region of Malaysia.
Mr Tan Lian Khar is the Managing
Director and one of the co-founders
of Eversafe Extinguisher Sdn Bhd
(“Eversafe”). He is responsible for the
overall growth and profitability of
Eversafe.
Mr Dennis Teo is the Operations
Director of Power Weld Sdn Bhd and
has more than 20 years of experience
in the manufacturing and marketing of
welding electrodes and consumables in
Malaysia.
Ms Fang Lee Wei is the Group
Financial Controller. She joined the
Group in 2006 and has more than
10 years of experience in financial
management and accounting. Ms
Fang holds a Master of Commerce in
International Business Degree from the
University of New South Wales and is a
member of the Institute of Certified Public
Accountants of Singapore (ICPAS).
She is responsible for all aspects of
financial and accounting management
of the Group, including treasury, internal
control and tax matters.
Ms Iris Yap is the Senior Manager
of Corporate Services and the Group’s
Company Secretary. She has been
with the Group for over 20 years and
oversees the corporate secretarial,
legal and general administration of
the Group. Ms Yap holds a Bachelor in
Business Administration Degree from La
Trobe University, Australia. She is Fellow
(FCIS) of the Institute of Chartered
Secretaries and Administrators (ICSA)
and the Singapore Associations of the
Institute of Chartered Secretaries and
Administrators (SAICSA).
13Annual Report 2008
Corporate Governance Report
Leeden Limited (the “Company” or “Leeden” or “Group”) continues to be committed to observing high standards
of corporate governance by complying with the Singapore Code of Corporate Governance (the “Code”).
For effective corporate governance, the Company has put in place various self-regulatory and monitoring
mechanisms. This Report outlines the Company’s corporate governance practices and structures that were in
place for the fi nancial year 2008.
BOARD OF DIRECTORS
Principle 1 : Board’s Conduct of its Affairs
The Board of Directors (the “Board”) holds at least two scheduled meetings a year with ad-hoc meetings being
convened as and when necessary. During the year, the Board met four times.
The principal roles of our Board are as follows:-
Formulating and approving the Group’s policies, strategies and fi nancial objectives;
Approving annual budgets, major funding proposals, investment and divestment proposals;
Overseeing the processes for evaluating the adequacy of risk management, internal controls, fi nancial
reporting and compliance;
Reviewing and approving any interested person transactions;
Approving the nomination of board members and the appointment of key executives;
Reviewing and endorsing the recommended framework of remuneration for the Board and key executives;
Setting values and standards of the Company and ensuring that obligations to shareholders are understood;
and
Assuming responsibilities for compliance with Corporate Governance.
The Board of Directors is obliged to act in good faith and will consider at all times, the interest of the Company.
The Company has adopted a set of Approving Authority & Limit, setting out the level of authorization required for
specifi ed transactions, including those that require Board approval.
To assist the Board in executing its responsibilities, the Board is supported by the Audit Committee, Nominating
Committee and Remuneration Committee. These Committees function within clear defi ned terms of reference,
which are reviewed on a regular basis, to ensure effectiveness of each Committee.
Upon appointment of a director, orientation program is organized for the newly appointed director to ensure that
incoming director is familiar with the Company’s business activities and directions of the Group. The Company will
consider relevant training for the directors, from time to time. Relevant courses include seminars conducted by the
Singapore Institute of Director or other training institute. During the year under review, the Directors visited one of
the overseas plants to understand the operations and provide strategic guidance.
A formal letter is provided to each newly-appointed Director, explaining their statutory and other duties and
responsibilities as a director.
Corporate Governance Report
14
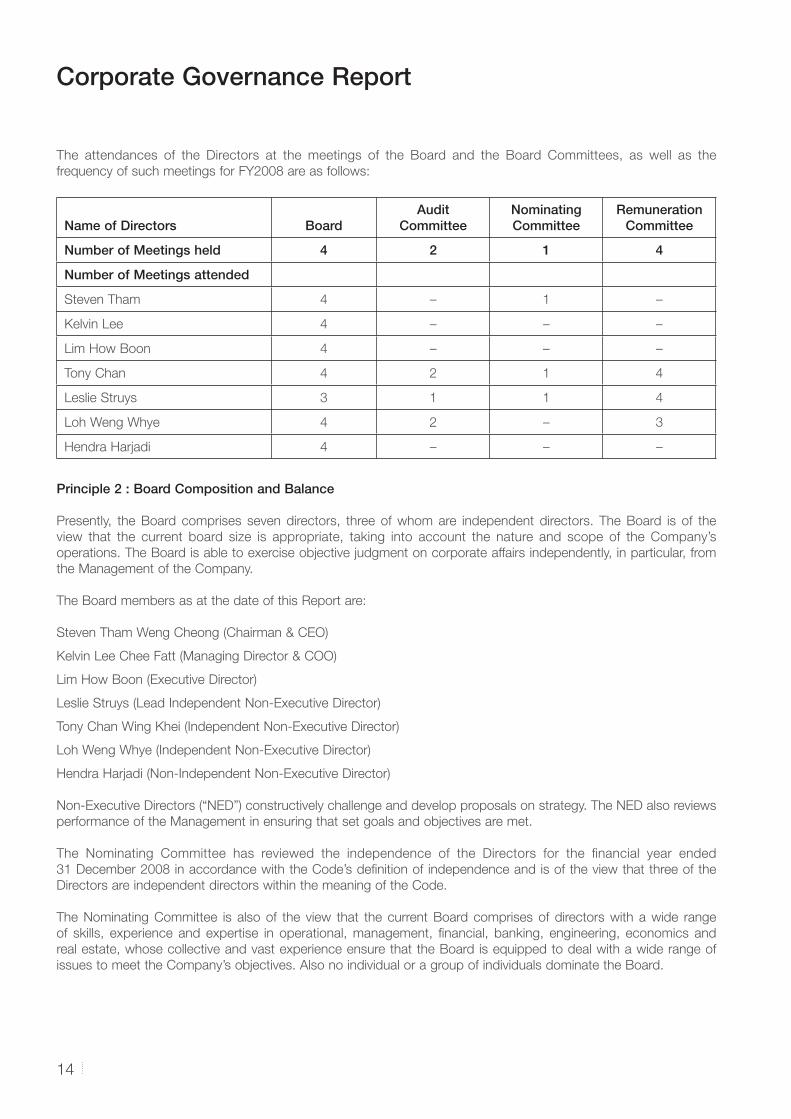
The attendances of the Directors at the meetings of the Board and the Board Committees, as well as the
frequency of such meetings for FY2008 are as follows:
Name of Directors BoardAudit
CommitteeNominating Committee
Remuneration Committee
Number of Meetings held 4 2 1 4
Number of Meetings attended
Steven Tham 4 – 1 –
Kelvin Lee 4 – – –
Lim How Boon 4 – – –
Tony Chan 4 2 1 4
Leslie Struys 3 1 1 4
Loh Weng Whye 4 2 – 3
Hendra Harjadi 4 – – –
Principle 2 : Board Composition and Balance
Presently, the Board comprises seven directors, three of whom are independent directors. The Board is of the
view that the current board size is appropriate, taking into account the nature and scope of the Company’s
operations. The Board is able to exercise objective judgment on corporate affairs independently, in particular, from
the Management of the Company.
The Board members as at the date of this Report are:
Steven Tham Weng Cheong (Chairman & CEO)
Kelvin Lee Chee Fatt (Managing Director & COO)
Lim How Boon (Executive Director)
Leslie Struys (Lead Independent Non-Executive Director)
Tony Chan Wing Khei (Independent Non-Executive Director)
Loh Weng Whye (Independent Non-Executive Director)
Hendra Harjadi (Non-Independent Non-Executive Director)
Non-Executive Directors (“NED”) constructively challenge and develop proposals on strategy. The NED also reviews
performance of the Management in ensuring that set goals and objectives are met.
The Nominating Committee has reviewed the independence of the Directors for the fi nancial year ended
31 December 2008 in accordance with the Code’s defi nition of independence and is of the view that three of the
Directors are independent directors within the meaning of the Code.
The Nominating Committee is also of the view that the current Board comprises of directors with a wide range
of skills, experience and expertise in operational, management, fi nancial, banking, engineering, economics and
real estate, whose collective and vast experience ensure that the Board is equipped to deal with a wide range of
issues to meet the Company’s objectives. Also no individual or a group of individuals dominate the Board.
15Annual Report 2008
Corporate Governance Report
Principle 3 : Role of Chairman and Chief Executive Offi cer (“CEO”)
The Board is of the view that it is in the best interest of the Group to adopt a single leadership structure,
whereby the CEO and Chairman of the Board is the same person, so as to ensure that the decision-making
process of the Group would be unnecessarily hindered. Mr Steven Tham continues to be the Chairman and CEO
of the Group. The Board is of the opinion that suffi cient checks and safeguards are in place to ensure that the
process of decision making is independent and based on collective decisions without any individual exercising
any considerable power or infl uence. As the Chairman, Mr Tham is responsible for the workings of the Board
and ensuring compliance with the Group’s guidelines on corporate governance. He exercises control over the
accuracy and timeliness of the information that the Directors receive. He facilitates effective contributions of the
NEDs in particular and encourages constructive relationships between Executive Directors and NEDs. As the CEO,
Mr Tham plays a pivotal role in the development and execution of policies and strategies and the day-to-day
management of the Group.
With the appointment of Mr Leslie Struys as the Company’s lead independent director, shareholders will have an
alternative avenue to raise their concerns, especially when contacts through the normal channels of the Chairman/
CEO have failed or when such contact is inappropriate.
BOARD COMMITTEES
Principle 4 : Board Membership
Nominating Committee (NC)
The NC comprises of three Directors, majority of whom are independent and non-executive. In addition, the
Chairman of the NC is not, and not directly associated with, a substantial shareholder.
The members of the NC as at the date of this report are:-
Mr Leslie Struys Chairman (Independent Non-Executive)
Mr Tony Chan (Independent Non-Executive)
Mr Steven Tham
The NC met once during the fi nancial year to evaluate Board’s performance as guided by the Terms of Reference
adopted by the NC on 11 August 2006.
The principal duties and responsibilities include:
Making recommendations to the Board on the appointment of new executive and non-executive Directors;
Determining annually whether or not a Director is independent as well as put in place plans for succession,
in particular for the Chairman and Chief Executive Offi cer;
Recommending Directors who are retiring by rotation to be put forward for re-election;
Deciding whether or not a Director is able to and has been adequately carrying out his duties as a Director
of the Company; and
Evaluating the performance and effectiveness of the Board as a whole.
Corporate Governance Report
16
In accordance with the Company’s Articles of Association, one-third of the Board is subject to re-election annually.
For this forthcoming Annual General Meeting, Mr Steven Tham Weng Cheong and Mr Hendra Harjadi will retire by
rotation. Mr Leslie Struys and Mr Tony Chan Wing Khei will retire pursuant to S153(6) of the Companies Act, Cap.
50. The NC had recommended Mr Steven Tham Weng Cheong, Mr Hendra Harjadi, Mr Leslie Struys and Mr Tony
Chan Wing Khei for re-election at the forthcoming Annual General Meeting.
Having considered their performance and contributions, the Board accepted the NC’s recommendation and
accordingly, Mr Steven Tham Weng Cheong, Mr Hendra Harjadi, Mr Leslie Struys and Mr Tony Chan Wing Khei
will be offering themselves for re-election at the forthcoming Annual General Meeting.
When the need for a new director arises, Nominating Committee will review the expertise, skills and attributes on
the Board, identify its needs and shortlist candidates with appropriate profi le for nomination and re-nomination.
The search will be through search companies, contacts and recommendation.
Principle 5 : Board Performance
The NC, in considering the re-appointment of any Director, evaluates the performance of the Director. Subsequent
to fi nancial year-end, the Board initiated an evaluation to assess the effectiveness of the Board as a whole in
FY2008 which requires the completion of a questionnaire. The assessment parameters include attendance record
at meetings of the Board and Board Committees, participation at meetings and contributions. Board performance
criteria will not change from year to year unless circumstances deem it necessary. The Board would continue the
evaluation into this fi nancial year and address the fi ndings accordingly. While the NC has continued monitoring the
contribution of individual Directors (such as meeting attendance, performance during meetings and how much
effort and time devoted etc), a more formal and appropriate/acceptable process of doing so would take some time
to evolve.
Principle 6 : Access to Information
Board members are provided with quarterly fi nancial reports and are furnished with relevant information from
time to time on material transactions to enable them to make informed decision. Board papers are circulated for
meetings of the Board and Committees in advance, to enable the Directors to review the information and obtain
further explanations, where necessary.
Directors have the discretion, whether as a group or individually, to obtain independent professional advice on any
matter in the furtherance of their duties as directors, at the Company’s expenses.
The Directors have separate and independent access to the Company Secretary and senior management of the
Company at all times. The Company Secretary attends the board meetings and assists the Board in ensuring
that established Board procedures are followed and all relevant statutes and regulations that are applicable to the
Company are complied with.
The Board is accountable to the shareholders and oversees the management of the business and affairs of the
Group.
17Annual Report 2008
Corporate Governance Report
Principle 7 : Procedures for Developing Remuneration PoliciesPrinciple 8 : Level of Mix of RemunerationPrinciple 9 : Disclosure on Remuneration
Remuneration Committee
The Remuneration Committee (RC) comprises of three independent non-executive members. Mr Leslie Struys is
the Chairman for the RC. The members of the RC as at the date of this Report are as follows:
Mr Leslie Struys Chairman (Independent Non-Executive)
Mr Tony Chan (Independent Non-Executive)
Mr Loh Weng Whye (Independent Non-Executive)
The primary role of RC, guided by the Terms of Reference adopted on 11 August 2006, is to review and approve
recommendations on remuneration including but not limited to directors’ fees, salaries, allowances, bonuses, share
options and benefi ts-in-kind. The RC met 4 times last year. The RC has access to professional advice both from
the internal human resource personnel and external remuneration professionals. The RC does not participate in
any decisions concerning their own remuneration package.
RC has adopted a framework for reviewing the remuneration of non-executive directors. It consists of a base fee,
membership fee for Board Committee as well as fees for being the Chairman of Board Committee. Amount of
time and level of responsibilities are taken into account when reviewing the remuneration. Fees for non-executive
Directors are subject to shareholders’ approval at the Company’s Annual General Meeting. Executive Directors are
not entitled to base fees or fees for membership of Board Committee. The remuneration packages for Executive
Chairman and Executive Directors consist of a performance bonus based on the Group’s profi tability. The RC
also ensures that the remuneration of the Executive Chairman and Executive Directors is on par with the industrial
standards and comparable companies.
The RC’s principle functions are to:
1. Review and recommend to the Board in consultation with the Chairman and CEO a remuneration framework
so as to determine a specifi c remuneration package and employment terms for each of the executive
directors and key management executives of the Group;
2. Recommend to the Board in consultation with the Chairman and CEO a share option scheme or long term
incentive schemes from time to time;
3. Ensure that all aspects of remunerations are covered which include directors’ fee, salaries, allowances,
bonuses, share options and benefi ts-in-kind; and
4. Compare the remuneration packages of directors within the industry and comparable companies so as
to fi nd a meaningful way of assessing the performance of individual executive directors. The remuneration
packages shall include a performance-related element.
The RC administers the Ace Dynamics Share Option Scheme and Leeden Share Option Scheme 2007, which
were approved by shareholders on 19 February 2000 and 8 August 2007, respectively.
Corporate Governance Report
18
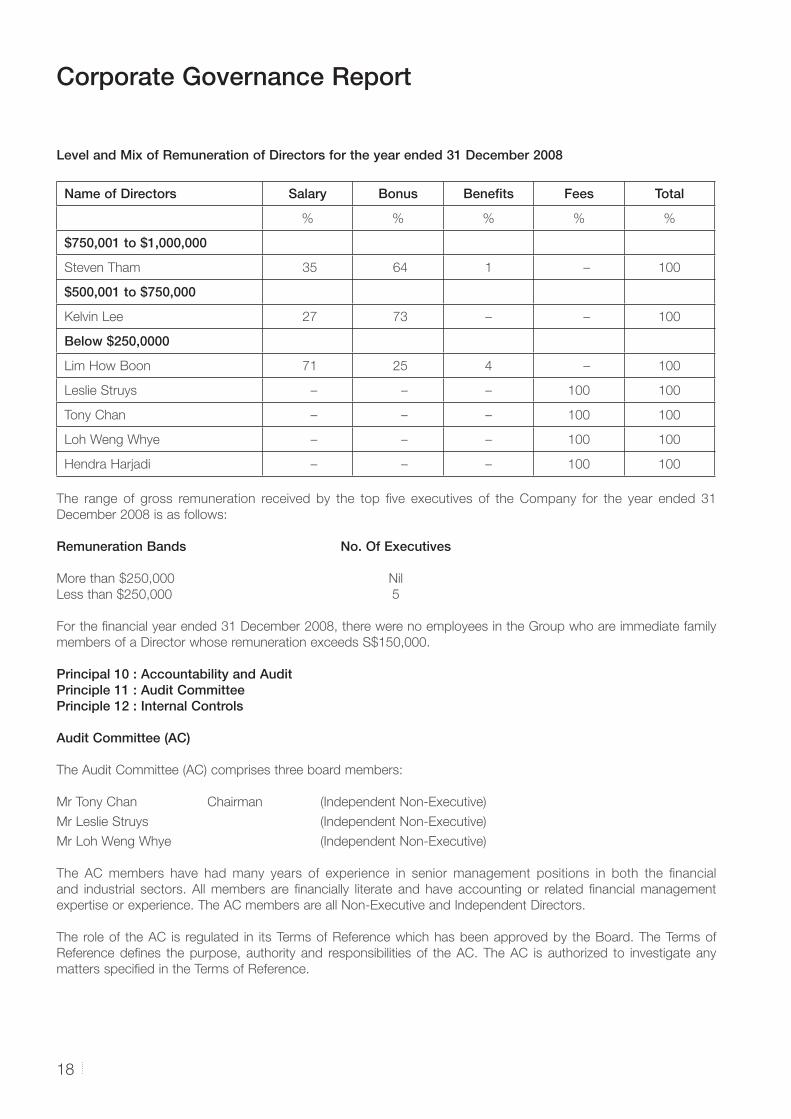
Level and Mix of Remuneration of Directors for the year ended 31 December 2008
Name of Directors Salary Bonus Benefi ts Fees Total
% % % % %
$750,001 to $1,000,000
Steven Tham 35 64 1 – 100
$500,001 to $750,000
Kelvin Lee 27 73 – – 100
Below $250,0000
Lim How Boon 71 25 4 – 100
Leslie Struys – – – 100 100
Tony Chan – – – 100 100
Loh Weng Whye – – – 100 100
Hendra Harjadi – – – 100 100
The range of gross remuneration received by the top fi ve executives of the Company for the year ended 31
December 2008 is as follows:
Remuneration Bands No. Of Executives
More than $250,000 Nil
Less than $250,000 5
For the fi nancial year ended 31 December 2008, there were no employees in the Group who are immediate family
members of a Director whose remuneration exceeds S$150,000.
Principal 10 : Accountability and AuditPrinciple 11 : Audit CommitteePrinciple 12 : Internal Controls
Audit Committee (AC)
The Audit Committee (AC) comprises three board members:
Mr Tony Chan Chairman (Independent Non-Executive)
Mr Leslie Struys (Independent Non-Executive)
Mr Loh Weng Whye (Independent Non-Executive)
The AC members have had many years of experience in senior management positions in both the fi nancial
and industrial sectors. All members are fi nancially literate and have accounting or related fi nancial management
expertise or experience. The AC members are all Non-Executive and Independent Directors.
The role of the AC is regulated in its Terms of Reference which has been approved by the Board. The Terms of
Reference defi nes the purpose, authority and responsibilities of the AC. The AC is authorized to investigate any
matters specifi ed in the Terms of Reference.
19Annual Report 2008
Corporate Governance Report
During the fi nancial year, the AC met twice and performed the following key functions:
Reviews with the internal auditors, the scope and the results of internal audit procedures and their evaluation
of the overall internal control systems and any signifi cant fi ndings;
Reviews with the external auditors, their audit plan, risk assessment, fi ndings for the external audit process
and any other relevant matters;
Reviews signifi cant fi nancial reporting issues and judgments to ensure the integrity of the fi nancial
statements and any formal announcements in relation to fi nancial performance;
Reviews the interim and annual fi nancial statements before submission to the Board for release to SGX-ST;
Reviews and makes recommendations to the Board on the appointment of external auditors;
Reviews interested person transactions, if any, as set out in the Listing Rules of SGX-ST; and
Reviews all non-audit services provided by the fi rm of external auditors, if any, to determine if the provision
of such services would affect the independence of the external auditors.
The AC has the express power to conduct or authorize investigations into any matters within its terms of reference,
has full access to and co-operation by the Management and full discretion to invite any Director or executive
offi cer to attend its meetings. All major fi ndings and recommendations are brought to the attention of the Board of
Directors.
In performing its functions, the AC also meets with external auditors without the presence of the Company’s
management at least once annually. Such meetings allow for a more open discussion on any issues of concerns.
During the year, AC has reviewed the effectiveness of the Group’s material internal controls, including fi nancial and
operational compliance controls, and risk management. The processes used by the AC to review the effectiveness
of the system of internal control and risk management include discussions with management and auditors on the
risks identifi ed and the review of signifi cant issues arising there from.
The AC, having reviewed all non-audit services provided by the external auditors to the Group, is satisfi ed that the
nature and extent of such services would not affect the independence of the external auditors.
The Directors are of the opinion that, in the absence of any evidence to the contrary, the system of internal controls
provides reasonable, but not absolute, assurance that the Group will not be adversely affected by any event that
could reasonably be foreseen as it strives to achieve its business objectives.
Whistle Blowing Policy
The Company has adopted a Policy and Procedure on Whistle Blowing. The Company has provided employees
with well-defi ned and accessible channels within the Group to raise concerns about possible improprieties in
matters of fi nancial reporting such as fraud, corruption or other matters. Upon receipt of such complaint, the AC
would exercise discretion on how to proceed with the investigation, thereafter recommend necessary actions to be
taken.
The AC has received no complaints as at the date of this report.
Corporate Governance Report
20
Principle 13 : Internal Audit
The Company has outsourced its internal audit function to a certifi ed public accounting fi rm. The internal auditors
plan its internal audit schedules in consultation with, but independent of the Management. The audit plan is
submitted to the AC for approval prior to the commencement of the internal audit. With the assistance of the
AC, the Board reviews the effectiveness of the Company’s internal control on an on-going basis, provides its
perspective on management control and ensures appropriate actions when required.
The internal auditors comply with the Standards for the Professional Practice of Internal Auditing developed by the
Institute of Internal Auditors.
COMMUNICATION WITH SHAREHOLDERS
Principle 14 : Communication with ShareholdersPrinciple 15 : Promoting Greater Participation by Shareholders
In complying with the Code:-
All information as required under the Singapore Exchange’s disclosure policy is disseminated to shareholders
through the SGXNET on a timely basis and the Company does not practice selective disclosure;
Price sensitive announcement including interim and full-year results are released through SGXNET within the
mandatory period;
The Annual Report is sent to all shareholders of the Company at least 14 days before the meeting and the
Notice of Annual General Meeting (“AGM”) is made available on SGX-ST’s website;
Members of the Board and various Board committees together with the External Auditor are present and
available to address questions at the AGM;.
Members of the Company are encouraged to attend the AGM and in the event that the member cannot
attend the AGM, the Articles of Association of the Company allow a member to appoint one or two proxies
to attend and vote on behalf of the member. At the AGM, shareholders are given the opportunity to voice
their constructive views and direct questions regarding the Group to the Management or the Directors,
including the Chairmen of the Audit Committee, Remuneration Committee and Nominating Committee; and
All the resolutions at the AGM are single item resolutions.
DEALINGS WITH SECURITIES[SGX-ST Listing Rule 1207 (18)]
The Company has adopted an internal code to provide guidance with regards to dealings in the Company’s
securities by Directors and senior offi cers of the Group.
The guideline sets out window periods where trading in the Company’s securities are not allowed. Directors and
senior offi cers are also expected to observe insiders trading laws at all times even when dealing in securities
outside the window periods. They are also discouraged from dealing in the Company’s share on short-term
considerations. Directors and senior offi cers are required to report to the Company Secretary whenever they deal
in the Company’s shares.
21Annual Report 2008
Corporate Governance Report
RISK MANAGEMENT
Although the Board does not have a risk management committee, the management reviews the Company’s
business and operational activities on a regular basis to identify areas of business risks as well as appropriate
control measures to mitigate these risks. Any signifi cant matters detected by the management are reported to the
Directors. The Group continues to review on an on-going basis, succession plans and other employees-related
issues in an effort to recruit and retain skilled and experienced workforce necessary for its operation The Group’s
fi nancial risk management is discussed under Note 39 to the Notes to the Financial Statements on pages 92 to
97.
MATERIAL CONTRACTS[SGX-ST Listing Rule 1207 (8)]
No material contracts were entered into between the Company or any of its subsidiaries involving the interest of
the CEO or any director or controlling shareholder of the Company or their associates, either still subsisting by end
of the fi nancial year or if not then subsisting, entered into since the end of the previous fi nancial year.
INTERESTED PERSON TRANSACTIONS
The Company has adopted an internal policy governing procedures for the identifi cation, approval and monitoring
of transactions with interested persons. All interested person transaction is subject to review by the AC.
During the fi nancial year, there was no interested person transactions entered into by the Group.
Directors’ Report
22
The Directors are pleased to present their report to the members together with the audited consolidated fi nancial
statements of Leeden Limited (the “Company”) and its subsidiary companies (collectively, the “Group”) and the
balance sheet and statement of changes in equity of the Company for the fi nancial year ended 31 December
2008.
Directors
The Directors of the Company in offi ce at the date of this report are :
Steven Tham Weng Cheong
Kelvin Lee Chee Fatt
Lim How Boon
Leslie Struys
Tony Chan Wing Khei
Loh Weng Whye
Hendra Harjadi
Arrangements to enable Directors to acquire shares and debentures
Other than Leeden Share Option Scheme 2007 and Ace Dynamics Share Option Scheme, neither at the end of
nor at any time during the fi nancial year, was the Company a party to any arrangement whose objects are, or one
of whose object is, to enable the Directors of the Company to acquire benefi ts by means of the acquisition of
shares or debentures of the Company or any other body corporate.
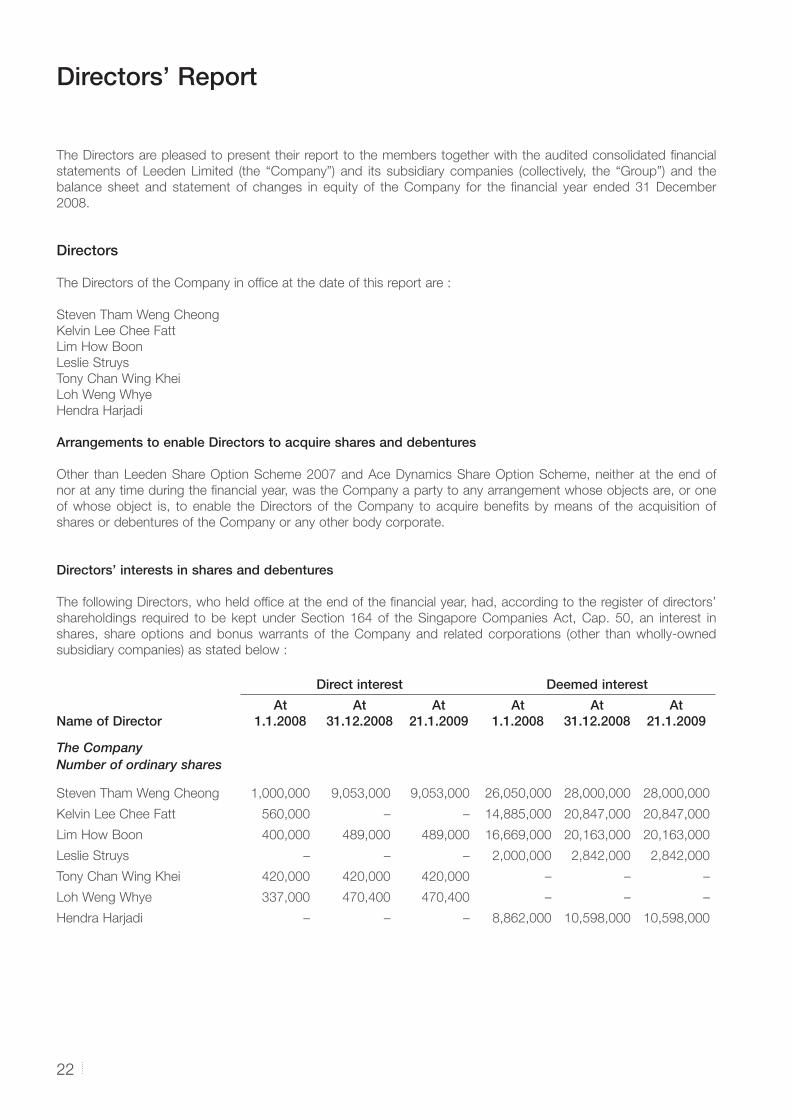
Directors’ interests in shares and debentures
The following Directors, who held offi ce at the end of the fi nancial year, had, according to the register of directors’
shareholdings required to be kept under Section 164 of the Singapore Companies Act, Cap. 50, an interest in
shares, share options and bonus warrants of the Company and related corporations (other than wholly-owned
subsidiary companies) as stated below :
Direct interest Deemed interest
Name of DirectorAt
1.1.2008At
31.12.2008At
21.1.2009At
1.1.2008At
31.12.2008At
21.1.2009
The CompanyNumber of ordinary shares
Steven Tham Weng Cheong 1,000,000 9,053,000 9,053,000 26,050,000 28,000,000 28,000,000
Kelvin Lee Chee Fatt 560,000 – – 14,885,000 20,847,000 20,847,000
Lim How Boon 400,000 489,000 489,000 16,669,000 20,163,000 20,163,000
Leslie Struys – – – 2,000,000 2,842,000 2,842,000
Tony Chan Wing Khei 420,000 420,000 420,000 – – –
Loh Weng Whye 337,000 470,400 470,400 – – –
Hendra Harjadi – – – 8,862,000 10,598,000 10,598,000
23Annual Report 2008
Directors’ Report
Direct interest Deemed interest
Name of DirectorAt
1.1.2008At
31.12.2008At
21.1.2009At
1.1.2008At
31.12.2008At
21.1.2009
Option to subscribe for ordinary shares
Steven Tham Weng Cheong 3,390,000 3,390,000 3,390,000 – – –
Kelvin Lee Chee Fatt 2,500,000 2,500,000 2,500,000 – – –
Lim How Boon 920,000 920,000 920,000 – – –
Leslie Struys 220,000 220,000 220,000 – – –
Tony Chan Wing Khei 200,000 200,000 200,000 – – –
Loh Weng Whye 200,000 200,000 200,000 – – –
Hendra Harjadi 200,000 200,000 200,000 – – –
Bonus Warrants
Steven Tham Weng Cheong 5,241,000 – – – – –
Kelvin Lee Chee Fatt 112,000 – – 2,897,000 – –
Lim How Boon 89,000 – – 3,201,000 – –
Leslie Struys – – – 642,000 – –
Loh Weng Whye 57,400 – – – – –
Hendra Harjadi – – – 1,736,000 – –
Except for the changes set out above, there was no other change in any of the above-mentioned interests
between the end of the fi nancial year and 21 January 2009.
Except as disclosed in this report, no director who held offi ce at the end of the fi nancial year had interests in
shares, share options, warrants or debentures of the Company, or of related corporations, either at the beginning
of the fi nancial year, or date of appointment if later, or at the end of the fi nancial year.
Share options
(a) At the Extraordinary General Meeting held on 19 February 2000 and 8 August 2007, shareholders approved
the adoption of the Ace Dynamics Share Option Scheme (“Scheme I”) and Leeden Share Option Scheme
2007 (“Scheme II”) respectively.
Scheme I
Options may be granted to selected employees of the Group including employees of its associated
companies, executive and non-executive directors. Controlling shareholders and their associates are not
eligible to participate in the scheme. Further details are set out in the circular to shareholders dated 28
January 2000 (“Circular I”).
Under the rules of the scheme as set out in Circular I, the duration of the scheme is subject to a maximum
of 5 fi nancial years commencing with the fi nancial year in which the fi rst option was granted under the
scheme. As the fi rst option was granted during the fi nancial year 2000, the scheme has ceased operation
in the fi nancial year ended 31 December 2004 (the “Period of the Scheme”). However, all outstanding
options under the scheme shall continue to be valid subject to the rules of the scheme. The share options
granted in 2000 in connection with the scheme were issued at a discount of $0.05 per share.
Directors’ Report
24
Scheme II
At an Extraordinary General Meeting held on 8 August 2007, shareholders approved the Leeden Share
Option Scheme 2007 for the granting of options to eligible confi rmed Group employees, including
employees of associated companies, executive and non-executive directors and controlling shareholder.
Further details are set out in the circular to shareholders dated 17 July 2007.
Three tranches of options were granted pursuant to the scheme. Tranch 1 and 3 have vesting period of
2 years while Tranch 2 has vesting periods between 2 to 4 years. Details of the options granted are as
follows :
TranchDate ofgrant
Duration(years)
Expirydate
Discount per share
($)
Exerciseprice
($)Number of
options
1 28 September 2007 10 27 September 2017 0.09 0.40 2,000,000
2 28 September 2007 10 27 September 2017 0.07 0.42 2,190,000
3A 23 October 2007 10 22 October 2017 0.11 0.48 4,360,000
3B 23 October 2007 5 22 October 2012 0.11 0.48 820,000
The Committee administering the schemes comprises of three directors: Leslie Struys, Tony Chan Wing
Khei and Loh Weng Whye.
(b) Details of share options to Directors to subscribe for ordinary shares under the schemes are as follows :
Scheme I
Name of Director
Optionsgranted
during the fi nancial year
Aggregateoptions
granted since commencement of the Scheme to the end of fi nancial year
Aggregate options lapsed/ exercised since commencement of the Scheme to the end of fi nancial year
Aggregateoptions
outstandingas at end of
fi nancial year
Steven Tham Weng Cheong – 4,326,000 3,126,000 1,200,000
Kelvin Lee Chee Fatt – 1,589,000 1,089,000 500,000
Lim How Boon – 2,377,000 1,777,000 600,000
Leslie Struys – 920,000 920,000 –
Tony Chan Wing Khei – 950,000 950,000 –
Hendra Harjadi – 250,000 250,000 –
25Annual Report 2008
Directors’ Report
Scheme II
Name of Director
Optionsgranted
during the fi nancial year
Aggregateoptions
granted since commencement of the Scheme to the end of fi nancial year
Aggregate options lapsed/ exercised since commencement of the Scheme to the end of fi nancial year
Aggregateoptions
outstandingas at end of
fi nancial year
Steven Tham Weng Cheong – 2,190,000 – 2,190,000
Kelvin Lee Chee Fatt – 2,000,000 – 2,000,000
Lim How Boon – 320,000 – 320,000
Leslie Struys – 220,000 – 220,000
Tony Chan Wing Khei – 200,000 – 200,000
Loh Weng Whye – 200,000 – 200,000
Hendra Harjadi – 200,000 – 200,000
(c) Details of share options to employees to subscribe for ordinary shares under the schemes are as follows :
Scheme I
Name of Participant
Optionsgranted
during the fi nancial year
Aggregateoptions
granted since commencement of the Scheme to the end of fi nancial year
Aggregate options lapsed/ exercised since commencement of the Scheme to the end of fi nancial year
Aggregateoptions
outstandingas at end of
fi nancial year
Granted 5% or more of the total options under the plan
John Lee Sok Khian – 1,708,000 1,708,000 –
Others below 5% individually – 11,512,000 10,707,000 805,000
Scheme II
Name of Participant
Optionsgranted
during the fi nancial year
Aggregateoptions
granted since commencement of the Scheme to the end of fi nancial year
Aggregate options lapsed/ exercised since commencement of the Scheme to the end of fi nancial year
Aggregateoptions
outstandingas at end of
fi nancial year
Granted 5% or more of the total options under the plan
Steven Tham Weng Cheong – 2,190,000 – 2,190,000
Kelvin Lee Chee Fatt – 2,000,000 – 2,000,000
Others below 5% individually – 5,180,000 1,325,000 3,855,000
Steven Tham Weng Cheong is a controlling shareholder of the Company.
Directors’ Report
26
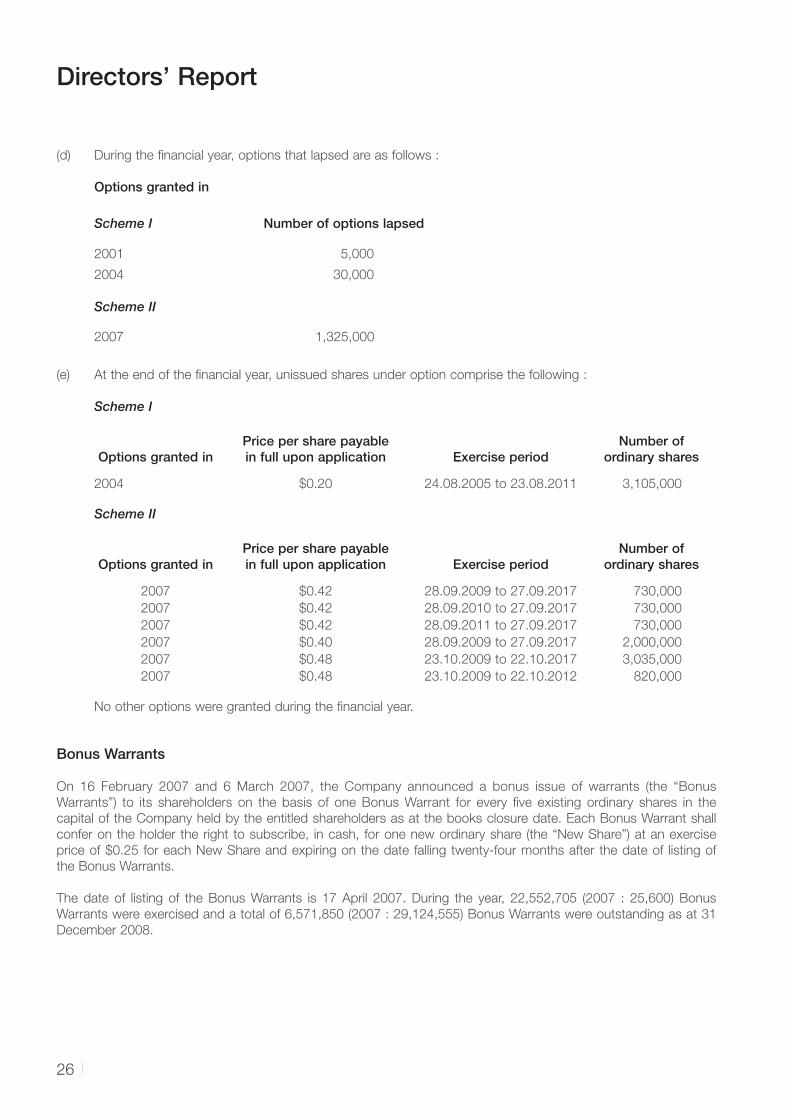
(d) During the fi nancial year, options that lapsed are as follows :
Options granted in
Scheme I Number of options lapsed
2001 5,000
2004 30,000
Scheme II
2007 1,325,000
(e) At the end of the fi nancial year, unissued shares under option comprise the following :
Scheme I
Options granted in Price per share payablein full upon application Exercise period
Number ofordinary shares
2004 $0.20 24.08.2005 to 23.08.2011 3,105,000
Scheme II
Options granted in Price per share payablein full upon application Exercise period
Number ofordinary shares
2007 $0.42 28.09.2009 to 27.09.2017 730,000
2007 $0.42 28.09.2010 to 27.09.2017 730,000
2007 $0.42 28.09.2011 to 27.09.2017 730,000
2007 $0.40 28.09.2009 to 27.09.2017 2,000,000
2007 $0.48 23.10.2009 to 22.10.2017 3,035,000
2007 $0.48 23.10.2009 to 22.10.2012 820,000
No other options were granted during the fi nancial year.
Bonus Warrants
On 16 February 2007 and 6 March 2007, the Company announced a bonus issue of warrants (the “Bonus
Warrants”) to its shareholders on the basis of one Bonus Warrant for every fi ve existing ordinary shares in the
capital of the Company held by the entitled shareholders as at the books closure date. Each Bonus Warrant shall
confer on the holder the right to subscribe, in cash, for one new ordinary share (the “New Share”) at an exercise
price of $0.25 for each New Share and expiring on the date falling twenty-four months after the date of listing of
the Bonus Warrants.
The date of listing of the Bonus Warrants is 17 April 2007. During the year, 22,552,705 (2007 : 25,600) Bonus
Warrants were exercised and a total of 6,571,850 (2007 : 29,124,555) Bonus Warrants were outstanding as at 31
December 2008.
27Annual Report 2008
Directors’ Report
Directors’ contractual benefi ts
Except as disclosed in the fi nancial statements, since the end of the previous fi nancial year, no Director of the
Company has received or become entitled to receive a benefi t by reason of a contract made by the Company or a
related corporation with the Director, or with a fi rm of which the Director is a member, or with a company in which
the Director has a substantial fi nancial interest.
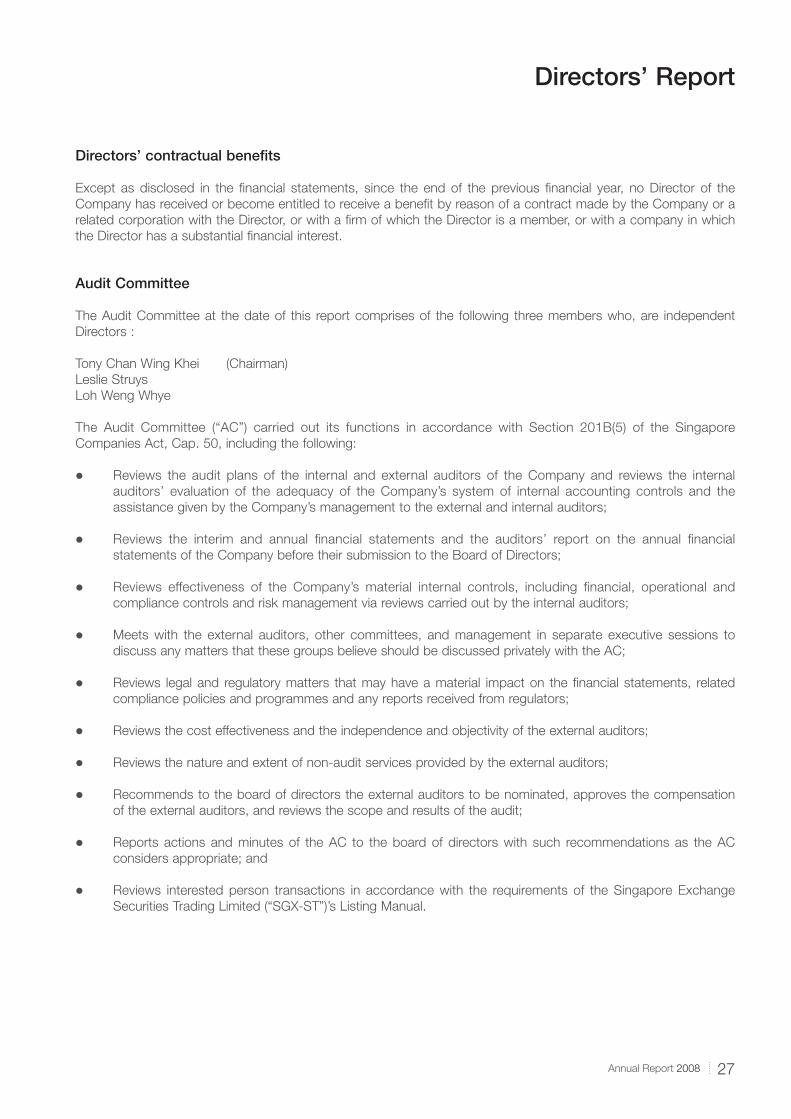
Audit Committee
The Audit Committee at the date of this report comprises of the following three members who, are independent
Directors :
Tony Chan Wing Khei (Chairman)
Leslie Struys
Loh Weng Whye
The Audit Committee (“AC”) carried out its functions in accordance with Section 201B(5) of the Singapore
Companies Act, Cap. 50, including the following:
Reviews the audit plans of the internal and external auditors of the Company and reviews the internal
auditors’ evaluation of the adequacy of the Company’s system of internal accounting controls and the
assistance given by the Company’s management to the external and internal auditors;
Reviews the interim and annual fi nancial statements and the auditors’ report on the annual fi nancial
statements of the Company before their submission to the Board of Directors;
Reviews effectiveness of the Company’s material internal controls, including fi nancial, operational and
compliance controls and risk management via reviews carried out by the internal auditors;
Meets with the external auditors, other committees, and management in separate executive sessions to
discuss any matters that these groups believe should be discussed privately with the AC;
Reviews legal and regulatory matters that may have a material impact on the fi nancial statements, related
compliance policies and programmes and any reports received from regulators;
Reviews the cost effectiveness and the independence and objectivity of the external auditors;
Reviews the nature and extent of non-audit services provided by the external auditors;
Recommends to the board of directors the external auditors to be nominated, approves the compensation
of the external auditors, and reviews the scope and results of the audit;
Reports actions and minutes of the AC to the board of directors with such recommendations as the AC
considers appropriate; and
Reviews interested person transactions in accordance with the requirements of the Singapore Exchange
Securities Trading Limited (“SGX-ST”)’s Listing Manual.
Directors’ Report
28
The AC, having reviewed all non-audit services provided by the external auditors to the Group, is satisfi ed that the
nature and extent of such services would not affect the independence of the external auditors. The AC has also
conducted a review of interested person transactions.
The AC convened two meetings during the year. The AC has also met with internal and external auditors, without
the presence of the Company’s management, at least once a year.
Further details regarding the AC are disclosed in the Report on Corporate Governance.
Auditors
Ernst & Young LLP have expressed their willingness to accept reappointment as auditors.
On behalf of the Board of Directors,
Steven Tham Weng CheongDirector
Kelvin Lee Chee FattDirector
Singapore
30 March 2009
29Annual Report 2008
Statement by Directors
We, Steven Tham Weng Cheong and Kelvin Lee Chee Fatt, being two of the Directors of Leeden Limited, do
hereby state that, in the opinion of the Directors :
(i) the accompanying balance sheets, consolidated income statement, statements of changes in equity, and
consolidated cash fl ow statement together with notes thereto are drawn up so as to give a true and fair
view of the state of affairs of the Group and of the Company as at 31 December 2008 and the results of the
business, changes in equity and cash fl ows of the Group and the changes in equity of the Company for the
year ended on that date, and
(ii) at the date of this statement, there are reasonable grounds to believe that the Company will be able to pay
its debts as and when they fall due.
On behalf of the Board of Directors,
Steven Tham Weng CheongDirector
Kelvin Lee Chee FattDirector
Singapore
30 March 2009
Independent Auditors’ ReportTo the Members of Leeden Limited
30
We have audited the accompanying fi nancial statements of Leeden Limited (the “Company”) and its subsidiary
companies (collectively, the “Group”) set out on pages 31 to 100, which comprise the balance sheets of the Group
and the Company as at 31 December 2008, the statements of changes in equity of the Group and the Company,
and the income statement and cash fl ow statement of the Group for the year then ended, and a summary of
signifi cant accounting policies and other explanatory notes.
Management’s responsibility for the fi nancial statements
Management is responsible for the preparation and fair presentation of these fi nancial statements in accordance
with the provisions of the Singapore Companies Act, Cap. 50 (the Act) and Singapore Financial Reporting
Standards. This responsibility includes devising and maintaining a system of internal accounting controls suffi cient
to provide a reasonable assurance that assets are safeguarded against loss from unauthorised use or disposition;
and transactions are properly authorised and that they are recorded as necessary to permit the preparation of true
and fair profi t and loss account and balance sheet and to maintain accountability of assets; selecting and applying
appropriate accounting policies; and making accounting estimates that are reasonable in the circumstances.
Auditors’ responsibility
Our responsibility is to express an opinion on these fi nancial statements based on our audit. We conducted our
audit in accordance with Singapore Standards on Auditing. Those standards require that we comply with ethical
requirements and plan and perform the audit to obtain reasonable assurance whether the fi nancial statements are
free from material misstatement.
An audit involves performing procedures to obtain audit evidence about the amounts and disclosures in the
fi nancial statements. The procedures selected depend on the auditor’s judgement, including the assessment of
the risks of material misstatement of the fi nancial statements, whether due to fraud or error. In making those risk
assessments, the auditor considers internal control relevant to the entity’s preparation and fair presentation of the
fi nancial statements in order to design audit procedures that are appropriate in the circumstances, but not for
the purpose of expressing an opinion on the effectiveness of the entity’s internal control. An audit also includes
evaluating the appropriateness of accounting policies used and the reasonableness of accounting estimates made
by management, as well as evaluating the overall presentation of the fi nancial statements.
We believe that the audit evidence we have obtained is suffi cient and appropriate to provide a basis for our audit
opinion.
Opinion
In our opinion,
(i) the consolidated fi nancial statements of the Group, and the balance sheet and statement of changes in
equity of the Company are properly drawn up in accordance with the provisions of the Act and Singapore
Financial Reporting Standards so as to give a true and fair view of the state of affairs of the Group and of
the Company as at 31 December 2008 and the results, changes in equity and cash fl ows of the Group and
the changes in equity of the Company for the year ended on that date; and
(ii) the accounting and other records required by the Act to be kept by the Company and by those subsidiary
companies incorporated in Singapore of which we are the auditors have been properly kept in accordance
with the provisions of the Act.
Ernst & Young LLP
Public Accountants and Certifi ed Public Accountants
Singapore
30 March 2009
31Annual Report 2008
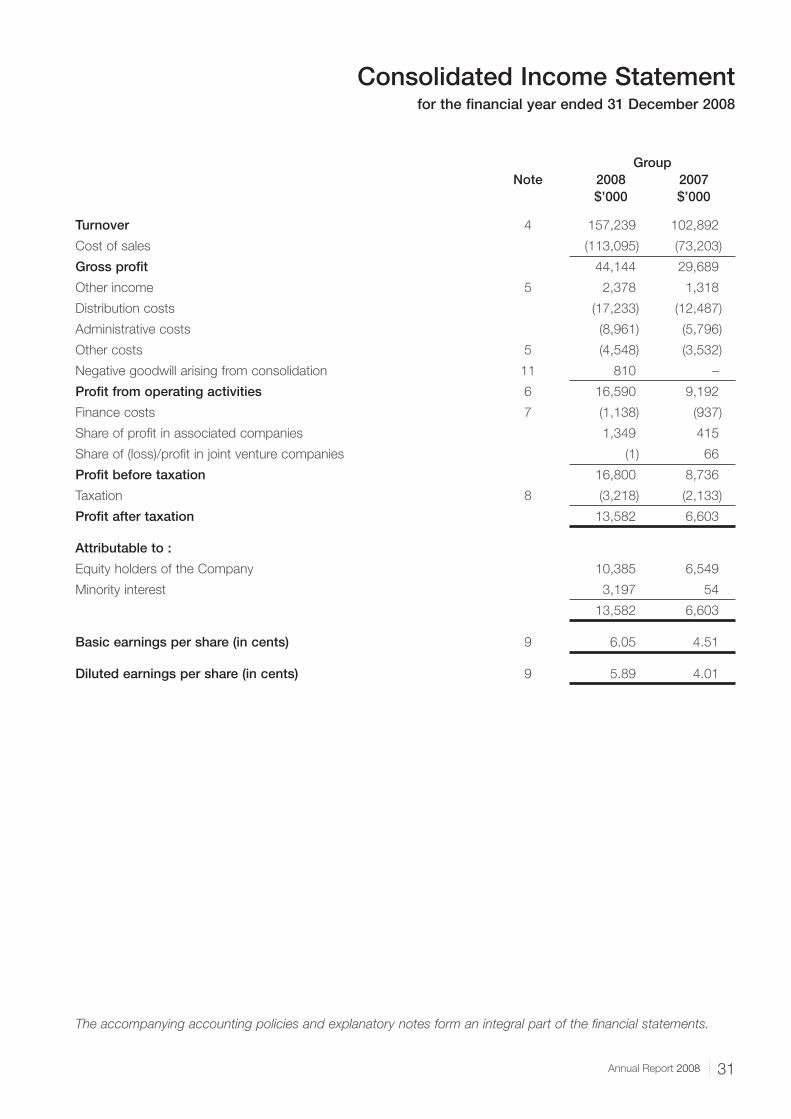
Consolidated Income Statementfor the fi nancial year ended 31 December 2008
GroupNote 2008 2007
$’000 $’000
Turnover 4 157,239 102,892
Cost of sales (113,095) (73,203)
Gross profi t 44,144 29,689
Other income 5 2,378 1,318
Distribution costs (17,233) (12,487)
Administrative costs (8,961) (5,796)
Other costs 5 (4,548) (3,532)
Negative goodwill arising from consolidation 11 810 –
Profi t from operating activities 6 16,590 9,192
Finance costs 7 (1,138) (937)
Share of profi t in associated companies 1,349 415
Share of (loss)/profi t in joint venture companies (1) 66
Profi t before taxation 16,800 8,736
Taxation 8 (3,218) (2,133)
Profi t after taxation 13,582 6,603
Attributable to :
Equity holders of the Company 10,385 6,549
Minority interest 3,197 54
13,582 6,603
Basic earnings per share (in cents) 9 6.05 4.51
Diluted earnings per share (in cents) 9 5.89 4.01
The accompanying accounting policies and explanatory notes form an integral part of the fi nancial statements.
Balance Sheetsas at 31 December 2008
32
Group Company
Note2008$’000
2007$’000
2008$’000
2007$’000
Non-current assets
Property, plant and equipment 10 48,010 9,492 441 16
Subsidiary companies 11 – – 53,994 39,408
Associated companies 12 4,811 9,233 – –
Joint venture companies 13 – 97 – –
Other investments 14 338 150 – –
Intangible assets 15 5,355 90 – –
Goodwill 16 1,487 – – –
Investment property 17 – – – –
60,001 19,062 54,435 39,424
Current assets
Assets held for sale 18 – 960 – –
Development property 19 4,628 – – –
Amount due from subsidiary companies 20 – – 3,371 –
Amount due from related parties 21 901 – 141 –
Stocks 22 46,216 17,688 4,202 208
Trade debtors 23 48,479 28,807 3,463 267
Other debtors and prepayments 24 3,999 869 301 153
Derivatives 25 4 – – –
Fixed deposits 26 1,669 7,176 – –
Cash and bank balances 26 14,893 8,034 3,681 452
120,789 63,534 15,159 1,080
Current liabilities
Amounts due to bankers 27 44,426 9,206 9,678 348
Gross amount due to customers for
contract work in progress 19 – 1,241 – –
Trade creditors 20,223 14,785 2,953 321
Other creditors and accruals 28 9,351 5,290 2,311 307
Hire purchase creditors 29 811 86 57 –
Amount due to related parties 21 3,232 – – –
Provision for taxation 2,230 2,683 130 –
Derivatives 25 747 – – –
81,020 33,291 15,129 976
Net current assets 39,769 30,243 30 104
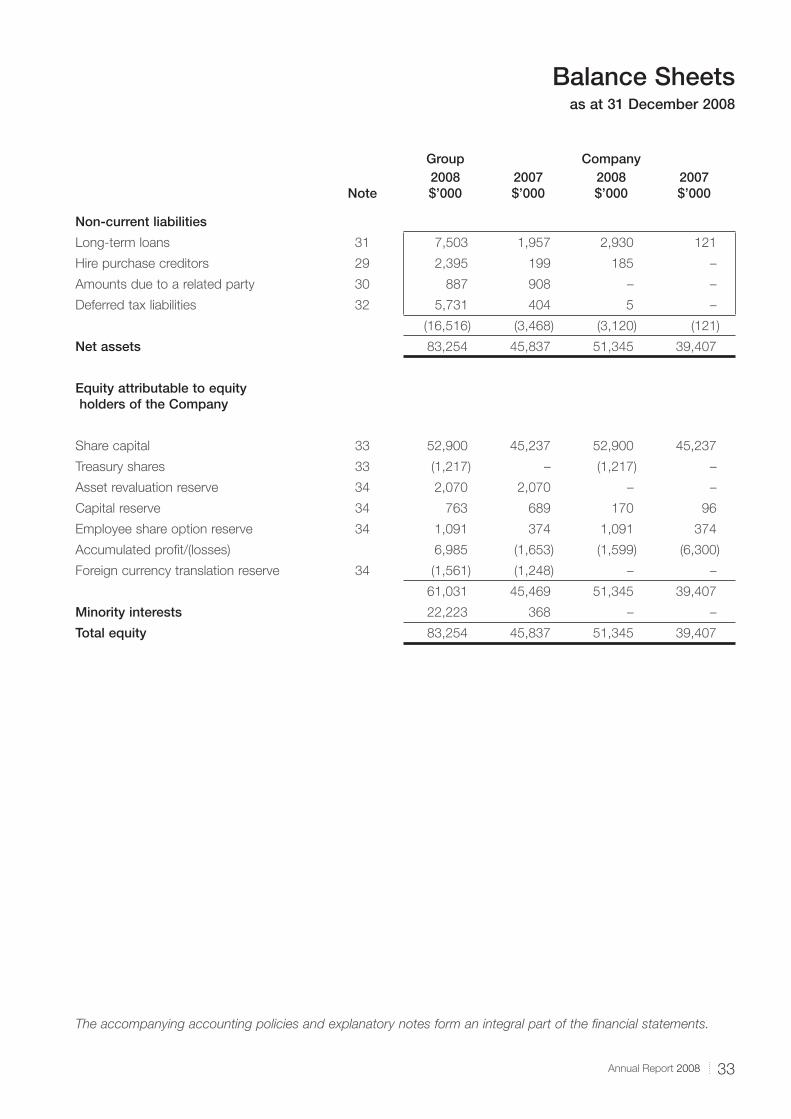
33Annual Report 2008
Balance Sheetsas at 31 December 2008
Group Company
Note2008$’000
2007$’000
2008$’000
2007$’000
Non-current liabilities
Long-term loans 31 7,503 1,957 2,930 121
Hire purchase creditors 29 2,395 199 185 –
Amounts due to a related party 30 887 908 – –
Deferred tax liabilities 32 5,731 404 5 –
(16,516) (3,468) (3,120) (121)
Net assets 83,254 45,837 51,345 39,407
Equity attributable to equity holders of the Company
Share capital 33 52,900 45,237 52,900 45,237
Treasury shares 33 (1,217) – (1,217) –
Asset revaluation reserve 34 2,070 2,070 – –
Capital reserve 34 763 689 170 96
Employee share option reserve 34 1,091 374 1,091 374
Accumulated profi t/(losses) 6,985 (1,653) (1,599) (6,300)
Foreign currency translation reserve 34 (1,561) (1,248) – –
61,031 45,469 51,345 39,407
Minority interests 22,223 368 – –
Total equity 83,254 45,837 51,345 39,407
The accompanying accounting policies and explanatory notes form an integral part of the fi nancial statements.
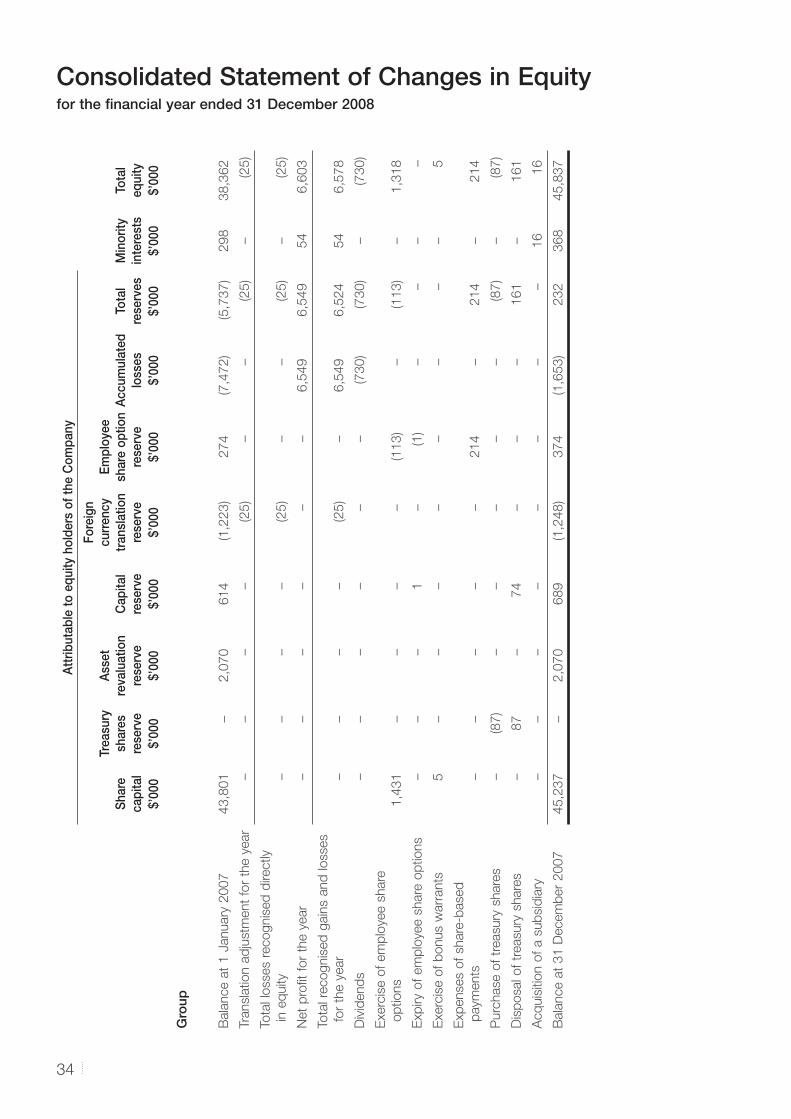
Consolidated Statement of Changes in Equityfor the fi nancial year ended 31 December 2008
34
Att
ribut
able
to e
quity
hol
ders
of t
he C
ompa
ny
Shar
e ca
pita
l
Trea
sury
sh
ares
re
serv
e
Ass
et
reva
luat
ion
rese
rve
Cap
ital
rese
rve
Fore
ign
curr
ency
tr
ansl
atio
n re
serv
e
Empl
oyee
sh
are
optio
n re
serv
eA
ccum
ulat
ed
loss
esTo
tal
rese
rves
Min
ority
in
tere
sts
Tota
leq
uity
$’00
0$’
000
$’00
0$’
000
$’00
0$’
000
$’00
0$’
000
$’00
0$’
000
Gro
up
Bala
nce a
t 1 J
anuary
2007
43,8
01
–
2,0
70
614
(1,2
23)
274
(7,4
72)
(5,7
37)
298
38,3
62
Tra
nsla
tion a
dju
stm
ent
for
the y
ear
–
–
–
–
(2
5)
–
–
(2
5)
–
(2
5)
Tota
l lo
sses r
ecognis
ed
directly
in
eq
uity
–
–
–
–
(2
5)
–
–
(2
5)
–
(2
5)
Net
pro
fi t f
or
the y
ear
–
–
–
–
–
–
6,5
49
6,5
49
54
6,6
03
Tota
l re
cognis
ed
gain
s a
nd
losses
fo
r th
e y
ear
–
–
–
–
(2
5)
–
6,5
49
6,5
24
54
6,5
78
Div
idend
s–
–
–
–
–
–
(7
30)
(730)
–
(7
30)
Exerc
ise o
f em
plo
yee s
hare
op
tions
1,4
31
–
–
–
–
(1
13
)–
(1
13)
–
1,3
18
Exp
iry
of
em
plo
yee s
hare
op
tions
–
–
–
1
–
(1
)–
–
–
–
Exerc
ise o
f b
onus w
arr
ants
5–
–
–
–
–
–
–
–
5
Exp
enses o
f share
-based
p
aym
ents
–
–
–
–
–
214
–
214
–
214
Purc
hase o
f tr
easury
share
s–
(87)
–
–
–
–
–
(8
7)
–
(8
7)
Dis
posal of
treasury
share
s–
87
–
74
–
–
–
161
–
161
Acq
uis
itio
n o
f a s
ub
sid
iary
–
–
–
–
–
–
–
–
16
16
Bala
nce a
t 31
Decem
ber
2007
45,2
37
–
2,0
70
689
(1,2
48)
374
(1,6
53)
232
368
45,8
37
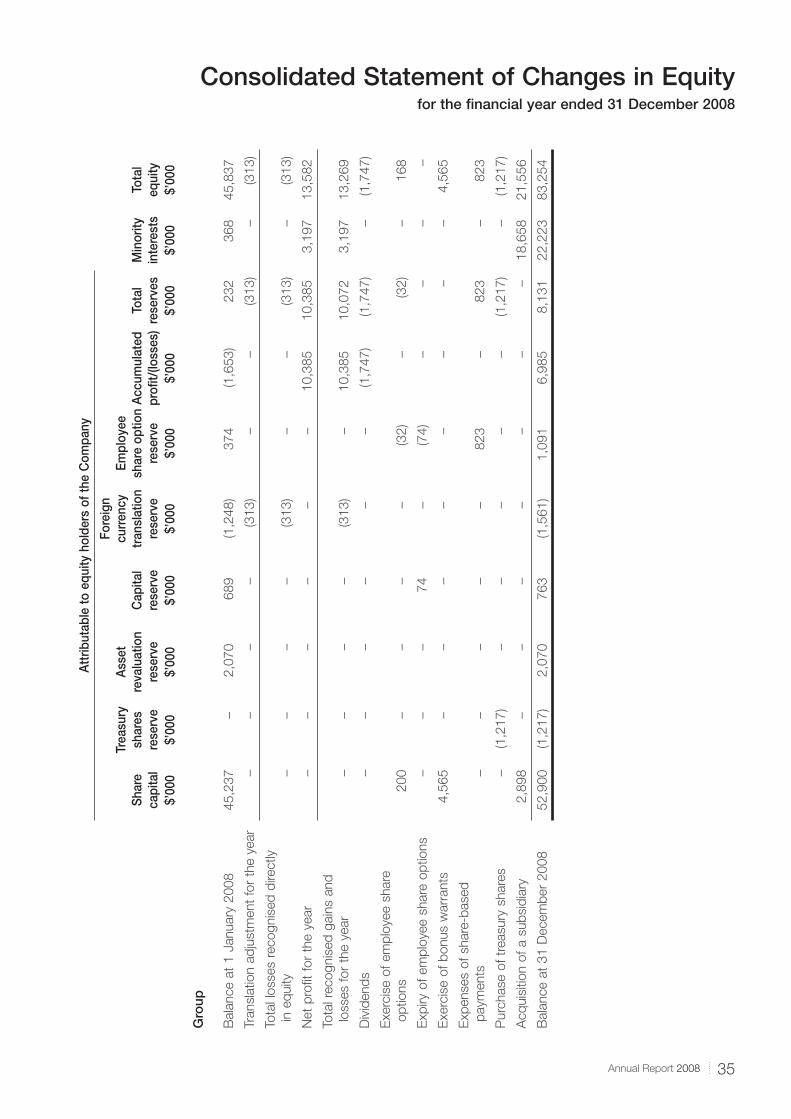
35Annual Report 2008
Consolidated Statement of Changes in Equityfor the fi nancial year ended 31 December 2008
Att
ribut
able
to e
quity
hol
ders
of t
he C
ompa
ny
Shar
e ca
pita
l
Trea
sury
sh
ares
re
serv
e
Ass
et
reva
luat
ion
rese
rve
Cap
ital
rese
rve
Fore
ign
curr
ency
tr
ansl
atio
n re
serv
e
Empl
oyee
sh
are
optio
n re
serv
eA
ccum
ulat
ed
profi
t/(lo
sses
)To
tal
rese
rves
Min
ority
in
tere
sts
Tota
leq
uity
$’00
0$’
000
$’00
0$’
000
$’00
0$’
000
$’00
0$’
000
$’00
0$’
000
Gro
up
Bala
nce a
t 1 J
anuary
2008
45,2
37
–
2,0
70
689
(1,2
48)
37
4(1
,653)
232
368
45,8
37
Tra
nsla
tion a
dju
stm
ent
for
the y
ear
–
–
–
–
(3
13)
–
–
(3
13)
–
(313)
Tota
l lo
sses r
ecognis
ed
directly
in
eq
uity
–
–
–
–
(3
13)
–
–
(3
13)
–
(313)
Net
pro
fi t f
or
the y
ear
––
––
––
10,3
85
10,3
85
3,1
97
13,5
82
Tota
l re
cognis
ed
gain
s a
nd
lo
sses f
or
the y
ear
–
–
–
–
(3
13)
–
10,3
85
10,0
72
3,1
97
13,2
69
Div
idend
s–
–
–
–
–
–
(1
,747)
(1,7
47)
–
(1,7
47)
Exerc
ise o
f em
plo
yee s
hare
op
tions
200
–
–
–
–
(3
2)
–
(3
2)
–
168
Exp
iry
of
em
plo
yee s
hare
op
tions
–
–
–
74
–
(7
4)
–
–
–
–
Exerc
ise o
f b
onus w
arr
ants
4,5
65
–
–
–
–
–
–
–
–
4,5
65
Exp
enses o
f share
-based
p
aym
ents
–
–
–
–
–
82
3–
823
–
823
Purc
hase o
f tr
easury
share
s–
(1,2
17)
–
–
–
–
–
(1
,217)
–
(1,2
17)
Acq
uis
itio
n o
f a s
ub
sid
iary
2,8
98
–
–
–
–
–
–
–
18,6
58
21,5
56
Bala
nce a
t 31
Decem
ber
2008
52,9
00
(1,2
17)
2,0
70
763
(1,5
61)
1,0
91
6,9
85
8,1
31
22,2
23
83,2
54
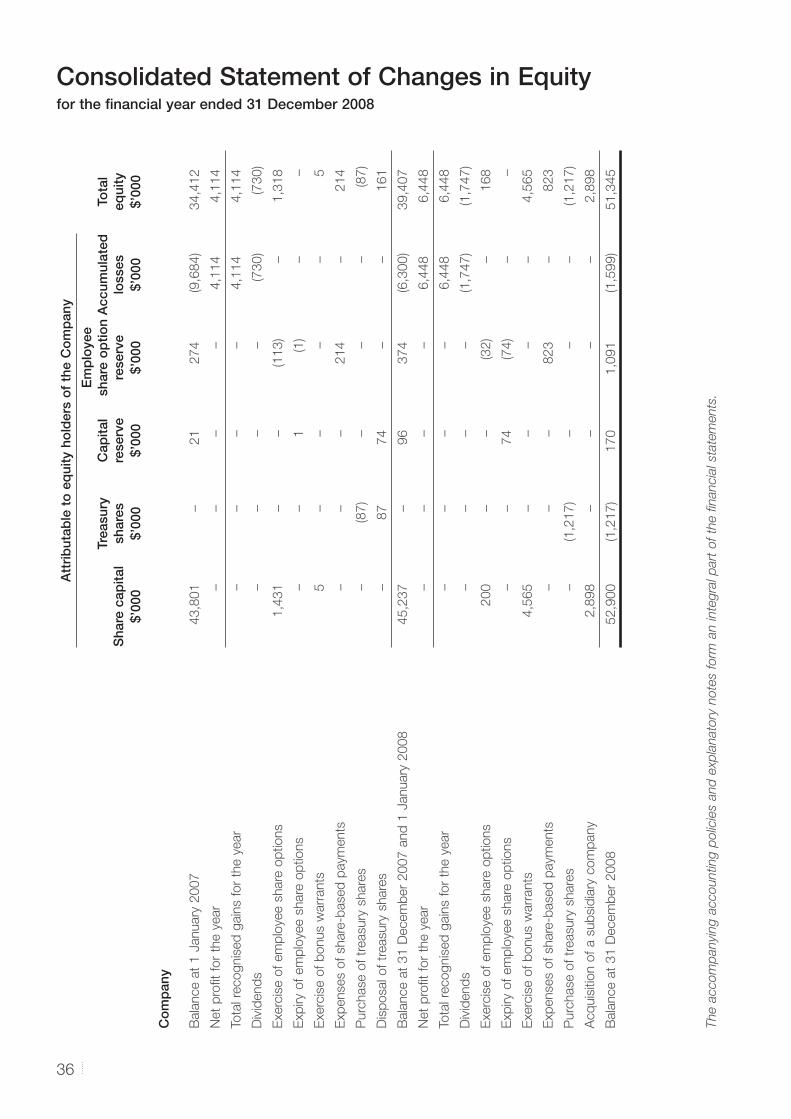
Consolidated Statement of Changes in Equityfor the fi nancial year ended 31 December 2008
36
Att
rib
utab
le t
o e
qui
ty h
old
ers
of
the
Co
mp
any
Sha
re c
apita
lTr
easu
ry
shar
es
Cap
ital
rese
rve
Em
plo
yee
shar
e o
ptio
n re
serv
eA
ccum
ulat
ed
loss
esTo
tal
equi
ty$’
000
$’00
0$’
000
$’00
0$’
000
$’00
0
Co
mp
any
Bala
nce a
t 1 J
anuary
2007
43,8
01
–
2
1274
(9,6
84)
34,4
12
Net
pro
fi t f
or
the y
ear
–
–
–
–
4,1
14
4,1
14
Tota
l re
cognis
ed
gain
s f
or
the y
ear
–
–
–
–
4,1
14
4,1
14
Div
idend
s–
–
–
–
(7
30)
(730)
Exerc
ise o
f em
plo
yee s
hare
op
tions
1,4
31
–
–
(1
13)
–
1,3
18
Exp
iry
of
em
plo
yee s
hare
op
tions
–
–
1
(1)
–
–
Exerc
ise o
f b
onus w
arr
ants
5–
–
–
–
5
Exp
enses o
f share
-based
paym
ents
–
–
–
214
–
214
Purc
hase o
f tr
easury
share
s–
(8
7)
–
–
–
(8
7)
Dis
posal of
treasury
share
s–
87
74
–
–
161
Bala
nce a
t 31
Decem
ber
2007 a
nd
1 J
anuary
2008
45,2
37
–
96
374
(6,3
00)
39,4
07
Net
pro
fi t f
or
the y
ear
–
–
–
–
6,4
48
6,4
48
Tota
l re
cognis
ed
gain
s f
or
the y
ear
–
–
–
–
6,4
48
6,4
48
Div
idend
s–
–
–
–
(1
,747)
(1,7
47)
Exerc
ise o
f em
plo
yee s
hare
op
tions
200
–
–
(3
2)
–
168
Exp
iry
of
em
plo
yee s
hare
op
tions
–
–
7
4(7
4)
–
–
Exerc
ise o
f b
onus w
arr
ants
4,5
65
–
–
–
–
4,5
65
Exp
enses o
f share
-based
paym
ents
–
–
–
823
–
823
Purc
hase o
f tr
easury
share
s–
(1
,217)
–
–
–
(1
,217)
Acq
uis
itio
n o
f a s
ub
sid
iary
com
pany
2,8
98
–
–
–
–
2,8
98
Bala
nce a
t 31
Decem
ber
2008
52,9
00
(1,2
17)
17
01,0
91
(1,5
99)
51,3
45
The a
ccom
panyi
ng a
ccounting p
olic
ies a
nd
exp
lanato
ry n
ote
s f
orm
an inte
gra
l p
art
of
the fi n
ancia
l sta
tem
ents
.
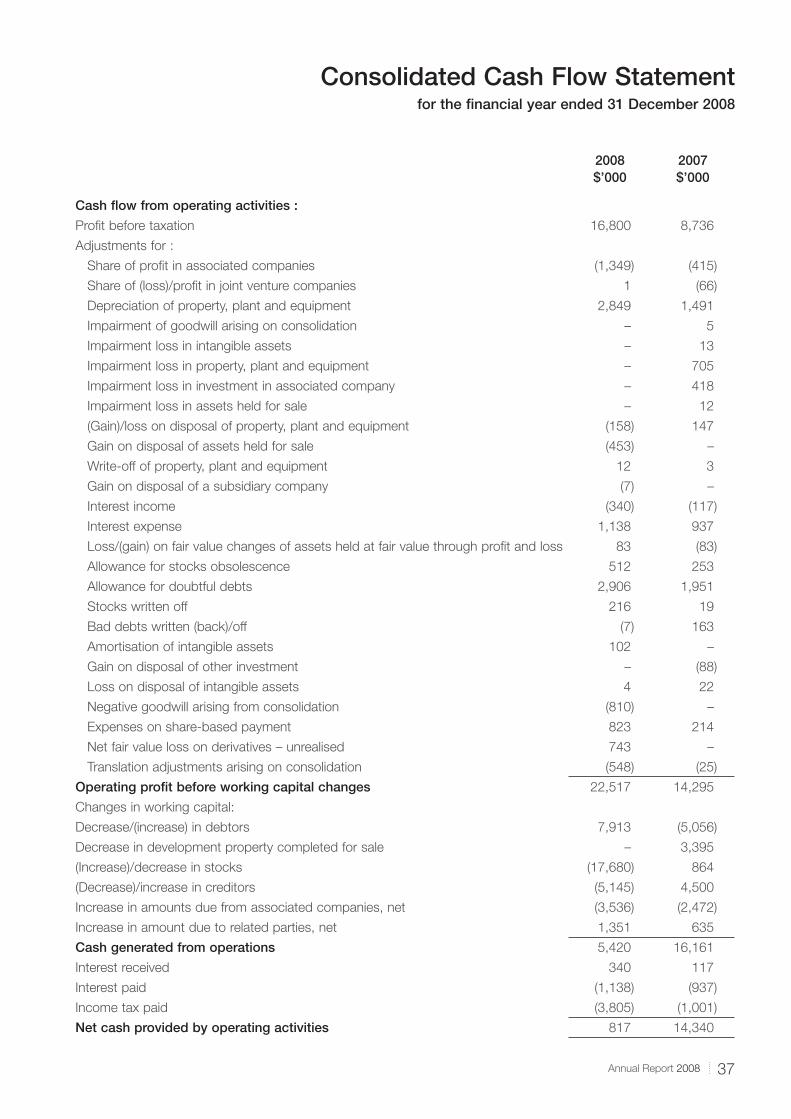
37Annual Report 2008
Consolidated Cash Flow Statementfor the fi nancial year ended 31 December 2008
2008 2007$’000 $’000
Cash fl ow from operating activities :
Profi t before taxation 16,800 8,736
Adjustments for :
Share of profi t in associated companies (1,349) (415)
Share of (loss)/profi t in joint venture companies 1 (66)
Depreciation of property, plant and equipment 2,849 1,491
Impairment of goodwill arising on consolidation – 5
Impairment loss in intangible assets – 13
Impairment loss in property, plant and equipment – 705
Impairment loss in investment in associated company – 418
Impairment loss in assets held for sale – 12
(Gain)/loss on disposal of property, plant and equipment (158) 147
Gain on disposal of assets held for sale (453) –
Write-off of property, plant and equipment 12 3
Gain on disposal of a subsidiary company (7) –
Interest income (340) (117)
Interest expense 1,138 937
Loss/(gain) on fair value changes of assets held at fair value through profi t and loss 83 (83)
Allowance for stocks obsolescence 512 253
Allowance for doubtful debts 2,906 1,951
Stocks written off 216 19
Bad debts written (back)/off (7) 163
Amortisation of intangible assets 102 –
Gain on disposal of other investment – (88)
Loss on disposal of intangible assets 4 22
Negative goodwill arising from consolidation (810) –
Expenses on share-based payment 823 214
Net fair value loss on derivatives – unrealised 743 –
Translation adjustments arising on consolidation (548) (25)
Operating profi t before working capital changes 22,517 14,295
Changes in working capital:
Decrease/(increase) in debtors 7,913 (5,056)
Decrease in development property completed for sale – 3,395
(Increase)/decrease in stocks (17,680) 864
(Decrease)/increase in creditors (5,145) 4,500
Increase in amounts due from associated companies, net (3,536) (2,472)
Increase in amount due to related parties, net 1,351 635
Cash generated from operations 5,420 16,161
Interest received 340 117
Interest paid (1,138) (937)
Income tax paid (3,805) (1,001)
Net cash provided by operating activities 817 14,340
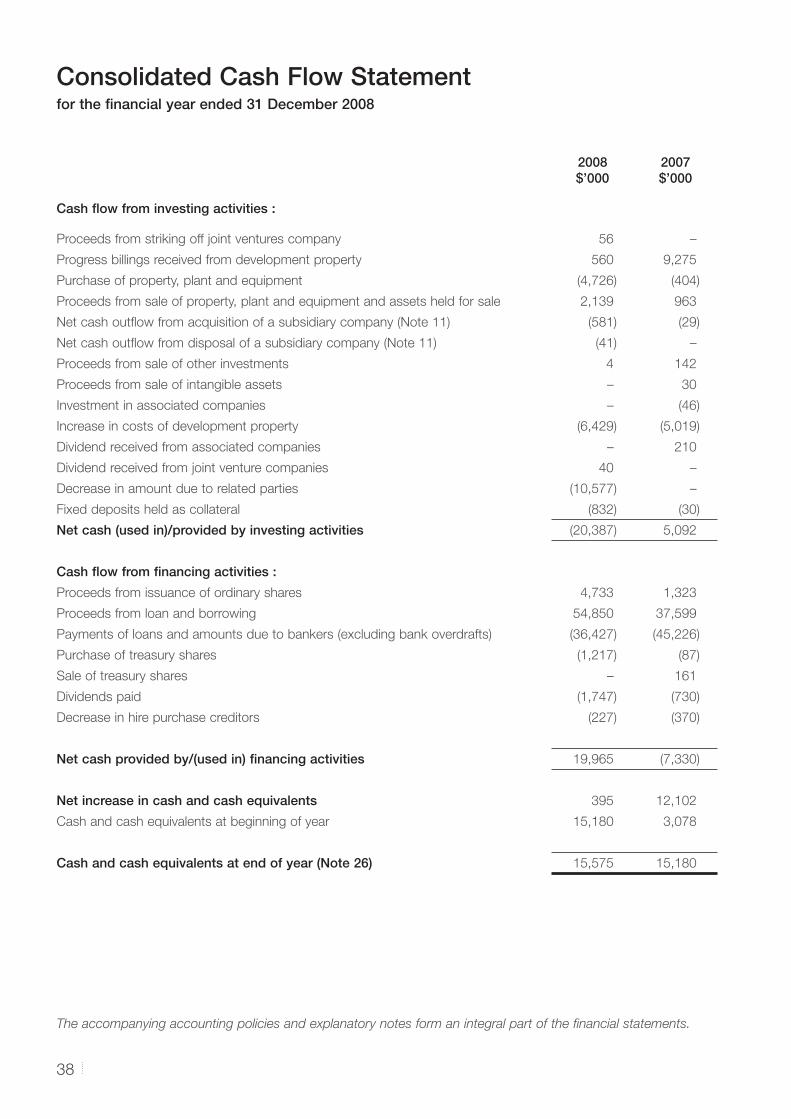
Consolidated Cash Flow Statementfor the fi nancial year ended 31 December 2008
38
2008$’000
2007$’000
Cash fl ow from investing activities :
Proceeds from striking off joint ventures company 56 –
Progress billings received from development property 560 9,275
Purchase of property, plant and equipment (4,726) (404)
Proceeds from sale of property, plant and equipment and assets held for sale 2,139 963
Net cash outfl ow from acquisition of a subsidiary company (Note 11) (581) (29)
Net cash outfl ow from disposal of a subsidiary company (Note 11) (41) –
Proceeds from sale of other investments 4 142
Proceeds from sale of intangible assets – 30
Investment in associated companies – (46)
Increase in costs of development property (6,429) (5,019)
Dividend received from associated companies – 210
Dividend received from joint venture companies 40 –
Decrease in amount due to related parties (10,577) –
Fixed deposits held as collateral (832) (30)
Net cash (used in)/provided by investing activities (20,387) 5,092
Cash fl ow from fi nancing activities :
Proceeds from issuance of ordinary shares 4,733 1,323
Proceeds from loan and borrowing 54,850 37,599
Payments of loans and amounts due to bankers (excluding bank overdrafts) (36,427) (45,226)
Purchase of treasury shares (1,217) (87)
Sale of treasury shares – 161
Dividends paid (1,747) (730)
Decrease in hire purchase creditors (227) (370)
Net cash provided by/(used in) fi nancing activities 19,965 (7,330)
Net increase in cash and cash equivalents 395 12,102
Cash and cash equivalents at beginning of year 15,180 3,078
Cash and cash equivalents at end of year (Note 26) 15,575 15,180
The accompanying accounting policies and explanatory notes form an integral part of the fi nancial statements.
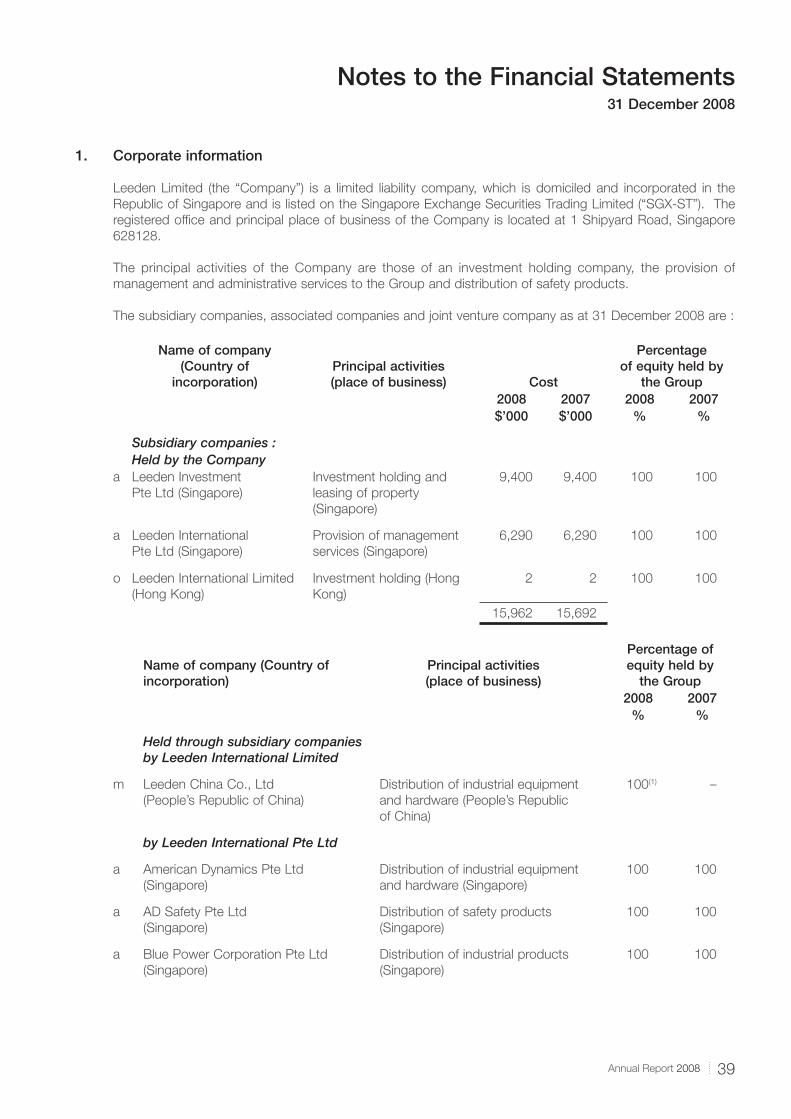
39Annual Report 2008
Notes to the Financial Statements31 December 2008
1. Corporate information
Leeden Limited (the “Company”) is a limited liability company, which is domiciled and incorporated in the
Republic of Singapore and is listed on the Singapore Exchange Securities Trading Limited (“SGX-ST”). The
registered offi ce and principal place of business of the Company is located at 1 Shipyard Road, Singapore
628128.
The principal activities of the Company are those of an investment holding company, the provision of
management and administrative services to the Group and distribution of safety products.
The subsidiary companies, associated companies and joint venture company as at 31 December 2008 are :
Name of company(Country of
incorporation)Principal activities(place of business) Cost
Percentageof equity held by
the Group2008 2007 2008 2007$’000 $’000 % %
Subsidiary companies :Held by the Company
a Leeden Investment
Pte Ltd (Singapore)
Investment holding and
leasing of property
(Singapore)
9,400 9,400 100 100
a Leeden International
Pte Ltd (Singapore)
Provision of management
services (Singapore)
6,290 6,290 100 100
o Leeden International Limited
(Hong Kong)
Investment holding (Hong
Kong)
2 2 100 100
15,962 15,692
Name of company (Country ofincorporation)
Principal activities(place of business)
Percentage of equity held by
the Group2008 2007
% %
Held through subsidiary companiesby Leeden International Limited
m Leeden China Co., Ltd
(People’s Republic of China)
Distribution of industrial equipment
and hardware (People’s Republic
of China)
100(1) –
by Leeden International Pte Ltd
a American Dynamics Pte Ltd
(Singapore)
Distribution of industrial equipment
and hardware (Singapore)
100 100
a AD Safety Pte Ltd
(Singapore)
Distribution of safety products
(Singapore)
100 100
a Blue Power Corporation Pte Ltd
(Singapore)
Distribution of industrial products
(Singapore)
100 100
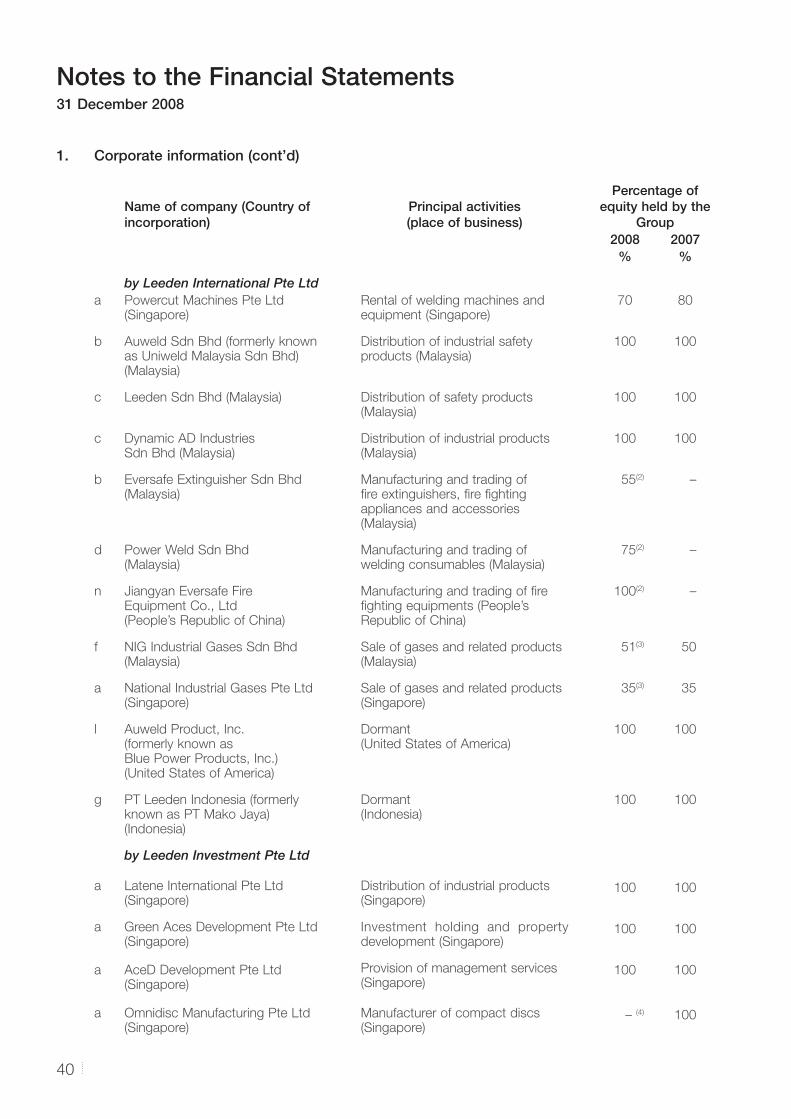
Notes to the Financial Statements31 December 2008
40
1. Corporate information (cont’d)
Name of company (Country ofincorporation)
Principal activities(place of business)
Percentage of equity held by the
Group2008 2007
% %
by Leeden International Pte Ltda Powercut Machines Pte Ltd
(Singapore)Rental of welding machines and equipment (Singapore)
70 80
b Auweld Sdn Bhd (formerly known as Uniweld Malaysia Sdn Bhd)(Malaysia)
Distribution of industrial safety products (Malaysia)
100 100
c Leeden Sdn Bhd (Malaysia) Distribution of safety products (Malaysia)
100 100
c Dynamic AD IndustriesSdn Bhd (Malaysia)
Distribution of industrial products (Malaysia)
100 100
b Eversafe Extinguisher Sdn Bhd(Malaysia)
Manufacturing and trading of fi re extinguishers, fi re fi ghting appliances and accessories (Malaysia)
55(2) –
d Power Weld Sdn Bhd(Malaysia)
Manufacturing and trading ofwelding consumables (Malaysia)
75(2) –
n Jiangyan Eversafe FireEquipment Co., Ltd(People’s Republic of China)
Manufacturing and trading of fi refi ghting equipments (People’sRepublic of China)
100(2) –
f NIG Industrial Gases Sdn Bhd(Malaysia)
Sale of gases and related products (Malaysia)
51(3) 50
a National Industrial Gases Pte Ltd(Singapore)
Sale of gases and related products(Singapore)
35(3) 35
l Auweld Product, Inc. (formerly known asBlue Power Products, Inc.)(United States of America)
Dormant(United States of America)
100 100
g PT Leeden Indonesia (formerly known as PT Mako Jaya) (Indonesia)
Dormant(Indonesia)
100 100
by Leeden Investment Pte Ltd
a Latene International Pte Ltd (Singapore)
Distribution of industrial products(Singapore)
100 100
a Green Aces Development Pte Ltd(Singapore)
Investment holding and property development (Singapore)
100 100
a AceD Development Pte Ltd(Singapore)
Provision of management services(Singapore)
100 100
a Omnidisc Manufacturing Pte Ltd(Singapore)
Manufacturer of compact discs(Singapore)
– (4) 100
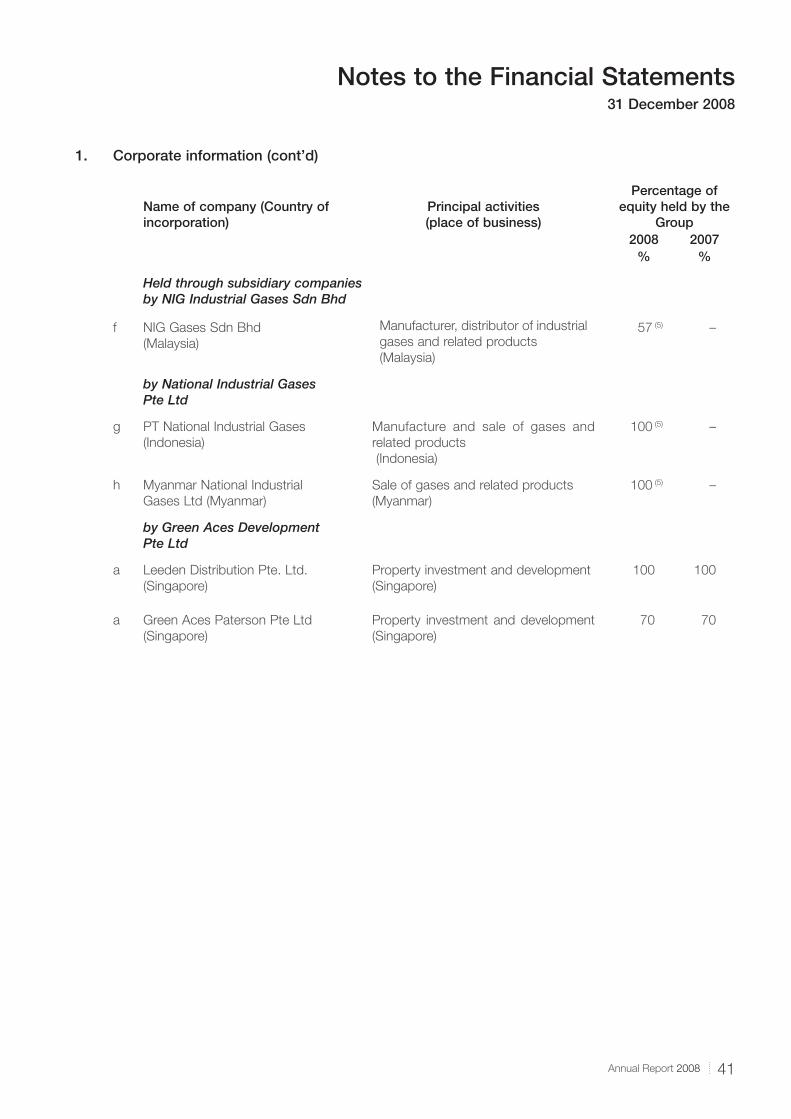
41Annual Report 2008
Notes to the Financial Statements31 December 2008
1. Corporate information (cont’d)
Name of company (Country ofincorporation)
Principal activities(place of business)
Percentage of equity held by the
Group2008 2007
% %
Held through subsidiary companies by NIG Industrial Gases Sdn Bhd
f NIG Gases Sdn Bhd
(Malaysia)
Manufacturer, distributor of industrial
gases and related products
(Malaysia)
57 (5) –
by National Industrial GasesPte Ltd
g PT National Industrial Gases
(Indonesia)
Manufacture and sale of gases and
related products
(Indonesia)
100 (5) –
h Myanmar National Industrial
Gases Ltd (Myanmar)
Sale of gases and related products
(Myanmar)
100 (5) –
by Green Aces DevelopmentPte Ltd
a Leeden Distribution Pte. Ltd.
(Singapore)
Property investment and development
(Singapore)
100 100
a Green Aces Paterson Pte Ltd
(Singapore)
Property investment and development
(Singapore)
70 70
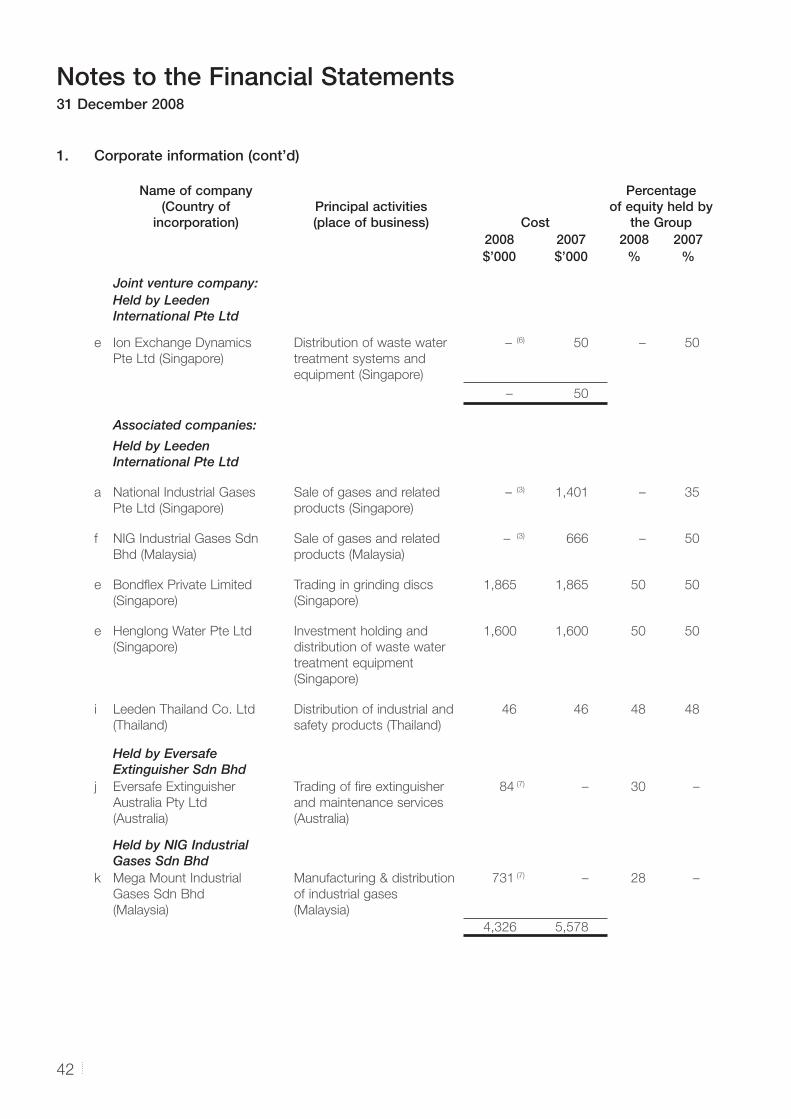
Notes to the Financial Statements31 December 2008
42
1. Corporate information (cont’d)
Name of company(Country of
incorporation)Principal activities(place of business) Cost
Percentageof equity held by
the Group2008 2007 2008 2007$’000 $’000 % %
Joint venture company:Held by Leeden International Pte Ltd
e Ion Exchange Dynamics
Pte Ltd (Singapore)
Distribution of waste water
treatment systems and
equipment (Singapore)
– (6) 50 – 50
– 50
Associated companies:
Held by Leeden International Pte Ltd
a National Industrial Gases
Pte Ltd (Singapore)
Sale of gases and related
products (Singapore)
– (3) 1,401 – 35
f NIG Industrial Gases Sdn
Bhd (Malaysia)
Sale of gases and related
products (Malaysia)
– (3) 666 – 50
e Bondfl ex Private Limited
(Singapore)
Trading in grinding discs
(Singapore)
1,865 1,865 50 50
e Henglong Water Pte Ltd
(Singapore)
Investment holding and
distribution of waste water
treatment equipment
(Singapore)
1,600 1,600 50 50
i Leeden Thailand Co. Ltd
(Thailand)
Distribution of industrial and
safety products (Thailand)
46 46 48 48
Held by Eversafe Extinguisher Sdn Bhd
j Eversafe Extinguisher
Australia Pty Ltd
(Australia)
Trading of fi re extinguisher
and maintenance services
(Australia)
84 (7) – 30 –
Held by NIG Industrial Gases Sdn Bhd
k Mega Mount Industrial
Gases Sdn Bhd
(Malaysia)
Manufacturing & distribution
of industrial gases
(Malaysia)
731 (7) – 28 –
4,326 5,578
43Annual Report 2008
Notes to the Financial Statements31 December 2008
1. Corporate information (cont’d)
a Audited by Ernst & Young LLP, Singapore.
b Audited by Ernst & Young, Chartered Accountants, Malaysia.
c Audited by Christopher Chooi & Co., Chartered Accountants, Malaysia.
d Audited by Horwath, Melaka, Chartered Accountants, Malaysia.
e Audited by Singapore Assurance PAC (formerly known as B L Ong & Co., Certifi ed Public Accountants), Singapore.
f Audited by Ong & Wong, Chartered Accountants, Malaysia.
g Audited by Riyanto, SE, AK., Indonesia.
h Audited by U Tin Win Group, Certifi ed Public Accountants, Myanmar.
i Audited by N&S Audit Partner, Thailand.
j Audited by Hacketts, DFK, Australia.
k Audited by Huang Yan Teo & Co, Chartered Accountants, Malaysia.
l Not required to be audited under the law of country of incorporation.
m Audited by Shanghai Hui Hong, Certifi ed Public Accountants, Co., Ltd.
n Audited by Taizhou Xingrui, Certifi ed Accountants Co., Ltd.
o Audited by World Link CPA Limited, Hong Kong
(1) Subsidiary company incorporated during the year.
(2) Subsidiary company acquired during the year.
(3) Associated company became subsidiary company during the year.
(4) Disposed off during the year.
(5) Subsidiary company of associated company which became subsidiary company during the year.
(6) Joint venture company in the process to be struck off during the year.
(7) Associated company of new subsidiary company acquired during the year.
2. Summary of signifi cant accounting policies
2.1 Basis of preparation
The consolidated fi nancial statements of the Group and the balance sheet and statement of changes in
equity of the Company have been prepared in accordance with Singapore Financial Reporting Standards
(“FRS”).
The fi nancial statements have been prepared on a historical cost basis except as disclosed in the
accounting policies below.
The fi nancial statements are presented in Singapore Dollars (SGD or $) and all values in the tables are
rounded to the nearest thousand ($’000) as indicated.
The accounting policies have been consistently applied by the Group and the Company and are consistent
with those used in the previous fi nancial year except as disclosed below.
2.2 Changes in accounting policies
The following INT FRSs are effective for annual period beginning 1 January 2008:
– INT FRS 111 FRS 102 – Group and Treasury Share Transactions
– INT FRS 112 Service Concession Arrangements
– INT FRS 114 FRS 19 – The Limit on a Defi ned Benefi t Asset, Minimum Funding Requirements and
Their Interaction
– FRS 39 and FRS 107 – FRS 39: Financial Instruments: Recognition and Measurement and FRS 107
Financial Instruments: Disclosures – Amendments relating to Reclassifi cation of Financial Assets
Notes to the Financial Statements31 December 2008
44
2. Summary of signifi cant accounting policies (cont’d)
2.2 Changes in accounting policies (cont’d)
The adoption of these new and revised INT FRS has no material impact to the fi nancial statements in the
period of initial application.
2.3 Future changes in accounting policies
The Group and the Company have not adopted the following FRS and INT FRS that have been issued but
not yet effective:
Reference Description
Effective for annual periods beginning
on or after
FRS 1 Presentation of Financial Statements
– Revised Presentation
– Amendments regarding Puttable Financial Instruments and
Obligations Arising on Liquidation
1 January 2009
1 January 2009
FRS 23 Borrowing Costs 1 January 2009
FRS 27 Consolidated and Separate Financial Statements –
Amendments relating to Cost of an Investment in a Subsidiary,
Jointly Controlled Entity or Associate
1 January 2009
FRS 32 Financial Instruments: Presentation – Amendments relating
to Puttable Financial Instruments and Obligations Arising on
Liquidation
1 January 2009
FRS 39 Financial Instruments: Recognition and Measurement
– Amendments relating to Eligible Hedged Items
1 July 2009
FRS 101 First-time Adoption of Financial Reporting Standards –
Amendments relating to Cost of an Investment in a Subsidiary,
Jointly Controlled Entity or Associate
1 January 2009
FRS 102 Share-based Payments – Amendments relating to vesting
conditions and cancellations
1 January 2009
FRS 108 Operating Segments 1 January 2009
INT FRS 101 First-time Adoption of Financial Reporting Standards –
Amendments relating to Cost of an Investment in a Subsidiary,
Jointly Controlled Entity or Associate
1 January 2009
INT FRS 112 Service Concession Arrangements 1 January 2009
INT FRS 113 Customer Loyalty Programmes 1 July 2008
INT FRS 116 Hedges of a Net Investment in a Foreign Operation 1 October 2008
INT FRS 117 Distributions of Non-cash Assets to Owners 1 July 2009
FRS 39 Financial Instruments: Recognition and Measurement –
Amendments relating to Eligible Hedged Items
1 July 2009
45Annual Report 2008
Notes to the Financial Statements31 December 2008
2. Summary of signifi cant accounting policies (cont’d)
2.3 Changes in accounting policies (cont’d)
The directors expect that the adoption of the above pronouncements will have no material impact to the
fi nancial statements in the period of initial application, except for FRS 1, FRS 102 and FRS 108 as indicated
below.
FRS 1 Presentation of Financial Statements – Revised presentation
The revised FRS 1 requires owner and non-owner changes in equity to be presented separately. The
statement of changes in equity will include only details of transactions with owners, with all non-owner
changes in equity presented as a single line item. In addition, the revised standard introduces the statement
of comprehensive income: it presents all items of income and expense recognised in profi t or loss, together
with all other items of recognised income and expense, either in one single statement, or in two linked
statements. The Group is currently evaluating the format to adopt.
FRS 102 Share-based payment – Vesting conditions and cancellations
FRS 102 has been amended to restrict the defi nition of “vesting condition”’ to a condition that includes an
explicit or implicit requirement to provide services. Any other conditions are non-vesting conditions which
have to be taken into account when estimating the fair value of the equity instrument granted. In the case
that an award does not vest as a result of failure to meet a non-vesting condition that is within the control of
either the entity or the counterparty, this must be accounted for as a cancellation. The change in accounting
policy is to be applied retrospectively. The Group is currently assessing the possible impact of the adoption
of these amendments on its fi nancial statements.
FRS 108 Operating Segments
FRS 108 requires entities to disclose segment information based on the information reviewed by the entity’s
chief operating decision maker. The impact of this standard on the other segment disclosures is still to be
determined. As this is a disclosure standard, it will have no impact on the fi nancial position and results of
the Group when implemented in 2009.
2.4 Basis of consolidation
The consolidation fi nancial statements comprise the fi nancial statements of the Company and its subsidiaries
as at the balance sheet date. The fi nancial statements of the subsidiaries used in the preparation of the
consolidated fi nancial statements are prepared for the same reporting date as the Company. Consistent
accounting policies are applied to like transactions and events in similar circumstances.
All intra-group balances, income and expenses and unrealised gains and losses resulting from intra-group
transactions are eliminated in full.
Acquisitions of subsidiaries are accounted for by applying the purchase method. Identifi able assets acquired
and liabilities and contingent liabilities assumed in a business combination are measured initially at their
fair values at the acquisition date. Adjustments to those fair values relating to previously held interests are
treated as a revaluation and recognised in equity. Any excess of the cost of business combination over the
Group’s share in the net fair value of the acquired subsidiary’s identifi able assets, liabilities and contingent
liabilities is recorded as goodwill on the balance sheet. The accounting policy for goodwill is set out in Note
2.8(a). Any excess of the Group’s share in the net fair value of the acquired subsidiary’s identifi able assets,
liabilities and contingent liabilities over the cost of business combination is recognised as income in the
income statement on the date of acquisition.
Subsidiaries are consolidated from the date of acquisition, being the date on which the Group obtains
control, and continue to be consolidated until the date that such control ceases.
Notes to the Financial Statements31 December 2008
46
2. Summary of signifi cant accounting policies (cont’d)
2.5 Transactions with minority interest
Minority interests represent the portion of profi t and loss and net assets in subsidiaries not held by the
Group and are presented separately in the consolidated income statement and within equity in the
consolidated balance sheet, separately from parent shareholders’ equity. Transactions with minority interests
are accounted for using the entity concept method, whereby, transactions with minority interests are
accounted for as transactions with equity holders. On the acquisition of minority interests, the difference
between the consideration and book value of the share of the net assets acquired is refl ected as being a
transaction between owners and recognised directly in equity. Gain or loss on disposal to minority interests
is recognised directly in equity.
2.6 Foreign currency
Transactions in foreign currencies are measured in the respective functional currencies of the Company
and its subsidiaries and are recorded on initial recognition in the functional currencies at exchange rates
approximating those ruling at the transaction dates. Monetary assets and liabilities denominated in foreign
currencies are translated at the rate of exchange ruling at the balance sheet date. Non-monetary items that
are measured in terms of historical cost in a foreign currency are translated using the exchange rates as
at the dates of the initial transactions. Non-monetary items measured at fair value in a foreign currency are
translated using the exchange rates at the date when the fair value was determined.
Exchange differences arising on the settlement of monetary items or on translating monetary items at the
balance sheet date are recognised in the income statement except for exchange differences arising on
monetary items that form part of the Group’s net investment in foreign operations, which are recognised
initially in equity as foreign currency translation reserve in the consolidated balance sheet and recognised in
the consolidated income statement on disposal of the foreign operation.
The assets and liabilities of foreign operations are translated into SGD at the rate of exchange ruling at the
balance sheet date and their income statements are translated at the weighted average exchange rates for
the year. The exchange differences arising on the translation are taken directly to a separate component of
equity as foreign currency translation reverse. On disposal of a foreign operation, the cumulative amount
recognised in equity in foreign currency translation reserve relating to that particular foreign operation is
recognised in the income statement.
2.7 Property, plant and equipment
All items of property, plant and equipment are initially recorded at cost. The cost of an item of property,
plant and equipment is recognised as an asset if, and only if, it is probable that future economic benefi ts
associated with the item will fl ow to the Group and the cost of the item can be measured reliably.
Subsequent to recognition, property, plant and equipment and furniture and fi ttings are measured at cost or
valuation less accumulated depreciation and accumulated impairment losses. A one-off revaluation of the
property was conducted in 1989 and the fair value is determined from market-based evidence by appraisal
that is undertaken by professionally qualifi ed valuers.
Any revaluation surplus is credited directly to the asset revaluation reserve in equity, except to the extent
that it reverses a revaluation decrease of the same asset previously recognised in the income statement,
in which case the decrease is recognised in the income statement. A revaluation defi cit is recognised in
income statement, except to the extent that it offsets an existing surplus on the same asset carried in the
asset revaluation reserve.
47Annual Report 2008
Notes to the Financial Statements31 December 2008
2. Summary of signifi cant accounting policies (cont’d)
2.7 Property, plant and equipment (cont’d)
Any accumulated depreciation as at the revaluation date is eliminated against the gross carrying amount of
the asset and the net amount is restated to the revalued amount of the asset. The whole of the revaluation
surplus included in the asset revaluation reserve in respect of an asset is transferred directly to retained
earnings on retirement or disposal of the asset.
Freehold land has an unlimited useful life and therefore is not depreciated.
Depreciation is computed on a straight-line basis over the estimated useful lives of the assets as follows :
Leasehold properties – over the term of the lease of 30 to 73½ years
Plant and machinery – 6 months to 10 years
Offi ce equipment, furniture and fi ttings – 3 to 10 years
Motor vehicles – 5 to 8 years
The carrying values of property, plant and equipment are reviewed for impairment when events or changes
in circumstances indicate that the carrying value may not be recoverable.
The residual values, useful life and depreciation method are reviewed at each fi nancial year-end to ensure
that the amount, method and period of depreciation are consistent with previous estimates and the
expected pattern of consumption of the future economic benefi ts embodied in the items of property, plant
and equipment.
An item of property, plant and equipment is derecognised upon disposal or when no future economic
benefi ts are expected from its use or disposal. Any gain or loss arising on derecognition of the asset is
included in the income statement in the year the asset is derecognised.
2.8 Intangible assets
(a) Goodwill
Goodwill is initially measured at cost. Following initial recognition, goodwill is measured at cost less
accumulated impairment losses. Goodwill is reviewed for impairment annually or more frequently if
events and circumstances indicate that the carrying value may be impaired.
For the purpose of impairment testing, goodwill acquired is allocated to each of the Group’s cash-
generating units that are expected to benefi t from the synergies of the combination.
The cash-generating unit to which goodwill has been allocated is tested for impairment annually and
whenever there is an indication that the cash-generating unit may be impaired, by comparing the
carrying amount of the cash-generating unit, including the allocated goodwill, with the recoverable
amount of the cash-generating unit. Where the recoverable amount of the cash-generating unit is
less than the carrying amount, an impairment loss is recognised in the income statement. Impairment
losses recognised for goodwill are not reversed in subsequent periods.
Where goodwill forms part of a cash-generating unit and part of the operation within that cash-
generating unit is disposed of, the goodwill associated with the operation disposed of is included in
the carrying amount of the operation when determining the gain or loss on disposal of the operation.
Goodwill disposed of in this circumstance is measured based on the relative fair values of the
operations disposed of and the portion of the cash-generating unit retained.
Notes to the Financial Statements31 December 2008
48
2. Summary of signifi cant accounting policies (cont’d)
2.8 Intangible assets (cont’d)
(a) Goodwill (cont’d)
Goodwill and fair value adjustments arising on the acquisition of foreign operations are treated as
assets and liabilities of the foreign operations and are recorded in the functional currency of the
foreign operations and translated in accordance with the accounting policy set out in Note 2.6.
(b) Other intangible assets
Intangible assets acquired separately are measured initially at cost. The cost of intangible assets
acquired in a business combination is their fair values as at the date of acquisition. Following
initial acquisition, intangible assets are measured at cost less any accumulated amortisation and
accumulated impairment losses.
Intangible assets with fi nite useful lives are amortised over the estimated useful lives and assessed
for impairment whenever there is an indication that the intangible assets may be impaired. The
amortisation period and the amortisation method are reviewed at least at each fi nancial year-end.
Intangible assets with indefi nite useful lives or not yet available for use are tested for impairment
annually, or more frequently if the events and circumstances indicate that the carrying value may be
impaired either individually or at the cash-generating unit level. Such intangibles are not amortised.
The useful life of an intangible asset with an indefi nite useful life is reviewed annually to determine
whether the useful life assessment continues to be supportable.
(i) Club membership
Club membership was acquired separately and is amortised on a straight line basis over its
fi nite useful life of 90 years.
(ii) Distribution rights
Distribution rights were acquired separately and are amortised on a straight line basis over its
fi nite useful life of 3 years.
(iii) Customer relationships
Customer relationships were acquired in business combinations. The useful lives of these
intangible assets are assessed to be 7 to 10 years based on average number of years the
customers have been with the acquired companies and are amortised on a straight-line basis.
(iv) Trade name
The trade names were acquired in business combinations. The useful lives of the trade names
are estimated to be indefi nite because based on the current market share of the brands,
management believes there is no foreseeable limit to the period over which the brands are
expected to generate net cash infl ows for the Group.
49Annual Report 2008
Notes to the Financial Statements31 December 2008
2. Summary of signifi cant accounting policies (cont’d)
2.9 Impairment of non-fi nancial assets
The Group assesses at each reporting date whether there is an indication that an asset may be impaired.
If any such indication exists, or when annual impairment assessment for an asset is required, the Group
makes an estimate of the asset’s recoverable amount.
An asset’s recoverable amount is the higher of an asset’s or cash-generating unit’s fair value less costs to
sell and its value in use and is determined for an individual asset, unless the asset does not generate cash
infl ows that are largely independent of those from other assets. In assessing value in use, the estimated
future cash fl ows expected to be generated by the asset are discounted to their present value. Where the
carrying amount of an asset exceeds its recoverable amount, the asset is written down to its recoverable
amount.
Impairment losses are recognised in the income statement except for assets that are previously revalued
where the revaluation was taken to equity. In this case the impairment is also recognised in equity up to the
amount of any previous revaluation.
An assessment is made at each reporting date as whether there is any indication that previously recognised
impairment losses may no longer exist or may have decreased. A previously recognised impairment loss
is reversed only if there has been a change in the estimates used to determine the asset’s recoverable
amount since the last impairment loss was recognised. If that is the case, the carrying amount of the asset
is increased to its recoverable amount. That increase cannot exceed the carrying amount that would have
been determined, net of depreciation, had no impairment loss be recognised previously. Such reversal is
recognised in the income statement unless the asset is measured at revalued amount, in which case the
reversal is treated as a revaluation increase.
2.10 Subsidiaries
A subsidiary is an entity over which the Group has the power to govern the fi nancial and operating policies
so as to obtain benefi ts from its activities.
In the Company’s separate fi nancial statements, investments in subsidiaries are accounted for at cost less
any impairment losses.
2.11 Associates
An associate is an entity, not being a subsidiary or a joint venture, in which the Group has signifi cant
infl uence. The associate is equity accounted for from the date the Group obtains signifi cant infl uence until
the date the Group ceases to have signifi cant infl uence over the associate.
The Group’s investments in associates are accounted for using the equity method. Under the equity
method, the investment in associate is measured in the balance sheet at cost plus post-acquisition changes
in the Group’s share of net assets of the associate. Goodwill relating to an associate is included in the
carrying amount of the investment. Any excess of the Group’s share of the net fair value of the associate’s
identifi able asset, liabilities and contingent liabilities over the cost of the investment is deducted from the
carrying amount of the investment and is recognised as income as part of the Group’s share of results of
the associate in the period in which the investment is acquired.
When the Group’s share of losses in an associate equals or exceeds its interest in the associate, the Group
does not recognise further losses, unless it has incurred obligations or made payments on behalf of the
associate.
The fi nancial statements of the associate are prepared as of the same reporting date as the Company.
Where necessary, adjustments are made to bring the accounting policies in line with those of the Group.
Notes to the Financial Statements31 December 2008
50
2. Summary of signifi cant accounting policies (cont’d)
2.12 Joint venture
A joint venture is a contractual arrangement whereby two or more parties undertake an economic activity
that is subject to joint control, where the strategic fi nancial and operating decisions relating to the activity
require the unanimous consent of the parties sharing control. The Group recognised its interest in joint
venture using the equity method. Under the equity method, the investment in joint venture is measured
in the balance sheet at cost plus post-acquisition changes in the Group’s share of net assets of the joint
venture. The Group’s share of the profi t or loss of the joint venture is recognised in the consolidated income
statement. Where there has been a change recognised directly in the equity of the joint venture, the Group
recognises its share of such changes. After application of the equity method, the Group determines whether
it is necessary to recognise any impairment loss with respect to the Group’s net investment in the joint
venture. The joint venture is equity accounted for from the date the Group obtains joint control until the date
the Group cease to have joint control over the joint venture.
The fi nancial statements of the joint venture are prepared as of the same reporting date as the Company.
Where necessary, adjustments are made to bring the accounting policies into line with those of the Group.
2.13 Financial assets
Financial assets are recognised on the balance sheet when, and only when, the Group becomes a party to
the contractual provisions of the fi nancial instrument.
When fi nancial assets are recognised initially, they are measured at fair value, plus, in the case of fi nancial
assets not at fair value through profi t or loss, directly attributable transaction costs.
A fi nancial asset is derecognised where the contractual right to receive cash fl ows from the assets has
expired. On derecognition of a fi nancial asset in its entirety, the difference between the carrying amount and
the sum of the consideration received and any cumulative gain or loss that has been recognised directly in
equity is recognised in the income statement.
All regular way purchases and sales of fi nancial assets are recognised or derecognised on the trade date
i.e. the date that the Group commits to purchase or sell the asset. Regular way purchases or sales are
purchases or sales of fi nancial assets that require delivery of assets within the period generally established
by regulation or convention in the marketplace concerned.
(a) Financial assets at fair value through profi t or loss
Financial assets held for trading are classifi ed as fi nancial assets at fair value through profi t or loss.
Financial assets held for trading are derivatives (including separated embedded derivatives) or fi nancial
assets acquired principally for the purpose of selling in the near term.
Subsequent to initial recognition, fi nancial assets at fair value through profi t or loss are measured at
fair value. Any gains or losses arising from changes in fair value of the fi nancial assets are recognised
in the income statement. Net gains or net losses on fi nancial assets at fair value through profi t or loss
include exchange differences, interest and dividend income.
51Annual Report 2008
Notes to the Financial Statements31 December 2008
2. Summary of signifi cant accounting policies (cont’d)
2.13 Financial assets (cont’d)
(b) Loans and receivables
Financial assets with fi xed or determinable payments that are not quoted in an active market are
classifi ed as loans and receivables. Subsequent to initial recognition, loans and receivables are
measured at amortised cost using the effective interest method. Gains and losses are recognised in
the income statement when the loans and receivables are derecognised or impaired, and through the
amortisation process.
The Group classifi es the following fi nancial assets as loans and receivables:
• cash and short term deposits;
• trade and other debtors, including amounts due from subsidiary companies and associated
companies.
(c) Available-for-sale fi nancial assets
Available-for-sale fi nancial assets are fi nancial assets that are not classifi ed in any of the other
categories. After initial recognition, available-for-sale fi nancial assets are measured at fair value. Any
gains or losses from changes in fair value of the fi nancial asset are recognised directly in the fair value
adjustment reserve in equity, except that impairment losses, foreign exchange gains and losses on
monetary instruments and interest calculated using the effective interest method are recognised in the
income statement. The cumulative gain or loss previously recognised in equity is recognised in the
income statement when the fi nancial asset is derecognised.
Investments in equity instruments whose fair value cannot be reliably measured are measured at cost
less impairment loss.
The Group does not have any held-to-maturity fi nancial assets.
2.14 Impairment of fi nancial assets
The Group assesses at each reporting date whether there is any objective evidence that a fi nancial asset is
impaired.
(a) Assets carried at amortised cost
If there is objective evidence that an impairment loss on fi nancial assets carried at amortised cost
has been incurred, the amount of the loss is measured as the difference between the asset’s carrying
amount and the present value of estimated future cash fl ows discounted at the fi nancial asset’s
original effective interest rate. The carrying amount of the asset is reduced through the use of an
allowance account. The impairment loss is recognised in the income statement.
When the assets become uncollectible, the carrying amount of impaired fi nancial assets is reduced
directly or if an amount was charged to the allowance account, the amounts charged to the
allowance account are written off against the carrying value of the fi nancial asset.
To determine whether there is objective evidence that an impairment loss on fi nancial assets has
been incurred, the Group considers factors such as the probability of insolvency or signifi cant fi nancial
diffi culties of the debtor and default or signifi cant delay in payments.
Notes to the Financial Statements31 December 2008
52
2. Summary of signifi cant accounting policies (cont’d)
2.14 Impairment of fi nancial assets (cont’d)
(a) Assets carried at amortised cost (cont’d)
If in a subsequent period, the amount of the impairment loss decreases and the decrease can
be related objectively to an event occurring after the impairment was recognised, the previously
recognised impairment loss is reversed to the extent that the carrying amount of the asset does not
exceed its amortised cost at the reversal date. The amount of reversal is recognised in the income
statement.
(b) Assets carried at cost
If there is objective evidence (such as signifi cant adverse changes in the business environment where
the issuer operates, probability of insolvency or signifi cant fi nancial diffi culties of the issuer) that an
impairment loss is measured as the difference between the asset’s carrying amount and the present
value of estimated future cash fl ows discounted at the current market rate of return for a similar
fi nancial asset. Such impairment losses are not reversed in subsequent periods.
(c) Available-for-sale fi nancial assets
Available-for-sale fi nancial assets are fi nancial assets that are not classifi ed in any of the other
categories. After initial recognition, available-for-sale fi nancial assets are measured at fair value. Any
gains or losses from changes in fair value of the fi nancial asset are recognised directly in the fair value
adjustment reserve in equity, except that impairment losses, foreign exchange gains and losses on
monetary instruments and interest calculated using the effective interest method are recognised in the
income statement. The cumulative gain or loss previously recognised in equity is recognised in the
income statement when the fi nancial asset is derecognised.
Investments in equity instruments whose fair value cannot be reliably measured are measured at cost
less impairment loss.
2.15 Cash and cash equivalents
Cash and cash equivalents comprise cash on hand, demand deposits, and short-term, highly liquid
investments that are readily convertible to known amounts of cash and which are subject to an insignifi cant
risk of changes in value. These also include bank overdrafts that form an integral part of the Group’s cash
management.
2.16 Assets held for sale
Assets are classifi ed as held for sale if their carrying amount will be recovered primarily through sale
transactions rather than through continuing use. Upon classifi cation as held for sale, these assets are
not depreciated and are measured at the lower of carrying amount and fair value less costs to sell. Any
differences are recognised in the income statement.
53Annual Report 2008
Notes to the Financial Statements31 December 2008
2. Summary of signifi cant accounting policies (cont’d)
2.17 Development property
Development properties are properties held and developed for sale in the ordinary course of business.
Development properties are stated at the lower of cost and net realisable value. The costs are assigned
by using specifi c identifi cation. Net realisable value represents the estimated selling price less costs to be
incurred in selling the property.
Costs of properties under development include land acquisition costs, development expenditure, borrowing
costs and other related expenditure. Borrowing costs payable on loans funding a development property are
capitalised as cost of the development property until the date of its practical completion, which is taken to
be the date of issue of the Temporary Occupation Permit (“TOP”).
Revenue and costs associated with the development property are recognised as revenue and expenses
respectively, by reference to the stage of completion of the development property at the balance sheet
date, when the outcome of the construction contract can be estimated reliably. The stage of completion is
determined by reference to the proportion that contract costs incurred for work performed to date bear to
the total estimated contract costs, costs in both cases exclude land and interest costs. When the outcome
of a construction contract cannot be estimated reliably, revenue is recognised to the extent of costs incurred
that are likely to be recoverable and development costs are recognised as expense in the period which they
are incurred.
When it is probable that total development costs will exceed total revenue of the construction contract,
provision for expected loss is recognised as an expense immediately. Revenue of the construction contract
comprise the amount of revenue agreed in the contract.
The development property will be transferred to development property completed for sale when it has been
completed, the TOP has been obtained and it is available for sale.
2.18 Stocks
Stocks are stated at the lower of cost and net realisable value. Net realisable value is the estimated selling
price in the ordinary course of business less estimated costs necessary to make the sale.
Costs incurred in bringing the inventories to their present location and condition are accounted for as
follows:
- Raw materials : purchase costs on a fi rst-in-fi rst-out basis
- Finished goods and work-in-progress for manufactured products : costs of direct materials and
labour and a proportion of manufacturing overheads based on normal operating capacity. These
costs are assigned on a fi rst-in fi rst-out basis
- Finished goods for trading products : Purchase costs on a weighted average basis
Notes to the Financial Statements31 December 2008
54
2. Summary of signifi cant accounting policies (cont’d)
2.19 Provisions
Provisions are recognised when the Group has a present obligation as a result of a past event, it is probable
that an outfl ow of economic resources will be required to settle the obligation and the amount of the
obligation can be estimated reliably.
Provisions are reviewed at each balance sheet date and adjusted to refl ect the current best estimate. If it
is no longer probable that an outfl ow of economic resources will be required to settle the obligation, the
provision is reversed. If the effect of the time value of money is material, provisions are discounted using
a current pre tax rate that refl ects, where appropriate, the risks specifi c to the liability. When discounting is
used, the increase in the provision due to the passage of time is recognised as a fi nance cost.
2.20 Financial liabilities
Financial liabilities include trade creditors which are normally settled on 30-90 day terms, other creditors,
amounts due to related parties and interest-bearing loans and borrowings. Financial liabilities are recognised
on the balance sheet when, and only when, the Group becomes a party to the contractual provisions of the
fi nancial instrument.
Financial liabilities are recognised initially at fair value plus, in the case of fi nancial liabilities other than
derivatives, directly attributable transaction costs.
Subsequent to initial recognition, all fi nancial liabilities are measured at amortised cost using the effective
interest method, except for derivatives, which are measured at fair value.
A fi nancial liability is derecognised when the obligation under the liability is extinguished. For fi nancial
liabilities other than derivatives, gains and losses are recognised in the income statement when the liabilities
are derecognised, and through the amortisation process. Any gains or losses arising from changes in fair
value of derivatives are recognised in the income statement. Net gains or losses on derivatives include
exchange differences.
2.21 Financial guarantee
A fi nancial guarantee contract is a contract that requires the issuer to make specifi ed payments to reimburse
the holder for a loss it incurs because a specifi ed debtor fails to make payment when due.
Financial guarantees are recognised initially at fair value. Subsequent to initial recognition, fi nancial
guarantees are recognised as income in the income statement over the period of the guarantee. If it is
probable that the liability will be higher than the amount initially recognised less amortisation, the liability is
recorded at the higher amount with the difference charged to the income statement.
2.22 Borrowing costs
Borrowing costs are recognised in the income statement as incurred except to the extent that they are
capitalised. Borrowing costs are capitalised if they are directly attributable to the acquisition, construction
or production of a qualifying asset. Capitalisation of borrowing costs commences when the activities to
prepare the asset for its intended use or sale are in progress and the expenditures and borrowing costs are
incurred. Borrowing costs are capitalised until the assets are ready for their intended use or sale.
55Annual Report 2008
Notes to the Financial Statements31 December 2008
2. Summary of signifi cant accounting policies (cont’d)
2.23 Employee benefi ts
(a) Defi ned contribution plans
The Group participates in the national pension schemes as defi ned by the laws of the countries in
which it has operations. In particular, the Singapore companies in the Group make contributions
to the Central Provident Fund scheme in Singapore, a defi ned contribution pension scheme.
Contributions to defi ned contribution pension schemes are recognised as an expense in the period in
which the related service is performed.
(b) Employee leave entitlement
Employee entitlements to annual leave are recognised as a liability when they accrue to the
employees. The estimated liability for leave is recognised for services rendered by employees up to
balance sheet date.
(c) Employee share option plans
Employees of the Group receive remuneration in the form of share options as consideration for
services rendered. The cost of these equity-settled transactions with employees is measured by
reference to the fair value of the options at the date on which the share options are granted. This cost
is recognised in the income statement, with a corresponding increase in the employee share option
reserve, over the vesting period. The cumulative expense recognised at each reporting date until the
vesting date refl ects the extent to which the vesting period has expired and the Group’s best estimate
of the number of options that will ultimately vest. The charge or credit to the income statement for a
period represents the movement in cumulative expense recognised as at the beginning and end of
that period.
No expense is recognised for options that do not ultimately vest, except for options where vesting is
conditional upon a market condition, which are treated as irrespective of whether or not the market
condition is satisfi ed, provided that all other performance conditions are satisfi ed. The employee share
option reserve is transferred to capital reserve upon expiry of the options. When the options are
exercised, the employee share option reserve is transferred to share capital if new shares are issued.
2.24 Leases
Finance leases, which transfer to the Group substantially all the risks and rewards incidental to ownership of
the leased item, are capitalised at the inception of the lease at the fair value of the leased asset or, if lower,
at the present value of the minimum lease payments. Any initial direct costs are also added to the amount
capitalised. Lease payments are apportioned between the fi nance charges and reduction of the lease liability
so as to achieve a constant rate of interest on the remaining balance of the liability. Finance charges are
charged to the income statement.
Capitalised leased assets are depreciated over the shorter of the estimated useful life of the asset and the
lease term, if there is no reasonable certainty that the Group will obtain ownership by the end of the lease
term.
Operating lease payments are recognised as an expense in the income statement on a straight-line basis
over the lease term. The aggregate benefi t of incentives provided by the lessor is recognised as a reduction
of rental expense over the lease term on a straight-line basis.
Notes to the Financial Statements31 December 2008
56
2. Summary of signifi cant accounting policies (cont’d)
2.25 Revenue
Revenue is recognised to the extent that it is probable that the economic benefi ts will fl ow to the Group and
the revenue can be reliably measured. Revenue is measured at the fair value of consideration received or
receivable. The following specifi c recognition criteria must also be met before revenue is recognised :
Revenue from the sale of manufactured products and equipment is recognised upon the transfer of
signifi cant risk and rewards of ownership of the goods to the customer which generally coincides with
their delivery and acceptance.
Revenue from the provision of management services is recognised when the services are rendered
(unless is in doubt).
Dividend income is recognised when the Group’s right to receive the payment is established.
Interest income is recognised using the effective interest method.
For development properties, it is recognised by reference to the stage of completion at the balance
sheet date as stated in Note 2.17.
Rental income arising on welding machines and equipment is accounted for on a straight-line basis
over the lease terms.
2.26 Income taxes
(a) Current tax
Current tax assets and liabilities are measured at the amount expected to be recovered from or paid
to the taxation authorities. The tax rates and tax laws used to compute the amount are those that are
enacted or substantively enacted by the balance sheet date.
Current taxes are recognised in the income statement except that the tax relating to items recognised
directly in equity is recognised directly in equity.
(b) Deferred tax
Deferred income tax is provided using the liability method on temporary differences at the balance
sheet date between the tax bases of assets and liabilities and their carrying amounts for fi nancial
reporting purposes.
Deferred tax assets and liabilities are recognised for all taxable temporary differences, except:
Where the deferred tax arises from the initial recognition of an asset or liability in a transaction
that is not a business combination and, at the time of the transaction, affects neither the
accounting profi t nor taxable profi t or loss;
In respect of taxable temporary differences associated with investments in subsidiary
companies, associates and interests in joint venture, where the timing of the reversal of the
temporary differences can be controlled by the Group and it is probable that the temporary
differences will not reverse in the foreseeable future; and
57Annual Report 2008
Notes to the Financial Statements31 December 2008
2. Summary of signifi cant accounting policies (cont’d)
2.26 Income taxes (cont’d)
(b) Deferred tax (cont’d)
In respect of deductible temporary differences and carry forward of unused tax credits and
unused tax losses, if it is not probable that taxable profi t will be available against which the
deductible temporary differences and carry-forward of unused tax credits and unused tax
losses can be utilised.
The carrying amount of deferred tax assets is reviewed at each balance sheet date and reduced to
the extent that it is no longer probable that suffi cient taxable profi t will be available to allow all or part
of the deferred tax asset to be utilised. Unrecognised deferred tax assets are reassessed at each
balance sheet date and are recognised to the extent that it has become probable that future taxable
profi t will allow the deferred tax asset to be utilised.
Deferred tax assets and liabilities are measured at the tax rates that are expected to apply to the year
when the asset is realised or the liability is settled, based on tax rates and tax laws that have been
enacted or substantively enacted at the balance sheet date.
Deferred taxes are recognised in the income statement except that deferred tax relating to items
recognised directly in equity is recognised directly in equity and deferred tax arising from a business
combination is adjusted against goodwill on acquisition.
(c) Sales tax
Revenues, expenses and assets are recognised net of the amount of sales tax except:
Where the sales tax incurred in a purchase of assets or services is not recoverable from the
taxation authority, in which case the sales tax is recognised as part of the cost of acquisition of
the asset or as part of the expense item as applicable; and
Receivables and payables that are stated with the amount of sales tax included.
The net amount of sales tax recoverable from, or payable to, the taxation authority is included as part
of receivables or payables in the balance sheet.
2.27 Segment reporting
A business segment is a distinguishable component of the Group that is engaged in providing products or
services that are subject to risks and returns that are different from those of other business segments. A
geographical segment is a distinguishable component of the Group that is engaged in providing products
within a particular economic environment and that is subject to risks and returns that are different from
those of components operating in other economic environments.
2.28 Share capital and share issue expenses
Proceeds from issuance of ordinary shares are recognised as share capital in equity. Incremental costs
directly attributable to the issuance of ordinary shares are deducted against share capital.
Notes to the Financial Statements31 December 2008
58
2. Summary of signifi cant accounting policies (cont’d)
2.29 Treasury shares
When shares recognised as equity are reacquired, the amount of consideration paid is recognised directly
in equity. Reacquired shares are classifi ed as treasury shares and presented as a deduction from total
equity. No gain or loss is recognised in the income statement on the purchase, sale, issue or cancellation of
treasury shares.
2.30 Contingencies
A contingent liability or asset is a possible obligation that arises from past events and whose existence
will be confi rmed only by the occurrence or non-occurrence of uncertain future event not wholly within the
control of the Group.
Contingent liabilities and assets are not recognised on the balance sheet of the Group.
3. Signifi cant accounting judgements and estimates
The preparation of the Group’s fi nancial statement requires management to make judgements, estimates
and assumptions that affect the reported amounts of revenues, expenses, assets and liabilities, and the
disclosure of contingent liabilities at the reporting date. However, uncertainty about these assumptions and
estimates could result in outcomes that could require a material adjustment to the carrying amount of the
asset or liability affected in the future.
3.1 Key sources of estimation uncertainty
The key assumptions concerning the future and other key sources of estimation uncertainty at the balance
sheet date, that have a signifi cant risk of causing a material adjustment to the carrying amounts of assets
and liabilities within the next fi nancial year are discussed below.
(i) Useful lives of property, plant and equipment
The cost of property, plant and equipment for welding and other industrial applications, as well as
for property development and investment, is depreciated on a straight-line basis over the assets’
useful lives. Management estimates the useful lives of these property, plant and equipment to
be within 6 months to 73½ years. These are common life expectancies applied in the relevant
industry. The carrying amount of the Group’s property, plant and equipment at 31 December 2008
was $48,010,000 (2007: $9,492,000). Changes in the expected level of usage and technological
developments could impact the economic useful lives and the residual values of these assets,
therefore future depreciation charges could be revised.
(ii) Provision for foreseeable losses of development property
In estimating the foreseeable losses, management makes reference to information such as (i) current
quotes from sub-contractors and suppliers, (ii) recent quotes agreed with sub-contractors and
suppliers, and (iii) estimates of construction and material costs and (iv) stages of completion of the
contracts. No provision for foreseeable losses of development property were made as at year end.
59Annual Report 2008
Notes to the Financial Statements31 December 2008
3. Signifi cant accounting judgements and estimates (cont’d)
3.1 Key sources of estimation uncertainty (cont’d)
(iii) Impairment of non-fi nancial assets
The Group assesses whether there are any indicators of impairment for all non-fi nancial assets at
each reporting date. Goodwill and other indefi nite life intangibles are tested for impairment annually
and at other times when such indicators exist. Other than intangibles, stocks are valued at the lower
of cost and net realisable value. Net realisable value is the estimated selling price in the ordinary
course of business less estimated costs necessary to make the sale. Other non-fi nancial assets are
tested for impairment when there are indicators that the carrying amounts may not be recoverable.
When value in use calculations are undertaken, management must estimate the expected future
cash fl ows from the asset or cash-generating unit and choose a suitable discount rate in order to
calculate the present value of those cash fl ows. Further details of the key assumptions are given in
the respective notes to the fi nancial statements.
(iv) Impairment of loans and receivables
The Group assesses at each balance sheet date whether there is any objective evidence that a
fi nancial asset is impaired. To determine whether there is objective evidence of impairment, the Group
considers factors such as the probability of insolvency or signifi cant fi nancial diffi culties of the debtor
and default or signifi cant delay in payments.
Where there is objective evidence of impairment, the amount and timing of future cash fl ows are
estimated based on historical loss experience for assets with similar credit risk characteristics.
The carrying amount of the Group’s loans and receivables at the balance sheet date is disclosed in
Note 40 to the fi nancial statements.
(v) Employee share options
The Group measures the cost of equity-settled transactions with employees by reference to the fair
value of the employee share options at the date at which they are granted. Judgement is required in
determining the most appropriate valuation model for the share options granted, depending on the
terms and conditions of the grant. Management are also required to use judgement in determining
the most appropriate inputs to the valuation model including expected life of the option, volatility and
dividend yield. The assumptions and model used are disclosed in Note 35.
Notes to the Financial Statements31 December 2008
60
3. Signifi cant accounting judgements and estimates (cont’d)
3.2 Judgements made in applying accounting policies
In the process of applying the Group’s accounting policies, management has made the following
judgements, apart from those involving estimations, which has the most signifi cant effect on the amounts
recognised in the fi nancial statements:
(i) Revenue recognition
The stage of completion of its development property is measured by reference to the proportion
that contract costs incurred for work performed to date bear to the estimated total contract costs.
Signifi cant assumptions are required to estimate the total contract costs and the recoverable variation
works that will affect the stage of completion. The estimates are made based on past experience
and knowledge of the project engineers. Where the fi nal cost incurred by the Group is different from
the amounts that were initially estimated, such differences will impact the revenue recognised in the
period in which such determination is made. The carrying amounts of assets and liabilities arising
from development property are disclosed in Note 19 to the fi nancial statements.
(ii) Income taxes
The Group has exposure to income taxes in numerous jurisdictions. Signifi cant judgement is
involved in determining the Group-wide provision for income taxes. There are certain transactions
and computations for which the ultimate tax determination is uncertain during the ordinary course
of business. The Group recognises liabilities for expected tax issues based on estimates of whether
additional taxes will be due. Where the fi nal tax outcome of these matters is different from the
amounts that were initially recognised, such differences will impact the income tax and deferred tax
provisions in the period in which such determination is made. The carrying amount of the Group’s
tax payables and deferred taxation at 31 December 2008 was $2,230,000 (2007: $2,683,000) and
$5,731,000 (2007: $404,000) respectively.
4. Turnover
Group2008 2007$’000 $’000
Sale of goods 139,707 99,237
Revenue recognised from development property 15,795 –
Revenue from development property completed for sale – 3,445
Others 1,737 210
157,239 102,892
61Annual Report 2008
Notes to the Financial Statements31 December 2008
5. Other income/costs
Group2008 2007$’000 $’000
Other income included the following :
Interest income 340 117
Administrative fees charged to an associated company 197 –
Gain on disposal of assets held for sale 453 –
Gain on disposal of property, plant and equipment 158 –
Gain on disposal of a subsidiary company 7 –
Rental of machineries 250 659
Repair and servicing 149 131
Sale of water treatment products – 205
Sales rebates 446 –
Commission income – 25
Group2008 2007$’000 $’000
Other costs included the following :
Amortisation of intangible assets 102 –
Allowance for stocks obsolescence 512 253
Stocks written off 216 19
Write off of property, plant and equipment 12 3
Allowance for doubtful debts (trade) 1,249 25
(Write back)/allowance for doubtful debts (other) (2) 107
Allowance for doubtful debts (associated company) 1,659 1,819
Bad debts written (back)/off (7) 163
Loss on disposal of property, plant and equipment – 147
Gain on disposal of other investment – (88)
Loss on disposal of intangible assets 4 22
Loss/(gain) on fair value change of assets held at fair value through
profi t and loss 83 (83)
Fair value losses on derivatives – unrealised 747 –
Fair value gains on derivatives – unrealised (4) –
Fair value gains on derivatives – realised (55) –
Fair value losses on derivatives – realised 9 –
Impairment loss in investment in associated company – 418
Impairment loss in intangible assets – 13
Impairment loss in property, plant and equipment – 705
Impairment loss in assets held for sale – 12
Notes to the Financial Statements31 December 2008
62
6. Profi t from operating activities
Group2008 2007$’000 $’000
Profi t from operating activities is stated after
charging/(crediting) the following:
Depreciation of property, plant and equipment 2,849 1,491
Salaries and related costs 15,147 10,047
Defi ned contributions schemes 1,494 691
Foreign currency exchange (gains)/losses
- realised (57) (803)
- unrealised 463 502
Expenses on share-based payment 823 214
Rental expense 836 553
Non-audit fees paid to auditors of the Company 30 –
7. Finance costs
Group2008 2007$’000 $’000
Interest expense :
- bank overdrafts 24 62
- hire purchase interest 121 32
- trust receipts 460 513
- term loans 518 330
- others 15 –
1,138 937
63Annual Report 2008
Notes to the Financial Statements31 December 2008
8. Taxation
Major components of income tax expense
The major components of income tax expense for the years ended 31 December 2008 and 2007 are:
Group2008 2007$’000 $’000
Income statement:
- current taxation 2,297 2,539
- deferred taxation 1,152 (451)
3,449 2,088
(Over)/under provision of prior years’
- current taxation (217) 45
- deferred taxation (14) –
(231) 45
Income tax expense recognised in the income statement 3,218 2,133
Relationship between tax expense and accounting profi t
The reconciliation between the tax expense and the product of accounting profi t multiplied by the applicable
corporate tax rate for years ended 31 December are as follows :
Group2008 2007$’000 $’000
Profi t before taxation 16,800 8,736
Tax at domestic rates applicable to profi ts in the countries where the Group
operates 3,689 1,591
Adjustments:
Non-deductible expenses 206 583
Income not subject to taxation (14) (63)
Utilisation of tax losses and capital allowances brought
forward (185) (44)
Tax rebate (257) (145)
Deferred tax asset not recognised 78 142
Reinvestment allowance (42) –
Others (26) 24
3,449 2,088
(Over)/under provision in respect of previous year (231) 45
Income tax expense recognised in the income statement 3,218 2,133
Notes to the Financial Statements31 December 2008
64
8. Taxation (cont’d)
At 31 December 2008, the Group has unutilised tax losses and unabsorbed capital allowances of
approximately $5,788,000 and $418,000, respectively (2007 : $7,106,000 and $6,000 respectively), which
are available for set off against future taxable income subject to the respective local tax provisions and
regulations. No deferred tax asset is recognised in the fi nancial statement for these unutilised tax losses
due to uncertainty of its recoverability.
The corporate income tax rate applicable to Singapore companies of the Group was reduced to 18% for the
year of assessment 2008 from 20% for year of assessment 2007. Subsequent to year-end, the corporate
income tax rate was further reduced to 17% for the year of assessment 2009 onwards. The corporate
income tax rate applicable to Malaysian companies of the Group was reduced from 28% to 27% and 26%
for the year of assessment 2007 and the year of assessment 2008 respectively. This was further reduced
to 25% for the year of assessment 2009 onwards.
The above reconciliation is prepared by aggregating separate reconciliations for each national jurisdiction.
9. Basic and diluted earnings per share
Basic earnings per share amounts are calculated by dividing profi t for the year attributable to ordinary equity
holders of the parent by the weighted average number of ordinary shares outstanding during the fi nancial
year.
Diluted earnings per share amounts are calculated by dividing profi t for the year attributable to ordinary
equity holders of the parent by the weighted average number of ordinary shares outstanding during the year
plus the weighted average number of ordinary shares that would be issued on the conversion of all dilutive
potential ordinary shares into ordinary shares.
The following tables refl ect the profi t and loss and share data used in the computation of basic and diluted
earnings per share for the years ended 31 December:
Group
2008 2007
$’000 $’000
Profi t net of tax attributable to ordinary equity holders for
basic and diluted earnings per share 10,385 6,549
2008 2007
’000 ’000
Weighted average number of ordinary shares on issue
applicable to basic earnings per share 171,724 145,337
Effects of dilution :
- Share options 1,787 2,388
- Bonus warrants 2,706 15,734
Adjusted weighted average number of ordinary shares
applicable to diluted earnings per share 176,217 163,459
65Annual Report 2008
Notes to the Financial Statements31 December 2008
9. Basic and diluted earnings per share (cont’d)
3,855,000 (2007: 5,180,000) of share options granted to employees under the existing employee share
option plans have not been included in the calculation of diluted earnings per share because they are anti-
dilutive for the current and previous fi nancial years presented.
Since the end of the fi nancial year, employees have exercised the options to acquire 843,000 (2007:
6,062,000) ordinary shares. There have been no other transactions involving ordinary shares or potential
ordinary shares since the reporting date and before the completion of these fi nancial statements.
10. Property, plant and equipment
Freehold land
Freehold property
Leasehold properties
Plant and machinery
Other assets Total
$’000 $’000 $’000 $’000 $’000 $’000
Group
Cost or valuation
Balance at 1 January 2007 -
Valuation – – 4,500 – – 4,500
Cost – – 10,508 6,264 2,298 19,070
– – 15,008 6,264 2,298 23,570
Additions – – – 135 269 404
Impairment loss – – – (705) – (705)
Disposals – – – (2,644) (117) (2,761)
Transferred to assets held
for sale (Note 18) – – – (1,659) (481) (2,140)
Balance at 31 December
2007 – – 15,008 1,391 1,969 18,368
Balance at 1 January 2008 -
Valuation – – 4,500 – – 4,500
Cost – – 10,508 1,391 1,969 13,868
– – 15,008 1,391 1,969 18,368
Additions – – 912 1,770 2,841 5,523
Disposals – (14) – (515) (1,339) (1,868)
Write off – – – (26) (32) (58)
Acquisition of subsidiaries 1,928 2,309 5,136 33,117 20,130 62,620
Exchange differences (18) (22) (181) (454) (130) (805)
Balance at 31 December
2008 1,910 2,273 20,875 35,283 23,439 83,780
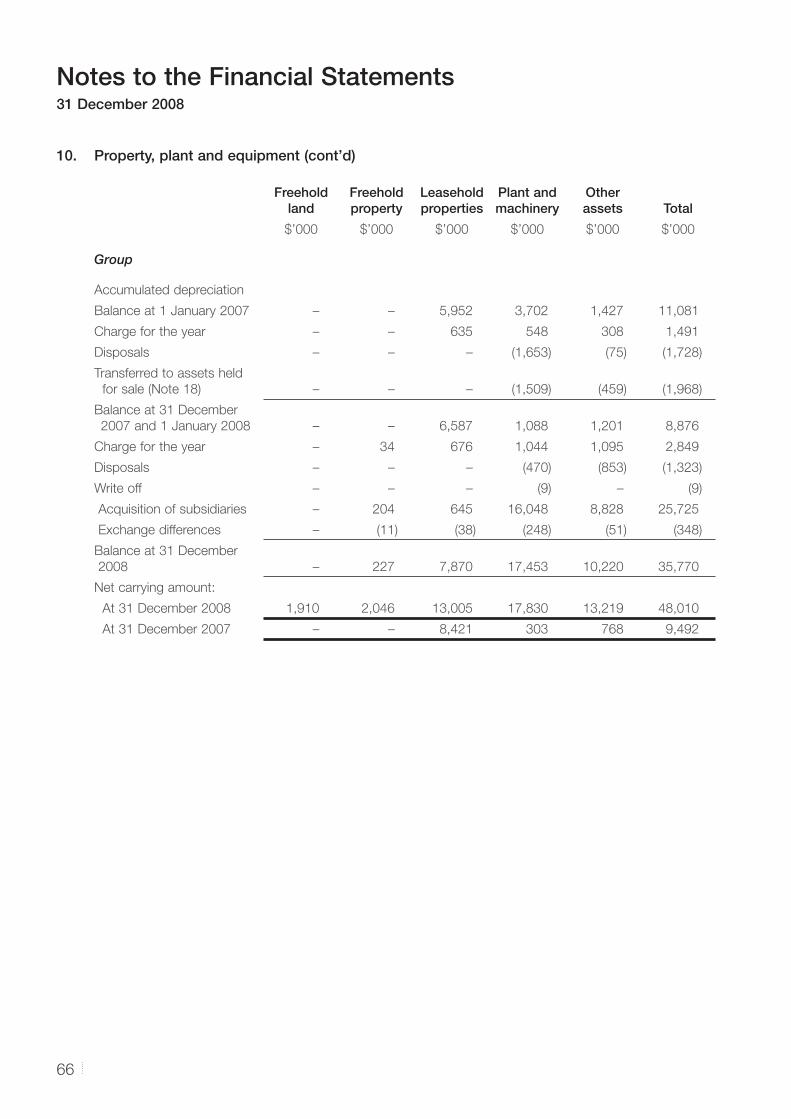
Notes to the Financial Statements31 December 2008
66
10. Property, plant and equipment (cont’d)
Freehold land
Freehold property
Leasehold properties
Plant and machinery
Other assets Total
$’000 $’000 $’000 $’000 $’000 $’000
Group
Accumulated depreciation
Balance at 1 January 2007 – – 5,952 3,702 1,427 11,081
Charge for the year – – 635 548 308 1,491
Disposals – – – (1,653) (75) (1,728)
Transferred to assets held
for sale (Note 18) – – – (1,509) (459) (1,968)
Balance at 31 December
2007 and 1 January 2008 – – 6,587 1,088 1,201 8,876
Charge for the year – 34 676 1,044 1,095 2,849
Disposals – – – (470) (853) (1,323)
Write off – – – (9) – (9)
Acquisition of subsidiaries – 204 645 16,048 8,828 25,725
Exchange differences – (11) (38) (248) (51) (348)
Balance at 31 December
2008 – 227 7,870 17,453 10,220 35,770
Net carrying amount:
At 31 December 2008 1,910 2,046 13,005 17,830 13,219 48,010
At 31 December 2007 – – 8,421 303 768 9,492
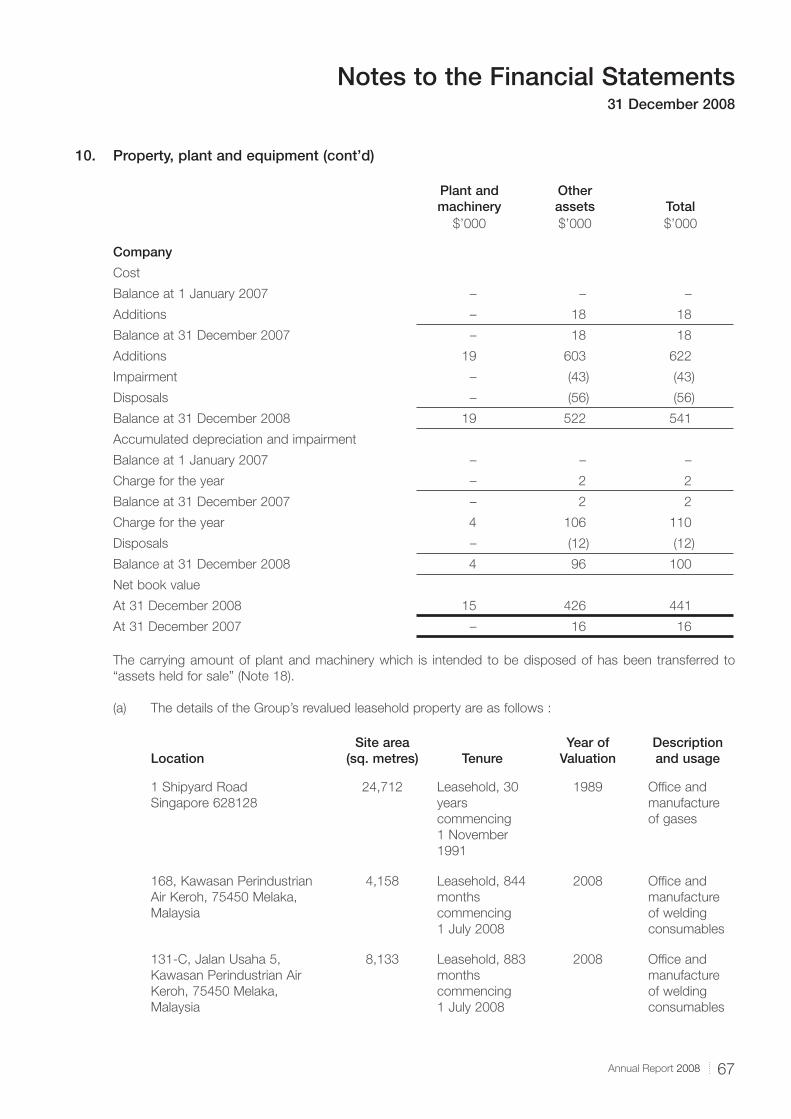
67Annual Report 2008
Notes to the Financial Statements31 December 2008
10. Property, plant and equipment (cont’d)
Plant and machinery
Other assets Total
$’000 $’000 $’000
Company
Cost
Balance at 1 January 2007 – – –
Additions – 18 18
Balance at 31 December 2007 – 18 18
Additions 19 603 622
Impairment – (43) (43)
Disposals – (56) (56)
Balance at 31 December 2008 19 522 541
Accumulated depreciation and impairment
Balance at 1 January 2007 – – –
Charge for the year – 2 2
Balance at 31 December 2007 – 2 2
Charge for the year 4 106 110
Disposals – (12) (12)
Balance at 31 December 2008 4 96 100
Net book value
At 31 December 2008 15 426 441
At 31 December 2007 – 16 16
The carrying amount of plant and machinery which is intended to be disposed of has been transferred to
“assets held for sale” (Note 18).
(a) The details of the Group’s revalued leasehold property are as follows :
LocationSite area
(sq. metres) TenureYear of
ValuationDescription and usage
1 Shipyard Road
Singapore 628128
24,712 Leasehold, 30
years
commencing
1 November
1991
1989 Offi ce and
manufacture
of gases
168, Kawasan Perindustrian
Air Keroh, 75450 Melaka,
Malaysia
4,158 Leasehold, 844
months
commencing
1 July 2008
2008 Offi ce and
manufacture
of welding
consumables
131-C, Jalan Usaha 5,
Kawasan Perindustrian Air
Keroh, 75450 Melaka,
Malaysia
8,133 Leasehold, 883
months
commencing
1 July 2008
2008 Offi ce and
manufacture
of welding
consumables
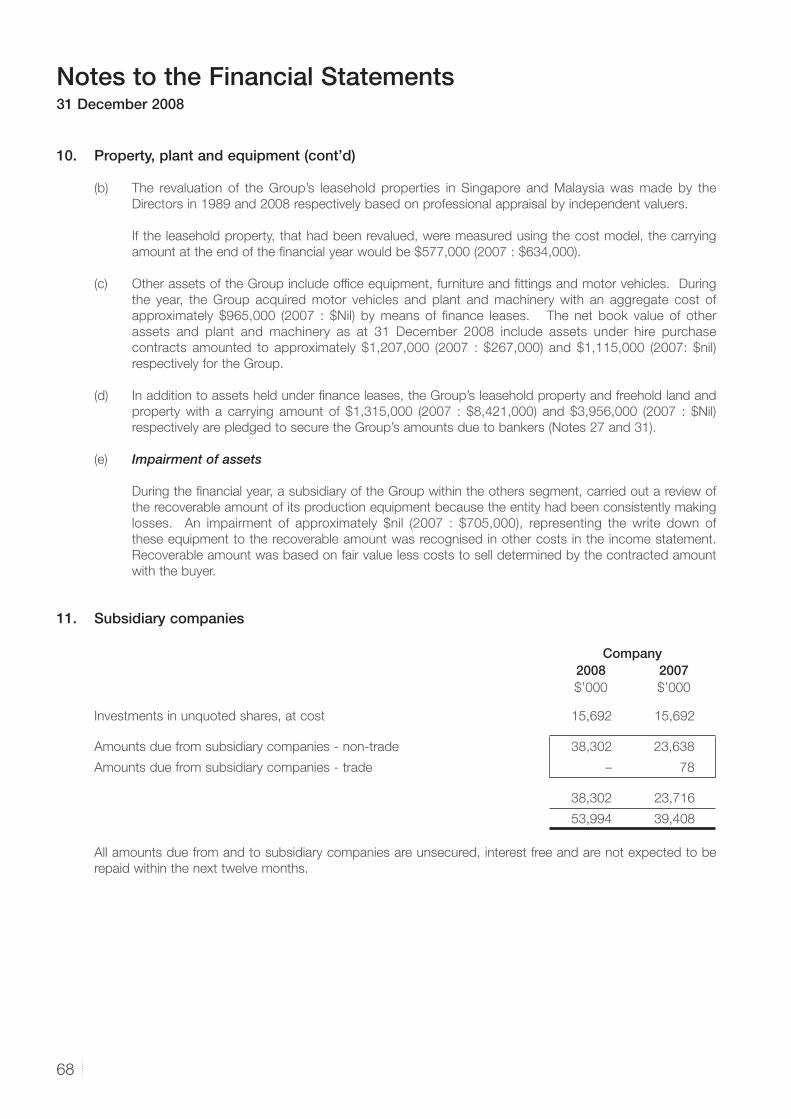
Notes to the Financial Statements31 December 2008
68
10. Property, plant and equipment (cont’d)
(b) The revaluation of the Group’s leasehold properties in Singapore and Malaysia was made by the
Directors in 1989 and 2008 respectively based on professional appraisal by independent valuers.
If the leasehold property, that had been revalued, were measured using the cost model, the carrying
amount at the end of the fi nancial year would be $577,000 (2007 : $634,000).
(c) Other assets of the Group include offi ce equipment, furniture and fi ttings and motor vehicles. During
the year, the Group acquired motor vehicles and plant and machinery with an aggregate cost of
approximately $965,000 (2007 : $Nil) by means of fi nance leases. The net book value of other
assets and plant and machinery as at 31 December 2008 include assets under hire purchase
contracts amounted to approximately $1,207,000 (2007 : $267,000) and $1,115,000 (2007: $nil)
respectively for the Group.
(d) In addition to assets held under fi nance leases, the Group’s leasehold property and freehold land and
property with a carrying amount of $1,315,000 (2007 : $8,421,000) and $3,956,000 (2007 : $Nil)
respectively are pledged to secure the Group’s amounts due to bankers (Notes 27 and 31).
(e) Impairment of assets
During the fi nancial year, a subsidiary of the Group within the others segment, carried out a review of
the recoverable amount of its production equipment because the entity had been consistently making
losses. An impairment of approximately $nil (2007 : $705,000), representing the write down of
these equipment to the recoverable amount was recognised in other costs in the income statement.
Recoverable amount was based on fair value less costs to sell determined by the contracted amount
with the buyer.
11. Subsidiary companies
Company2008 2007$’000 $’000
Investments in unquoted shares, at cost 15,692 15,692
Amounts due from subsidiary companies - non-trade 38,302 23,638
Amounts due from subsidiary companies - trade – 78
38,302 23,716
53,994 39,408
All amounts due from and to subsidiary companies are unsecured, interest free and are not expected to be
repaid within the next twelve months.
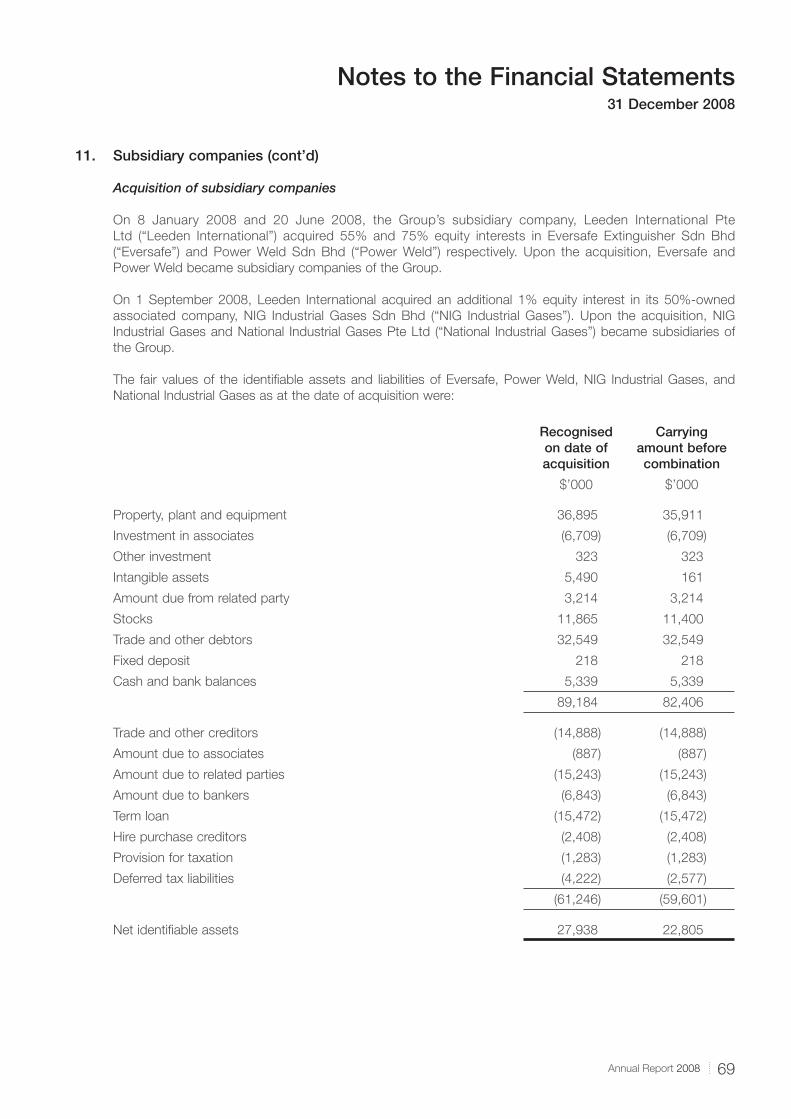
69Annual Report 2008
Notes to the Financial Statements31 December 2008
11. Subsidiary companies (cont’d)
Acquisition of subsidiary companies
On 8 January 2008 and 20 June 2008, the Group’s subsidiary company, Leeden International Pte
Ltd (“Leeden International”) acquired 55% and 75% equity interests in Eversafe Extinguisher Sdn Bhd
(“Eversafe”) and Power Weld Sdn Bhd (“Power Weld”) respectively. Upon the acquisition, Eversafe and
Power Weld became subsidiary companies of the Group.
On 1 September 2008, Leeden International acquired an additional 1% equity interest in its 50%-owned
associated company, NIG Industrial Gases Sdn Bhd (“NIG Industrial Gases”). Upon the acquisition, NIG
Industrial Gases and National Industrial Gases Pte Ltd (“National Industrial Gases”) became subsidiaries of
the Group.
The fair values of the identifi able assets and liabilities of Eversafe, Power Weld, NIG Industrial Gases, and
National Industrial Gases as at the date of acquisition were:
Recognised on date of acquisition
Carrying amount before combination
$’000 $’000
Property, plant and equipment 36,895 35,911
Investment in associates (6,709) (6,709)
Other investment 323 323
Intangible assets 5,490 161
Amount due from related party 3,214 3,214
Stocks 11,865 11,400
Trade and other debtors 32,549 32,549
Fixed deposit 218 218
Cash and bank balances 5,339 5,339
89,184 82,406
Trade and other creditors (14,888) (14,888)
Amount due to associates (887) (887)
Amount due to related parties (15,243) (15,243)
Amount due to bankers (6,843) (6,843)
Term loan (15,472) (15,472)
Hire purchase creditors (2,408) (2,408)
Provision for taxation (1,283) (1,283)
Deferred tax liabilities (4,222) (2,577)
(61,246) (59,601)
Net identifi able assets 27,938 22,805
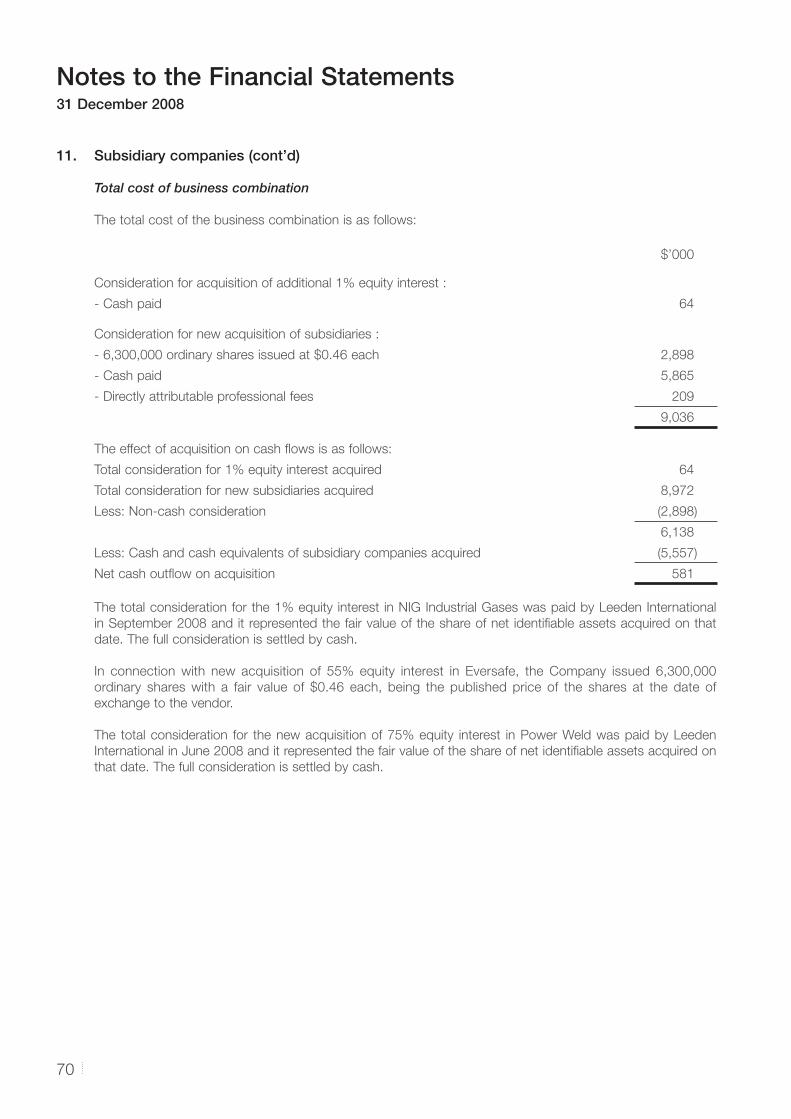
Notes to the Financial Statements31 December 2008
70
11. Subsidiary companies (cont’d)
Total cost of business combination
The total cost of the business combination is as follows:
$’000
Consideration for acquisition of additional 1% equity interest :
- Cash paid 64
Consideration for new acquisition of subsidiaries :
- 6,300,000 ordinary shares issued at $0.46 each 2,898
- Cash paid 5,865
- Directly attributable professional fees 209
9,036
The effect of acquisition on cash fl ows is as follows:
Total consideration for 1% equity interest acquired 64
Total consideration for new subsidiaries acquired 8,972
Less: Non-cash consideration (2,898)
6,138
Less: Cash and cash equivalents of subsidiary companies acquired (5,557)
Net cash outfl ow on acquisition 581
The total consideration for the 1% equity interest in NIG Industrial Gases was paid by Leeden International
in September 2008 and it represented the fair value of the share of net identifi able assets acquired on that
date. The full consideration is settled by cash.
In connection with new acquisition of 55% equity interest in Eversafe, the Company issued 6,300,000
ordinary shares with a fair value of $0.46 each, being the published price of the shares at the date of
exchange to the vendor.
The total consideration for the new acquisition of 75% equity interest in Power Weld was paid by Leeden
International in June 2008 and it represented the fair value of the share of net identifi able assets acquired on
that date. The full consideration is settled by cash.
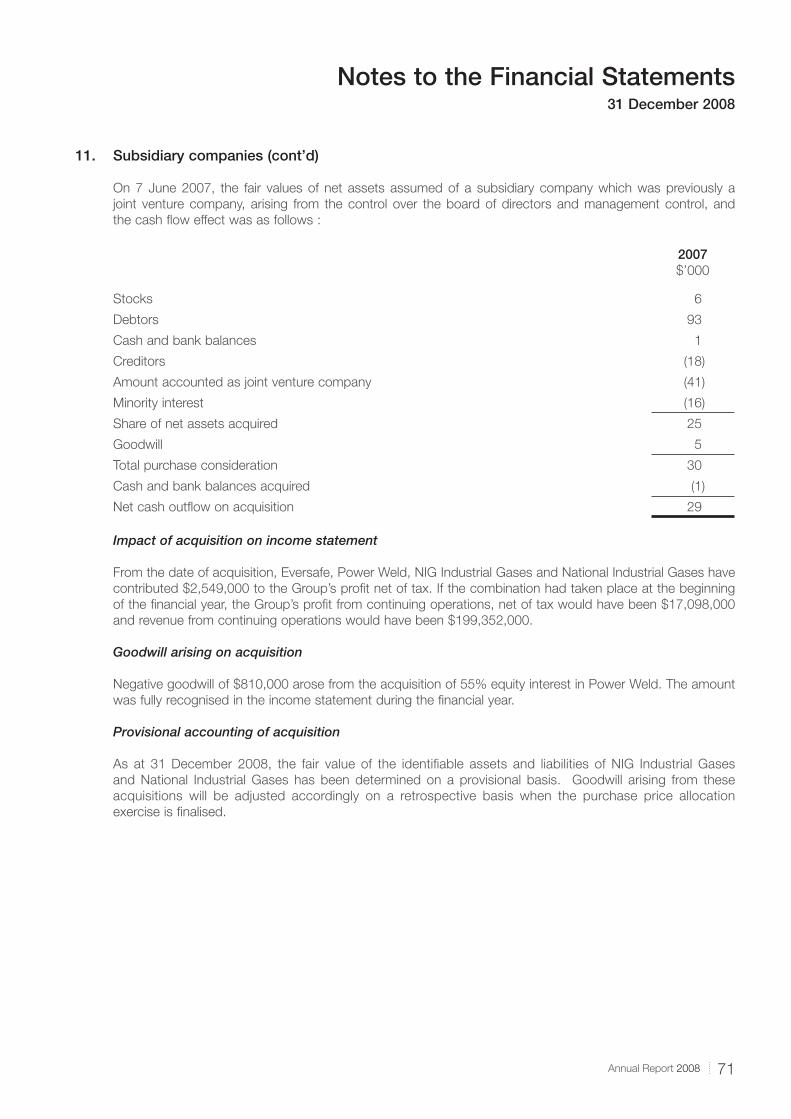
71Annual Report 2008
Notes to the Financial Statements31 December 2008
11. Subsidiary companies (cont’d)
On 7 June 2007, the fair values of net assets assumed of a subsidiary company which was previously a
joint venture company, arising from the control over the board of directors and management control, and
the cash fl ow effect was as follows :
2007$’000
Stocks 6
Debtors 93
Cash and bank balances 1
Creditors (18)
Amount accounted as joint venture company (41)
Minority interest (16)
Share of net assets acquired 25
Goodwill 5
Total purchase consideration 30
Cash and bank balances acquired (1)
Net cash outfl ow on acquisition 29
Impact of acquisition on income statement
From the date of acquisition, Eversafe, Power Weld, NIG Industrial Gases and National Industrial Gases have
contributed $2,549,000 to the Group’s profi t net of tax. If the combination had taken place at the beginning
of the fi nancial year, the Group’s profi t from continuing operations, net of tax would have been $17,098,000
and revenue from continuing operations would have been $199,352,000.
Goodwill arising on acquisition
Negative goodwill of $810,000 arose from the acquisition of 55% equity interest in Power Weld. The amount
was fully recognised in the income statement during the fi nancial year.
Provisional accounting of acquisition
As at 31 December 2008, the fair value of the identifi able assets and liabilities of NIG Industrial Gases
and National Industrial Gases has been determined on a provisional basis. Goodwill arising from these
acquisitions will be adjusted accordingly on a retrospective basis when the purchase price allocation
exercise is fi nalised.
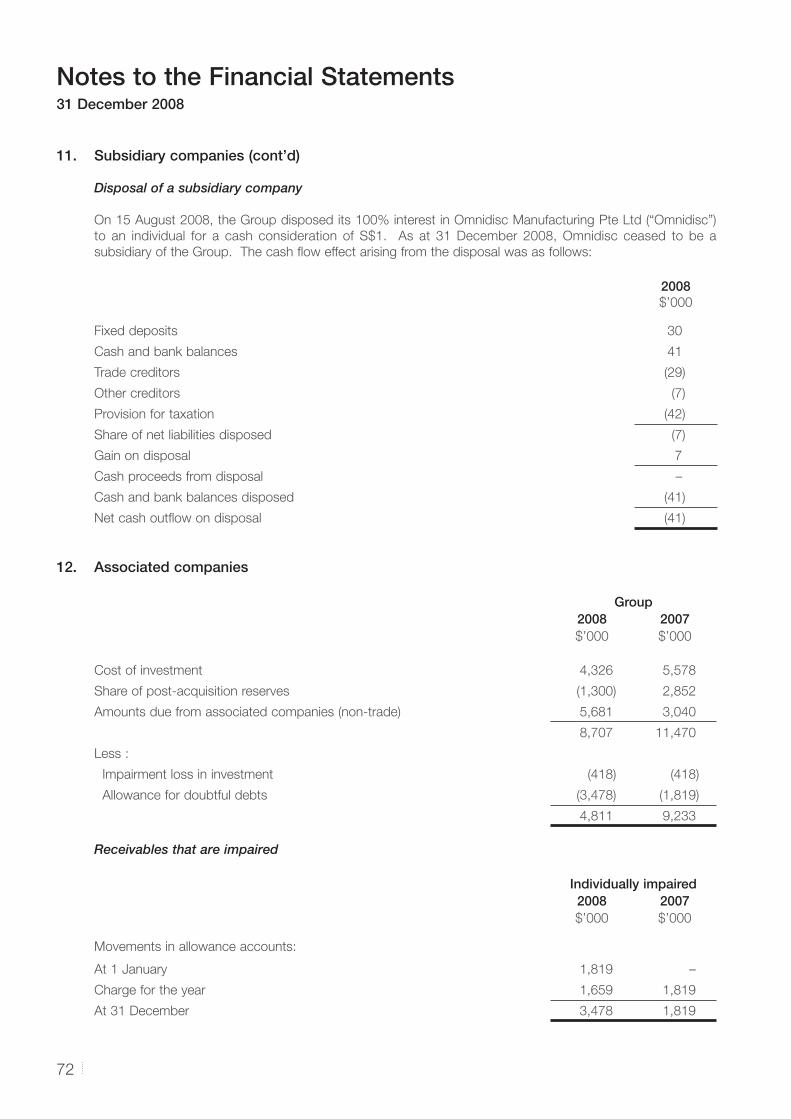
Notes to the Financial Statements31 December 2008
72
11. Subsidiary companies (cont’d)
Disposal of a subsidiary company
On 15 August 2008, the Group disposed its 100% interest in Omnidisc Manufacturing Pte Ltd (“Omnidisc”)
to an individual for a cash consideration of S$1. As at 31 December 2008, Omnidisc ceased to be a
subsidiary of the Group. The cash fl ow effect arising from the disposal was as follows:
2008$’000
Fixed deposits 30
Cash and bank balances 41
Trade creditors (29)
Other creditors (7)
Provision for taxation (42)
Share of net liabilities disposed (7)
Gain on disposal 7
Cash proceeds from disposal –
Cash and bank balances disposed (41)
Net cash outfl ow on disposal (41)
12. Associated companies
Group2008 2007$’000 $’000
Cost of investment 4,326 5,578
Share of post-acquisition reserves (1,300) 2,852
Amounts due from associated companies (non-trade) 5,681 3,040
8,707 11,470
Less :
Impairment loss in investment (418) (418)
Allowance for doubtful debts (3,478) (1,819)
4,811 9,233
Receivables that are impaired
Individually impaired2008 2007$’000 $’000
Movements in allowance accounts:
At 1 January 1,819 –
Charge for the year 1,659 1,819
At 31 December 3,478 1,819
73Annual Report 2008
Notes to the Financial Statements31 December 2008
12. Associated companies (cont’d)
The amounts due from associated companies are unsecured, interest-free and are not expected to be
repaid within the next twelve months.
During the fi nancial year, the Group carried out a review of the discounted cashfl ows of an associated
company that had been making losses. An impairment loss of $nil (2007 : $418,000), representing the
write-down of this investment to the recoverable amount was recognised in other costs of the income
statement.
On 1 September 2008, the Group’s subsidiary company, Leeden International acquired an additional 1%
equity interest in its 50%-owned associated company, NIG Industrial Gases Sdn Bhd (“NIG Industrial
Gases”). Upon the acquisition, NIG Industrial Gases and National Industrial Gases Pte Ltd (“National
Industrial Gases”) became subsidiaries of the Group.
The Group has not recognised losses relating to Bondfl ex Private Limited where its share of losses exceeds
the Group’s interest in this associate. The Group’s cumulative share of unrecognised losses at the balance
sheet date was approximately $323,000 (2007 : $Nil). The Group has no obligation in respect of these
losses.
The summarised fi nancial information of the associated companies, not adjusted for the proportion of
ownership interest held by the Group is as follows:
Group2008 2007$’000 $’000
Assets and liabilities :
Current assets 15,807 33,118
Non-current assets 24,355 47,852
Total assets 40,162 80,970
Non-current liabilities (4,642) (18,996)
Current liabilities (24,192) (37,851)
Total liabilities (28,834) (56,847)
Results :
Revenue 19,205 51,757
(Loss)/profi t for the year (1,076) 1,597
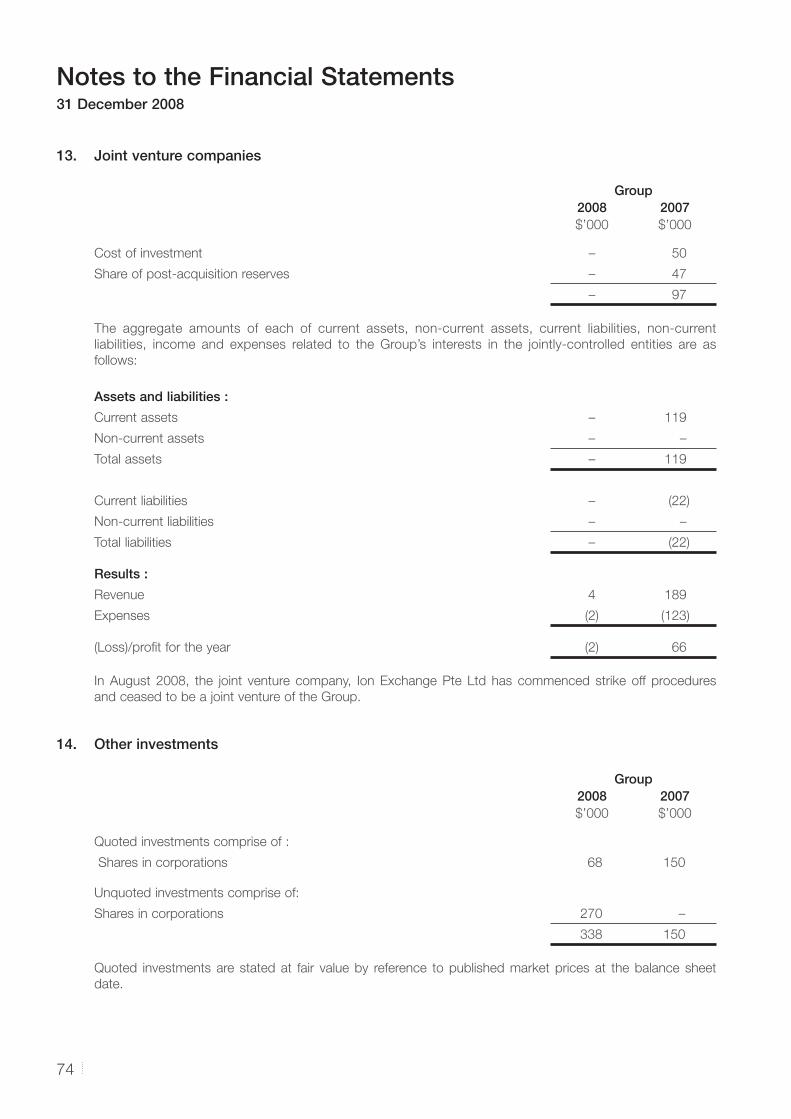
Notes to the Financial Statements31 December 2008
74
13. Joint venture companies
Group2008 2007$’000 $’000
Cost of investment – 50
Share of post-acquisition reserves – 47
– 97
The aggregate amounts of each of current assets, non-current assets, current liabilities, non-current
liabilities, income and expenses related to the Group’s interests in the jointly-controlled entities are as
follows:
Assets and liabilities :
Current assets – 119
Non-current assets – –
Total assets – 119
Current liabilities – (22)
Non-current liabilities – –
Total liabilities – (22)
Results :
Revenue 4 189
Expenses (2) (123)
(Loss)/profi t for the year (2) 66
In August 2008, the joint venture company, Ion Exchange Pte Ltd has commenced strike off procedures
and ceased to be a joint venture of the Group.
14. Other investments
Group2008 2007$’000 $’000
Quoted investments comprise of :
Shares in corporations 68 150
Unquoted investments comprise of:
Shares in corporations 270 –
338 150
Quoted investments are stated at fair value by reference to published market prices at the balance sheet
date.
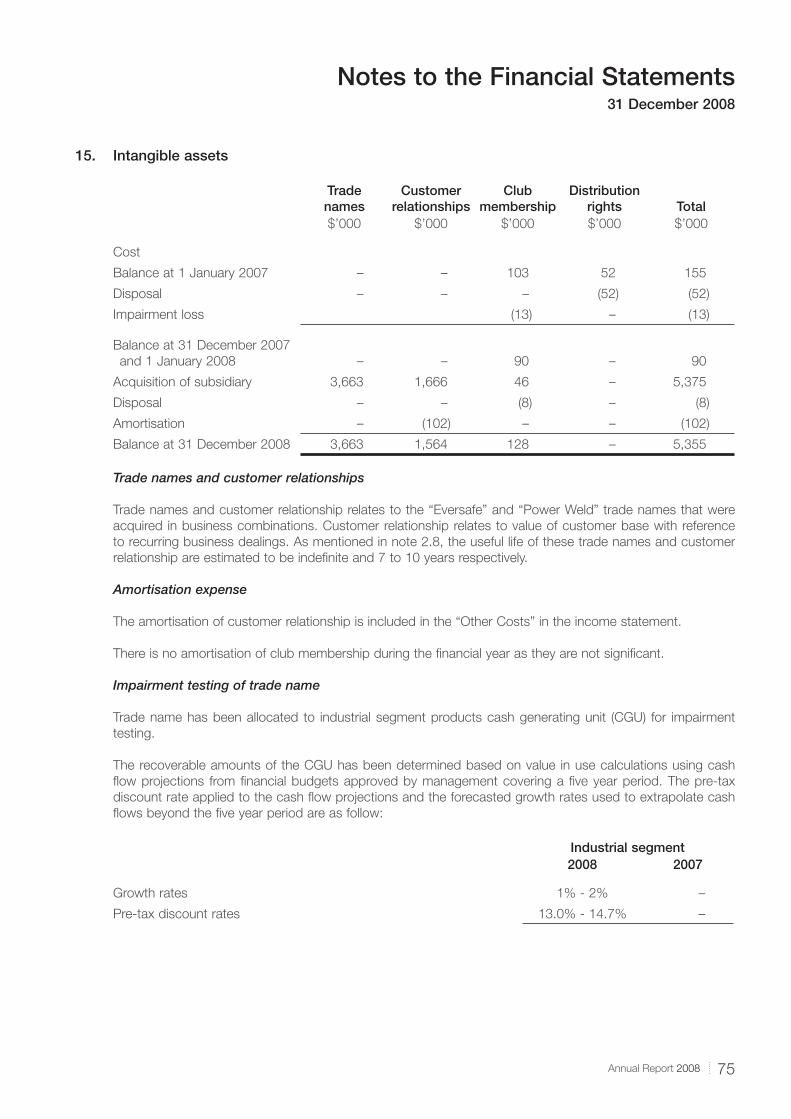
75Annual Report 2008
Notes to the Financial Statements31 December 2008
15. Intangible assets
Tradenames
Customer relationships
Club membership
Distribution rights Total
$’000 $’000 $’000 $’000 $’000
Cost
Balance at 1 January 2007 – – 103 52 155
Disposal – – – (52) (52)
Impairment loss (13) – (13)
Balance at 31 December 2007
and 1 January 2008 – – 90 – 90
Acquisition of subsidiary 3,663 1,666 46 – 5,375
Disposal – – (8) – (8)
Amortisation – (102) – – (102)
Balance at 31 December 2008 3,663 1,564 128 – 5,355
Trade names and customer relationships
Trade names and customer relationship relates to the “Eversafe” and “Power Weld” trade names that were
acquired in business combinations. Customer relationship relates to value of customer base with reference
to recurring business dealings. As mentioned in note 2.8, the useful life of these trade names and customer
relationship are estimated to be indefi nite and 7 to 10 years respectively.
Amortisation expense
The amortisation of customer relationship is included in the “Other Costs” in the income statement.
There is no amortisation of club membership during the fi nancial year as they are not signifi cant.
Impairment testing of trade name
Trade name has been allocated to industrial segment products cash generating unit (CGU) for impairment
testing.
The recoverable amounts of the CGU has been determined based on value in use calculations using cash
fl ow projections from fi nancial budgets approved by management covering a fi ve year period. The pre-tax
discount rate applied to the cash fl ow projections and the forecasted growth rates used to extrapolate cash
fl ows beyond the fi ve year period are as follow:
Industrial segment2008 2007
Growth rates 1% - 2% –
Pre-tax discount rates 13.0% - 14.7% –
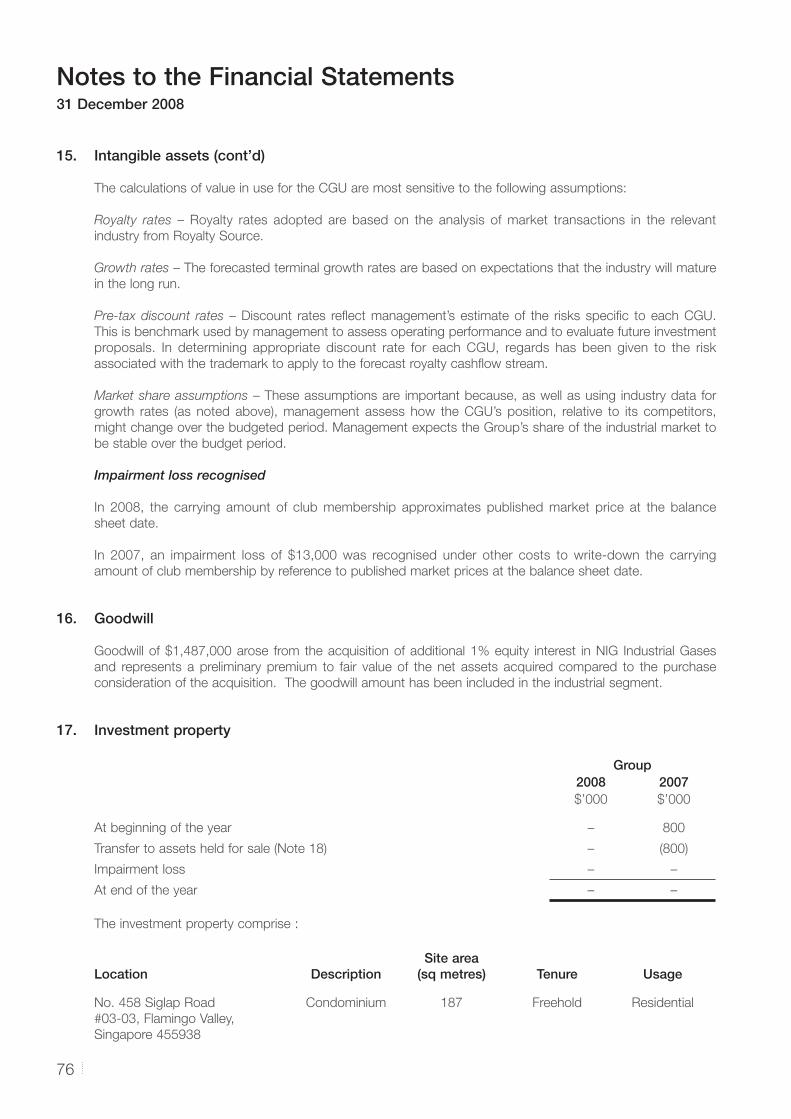
Notes to the Financial Statements31 December 2008
76
15. Intangible assets (cont’d)
The calculations of value in use for the CGU are most sensitive to the following assumptions:
Royalty rates – Royalty rates adopted are based on the analysis of market transactions in the relevant
industry from Royalty Source.
Growth rates – The forecasted terminal growth rates are based on expectations that the industry will mature
in the long run.
Pre-tax discount rates – Discount rates refl ect management’s estimate of the risks specifi c to each CGU.
This is benchmark used by management to assess operating performance and to evaluate future investment
proposals. In determining appropriate discount rate for each CGU, regards has been given to the risk
associated with the trademark to apply to the forecast royalty cashfl ow stream.
Market share assumptions – These assumptions are important because, as well as using industry data for
growth rates (as noted above), management assess how the CGU’s position, relative to its competitors,
might change over the budgeted period. Management expects the Group’s share of the industrial market to
be stable over the budget period.
Impairment loss recognised
In 2008, the carrying amount of club membership approximates published market price at the balance
sheet date.
In 2007, an impairment loss of $13,000 was recognised under other costs to write-down the carrying
amount of club membership by reference to published market prices at the balance sheet date.
16. Goodwill
Goodwill of $1,487,000 arose from the acquisition of additional 1% equity interest in NIG Industrial Gases
and represents a preliminary premium to fair value of the net assets acquired compared to the purchase
consideration of the acquisition. The goodwill amount has been included in the industrial segment.
17. Investment property
Group2008 2007$’000 $’000
At beginning of the year – 800
Transfer to assets held for sale (Note 18) – (800)
Impairment loss – –
At end of the year – –
The investment property comprise :
Location DescriptionSite area
(sq metres) Tenure Usage
No. 458 Siglap Road
#03-03, Flamingo Valley,
Singapore 455938
Condominium 187 Freehold Residential
77Annual Report 2008
Notes to the Financial Statements31 December 2008
17. Investment property (cont’d)
The investment property is charged to fi nancial institution for credit facilities as mentioned in Notes 27 and 31.
Investment property is stated at fair value which has been determined based on valuation as at 31 December 2005 performed by a registered independent appraiser having an appropriate recognised professional qualifi cation.
Transfer to assets held for sale
In 2007, the investment property was reclassifi ed as asset held for sale in view of the conclusion of a collective sales agreement. The asset was measured at lower of its carrying amount and fair value less costs to sell (Note 18). During the year, the investment property was sold off.
18. Assets held for sale
In 2007, in connection with the intention to dispose certain machineries not in use, the assets were written down to their recoverable amounts based on a valuation carried out by a recognised independent appraiser having an appropriate recognised professional qualifi cation.
Group2008 2007$’000 $’000
Transferred from property, plant and equipment (Note 10):
Plant and machinery:
Carrying value – 2,140
Accumulated depreciation – (1,968)
Impairment loss in asset held for sale – (12)
– 160
Investment property (Note 17) – 800
– 960
Assets held-for-sale were recognised under the property and others segment in segment information. The disposal of assets held for sale were completed during the year.
19. Development property/Gross amount due to customers for contract work-in-progress
In accordance with a Collaboration Agreement between the 20 existing owners of Paterson Lodge and a subsidiary company, the owners permitted the subsidiary company, at its own costs, to demolish the existing building on the land located at 20 Paterson Road, Singapore 238509, and to develop it into a new residential development comprising a new residential building with 35 new units with certain communal facilities. The subsidiary company also undertook to deliver vacant possession of 20 new units out of the 35 new units and the respective subsidiary Strata Certifi cates of Titles to the respective 20 existing owners. The remaining 15 new units are transferred to the subsidiary company in consideration of the role and undertaking by the subsidiary company as stated above. All 15 units were sold in 2007. Based on the selling price of these 15 units, the 20 units to be delivered to the 20 existing owners are estimated to be valued at approximately $50 million.
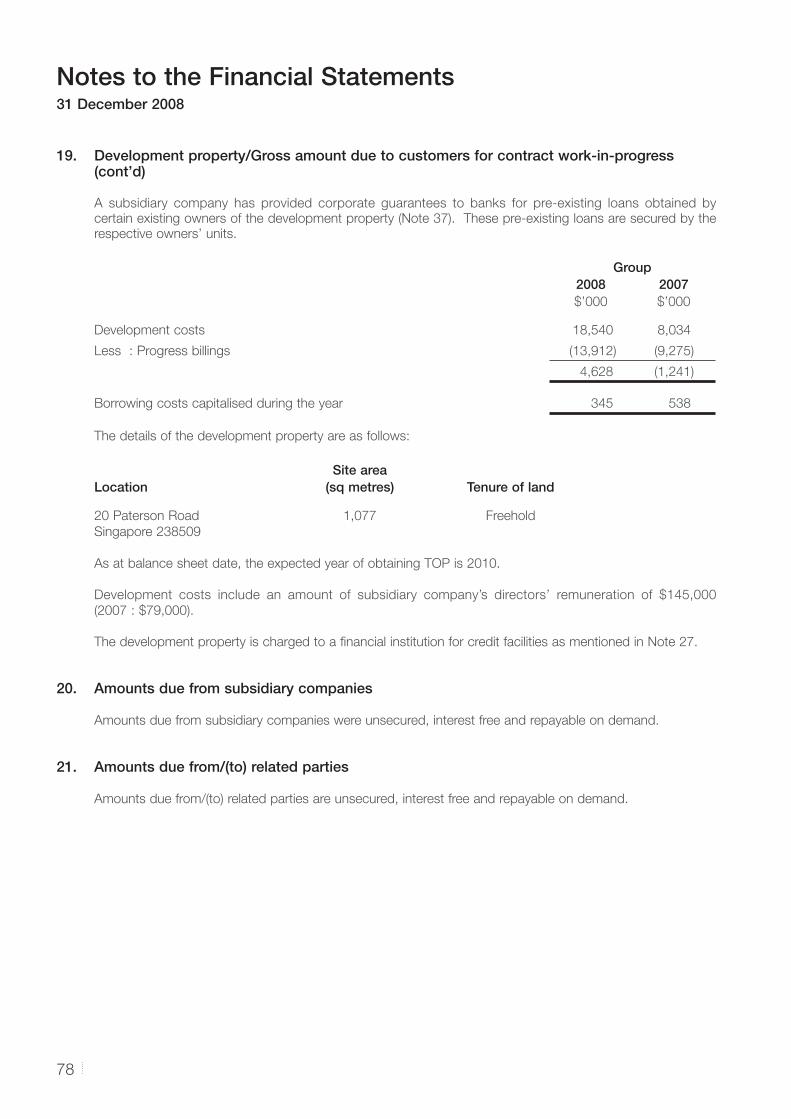
Notes to the Financial Statements31 December 2008
78
19. Development property/Gross amount due to customers for contract work-in-progress (cont’d)
A subsidiary company has provided corporate guarantees to banks for pre-existing loans obtained by certain existing owners of the development property (Note 37). These pre-existing loans are secured by the respective owners’ units.
Group2008 2007$’000 $’000
Development costs 18,540 8,034
Less : Progress billings (13,912) (9,275)
4,628 (1,241)
Borrowing costs capitalised during the year 345 538
The details of the development property are as follows:
Site areaLocation (sq metres) Tenure of land
20 Paterson Road
Singapore 238509
1,077 Freehold
As at balance sheet date, the expected year of obtaining TOP is 2010.
Development costs include an amount of subsidiary company’s directors’ remuneration of $145,000
(2007 : $79,000).
The development property is charged to a fi nancial institution for credit facilities as mentioned in Note 27.
20. Amounts due from subsidiary companies
Amounts due from subsidiary companies were unsecured, interest free and repayable on demand.
21. Amounts due from/(to) related parties
Amounts due from/(to) related parties are unsecured, interest free and repayable on demand.
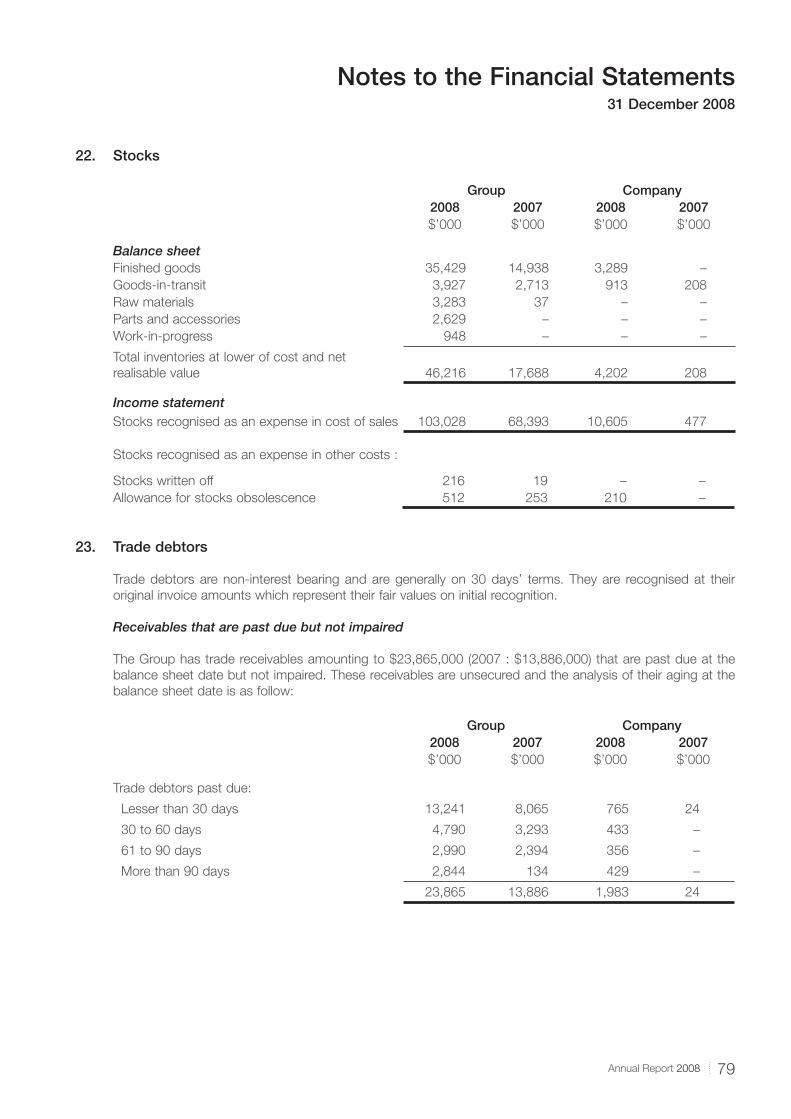
79Annual Report 2008
Notes to the Financial Statements31 December 2008
22. Stocks
Group Company2008 2007 2008 2007$’000 $’000 $’000 $’000
Balance sheetFinished goods 35,429 14,938 3,289 –
Goods-in-transit 3,927 2,713 913 208
Raw materials 3,283 37 – –
Parts and accessories 2,629 – – –
Work-in-progress 948 – – –
Total inventories at lower of cost and net
realisable value 46,216 17,688 4,202 208
Income statementStocks recognised as an expense in cost of sales 103,028 68,393 10,605 477
Stocks recognised as an expense in other costs :
Stocks written off 216 19 – –
Allowance for stocks obsolescence 512 253 210 –
23. Trade debtors
Trade debtors are non-interest bearing and are generally on 30 days’ terms. They are recognised at their
original invoice amounts which represent their fair values on initial recognition.
Receivables that are past due but not impaired
The Group has trade receivables amounting to $23,865,000 (2007 : $13,886,000) that are past due at the
balance sheet date but not impaired. These receivables are unsecured and the analysis of their aging at the
balance sheet date is as follow:
Group Company2008 2007 2008 2007$’000 $’000 $’000 $’000
Trade debtors past due:
Lesser than 30 days 13,241 8,065 765 24
30 to 60 days 4,790 3,293 433 –
61 to 90 days 2,990 2,394 356 –
More than 90 days 2,844 134 429 –
23,865 13,886 1,983 24
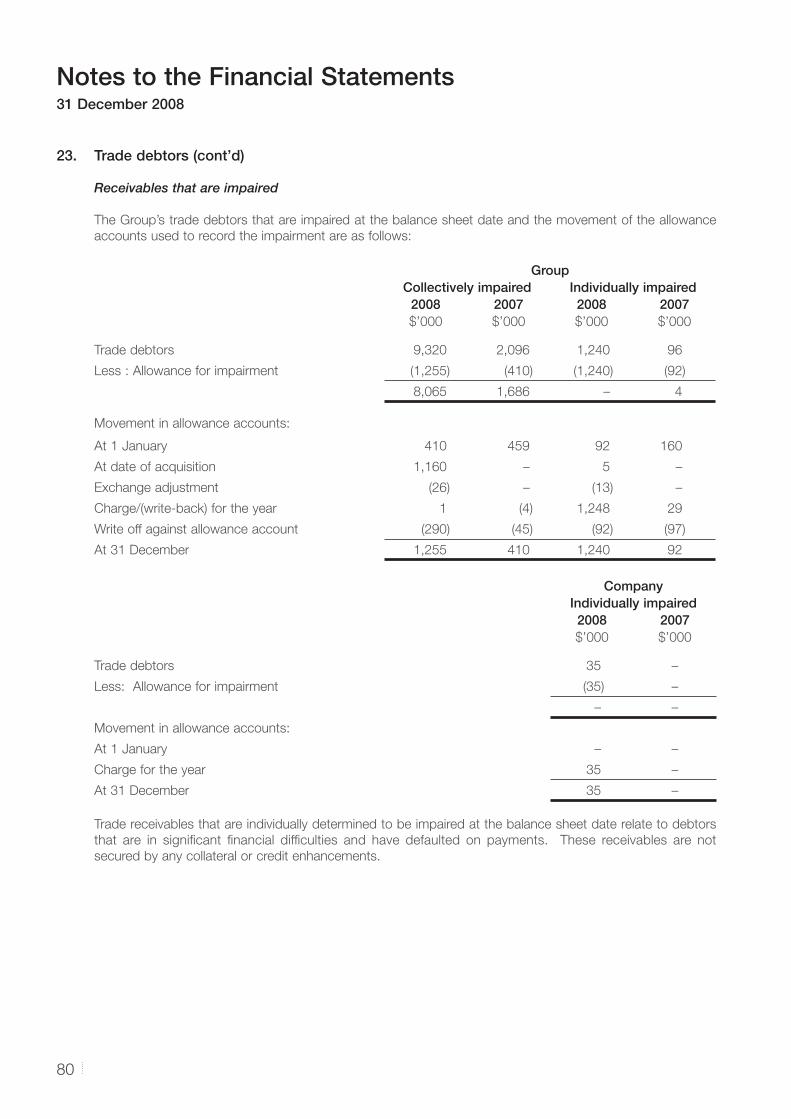
Notes to the Financial Statements31 December 2008
80
23. Trade debtors (cont’d)
Receivables that are impaired
The Group’s trade debtors that are impaired at the balance sheet date and the movement of the allowance
accounts used to record the impairment are as follows:
GroupCollectively impaired Individually impaired
2008 2007 2008 2007$’000 $’000 $’000 $’000
Trade debtors 9,320 2,096 1,240 96
Less : Allowance for impairment (1,255) (410) (1,240) (92)
8,065 1,686 – 4
Movement in allowance accounts:
At 1 January 410 459 92 160
At date of acquisition 1,160 – 5 –
Exchange adjustment (26) – (13) –
Charge/(write-back) for the year 1 (4) 1,248 29
Write off against allowance account (290) (45) (92) (97)
At 31 December 1,255 410 1,240 92
CompanyIndividually impaired2008 2007$’000 $’000
Trade debtors 35 –
Less: Allowance for impairment (35) –
– –
Movement in allowance accounts:
At 1 January – –
Charge for the year 35 –
At 31 December 35 –
Trade receivables that are individually determined to be impaired at the balance sheet date relate to debtors
that are in signifi cant fi nancial diffi culties and have defaulted on payments. These receivables are not
secured by any collateral or credit enhancements.
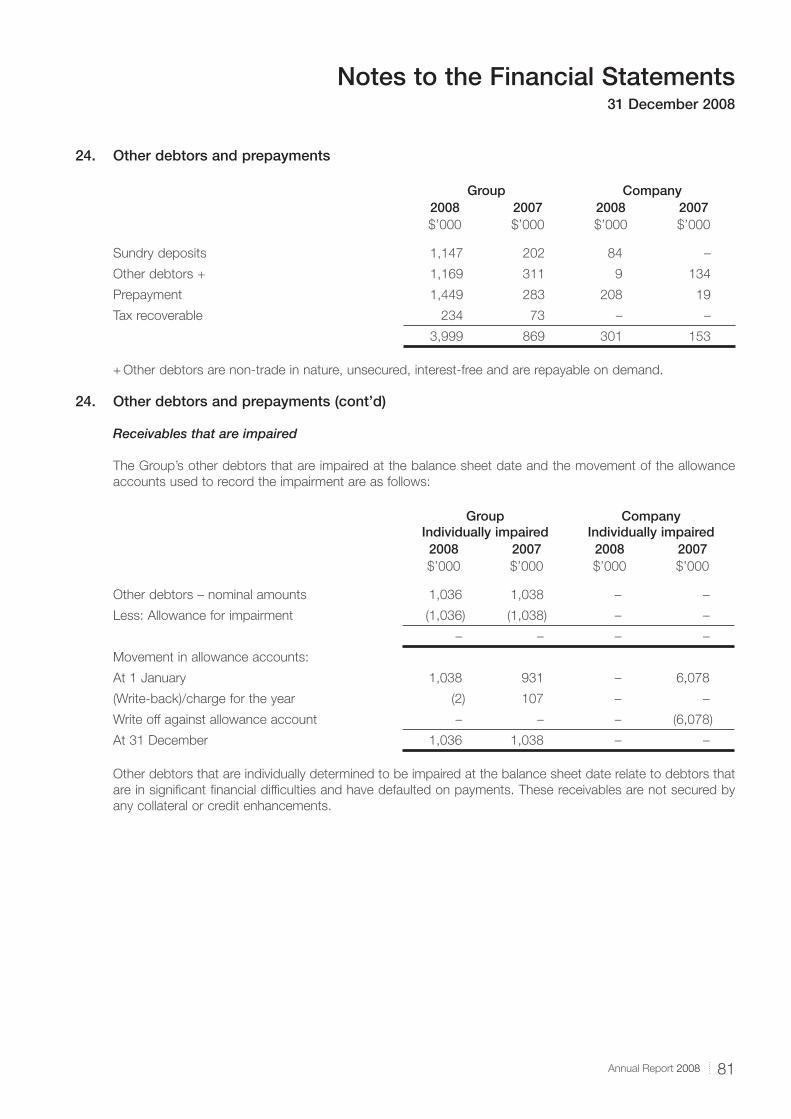
81Annual Report 2008
Notes to the Financial Statements31 December 2008
24. Other debtors and prepayments
Group Company2008 2007 2008 2007$’000 $’000 $’000 $’000
Sundry deposits 1,147 202 84 –
Other debtors + 1,169 311 9 134
Prepayment 1,449 283 208 19
Tax recoverable 234 73 – –
3,999 869 301 153
+ Other debtors are non-trade in nature, unsecured, interest-free and are repayable on demand.
24. Other debtors and prepayments (cont’d)
Receivables that are impaired
The Group’s other debtors that are impaired at the balance sheet date and the movement of the allowance
accounts used to record the impairment are as follows:
GroupIndividually impaired
CompanyIndividually impaired
2008 2007 2008 2007$’000 $’000 $’000 $’000
Other debtors – nominal amounts 1,036 1,038 – –
Less: Allowance for impairment (1,036) (1,038) – –
– – – –
Movement in allowance accounts:
At 1 January 1,038 931 – 6,078
(Write-back)/charge for the year (2) 107 – –
Write off against allowance account – – – (6,078)
At 31 December 1,036 1,038 – –
Other debtors that are individually determined to be impaired at the balance sheet date relate to debtors that
are in signifi cant fi nancial diffi culties and have defaulted on payments. These receivables are not secured by
any collateral or credit enhancements.
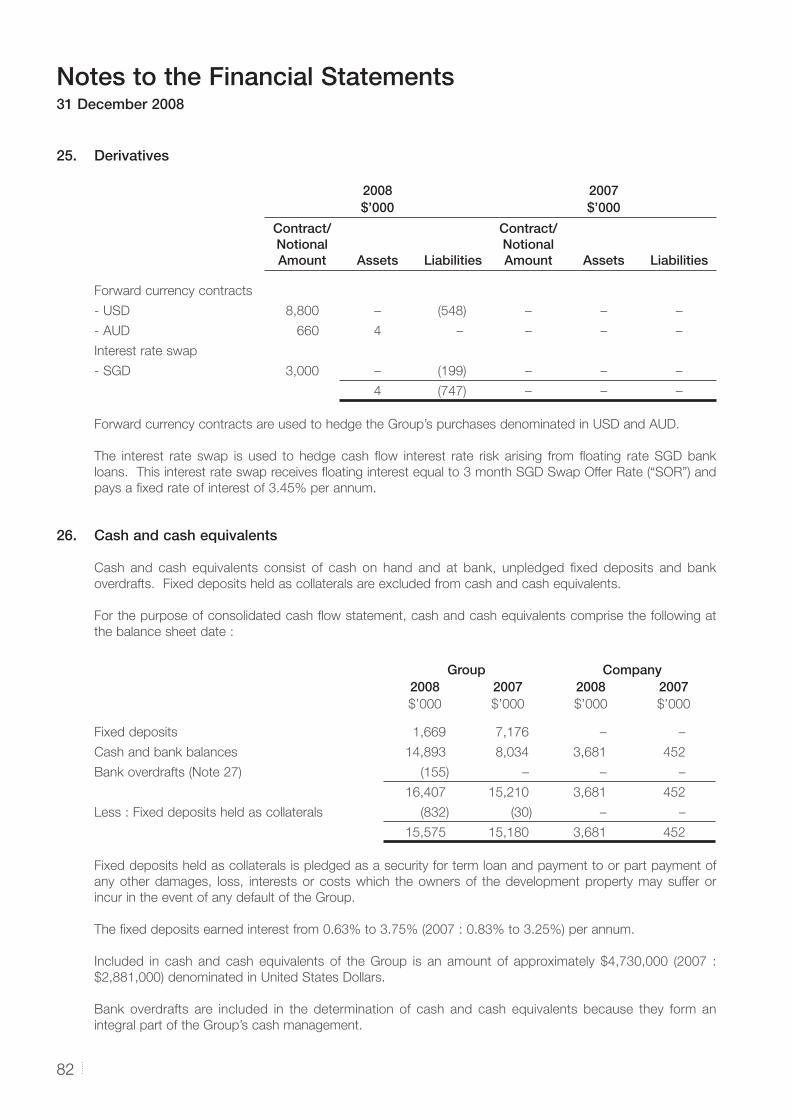
Notes to the Financial Statements31 December 2008
82
25. Derivatives
2008 2007$’000 $’000
Contract/Notional Amount Assets Liabilities
Contract/Notional Amount Assets Liabilities
Forward currency contracts
- USD 8,800 – (548) – – –
- AUD 660 4 – – – –
Interest rate swap
- SGD 3,000 – (199) – – –
4 (747) – – –
Forward currency contracts are used to hedge the Group’s purchases denominated in USD and AUD.
The interest rate swap is used to hedge cash fl ow interest rate risk arising from fl oating rate SGD bank
loans. This interest rate swap receives fl oating interest equal to 3 month SGD Swap Offer Rate (“SOR”) and
pays a fi xed rate of interest of 3.45% per annum.
26. Cash and cash equivalents
Cash and cash equivalents consist of cash on hand and at bank, unpledged fi xed deposits and bank
overdrafts. Fixed deposits held as collaterals are excluded from cash and cash equivalents.
For the purpose of consolidated cash fl ow statement, cash and cash equivalents comprise the following at
the balance sheet date :
Group Company2008 2007 2008 2007$’000 $’000 $’000 $’000
Fixed deposits 1,669 7,176 – –
Cash and bank balances 14,893 8,034 3,681 452
Bank overdrafts (Note 27) (155) – – –
16,407 15,210 3,681 452
Less : Fixed deposits held as collaterals (832) (30) – –
15,575 15,180 3,681 452
Fixed deposits held as collaterals is pledged as a security for term loan and payment to or part payment of
any other damages, loss, interests or costs which the owners of the development property may suffer or
incur in the event of any default of the Group.
The fi xed deposits earned interest from 0.63% to 3.75% (2007 : 0.83% to 3.25%) per annum.
Included in cash and cash equivalents of the Group is an amount of approximately $4,730,000 (2007 :
$2,881,000) denominated in United States Dollars.
Bank overdrafts are included in the determination of cash and cash equivalents because they form an
integral part of the Group’s cash management.
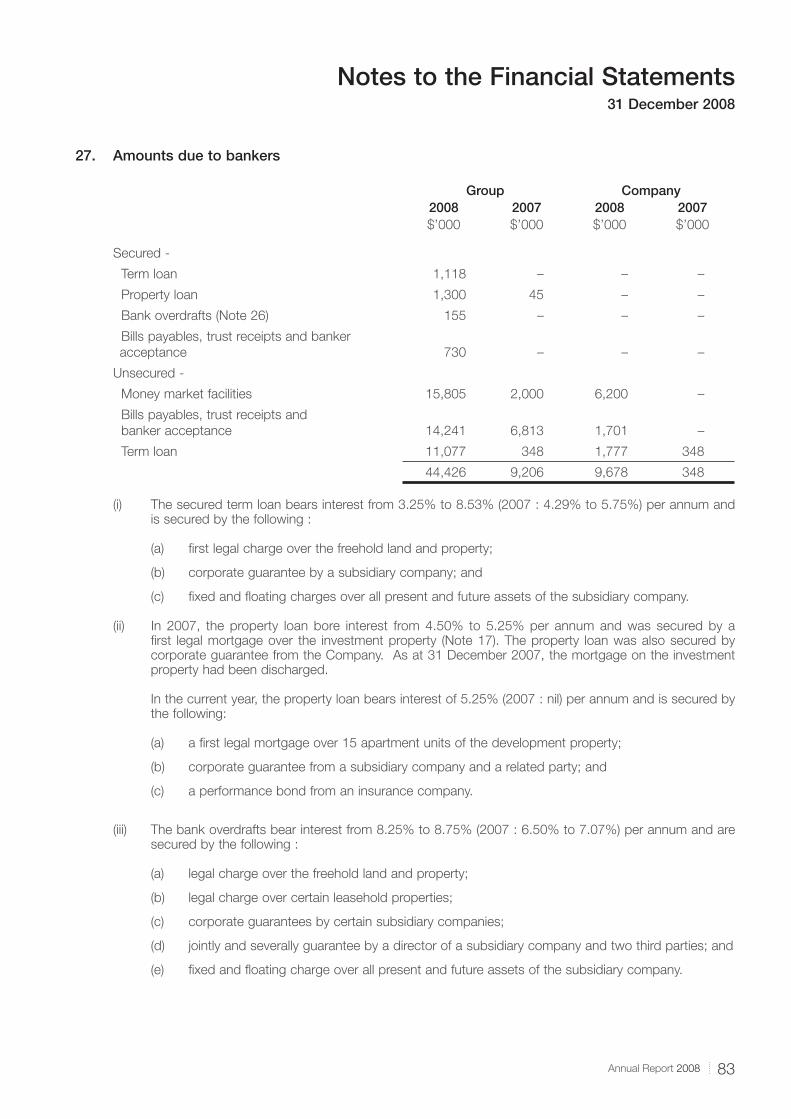
83Annual Report 2008
Notes to the Financial Statements31 December 2008
27. Amounts due to bankers
Group Company2008 2007 2008 2007$’000 $’000 $’000 $’000
Secured -
Term loan 1,118 – – –
Property loan 1,300 45 – –
Bank overdrafts (Note 26) 155 – – –
Bills payables, trust receipts and banker
acceptance 730 – – –
Unsecured -
Money market facilities 15,805 2,000 6,200 –
Bills payables, trust receipts and
banker acceptance 14,241 6,813 1,701 –
Term loan 11,077 348 1,777 348
44,426 9,206 9,678 348
(i) The secured term loan bears interest from 3.25% to 8.53% (2007 : 4.29% to 5.75%) per annum and is secured by the following :
(a) fi rst legal charge over the freehold land and property;
(b) corporate guarantee by a subsidiary company; and
(c) fi xed and fl oating charges over all present and future assets of the subsidiary company.
(ii) In 2007, the property loan bore interest from 4.50% to 5.25% per annum and was secured by a fi rst legal mortgage over the investment property (Note 17). The property loan was also secured by corporate guarantee from the Company. As at 31 December 2007, the mortgage on the investment property had been discharged.
In the current year, the property loan bears interest of 5.25% (2007 : nil) per annum and is secured by the following:
(a) a fi rst legal mortgage over 15 apartment units of the development property;
(b) corporate guarantee from a subsidiary company and a related party; and
(c) a performance bond from an insurance company.
(iii) The bank overdrafts bear interest from 8.25% to 8.75% (2007 : 6.50% to 7.07%) per annum and are secured by the following :
(a) legal charge over the freehold land and property;
(b) legal charge over certain leasehold properties;
(c) corporate guarantees by certain subsidiary companies;
(d) jointly and severally guarantee by a director of a subsidiary company and two third parties; and
(e) fi xed and fl oating charge over all present and future assets of the subsidiary company.
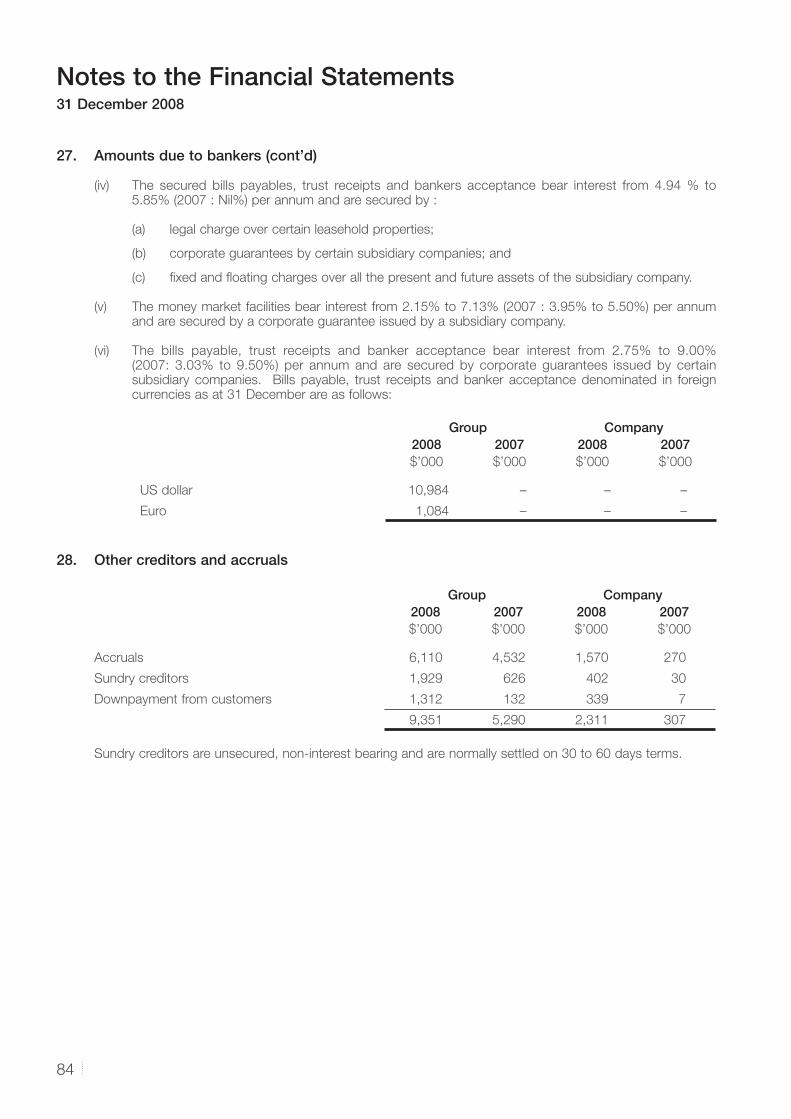
Notes to the Financial Statements31 December 2008
84
27. Amounts due to bankers (cont’d)
(iv) The secured bills payables, trust receipts and bankers acceptance bear interest from 4.94 % to 5.85% (2007 : Nil%) per annum and are secured by :
(a) legal charge over certain leasehold properties;
(b) corporate guarantees by certain subsidiary companies; and
(c) fi xed and fl oating charges over all the present and future assets of the subsidiary company.
(v) The money market facilities bear interest from 2.15% to 7.13% (2007 : 3.95% to 5.50%) per annum and are secured by a corporate guarantee issued by a subsidiary company.
(vi) The bills payable, trust receipts and banker acceptance bear interest from 2.75% to 9.00% (2007: 3.03% to 9.50%) per annum and are secured by corporate guarantees issued by certain subsidiary companies. Bills payable, trust receipts and banker acceptance denominated in foreign currencies as at 31 December are as follows:
Group Company2008 2007 2008 2007$’000 $’000 $’000 $’000
US dollar 10,984 – – –
Euro 1,084 – – –
28. Other creditors and accruals
Group Company2008 2007 2008 2007$’000 $’000 $’000 $’000
Accruals 6,110 4,532 1,570 270
Sundry creditors 1,929 626 402 30
Downpayment from customers 1,312 132 339 7
9,351 5,290 2,311 307
Sundry creditors are unsecured, non-interest bearing and are normally settled on 30 to 60 days terms.
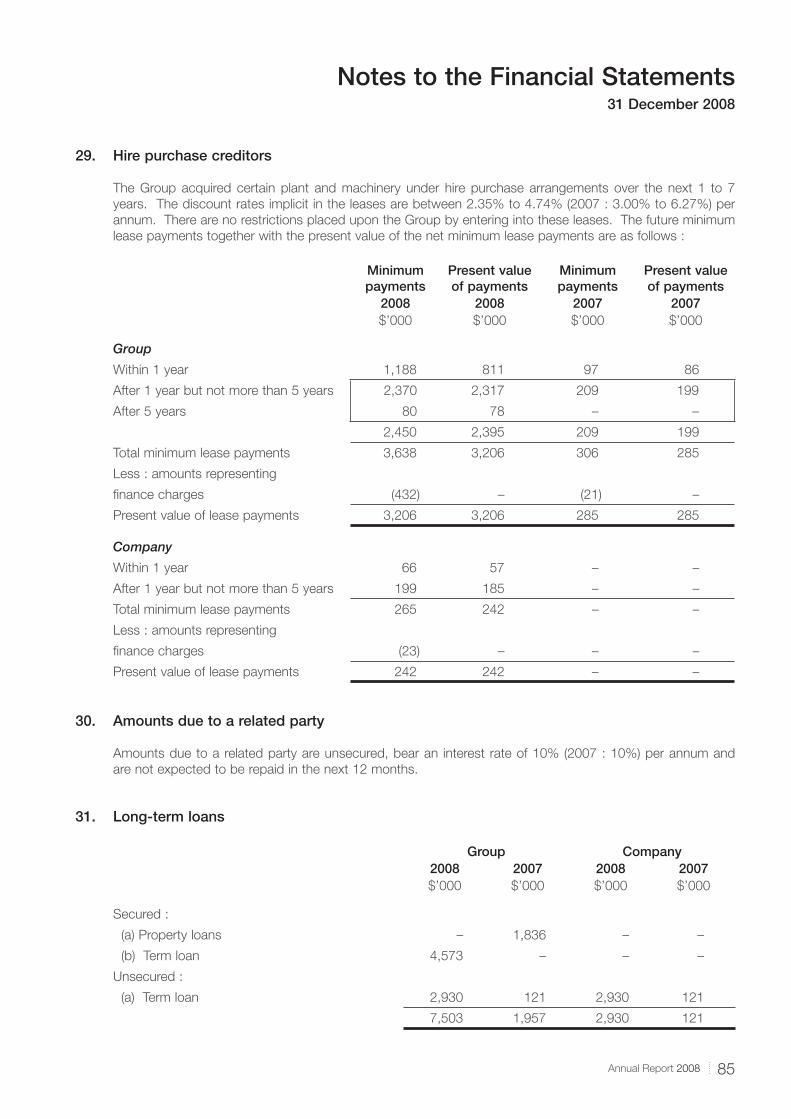
85Annual Report 2008
Notes to the Financial Statements31 December 2008
29. Hire purchase creditors
The Group acquired certain plant and machinery under hire purchase arrangements over the next 1 to 7
years. The discount rates implicit in the leases are between 2.35% to 4.74% (2007 : 3.00% to 6.27%) per
annum. There are no restrictions placed upon the Group by entering into these leases. The future minimum
lease payments together with the present value of the net minimum lease payments are as follows :
Minimum payments
Present value of payments
Minimum payments
Present value of payments
2008 2008 2007 2007$’000 $’000 $’000 $’000
Group
Within 1 year 1,188 811 97 86
After 1 year but not more than 5 years 2,370 2,317 209 199
After 5 years 80 78 – –
2,450 2,395 209 199
Total minimum lease payments 3,638 3,206 306 285
Less : amounts representing
fi nance charges (432) – (21) –
Present value of lease payments 3,206 3,206 285 285
Company
Within 1 year 66 57 – –
After 1 year but not more than 5 years 199 185 – –
Total minimum lease payments 265 242 – –
Less : amounts representing
fi nance charges (23) – – –
Present value of lease payments 242 242 – –
30. Amounts due to a related party
Amounts due to a related party are unsecured, bear an interest rate of 10% (2007 : 10%) per annum and
are not expected to be repaid in the next 12 months.
31. Long-term loans
Group Company2008 2007 2008 2007$’000 $’000 $’000 $’000
Secured :
(a) Property loans – 1,836 – –
(b) Term loan 4,573 – – –
Unsecured :
(a) Term loan 2,930 121 2,930 121
7,503 1,957 2,930 121
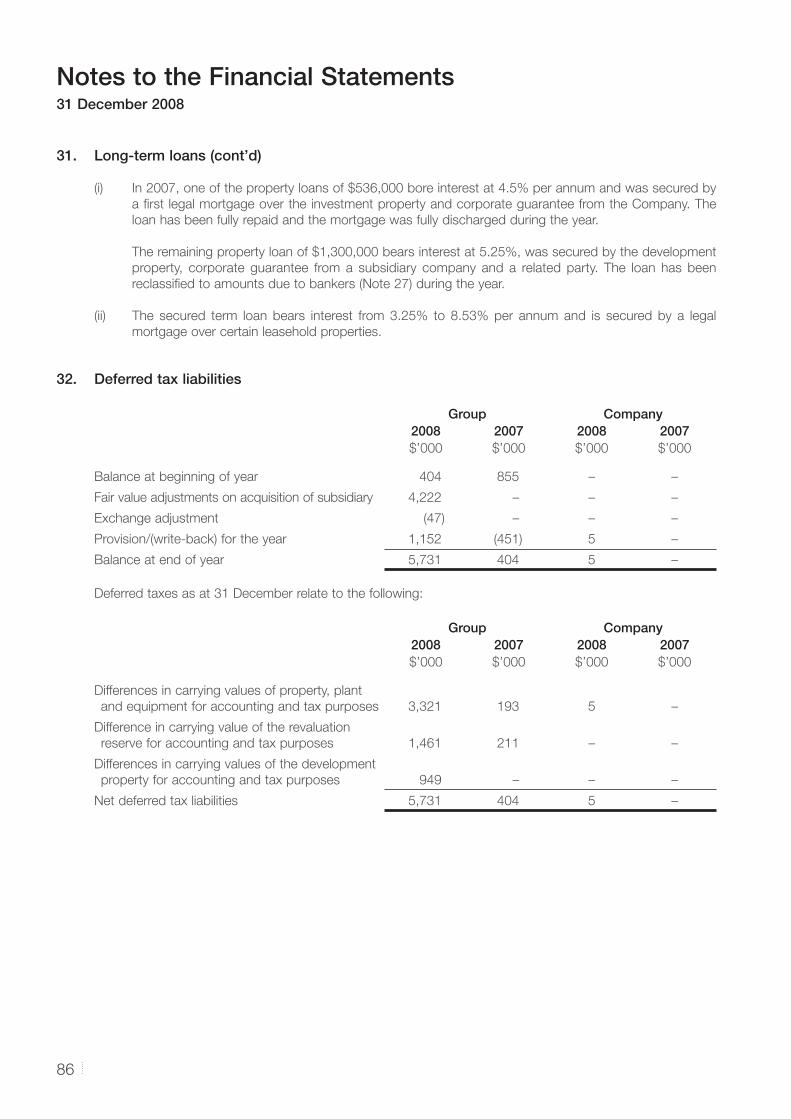
Notes to the Financial Statements31 December 2008
86
31. Long-term loans (cont’d)
(i) In 2007, one of the property loans of $536,000 bore interest at 4.5% per annum and was secured by
a fi rst legal mortgage over the investment property and corporate guarantee from the Company. The
loan has been fully repaid and the mortgage was fully discharged during the year.
The remaining property loan of $1,300,000 bears interest at 5.25%, was secured by the development
property, corporate guarantee from a subsidiary company and a related party. The loan has been
reclassifi ed to amounts due to bankers (Note 27) during the year.
(ii) The secured term loan bears interest from 3.25% to 8.53% per annum and is secured by a legal
mortgage over certain leasehold properties.
32. Deferred tax liabilities
Group Company2008 2007 2008 2007$’000 $’000 $’000 $’000
Balance at beginning of year 404 855 – –
Fair value adjustments on acquisition of subsidiary 4,222 – – –
Exchange adjustment (47) – – –
Provision/(write-back) for the year 1,152 (451) 5 –
Balance at end of year 5,731 404 5 –
Deferred taxes as at 31 December relate to the following:
Group Company2008 2007 2008 2007$’000 $’000 $’000 $’000
Differences in carrying values of property, plant
and equipment for accounting and tax purposes 3,321 193 5 –
Difference in carrying value of the revaluation
reserve for accounting and tax purposes 1,461 211 – –
Differences in carrying values of the development
property for accounting and tax purposes 949 – – –
Net deferred tax liabilities 5,731 404 5 –
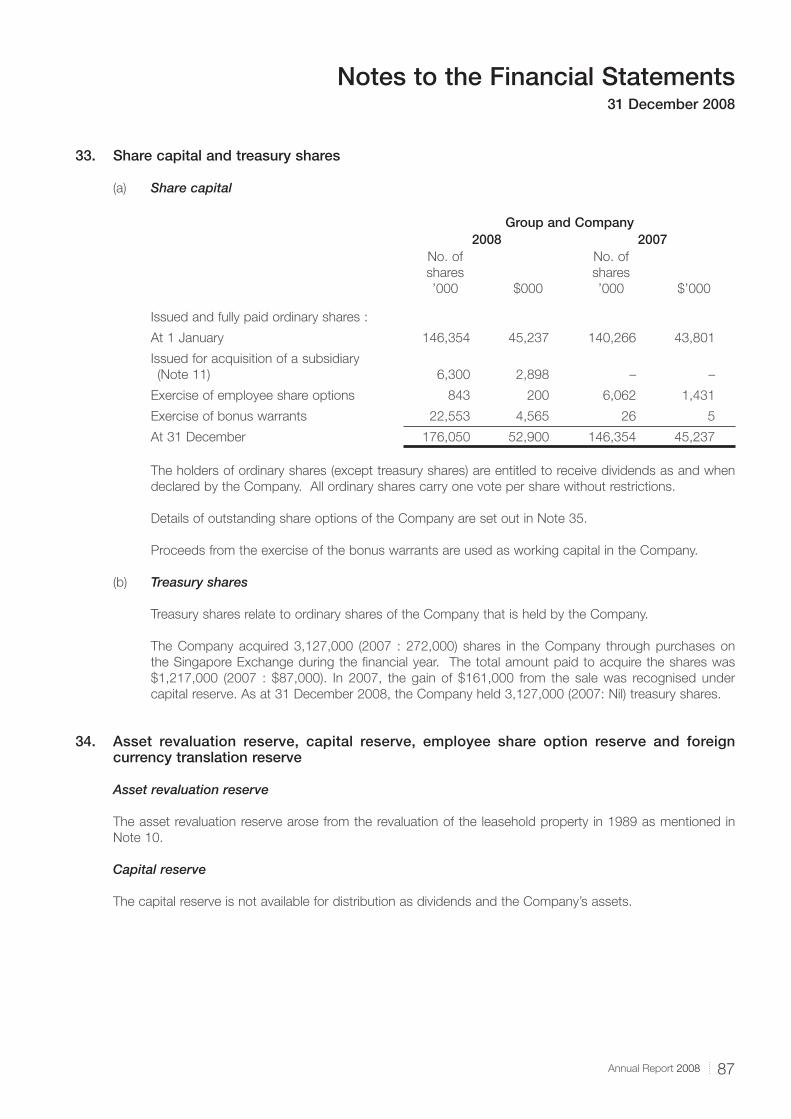
87Annual Report 2008
Notes to the Financial Statements31 December 2008
33. Share capital and treasury shares
(a) Share capital
Group and Company2008 2007
No. of
shares
’000 $000
No. of
shares
’000 $’000
Issued and fully paid ordinary shares :
At 1 January 146,354 45,237 140,266 43,801
Issued for acquisition of a subsidiary
(Note 11) 6,300 2,898 – –
Exercise of employee share options 843 200 6,062 1,431
Exercise of bonus warrants 22,553 4,565 26 5
At 31 December 176,050 52,900 146,354 45,237
The holders of ordinary shares (except treasury shares) are entitled to receive dividends as and when
declared by the Company. All ordinary shares carry one vote per share without restrictions.
Details of outstanding share options of the Company are set out in Note 35.
Proceeds from the exercise of the bonus warrants are used as working capital in the Company.
(b) Treasury shares
Treasury shares relate to ordinary shares of the Company that is held by the Company.
The Company acquired 3,127,000 (2007 : 272,000) shares in the Company through purchases on
the Singapore Exchange during the fi nancial year. The total amount paid to acquire the shares was
$1,217,000 (2007 : $87,000). In 2007, the gain of $161,000 from the sale was recognised under
capital reserve. As at 31 December 2008, the Company held 3,127,000 (2007: Nil) treasury shares.
34. Asset revaluation reserve, capital reserve, employee share option reserve and foreign currency translation reserve
Asset revaluation reserve
The asset revaluation reserve arose from the revaluation of the leasehold property in 1989 as mentioned in
Note 10.
Capital reserve
The capital reserve is not available for distribution as dividends and the Company’s assets.
Notes to the Financial Statements31 December 2008
88
34. Asset revaluation reserve, capital reserve, employee share option reserve and foreign currency translation reserve (cont’d)
Employee share option reserve
Employee share option reserve represents the equity settled share options granted to employees.
Foreign currency translation reserve
The foreign currency translation reserve is used to record exchange differences arising from the translation
of the fi nancial statements of foreign operations whose functional currencies are different from that of the
Group’s presentation currency.
35. Equity compensation benefi ts
Share Option Schemes
(a) Ace Dynamics Share Option Scheme (“Scheme I”)
At the Extraordinary meeting held on 19 February 2000, shareholders approved the adoption of
Scheme I. Under Scheme I, options may be granted to selected employees of the Group including
employees of its associated companies, executive and non-executive Directors. Controlling
shareholders and their associates are not eligible to participate in Scheme I. Further details of
Scheme I are set out in the circular to shareholders dated 28 January 2000. Details of the various
exercise prices per share are set out in paragraph (c) below.
(b) Leeden Share Option Scheme 2007 (“Scheme II”)
At the Extraordinary meeting held on 8 August 2007, shareholders approved the adoption of the
Scheme. Under Scheme II, options may be granted to confi rmed Group employees, including
employees of associated companies, executive and non-executive directors and controlling
shareholders. Further details are set out in the circular to shareholders dated 17 July 2007. Details
of the various exercise prices per share are set out in paragraph (c) below.
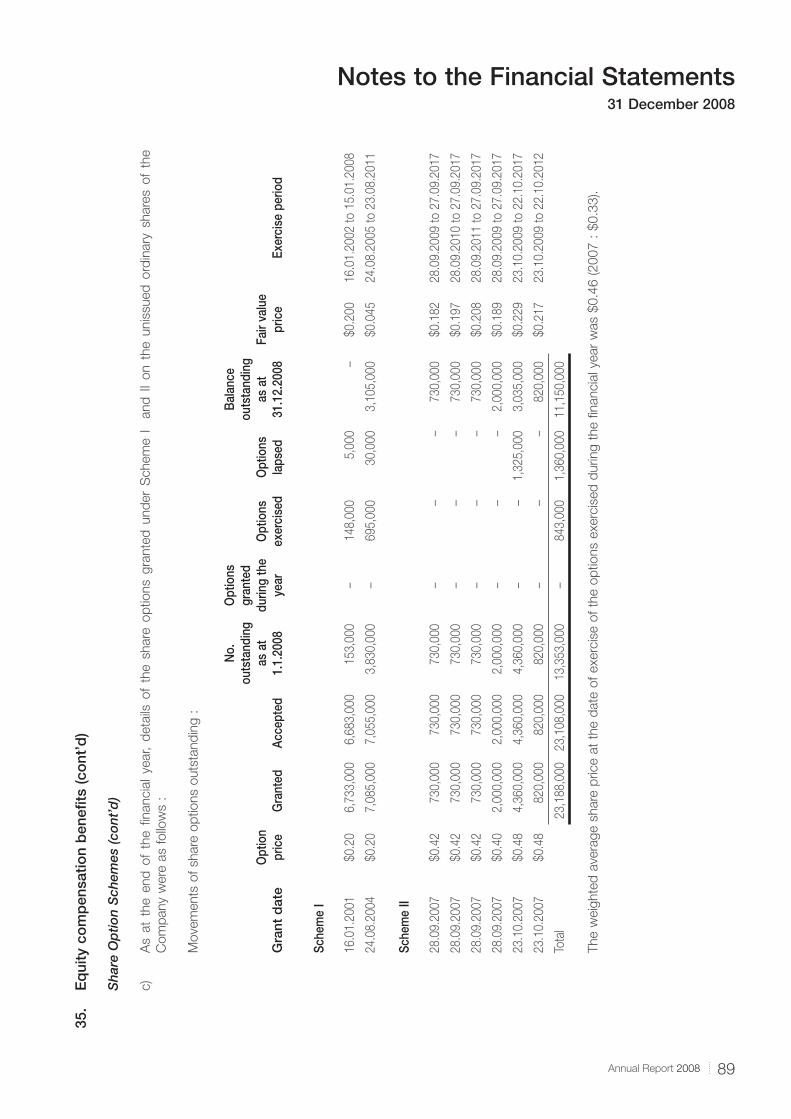
89Annual Report 2008
Notes to the Financial Statements31 December 2008
35.
Eq
uity
co
mp
ensa
tion
ben
efi t
s (c
ont
’d)
S
hare
Op
tion
Sch
emes
(co
nt’d
)
c)
As a
t th
e e
nd
of
the fi
nancia
l year, d
eta
ils o
f th
e s
hare
op
tio
ns g
rante
d u
nd
er
Schem
e I
and
II
on t
he u
nis
sued
ord
inary
share
s o
f th
e
Com
pany
were
as f
ollo
ws :
Move
ments
of
share
op
tions o
uts
tand
ing :
Gra
nt d
ate
Opt
ion
pric
eG
rant
edAc
cept
ed
No.
ou
tsta
ndin
g as
at
1.1.
2008
Opt
ions
gr
ante
d du
ring
the
year
Opt
ions
ex
erci
sed
Opt
ions
la
psed
Bal
ance
ou
tsta
ndin
g as
at
31.1
2.20
08Fa
ir va
lue
pric
eEx
erci
se p
erio
d
Sche
me
I
16.0
1.2
001
$0.2
06,7
33,0
00
6,6
83
,00
01
53
,00
0–
1
48
,00
05
,000
–
$0
.20
01
6.0
1.2
00
2 t
o 1
5.0
1.2
00
8
24.0
8.2
004
$0.2
07,0
85,0
00
7,0
55
,00
03
,83
0,0
00
–
69
5,0
00
30
,00
03
,10
5,0
00
$0
.04
52
4.0
8.2
00
5 t
o 2
3.0
8.2
01
1
Sche
me
II
28.0
9.2
007
$0.4
2730,0
00
73
0,0
00
73
0,0
00
–
–
–
73
0,0
00
$0
.18
22
8.0
9.2
00
9 t
o 2
7.0
9.2
01
7
28.0
9.2
007
$0.4
2730,0
00
73
0,0
00
73
0,0
00
–
–
–
73
0,0
00
$0
.19
72
8.0
9.2
01
0 t
o 2
7.0
9.2
01
7
28.0
9.2
007
$0.4
2730,0
00
73
0,0
00
73
0,0
00
–
–
–
73
0,0
00
$0
.20
82
8.0
9.2
01
1 t
o 2
7.0
9.2
01
7
28.0
9.2
007
$0.4
02,0
00,0
00
2,0
00
,00
02
,00
0,0
00
–
–
–
2,0
00
,00
0$
0.1
89
28
.09
.20
09
to
27
.09
.20
17
23.1
0.2
007
$0.4
84,3
60,0
00
4,3
60
,00
04
,36
0,0
00
–
–
1,3
25
,00
03
,03
5,0
00
$0
.22
92
3.1
0.2
00
9 t
o 2
2.1
0.2
01
7
23.1
0.2
007
$0.4
8820,0
00
82
0,0
00
82
0,0
00
–
–
–
82
0,0
00
$0
.21
72
3.1
0.2
00
9 t
o 2
2.1
0.2
01
2
Tota
l23,1
88,0
00
23
,10
8,0
00
13
,35
3,0
00
–
84
3,0
00
1,3
60
,000
11
,15
0,0
00
The w
eig
hte
d a
vera
ge s
hare
price a
t th
e d
ate
of
exerc
ise o
f th
e o
ptions e
xerc
ised
during t
he fi n
ancia
l ye
ar
was $
0.4
6 (2007 :
$0.3
3).
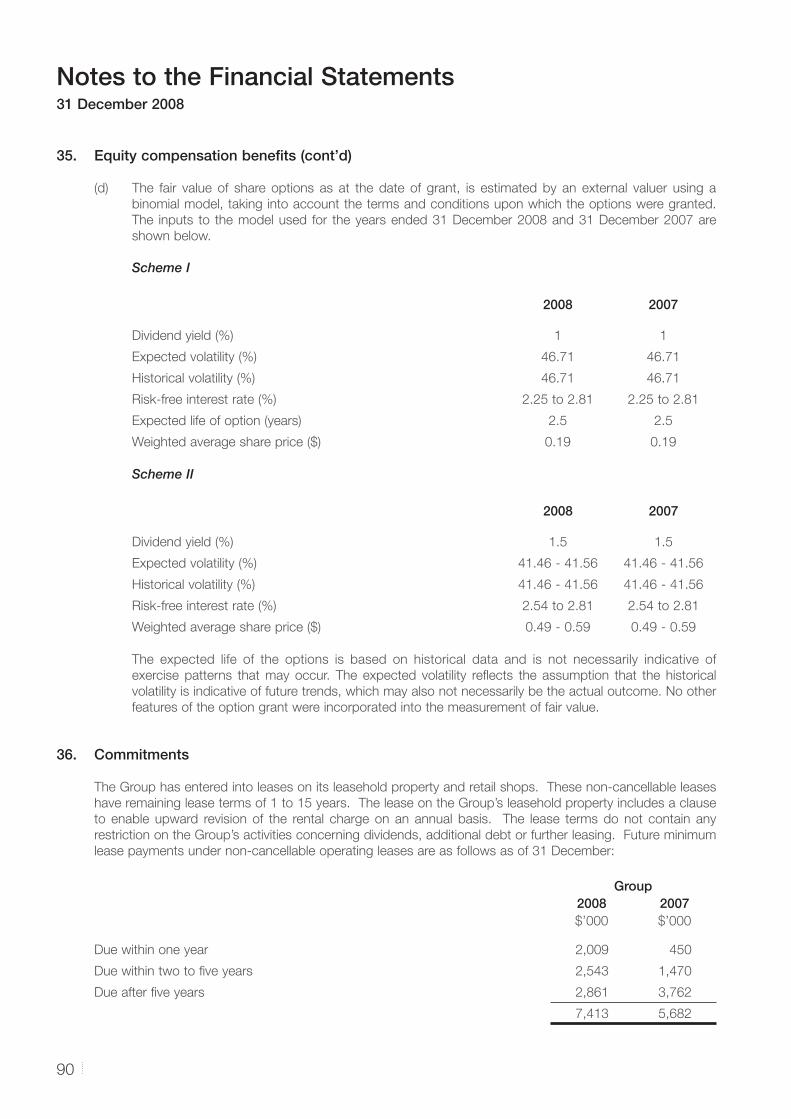
Notes to the Financial Statements31 December 2008
90
35. Equity compensation benefi ts (cont’d)
(d) The fair value of share options as at the date of grant, is estimated by an external valuer using a
binomial model, taking into account the terms and conditions upon which the options were granted.
The inputs to the model used for the years ended 31 December 2008 and 31 December 2007 are
shown below.
Scheme I
2008 2007
Dividend yield (%) 1 1
Expected volatility (%) 46.71 46.71
Historical volatility (%) 46.71 46.71
Risk-free interest rate (%) 2.25 to 2.81 2.25 to 2.81
Expected life of option (years) 2.5 2.5
Weighted average share price ($) 0.19 0.19
Scheme II
2008 2007
Dividend yield (%) 1.5 1.5
Expected volatility (%) 41.46 - 41.56 41.46 - 41.56
Historical volatility (%) 41.46 - 41.56 41.46 - 41.56
Risk-free interest rate (%) 2.54 to 2.81 2.54 to 2.81
Weighted average share price ($) 0.49 - 0.59 0.49 - 0.59
The expected life of the options is based on historical data and is not necessarily indicative of
exercise patterns that may occur. The expected volatility refl ects the assumption that the historical
volatility is indicative of future trends, which may also not necessarily be the actual outcome. No other
features of the option grant were incorporated into the measurement of fair value.
36. Commitments
The Group has entered into leases on its leasehold property and retail shops. These non-cancellable leases
have remaining lease terms of 1 to 15 years. The lease on the Group’s leasehold property includes a clause
to enable upward revision of the rental charge on an annual basis. The lease terms do not contain any
restriction on the Group’s activities concerning dividends, additional debt or further leasing. Future minimum
lease payments under non-cancellable operating leases are as follows as of 31 December:
Group2008 2007$’000 $’000
Due within one year 2,009 450
Due within two to fi ve years 2,543 1,470
Due after fi ve years 2,861 3,762
7,413 5,682
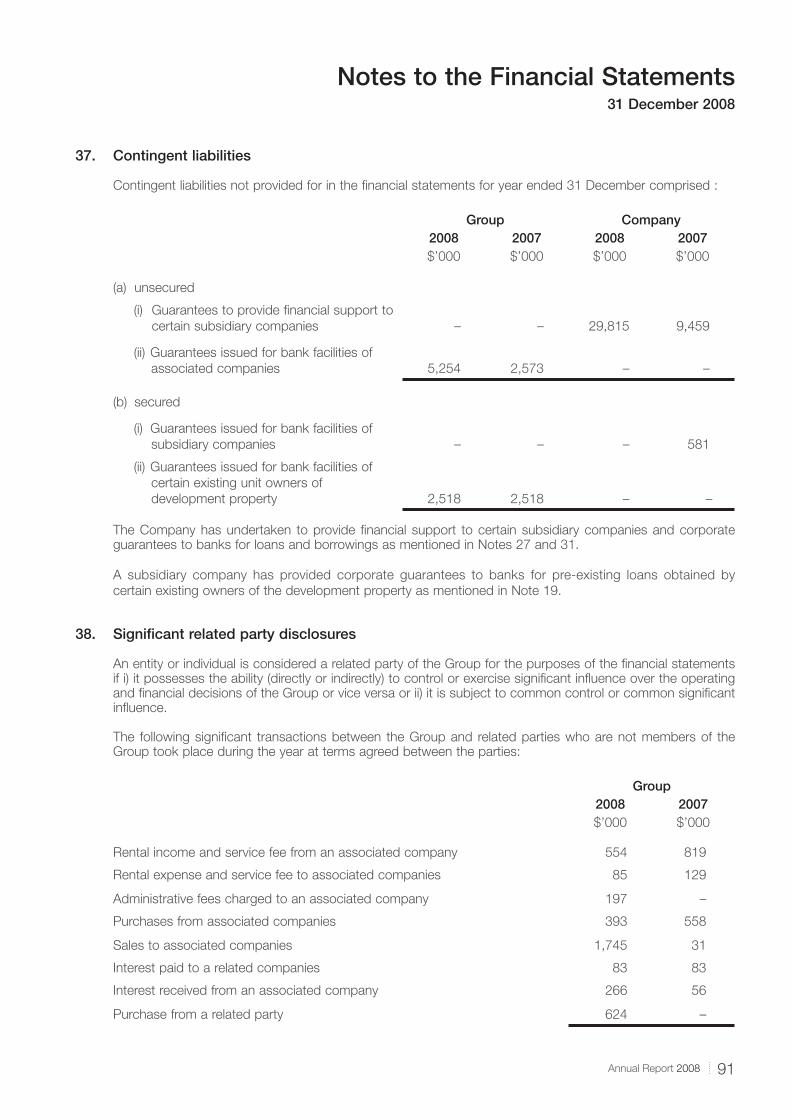
91Annual Report 2008
Notes to the Financial Statements31 December 2008
37. Contingent liabilities
Contingent liabilities not provided for in the fi nancial statements for year ended 31 December comprised :
Group Company2008 2007 2008 2007$’000 $’000 $’000 $’000
(a) unsecured
(i) Guarantees to provide fi nancial support to
certain subsidiary companies – – 29,815 9,459
(ii) Guarantees issued for bank facilities of
associated companies 5,254 2,573 – –
(b) secured
(i) Guarantees issued for bank facilities of
subsidiary companies – – – 581
(ii) Guarantees issued for bank facilities of
certain existing unit owners of
development property 2,518 2,518 – –
The Company has undertaken to provide fi nancial support to certain subsidiary companies and corporate guarantees to banks for loans and borrowings as mentioned in Notes 27 and 31.
A subsidiary company has provided corporate guarantees to banks for pre-existing loans obtained by
certain existing owners of the development property as mentioned in Note 19.
38. Signifi cant related party disclosures
An entity or individual is considered a related party of the Group for the purposes of the fi nancial statements if i) it possesses the ability (directly or indirectly) to control or exercise signifi cant infl uence over the operating and fi nancial decisions of the Group or vice versa or ii) it is subject to common control or common signifi cant infl uence.
The following signifi cant transactions between the Group and related parties who are not members of the Group took place during the year at terms agreed between the parties:
Group2008 2007$’000 $’000
Rental income and service fee from an associated company 554 819
Rental expense and service fee to associated companies 85 129
Administrative fees charged to an associated company 197 –
Purchases from associated companies 393 558
Sales to associated companies 1,745 31
Interest paid to a related companies 83 83
Interest received from an associated company 266 56
Purchase from a related party 624 –
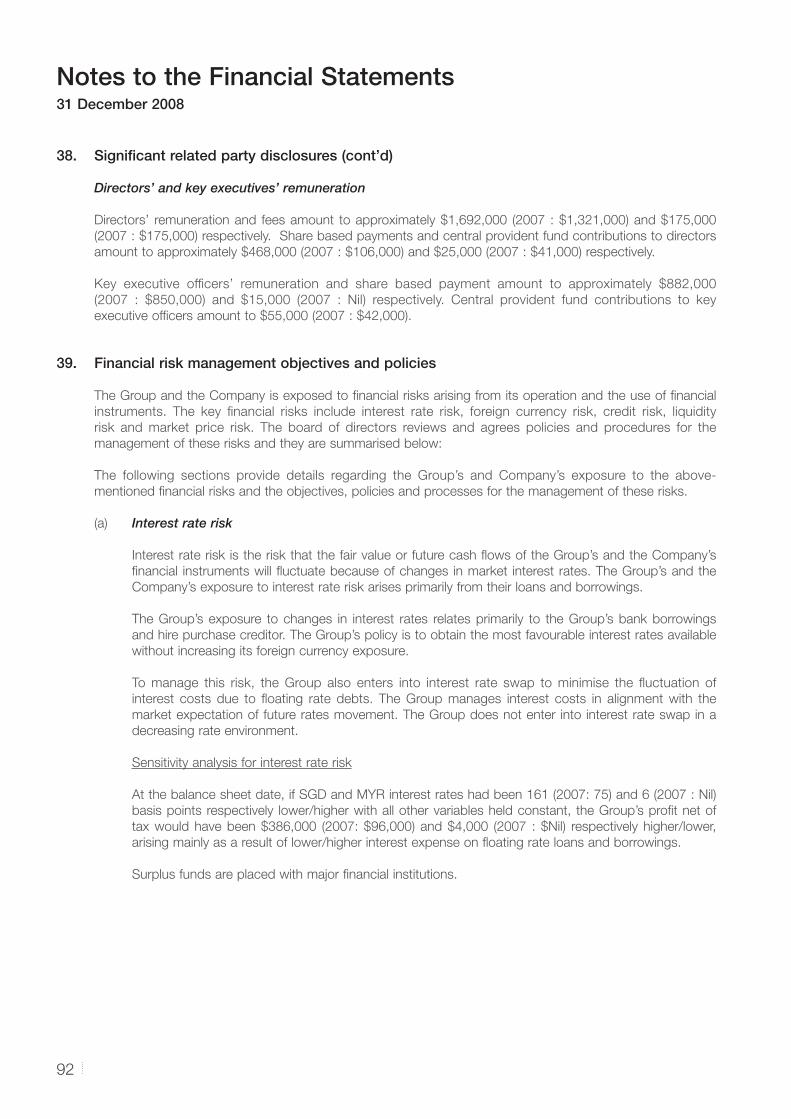
Notes to the Financial Statements31 December 2008
92
38. Signifi cant related party disclosures (cont’d)
Directors’ and key executives’ remuneration
Directors’ remuneration and fees amount to approximately $1,692,000 (2007 : $1,321,000) and $175,000
(2007 : $175,000) respectively. Share based payments and central provident fund contributions to directors
amount to approximately $468,000 (2007 : $106,000) and $25,000 (2007 : $41,000) respectively.
Key executive offi cers’ remuneration and share based payment amount to approximately $882,000
(2007 : $850,000) and $15,000 (2007 : Nil) respectively. Central provident fund contributions to key
executive offi cers amount to $55,000 (2007 : $42,000).
39. Financial risk management objectives and policies
The Group and the Company is exposed to fi nancial risks arising from its operation and the use of fi nancial
instruments. The key fi nancial risks include interest rate risk, foreign currency risk, credit risk, liquidity
risk and market price risk. The board of directors reviews and agrees policies and procedures for the
management of these risks and they are summarised below:
The following sections provide details regarding the Group’s and Company’s exposure to the above-
mentioned fi nancial risks and the objectives, policies and processes for the management of these risks.
(a) Interest rate risk
Interest rate risk is the risk that the fair value or future cash fl ows of the Group’s and the Company’s
fi nancial instruments will fl uctuate because of changes in market interest rates. The Group’s and the
Company’s exposure to interest rate risk arises primarily from their loans and borrowings.
The Group’s exposure to changes in interest rates relates primarily to the Group’s bank borrowings
and hire purchase creditor. The Group’s policy is to obtain the most favourable interest rates available
without increasing its foreign currency exposure.
To manage this risk, the Group also enters into interest rate swap to minimise the fl uctuation of
interest costs due to fl oating rate debts. The Group manages interest costs in alignment with the
market expectation of future rates movement. The Group does not enter into interest rate swap in a
decreasing rate environment.
Sensitivity analysis for interest rate risk
At the balance sheet date, if SGD and MYR interest rates had been 161 (2007: 75) and 6 (2007 : Nil)
basis points respectively lower/higher with all other variables held constant, the Group’s profi t net of
tax would have been $386,000 (2007: $96,000) and $4,000 (2007 : $Nil) respectively higher/lower,
arising mainly as a result of lower/higher interest expense on fl oating rate loans and borrowings.
Surplus funds are placed with major fi nancial institutions.
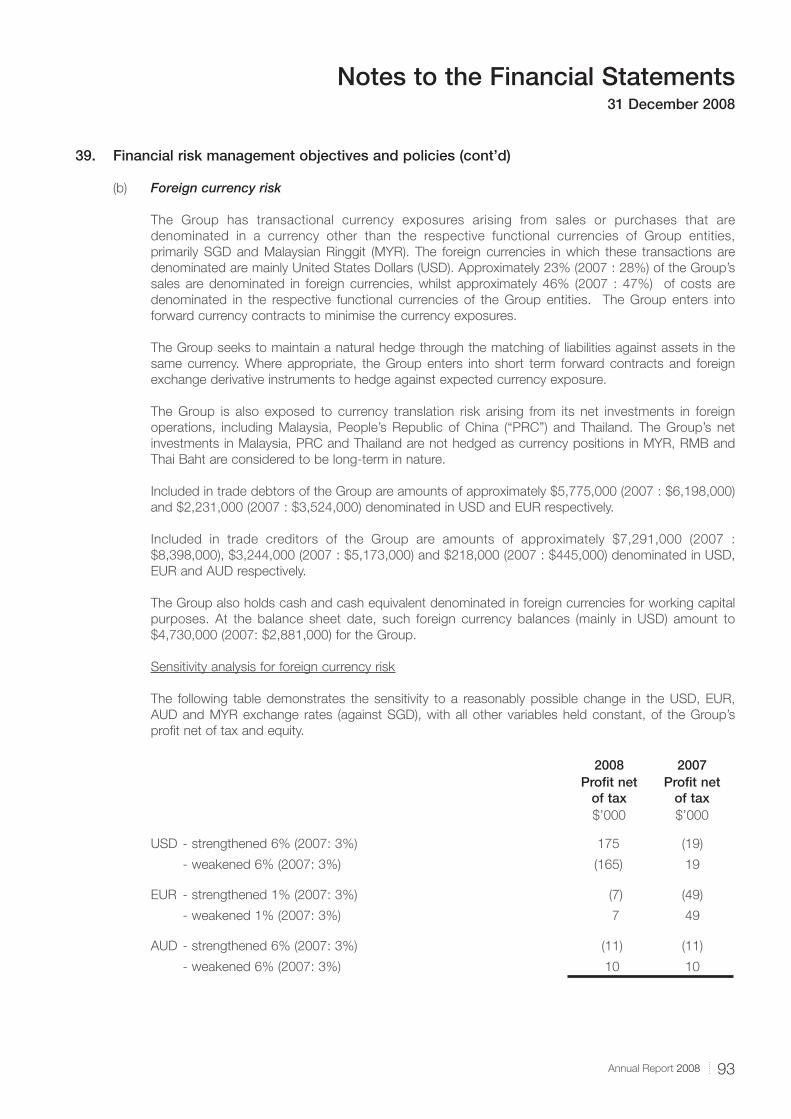
93Annual Report 2008
Notes to the Financial Statements31 December 2008
39. Financial risk management objectives and policies (cont’d)
(b) Foreign currency risk
The Group has transactional currency exposures arising from sales or purchases that are
denominated in a currency other than the respective functional currencies of Group entities,
primarily SGD and Malaysian Ringgit (MYR). The foreign currencies in which these transactions are
denominated are mainly United States Dollars (USD). Approximately 23% (2007 : 28%) of the Group’s
sales are denominated in foreign currencies, whilst approximately 46% (2007 : 47%) of costs are
denominated in the respective functional currencies of the Group entities. The Group enters into
forward currency contracts to minimise the currency exposures.
The Group seeks to maintain a natural hedge through the matching of liabilities against assets in the
same currency. Where appropriate, the Group enters into short term forward contracts and foreign
exchange derivative instruments to hedge against expected currency exposure.
The Group is also exposed to currency translation risk arising from its net investments in foreign
operations, including Malaysia, People’s Republic of China (“PRC”) and Thailand. The Group’s net
investments in Malaysia, PRC and Thailand are not hedged as currency positions in MYR, RMB and
Thai Baht are considered to be long-term in nature.
Included in trade debtors of the Group are amounts of approximately $5,775,000 (2007 : $6,198,000)
and $2,231,000 (2007 : $3,524,000) denominated in USD and EUR respectively.
Included in trade creditors of the Group are amounts of approximately $7,291,000 (2007 :
$8,398,000), $3,244,000 (2007 : $5,173,000) and $218,000 (2007 : $445,000) denominated in USD,
EUR and AUD respectively.
The Group also holds cash and cash equivalent denominated in foreign currencies for working capital
purposes. At the balance sheet date, such foreign currency balances (mainly in USD) amount to
$4,730,000 (2007: $2,881,000) for the Group.
Sensitivity analysis for foreign currency risk
The following table demonstrates the sensitivity to a reasonably possible change in the USD, EUR,
AUD and MYR exchange rates (against SGD), with all other variables held constant, of the Group’s
profi t net of tax and equity.
2008 2007Profi t net
of taxProfi t net
of tax$’000 $’000
USD - strengthened 6% (2007: 3%) 175 (19)
- weakened 6% (2007: 3%) (165) 19
EUR - strengthened 1% (2007: 3%) (7) (49)
- weakened 1% (2007: 3%) 7 49
AUD - strengthened 6% (2007: 3%) (11) (11)
- weakened 6% (2007: 3%) 10 10
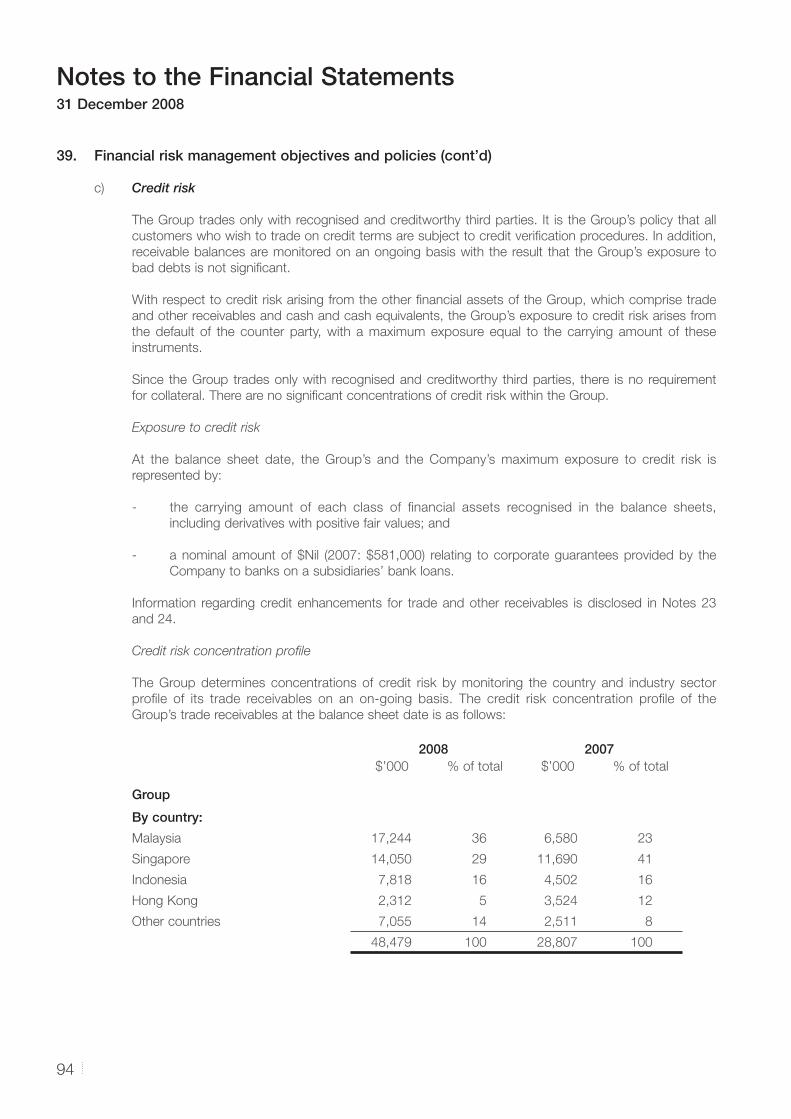
Notes to the Financial Statements31 December 2008
94
39. Financial risk management objectives and policies (cont’d)
c) Credit risk
The Group trades only with recognised and creditworthy third parties. It is the Group’s policy that all
customers who wish to trade on credit terms are subject to credit verifi cation procedures. In addition,
receivable balances are monitored on an ongoing basis with the result that the Group’s exposure to
bad debts is not signifi cant.
With respect to credit risk arising from the other fi nancial assets of the Group, which comprise trade
and other receivables and cash and cash equivalents, the Group’s exposure to credit risk arises from
the default of the counter party, with a maximum exposure equal to the carrying amount of these
instruments.
Since the Group trades only with recognised and creditworthy third parties, there is no requirement
for collateral. There are no signifi cant concentrations of credit risk within the Group.
Exposure to credit risk
At the balance sheet date, the Group’s and the Company’s maximum exposure to credit risk is
represented by:
- the carrying amount of each class of fi nancial assets recognised in the balance sheets,
including derivatives with positive fair values; and
- a nominal amount of $Nil (2007: $581,000) relating to corporate guarantees provided by the
Company to banks on a subsidiaries’ bank loans.
Information regarding credit enhancements for trade and other receivables is disclosed in Notes 23
and 24.
Credit risk concentration profi le
The Group determines concentrations of credit risk by monitoring the country and industry sector
profi le of its trade receivables on an on-going basis. The credit risk concentration profi le of the
Group’s trade receivables at the balance sheet date is as follows:
2008 2007$’000 % of total $’000 % of total
Group
By country:
Malaysia 17,244 36 6,580 23
Singapore 14,050 29 11,690 41
Indonesia 7,818 16 4,502 16
Hong Kong 2,312 5 3,524 12
Other countries 7,055 14 2,511 8
48,479 100 28,807 100
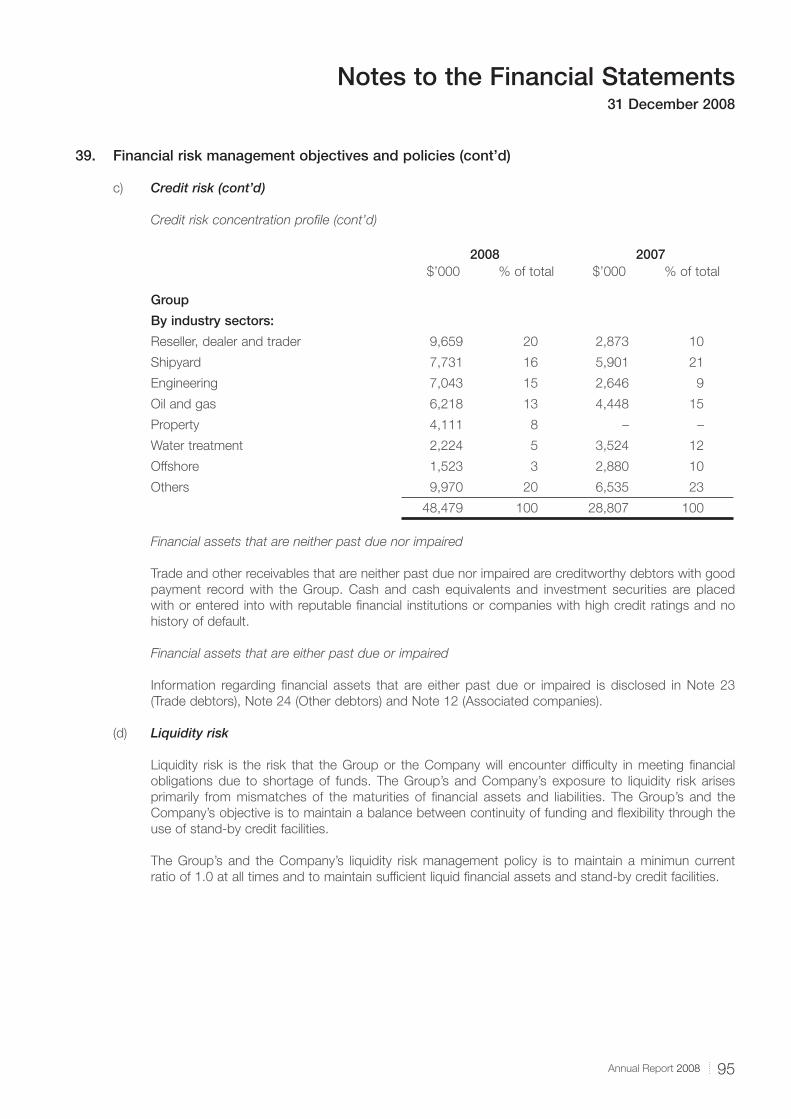
95Annual Report 2008
Notes to the Financial Statements31 December 2008
39. Financial risk management objectives and policies (cont’d)
c) Credit risk (cont’d)
Credit risk concentration profi le (cont’d)
2008 2007$’000 % of total $’000 % of total
Group
By industry sectors:
Reseller, dealer and trader 9,659 20 2,873 10
Shipyard 7,731 16 5,901 21
Engineering 7,043 15 2,646 9
Oil and gas 6,218 13 4,448 15
Property 4,111 8 – –
Water treatment 2,224 5 3,524 12
Offshore 1,523 3 2,880 10
Others 9,970 20 6,535 23
48,479 100 28,807 100
Financial assets that are neither past due nor impaired
Trade and other receivables that are neither past due nor impaired are creditworthy debtors with good
payment record with the Group. Cash and cash equivalents and investment securities are placed
with or entered into with reputable fi nancial institutions or companies with high credit ratings and no
history of default.
Financial assets that are either past due or impaired
Information regarding fi nancial assets that are either past due or impaired is disclosed in Note 23
(Trade debtors), Note 24 (Other debtors) and Note 12 (Associated companies).
(d) Liquidity risk
Liquidity risk is the risk that the Group or the Company will encounter diffi culty in meeting fi nancial
obligations due to shortage of funds. The Group’s and Company’s exposure to liquidity risk arises
primarily from mismatches of the maturities of fi nancial assets and liabilities. The Group’s and the
Company’s objective is to maintain a balance between continuity of funding and fl exibility through the
use of stand-by credit facilities.
The Group’s and the Company’s liquidity risk management policy is to maintain a minimun current
ratio of 1.0 at all times and to maintain suffi cient liquid fi nancial assets and stand-by credit facilities.
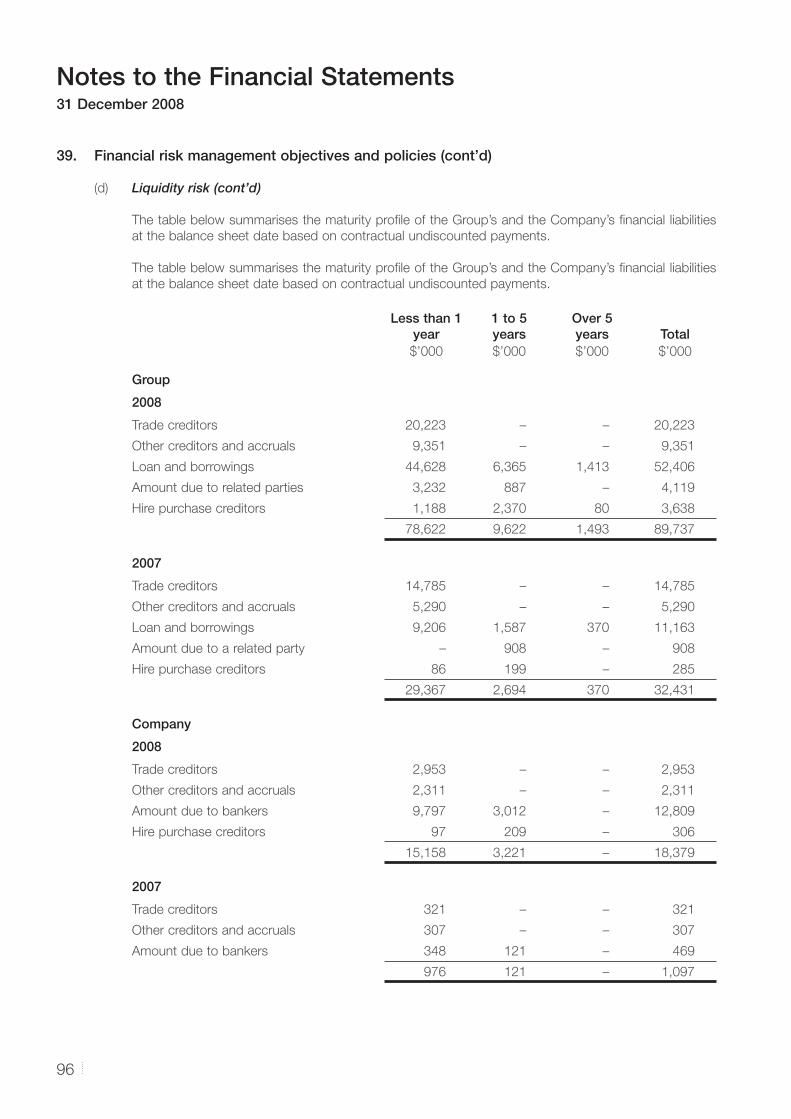
Notes to the Financial Statements31 December 2008
96
39. Financial risk management objectives and policies (cont’d)
(d) Liquidity risk (cont’d)
The table below summarises the maturity profi le of the Group’s and the Company’s fi nancial liabilities
at the balance sheet date based on contractual undiscounted payments.
The table below summarises the maturity profi le of the Group’s and the Company’s fi nancial liabilities
at the balance sheet date based on contractual undiscounted payments.
Less than 1 year
1 to 5 years
Over 5 years Total
$’000 $’000 $’000 $’000
Group
2008
Trade creditors 20,223 – – 20,223
Other creditors and accruals 9,351 – – 9,351
Loan and borrowings 44,628 6,365 1,413 52,406
Amount due to related parties 3,232 887 – 4,119
Hire purchase creditors 1,188 2,370 80 3,638
78,622 9,622 1,493 89,737
2007
Trade creditors 14,785 – – 14,785
Other creditors and accruals 5,290 – – 5,290
Loan and borrowings 9,206 1,587 370 11,163
Amount due to a related party – 908 – 908
Hire purchase creditors 86 199 – 285
29,367 2,694 370 32,431
Company
2008
Trade creditors 2,953 – – 2,953
Other creditors and accruals 2,311 – – 2,311
Amount due to bankers 9,797 3,012 – 12,809
Hire purchase creditors 97 209 – 306
15,158 3,221 – 18,379
2007
Trade creditors 321 – – 321
Other creditors and accruals 307 – – 307
Amount due to bankers 348 121 – 469
976 121 – 1,097
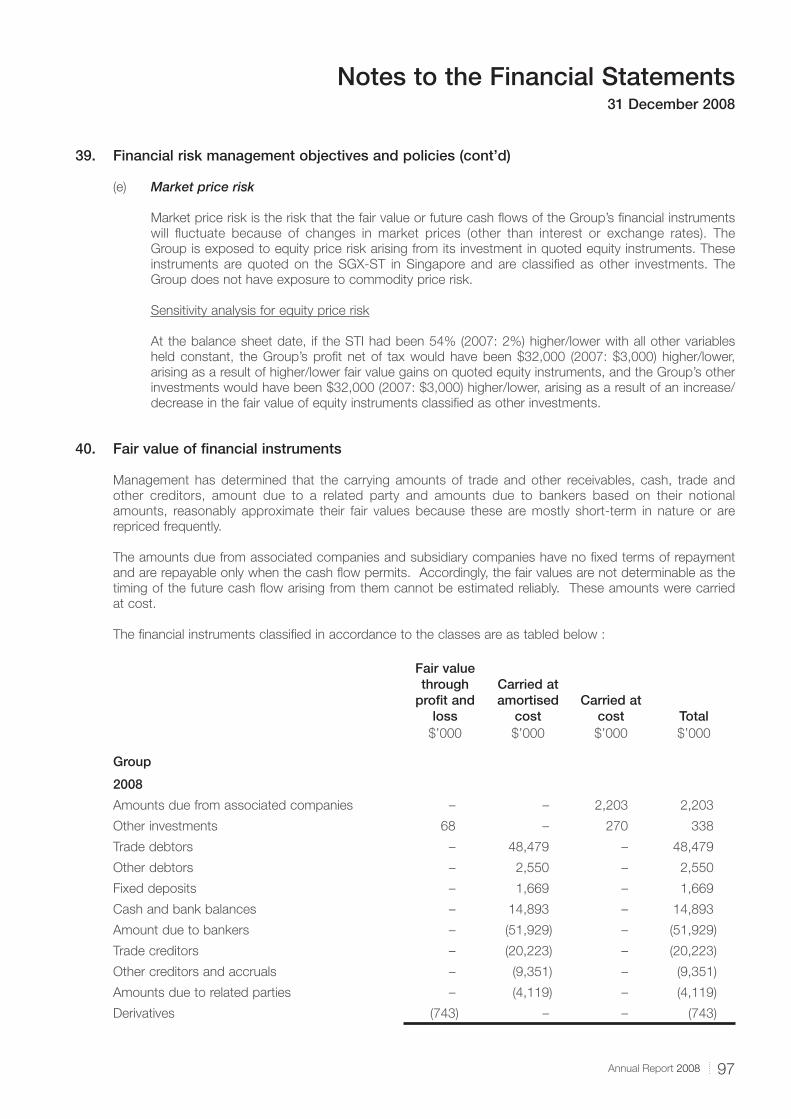
97Annual Report 2008
Notes to the Financial Statements31 December 2008
39. Financial risk management objectives and policies (cont’d)
(e) Market price risk
Market price risk is the risk that the fair value or future cash fl ows of the Group’s fi nancial instruments
will fl uctuate because of changes in market prices (other than interest or exchange rates). The
Group is exposed to equity price risk arising from its investment in quoted equity instruments. These
instruments are quoted on the SGX-ST in Singapore and are classifi ed as other investments. The
Group does not have exposure to commodity price risk.
Sensitivity analysis for equity price risk
At the balance sheet date, if the STI had been 54% (2007: 2%) higher/lower with all other variables
held constant, the Group’s profi t net of tax would have been $32,000 (2007: $3,000) higher/lower,
arising as a result of higher/lower fair value gains on quoted equity instruments, and the Group’s other
investments would have been $32,000 (2007: $3,000) higher/lower, arising as a result of an increase/
decrease in the fair value of equity instruments classifi ed as other investments.
40. Fair value of fi nancial instruments
Management has determined that the carrying amounts of trade and other receivables, cash, trade and
other creditors, amount due to a related party and amounts due to bankers based on their notional
amounts, reasonably approximate their fair values because these are mostly short-term in nature or are
repriced frequently.
The amounts due from associated companies and subsidiary companies have no fi xed terms of repayment
and are repayable only when the cash fl ow permits. Accordingly, the fair values are not determinable as the
timing of the future cash fl ow arising from them cannot be estimated reliably. These amounts were carried
at cost.
The fi nancial instruments classifi ed in accordance to the classes are as tabled below :
Fair value through
profi t and loss
Carried at amortised
costCarried at
cost Total$’000 $’000 $’000 $’000
Group
2008
Amounts due from associated companies – – 2,203 2,203
Other investments 68 – 270 338
Trade debtors – 48,479 – 48,479
Other debtors – 2,550 – 2,550
Fixed deposits – 1,669 – 1,669
Cash and bank balances – 14,893 – 14,893
Amount due to bankers – (51,929) – (51,929)
Trade creditors – (20,223) – (20,223)
Other creditors and accruals – (9,351) – (9,351)
Amounts due to related parties – (4,119) – (4,119)
Derivatives (743) – – (743)
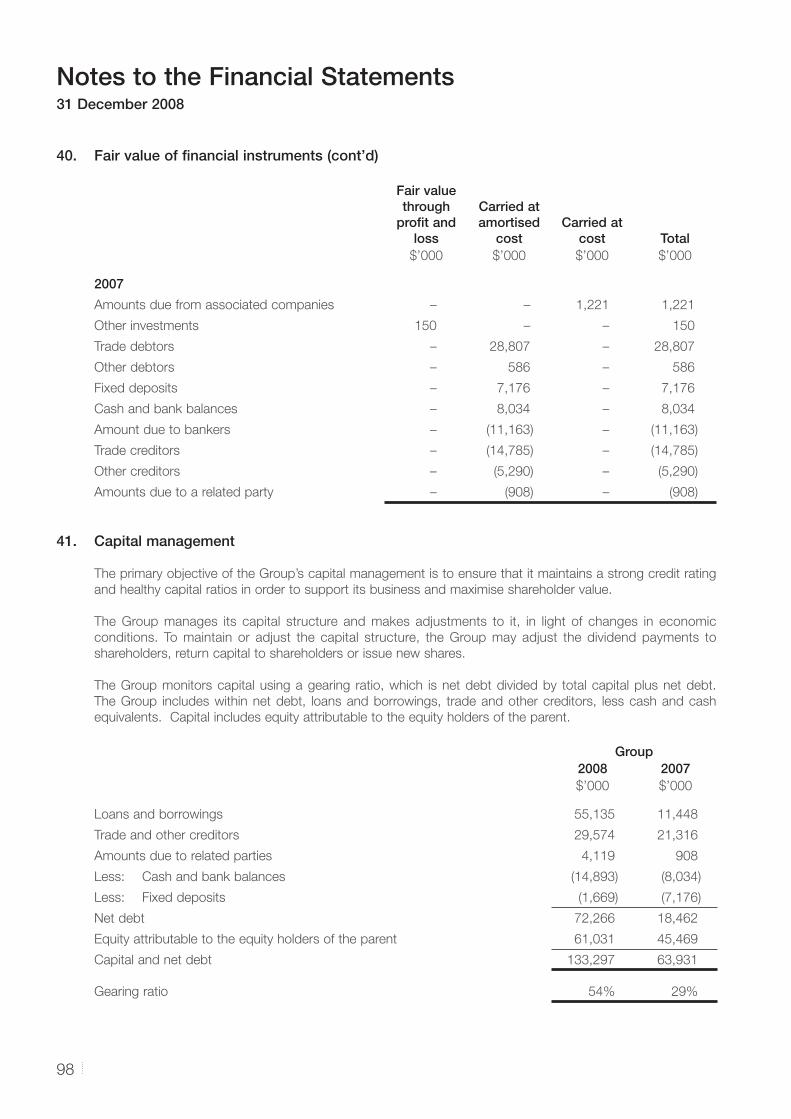
Notes to the Financial Statements31 December 2008
98
40. Fair value of fi nancial instruments (cont’d)
Fair value through
profi t and loss
Carried at amortised
costCarried at
cost Total$’000 $’000 $’000 $’000
2007
Amounts due from associated companies – – 1,221 1,221
Other investments 150 – – 150
Trade debtors – 28,807 – 28,807
Other debtors – 586 – 586
Fixed deposits – 7,176 – 7,176
Cash and bank balances – 8,034 – 8,034
Amount due to bankers – (11,163) – (11,163)
Trade creditors – (14,785) – (14,785)
Other creditors – (5,290) – (5,290)
Amounts due to a related party – (908) – (908)
41. Capital management
The primary objective of the Group’s capital management is to ensure that it maintains a strong credit rating
and healthy capital ratios in order to support its business and maximise shareholder value.
The Group manages its capital structure and makes adjustments to it, in light of changes in economic
conditions. To maintain or adjust the capital structure, the Group may adjust the dividend payments to
shareholders, return capital to shareholders or issue new shares.
The Group monitors capital using a gearing ratio, which is net debt divided by total capital plus net debt.
The Group includes within net debt, loans and borrowings, trade and other creditors, less cash and cash
equivalents. Capital includes equity attributable to the equity holders of the parent.
Group2008 2007$’000 $’000
Loans and borrowings 55,135 11,448
Trade and other creditors 29,574 21,316
Amounts due to related parties 4,119 908
Less: Cash and bank balances (14,893) (8,034)
Less: Fixed deposits (1,669) (7,176)
Net debt 72,266 18,462
Equity attributable to the equity holders of the parent 61,031 45,469
Capital and net debt 133,297 63,931
Gearing ratio 54% 29%
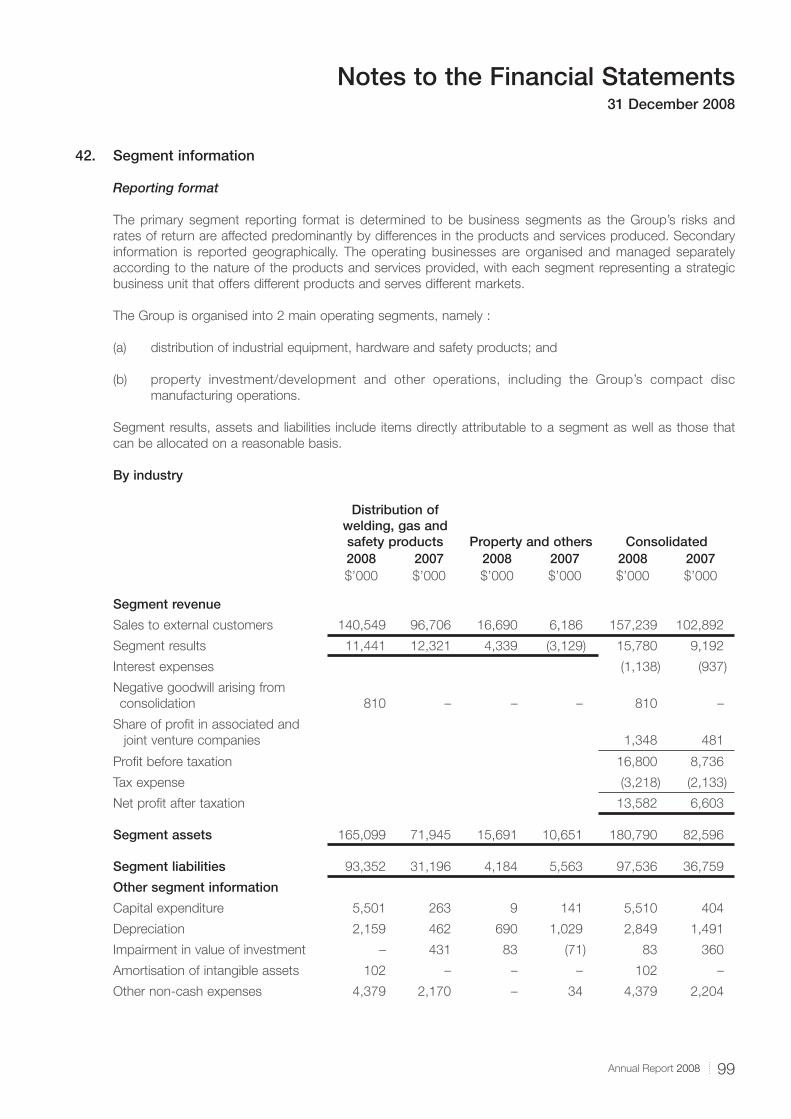
99Annual Report 2008
Notes to the Financial Statements31 December 2008
42. Segment information
Reporting format
The primary segment reporting format is determined to be business segments as the Group’s risks and
rates of return are affected predominantly by differences in the products and services produced. Secondary
information is reported geographically. The operating businesses are organised and managed separately
according to the nature of the products and services provided, with each segment representing a strategic
business unit that offers different products and serves different markets.
The Group is organised into 2 main operating segments, namely :
(a) distribution of industrial equipment, hardware and safety products; and
(b) property investment/development and other operations, including the Group’s compact disc
manufacturing operations.
Segment results, assets and liabilities include items directly attributable to a segment as well as those that
can be allocated on a reasonable basis.
By industry
Distribution of welding, gas and safety products Property and others Consolidated2008 2007 2008 2007 2008 2007$’000 $’000 $’000 $’000 $’000 $’000
Segment revenue
Sales to external customers 140,549 96,706 16,690 6,186 157,239 102,892
Segment results 11,441 12,321 4,339 (3,129) 15,780 9,192
Interest expenses (1,138) (937)
Negative goodwill arising from
consolidation 810 – – – 810 –
Share of profi t in associated and
joint venture companies 1,348 481
Profi t before taxation 16,800 8,736
Tax expense (3,218) (2,133)
Net profi t after taxation 13,582 6,603
Segment assets 165,099 71,945 15,691 10,651 180,790 82,596
Segment liabilities 93,352 31,196 4,184 5,563 97,536 36,759
Other segment information
Capital expenditure 5,501 263 9 141 5,510 404
Depreciation 2,159 462 690 1,029 2,849 1,491
Impairment in value of investment – 431 83 (71) 83 360
Amortisation of intangible assets 102 – – – 102 –
Other non-cash expenses 4,379 2,170 – 34 4,379 2,204
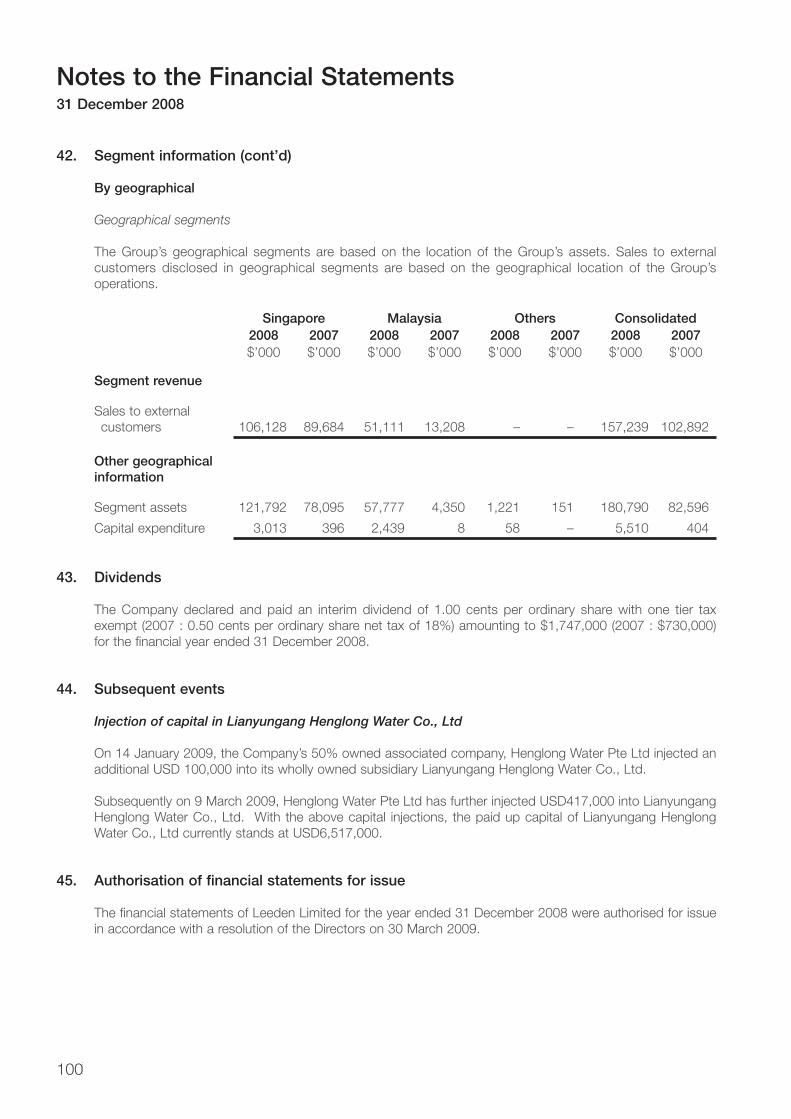
Notes to the Financial Statements31 December 2008
100
42. Segment information (cont’d)
By geographical
Geographical segments
The Group’s geographical segments are based on the location of the Group’s assets. Sales to external
customers disclosed in geographical segments are based on the geographical location of the Group’s
operations.
Singapore Malaysia Others Consolidated2008 2007 2008 2007 2008 2007 2008 2007$’000 $’000 $’000 $’000 $’000 $’000 $’000 $’000
Segment revenue
Sales to external
customers 106,128 89,684 51,111 13,208 – – 157,239 102,892
Other geographical information
Segment assets 121,792 78,095 57,777 4,350 1,221 151 180,790 82,596
Capital expenditure 3,013 396 2,439 8 58 – 5,510 404
43. Dividends
The Company declared and paid an interim dividend of 1.00 cents per ordinary share with one tier tax
exempt (2007 : 0.50 cents per ordinary share net tax of 18%) amounting to $1,747,000 (2007 : $730,000)
for the fi nancial year ended 31 December 2008.
44. Subsequent events
Injection of capital in Lianyungang Henglong Water Co., Ltd
On 14 January 2009, the Company’s 50% owned associated company, Henglong Water Pte Ltd injected an
additional USD 100,000 into its wholly owned subsidiary Lianyungang Henglong Water Co., Ltd.
Subsequently on 9 March 2009, Henglong Water Pte Ltd has further injected USD417,000 into Lianyungang
Henglong Water Co., Ltd. With the above capital injections, the paid up capital of Lianyungang Henglong
Water Co., Ltd currently stands at USD6,517,000.
45. Authorisation of fi nancial statements for issue
The fi nancial statements of Leeden Limited for the year ended 31 December 2008 were authorised for issue
in accordance with a resolution of the Directors on 30 March 2009.
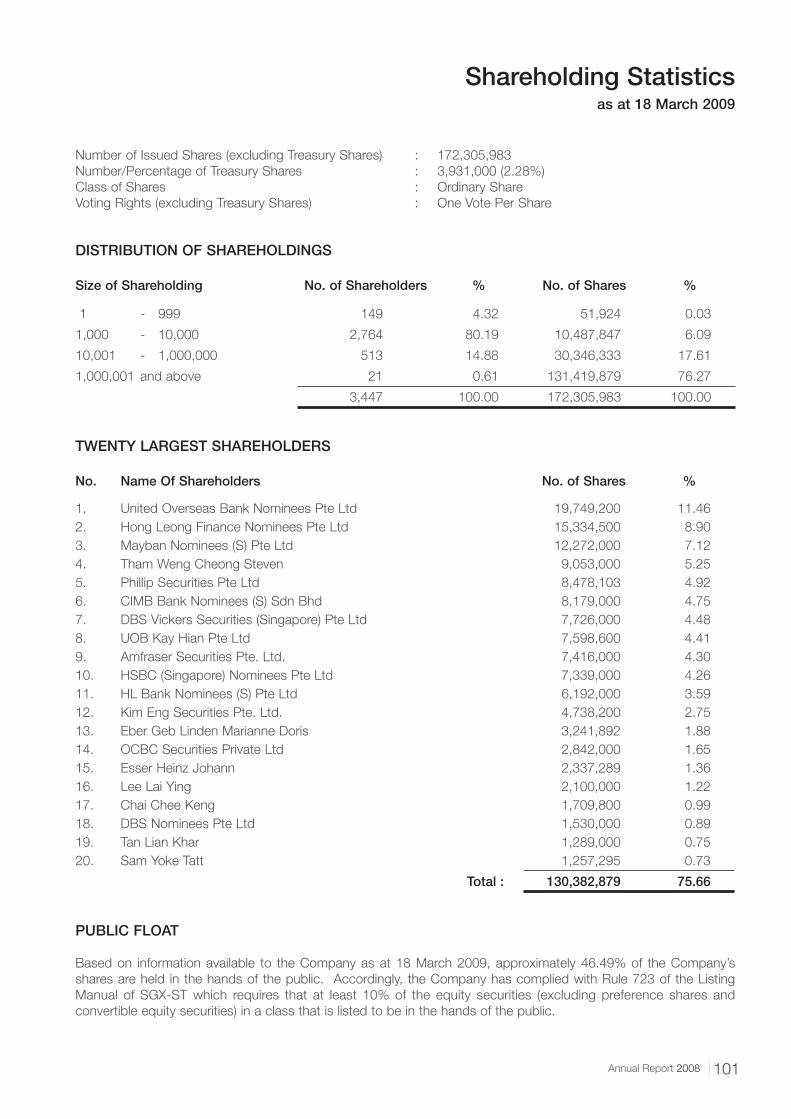
101Annual Report 2008
Shareholding Statisticsas at 18 March 2009
Number of Issued Shares (excluding Treasury Shares) : 172,305,983
Number/Percentage of Treasury Shares : 3,931,000 (2.28%)
Class of Shares : Ordinary Share
Voting Rights (excluding Treasury Shares) : One Vote Per Share
DISTRIBUTION OF SHAREHOLDINGS
Size of Shareholding No. of Shareholders % No. of Shares %
1 - 999 149 4.32 51,924 0.03
1,000 - 10,000 2,764 80.19 10,487,847 6.09
10,001 - 1,000,000 513 14.88 30,346,333 17.61
1,000,001 and above 21 0.61 131,419,879 76.27
3,447 100.00 172,305,983 100.00
TWENTY LARGEST SHAREHOLDERS
No. Name Of Shareholders No. of Shares %
1. United Overseas Bank Nominees Pte Ltd 19,749,200 11.46
2. Hong Leong Finance Nominees Pte Ltd 15,334,500 8.90
3. Mayban Nominees (S) Pte Ltd 12,272,000 7.12
4. Tham Weng Cheong Steven 9,053,000 5.25
5. Phillip Securities Pte Ltd 8,478,103 4.92
6. CIMB Bank Nominees (S) Sdn Bhd 8,179,000 4.75
7. DBS Vickers Securities (Singapore) Pte Ltd 7,726,000 4.48
8. UOB Kay Hian Pte Ltd 7,598,600 4.41
9. Amfraser Securities Pte. Ltd. 7,416,000 4.30
10. HSBC (Singapore) Nominees Pte Ltd 7,339,000 4.26
11. HL Bank Nominees (S) Pte Ltd 6,192,000 3.59
12. Kim Eng Securities Pte. Ltd. 4,738,200 2.75
13. Eber Geb Linden Marianne Doris 3,241,892 1.88
14. OCBC Securities Private Ltd 2,842,000 1.65
15. Esser Heinz Johann 2,337,289 1.36
16. Lee Lai Ying 2,100,000 1.22
17. Chai Chee Keng 1,709,800 0.99
18. DBS Nominees Pte Ltd 1,530,000 0.89
19. Tan Lian Khar 1,289,000 0.75
20. Sam Yoke Tatt 1,257,295 0.73
Total : 130,382,879 75.66
PUBLIC FLOAT
Based on information available to the Company as at 18 March 2009, approximately 46.49% of the Company’s
shares are held in the hands of the public. Accordingly, the Company has complied with Rule 723 of the Listing
Manual of SGX-ST which requires that at least 10% of the equity securities (excluding preference shares and
convertible equity securities) in a class that is listed to be in the hands of the public.
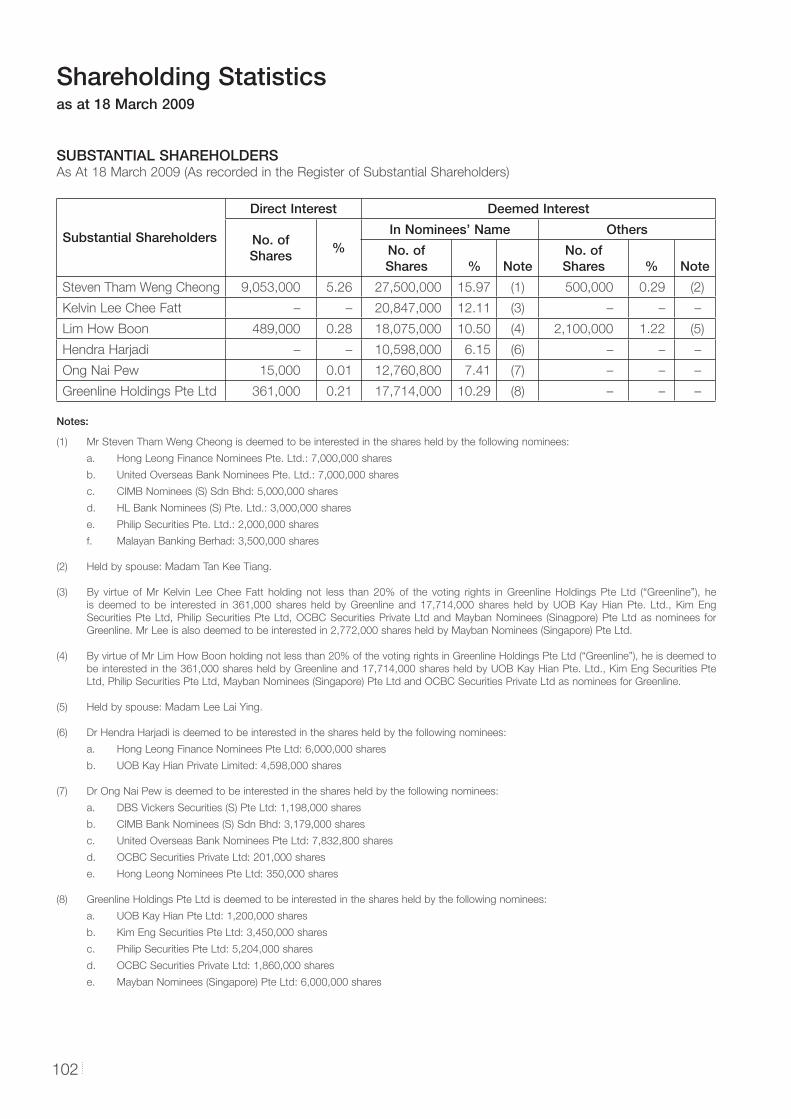
Shareholding Statisticsas at 18 March 2009
102
SUBSTANTIAL SHAREHOLDERS As At 18 March 2009 (As recorded in the Register of Substantial Shareholders)
Substantial Shareholders
Direct Interest Deemed Interest
No. of Shares
%In Nominees’ Name Others
No. of Shares % Note
No. of Shares % Note
Steven Tham Weng Cheong 9,053,000 5.26 27,500,000 15.97 (1) 500,000 0.29 (2)
Kelvin Lee Chee Fatt – – 20,847,000 12.11 (3) – – –
Lim How Boon 489,000 0.28 18,075,000 10.50 (4) 2,100,000 1.22 (5)
Hendra Harjadi – – 10,598,000 6.15 (6) – – –
Ong Nai Pew 15,000 0.01 12,760,800 7.41 (7) – – –
Greenline Holdings Pte Ltd 361,000 0.21 17,714,000 10.29 (8) – – –
Notes:
(1) Mr Steven Tham Weng Cheong is deemed to be interested in the shares held by the following nominees:
a. Hong Leong Finance Nominees Pte. Ltd.: 7,000,000 shares
b. United Overseas Bank Nominees Pte. Ltd.: 7,000,000 shares
c. CIMB Nominees (S) Sdn Bhd: 5,000,000 shares
d. HL Bank Nominees (S) Pte. Ltd.: 3,000,000 shares
e. Philip Securities Pte. Ltd.: 2,000,000 shares
f. Malayan Banking Berhad: 3,500,000 shares
(2) Held by spouse: Madam Tan Kee Tiang.
(3) By virtue of Mr Kelvin Lee Chee Fatt holding not less than 20% of the voting rights in Greenline Holdings Pte Ltd (“Greenline”), he
is deemed to be interested in 361,000 shares held by Greenline and 17,714,000 shares held by UOB Kay Hian Pte. Ltd., Kim Eng
Securities Pte Ltd, Philip Securities Pte Ltd, OCBC Securities Private Ltd and Mayban Nominees (Sinagpore) Pte Ltd as nominees for
Greenline. Mr Lee is also deemed to be interested in 2,772,000 shares held by Mayban Nominees (Singapore) Pte Ltd.
(4) By virtue of Mr Lim How Boon holding not less than 20% of the voting rights in Greenline Holdings Pte Ltd (“Greenline”), he is deemed to
be interested in the 361,000 shares held by Greenline and 17,714,000 shares held by UOB Kay Hian Pte. Ltd., Kim Eng Securities Pte
Ltd, Philip Securities Pte Ltd, Mayban Nominees (Singapore) Pte Ltd and OCBC Securities Private Ltd as nominees for Greenline.
(5) Held by spouse: Madam Lee Lai Ying.
(6) Dr Hendra Harjadi is deemed to be interested in the shares held by the following nominees:
a. Hong Leong Finance Nominees Pte Ltd: 6,000,000 shares
b. UOB Kay Hian Private Limited: 4,598,000 shares
(7) Dr Ong Nai Pew is deemed to be interested in the shares held by the following nominees:
a. DBS Vickers Securities (S) Pte Ltd: 1,198,000 shares
b. CIMB Bank Nominees (S) Sdn Bhd: 3,179,000 shares
c. United Overseas Bank Nominees Pte Ltd: 7,832,800 shares
d. OCBC Securities Private Ltd: 201,000 shares
e. Hong Leong Nominees Pte Ltd: 350,000 shares
(8) Greenline Holdings Pte Ltd is deemed to be interested in the shares held by the following nominees:
a. UOB Kay Hian Pte Ltd: 1,200,000 shares
b. Kim Eng Securities Pte Ltd: 3,450,000 shares
c. Philip Securities Pte Ltd: 5,204,000 shares
d. OCBC Securities Private Ltd: 1,860,000 shares
e. Mayban Nominees (Singapore) Pte Ltd: 6,000,000 shares
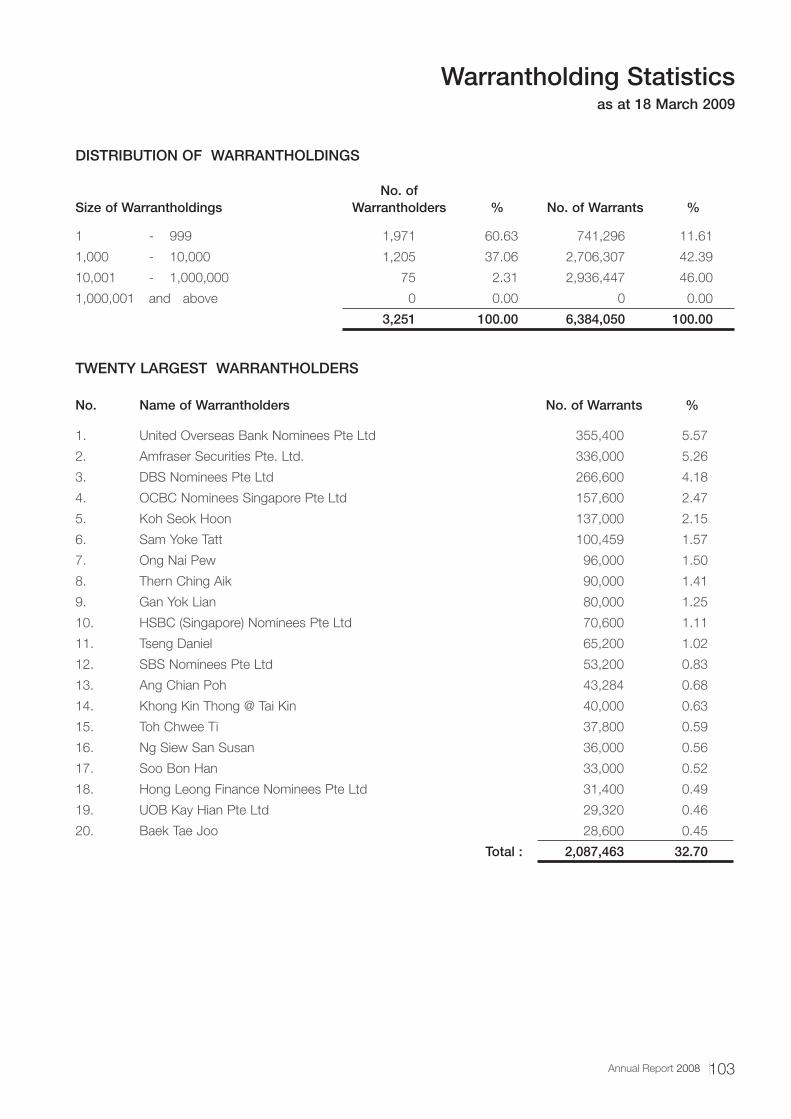
103Annual Report 2008
Warrantholding Statisticsas at 18 March 2009
DISTRIBUTION OF WARRANTHOLDINGS
No. of Size of Warrantholdings Warrantholders % No. of Warrants %
1 - 999 1,971 60.63 741,296 11.61
1,000 - 10,000 1,205 37.06 2,706,307 42.39
10,001 - 1,000,000 75 2.31 2,936,447 46.00
1,000,001 and above 0 0.00 0 0.00
3,251 100.00 6,384,050 100.00
TWENTY LARGEST WARRANTHOLDERS
No. Name of Warrantholders No. of Warrants %
1. United Overseas Bank Nominees Pte Ltd 355,400 5.57
2. Amfraser Securities Pte. Ltd. 336,000 5.26
3. DBS Nominees Pte Ltd 266,600 4.18
4. OCBC Nominees Singapore Pte Ltd 157,600 2.47
5. Koh Seok Hoon 137,000 2.15
6. Sam Yoke Tatt 100,459 1.57
7. Ong Nai Pew 96,000 1.50
8. Thern Ching Aik 90,000 1.41
9. Gan Yok Lian 80,000 1.25
10. HSBC (Singapore) Nominees Pte Ltd 70,600 1.11
11. Tseng Daniel 65,200 1.02
12. SBS Nominees Pte Ltd 53,200 0.83
13. Ang Chian Poh 43,284 0.68
14. Khong Kin Thong @ Tai Kin 40,000 0.63
15. Toh Chwee Ti 37,800 0.59
16. Ng Siew San Susan 36,000 0.56
17. Soo Bon Han 33,000 0.52
18. Hong Leong Finance Nominees Pte Ltd 31,400 0.49
19. UOB Kay Hian Pte Ltd 29,320 0.46
20. Baek Tae Joo 28,600 0.45
Total : 2,087,463 32.70
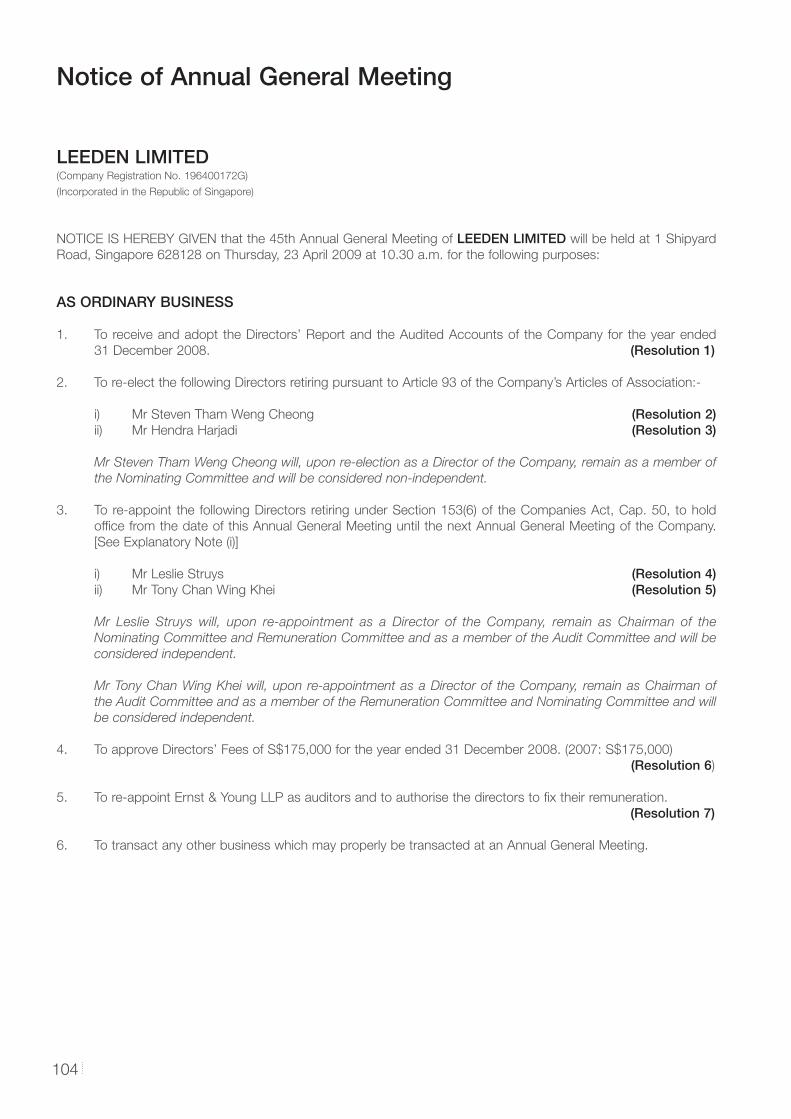
Notice of Annual General Meeting
104
LEEDEN LIMITED(Company Registration No. 196400172G)
(Incorporated in the Republic of Singapore)
NOTICE IS HEREBY GIVEN that the 45th Annual General Meeting of LEEDEN LIMITED will be held at 1 Shipyard
Road, Singapore 628128 on Thursday, 23 April 2009 at 10.30 a.m. for the following purposes:
AS ORDINARY BUSINESS
1. To receive and adopt the Directors’ Report and the Audited Accounts of the Company for the year ended
31 December 2008. (Resolution 1)
2. To re-elect the following Directors retiring pursuant to Article 93 of the Company’s Articles of Association:-
i) Mr Steven Tham Weng Cheong (Resolution 2) ii) Mr Hendra Harjadi (Resolution 3)
Mr Steven Tham Weng Cheong will, upon re-election as a Director of the Company, remain as a member of
the Nominating Committee and will be considered non-independent.
3. To re-appoint the following Directors retiring under Section 153(6) of the Companies Act, Cap. 50, to hold
offi ce from the date of this Annual General Meeting until the next Annual General Meeting of the Company.
[See Explanatory Note (i)]
i) Mr Leslie Struys (Resolution 4) ii) Mr Tony Chan Wing Khei (Resolution 5)
Mr Leslie Struys will, upon re-appointment as a Director of the Company, remain as Chairman of the
Nominating Committee and Remuneration Committee and as a member of the Audit Committee and will be
considered independent.
Mr Tony Chan Wing Khei will, upon re-appointment as a Director of the Company, remain as Chairman of
the Audit Committee and as a member of the Remuneration Committee and Nominating Committee and will
be considered independent.
4. To approve Directors’ Fees of S$175,000 for the year ended 31 December 2008. (2007: S$175,000)
(Resolution 6)
5. To re-appoint Ernst & Young LLP as auditors and to authorise the directors to fi x their remuneration.
(Resolution 7)
6. To transact any other business which may properly be transacted at an Annual General Meeting.
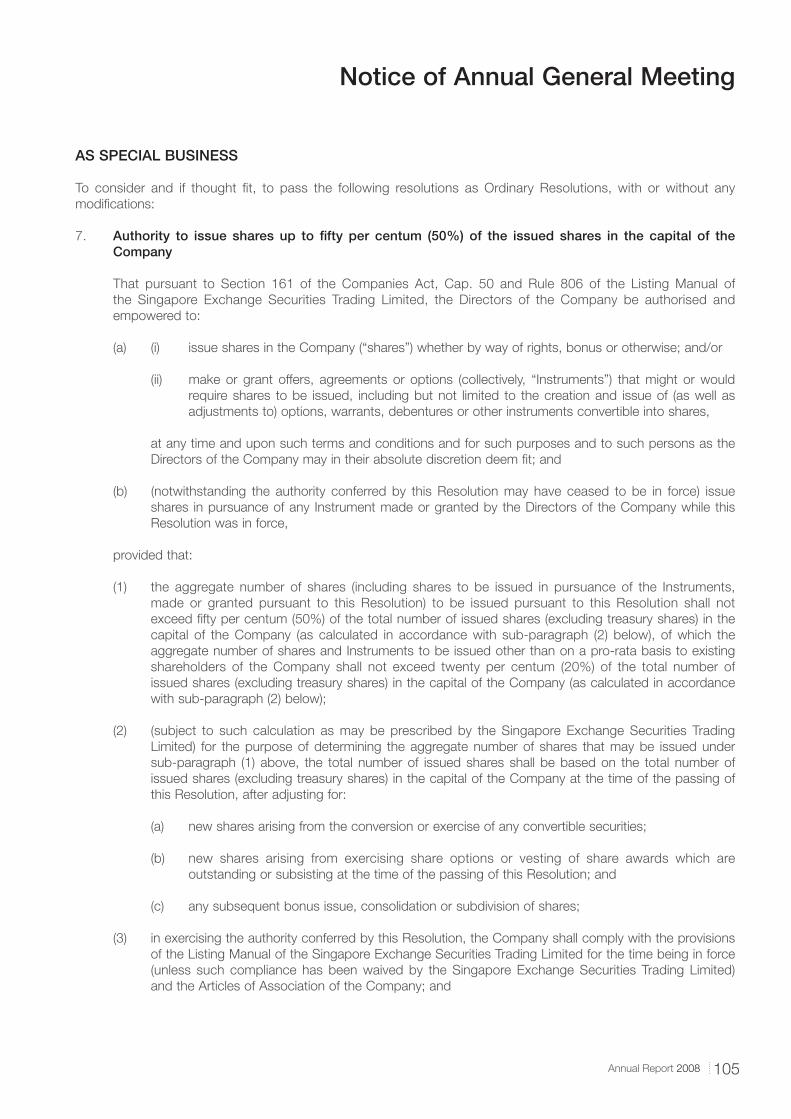
105Annual Report 2008
Notice of Annual General Meeting
AS SPECIAL BUSINESS
To consider and if thought fi t, to pass the following resolutions as Ordinary Resolutions, with or without any
modifi cations:
7. Authority to issue shares up to fi fty per centum (50%) of the issued shares in the capital of the Company
That pursuant to Section 161 of the Companies Act, Cap. 50 and Rule 806 of the Listing Manual of
the Singapore Exchange Securities Trading Limited, the Directors of the Company be authorised and
empowered to:
(a) (i) issue shares in the Company (“shares”) whether by way of rights, bonus or otherwise; and/or
(ii) make or grant offers, agreements or options (collectively, “Instruments”) that might or would
require shares to be issued, including but not limited to the creation and issue of (as well as
adjustments to) options, warrants, debentures or other instruments convertible into shares,
at any time and upon such terms and conditions and for such purposes and to such persons as the
Directors of the Company may in their absolute discretion deem fi t; and
(b) (notwithstanding the authority conferred by this Resolution may have ceased to be in force) issue
shares in pursuance of any Instrument made or granted by the Directors of the Company while this
Resolution was in force,
provided that:
(1) the aggregate number of shares (including shares to be issued in pursuance of the Instruments,
made or granted pursuant to this Resolution) to be issued pursuant to this Resolution shall not
exceed fi fty per centum (50%) of the total number of issued shares (excluding treasury shares) in the
capital of the Company (as calculated in accordance with sub-paragraph (2) below), of which the
aggregate number of shares and Instruments to be issued other than on a pro-rata basis to existing
shareholders of the Company shall not exceed twenty per centum (20%) of the total number of
issued shares (excluding treasury shares) in the capital of the Company (as calculated in accordance
with sub-paragraph (2) below);
(2) (subject to such calculation as may be prescribed by the Singapore Exchange Securities Trading
Limited) for the purpose of determining the aggregate number of shares that may be issued under
sub-paragraph (1) above, the total number of issued shares shall be based on the total number of
issued shares (excluding treasury shares) in the capital of the Company at the time of the passing of
this Resolution, after adjusting for:
(a) new shares arising from the conversion or exercise of any convertible securities;
(b) new shares arising from exercising share options or vesting of share awards which are
outstanding or subsisting at the time of the passing of this Resolution; and
(c) any subsequent bonus issue, consolidation or subdivision of shares;
(3) in exercising the authority conferred by this Resolution, the Company shall comply with the provisions
of the Listing Manual of the Singapore Exchange Securities Trading Limited for the time being in force
(unless such compliance has been waived by the Singapore Exchange Securities Trading Limited)
and the Articles of Association of the Company; and
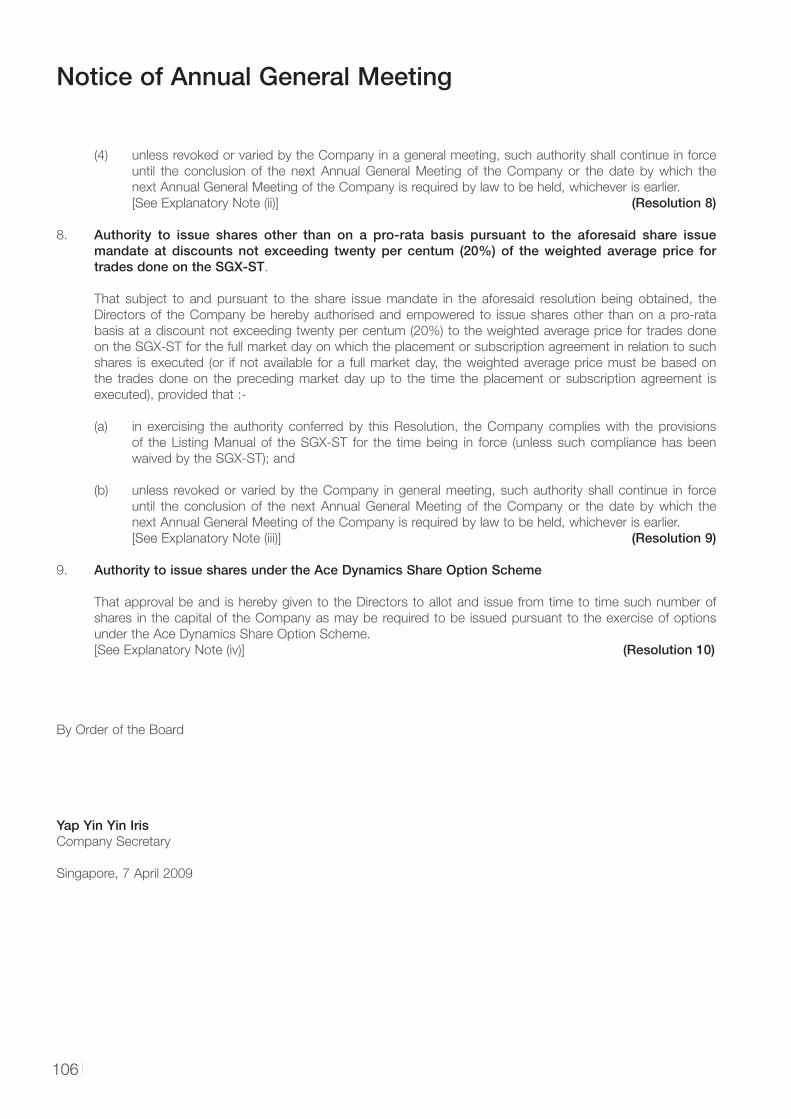
Notice of Annual General Meeting
106
(4) unless revoked or varied by the Company in a general meeting, such authority shall continue in force
until the conclusion of the next Annual General Meeting of the Company or the date by which the
next Annual General Meeting of the Company is required by law to be held, whichever is earlier.
[See Explanatory Note (ii)] (Resolution 8)
8. Authority to issue shares other than on a pro-rata basis pursuant to the aforesaid share issue mandate at discounts not exceeding twenty per centum (20%) of the weighted average price for trades done on the SGX-ST.
That subject to and pursuant to the share issue mandate in the aforesaid resolution being obtained, the
Directors of the Company be hereby authorised and empowered to issue shares other than on a pro-rata
basis at a discount not exceeding twenty per centum (20%) to the weighted average price for trades done
on the SGX-ST for the full market day on which the placement or subscription agreement in relation to such
shares is executed (or if not available for a full market day, the weighted average price must be based on
the trades done on the preceding market day up to the time the placement or subscription agreement is
executed), provided that :-
(a) in exercising the authority conferred by this Resolution, the Company complies with the provisions
of the Listing Manual of the SGX-ST for the time being in force (unless such compliance has been
waived by the SGX-ST); and
(b) unless revoked or varied by the Company in general meeting, such authority shall continue in force
until the conclusion of the next Annual General Meeting of the Company or the date by which the
next Annual General Meeting of the Company is required by law to be held, whichever is earlier.
[See Explanatory Note (iii)] (Resolution 9)
9. Authority to issue shares under the Ace Dynamics Share Option Scheme
That approval be and is hereby given to the Directors to allot and issue from time to time such number of
shares in the capital of the Company as may be required to be issued pursuant to the exercise of options
under the Ace Dynamics Share Option Scheme.
[See Explanatory Note (iv)] (Resolution 10)
By Order of the Board
Yap Yin Yin IrisCompany Secretary
Singapore, 7 April 2009
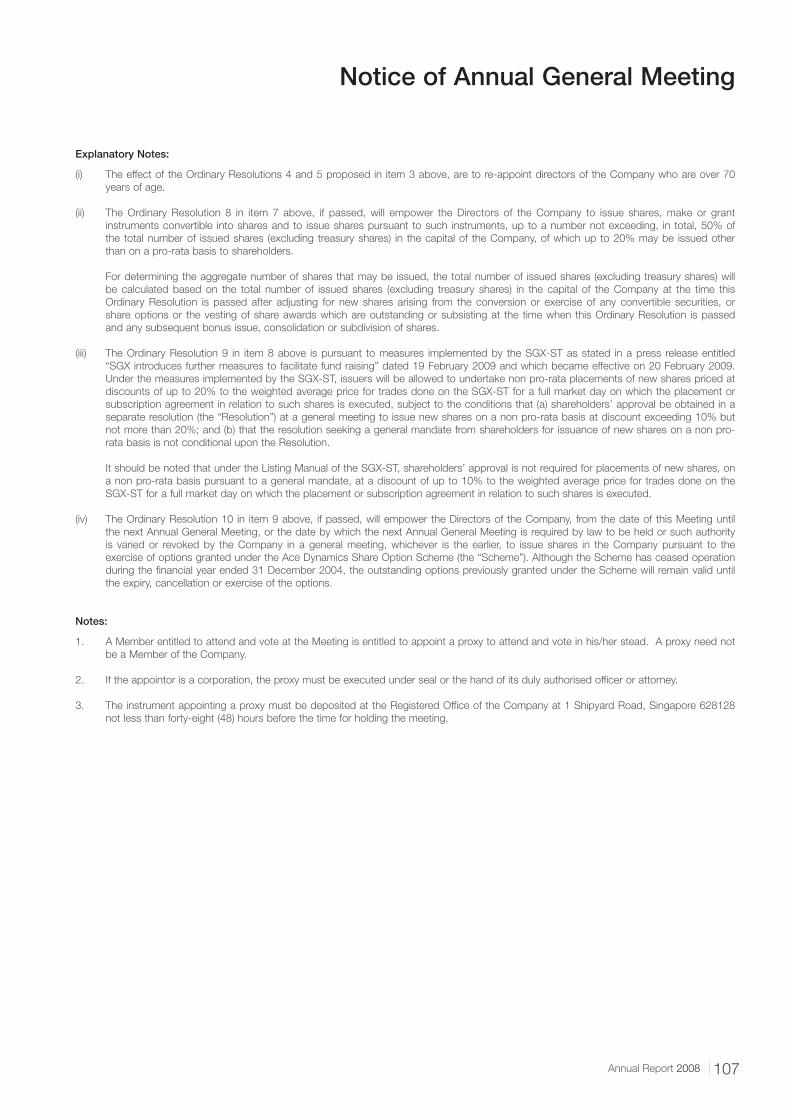
107Annual Report 2008
Notice of Annual General Meeting
Explanatory Notes:
(i) The effect of the Ordinary Resolutions 4 and 5 proposed in item 3 above, are to re-appoint directors of the Company who are over 70
years of age.
(ii) The Ordinary Resolution 8 in item 7 above, if passed, will empower the Directors of the Company to issue shares, make or grant
instruments convertible into shares and to issue shares pursuant to such instruments, up to a number not exceeding, in total, 50% of
the total number of issued shares (excluding treasury shares) in the capital of the Company, of which up to 20% may be issued other
than on a pro-rata basis to shareholders.
For determining the aggregate number of shares that may be issued, the total number of issued shares (excluding treasury shares) will
be calculated based on the total number of issued shares (excluding treasury shares) in the capital of the Company at the time this
Ordinary Resolution is passed after adjusting for new shares arising from the conversion or exercise of any convertible securities, or
share options or the vesting of share awards which are outstanding or subsisting at the time when this Ordinary Resolution is passed
and any subsequent bonus issue, consolidation or subdivision of shares.
(iii) The Ordinary Resolution 9 in item 8 above is pursuant to measures implemented by the SGX-ST as stated in a press release entitled
“SGX introduces further measures to facilitate fund raising” dated 19 February 2009 and which became effective on 20 February 2009.
Under the measures implemented by the SGX-ST, issuers will be allowed to undertake non pro-rata placements of new shares priced at
discounts of up to 20% to the weighted average price for trades done on the SGX-ST for a full market day on which the placement or
subscription agreement in relation to such shares is executed, subject to the conditions that (a) shareholders’ approval be obtained in a
separate resolution (the “Resolution”) at a general meeting to issue new shares on a non pro-rata basis at discount exceeding 10% but
not more than 20%; and (b) that the resolution seeking a general mandate from shareholders for issuance of new shares on a non pro-
rata basis is not conditional upon the Resolution.
It should be noted that under the Listing Manual of the SGX-ST, shareholders’ approval is not required for placements of new shares, on
a non pro-rata basis pursuant to a general mandate, at a discount of up to 10% to the weighted average price for trades done on the
SGX-ST for a full market day on which the placement or subscription agreement in relation to such shares is executed.
(iv) The Ordinary Resolution 10 in item 9 above, if passed, will empower the Directors of the Company, from the date of this Meeting until
the next Annual General Meeting, or the date by which the next Annual General Meeting is required by law to be held or such authority
is varied or revoked by the Company in a general meeting, whichever is the earlier, to issue shares in the Company pursuant to the
exercise of options granted under the Ace Dynamics Share Option Scheme (the “Scheme”). Although the Scheme has ceased operation
during the fi nancial year ended 31 December 2004, the outstanding options previously granted under the Scheme will remain valid until
the expiry, cancellation or exercise of the options.
Notes:
1. A Member entitled to attend and vote at the Meeting is entitled to appoint a proxy to attend and vote in his/her stead. A proxy need not
be a Member of the Company.
2. If the appointor is a corporation, the proxy must be executed under seal or the hand of its duly authorised offi cer or attorney.
3. The instrument appointing a proxy must be deposited at the Registered Offi ce of the Company at 1 Shipyard Road, Singapore 628128
not less than forty-eight (48) hours before the time for holding the meeting.
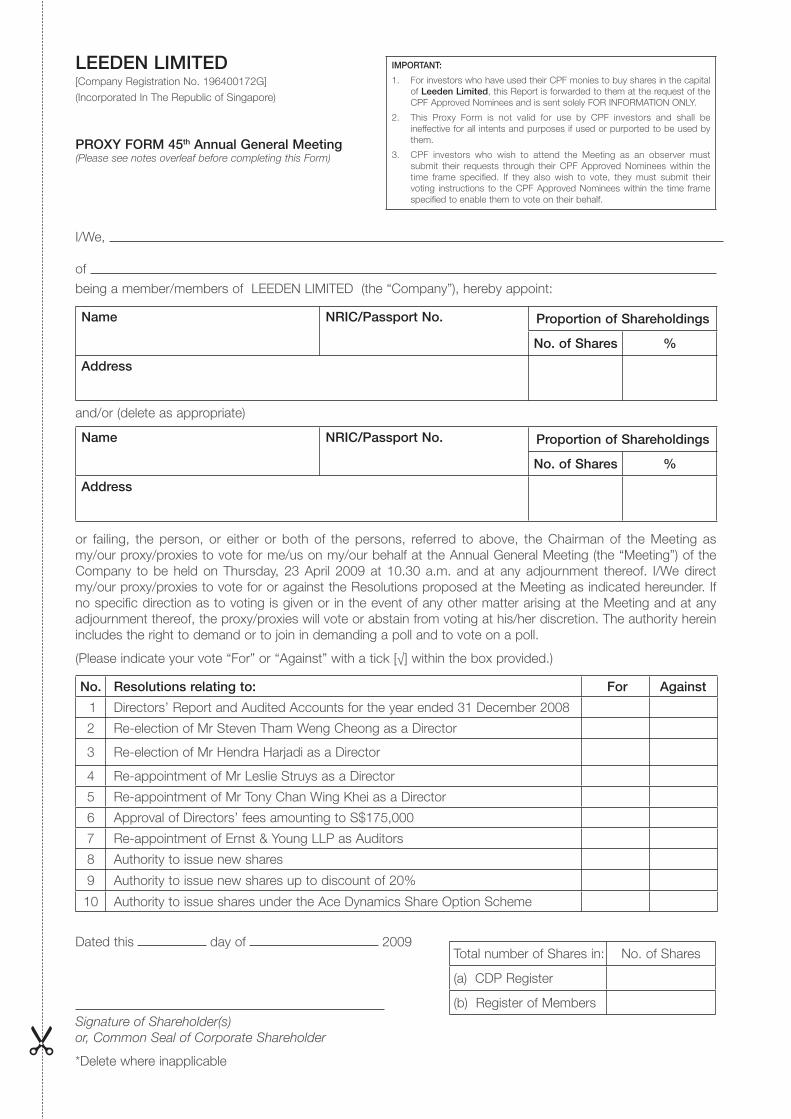
LEEDEN LIMITED[Company Registration No. 196400172G]
(Incorporated In The Republic of Singapore)
PROXY FORM 45th Annual General Meeting (Please see notes overleaf before completing this Form)
I/We,
of
being a member/members of LEEDEN LIMITED (the “Company”), hereby appoint:
Name NRIC/Passport No. Proportion of Shareholdings
No. of Shares %
Address
and/or (delete as appropriate)
Name NRIC/Passport No. Proportion of Shareholdings
No. of Shares %
Address
or failing, the person, or either or both of the persons, referred to above, the Chairman of the Meeting as
my/our proxy/proxies to vote for me/us on my/our behalf at the Annual General Meeting (the “Meeting”) of the
Company to be held on Thursday, 23 April 2009 at 10.30 a.m. and at any adjournment thereof. I/We direct
my/our proxy/proxies to vote for or against the Resolutions proposed at the Meeting as indicated hereunder. If
no specifi c direction as to voting is given or in the event of any other matter arising at the Meeting and at any
adjournment thereof, the proxy/proxies will vote or abstain from voting at his/her discretion. The authority herein
includes the right to demand or to join in demanding a poll and to vote on a poll.
(Please indicate your vote “For” or “Against” with a tick [√] within the box provided.)
No. Resolutions relating to: For Against
1 Directors’ Report and Audited Accounts for the year ended 31 December 2008
2 Re-election of Mr Steven Tham Weng Cheong as a Director
3 Re-election of Mr Hendra Harjadi as a Director
4 Re-appointment of Mr Leslie Struys as a Director
5 Re-appointment of Mr Tony Chan Wing Khei as a Director
6 Approval of Directors’ fees amounting to S$175,000
7 Re-appointment of Ernst & Young LLP as Auditors
8 Authority to issue new shares
9 Authority to issue new shares up to discount of 20%
10 Authority to issue shares under the Ace Dynamics Share Option Scheme
Dated this day of 2009
Signature of Shareholder(s)
or, Common Seal of Corporate Shareholder
*Delete where inapplicable
Total number of Shares in: No. of Shares
(a) CDP Register
(b) Register of Members
IMPORTANT:
1. For investors who have used their CPF monies to buy shares in the capital
of Leeden Limited, this Report is forwarded to them at the request of the
CPF Approved Nominees and is sent solely FOR INFORMATION ONLY.
2. This Proxy Form is not valid for use by CPF investors and shall be
ineffective for all intents and purposes if used or purported to be used by
them.
3. CPF investors who wish to attend the Meeting as an observer must
submit their requests through their CPF Approved Nominees within the
time frame specifi ed. If they also wish to vote, they must submit their
voting instructions to the CPF Approved Nominees within the time frame
specifi ed to enable them to vote on their behalf.
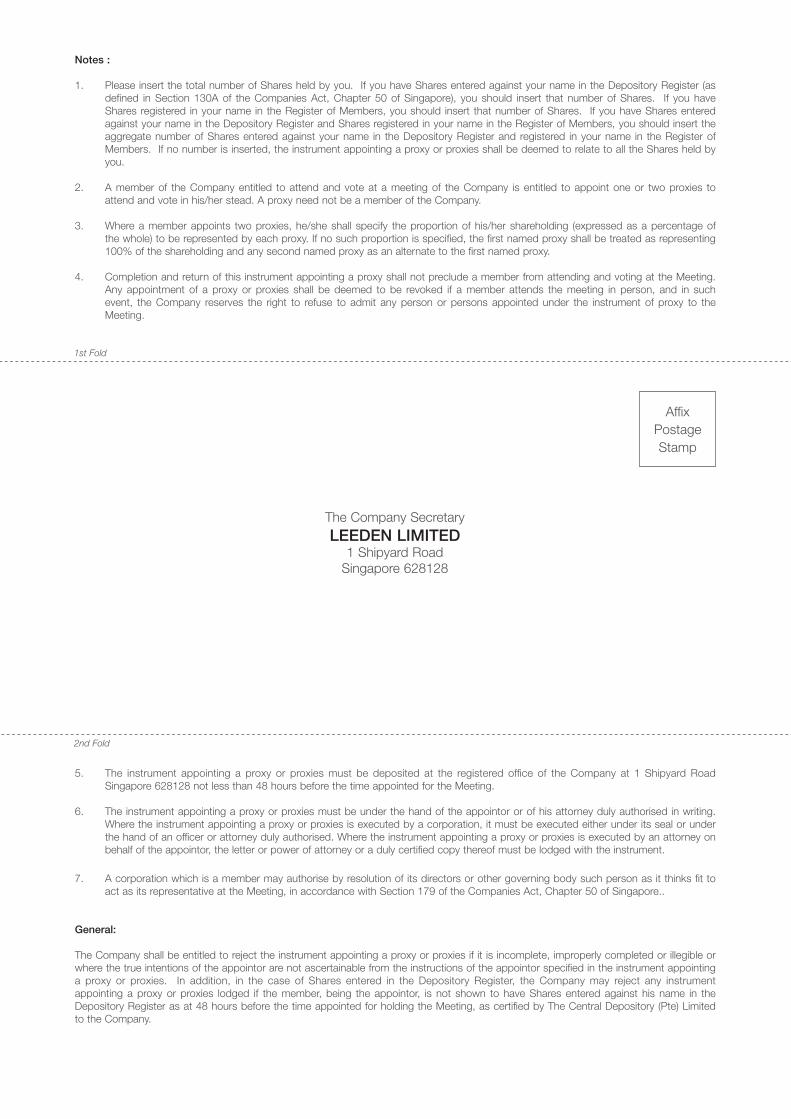
Notes :
1. Please insert the total number of Shares held by you. If you have Shares entered against your name in the Depository Register (as
defi ned in Section 130A of the Companies Act, Chapter 50 of Singapore), you should insert that number of Shares. If you have
Shares registered in your name in the Register of Members, you should insert that number of Shares. If you have Shares entered
against your name in the Depository Register and Shares registered in your name in the Register of Members, you should insert the
aggregate number of Shares entered against your name in the Depository Register and registered in your name in the Register of
Members. If no number is inserted, the instrument appointing a proxy or proxies shall be deemed to relate to all the Shares held by
you.
2. A member of the Company entitled to attend and vote at a meeting of the Company is entitled to appoint one or two proxies to
attend and vote in his/her stead. A proxy need not be a member of the Company.
3. Where a member appoints two proxies, he/she shall specify the proportion of his/her shareholding (expressed as a percentage of
the whole) to be represented by each proxy. If no such proportion is specifi ed, the fi rst named proxy shall be treated as representing
100% of the shareholding and any second named proxy as an alternate to the fi rst named proxy.
4. Completion and return of this instrument appointing a proxy shall not preclude a member from attending and voting at the Meeting.
Any appointment of a proxy or proxies shall be deemed to be revoked if a member attends the meeting in person, and in such
event, the Company reserves the right to refuse to admit any person or persons appointed under the instrument of proxy to the
Meeting.
The Company Secretary
LEEDEN LIMITED1 Shipyard Road
Singapore 628128
Affi x
Postage
Stamp
1st Fold
2nd Fold
5. The instrument appointing a proxy or proxies must be deposited at the registered offi ce of the Company at 1 Shipyard Road
Singapore 628128 not less than 48 hours before the time appointed for the Meeting.
6. The instrument appointing a proxy or proxies must be under the hand of the appointor or of his attorney duly authorised in writing.
Where the instrument appointing a proxy or proxies is executed by a corporation, it must be executed either under its seal or under
the hand of an offi cer or attorney duly authorised. Where the instrument appointing a proxy or proxies is executed by an attorney on
behalf of the appointor, the letter or power of attorney or a duly certifi ed copy thereof must be lodged with the instrument.
7. A corporation which is a member may authorise by resolution of its directors or other governing body such person as it thinks fi t to
act as its representative at the Meeting, in accordance with Section 179 of the Companies Act, Chapter 50 of Singapore..
General:
The Company shall be entitled to reject the instrument appointing a proxy or proxies if it is incomplete, improperly completed or illegible or
where the true intentions of the appointor are not ascertainable from the instructions of the appointor specifi ed in the instrument appointing
a proxy or proxies. In addition, in the case of Shares entered in the Depository Register, the Company may reject any instrument
appointing a proxy or proxies lodged if the member, being the appointor, is not shown to have Shares entered against his name in the
Depository Register as at 48 hours before the time appointed for holding the Meeting, as certifi ed by The Central Depository (Pte) Limited
to the Company.
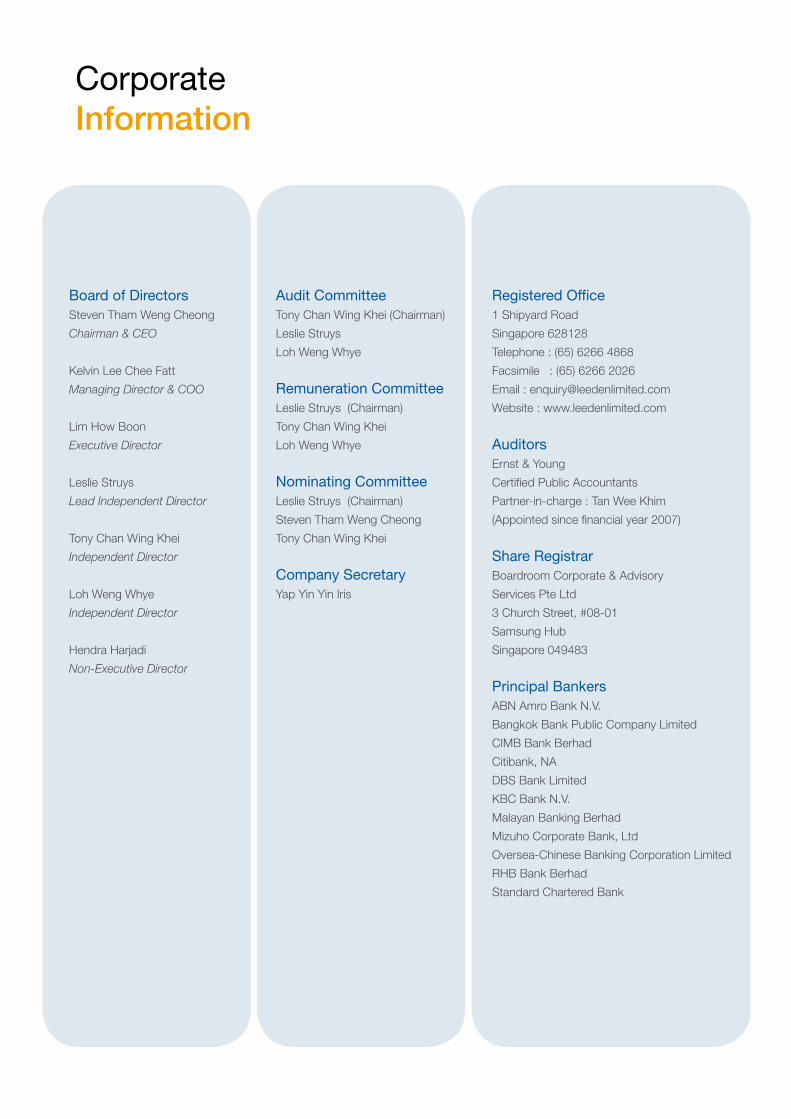
CorporateInformation
Registered Office1 Shipyard Road
Singapore 628128
Telephone : (65) 6266 4868
Facsimile : (65) 6266 2026
Email : [email protected]
Website : www.leedenlimited.com
AuditorsErnst & Young
Certified Public Accountants
Partner-in-charge : Tan Wee Khim
(Appointed since financial year 2007)
Share RegistrarBoardroom Corporate & Advisory
Services Pte Ltd
3 Church Street, #08-01
Samsung Hub
Singapore 049483
Principal BankersABN Amro Bank N.V.
Bangkok Bank Public Company Limited
CIMB Bank Berhad
Citibank, NA
DBS Bank Limited
KBC Bank N.V.
Malayan Banking Berhad
Mizuho Corporate Bank, Ltd
Oversea-Chinese Banking Corporation Limited
RHB Bank Berhad
Standard Chartered Bank
Board of Directors
Steven Tham Weng Cheong
Chairman & CEO
Kelvin Lee Chee Fatt
Managing Director & COO
Lim How Boon
Executive Director
Leslie Struys
Lead Independent Director
Tony Chan Wing Khei
Independent Director
Loh Weng Whye
Independent Director
Hendra Harjadi
Non-Executive Director
Audit Committee
Tony Chan Wing Khei (Chairman)
Leslie Struys
Loh Weng Whye
Remuneration Committee
Leslie Struys (Chairman)
Tony Chan Wing Khei
Loh Weng Whye
Nominating Committee
Leslie Struys (Chairman)
Steven Tham Weng Cheong
Tony Chan Wing Khei
Company Secretary
Yap Yin Yin Iris
Leeden LimitedCompany Registration No. 196400172G
1 Shipyard Road, Singapore 628128Tel : (65) 6266 4868 Fax : (65) 6266 [email protected]
LeedenThe Integration Specialist for Welding, Gas and Safety
Leeden Lim
itedA
nnual Report 2008