connecting the philippines through mobile broadband · ericsson | may 2011 ... multi-carrier (4) +...
TRANSCRIPT
Connecting thePhilippines throughMobile Broadband

Sandra Gilligan,
Project Marketing Director,
GSMA

© GSMA 2011
The GSMA
3
Represents the interests of
the worldwide mobile
communications industry
– 800 mobile operators
– Over 200 associate
members
– Across 219 countries
– Nearly 5 Billion wireless
connections
Remit is to innovate,
incubate and deliver new
opportunities for our
members, with the goal of
driving the growth of the
mobile communications
industry
CONNECTING THE WORLD
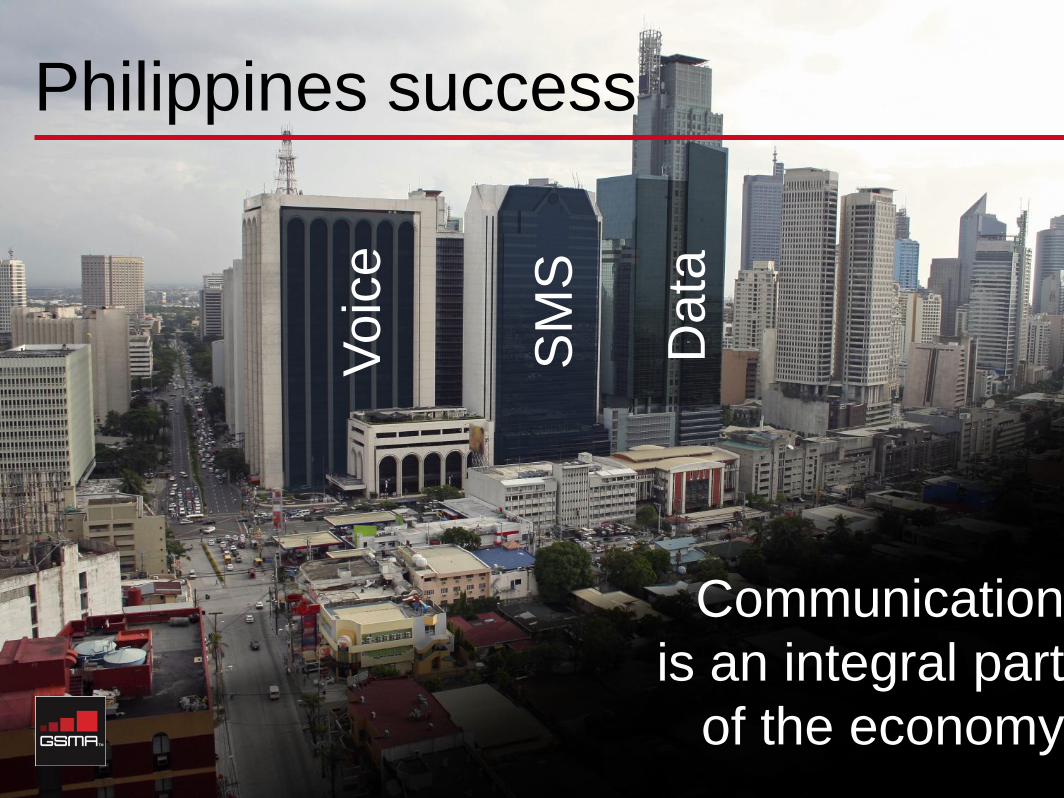
Philippines success
Communication
is an integral part
of the economy
Voic
e
SM
S
Data

Engagement
Inclusiveness
Empowerment
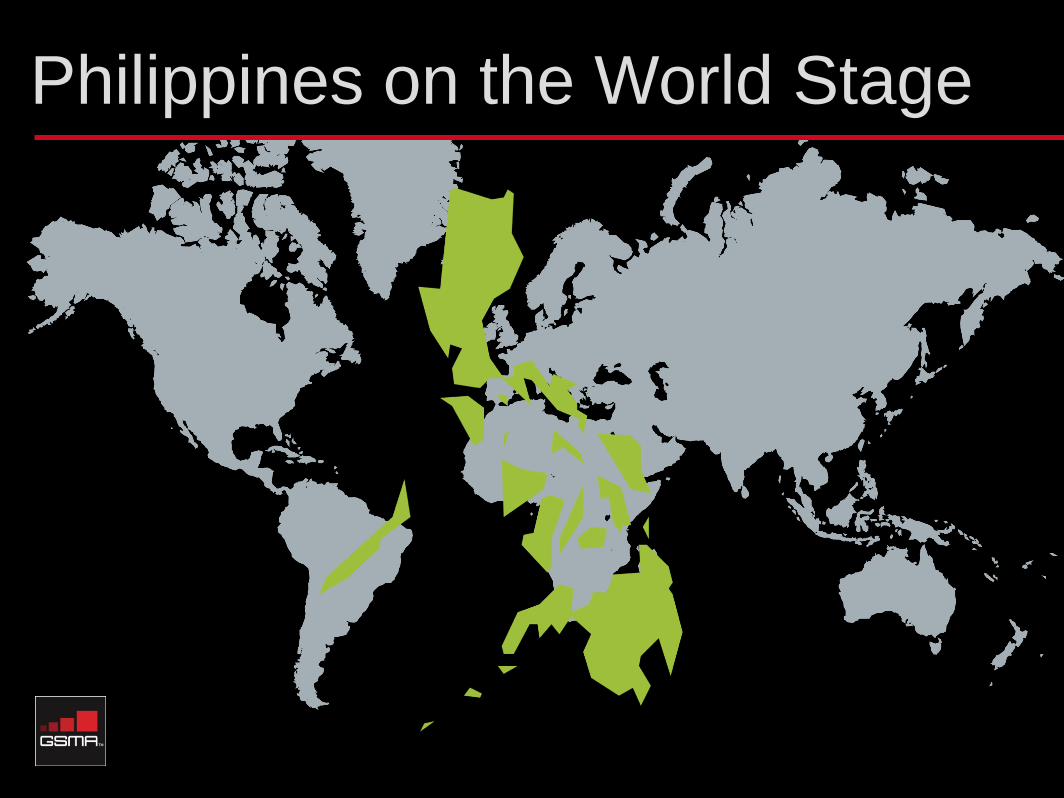
Philippines on the World Stage

Connecting the Philippines

Key initiatives within
government policy on
mobile broadband to
promote economic
development
Commissioner Monchito
Ibrahim, Commission for
Information and
Communications
Technology (CICT)

Creating the right environment
to deliver affordable HSPA
and LTE Mobile Broadband
Adam Denton, Head of Spectrum,
GSMA

© GSMA 2011
Mobile networks are connecting the world...
Fixed Mobile
1.1 Billion Lines Over 5 Billion Connections
Connecting the World
MOBILE BROADBAND WILL CONNECT THE WORLD TO THE INTERNET

© GSMA 2011
By 2013, the number of smartphones will exceed the number of PCs
Ubiquity of Smartphones
MOBILE WILL BECOME DOMINANT INTERNET ACCESS DEVICE
Source: Gartner, Inc.
1.78 Billion Units1.82 Billion Units
© GSMA 2011
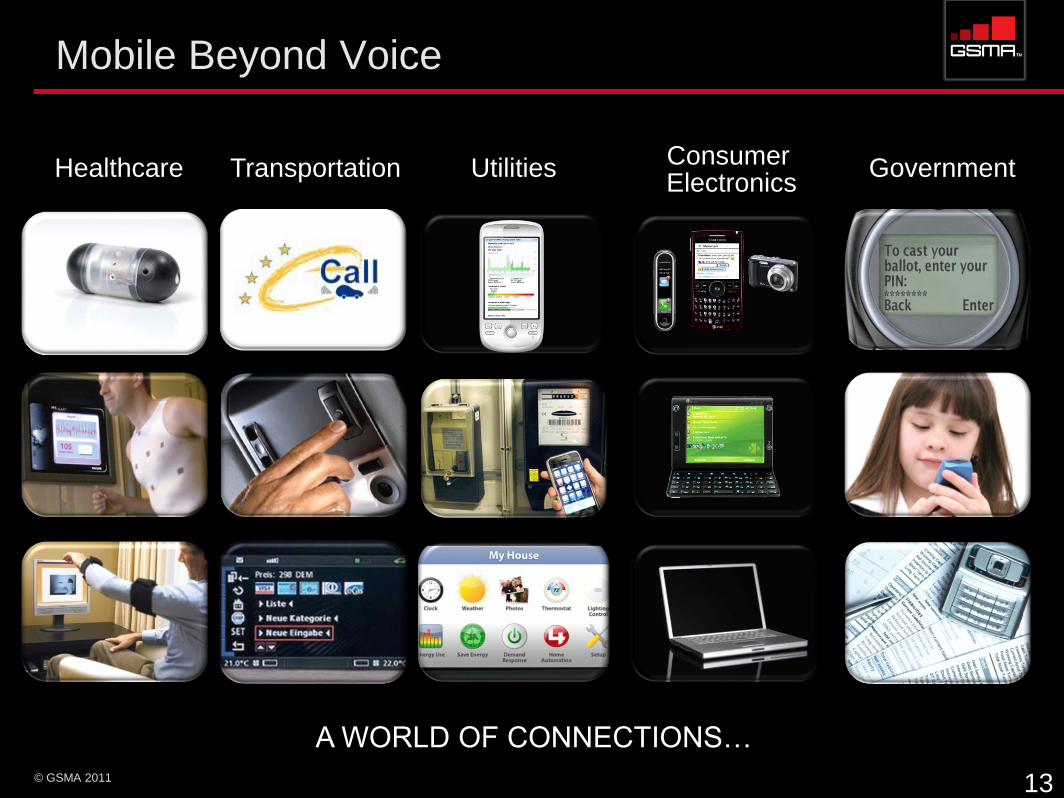
Mobile Beyond Voice
A WORLD OF CONNECTIONS…
Utilities GovernmentConsumer Electronics
Transportation
13
Healthcare
© GSMA 2011
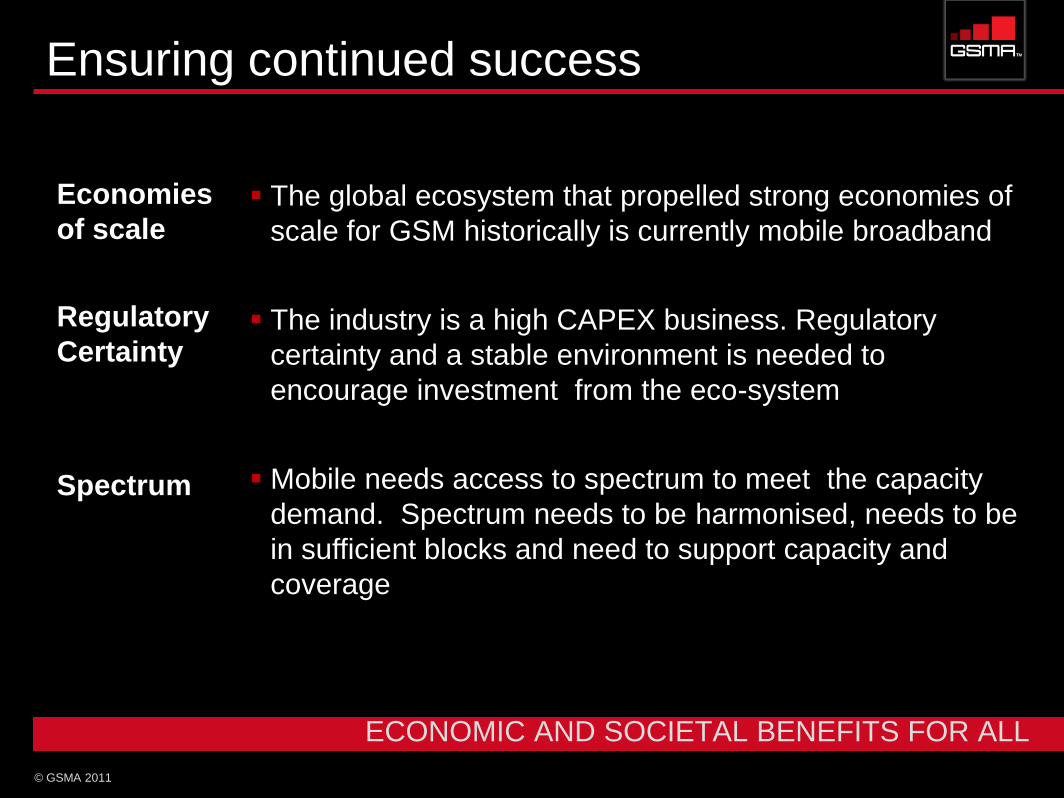
The global ecosystem that propelled strong economies of
scale for GSM historically is currently mobile broadband
The industry is a high CAPEX business. Regulatory
certainty and a stable environment is needed to
encourage investment from the eco-system
Mobile needs access to spectrum to meet the capacity
demand. Spectrum needs to be harmonised, needs to be
in sufficient blocks and need to support capacity and
coverage
Economies
of scale
Spectrum
Regulatory
Certainty
Ensuring continued success
ECONOMIC AND SOCIETAL BENEFITS FOR ALL

© GSMA 2011
Development Circle
What worked for voice will
work for data
Governments and
regulators play a key role
With the right environment
Private investors can
deliver (amazing things!)
Critical is developing the
right investment
environment
15
Regulatory & Fiscal
Policy
Mobile
Affordability
Employment
GDP Boost
Mobile
Industry
Growth
© GSMA 2011
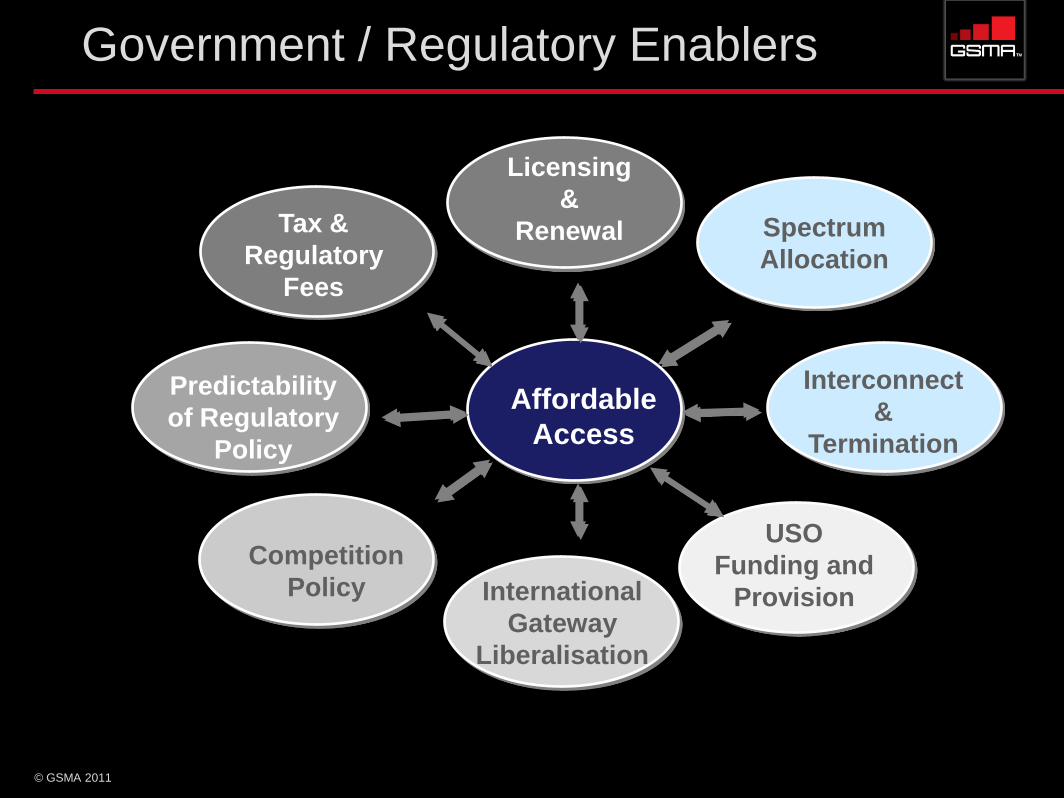
Government / Regulatory Enablers
Affordable
Access
Tax &
Regulatory
Fees
Competition
Policy International
Gateway
Liberalisation
USO
Funding and
Provision
Predictability
of Regulatory
Policy
Spectrum
Allocation
Licensing
&
Renewal
Interconnect
&
Termination
© GSMA 2011
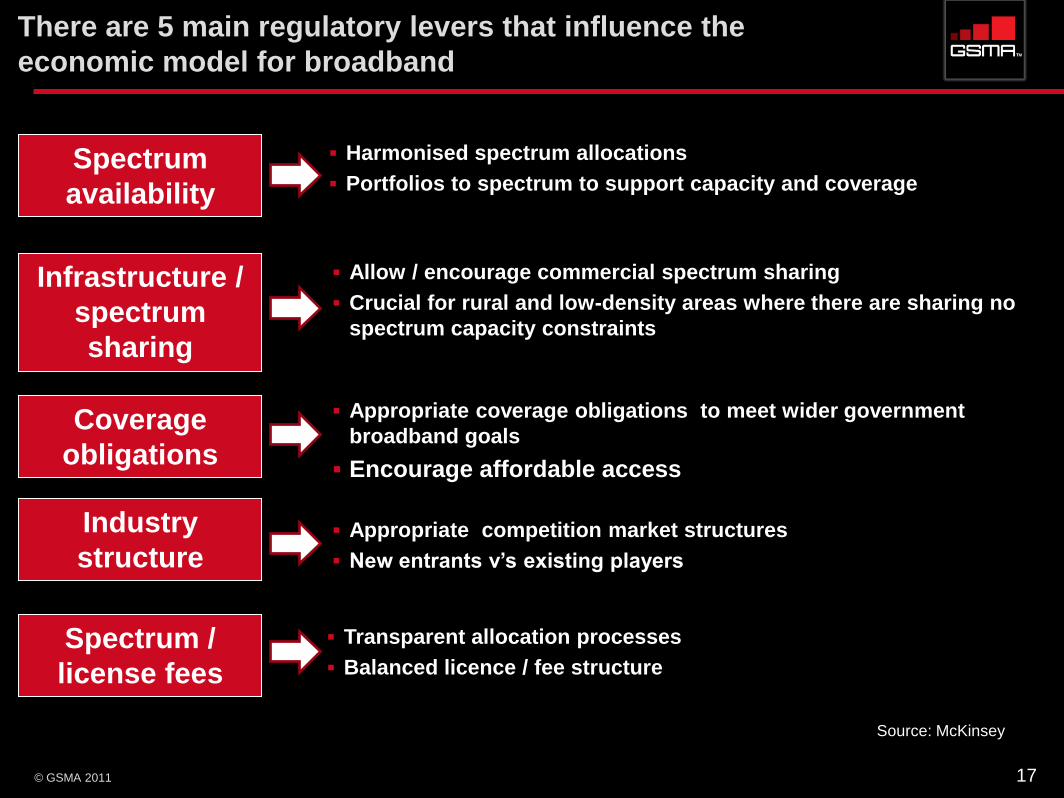
There are 5 main regulatory levers that influence the
economic model for broadband
Harmonised spectrum allocations
Portfolios to spectrum to support capacity and coverage
17
Spectrum
availability
Infrastructure /
spectrum
sharing
Coverage
obligations
Industry
structure
Spectrum /
license fees
Source: McKinsey
Allow / encourage commercial spectrum sharing
Crucial for rural and low-density areas where there are sharing no
spectrum capacity constraints
Appropriate coverage obligations to meet wider government
broadband goals
Encourage affordable access
Appropriate competition market structures
New entrants v’s existing players
Transparent allocation processes
Balanced licence / fee structure

© GSMA 2011
In conclusion...
President Barack Obama – 16.03.10
“Just as past generations met the great infrastructure challenges of the
day, such as building the railroads and the Interstate highways, so too
must we harness the potential of the Internet. Expanding broadband
across the nation will build a foundation of sustained economic growth
and the widely shared prosperity we all seek.
ITU Secretary General, Dr Hamadoun Toure, 15.02.2011
“governments need to raise broadband to the top of the development
agenda, so that rollout is accelerated and the benefits are brought to as
many people as possible”
18
Spectrum alignment for
Mobile Broadband
Michael Bjarhov, Director Government &
Industry Relations, Ericsson
Slide title
minimum 32 pt
(32 pt makes 2 rows
Text and bullet level 1
minimum 24 pt
5
minimum 20 pt
Do not add objects or
text in the footer areaEricsson | May 2011 | Page 21 Connecting the Philippines through Mobile Broadband – Manila 10 May 2011
Michael BjarhovDirector Government & Industry relations, Asia PacificEricsson
Mobile Broadband
Network evolution and Spectrum alignment
Slide title
minimum 32 pt
(32 pt makes 2 rows
Text and bullet level 1
minimum 24 pt
5
minimum 20 pt
Do not add objects or
text in the footer areaEricsson | May 2011 | Page 22 Connecting the Philippines through Mobile Broadband – Manila 10 May 2011
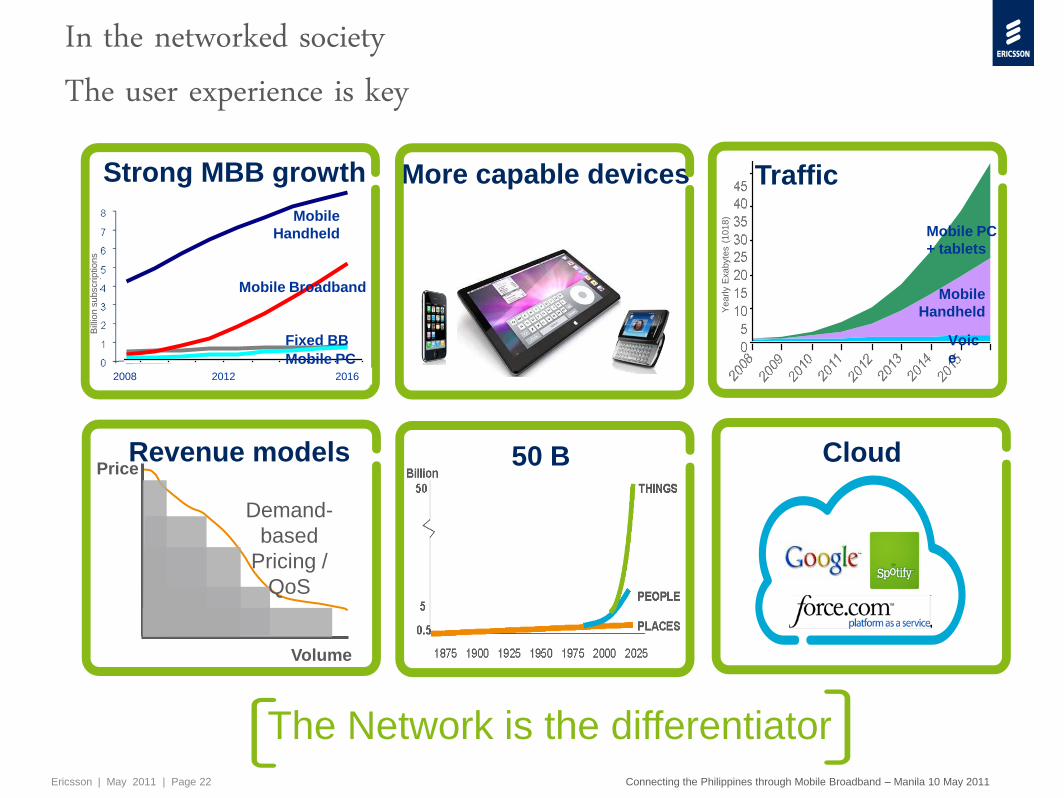
In the networked society The user experience is key
More capable devices
2008 2012 2016
0
1 0 0 0
2 0 0 0
3 0 0 0
4 0 0 0
5 0 0 0
6 0 0 0
7 0 0 0
8 0 0 0
9 0 0 0
2 0 0 8 2 0 0 9 2 0 10 2 0 11 2 0 12 2 0 13 2 0 14 2 0 15 2 0 16
Mobile
Handheld
Mobile Broadband
Fixed BB
Mobile PC
Strong MBB growth
Bill
ion s
ubscriptions
Volume
Price
Demand-
based
Pricing /
QoS
CloudRevenue models
0
10 000 000
20 000 000
30 000 000
40 000 000
50 000 000
60 000 000
2008
2009
2010
2011
2012
2013
2014
2015
2016
Traffic
Mobile
Handheld
Mobile PC
+ tablets
Voic
e
Yearly
Exabyt
es (
1018)
50 B
The Network is the differentiator
Slide title
minimum 32 pt
(32 pt makes 2 rows
Text and bullet level 1
minimum 24 pt
5
minimum 20 pt
Do not add objects or
text in the footer areaEricsson | May 2011 | Page 23 Connecting the Philippines through Mobile Broadband – Manila 10 May 2011
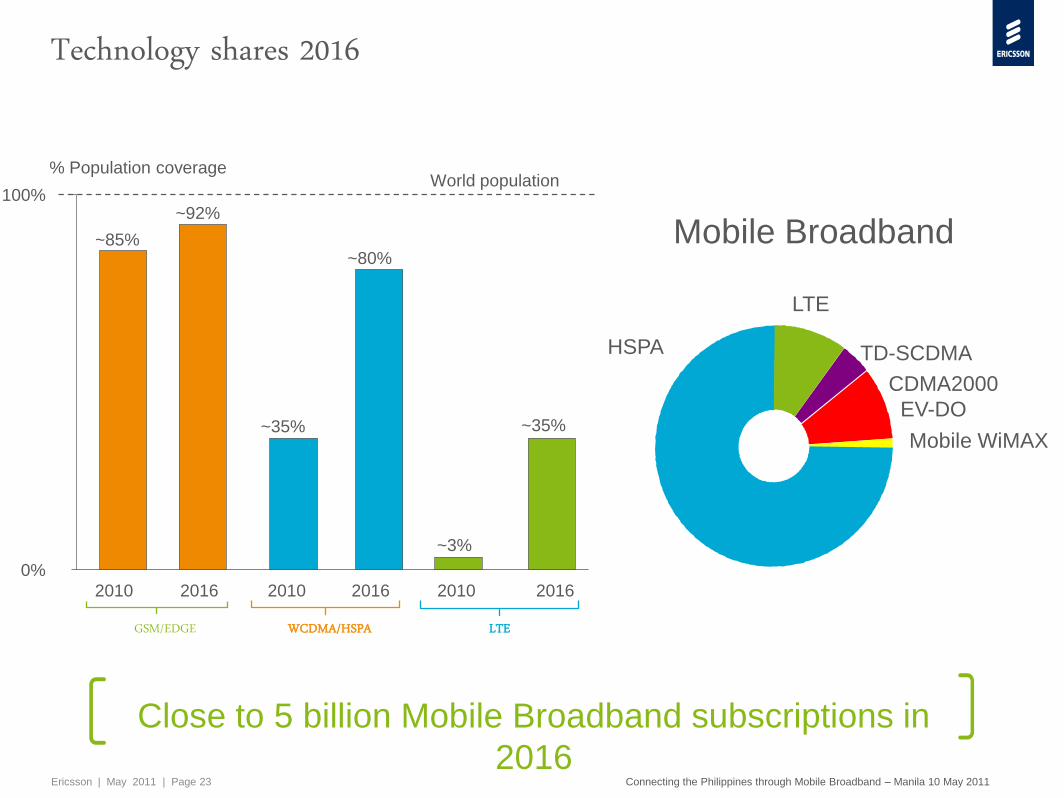
Technology shares 2016
2016201620162010 2010 2010
0%
100%
% Population coverageWorld population
Urban
Sub-
urban
~85%
Metro
Rural
~35%
~3%
~92%
~80%
~35%
WCDMA/HSPAGSM/EDGE LTE
Close to 5 billion Mobile Broadband subscriptions in
2016
CDMA2000
EV-DO
TD-SCDMA
LTE
HSPA
Mobile WiMAX
Mobile Broadband

Slide title
minimum 32 pt
(32 pt makes 2 rows
Text and bullet level 1
minimum 24 pt
5
minimum 20 pt
Do not add objects or
text in the footer areaEricsson | May 2011 | Page 24 Connecting the Philippines through Mobile Broadband – Manila 10 May 2011
2009
2010
2015
>20 MHz20 MHz10 MHz
5-50 Mbps
10-100 Mbps
~150 Mbps
3-10 Mbps
8-30 Mbps
~50 Mbps
Operator dependent
Operator dependent
~1000 Mbps
50 Mbps150 Mbps
1000
Mbps
HSPA Evolution
LTE Evolution to 4G (ITU)
12
48Downlink*
336 …
7.2
21
28
42
84
168
10 ms TTI
2 ms TTI
Dual-carrier or
16QAM
Dual-carrier + MIMOor
Dual-carrier + 16QAM
64QAM
MIMO
64QAM + MIMOor
Dual-carrier + 64QAM
Dual-carrier + 64QAM + MIMO
orMulti-carrier (4) + 64QAM
Multi-carrier (4) + 64QAM + MIMO
orMulti-carrier (8) + 64QAM
1.4
…
5.8
24
Uplink*
Dual-carrier + MIMO + 16QAM
0.384 *Peak speeds (Mbps)High capacity IP backhaul
using fiber and microwave
Evolution of Mobile Broadband3gpp Technologies dominating the market

Slide title
minimum 32 pt
(32 pt makes 2 rows
Text and bullet level 1
minimum 24 pt
5
minimum 20 pt
Do not add objects or
text in the footer areaEricsson | May 2011 | Page 25 Connecting the Philippines through Mobile Broadband – Manila 10 May 2011
Impressive Mobile data growth
Subscriber traffic in mobile access networks
Ye
arly E
xa
byte
s (
10
18)
0
10
20
30
40
50
60
2008 2009 2010 2011 2012 2013 2014 2015 2016
Data
Voice
Mobile data traffic forecasted to double annually over the coming years due to Smartphones, laptops and tablets
Source: Internal Ericsson
WiMAX and WiFi traffic not included.
M2M traffic to be added on top.
This slide contains forward looking statements
Slide title
minimum 32 pt
(32 pt makes 2 rows
Text and bullet level 1
minimum 24 pt
5
minimum 20 pt
Do not add objects or
text in the footer areaEricsson | May 2011 | Page 26 Connecting the Philippines through Mobile Broadband – Manila 10 May 2011
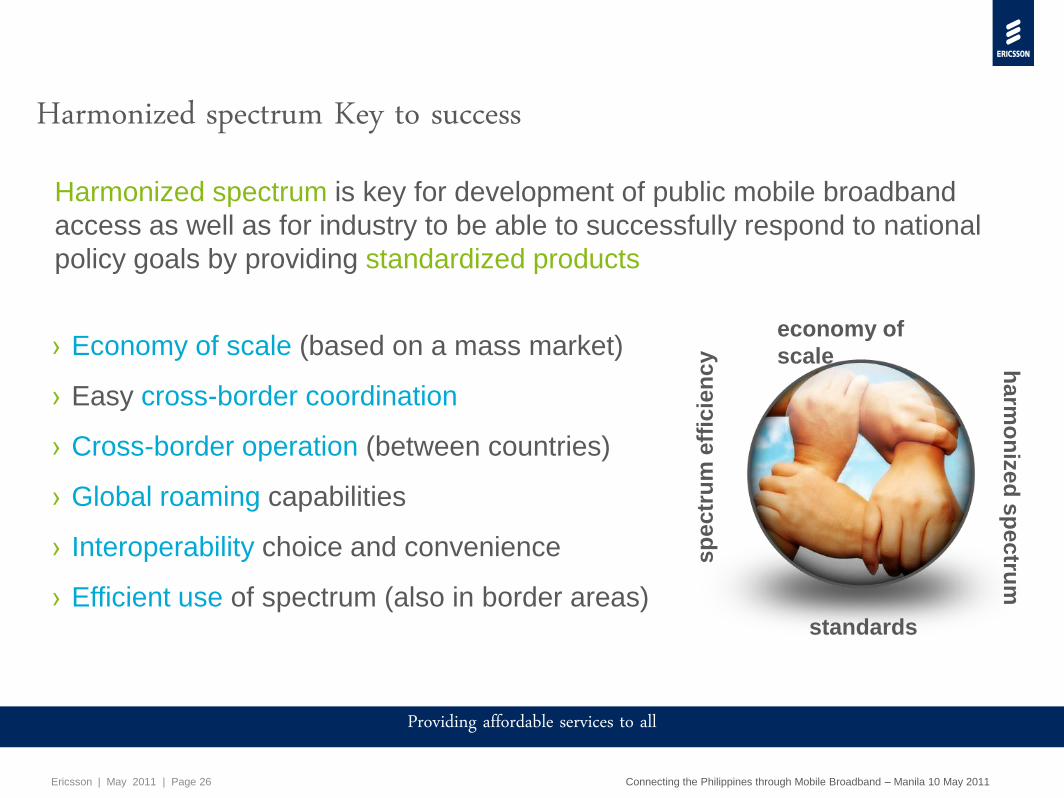
Harmonized spectrum Key to success
› Economy of scale (based on a mass market)
› Easy cross-border coordination
› Cross-border operation (between countries)
› Global roaming capabilities
› Interoperability choice and convenience
› Efficient use of spectrum (also in border areas)
Harmonized spectrum is key for development of public mobile broadband
access as well as for industry to be able to successfully respond to national
policy goals by providing standardized products
economy of
scale ha
rmo
niz
ed
sp
ec
trum
standards
sp
ec
tru
m e
ffic
ien
cy
Providing affordable services to all
Slide title
minimum 32 pt
(32 pt makes 2 rows
Text and bullet level 1
minimum 24 pt
5
minimum 20 pt
Do not add objects or
text in the footer areaEricsson | May 2011 | Page 27 Connecting the Philippines through Mobile Broadband – Manila 10 May 2011
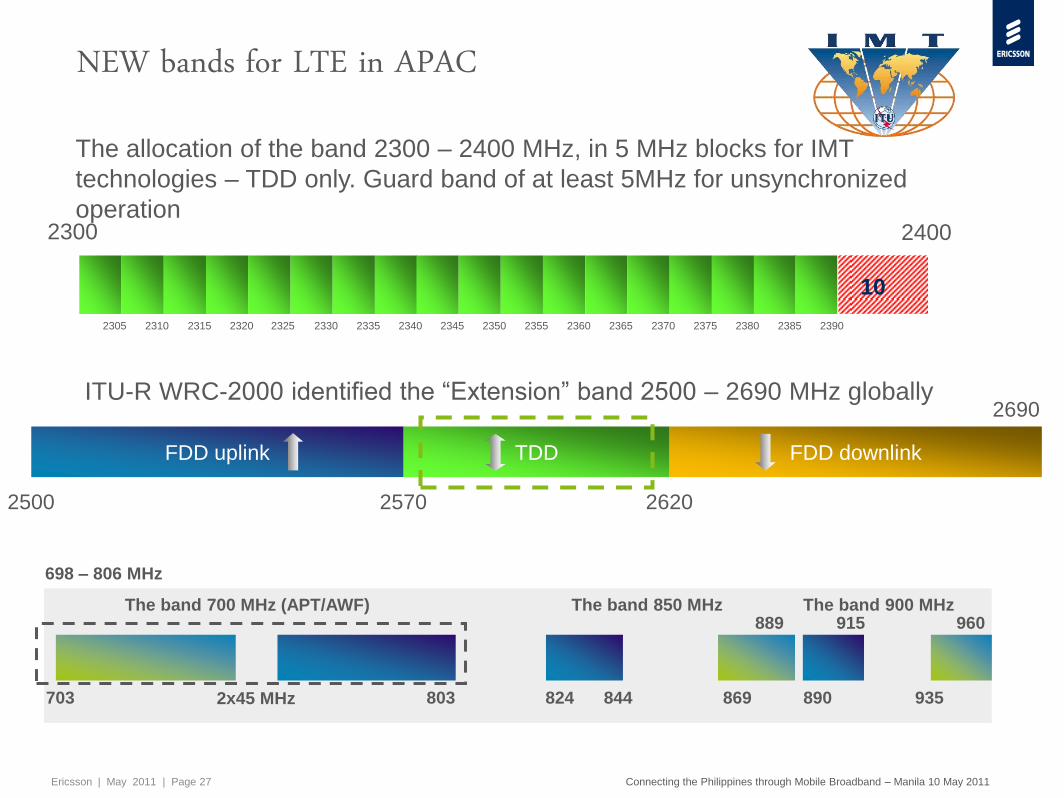
2300 2400
2305 2310 2315 2320 2325 2330 2335 2340 2345 2350 2355 2360 2365 2370 2375 2380 2385 2390
The allocation of the band 2300 – 2400 MHz, in 5 MHz blocks for IMT
technologies – TDD only. Guard band of at least 5MHz for unsynchronized
operation
10
NEW bands for LTE in APAC
FDD uplink TDD FDD downlink
2500 2570 2620
2690ITU-R WRC-2000 identified the ―Extension‖ band 2500 – 2690 MHz globally
698 – 806 MHz
803 824 844 869 890
The band 850 MHz889 915
935
960The band 900 MHz
703
The band 700 MHz (APT/AWF)
2x45 MHz
Slide title
minimum 32 pt
(32 pt makes 2 rows
Text and bullet level 1
minimum 24 pt
5
minimum 20 pt
Do not add objects or
text in the footer areaEricsson | May 2011 | Page 28 Connecting the Philippines through Mobile Broadband – Manila 10 May 2011
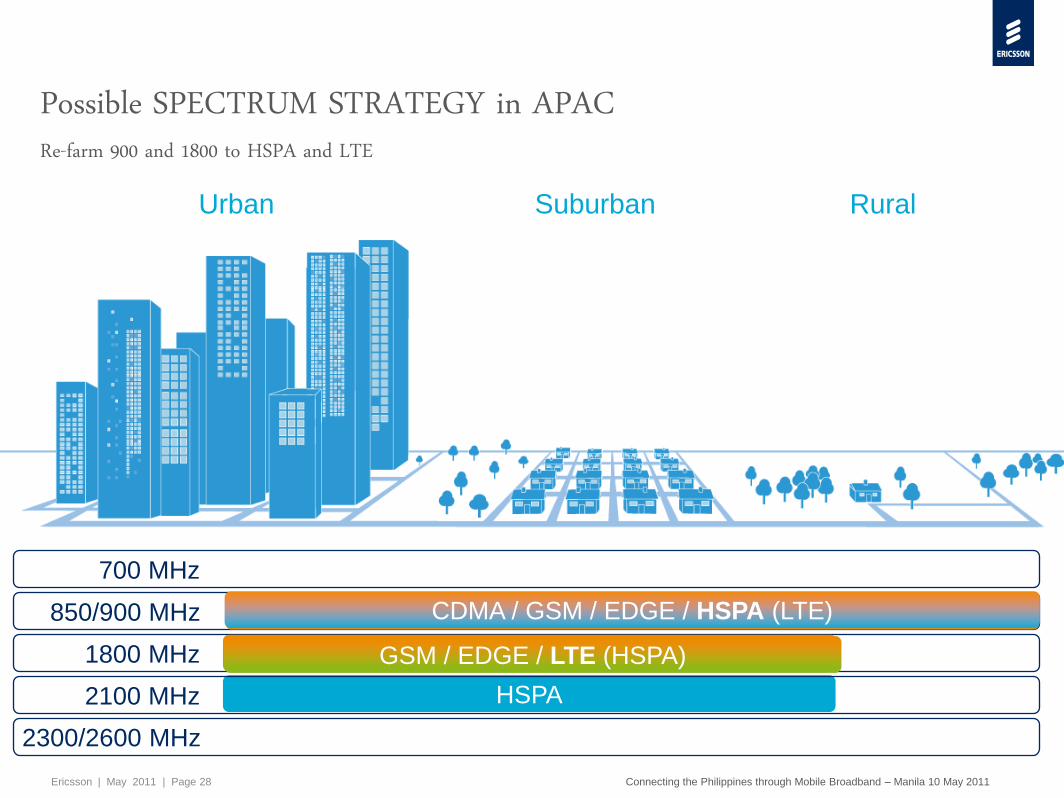
Urban Suburban Rural
Possible SPECTRUM STRATEGY in APACRe-farm 900 and 1800 to HSPA and LTE
HSPA2100 MHz
700 MHz
2300/2600 MHz
850/900 MHz
1800 MHz GSM / EDGE
CDMA / GSM / EDGECDMA / GSM / EDGE / HSPA (LTE)
GSM / EDGE / LTE (HSPA)

Slide title
minimum 32 pt
(32 pt makes 2 rows
Text and bullet level 1
minimum 24 pt
5
minimum 20 pt
Do not add objects or
text in the footer areaEricsson | May 2011 | Page 29 Connecting the Philippines through Mobile Broadband – Manila 10 May 2011
Urban Suburban Rural
Possible SPECTRUM STRATEGY in APACIntroduce LTE in 700 & 2300 / 2600
HSPA2100 MHz
700 MHz
2300/2600 MHz
850/900 MHz
1800 MHz GSM / EDGE
GSM / EDGECDMA / GSM / EDGE / HSPA (LTE)
GSM / EDGE / LTE (HSPA)
LTE
LTE
Slide title
minimum 32 pt
(32 pt makes 2 rows
Text and bullet level 1
minimum 24 pt
5
minimum 20 pt
Do not add objects or
text in the footer areaEricsson | May 2011 | Page 30 Connecting the Philippines through Mobile Broadband – Manila 10 May 2011
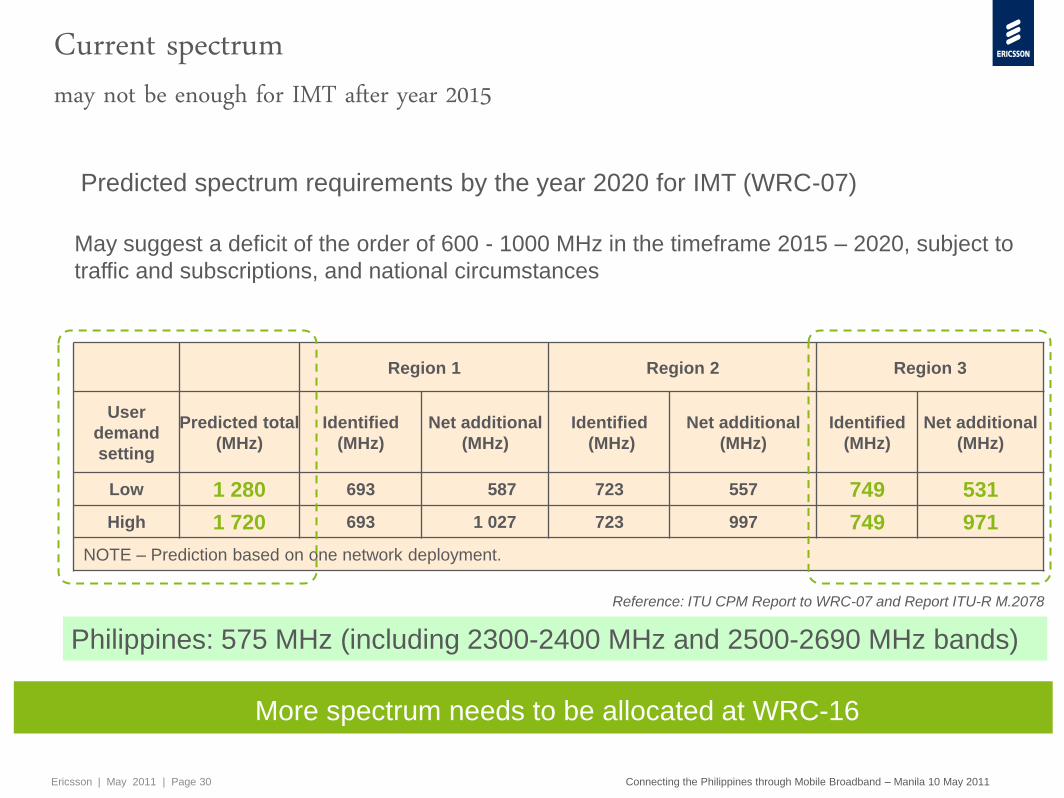
Current spectrummay not be enough for IMT after year 2015
Predicted spectrum requirements by the year 2020 for IMT (WRC-07)
Region 1 Region 2 Region 3
User
demand
setting
Predicted total
(MHz)
Identified
(MHz)
Net additional
(MHz)
Identified
(MHz)
Net additional
(MHz)
Identified
(MHz)
Net additional
(MHz)
Low 1 280 693 587 723 557 749 531
High 1 720 693 1 027 723 997 749 971
NOTE – Prediction based on one network deployment.
Reference: ITU CPM Report to WRC-07 and Report ITU-R M.2078
May suggest a deficit of the order of 600 - 1000 MHz in the timeframe 2015 – 2020, subject to
traffic and subscriptions, and national circumstances
More spectrum needs to be allocated at WRC-16
Philippines: 575 MHz (including 2300-2400 MHz and 2500-2690 MHz bands)
Slide title
minimum 32 pt
(32 pt makes 2 rows
Text and bullet level 1
minimum 24 pt
5
minimum 20 pt
Do not add objects or
text in the footer areaEricsson | May 2011 | Page 31 Connecting the Philippines through Mobile Broadband – Manila 10 May 2011
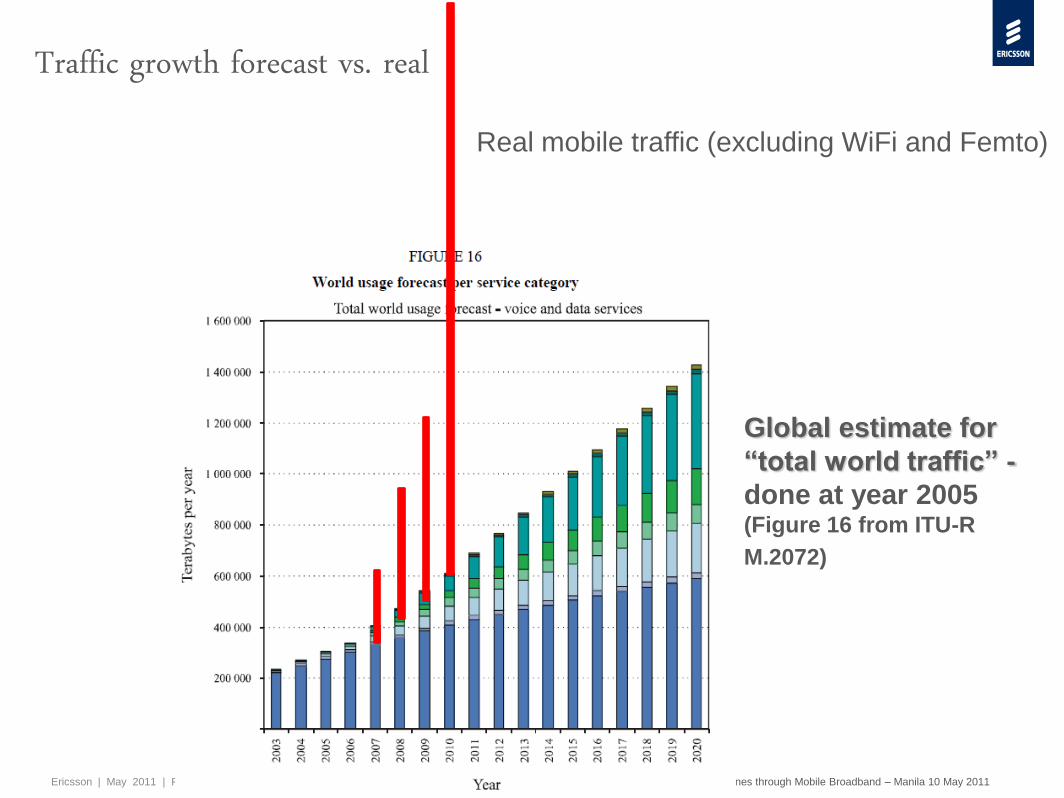
Traffic growth forecast vs. real
Global estimate for
―total world traffic‖ -
done at year 2005 (Figure 16 from ITU-R
M.2072)
Real mobile traffic (excluding WiFi and Femto)

Slide title
minimum 32 pt
(32 pt makes 2 rows
Text and bullet level 1
minimum 24 pt
5
minimum 20 pt
Do not add objects or
text in the footer areaEricsson | May 2011 | Page 32 Connecting the Philippines through Mobile Broadband – Manila 10 May 2011
Summary
› In the networked society the user experience is key
› Connectivity will be embedded into all kinds of devices
› The 3GPP family of technologies with a path to 4G/LTE will dominate the market
› Spectrum management is key to a smooth evolution
› Traffic growth will require,
– the most spectral efficient technologies
– more radio sites with high speed IP backhaul
– and more globally or regionally harmonized spectrum
› To enable cost effective and affordable …
Mobile Broadband for all
Slide title
minimum 32 pt
(32 pt makes 2 rows
Text and bullet level 1
minimum 24 pt
5
minimum 20 pt
Do not add objects or
text in the footer areaEricsson | May 2011 | Page 33 Connecting the Philippines through Mobile Broadband – Manila 10 May 2011
HSPA+, LTE and The
Continuing Wireless Evolution
John Stefanac, Vice President and
President of Asia Pacific, Qualcomm

Coffee/tea break with
networking

36
HSPA+, LTE and The Continuing Wireless EvolutionMay 2011

37
The Biggest Platform in the History of Mankind
Note : 3G includes CDMA2000, WCDMA and TD-SCDMA
Source: Wireless Intelligence estimates as of Nov.2 , 2010 for the quarter ending Sep 30, 2010; *number of unique wireless connections
3G SUBSCRIPTIONS
NOW
3G SUBSCRIPTIONS
BY 2014
>5 BILLION WIRELESS SUBSCRIBERS

38
Device – form factor diversity
Device – processing power and capabilities
Network capacity enhancements
Flexible data plans
Compelling apps and services
Cloud computing
What‘s Driving The Perfect Wireless Storm?
By 2014, Monthly Worldwide Mobile Data Traffic Expected to Exceed 2008 Total
39
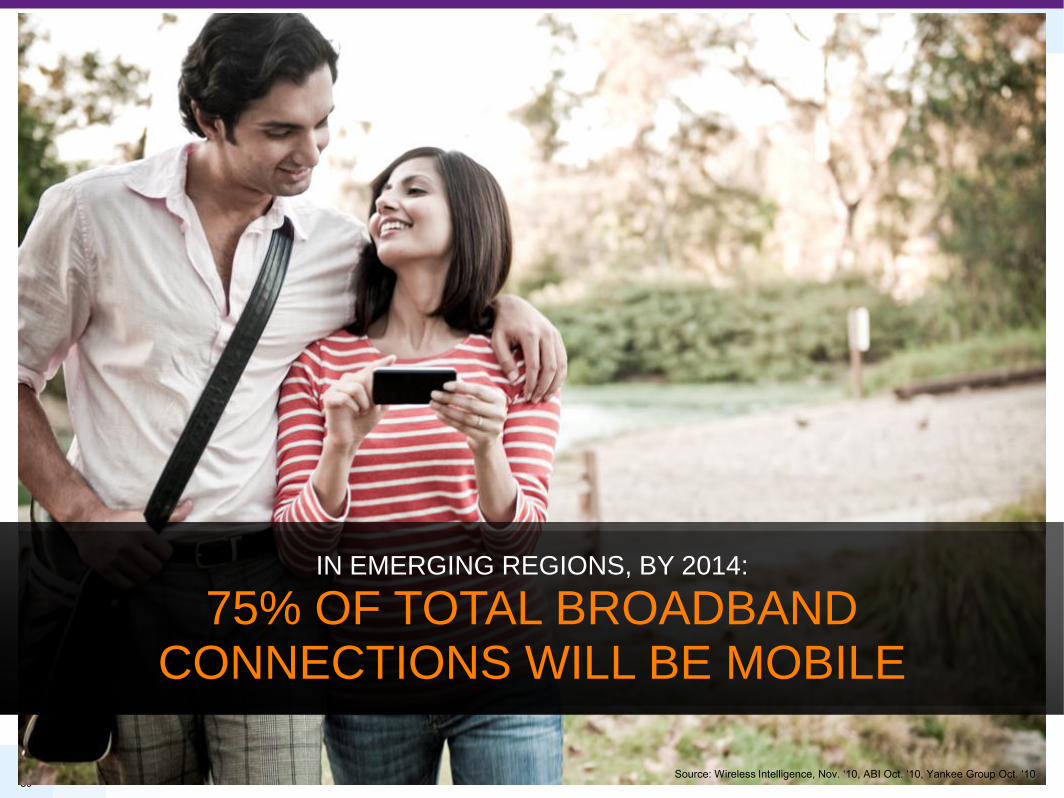
75% OF TOTAL BROADBAND CONNECTIONS WILL BE MOBILE
IN EMERGING REGIONS, BY 2014:
Source: Wireless Intelligence, Nov. ‗10, ABI Oct. ‗10, Yankee Group Oct. ‗10

40
Always with you
Real-time Context aware
Leveragesthe cloud
Highly personalized
The Internet Is Now MobileSHIFTING TO A CARRY ALONG EXPERIENCE
41
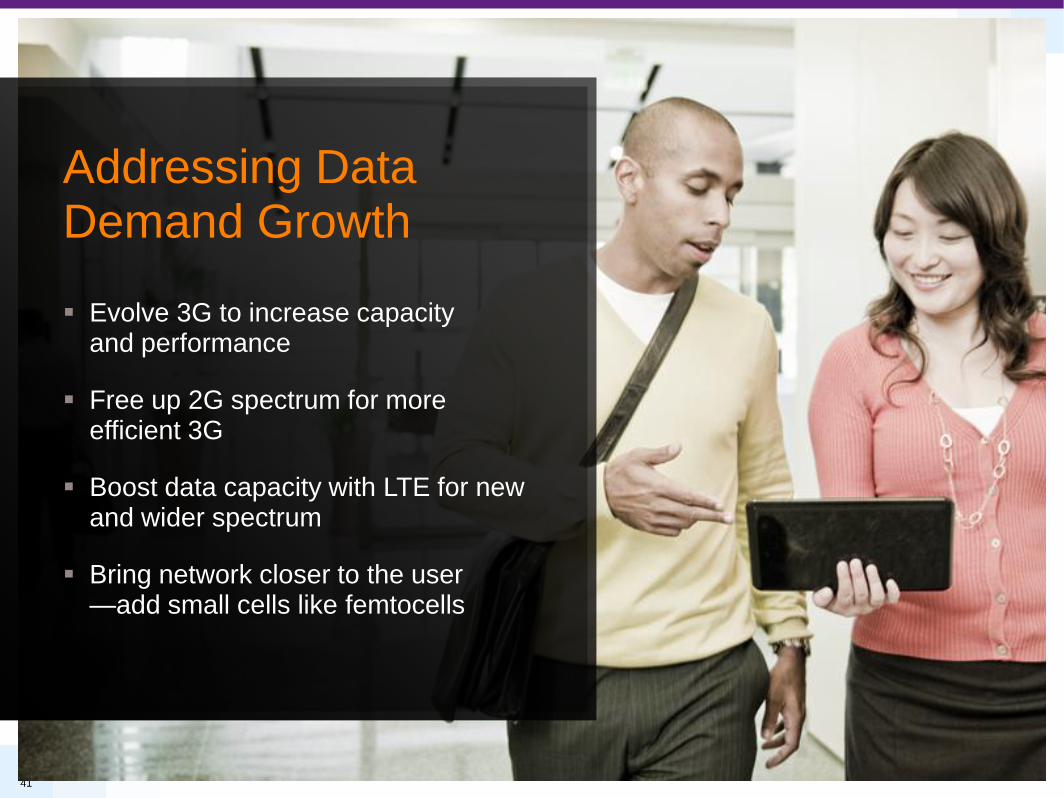
Evolve 3G to increase capacity and performance
Free up 2G spectrum for more efficient 3G
Boost data capacity with LTE for new and wider spectrum
Bring network closer to the user—add small cells like femtocells
Addressing Data Demand Growth

42
HSPA+ is The Mobile Broadband Leader
EV-DO
Subs
Total 3G* mobile broadband subscribers expected to be ~2.2B by 2014 (of total 2.8B
3G)
Su
bscrib
ers
* (M
illio
ns)
HSPA/HSPA+
Subs
Source: 3G subs – Wireless Intelligence (Nov-10), LTE – Avg. of ABI (Oct-10) and Yankee (Sep-10) and WiMax - ABI (Oct-10).
Note: * 3G includes EV-DO family, HSPA family and TD-SCDMA, ** number of unique wireless connections.
43
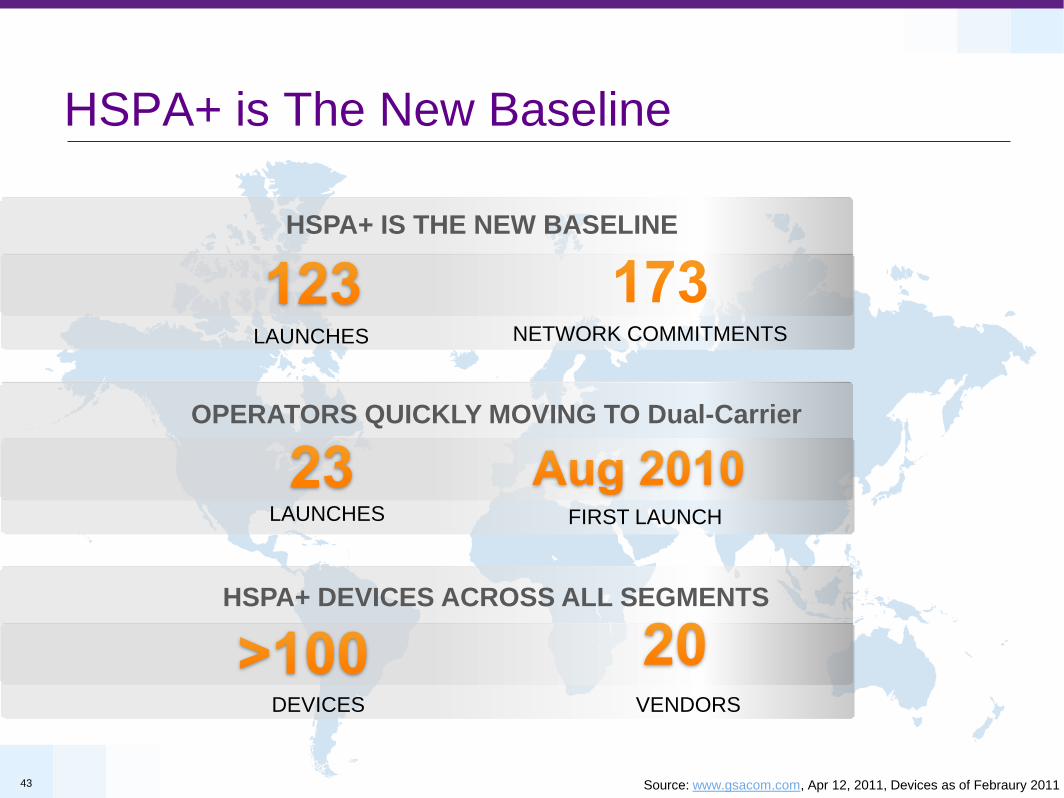
HSPA+ is The New Baseline
HSPA+ IS THE NEW BASELINE
LAUNCHES NETWORK COMMITMENTS
LAUNCHES FIRST LAUNCH
OPERATORS QUICKLY MOVING TO Dual-Carrier
HSPA+ DEVICES ACROSS ALL SEGMENTS
DEVICES VENDORS
Source: www.gsacom.com, Apr 12, 2011, Devices as of Febraury 2011
44
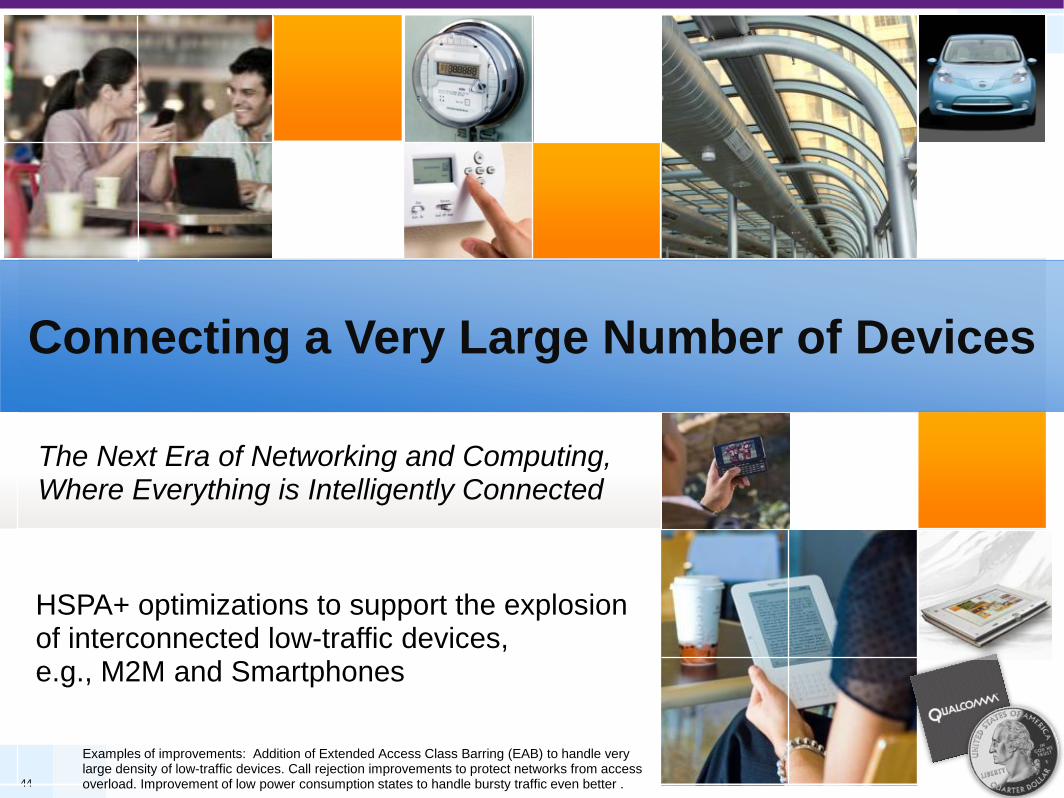
Connecting a Very Large Number of Devices
The Next Era of Networking and Computing, Where Everything is Intelligently Connected
HSPA+ optimizations to support the explosion of interconnected low-traffic devices,e.g., M2M and Smartphones
Examples of improvements: Addition of Extended Access Class Barring (EAB) to handle very large density of low-traffic devices. Call rejection improvements to protect networks from access overload. Improvement of low power consumption states to handle bursty traffic even better .

45
R11 and Beyond: HSPA+ Advanced
• Expands HSPA+ to 40MHz deployments
• Further leverages multiple antennas (UL MIMO/Beamforming)
• Exploits smart networks (multipoint ) and HetNet enhancements
R10: 20 MHz Multicarrier
• Expands HSPA+ to 20 MHz deployments
• Evolution to femtocell networks
R9: Expands Dual-Carrier
• 10 MHz Dual-Carrier in uplink
• Combination of MIMO and Dual-Carrier in downlink
• Aggregation across spectrum bands
• Femtocell enhancements: active mobility
R8: 10 MHz Dual-Carrier
• Enhances broadband—doubled data rates to all users
• Introduction of femtocell support
• Alleviates signaling traffic e.g., from Smartphones
HSPA+ Has A Strong Evolution Path
21- 28 Mbps
42 Mbps
84 Mbps
168 Mbps
11 Mbps
23 Mbps
Notes: R8 reaches 42 Mbps by combining 2x2 MIMO and HOM (64QAM) in 5 MHz, or by utilizing HOM (64QAM) and multicarrier in 10 MHz. R9 combines multicarrier and MIMO in 10 MHz to reach 84
Mbps peak rates. Uplink multicarrier doubles the uplink peak data rate to 23 Mbps in 10 MHz in R9. R10 expands multicarrier to 20 MHz to reach 168 Mbps. R11 expands multicarrier to 40MHz to reach
336 Mbps.
Rel-11 and BeyondRel - 9 Rel - 10 Rel - 7
HSPA + HSPA +(commercial)
More 5MHz Carriers
(336+ Mbps)
HSPA + Advanced
46+ Mbps
Created 01/21/11
Rel - 8
46
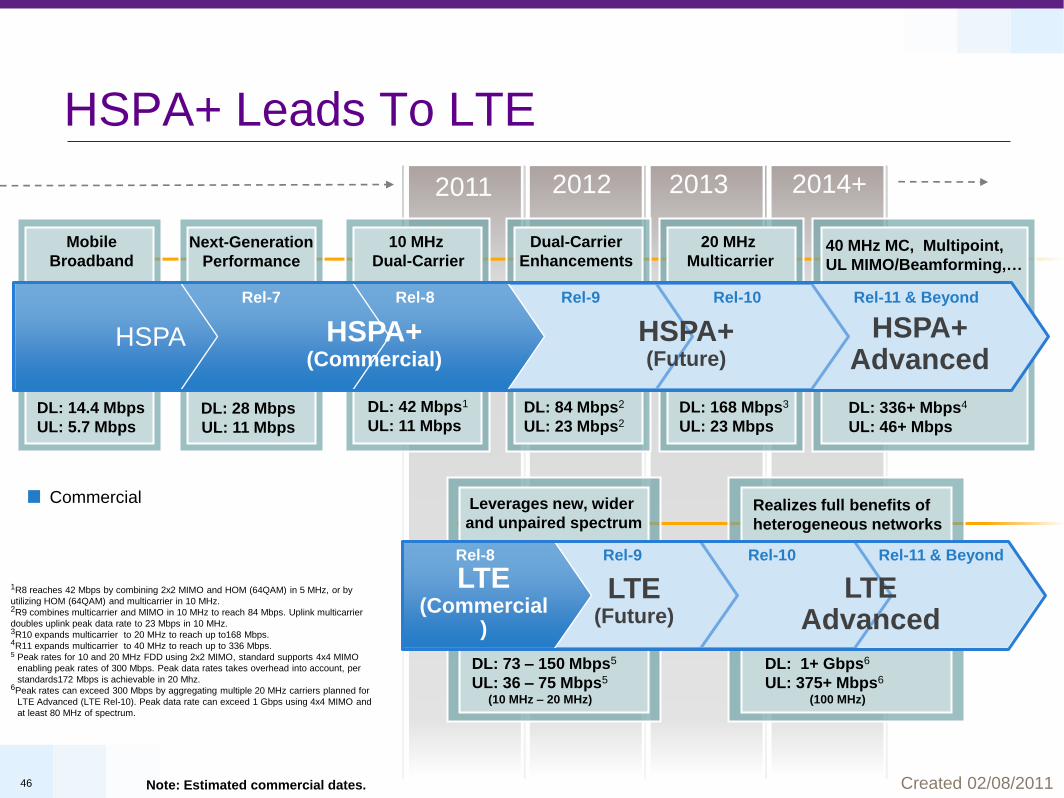
DL: 73 – 150 Mbps5
UL: 36 – 75 Mbps5
(10 MHz – 20 MHz)
Leverages new, wider
and unpaired spectrum
DL: 1+ Gbps6
UL: 375+ Mbps6
(100 MHz)
Realizes full benefits of
heterogeneous networks
HSPA+ Leads To LTE
DL: 84 Mbps2
UL: 23 Mbps2
DL: 168 Mbps3
UL: 23 MbpsDL: 28 Mbps
UL: 11 Mbps
DL: 42 Mbps1
UL: 11 MbpsDL: 14.4 Mbps
UL: 5.7 Mbps
DL: 336+ Mbps4
UL: 46+ Mbps
Commercial
2012 2013 2014+2011
Mobile
Broadband
10 MHz
Dual-Carrier
20 MHz
Multicarrier
Dual-Carrier
Enhancements40 MHz MC, Multipoint,
UL MIMO/Beamforming,…
Next-Generation
Performance
HSPA+ Advanced
HSPA+(Future)
Rel-11 & BeyondRel-10Rel-9
HSPA+(Commercial)
Rel-8Rel-7
HSPA
Rel-11 & BeyondRel-10Rel-9Rel-8
LTEAdvanced
Note: Estimated commercial dates.
1R8 reaches 42 Mbps by combining 2x2 MIMO and HOM (64QAM) in 5 MHz, or by
utilizing HOM (64QAM) and multicarrier in 10 MHz.2R9 combines multicarrier and MIMO in 10 MHz to reach 84 Mbps. Uplink multicarrier
doubles uplink peak data rate to 23 Mbps in 10 MHz.3R10 expands multicarrier to 20 MHz to reach up to168 Mbps.4R11 expands multicarrier to 40 MHz to reach up to 336 Mbps.5 Peak rates for 10 and 20 MHz FDD using 2x2 MIMO, standard supports 4x4 MIMO
enabling peak rates of 300 Mbps. Peak data rates takes overhead into account, per
standards172 Mbps is achievable in 20 Mhz. 6Peak rates can exceed 300 Mbps by aggregating multiple 20 MHz carriers planned for
LTE Advanced (LTE Rel-10). Peak data rate can exceed 1 Gbps using 4x4 MIMO and
at least 80 MHz of spectrum.
Created 02/08/2011
LTE(Commercial
)
LTE(Future)

47
LTE Has Strong Commitments
LTE MULTIMODE LAUNCHED
LAUNCHES NETWORK COMMITMENTS
TRIALS QUALCOMM MOBILITY FIELD TRIAL
LTE TDD GAINING MOMENTUM
GROWING DEVICE ECOSYSTEM
DEVICES VENDORS
Source: www.gsacom.com, Mar 2011
48
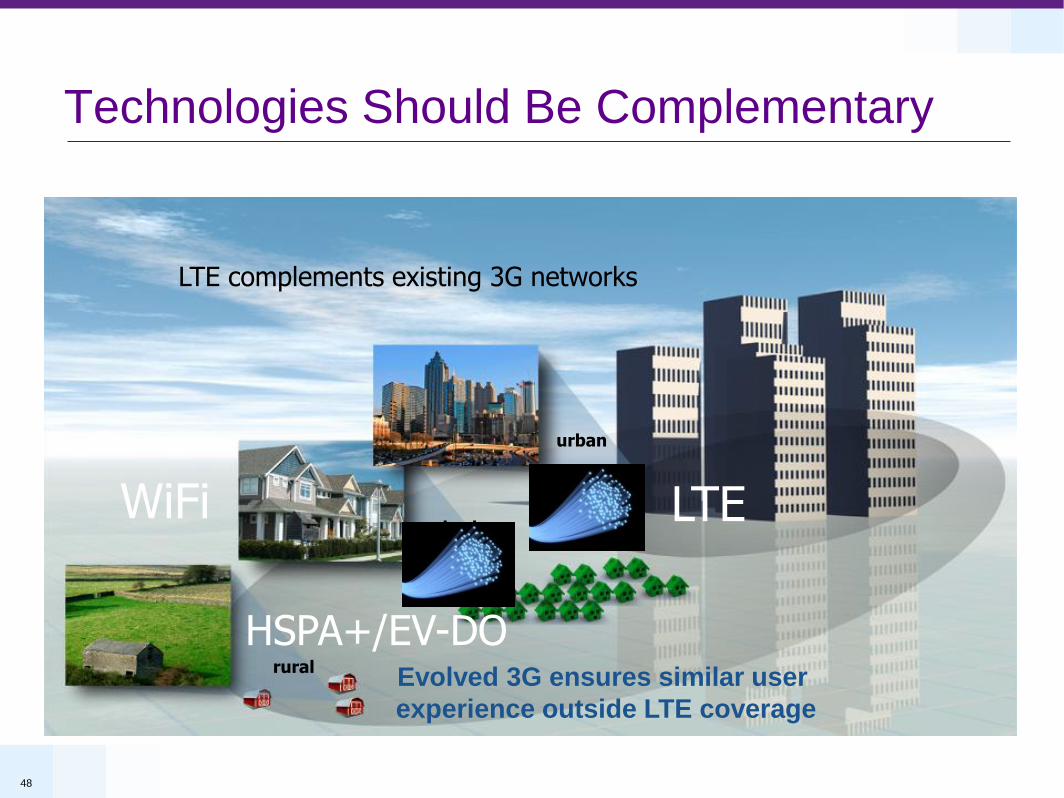
Technologies Should Be Complementary
LTE complements existing 3G networks
LTE
HSPA+/EV-DO
urban
suburban
ruralEvolved 3G ensures similar user
experience outside LTE coverage
WiFi

49
Benefits Of Spectrum Harmonization
US/Canada700, 850 MHz
1.7/2.1, 1.9, 2.5 GHz
Europe800, 900 MHz
1.8, 1.9/2.1, 2.5 GHz
Asia-Pacific450, 700, 850, 900 MHz1.7, 1.8, 1.9/2.1, 2.3, 2.5
GHz
Africa & Middle E.450, 800, 850, 900 MHz
1.8, 1.9/2.1, 2.5 GHzLatin America
450, 700, 850, 900 MHz1.7/2.1, 1.8, 1.9, 2.5 GHz
Facilitates international roaming
Greater economies of scale will drive down the cost of mobile user devices
Minimizes interference

50
LTE Leverages New Wider Spectrum
Similar LTE and Evolved 3G PerformanceWhen using same bandwidth and same number of antennas
Best suited to leverage
new and wider contiguous spectrum
Available in smaller
bandwidths
20 MHz15 MHz1.4
MHz 10 MHz5 MHz3 MHz
LTE relative performance decreases with bandwidth due to higher overhead; 40% overhead
in 1.4 MHz vs. 25% in 20 MHz results in 25% better relative performance in 20 MHz vs. 1.4
MHz.

51
Free Up 2G Spectrum for 3G/4G LTE
1Source: GFK. 2Multicarrier across bands supported in 3GPP R9
UMTS900 almost closes 2G/3G coverage gap—eliminates 3G porosity
3G to cope with increasing data usage and 2G capacity limitations
Additional 2G bands e.g.1800MHz suitable for HSPA+ and/or LTE refarming
Example: UMTS900 enabled devices is
more than 50% of monthly sales in EU51
Multicarrier Across Bands—Another Driver for
refarming 900 MHz and 1800 MHz for HSPA+2

52
LTE TDD: The Global Solution for Unpaired Spectrum
2011 2012+2010
LTE FDD Multimodecommercial launches
LTE FDD single mode
LTE TDD Multimodecommercial launches
3G Evolution (HSPA/HSPA+, EV-DO Rev. A/B , 1X/DO Advanced)
LTE TDDtrials
TDD Spectrum BandsPotential
Spectrum
2.5/2.6 GHz (IMT Extension gap)B383: 2570 MHz to 2620 MHz
50 MHz
2.3 GHzB404: 2300 MHz to 2400 MHz
100
MHz
Global TDD Spectrum
LTE TDD operator trials in 2010, Commercial launches in 20112
China and India to deploy LTE TDD China Mobile committed to LTE TDD, e.g. in 2.3 GHz
Major India BWA operators in 2.3 GHz
Strong industry support Basically all vendors offering LTE TDD
WiMAX industry support declining1
Leverages LTE FDD Shares most of FDD design and standard
Common FDD/TDD core network
1Examples: Clearwire announced LTE trials in press release Aug 4th 2010. Russia’s Yota announced plans to drop WiMAX in favor of LTE in some markets. 2Single mode LTE TDD trials 2H2010, multimode trials 1H 2010 and commercial multimode launch in 2011
3IMT extension band provides 50 MHz TDD in addition to 70 MHz + 70 MHz
FDD in most countries. 2B340 will e.g. be used for India and China, can
provide up to 100 MHz, but less spectrum may be available in some markets.

Thank You
Follow us on:
For more information on Qualcomm, visit us at: www.qualcomm.comwww.qualcomm.com/blog www.facebook.com/QualcommPhilippines
For more information on Qualcomm, visit us at: www.qualcomm.comwww.qualcomm.com/blog www.facebook.com/QualcommPhilippines
Regulatory enablement towards
growth of Mobile Broadband
Kristin Due Hague,
Spectrum Director, GSMA

© GSMA 2011
The key messages
Release mobile spectrum
Make all internationally/regionally harmonised mobile bands available
Make spectrum for backbone / feeding available
Mobile broadband requires increased backbone capacity too
Ensure transparent and fair mechanisms to award spectrum/licenses
Operators competing when excess demand makes sense
Technologies competing for access to spectrum is ok
Focus on long term economic efficient use of spectrum and not short term
policies of maximizing revenue collection
Ensure distribution of spectrum for a competitive downstream market but
allow market mechanisms and underlying economic structures to
contribute to determine the market structure
Significant upfront investment issues and scale issues
Leaving spectrum idle potentially making society worse off than allowing
existing operators use it
55
© GSMA 2011
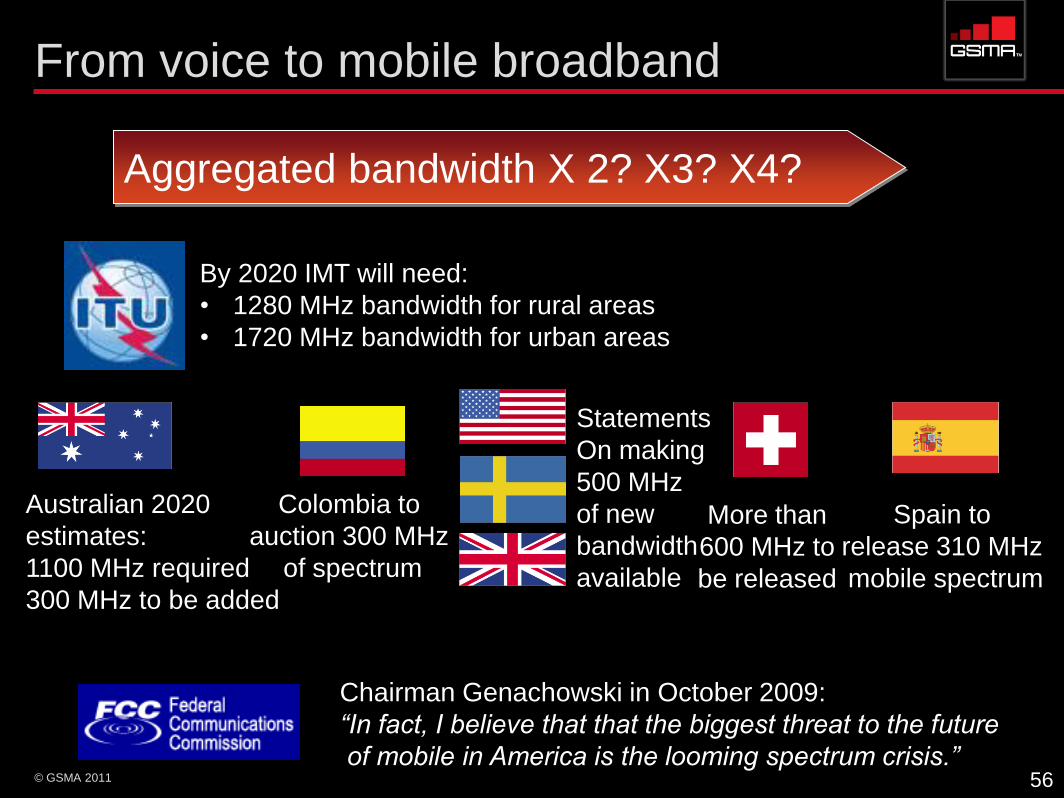
From voice to mobile broadband
56
Aggregated bandwidth X 2? X3? X4?
By 2020 IMT will need:
• 1280 MHz bandwidth for rural areas
• 1720 MHz bandwidth for urban areas
Chairman Genachowski in October 2009:
“In fact, I believe that that the biggest threat to the future
of mobile in America is the looming spectrum crisis.”
Colombia to
auction 300 MHz
of spectrum
Spain to
release 310 MHz
mobile spectrum
Statements
On making
500 MHz
of new
bandwidth
available
More than
600 MHz to
be released
Australian 2020
estimates:
1100 MHz required
300 MHz to be added

© GSMA 2011
Candidate mobile bands Asia Pacific
703 803
10
MHz
880 960
20
MHz
1710 1880
The coverage bands The capacity bands
2300 2400
1920 217030
MHz
50
MHz
2500 2690
The 900 band: 2X35 MHz
The 1800 band: 2X75 MHzThe 700 band: 2X45 MHz
The 2100 band: 2X60 MHz
The 2600 band: 2X70 MHz and 50 MHz unpaired
The 2300 band: 100 MHz
10
MHz
824 894
20
MHz
The 850 band: 2X25 MHz
748 758
849 869
915 925
1785 1805
1880 2110
2570 2620

© GSMA 2011
Spectrum roadmaps
Increased complexity when assessing
combinations of spectrum bands and
technologies
Decision making under uncertainty is one
scenario that reduces the price of the
assets to acquire (and government
revenue!)
Mobile operators needs to know what
spectrum they should expect to be
allocated and awarded in the future when
making investment decisions
Equipment manufacturers needs a
spectrum availability roadmap when
deciding upon their go-to-market
strategies
Tie between band and technology broken
900 band:
• 10 years ago = GSM
• Today = GSM and/or UMTS/HSPA?
• Tomorrow = GSM, and/or UMTS/HSPA and/or
LTE?
Complexity will continue to increase:
• LTE FDD in 700?
• LTE FDD in 700/1800?
• LTE FDD in 700 and LTE TDD in 2.3?
• LTE FDD in 700/2.6?
Mobile operators will face a complex scenario when
making future investment decisions
Vendors face a complex scenario when determining
the road from standardisation to commercial launch
Governments should publish spectrum allocation and award roadmaps!
• Tell us what you‘ll do next year
• Tell us what are your 3 year allocation and release plan
• Tell us what are your 10 year allocation and release plan
© GSMA 2011
Awarding spectrum/licenses
Stages of awarding spectrum
Deciding objectives
Economic efficient outcome for society or short term maximizing of
revenue collection for the government?
Specific competition issues to be solved? Market structure, caps etc
Defining what to sell
License design – definition of usage rights
Other terms and conditions which will have impact on the business
cases for ―bidders‖ such as coverage and roll out obligations, potential
technology and service restrictions, annual fees/charges, sharing
models, tradability etc
Designing the award procedure
Open, transparent, non-discriminatory
Specific exercise, tailor-made, not a one-size-fits-all exercise
When demand exceeds supply a competitive award procedure is
normally used (―money auctions‖, ―beauty parades‖)
Implementing and executing the award
Open, transparent, non-discriminatory
59

© GSMA 2011
Market structure issues Promote competition in down stream markets
Competitive markets for delivering innovative services, high quality services, at
lowest possible prices for consumers
Number of operators does not necessarily define how competitive a market is (but
monopolies are of course not competitive)
Determining ―the right market structure‖ is complicated and a risky exercise for
any government to take full responsibility for - observation of current trends
Using more flexible award designs to determine exact number of operators (whether
e.g. three, four or five is the right number of licenses in a band)
Recognising that going broadband means more bandwidth per operator – including
loosening up on previous stricter spectrum caps
Allowing more commercially based arrangements around spectrum and network
sharing, infrastructure sharing etc
Considering more than one band as relevant if considering to implement spectrum
caps – the more bands and more technologies per band issues means bands can be
substitutes – and the growing interests in the ―multi-band auctions‖
Consider mechanisms to avoid spectrum being left idle because of a pre-defined
license not being ―sold‖ in an award procedure
60

Connecting consumers to Internet –
socio-economic impact
Kristin Due Hague,
Spectrum Director, GSMA
© GSMA 2011
Social and economic impact analysis
A number of analysis of economic impact and/or social impact of
connecting consumers to the Internet, of broadband adaption and of
mobile broadband adaption have been carried out
Who uses the approach of social and economic impact analysis
Governments
Analysis carried out internally
Use of external expertise – academics and consultants
International organizations involved in policy making
Organizations involved in economic development
Regional example: EU uses economic impact analysis when developing
their broadband policies and spectrum policies
Market players engaged in businesses in various sectors
Socio-economic impact analysis used by mobile operators and vendors
Trade organizations
A telecom example: GSMA commissions socio-economic impact analysis
63

© GSMA 2011
Broadband and GDP growth
1.2–1,4Various
0,6U.K.
0,8Australia
(Victoria)
0,9New Zealand
0,1Malaysia
0.13–0,3Middle Eastern
country
GDP impact of 10% higher
broadband penetration*
%
Source: McKinsey
World Bank econometrics
analysis of 120 countries
(Qiang 2009):
10% increased broadband
penetration
1.3% economic growth
The growth effect of
broadband is significant and
stronger in developing
countries than in developed
economies
The impact can be even more
robust once the penetration
reaches a critical mass
1.3% GDP growth per 10% penetration increase

© GSMA 2011
Society / consumers benefits from Internet
Improving healthcare Tool for gathering and
managing health information
Disease surveillance tool
Remote diagnoses via
telemedicine
Access to health information,
health hotline
Health education, training
and emergency support tool
Coordinating drug and
medical supply distribution
tool
Enhancing rapid disease
testing via mobile phone
microscopy applications
65
Mobile money
Mobile money for everyone
Mobile money for the
unbanked
Education
Improved quality of teaching
Online courses and classes
Online libraries
Higher education opportunities
Agriculture
Farmer helplines
Seed information
Weather warnings
Creating jobs
In the ICT industry
Enabler in job creation in other sectors

© GSMA 2011
700 band to mobile: GDP impact in APAC
66
BCG: total GDP will increase US$ 658B for the period 2014-2020
Source:

© GSMA 2011
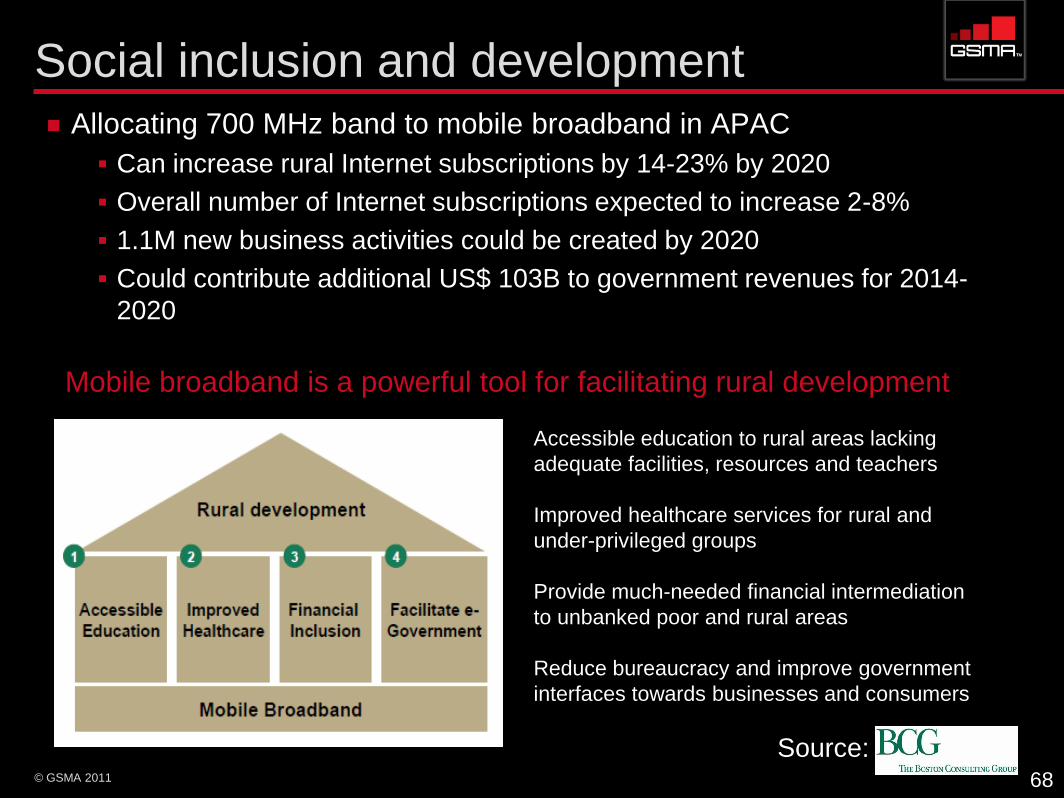
Social inclusion and development
Allocating 700 MHz band to mobile broadband in APAC
Can increase rural Internet subscriptions by 14-23% by 2020
Overall number of Internet subscriptions expected to increase 2-8%
1.1M new business activities could be created by 2020
Could contribute additional US$ 103B to government revenues for 2014-
2020
68
Source:
Mobile broadband is a powerful tool for facilitating rural development
Accessible education to rural areas lacking
adequate facilities, resources and teachers
Improved healthcare services for rural and
under-privileged groups
Provide much-needed financial intermediation
to unbanked poor and rural areas
Reduce bureaucracy and improve government
interfaces towards businesses and consumers

69
Allocation of sufficient and harmonized spectrum has been
assumed in the analysis of socio-economic benefits
Source: 9th Meeting of the APT Wireless Forum (AWF-9); GSMA
Sufficient bandwidth needs
to be allocated to mobile
2 x 45 MHz needed to provide sufficient
bandwidth for effective rollout
• APT harmonized UHF bandplan for IMT
within the 698-806 MHz band
• Lower guard-band between 698-703
MHz and an upper guard-band between
803-806 MHz
Adequate bandwidth will facilitate
competition between operators,
enhancing efficiency and consumer
choice and price benefits
Harmonization of spectrum
across region necessary to reap
full benefits
Non-harmonization will drive up cost of
hand-sets and make them unaffordable to
lower-income consumers
• Lack of frequency harmonization can
drive up terminal costs, as providers will
not be able to enjoy economies of scale
• Small un-harmonized markets risk being
marginalized by equipment
manufacturers
• Harmonization will reduce cross-border
interference and facilitate improved
usage quality
45
MHz45
MHz
698
MH
z
806
MHz
694
MHzPPDR/
LMR
DTTV
10 MHz
centre gap
5
MHz3
MHz

© GSMA 2011
The impact of Mobile Broadband in emerging markets is
transformative
Mobile Broadband will
be the first Internet
connection for many
consumers in emerging
markets
Social and economic
impact of the first
connection is significant
Impact of mobile
broadband in emerging
markets are more
significant than in
mature markets where
consumers already are
connected
Delivering social value: mobile broadband for all
Mobile broadband will do for Internet connections what
GSM did for voice communications in emerging markets
© GSMA 2011
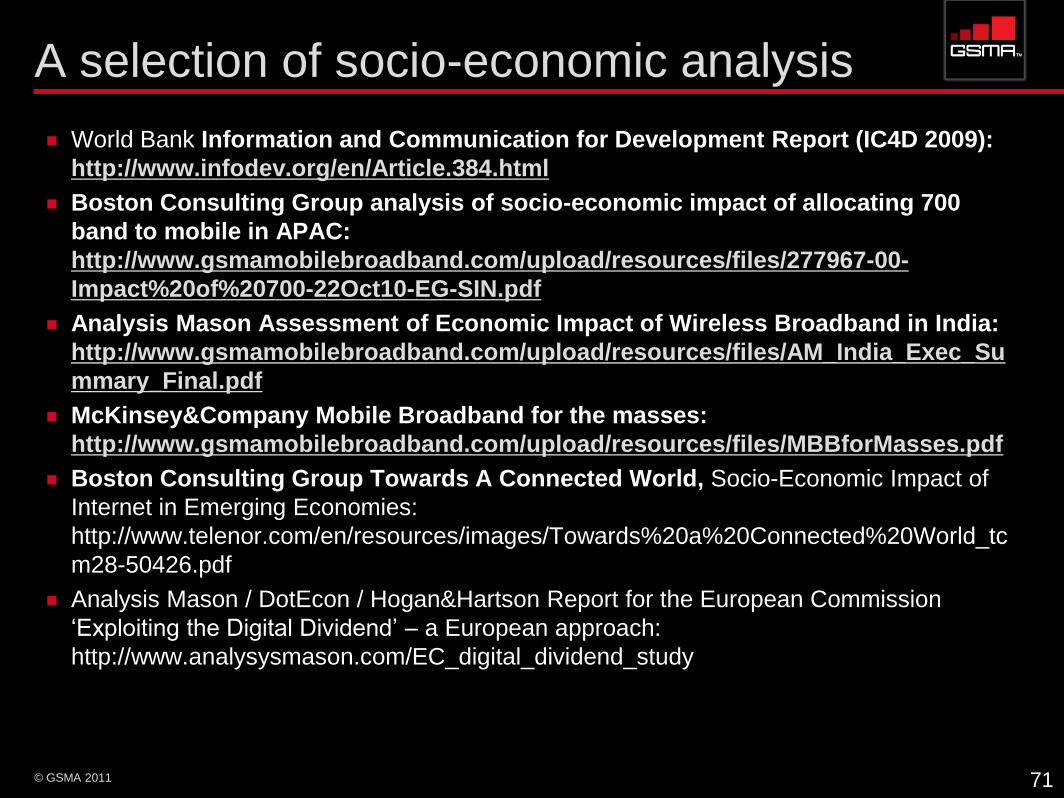
A selection of socio-economic analysis
World Bank Information and Communication for Development Report (IC4D 2009):
http://www.infodev.org/en/Article.384.html
Boston Consulting Group analysis of socio-economic impact of allocating 700
band to mobile in APAC:
http://www.gsmamobilebroadband.com/upload/resources/files/277967-00-
Impact%20of%20700-22Oct10-EG-SIN.pdf
Analysis Mason Assessment of Economic Impact of Wireless Broadband in India:
http://www.gsmamobilebroadband.com/upload/resources/files/AM_India_Exec_Su
mmary_Final.pdf
McKinsey&Company Mobile Broadband for the masses:
http://www.gsmamobilebroadband.com/upload/resources/files/MBBforMasses.pdf
Boston Consulting Group Towards A Connected World, Socio-Economic Impact of
Internet in Emerging Economies:
http://www.telenor.com/en/resources/images/Towards%20a%20Connected%20World_tc
m28-50426.pdf
Analysis Mason / DotEcon / Hogan&Hartson Report for the European Commission
‗Exploiting the Digital Dividend‘ – a European approach:
http://www.analysysmason.com/EC_digital_dividend_study
71

Executive Roundtable
Panel Discussion: Mobile
Broadband Today in the
Philippines

Closing Remarks and Vote of Thankswww.gsmamobilebroadband.com