connecting the world...expansions volumes (in mm lbs/year) year status...
TRANSCRIPT

Connecting the World
Kathleen L. Quirk
www.fcx.com
at ee QuExecutive Vice President & CFO
June 22, 2011
Cautionary Statement Cautionary Statement This presentation contains forward-looking statements in which we discuss factors we believe may affect our potential performance in the future. Forward-looking statements are all statements other than statements of historical facts, such as statements regarding projected ore grades and milling rates, projected production and sales volumes, projected unit net cash costs, projected operating cash flows, projected capital expenditures, the impact
Cautionary Statement Cautionary Statement
of copper, gold, molybdenum and cobalt price changes, reserve estimates, exploration efforts and results, mine production and development plans, liquidity, other financial commitments and tax rates, the impact of copper, gold, molybdenum and cobalt price changes, potential prepayments of debt, projected EBITDA, future dividend payments and potential share purchases. The words “anticipates,” “may,” “can,” “plans,” “believes,” “estimates,” “expects,” “projects,” “intends,” “likely,” “will,” “should,” “to be” and any similar expressions are intended to identify those assertions as forward-looking statements. The declaration of dividends is at the discretion of the Company's Board of Directors and will depend on the Company's financial results, cash requirements, future prospects, and other factors deemed relevant by the Board. This presentation also includes forward-looking statements regarding mineralized material not included in reserves. The mineralized material described in this presentation will not qualify as reserves until comprehensive engineering studies establish their economic feasibility. Accordingly, no assurance can be given that the estimated mineralized material not included in reserves will become proven and probable reserves.
In making any forward-looking statements, the person making them believes that the expectations are based on reasonable assumptions. We caution readers that those statements are not guarantees of future performance and our actual results may differ materially from those anticipated, projected or assumed in the forward-looking statements. Important factors that can cause our actual results to differ materially from results anticipated by forward-looking statements include commodity prices, mine sequencing, production rates, industry risks, regulatory changes, political risks, potential effects of violence in Indonesia, the resolution of administrative disputes in the Democratic Republic of Congo, weather-related risks, labor relations, environmental risks, litigation results, currency translation risks and other factors described in more detail under the heading “Risk Factors” in our Annual Report on Form 10-K for the year ended December 31, 2010, filed with the Securities and Exchange Commission (SEC).
I t ti d th t f th ti hi h f d l ki t t t b d lik l t h ft f dInvestors are cautioned that many of the assumptions on which our forward-looking statements are based are likely to change after our forward-looking statements are made, including for example commodity prices, which we cannot control, and production volumes and costs, some aspects of which we may or may not be able to control. Further, we may make changes to our business plans that could or will affect our results. We caution investors that we do not intend to update our forward-looking statements, notwithstanding any changes in our assumptions, changes in our business plans, our actual experience, or other changes, and we undertake no obligation to update any forward-looking statements more frequently than quarterly.
2
This presentation also contains certain financial measures such as unit net cash costs (credits) per pound of copper and per pound of molybdenum. As required by SEC Regulation G, reconciliations of these measures to amounts reported in the Company’s consolidated financial statements are in the supplemental schedule, “Product Revenues and Production Costs,” which is available on our internet website www.fcx.com.
“Connecting the World”“Connecting the World”Connecting the WorldConnecting the World2010 Annual Report Highlights
Global Leader in Production of Copper, Gold and Molybdenum
Well Situated to Meet Growing Demand for Metals
Geographically Diverse Geographically Diverse
Long-Lived Reserves
Growing Production Profile
Strong Financial Position
3
Experienced Team

FCX’s Global FootprintFCX’s Global FootprintMajor Mine Operations & Development Projects
All major assets majority-controlled and operated
FCX s Global FootprintFCX s Global Footprint
Grasberg (90.64%)Grasberg (90.64%)
ReservesCu 42.2 billion lbsMo 2.75 billion lbs
Sales
North America1North America1 CopperCopper/Gold/SilverMolybdenumCobalt
ReservesCu 32.7 billion lbsAu 33.7 million ozs
SalesCu 1.1 billion lbsAu 1.5 million ozs
SalesCu 1.2 billion lbsMo 73 million lbs2
South America3South America3
Tenke (56 0%)4Tenke (56 0%)4Reserves
ReservesCu 8.1 billion lbsCo 0.8 billion lbs
SalesCu 285 million lbsCo 20 million lbs
Tenke (56.0%)Tenke (56.0%)Cu 37.5 billion lbsAu 1.4 million ozsMo 0.6 billion lbs
SalesCu 1.3 billion lbsAu 0.1 million ozs
4
Note: FCX consolidated reserves and annual sales; reserves as of December 31, 2010. Sales figures are based on 2011e.1 Cu operations: Morenci (85%), Sierrita (100%), Bagdad (100%), Tyrone (100%), Safford (100%), Miami (100%) and Chino (100%); Primary Mo: Henderson (100%) 2 Includes moly sales from South America 3 Cu operations: Candelaria/Ojos del Salado (80%), Cerro Verde (53.6%) and El Abra (51%) 4 After recent amendments to Tenke’s contract become effective, FCX’s ownership interest will be 56%.
Co 20 million lbs

World’s Leading Copper ProducersWorld’s Leading Copper Producersg ppg pp
(000 t)
Top 10 Copper Producers (2011e)
1,600
1,800
2,000
1,200
1,400
600
800
1,000
200
400
5
0
Codelco FCX BHP Billiton Xstrata Anglo American
Southern Copper
Rio Tinto Antofagasta KGHM RAO Norilsk
____________________Source: Brook Hunt 1Q11 Report. Rankings based on net equity ownership.e=estimate

World Class Copper DiscoveriesAre Extremely Rare
World Class Copper DiscoveriesAre Extremely Rare
2011e Copper Production
Are Extremely RareAre Extremely Rare
Recoverable Copper ReservesMillion metric tons Thousand metric tons
0 200 400 600 800 1,000 1,200
Escondida - 1979
Chuquicamata - 1910
0 5 10 15 20 25
Grasberg Complex - 1988
KGHM Polish Copper - 1957
Million metric tons Thousand metric tons
Collahuasi - 1979
Grasberg Complex - 1988
Escondida - 1979
Collahuasi - 1979
Los Pelambres - 1996
El Teniente - 1910
Antamina - 1996
El Teniente - 1910
Cananea - 1926
Oyu Togloi - 1997
Norilsk - 1935
Cerro Verde - 1860s
Oyu Togloi 1997
Chuquicamata - 1910
Andina - 1865
6
Los Bronces - 1981Los Pelambres - 1996
Source: Brook Hunt
e=estimate

MarketsMarketsCs
2,000
2,500
400
500
LME Copper Price
Cen
ts Per P
oun0
’s M
etri
c To
ns
1,000
1,500
200
300
LME Copper Price
nd
00
0
0
500
Jan-99
Jul-99
Jan-00
Jul-00
Jan-01
Jul-01
Jan-02
Jul-02
Jan-03
Jul-03
Jan-04
Jul-04
Jan-05
Jul-05
Jan-06
Jul-06
Jan-07
Jul-07
Jan-08
Jul-08
Jan-09
Jul-09
Jan-10
Jul-10
Jan-11
0
100
LME & COMEX Exchange Stocks* LME & COMEX Exchange Stocks*
*LME and Comex, excluding Shanghai stocks, producer, consumer and merchant stocks.
Molybdenum Price* ($/lb)London Gold Price ($/oz)
$1,500
$1,750
$35
$40
$500
$750
$1,000
$1,250
$10
$15
$20
$25
$30
7* Metals Week – Molybdenum Dealer Oxide Price
$0
$250
$
Jan-99
Jan-00
Jan-01
Jan-02
Jan-03
Jan-04
Jan-05
Jan-06
Jan-07
Jan-08
Jan-09
Jan-10
Jan-11
$0
$5
$10
Jan-02 Jan-03 Jan-04 Jan-05 Jan-06 Jan-07 Jan-08 Jan-09 Jan-10 Jan-11
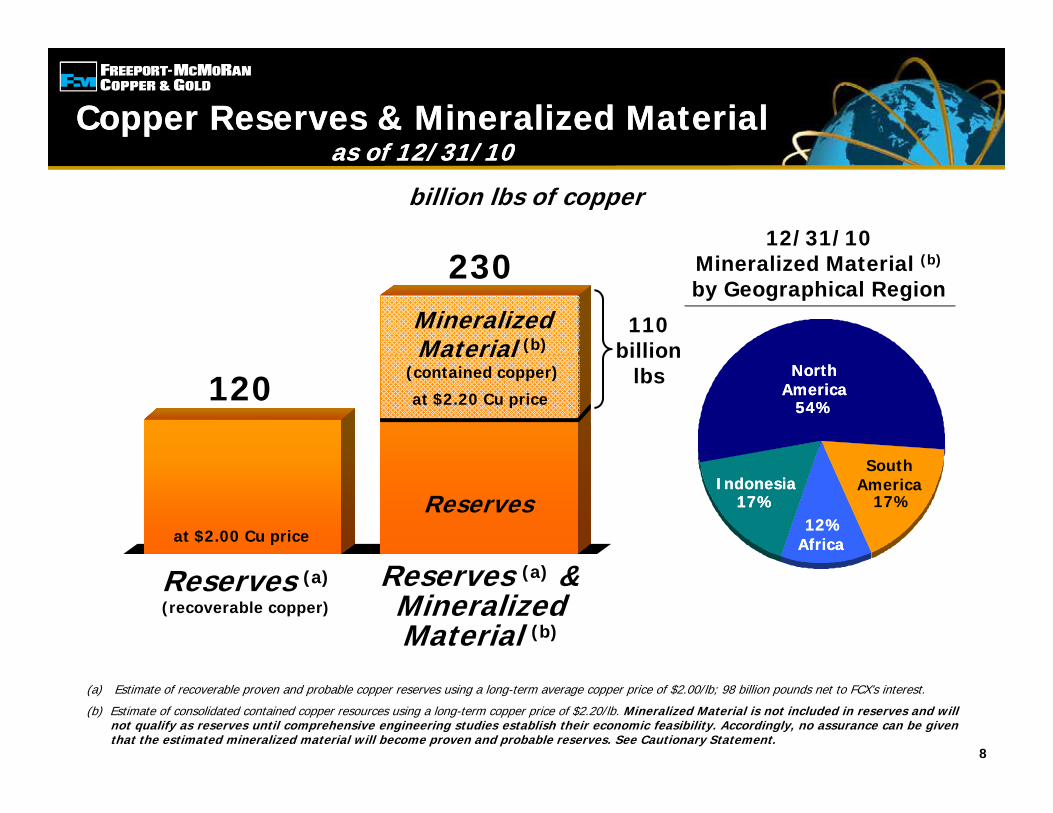
Copper Reserves & Mineralized Materialas of 12/31/10
Copper Reserves & Mineralized Materialas of 12/31/10as of 12/31/10as of 12/31/10
billion lbs of copper
12/31/10230
MineralizedMaterial (b)
110billion
Mineralized Material (b)
by Geographical Region
120 at $2.20 Cu price
Material(contained copper)
billionlbs North
AmericaNorth
America54%54%
at $2.00 Cu price
ReservesIndonesiaIndonesia
17%17%
SouthAmerica
17%
AfricaAfrica12%12%
Reserves (a)
(recoverable copper)
Reserves (a) &MineralizedMaterial (b)
(a) Estimate of recoverable proven and probable copper reserves using a long-term average copper price of $2.00/lb; 98 billion pounds net to FCX’s interest.
(b) Estimate of consolidated contained copper resources using a long-term copper price of $2.20/lb. Mineralized Material is not included in reserves and willnot qualify as reserves until comprehensive engineering studies establish their economic feasibility. Accordingly, no assurance can be giventhat the estimated mineralized material will become proven and probable reserves. See Cautionary Statement.
8
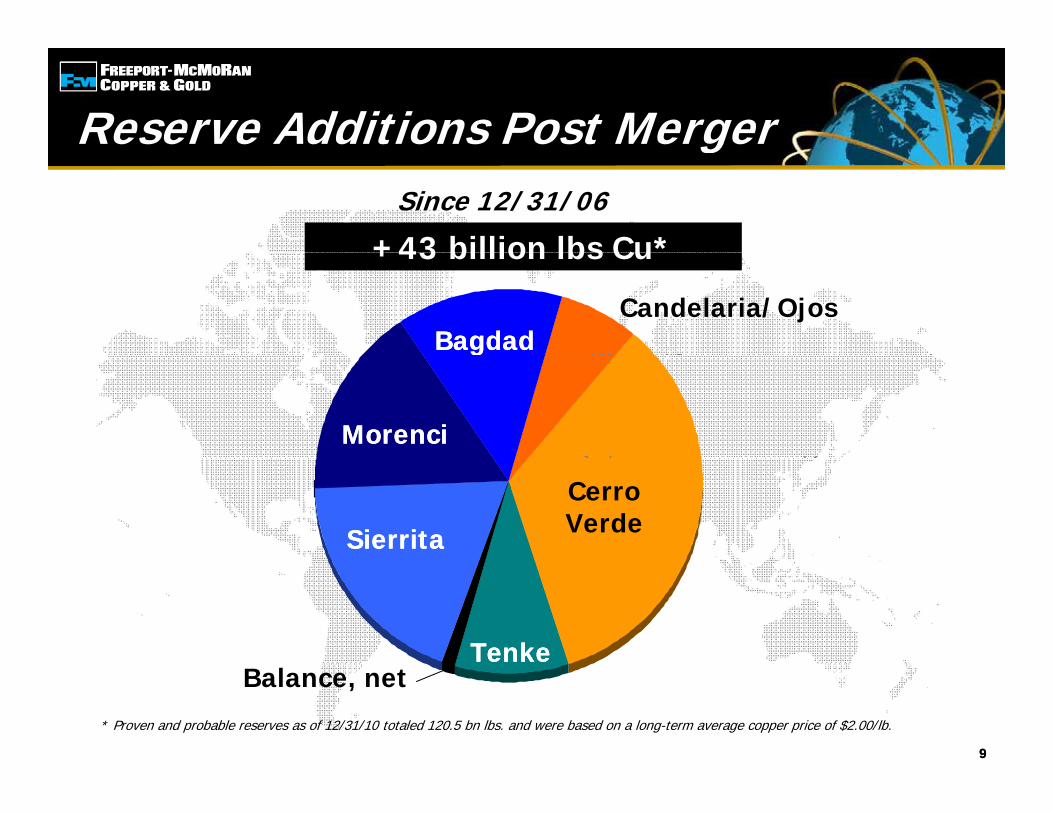
Reserve Additions Post Mergerg
+43 billion lbs Cu*Since 12/31/06
BagdadBagdadCandelaria/Ojos
+43 billion lbs Cu
MorenciMorenci
SierritaSierrita
CerroVerde
TenkeTenke
99
* Proven and probable reserves as of 12/31/10 totaled 120.5 bn lbs. and were based on a long-term average copper price of $2.00/lb.
Balance, net
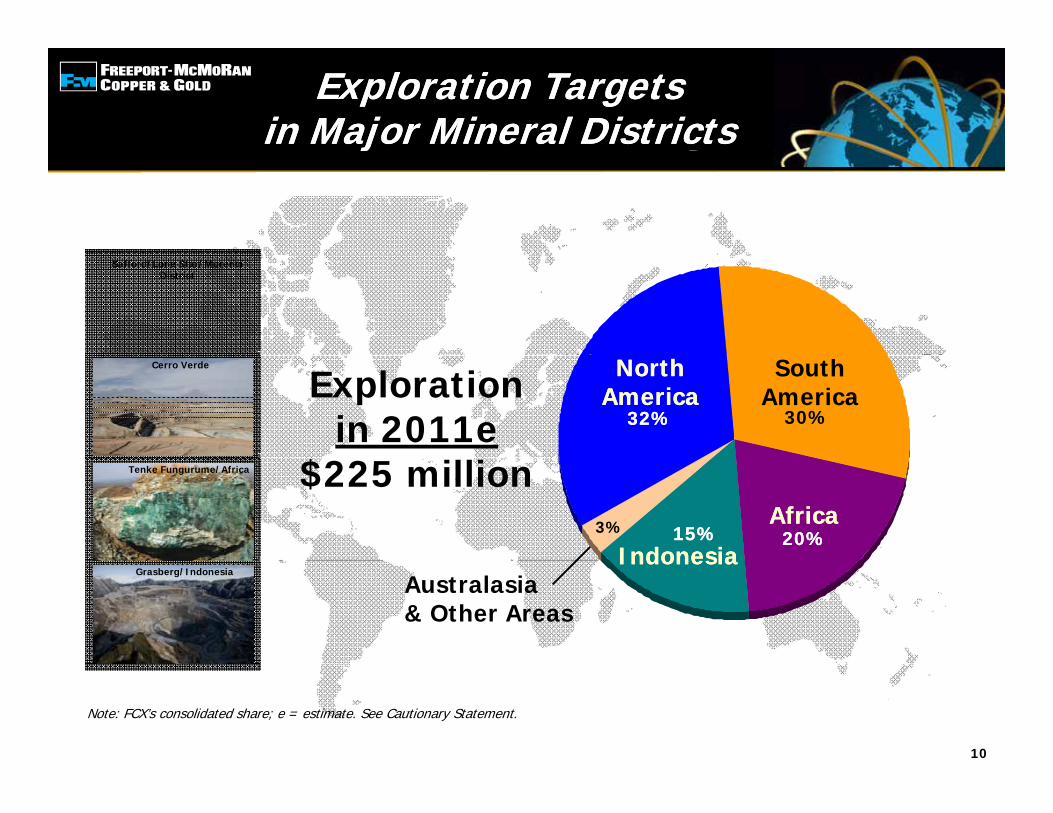
Click to edit Master title styleExploration Targets
in Major Mineral DistrictsExploration Targets
in Major Mineral Districtsyjj
Safford/Lone Star/MorenciDistrict
Explorationin 2011e
NorthAmerica
NorthAmerica
SouthAmerica
Cerro Verde
32%32% 30%
$225 millionAfricaAfrica
IndonesiaIndonesia
Tenke Fungurume/Africa
20%20%15%15%3%
Australasia& Other Areas
IndonesiaIndonesiaGrasberg/Indonesia
Note: FCX’s consolidated share; e = estimate. See Cautionary Statement.
10
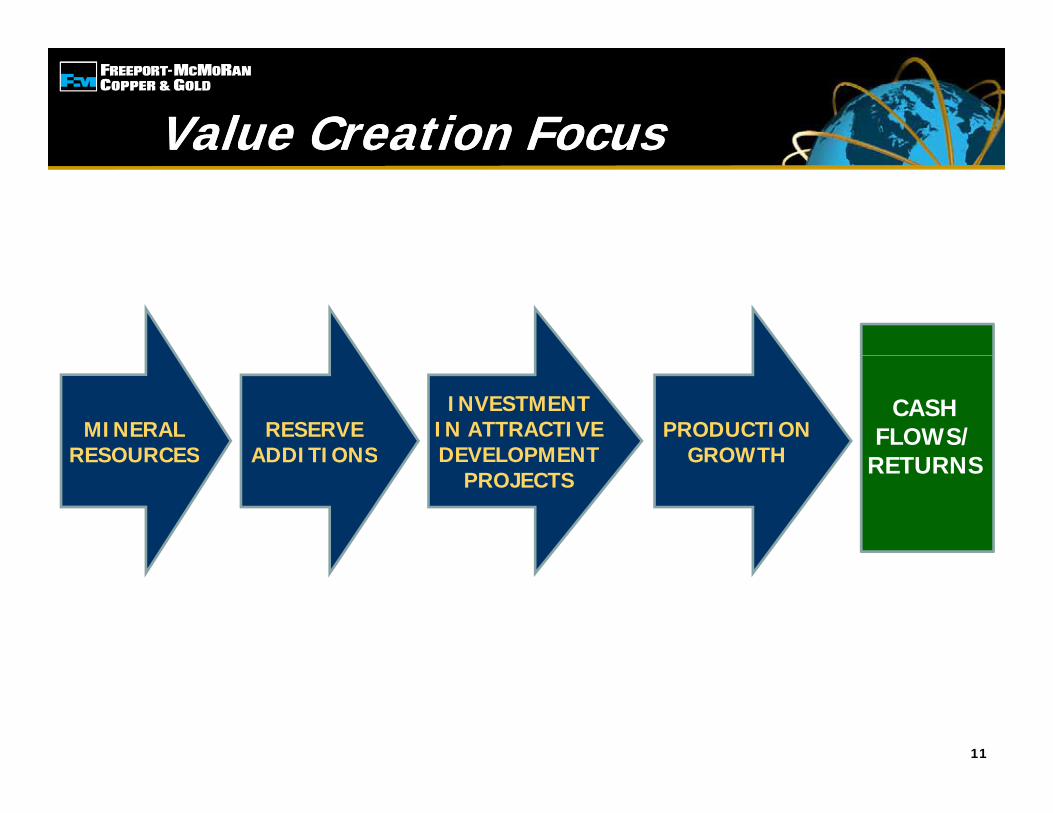
Value Creation FocusValue Creation Focusa ue C ea o ocusa ue C ea o ocus
INVESTMENT IN ATTRACTIVEDEVELOPMENT
PRODUCTIONGROWTH
CASHFLOWS/
RETURNSRESERVE
ADDITIONSMINERAL
RESOURCES DEVELOPMENTPROJECTS
GROWTH RETURNSADDITIONSRESOURCES
11

Status of Announced ProjectsStatus of Announced Projects
ExpansionsExpansionsVolumes
(in mm lbs/year) Year StatusMorenci Mill Restart & 125 2011 l tMorenci Mill Restart &
Mine Rate Increase
Miami Mine Restart
Chino Mine & Mill Restart
125
100200
2011
20122012
complete
in progressin progress
( )Chino Mine & Mill Restart
Subtotal
Tenke Mill & Mine Rate Increase
Cerro Verde Debottleneck
200425
4030
-2014
20112011
in progress
completel t
(a)
Cerro Verde Debottleneck
Total Copper
Climax Molybdenum Restart
30 2011 complete49530 2012 in progress(b)
El Abra Sulfolix
Grasberg U/G300
1,100
2011
2016 in progress
substantiallycomplete
Replacement ProjectsReplacement Projects
(c)
12
,
1,400
p g
(a) 100mm lbs in 2012 & 2013; 200mm lbs by 2014(b) Construction completion in 2012; start-up timing under evaluation (c) following transition and ramp-up from open pit; timing under evaluation

Near-Term Copper ProjectsUnder Evaluation
Near-Term Copper ProjectsUnder EvaluationUnder EvaluationUnder Evaluation
Incremental PreliminaryIncrementalCopper
(mm lbs/year)
PreliminaryCapital*($ billions)
AchieveFull RatesMill Expansions
C V d (360K) 600 $3 5 2016Cerro Verde (360K) 600 $3.5 2016Morenci (115K) 150-200 0.9 2014 Tenke (14K) 150 0 8 2013Tenke (14K) 150 0.8 2013
TOTAL 900-950 $5.2
~1 billion lbs/year Incremental Cu~$5 billion Capital Investment
13
* preliminary estimates and excludes capitalized interest; Feasibility Studies in progress

Potential Additional ProjectsPotential Additional Projectsjj
• Sulfides/Mill Projects • El Abra MillNorth AmericaNorth America South AmericaSouth America
Sulfides/Mill ProjectsLarge Scale MorenciSierrita
El Abra Mill
Af iAf i• Future Expansion
SierritaBagdadAjo
AfricaAfrica
of Tenke Oxides• Tenke Sulfides
AjoTwin Buttes
• Safford/Lone Star
14
Safford/Lone Star
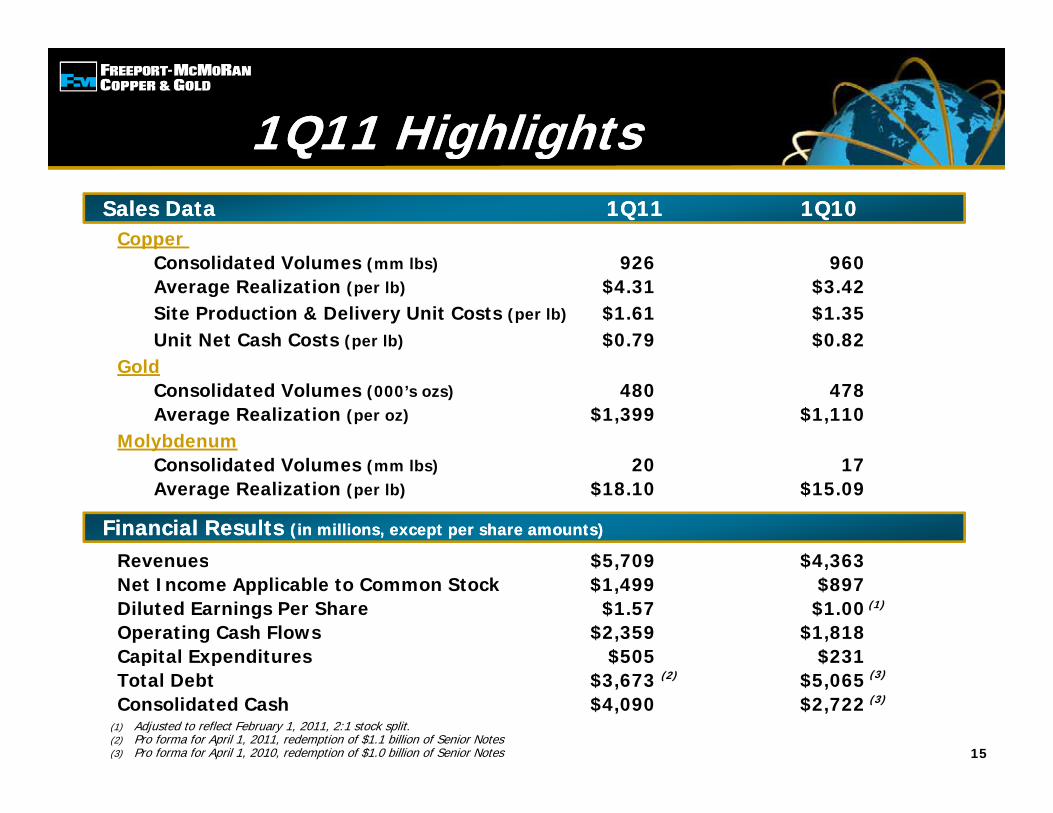
1Q11 Highlights1Q11 Highlights
Copper
Q g gQ g gSales Data 1Q11 1Q10Sales Data 1Q11 1Q10
Consolidated Volumes (mm lbs) 926 960 Average Realization (per lb) $4.31 $3.42Site Production & Delivery Unit Costs (per lb) $1.61 $1.35Unit Net Cash Costs (per lb) $0.79 $0.82
GoldConsolidated Volumes (000’s ozs) 480 478Average Realization (per oz) $1,399 $1,110
MolybdenumC lid d V l 20 17Consolidated Volumes (mm lbs) 20 17Average Realization (per lb) $18.10 $15.09
Revenues $5 709 $4 363
Financial Results (in millions, except per share amounts)Financial Results (in millions, except per share amounts)
Revenues $5,709 $4,363Net Income Applicable to Common Stock $1,499 $897Diluted Earnings Per Share $1.57 $1.00Operating Cash Flows $2,359 $1,818Capital Expenditures $505 $231
(1)
15
p p $ $Total Debt $3,673 $5,065Consolidated Cash $4,090 $2,722
(1) Adjusted to reflect February 1, 2011, 2:1 stock split.(2) Pro forma for April 1, 2011, redemption of $1.1 billion of Senior Notes(3) Pro forma for April 1, 2010, redemption of $1.0 billion of Senior Notes
(2) (3)
(3)

2011 Outlook2011 Outlook0 Out oo0 Out oo
Sales Outlook: • Copper: 3.9 Billion lbs. Sales Outlook: • Copper: 3.9 Billion lbs.
• Gold: 1.6 Million ozs.
• Molybdenum: 73 Million lbs.
Unit Net Cash Cost(1): • $1.04/lb
Operating Cash Flows(2): • ~$8.3 Billion (@$4.25 copper for remaining 9 months)
• Each 10¢/lb Change in Copper = $250 MM in 2011
Capital Expenditures: • $2.5 Billion
16
(1) Assumes average prices of $1,400/oz for gold and $15/lb for molybdenum in the remaining nine months of 2011.(2) Assumes prices of $1,400/oz gold, and $15/lb molybdenum in the remaining nine months of 2011; each $50/oz change in gold would have an approximate $50 MM impact,
and each $2.00/lb change in molybdenum would have an approximate $60 MM impact.
NOTE: Amounts are projections; see cautionary statement.
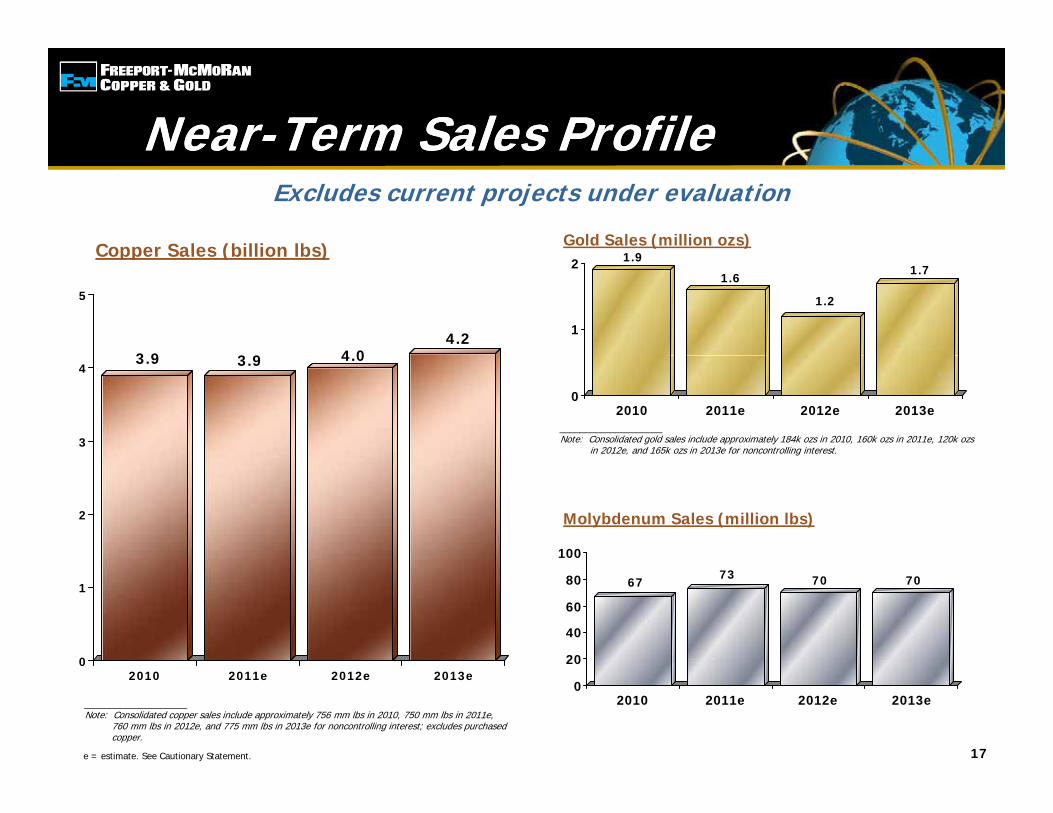
Near-Term Sales ProfileNear-Term Sales Profile
Copper Sales (billion lbs) Gold Sales (million ozs)
Near Term Sales ProfileNear Term Sales Profile
1 9
Excludes current projects under evaluation
Copper Sales (billion lbs)
3 9 3 9 4 04.2
5
1.9
1.6
1.2
1.7
1
2
____________________Note: Consolidated gold sales include approximately 184k ozs in 2010, 160k ozs in 2011e, 120k ozs
in 2012e, and 165k ozs in 2013e for noncontrolling interest.
3.9 3.9 4.0
3
4
02010 2011e 2012e 2013e
2
100
Molybdenum Sales (million lbs)
0
1 6773 70 70
20
40
60
80
17
____________________Note: Consolidated copper sales include approximately 756 mm lbs in 2010, 750 mm lbs in 2011e,
760 mm lbs in 2012e, and 775 mm lbs in 2013e for noncontrolling interest; excludes purchased copper.
02010 2011e 2012e 2013e
0
20
2010 2011e 2012e 2013e
e = estimate. See Cautionary Statement.

2011e Quarterly Payable Metal Sales2011e Quarterly Payable Metal Sales
Copper Sales (million lbs)
Q y yQ y y
Gold Sales (thousand ozs)
965
1,045
9651 000
1,250
480
365445
275400
600
800
____________________Note: Consolidated gold sales include approximately 47k ozs in 1Q11, 38k ozs in 2Q11e,
45k ozs in 3Q11e and 30k oz in 4Q11e for noncontrolling interest.
926 965 965
750
1,000
0
200
1Q11 2Q11e 3Q11e 4Q11e
Q Q g
500
2025
Molybdenum Sales (million lbs)
0
250
1Q11 2Q11e 3Q11e 4Q11e
2017 18 18
5
10
15
20
18
____________________Note: Consolidated copper sales include approximately 173 mm lbs in 1Q11, 185 mm lbs in 2Q11e,
200 mm lbs in 3Q11e and 192 mm lbs in 4Q11e for noncontrolling interest; excludes purchased copper.
01Q11 2Q11e 3Q11e 4Q11e
e = estimate. See Cautionary Statement.
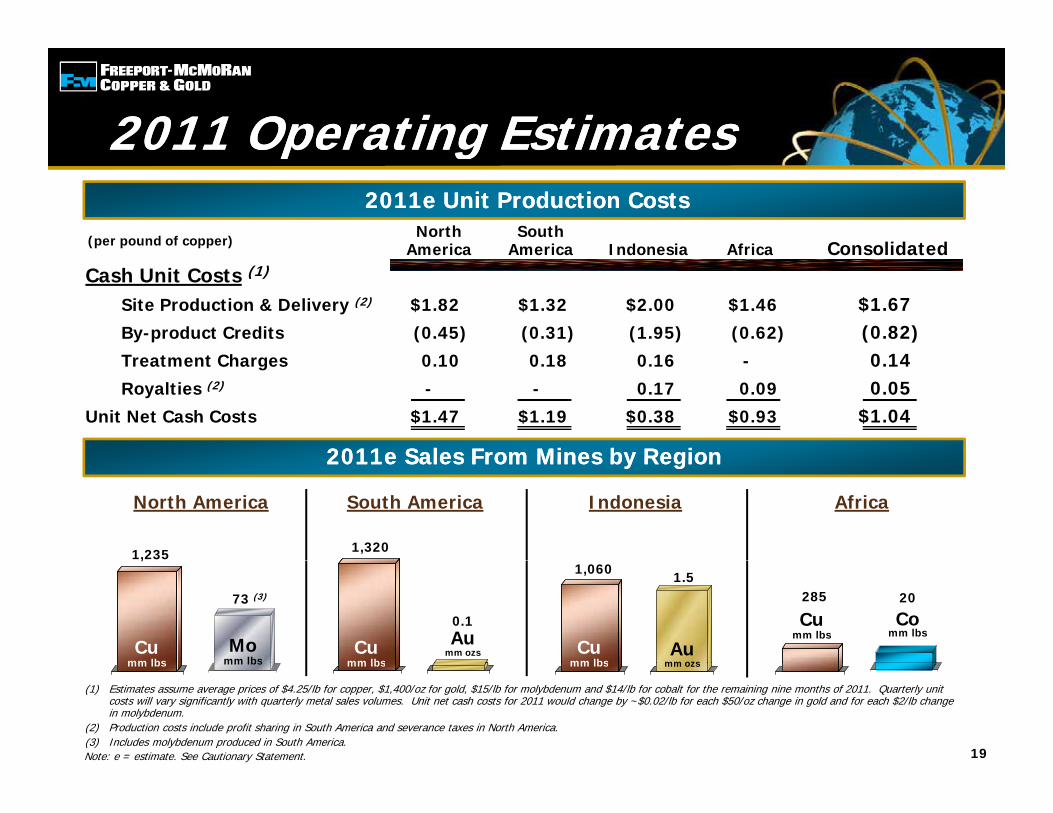
2011 Operating Estimates2011 Operating Estimatesp gp g
(per pound of copper)North South
America America Indonesia Africa Consolidated
2011e Unit Production Costs2011e Unit Production Costs
America America Indonesia Africa ConsolidatedCash Unit Costs (1)
Site Production & Delivery (2) $1.82 $1.32 $2.00 $1.46 $1.67By-product Credits (0.45) (0.31) (1.95) (0.62) (0.82)T t t Ch 0 10 0 18 0 16 0 14Treatment Charges 0.10 0.18 0.16 - 0.14Royalties (2) - - 0.17 0.09 0.05
Unit Net Cash Costs $1.47 $1.19 $0.38 $0.93 $1.04
2011e Sales From Mines by Region2011e Sales From Mines by Region2011e Sales From Mines by Region2011e Sales From Mines by Region
1,235
North America South America Indonesia
1,320
Africa
Cumm lbs
Momm lbs
,
73 (3)
Cumm lbs
Aumm ozs
0.1
Cumm lbs
Aumm ozs
1,060 1.5
Cumm lbs
Comm lbs
285 20
19
(1) Estimates assume average prices of $4.25/lb for copper, $1,400/oz for gold, $15/lb for molybdenum and $14/lb for cobalt for the remaining nine months of 2011. Quarterly unit costs will vary significantly with quarterly metal sales volumes. Unit net cash costs for 2011 would change by ~$0.02/lb for each $50/oz change in gold and for each $2/lb change in molybdenum.
(2) Production costs include profit sharing in South America and severance taxes in North America.(3) Includes molybdenum produced in South America.
1Q111 Q 1 1 1Q111Q11
mm lbs1Q11
mm lbs
1Q11
mm lbs
1Q11
mm lbs1 Q 1 1
mm ozs
Note: e = estimate. See Cautionary Statement.
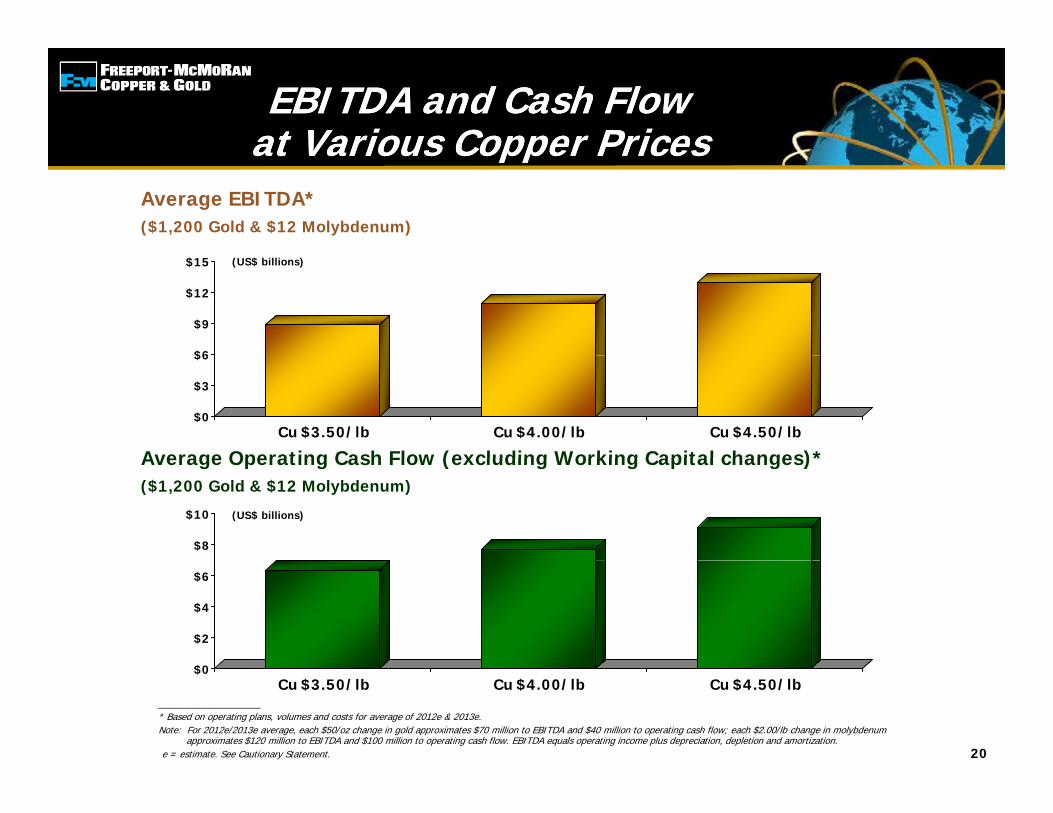
EBITDA and Cash Flow at Various Copper PricesEBITDA and Cash Flow
at Various Copper Pricesat Various Copper Pricesat Various Copper PricesAverage EBITDA* ($1,200 Gold & $12 Molybdenum)
(US$ billions)
$6
$9
$12
$15
Average Operating Cash Flow (excluding Working Capital changes)*
$0
$3
$6
Cu $3.50/lb Cu $4.00/lb Cu $4.50/lb
Average Operating Cash Flow (excluding Working Capital changes)*($1,200 Gold & $12 Molybdenum)
$8
$10 (US$ billions)
$2
$4
$6
20
$0Cu $3.50/lb Cu $4.00/lb Cu $4.50/lb
____________________* Based on operating plans, volumes and costs for average of 2012e & 2013e.Note: For 2012e/2013e average, each $50/oz change in gold approximates $70 million to EBITDA and $40 million to operating cash flow; each $2.00/lb change in molybdenum
approximates $120 million to EBITDA and $100 million to operating cash flow. EBITDA equals operating income plus depreciation, depletion and amortization.e = estimate. See Cautionary Statement.
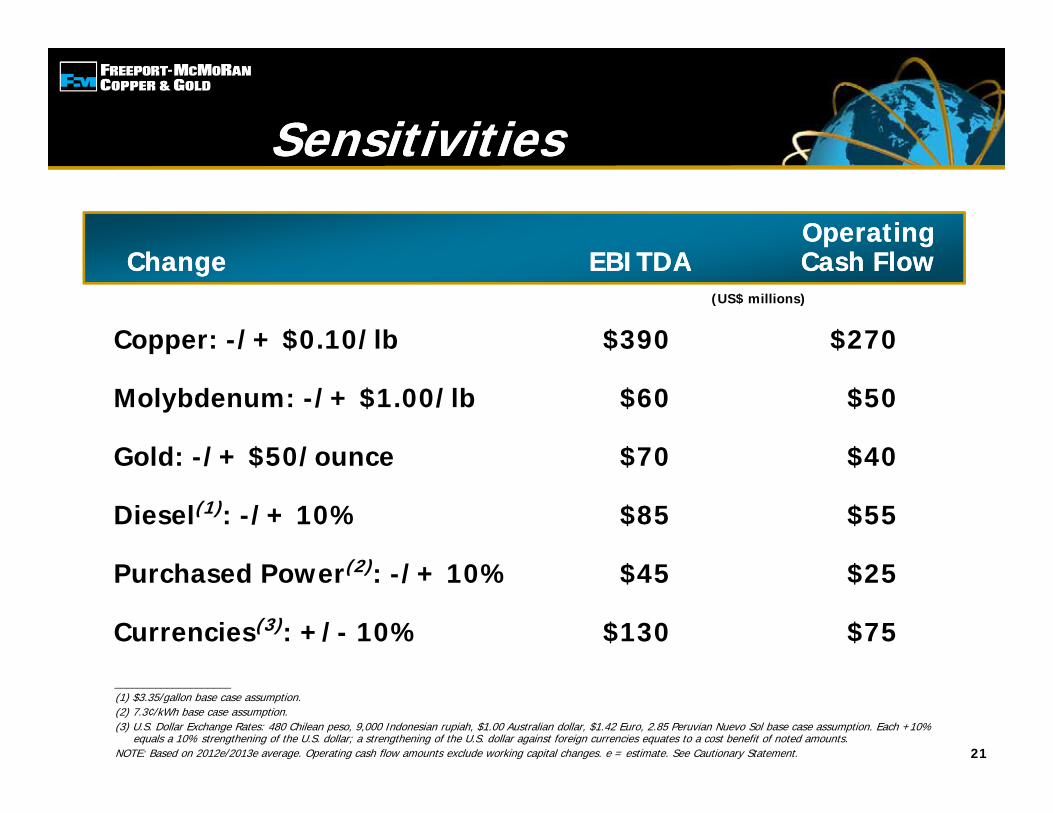
SensitivitiesSensitivitiesSensitivitiesSensitivities
OperatingCh EBITDA C h Fl
OperatingCh EBITDA C h FlChange EBITDA Cash FlowChange EBITDA Cash Flow
Copper: -/+ $0.10/lb $390 $270
(US$ millions)
Molybdenum: -/+ $1.00/lb $60 $50
Gold: -/+ $50/ounce $70 $40Gold: -/+ $50/ounce $70 $40
Diesel(1): -/+ 10% $85 $55
(2)Purchased Power(2): -/+ 10% $45 $25
Currencies(3): +/- 10% $130 $75
21
____________________(1) $3.35/gallon base case assumption.(2) 7.3¢/kWh base case assumption.(3) U.S. Dollar Exchange Rates: 480 Chilean peso, 9,000 Indonesian rupiah, $1.00 Australian dollar, $1.42 Euro, 2.85 Peruvian Nuevo Sol base case assumption. Each +10%
equals a 10% strengthening of the U.S. dollar; a strengthening of the U.S. dollar against foreign currencies equates to a cost benefit of noted amounts.NOTE: Based on 2012e/2013e average. Operating cash flow amounts exclude working capital changes. e = estimate. See Cautionary Statement.

Capital Expenditures (1)Capital Expenditures (1)
$3 0
Capital Expenditures Capital Expenditures (US$ billions)
All OtherMajor Projects
Excludes current projects under evaluation
$2.5
$3.0
$2.5
$2.1
1.2
1.2$1.5
$2.0
$1.4
0.7
1.3$0 5
$1.0(3)
(4)
0.7 0.9
$0.0
$0.5
2010 2011e 2012e
(4) (4)
(2)
22
(1) Capital expenditure estimates will continue to be reviewed and revised subject to market conditions.(2) Primarily includes El Abra sulfide, Grasberg underground development, Climax construction activities and Safford sulphur burner.(3) Primarily includes Grasberg underground development, Climax construction activities and El Abra sulfide.(4) Primarily includes Grasberg underground development.Note: Includes capitalized interest. Excludes capital expenditures for Projects Under Evaluation (slides 17 and 18).e= estimate. See Cautionary Statement.
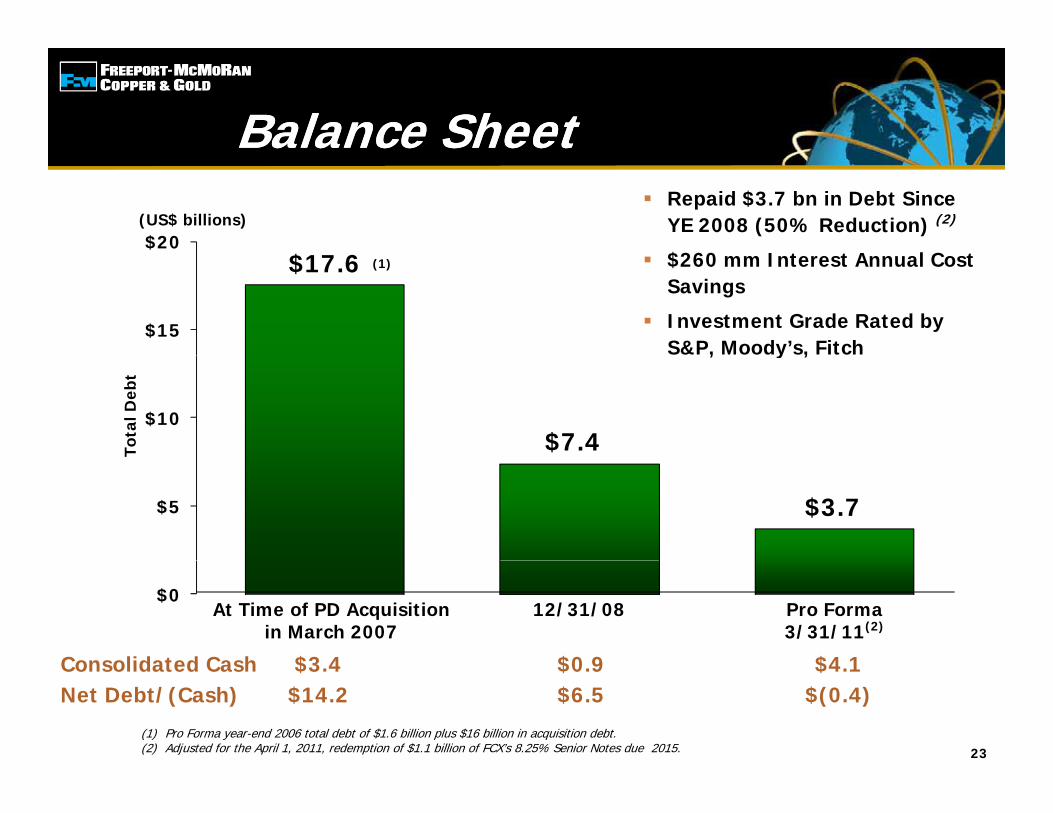
Balance SheetBalance Sheet
$20(US$ billions)
Repaid $3.7 bn in Debt Since YE 2008 (50% Reduction) (2)
$260 I t t A l C t$17.6
$15
(1) $260 mm Interest Annual Cost Savings
Investment Grade Rated by S&P, Moody’s, Fitch
$7.4 $10
Tota
l Deb
t
, y ,
$3.7$5
$0At Time of PD Acquisition
in March 2007Pro Forma3/31/11(2)
12/31/08
Consolidated Cash $3 4 $0 9 $4 1
23(1) Pro Forma year-end 2006 total debt of $1.6 billion plus $16 billion in acquisition debt.(2) Adjusted for the April 1, 2011, redemption of $1.1 billion of FCX’s 8.25% Senior Notes due 2015.
Consolidated Cash $3.4 $0.9 $4.1Net Debt/(Cash) $14.2 $6.5 $(0.4)

Financial PolicyFinancial Policy
Maintain Strong Balance Sheet & Liquidity Position
o yo y
Invest in Attractive Growth Projects
Opportunistic Debt Repayment
Current Common Stock Dividend Rate: $1.00/Share per Annum
Supplemental Dividend of $0.50/Share Paid June 1, 2011
• $0.50 (Post-split) Paid on December 30, 2010
24
Board to Review Financial Policy on an Ongoing Basis

FCX Investment SummaryFCX Investment SummaryFCX Investment SummaryFCX Investment Summary
World’s Premier Publicly Traded Copper Company World’s Premier Publicly Traded Copper Company
World’s Largest Molybdenum Producer & Significant Gold Producer World s Largest Molybdenum Producer & Significant Gold Producer
Long-lived Reserves, Geographically Diverse OperationsLong lived Reserves, Geographically Diverse Operations
Flexible Operating Structure Can Respond to Varying Market e b e Ope at g St uctu e Ca espo d to a y g a etConditions
25
Significant Reserve Growth