connectional basis for frequency representation in the ... · lateral lemniscus of the bat...
TRANSCRIPT
The Journal of Neuroscience October 1966, 6(10): 2926-2940
Connectional Basis for Frequency Representation in the Nuclei of the Lateral Lemniscus of the Bat Eptesicus fuscus
E. Covey* and J. H. Casseday*l”f
Departments of *Surgery (Otolaryngology) and *s-j-Psychology, Duke University, Durham, North Carolina 27710
To study the role of the lateral lemniscus as a link in the as- cending auditory pathway, injections of neuronal tracers were placed in the anteroventral cochlear nucleus (AVCN) and in the inferior colliculus of the bat Eptesicus fuscus. To correlate the anatomical results with tonotopic organization, the character- istic frequency of cells at each injection site was determined electrophysiologically. Pathways from AVCN diverge to 3 ma- jor targets in the lateral lemniscus, the intermediate nucleus and 2 divisions of the ventral nucleus (VNLL). Projections from these 3 nuclei then converge at the inferior colliculus. One cell group is particularly notable for its cytoarchitectural appearance. It is referred to here as the columnar area of VNLL because its cells are organized as a tightly packed matrix of columns and rows. The connections of the columnar area are organized in sheets that are precisely related to the tonotopic organization of both AVCN and the inferior colliculus. Sheets of cells in the dorsal part of the columnar area receive projections from low-frequen- cy parts of AVCN and project to low-frequency parts of the inferior colliculus. These sheets of connections occupy succes- sively more ventral locations as the tonotopic focus of the injec- tion site increases in frequency. The entire range of frequencies audible to the bat is systematically represented along the dor- sal-ventral dimension of the columnar area. Because each col- umn is only 20-30 cells in height, frequency representation must be compressed in this dimension. Within the columnar area there is an overrepresentation of frequencies between 25 and 50 kHz, which corresponds roughly to the range of the FM echo- location call in Eptesicus. The connections of the other nuclei of the lateral lemniscus are not as precisely related to the ton- otopic organization of the system as are those of the columnar area.
A number of distinct auditory pathways ascend to the inferior colliculus. Some of these arise directly from the different divi- sions of the cochlear nucleus, whereas others take an indirect route via synapses in the nuclei of the superior olivary complex or nuclei of the lateral lemniscus. Previous reports from this laboratory have shown that in the mustache bat, Pteronotus, the ventral and intermediate nuclei of the lateral lemniscus are hy- pertrophied and have an elegance of organization not matched in the lateral lemniscus of other mammals. The intermediate nucleus is more highly differentiated than it is in the cat (see Glendenning et al., 198 1; Zook and Casseday, 1982a), and the ventral nucleus is clearly divided into 2 parts, one of which has a columnar arrangement of its cells and the other of which does not. The pattern of afferent and efferent connections matches
Received Dec. 17, 1985; revised Apr. 14, 1986; accepted Apr. 17, 1986. I This work was supported by NIH Grant NS 2 1748 and NSF Grant BNS 82-
17357. We thank Cindy Biles for technical assistance. Correspondence should be addressed to Dr. E. Covey, Department of Surgery,
Box 3943, Duke University Medical Center, Durham, NC 27710.
Copyright 0 1986 Society for Neuroscience 0270-6474/86/102926-15$02.00/O
these cytoarchitectural distinctions. The intermediate and ven- tral nuclei of the lateral lemniscus receive their major input from the contralateral cochlear nucleus and project to the ip- silateral inferior colliculus (Zook and Casseday, 1982b, 1985). These connections provide a “monaural” pathway to the infe- rior colliculus in Pteronotus and are more likely involved in frequency or temporal analysis than in binaural analysis (Casse- day and Covey, 1986; Zook and Casseday, 1985).
In this report we examine the indirect pathways via the in- termediate and ventral nuclei of the lateral lemniscus of Eptes- icus fiscus. Because the echolocation cries of Eptesicus and Pteronotus differ greatly in some respects but are similar in that they both contain an FM component, we were curious as to what similarities or differences might be found in the brain-stem auditory structures of these 2 species. In examining the brain stem of Eptesicus a striking similarity was immediately obvious in the organization of the nuclei of the lateral lemniscus in these 2 species of bats.
For this reason we decided to examine these structures in more detail, using a combination of anatomical and physiolog- ical techniques, and we report here the connectional basis for frequency organization in the nuclei of the lateral lemniscus. We conducted 2 types of experiments: (1) anterograde transport from the anteroventral cochlear nucleus to the lateral lemniscus, and (2) retrograde transport from the inferior colliculus. In both types of experiments we determined by electrophysiological methods the sound frequency to which cells at the center of the injection site responded best. In this way we were able to match the pattern of labeling in the nuclei of the lateral lemniscus with the tonotopic organization of the source of the afferent projec- tions and the target of the efferent projections. We shall describe evidence to show that the division of the lateral lemniscus that has the most orderly cytoarchitectural features, the columnar area, also has the most precise relationship with the tonotopic organization of the anteroventral cochlear nucleus and the in- ferior colliculus.
Materials and Methods Twenty-seven adult big brown bats, E. fuscus, obtained from the attics of local houses, were used in this study. Wheat germ agglutinin con- jugated to HRP (WGA-HRP) was injected in the anteroventral cochlear nucleus (AVCN) of 7 bats, and WGA-HRP or HRP was injected in the inferior colliculus of 20 bats. The HRP was obtained from Sigma (type VI) and the WGA-HRP from Sigma or from Dr. R. G. Carey, Barrow Neurobiological Institute.
The animals were anesthetized for surgery with methoxyfluorane (Me- tofane) and maintained in a lightly anesthetized state during electro- physiological recording and injection of neuronal tracer substances. The inferior colliculus was exposed by removal of a small portion of the overlying skull; to expose the cochlear nucleus it was necessary to re- move part of the lateral lobe of the cerebellum. The bat’s head was immobilized by clamping its upper jaw in a bite bar.
To determine the tonotopic organization in and around the injection site, we recorded the response of single neurons or multiunit clusters to pure-tone stimuli. The stimuli were tone pulses, 10 msec in duration,
The Journal of Neuroscience Connections of Lateral Lemniscus in the Bat
INLL
so
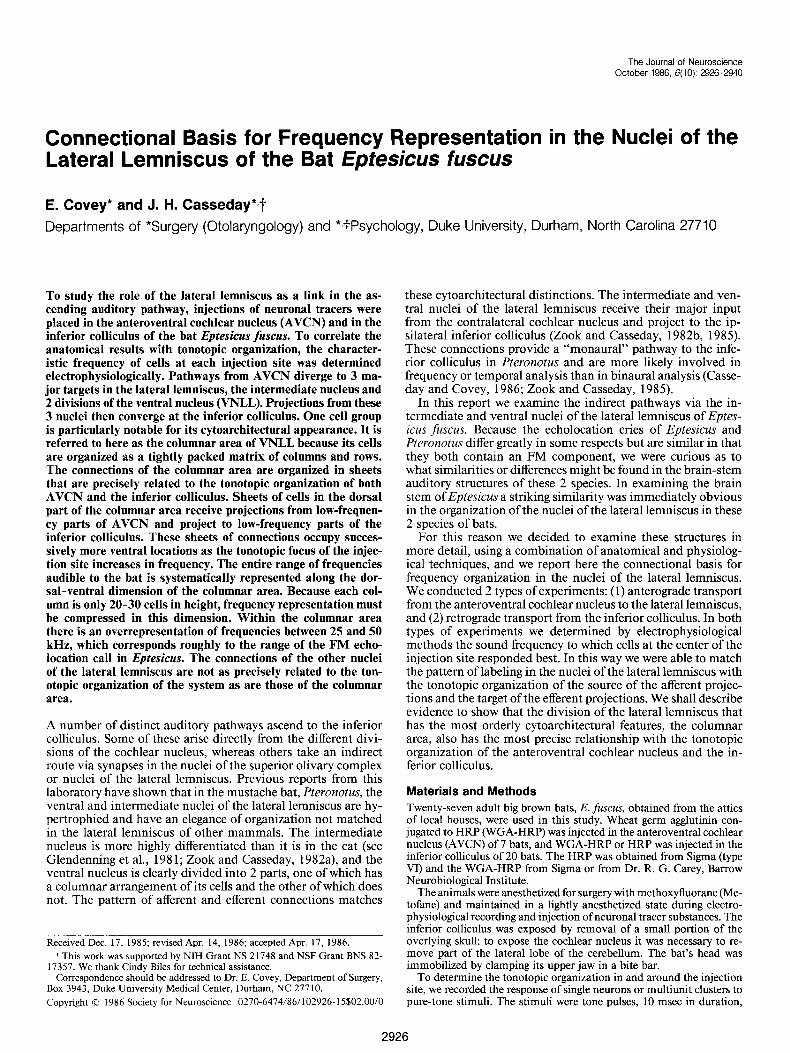
Figure I. Camera lucida drawing showing the cytoarchitecture of the nuclei of the lateral lemniscus in Eptesicus. Columnar area (Vc) is easily identified by its small and densely packed cells and by the beaded or columnar arrangement of the cells along the length of the ascending fibers. Drawn in the frontal plane from a 40 pm frozen section stained with cresyl violet. Calibration bar, 100 pm.
with a 1 msec rise-fall time. The tone pulses were presented in a free field, using Polaroid transducers.
In all cases neural activity was recorded with the electrode used to inject HRP or WGA-HRP. In some cases we used electrodes filled with NaCl or KC1 to map the tonotopic organization adjacent to the site at which we later injected the neural tracer. The electrode was advanced with a hydraulic microdrive. Whenever a single unit was encountered, we determined its characteristic frequency (CF) by manually controlling the oscillator and attenuator and observing the neural response on the oscilloscope and loudspeaker. Otherwise we examined the response to tones at steps of 50 pm and were usually able to determine best frequency at every step by tuning the combined response of several cells.
For injections, micropipettes with tip diameters of l-10 pm were filled with a 10% solution of HRP or a 5% solution of WGA-HRP in 0.85% saline. Upon reaching an area containing units with the desired CF, the tracer was injected electrophoretically by applying pulses of positive current (0.5-2.0 pA),7 set on and 7 set off, for periods ranging from 7 to 20 min. In several cases the electrode was withdrawn gradually during the injection so as to produce a cylindrical shaped injection spanning a known tonotopic range.
The animals were perfused after a survival period of 24 hr. Those with HRP injections were perfused with PBS followed by a solution of 4% glutaraldehyde in phosphate buffer (0.1 M). Animals with WGA- HRP injections were perfused with PBS followed by 8% formalin and 2% sucrose in phosphate buffer, followed by 10% sucrose in phosphate buffer. All brains were refrigerated overnight in a solution of 30% sucrose in phosphate buffer. The brains were sectioned at 40 pm on a freezing microtome, and in most cases the sections were divided into 3 sets. Two of these sets were processed with tetramethyl benzidine (TMB) according to the method of Mesulam (1978). In most cases, a set was left unstained to allow optimum visualization of anterograde transport; another set was stained with neutral red in order to examine cytoar- chitecture. The third set was reacted with diaminobenzidine (DAB, LaVail and LaVail, 1972) to help define the injection site and stained with cresyl violet for cytoarchitectural analysis. Sections were examined microscopically, and the location of labeled cells or labeled fibers was
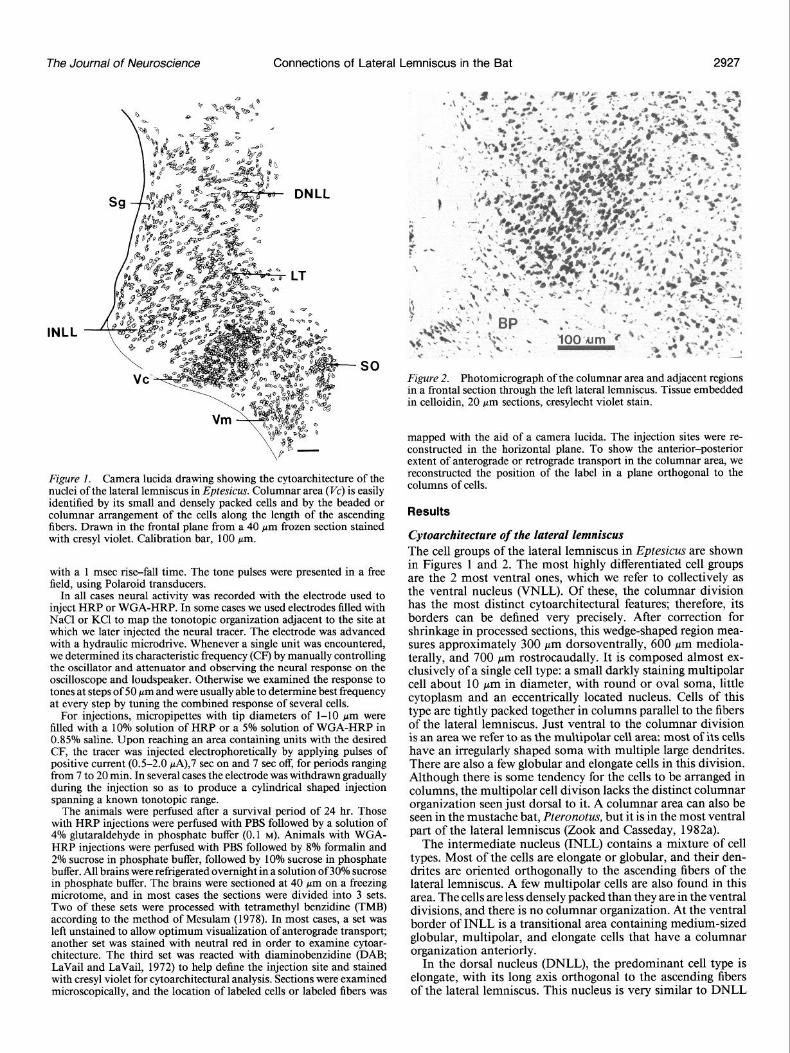
Figure 2. Photomicrograph of the columnar area and adjacent regions in a frontal section through the left lateral lemniscus. Tissue embedded in celloidin, 20 Mm sections, cresylecht violet stain.
mapped with the aid of a camera lucida. The injection sites were re- constructed in the horizontal plane. To show the anterior-posterior extent of anterograde or retrograde transport in the columnar area, we reconstructed the position of the label in a plane orthogonal to the columns of cells.
Results
Cytoarchifecture of the lateral lemniscus The cell groups of the lateral lemniscus in Eptesicus are shown in Figures 1 and 2. The most highly differentiated cell groups are the 2 most ventral ones, which we refer to collectively as the ventral nucleus (WILL). Of these, the columnar division has the most distinct cytoarchitectural features; therefore, its borders can be defined very precisely. After correction for shrinkage in processed sections, this wedge-shaped region mea- sures approximately 300 pm dorsoventrally, 600 pm mediola- terally, and 700 pm rostrocaudally. It is composed almost ex- clusively of a single cell type: a small darkly staining multipolar cell about 10 pm in diameter, with round or oval soma, little cytoplasm and an eccentrically located nucleus. Cells of this type are tightly packed together in columns parallel to the fibers of the lateral lemniscus. Just ventral to the columnar division is an area we refer to as the multipolar cell area: most of its cells have an irregularly shaped soma with multiple large dendrites. There are also a few globular and elongate cells in this division. Although there is some tendency for the cells to be arranged in columns, the multipolar cell divison lacks the distinct columnar organization seen just dorsal to it. A columnar area can also be seen in the mustache bat, Pteronotus, but it is in the most ventral part of the lateral lemniscus (Zook and Casseday, 1982a).
The intermediate nucleus (INLL) contains a mixture of cell types. Most of the cells are elongate or globular, and their den- drites are oriented orthogonally to the ascending fibers of the lateral lemniscus. A few multipolar cells are also found in this area. The cells are less densely packed than they are in the ventral divisions, and there is no columnar organization. At the ventral border of INLL is a transitional area containing medium-sized globular, multipolar, and elongate cells that have a columnar organization anteriorly.
In the dorsal nucleus (DNLL), the predominant cell type is elongate, with its long axis orthogonal to the ascending fibers of the lateral lemniscus. This nucleus is very similar to DNLL
2928 Covey and Casseday Vol. 6, No. 10, Oct. 1986
963
39 kHz
-BIG
MtiiB
A I
BIC
PY
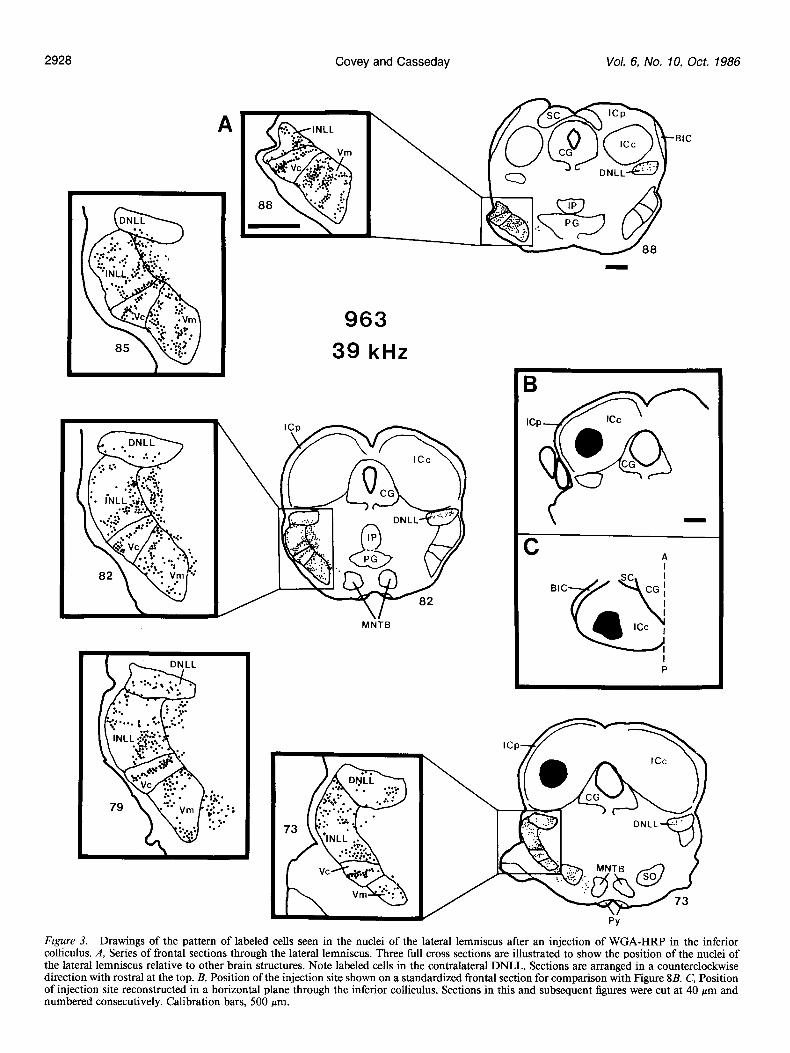
Figure 3. Drawings of the pattern of labeled cells seen in the nuclei of the lateral lemniscus after an injection of WGA-HRP in the inferior colliculus. A, Series of frontal sections through the lateral lemniscus. Three full cross sections are illustrated to show the position of the nuclei of the lateral lemniscus relative to other brain structures. Note labeled cells in the contralateral DNLL. Sections are arranged in a counterclockwise direction with rostra1 at the top. B, Position of the injection site shown on a standardized frontal section for comparison with Figure 8B. C, Position of injection site reconstructed in a horizontal plane through the inferior colliculus. Sections in this and subsequent figures were cut at 40 pm and numbered consecutively. Calibration bars, 500 pm.
The Journal of Neuroscience Connections of Lateral Lemniscus in the Bat 2929
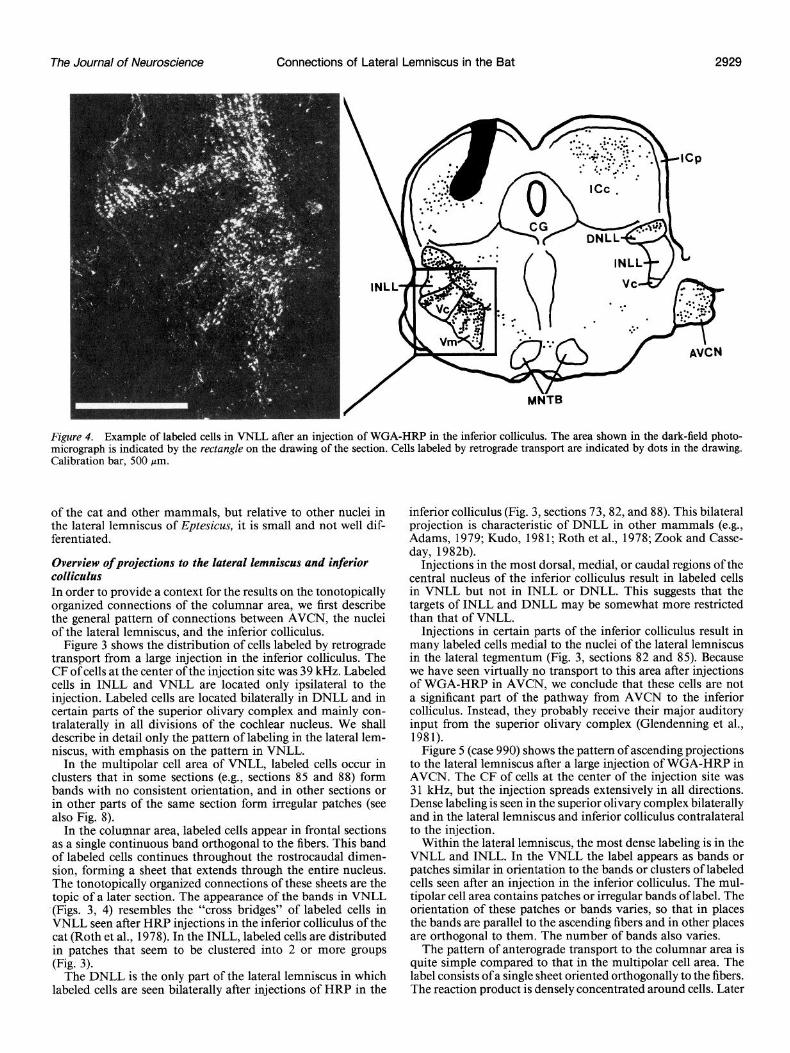
Figure 4. Example of labeled cells in VNLL after an injection of WGA-HRP in the inferior colliculus. The area shown in the dark-field photo- micrograph is indicated by the rectangle on the drawing of the section. Cells labeled by retrograde transport are indicated by dots in the drawing. Calibration bar, 500 pm.
of the cat and other mammals, but relative to other nuclei in the lateral lemniscus of Eptesicus, it is small and not well dif- ferentiated.
Overview of projections to the lateral lemniscus and inferior colliculus In order to provide a context for the results on the tonotopically organized connections of the columnar area, we first describe the general pattern of connections between AVCN, the nuclei of the lateral lemniscus, and the inferior colliculus.
Figure 3 shows the distribution of cells labeled by retrograde transport from a large injection in the inferior colliculus. The CF of cells at the center of the injection site was 39 kHz. Labeled cells in INLL and VNLL are located only ipsilateral to the injection. Labeled cells are located bilaterally in DNLL and in certain parts of the superior olivary complex and mainly con- tralaterally in all divisions of the cochlear nucleus. We shall describe in detail only the pattern of labeling in the lateral lem- niscus, with emphasis on the pattern in VNLL.
In the multipolar cell area of VNLL, labeled cells occur in clusters that in some sections (e.g., sections 85 and 88) form bands with no consistent orientation, and in other sections or in other parts of the same section form irregular patches (see also Fig. 8).
In the columnar area, labeled cells appear in frontal sections as a single continuous band orthogonal to the fibers. This band of labeled cells continues throughout the rostrocaudal dimen- sion, forming a sheet that extends through the entire nucleus. The tonotopically organized connections of these sheets are the topic of a later section. The appearance of the bands in VNLL (Figs. 3, 4) resembles the “cross bridges” of labeled cells in VNLL seen after HRP injections in the inferior colliculus of the cat (Roth et al., 1978). In the INLL, labeled cells are distributed in patches that seem to be clustered into 2 or more groups (Fig. 3).
The DNLL is the only part of the lateral lemniscus in which labeled cells are seen bilaterally after injections of HRP in the
inferior colliculus (Fig. 3, sections 73,82, and 88). This bilateral projection is characteristic of DNLL in other mammals (e.g., Adams, 1979; Kudo, 1981; Roth et al., 1978; Zook and Casse- day, 1982b).
Injections in the most dorsal, medial, or caudal regions of the central nucleus of the inferior colliculus result in labeled cells in VNLL but not in INLL or DNLL. This suggests that the targets of INLL and DNLL may be somewhat more restricted than that of VNLL.
Injections in certain parts of the inferior colliculus result in many labeled cells medial to the nuclei of the lateral lemniscus in the lateral tegmentum (Fig. 3, sections 82 and 85). Because we have seen virtually no transport to this area after injections of WGA-HRP in AVCN, we conclude that these cells are not a significant part of the pathway from AVCN to the inferior colliculus. Instead, they probably receive their major auditory input from the superior olivary complex (Glendenning et al., 1981).
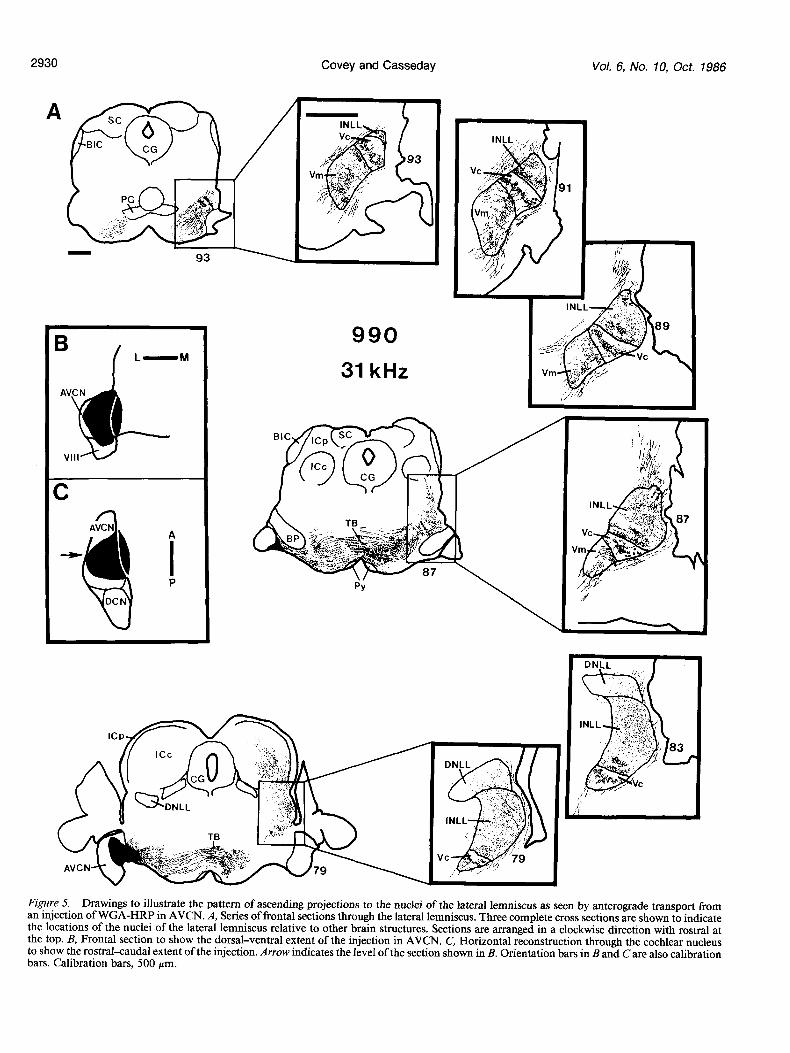
Figure 5 (case 990) shows the pattern of ascending projections to the lateral lemniscus after a large injection of WGA-HRP in AVCN. The CF of cells at the center of the injection site was 3 1 kHz, but the injection spreads extensively in all directions. Dense labeling is seen in the superior olivary complex bilaterally and in the lateral lemniscus and inferior colliculus contralateral to the injection.
Within the lateral lemniscus, the most dense labeling is in the VNLL and INLL. In the VNLL the label appears as bands or patches similar in orientation to the bands or clusters of labeled cells seen after an injection in the inferior colliculus. The mul- tipolar cell area contains patches or irregular bands of label. The orientation of these patches or bands varies, so that in places the bands are parallel to the ascending fibers and in other places are orthogonal to them. The number of bands also varies.
The pattern of anterograde transport to the columnar area is quite simple compared to that in the multipolar cell area. The label consists of a single sheet oriented orthogonally to the fibers. The reaction product is densely concentrated around cells. Later
Covey and Casseday Vol. 6, No. 10, Oct. 1986
A
I P
990
31 kHz
Figure 5. Drawings to illustrate the pattern of ascending projections to the nuclei of the lateral lemniscus as seen by anterograde transport from an injection of WGA-HRP in AVCN. A, Series of frontal sections through the lateral lemniscus. Three complete cross sections are shown to indicate the locations of the nuclei of the lateral lemniscus relative to other brain structures. Sections are arranged in a clockwise direction with rostra1 at the top. B, Frontal section to show the dorsal-ventral extent of the injection in AVCN. C, Horizontal reconstruction through the cochlear nucleus to show the rostrakaudal extent of the injection. Arrow indicates the level of the section shown in B. Orientation bars in Band Care also calibration bars. Calibration bars, 500 pm.
The Journal of Neuroscience Connections of Lateral Lemniscus in the Bat 2931
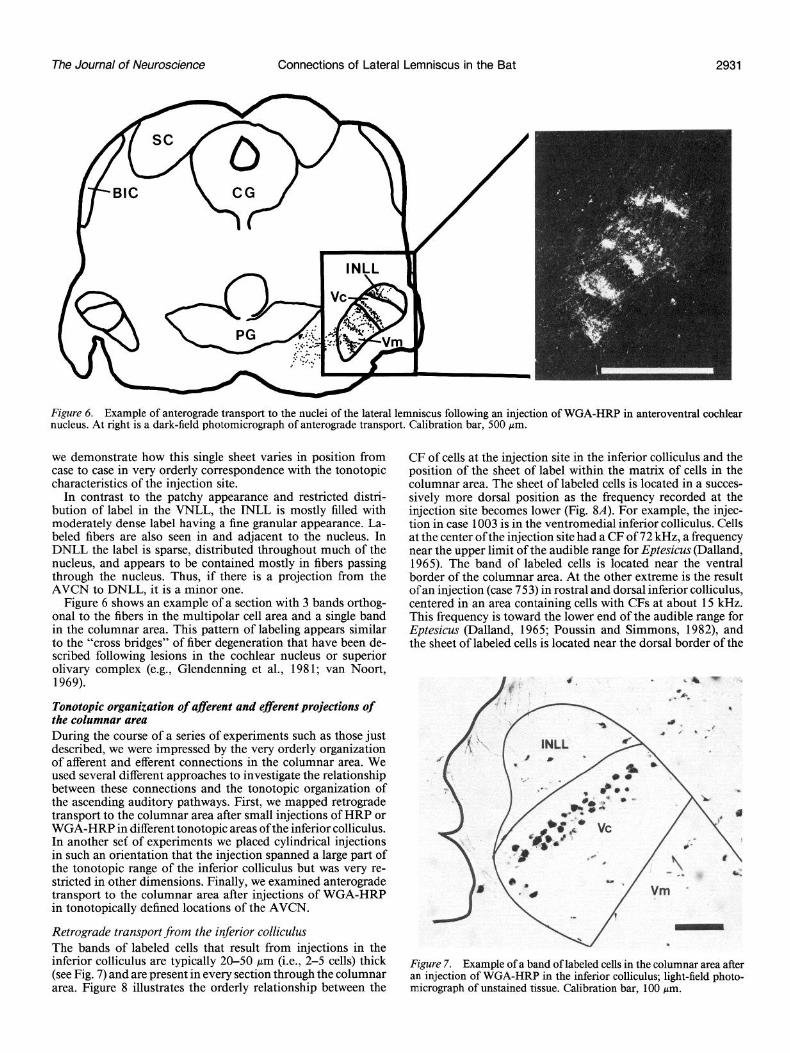
Figure 6. Example of anterograde transport to the nuclei of the lateral lemniscus following an injection of WGA-HRP in anteroventral cochlear nucleus. At right is a dark-field photomicrograph of anterograde transport. Calibration bar, 500 pm.
we demonstrate how this single sheet varies in position from case to case in very orderly correspondence with the tonotopic characteristics of the injection site.
In contrast to the patchy appearance and restricted distri- bution of label in the VNLL, the INLL is mostly filled with moderately dense label having a fine granular appearance. La- beled fibers are also seen in and adjacent to the nucleus. In DNLL the label is sparse, distributed throughout much of the nucleus, and appears to be contained mostly in fibers passing through the nucleus. Thus, if there is a projection from the AVCN to DNLL, it is a minor one.
Figure 6 shows an example of a section with 3 bands orthog- onal to the fibers in the multipolar cell area and a single band in the columnar area. This pattern of labeling appears similar to the “cross bridges” of fiber degeneration that have been de- scribed following lesions in the cochlear nucleus or superior olivary complex (e.g., Glendenning et al., 198 1; van Noort, 1969).
Tonotopic organization of afferent and e&rent projections of the columnar area During the course of a series of experiments such as those just described, we were impressed by the very orderly organization of afferent and efferent connections in the columnar area. We used several different approaches to investigate the relationship between these connections and the tonotopic organization of the ascending auditory pathways. First, we mapped retrograde transport to the columnar area after small injections of HRP or WGA-HRP in different tonotopic areas of the inferior colliculus. In another sef of experiments we placed cylindrical injections in such an orientation that the injection spanned a large part of the tonotopic range of the inferior colliculus but was very re- stricted in other dimensions. Finally, we examined anterograde transport to the columnar area after injections of WGA-HRP in tonotopically defined locations of the AVCN.
Retrograde transport from the inferior colliculus The bands of labeled cells that result from injections in the inferior colliculus are typically 20-50 pm (i.e., 2-5 cells) thick (see Fig. 7) and are present in every section through the columnar area. Figure 8 illustrates the orderly relationship between the
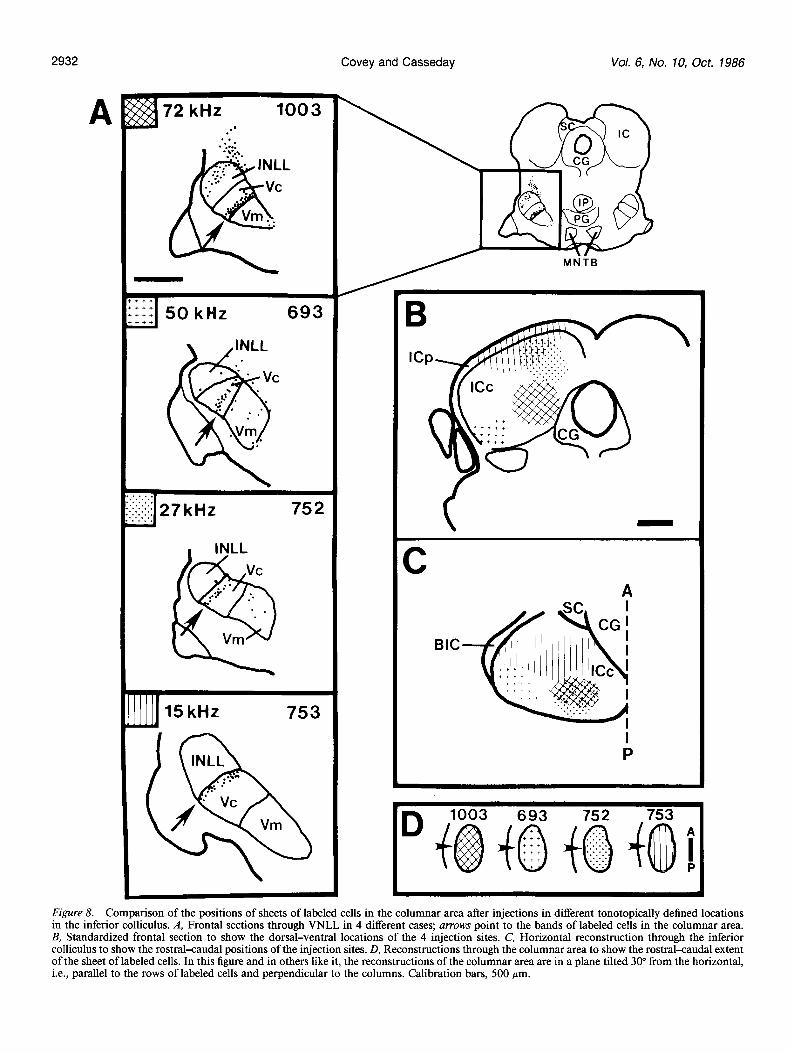
CF of cells at the injection site in the inferior colliculus and the position of the sheet of label within the matrix of cells in the columnar area. The sheet of labeled cells is located in a succes- sively more dorsal position as the frequency recorded at the injection site becomes lower (Fig. 84. For example, the injec- tion in case 1003 is in the ventromedial inferior colliculus. Cells at the center of the injection site had a CF of 72 kHz, a frequency near the upper limit of the audible range for Eptesicus (Dalland, 1965). The band of labeled cells is located near the ventral border of the columnar area. At the other extreme is the result of an injection (case 753) in rostra1 and dorsal inferior colliculus, centered in an area containing cells with CFs at about 15 kHz. This frequency is toward the lower end of the audible range for Eptesicus (Dalland, 1965; Poussin and Simmons, 1982), and the sheet of labeled cells is located near the dorsal border of the
Figure 7. Example of a band of labeled cells in the columnar area after an injection of WGA-HRP in the inferior colliculus; light-field photo- micrograph of unstained tissue. Calibration bar, 100 pm.
Covey and Casseday Vol. 6, No. 10, Oct. 1986
72 kHz 1003 .* .
693
752
MNTB
BIC
Figure 8. Comparison of the positions of sheets of labeled cells in the columnar area after injections in different tonotopically defined locations in the inferior colliculus. A, Frontal sections through VNLL in 4 different cases; arrows point to the bands of labeled cells in the columnar area. B, Standardized frontal section to show the dorsal-ventral locations of the 4 injection sites. C, Horizontal reconstruction through the inferior colliculus to show the rostralxaudal positions of the injection sites. D, Reconstructions through the columnar area to show the rostral-caudal extent of the sheet of labeled cells. In this figure and in others like it, the reconstructions of the columnar area are in a plane tilted 30” from the horizontal, i.e., parallel to the rows of labeled cells and perpendicular to the columns. Calibration bars, 500 pm.
The Journal of Neuroscience Connections of Lateral Lemniscus in the Bat
&WI iii 25-37kHz 964
C A I
BIC
D 956 964 A I P
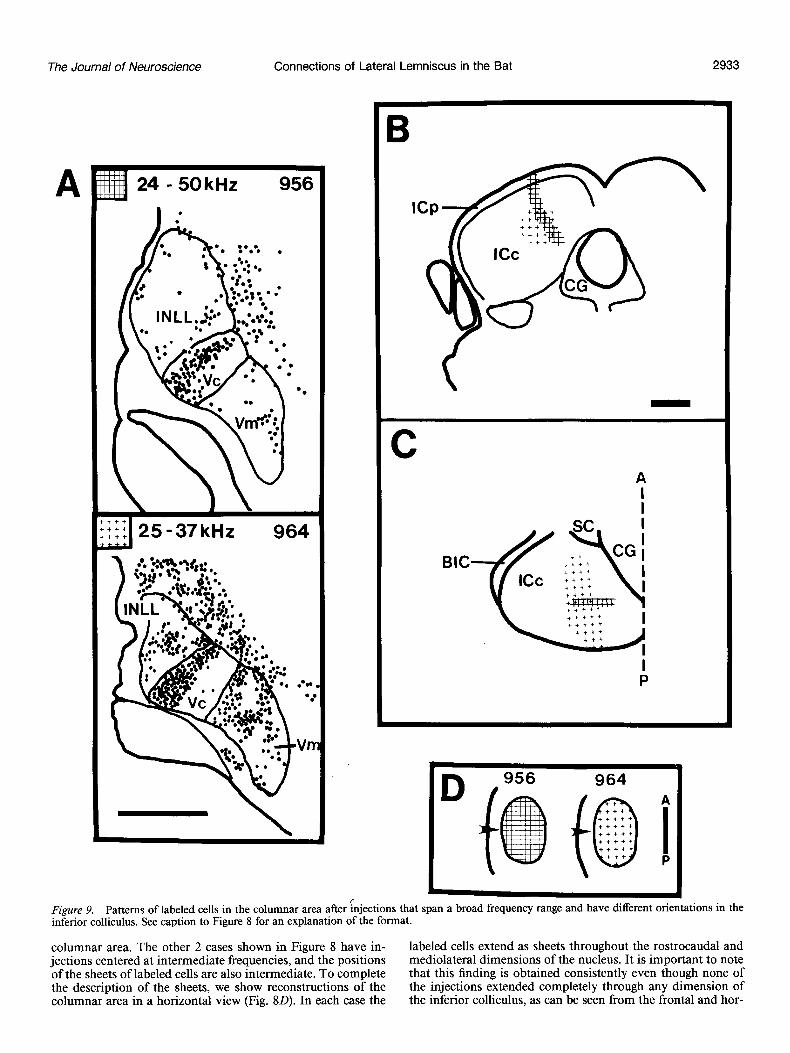
Figure 9. Patterns of labeled cells in the columnar area after injections that span a broad frequency range and have different orientations in the inferior colliculus. See caption to Figure 8 for an explanation of the format.
columnar area. The other 2 cases shown in Figure 8 have in- jections centered at intermediate frequencies, and the positions of the sheets of labeled cells are also intermediate. To complete the description of the sheets, we show reconstructions of the columnar area in a horizontal view (Fig. 8D). In each case the
labeled cells extend as sheets throughout the rostrocaudal and mediolateral dimensions of the nucleus. It is important to note that this finding is obtained consistently even though none of the injections extended completely through any dimension of the inferior colliculus, as can be seen from the frontal and hor-
Covey and Casseday Vol. 6, No. 10, Oct. 1986
/CP
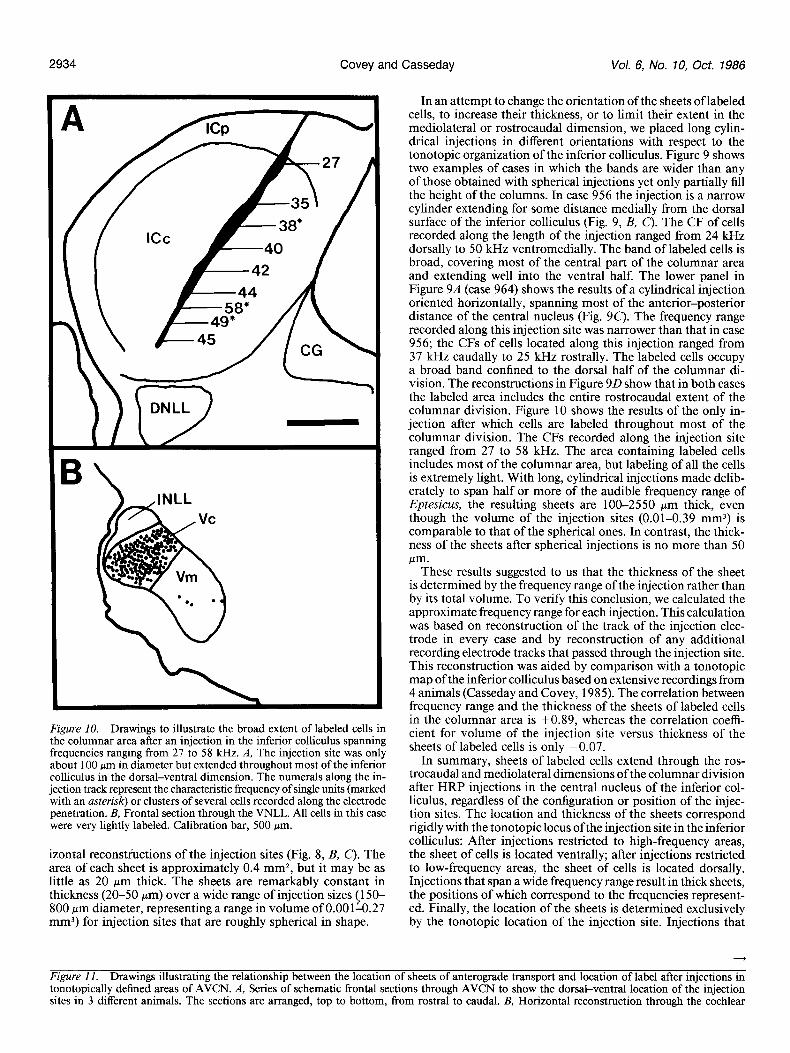
Figure 10. Drawings to illustrate the broad extent of labeled cells in the columnar area after an injection in the inferior colliculus spanning frequencies ranging from 27 to 58 kHz. A, The injection site was only about 100 pm in diameter but extended throughout most of the inferior colliculus in the dorsal-ventral dimension. The numerals along the in- jection track represent the characteristic frequency of single units (marked with an asterisk) or clusters of several cells recorded along the electrode penetration. B, Frontal section through the VNLL. All cells in this case were very lightly labeled. Calibration bar, 500 pm.
izontal reconstructions of the injection sites (Fig. 8, B, C). The area of each sheet is approximately 0.4 mm*, but it may be as little as 20 pm thick. The sheets are remarkably constant in thickness (20-50 pm) over a wide range of injection sizes (150- 800 Km diameter, representing a range in volume of O.OOlti.27 mm3) for injection sites that are roughly spherical in shape.
In an attempt to change the orientation of the sheets of labeled cells, to increase their thickness, or to limit their extent in the mediolateral or rostrocaudal dimension, we placed long cylin- drical injections in different orientations with respect to the tonotopic organization of the inferior colliculus. Figure 9 shows two examples of cases in which the bands are wider than any of those obtained with spherical injections yet only partially fill the height of the columns. In case 956 the injection is a narrow cylinder extending for some distance medially from the dorsal surface of the inferior colliculus (Fig. 9, B, C). The CF of cells recorded along the length of the injection ranged from 24 kHz dorsally to 50 kHz ventromedially. The band of labeled cells is broad, covering most of the central part of the columnar area and extending well into the ventral half. The lower panel in Figure 9A (case 964) shows the results of a cylindrical injection oriented horizontally, spanning most of the anterior-posterior distance of the central nucleus (Fig. 90. The frequency range recorded along this injection site was narrower than that in case 956; the CFs of cells located along this injection ranged from 37 kHz caudally to 25 kHz rostrally. The labeled cells occupy a broad band confined to the dorsal half of the columnar di- vision. The reconstructions in Figure 9D show that in both cases the labeled area includes the entire rostrocaudal extent of the columnar division. Figure 10 shows the results of the only in- jection after which cells are labeled throughout most of the columnar division. The CFs recorded along the injection site ranged from 27 to 58 kHz. The area containing labeled cells includes most of the columnar area, but labeling of all the cells is extremely light. With long, cylindrical injections made delib- erately to span half or more of the audible frequency range of Eptesicus, the resulting sheets are loo-2550 pm thick, even though the volume of the injection sites (0.01-0.39 mm3) is comparable to that of the spherical ones. In contrast, the thick- ness of the sheets after spherical injections is no more than 50 pm.
These results suggested to us that the thickness of the sheet is determined by the frequency range of the injection rather than by its total volume. To verify this conclusion, we calculated the approximate frequency range for each injection. This calculation was based on reconstruction of the track of the injection elec- trode in every case and by reconstruction of any additional recording electrode tracks that passed through the injection site. This reconstruction was aided by comparison with a tonotopic map ofthe inferior colliculus based on extensive recordings from 4 animals (Casseday and Covey, 1985). The correlation between frequency range and the thickness of the sheets of labeled cells in the columnar area is +0.89, whereas the correlation coeffi- cient for volume of the injection site versus thickness of the sheets of labeled cells is only -0.07.
In summary, sheets of labeled cells extend through the ros- trocaudal and mediolateral dimensions of the columnar division after HRP injections in the central nucleus of the inferior col- liculus, regardless of the configuration or position of the injec- tion sites. The location and thickness of the sheets correspond rigidly with the tonotopic locus ofthe injection site in the inferior colliculus: After injections restricted to high-frequency areas, the sheet of cells is located ventrally; after injections restricted to low-frequency areas, the sheet of cells is located dorsally. Injections that span a wide frequency range result in thick sheets, the positions of which correspond to the frequencies represent- ed. Finally, the location of the sheets is determined exclusively by the tonotopic location of the injection site. Injections that
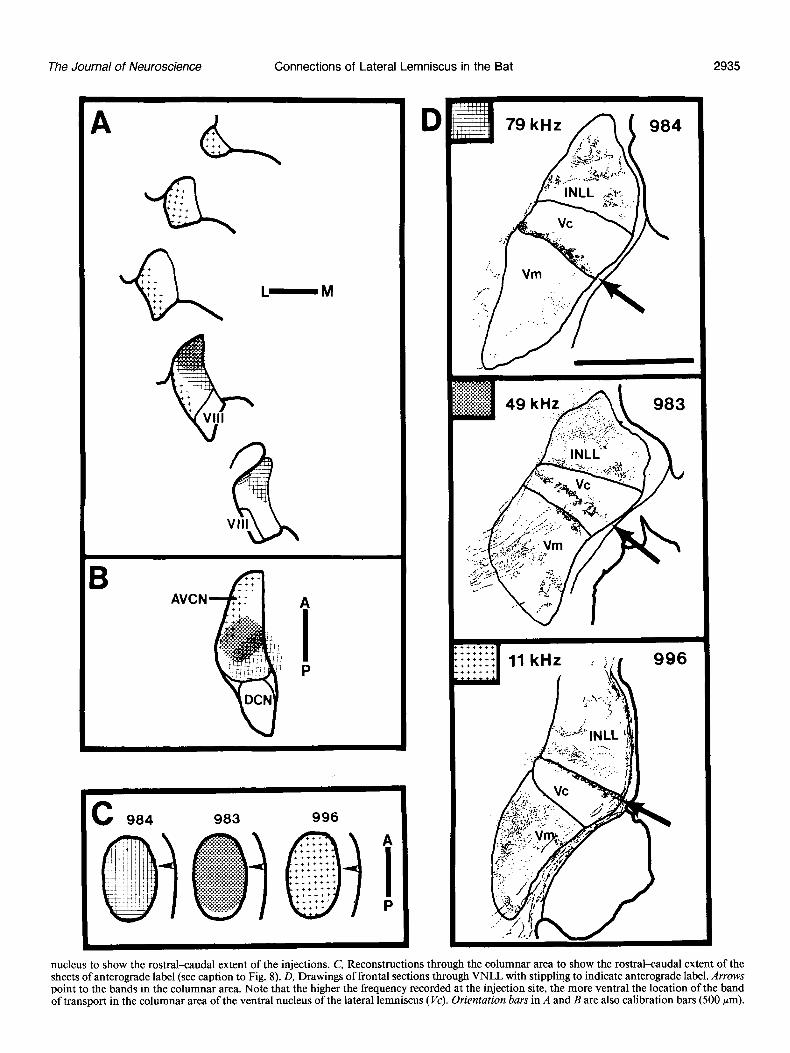
Figure I I. Drawings illustrating the relationship between the location of sheets of anterograde transport and location of label after injections in tonotopically defined areas of AVCN. A, Series of schematic frontal sections through AVCN to show the dorsal-ventral location of the injection sites in 3 different animals. The sections are arranged, top to bottom, from rostra1 to caudal. B, Horizontal reconstruction through the cochlear
The Journal of Neuroscience Connections of Lateral Lemniscus in the Bat A + b, ::, + + +, 1 -0, ::+ ‘1:: ++ + ::+ a ::+ 1: L-M
nucleus to show the rostrakaudal extent of the injections. C, Reconstructions through the columnar area to show the rostrakaudal extent of the sheets of anterograde label (see caption to Fig. 8). D, Drawings of frontal sections through VNLL with stippling to indicate anterograde label. Arrows point to the bands in the columnar area. Note that the higher the frequency recorded at the injection site, the more ventral the location of the band of transport in the columnar area of the ventral nucleus of the lateral lemniscus (Vc). Orientation bars in A and B are also calibration bars (500 pm).
2936 Covey and Casseday Vol. 6, No. 10, Oct. 1986
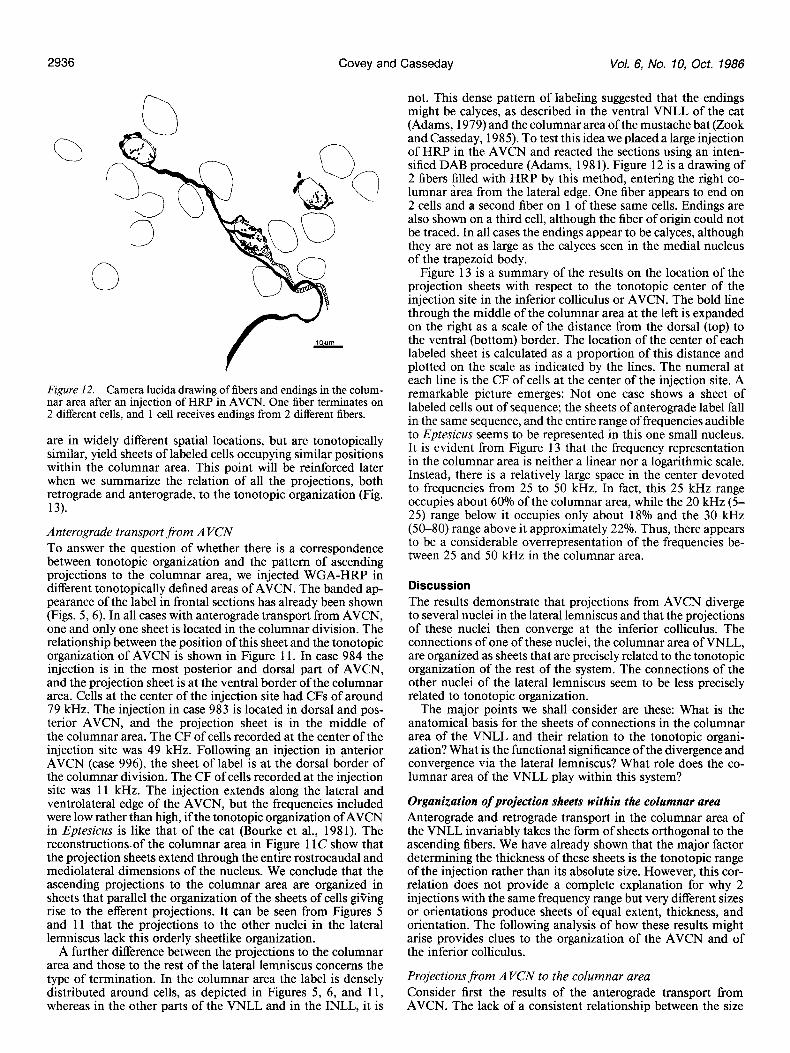
Figure 12. Camera lucida drawing of fibers and endings in the colum- nar area after an injection of HRP in AVCN. One fiber terminates on 2 different cells, and 1 cell receives endings from 2 different fibers.
are in widely different spatial locations, but are tonotopically similar, yield sheets of labeled cells occupying similar positions within the columnar area. This point will be reinforced later when we summarize the relation of all the projections, both retrograde and anterograde, to the tonotopic organization (Fig. 13).
Anterograde transport from AVCN To answer the question of whether there is a correspondence between tonotopic organization and the pattern of ascending projections to the columnar area, we injected WGA-HRP in different tonotopically defined areas of AVCN. The banded ap- pearance of the label in frontal sections has already been shown (Figs. 5,6). In all cases with anterograde transport from AVCN, one and only one sheet is located in the columnar division. The relationship between the position of this sheet and the tonotopic organization of AVCN is shown in Figure 11. In case 984 the injection is in the most posterior and dorsal part of AVCN, and the projection sheet is at the ventral border of the columnar area. Cells at the center of the injection site had CFs of around 79 kHz. The injection in case 983 is located in dorsal and pos- terior AVCN, and the projection sheet is in the middle of the columnar area. The CF of cells recorded at the center of the injection site was 49 kHz. Following an injection in anterior AVCN (case 996), the sheet of label is at the dorsal border of the columnar division. The CF of cells recorded at the injection site was 11 kHz. The injection extends along the lateral and ventrolateral edge of the AVCN, but the frequencies included were low rather than high, if the tonotopic organization of AVCN in Eptesicus is like that of the cat (Bourke et al., 1981). The reconstructionsof the columnar area in Figure 11 C show that the projection sheets extend through the entire rostrocaudal and mediolateral dimensions of the nucleus. We conclude that the ascending projections to the columnar area are organized in sheets that parallel the organization of the sheets of cells gibing rise to the efferent projections. It can be seen from Figures 5 and 11 that the projections to the other nuclei in the lateral lemniscus lack this orderly sheetlike organization.
A further difference between the projections to the columnar area and those to the rest of the lateral lemniscus concerns the type of termination. In the columnar area the label is densely distributed around cells, as depicted in Figures 5, 6, and 11, whereas in the other parts of the VNLL and in the INLL, it is
not. This dense pattern of labeling suggested that the endings might be calyces, as described in the ventral VNLL of the cat (Adams, 1979) and the columnar area of the mustache bat (Zook and Casseday, 1985). To test this idea we placed a large injection of HRP in the AVCN and reacted the sections using an inten- sified DAB procedure (Adams, 198 1). Figure 12 is a drawing of 2 fibers filled with HRP by this method, entering the right co- lumnar area from the lateral edge. One fiber appears to end on 2 cells and a second fiber on 1 of these same cells. Endings are also shown on a third cell, although the fiber of origin could not be traced. In all cases the endings appear to be calyces, although they are not as large as the calyces seen in the medial nucleus of the trapezoid body.
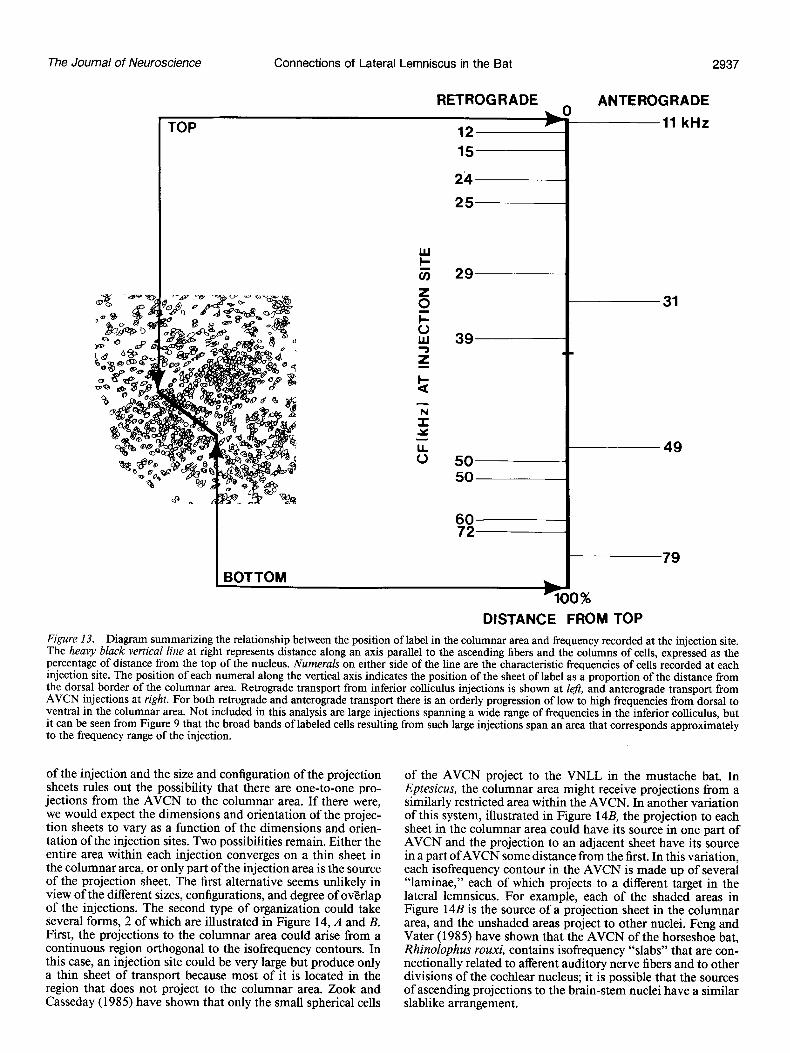
Figure 13 is a summary of the results on the location of the projection sheets with respect to the tonotopic center of the injection site in the inferior colliculus or AVCN. The bold line through the middle of the columnar area at the left is expanded on the right as a scale of the distance from the dorsal (top) to the ventral (bottom) border. The location of the center of each labeled sheet is calculated as a proportion of this distance and plotted on the scale as indicated by the lines. The numeral at each line is the CF of cells at the center of the injection site. A remarkable picture emerges: Not one case shows a sheet of labeled cells out of sequence; the sheets of anterograde label fall in the same sequence, and the entire range of frequencies audible to Eptesicus seems to be represented in this one small nucleus. It is evident from Figure 13 that the frequency representation in the columnar area is neither a linear nor a logarithmic scale. Instead, there is a relatively large space in the center devoted to frequencies from 25 to 50 kHz. In fact, this 25 kHz range occupies about 60% of the columnar area, while the 20 kHz (5- 25) range below it occupies only about 18% and the 30 kHz (50-80) range above it approximately 22%. Thus, there appears to be a considerable overrepresentation of the frequencies be- tween 25 and 50 kHz in the columnar area.
Discussion The results demonstrate that projections from AVCN diverge to several nuclei in the lateral lemniscus and that the projections of these nuclei then converge at the inferior colliculus. The connections of one of these nuclei, the columnar area of VNLL, are organized as sheets that are precisely related to the tonotopic organization of the rest of the system. The connections of the other nuclei of the lateral lemniscus seem to be less precisely related to tonotopic organization.
The major points we shall consider are these: What is the anatomical basis for the sheets of connections in the columnar area of the VNLL and their relation to the tonotopic organi- zation? What is the functional significance of the divergence and convergence via the lateral lemniscus? What role does the co- lumnar area of the VNLL play within this system?
Organization of projection sheets within the columnar area Anterograde and retrograde transport in the columnar area of the VNLL invariably takes the form of sheets orthogonal to the ascending fibers. We have already shown that the major factor determining the thickness of these sheets is the tonotopic range of the injection rather than its absolute size. However, this cor- relation does not provide a complete explanation for why 2 injections with the same frequency range but very different sizes or orientations produce sheets of equal extent, thickness, and orientation. The following analysis of how these results might arise provides clues to the organization of the AVCN and of the inferior colliculus.
Projections from A VCN to the columnar area Consider first the results of the anterograde transport from AVCN. The lack of a consistent relationship between the size
The Journal of Neuroscience Connections of Lateral Lemniscus in the Bat 2937
TOP
RETROGRADE
i 15
2’4
25
50 50
60 72
BOTTOM
9
ANTEROGRADE
11 kHz
31
49
79
1%
DISTANCE FROM TOP Figure 13. Diagram summarizing the relationship between the position of label in the columnar area and frequency recorded at the injection site. The heavy black vertical line at right represents distance along an axis parallel to the ascending fibers and the columns of cells, expressed as the percentage of distance from the top of the nucleus. Numerals on either side of the line are the characteristic frequencies of cells recorded at each injection site. The position of each numeral along the vertical axis indicates the position of the sheet of label as a proportion of the distance from the dorsal border of the columnar area. Retrograde transport from inferior colliculus injections is shown at le#, and anterograde transport from AVCN injections at right. For both retrograde and anterograde transport there is an orderly progression of low to high frequencies from dorsal to ventral in the columnar area. Not included in this analysis are large injections spanning a wide range of frequencies in the inferior colliculus, but it can be seen from Figure 9 that the broad bands of labeled cells resulting from such large injections span an area that corresponds approximately to the frequency range of the injection.
of the injection and the size and configuration of the projection sheets rules out the possibility that there are one-to-one pro-
of the AVCN project to the VNLL in the mustache bat. In
jections from the AVCN to the columnar area. If there were, Eptesicus, the columnar area might receive projections from a similarly restricted area within the AVCN. In another variation
we would expect the dimensions and orientation of the projec- tion sheets to vary as a function of the dimensions and orien-
of this system, illustrated in Figure 14B, the projection to each
tation of the injection sites. Two possibilities remain. Either the sheet in the columnar area could have its source in one part of
entire area within each injection converges on a thin sheet in AVCN and the projection to an adjacent sheet have its source
the columnar area, or only part of the injection area is the source in a part of AVCN some distance from the first. In this variation,
of the projection sheet. The first alternative seems unlikely in each isofrequency contour in the AVCN is made up of several
view of the different sizes, configurations, and degree of ovErlap “laminae,” each of which projects to a different target in the
of the injections. The second type of organization could take lateral lemnsicus. For example, each of the shaded areas in
several forms, 2 of which are illustrated in Figure 14, A and B. Figure 14B is the source of a projection sheet in the columnar
First, the projections to the columnar area could arise from a area, and the unshaded areas project to other nuclei. Feng and
continuous region orthogonal to the isofrequency contours. In Vater (1985) have shown that the AVCN of the horseshoe bat,
this case, an injection site could be very large but produce only Rhinolophus rouxi, contains isofrequency “slabs” that are con-
a thin sheet of transport because most of it is located in the nectionally related to afferent auditory nerve fibers and to other
region that does not project to the columnar area. Zook and divisions of the cochlear nucleus; it is possible that the sources
Casseday (1985) have shown that only the small spherical cells of ascending projections to the brain-stem nuclei have a similar slablike arrangement.
2938 Covey and Casseday Vol. 6, No. 10, Oct. 1986
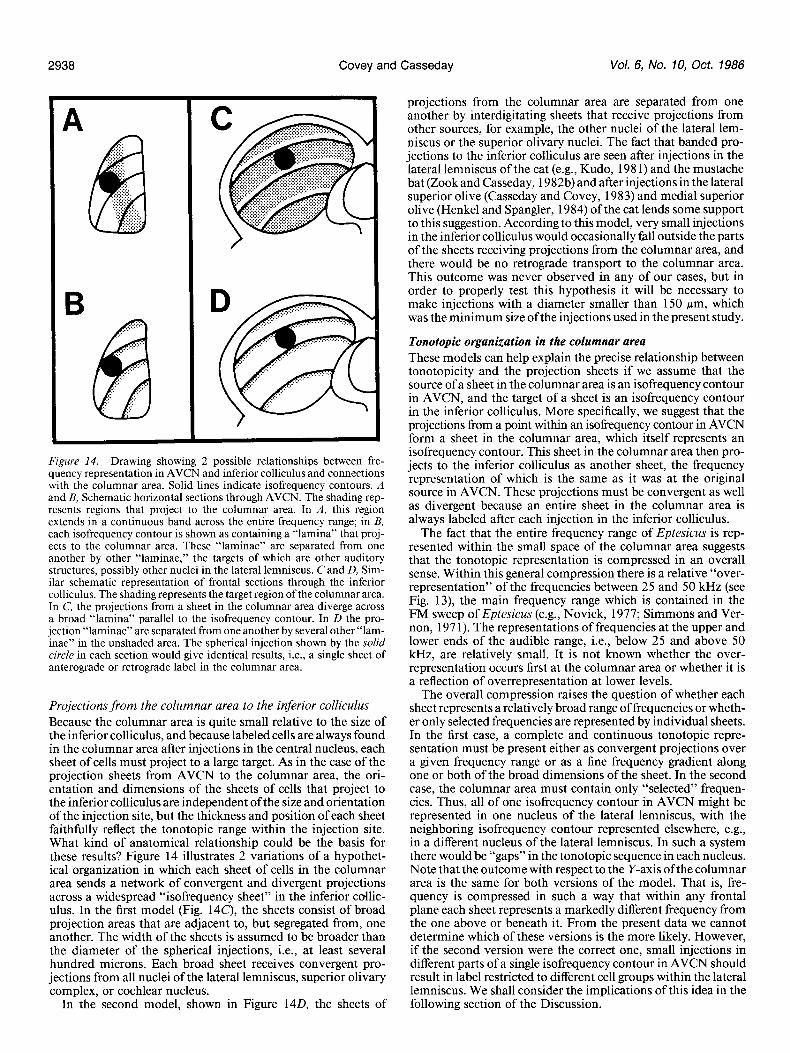
Figure 14. Drawing showing 2 possible relationships between fre- quency representation in AVCN and inferior colliculus and connections with the columnar area. Solid lines indicate isofrequency contours. A and B, Schematic horizontal sections through AVCN. The shading rep- resents regions that project to the columnar area. In A, this region extends in a continuous band across the entire frequency range; in B, each isofrequency contour is shown as containing a “lamina” that proj- ects to the columnar area. These “laminae” are separated from one another by other “laminae,” the targets of which are other auditory structures, possibly other nuclei in the lateral lemniscus. C and D, Sim- ilar schematic representation of frontal sections through the inferior colliculus. The shading represents the target region of the columnar area. In C, the projections from a sheet in the columnar area diverge across a broad “lamina” parallel to the isofrequency contour. In D the pro- jection “laminae” are separated from one another by several other “lam- inae” in the unshaded area. The spherical injection shown by the solid circle in each section would give identical results, i.e., a single sheet of anterograde or retrograde label in the columnar area.
Projections from the columnar area to the inferior colliculus Because the columnar area is quite small relative to the size of the inferior colliculus, and because labeled cells are always found in the columnar area after injections in the central nucleus, each sheet of cells must project to a large target. As in the case of the projection sheets from AVCN to the columnar area, the ori- entation and dimensions of the sheets of cells that project to the inferior colliculus are independent of the size and orientation of the injection site, but the thickness and position of each sheet faithfully reflect the tonotopic range within the injection site. What kind of anatomical relationship could be the basis for these results? Figure 14 illustrates 2 variations of a hypothet- ical organization in which each sheet of cells in the columnar area sends a network of convergent and divergent projections across a widespread “isofrequency sheet” in the inferior collic- ulus. In the first model (Fig. 14c), the sheets consist of broad projection areas that are adjacent to, but segregated from, one another. The width of the sheets is assumed to be broader than the diameter of the spherical injections, i.e., at least several hundred microns. Each broad sheet receives convergent pro- jections from all nuclei of the lateral lemniscus, superior olivary complex, or cochlear nucleus.
In the second model, shown in Figure 140, the sheets of
projections from the columnar area are separated from one another by interdigitating sheets that receive projections from other sources, for example, the other nuclei of the lateral lem- niscus or the superior olivary nuclei. The fact that banded pro- jections to the inferior colliculus are seen after injections in the lateral lemniscus of the cat (e.g., Kudo, 198 1) and the mustache bat (Zook and Casseday, 1982b) and after injections in the lateral superior olive (Casseday and Covey, 1983) and medial superior olive (Henkel and Spangler, 1984) of the cat lends some support to this suggestion. According to this model, very small injections in the inferior colliculus would occasionally fall outside the parts of the sheets receiving projections from the columnar area, and there would be no retrograde transport to the columnar area. This outcome was never observed in any of our cases, but in order to properly test this hypothesis it will be necessary to make injections with a diameter smaller than 150 pm, which was the minimum size of the injections used in the present study.
Tonotopic organization in the columnar area These models can help explain the precise relationship between tonotopicity and the projection sheets if we assume that the source of a sheet in the columnar area is an isofrequency contour in AVCN, and the target of a sheet is an isofrequency contour in the inferior colliculus. More specifically, we suggest that the projections from a point within an isofrequency contour in AVCN form a sheet in the columnar area, which itself represents an isofrequency contour. This sheet in the columnar area then pro- jects to the inferior colliculus as another sheet, the frequency representation of which is the same as it was at the original source in AVCN. These projections must be convergent as well as divergent because an entire sheet in the columnar area is always labeled after each injection in the inferior colliculus.
The fact that the entire frequency range of Eptesicus is rep- resented within the small space of the columnar area suggests that the tonotopic representation is compressed in an overall sense. Within this general compression there is a relative “over- representation” of the frequencies between 25 and 50 kHz (see Fig. 13), the main frequency range which is contained in the FM sweep of Eptesicus (e.g., Novick, 1977; Simmons and Ver- non, 197 1). The representations of frequencies at the upper and lower ends of the audible range, i.e., below 25 and above 50 kHz, are relatively small. It is not known whether the over- representation occurs first at the columnar area or whether it is a reflection of overrepresentation at lower levels.
The overall compression raises the question of whether each sheet represents a relatively broad range of frequencies or wheth- er only selected frequencies are represented by individual sheets. In the first case, a complete and continuous tonotopic repre- sentation must be present either as convergent projections over a given frequency range or as a fine frequency gradient along one or both of the broad dimensions of the sheet. In the second case, the columnar area must contain only “selected” frequen- cies. Thus, all of one isofrequency contour in AVCN might be represented in one nucleus of the lateral lemniscus, with the neighboring isofrequency contour represented elsewhere, e.g., in a different nucleus of the lateral lemniscus. In such a system there would be “gaps” in the tonotopic sequence in each nucleus. Note that the outcome with respect to the Y-axis ofthe columnar area is the same for both versions of the model. That is, fre- quency is compressed in such a way that within any frontal plane each sheet represents a markedly different frequency from the one above or beneath it. From the present data we cannot determine which of these versions is the more likely. However, if the second version were the correct one, small injections in different parts of a single isofrequency contour in AVCN should result in label restricted to different cell groups within the lateral lemniscus. We shall consider the implications of this idea in the following section of the Discussion.
The Journal of Neuroscience Connections of Lateral Lemniscus in the Bat 2939
In the cat there is some question about whether there is a continuous tonotopic organization in VNLL (Adams, 1979; Ait- kin et al., 1970; Guinan et al., 1972). Ifthe connections ofVNLL in the cat are similar to those in bats, as is most likely the case (see Glendenning et al., 1981; Roth et al., 1978; van Noort, 1969; Warr, 1966, 1969, 1972), then one might expect to find multiple tonotopic representations rather than a single contin- uous one.
Relation to echolocation: A frequency to time converter?
The echolocation pulse of Eptesicus provides a basis for a theory about the function of the columnar area. Eptesicus emits brief (0.25-4.0 msec) FM sounds that are repeated at varying rates depending on behavioral requirements (Novick, 1977). Behav- ioral experiments indicate that Eptesicus must use spectral or temporal cues, or both, to make fine discriminations about the properties of reflective surfaces, such as distance between 2 ob- jects, surface structure, or oscillatory movement of targets (Sim- mons, 1979; Simmons et al., 1974). It is quite obvious that the columnar area could extract spectral information, as already described. In addition, because the frequency of the echoloca- tion pulse sweeps downward over time, there is the opportunity to preserve temporal features of the pulse. This hypothesis is based on the assumption that each sheet processes a very narrow range of frequencies and that there are “gaps” between the fre- quencies processed by one sheet and those processed by an adjacent sheet. Consider the consequences of such an arrange- ment for neural processing of an FM pulse or echo. Because high frequencies always precede low in the FM sweep, the sheets will be successively activated from ventral to dorsal during the vocalized FM sweep and during the returning echo. This suc- cessive activation might provide a mechanism for extracting from complex temporal signals, such as FM sweeps, timing information related to discrete frequency components of the signal. That is, the nearly simultaneous response of all the neu- rons in one sheet could provide a “timing marker” which occurs at some point on the FM pulse and its echo, and the response of all the sheets to an FM signal would be a number of discrete events, temporally related to the sequence of frequencies in the FM signal.
Although a test of this hypothesis requires physiological mea- sures on cells in the columnar area itself, published studies on the responses of cells in the inferior colliculus of bats that emit FM pulses provide evidence that is relevant to the above anal- ysis. These studies describe a class of neurons that respond phasically and have nearly constant response latencies over a wide range of intensities (Bodenhamer and Pollak, 198 1; Pollak et al., 1977; Suga, 1970; Vater and Schlegel, 1979). When pre- sented with a downward FM sweep the response of such neurons very precisely indicates the time of occurrence of the frequencies to which the neuron is most sensitive. Our evidence suggests that the columnar area might be an important stage in extracting such temporal information from FM signals.
In a broader sense, the entire system of connections via the nuclei of the lateral lemniscus could be a mechanism to provide the inferior colliculus and, ultimately, higher centers with dif- ferent delays df the output from AVCN. Indeed, the connec- tional architecture of these nuclei is reminiscent of a neural model for autocorrelation in auditory pathways suggested years ago by Licklider (1959). Delay-sensitive neurons have been feund in the inferior colliculus (e.g., Pollak et al., 1977; Suga, 1970) and cortex of echolocating bats (e.g., Feng et al., 1978; O’Neill and Suga, 1979, 1982; Sullivan, 1982). Further, the potential exists within the different nuclei of the lateral lemniscus for different transformations of neural signals. Calyx-like endings innervate neurons in the columnar area of Eptesicus (present study) and Pteronotus (Zook and Casseday, 1985) and in the ventral part of the VNLL of cats (Adams, 1979). Thus, this area
may receive input that has a shorter latency (Pfeiffer, 1966) or is more “secure” (Mores& 1968) than input to the other nuclei of the lateral lemniscus. A thorough examination of the types of endings in the lateral lemniscus and of the trajectory of fibers to and from the nuclei of the lateral lemniscus should provide information to help in evaluating these possibilities.
Appendix Abbreviations used in the figures are as follofvs: A, anterior; A VCN, anteroventral cochlear nucleus; BZC, brachium ofthe inferior colliculus; BP, brachium pontis; CF, characteristic frequency; CG, central grey; DCN, dorsal cochlear nucleus; DNLL, dorsal nucleus of the lateral lem- niscus; ICC, central nucleus of the inferior colliculus; ZCp, pericentral nucleus of the inferior colliculus; ZNLL, intermediate nucleus of the lateral lemniscus; ZP, interpedunclar nucleus; L, lateral; LT, lateral teg- mentum; M, medial; MNTB, medial nucleus of the trapezoid body; P, posterior; PG, pontine grey; Py, pyramidal body; SC, superior colliculus; Sg, sagulum; SO, superior olive; TB, trapezoid body; Vc, columnar area ofthe ventral nucleus ofthe lateral lemniscus; VIII, eighth cranial nerve; Vm, multipolar cell area of the ventral nucleus of the lateral lemniscus.
References Adams, J. C. (1979) Ascending projections to the inferior colliculus.
J. Comp. Neurol. 183: 519-538. Adams, J. C. (198 1) Heavy metal intensificationof DAB-based HRP
reaction product. J. Histochem. Cytochem. 3: 265-274. Aitkin, L. M., D. J. Anderson, and J. F. Brugge (1970) Tonotopic
organization and discharge characteristics of single neurons in nuclei of the lateral lemniscus of the cat. J. Neurophysiol. 33: 42 l-440.
Bodenhamer, R. D., and G. D. Pollak (1981) Time and frequency domain processing in the inferior colliculus of echolocating bats. Hearing Res. 5: 3 17-335.
Bourke. T. R.. J. P. Mielcarz. and B. E. Norris (1981) Tonotooic \ , organization of the anteroventral cochlear nucleus of the cat. Heahng Res. 4: 2 15-24 1.
Casseday, J. H., and E. Covey (1983) Laminar projections to the inferior colliculus as seen from injections of wheat germ agglutinin- horseradish peroxidase in the superior olivary complex of the cat. Sot. Neurosci. Abstr. 9: 766.
Casseday, J. H., and E. Covey (1985) Tonotopic organization in the inferior colliculus of Eptesicusfuscus and its relation to afferent pro- jections. Seventh International Bat Research Conference, Aberdeen, U.K. (abstract).
Casseday, J. H., and E. Covey (1986) Structural basis for directional hearing. In Directional Hearing, W. .Yost and G. Gourevitch, eds., Springer-Verlag, New York (in press).
Dalland, J. I. (1965) Hearing sensitivity in bats. Science 150: 1185- 1186.
Feng, A. S., and M. Vater (1985) Functional organization of the coch- lear nucleus of rufous horseshoe bats (Rhinolophus rouxi): Frequen- cies and internal connections are arranged in slabs. J. Comp. Neurol. 235: 529-554.
Feng, A. S., J. A. Simmons, and S. A. Kick (1978) Echodetection and target-ranging neurons in the auditory system of the bat Eptesicus jiiscus. Science 202: 645-648.
Glendenning, K. K., J. K. Brunso-Bechtold, G. C. Thompson, and R. B. Masterton (198 1) Ascending auditory afferents to the nuclei of the lateral lemniscus. J. Comp. Neurol. 197: 673-703.
Guinan, J. J., Jr., S. S. Guinan, and B. E. Norris (1972) Single auditory units in the superior olivary complex. I. Responses to sounds and classifications based on physiological properties. Int. J. Neurosci. 4: 101-120.
Henkel, C. K., and K. M. Spangler (1984) Organization ofthe efferent projections of the medial superior olivary nucleus in the cat as re- vealed by HRP and autoradiographic tracing methods. J. Comp. Neu- rol. 221: 4 16-428.
Kudo, M. (198 1) Projections of the nuclei of the lateral lemniscus in the cat: An autoradiographic study. Brain Res. 221: 57-69.
LaVail, J. H., and M. M. LaVail (1972) Retrograde axonal transport in the central nervous system. Science 176: 14 16-l 4 17.
Licklider. J. C. R. (1959) Three auditorv theories. In Psvcholom: A Study bf Science, ‘Vol. 3, S. Koch, ed.,.pp. 41-144, McGraw&ill, New York.
Mesulam, M.-M. (1978) Tetramethyl benzidine for horseradish per-
2940 Covey and Casseday Vol. 6, No. 10, Oct. 1986
oxidase neurohistochemistry: A non-carcinogenic blue reaction prod- uct with superior sensitivity for visualizing neural afferents and ef- ferents. J. Histochem. Cytochem. 26: 106-l 17.
Morest. D. K. (1968) The collateral svstem of the medial nucleus of the trapezoid body’of the cat, its neuronal architecture and relation to the olivo-cochlear bundle. Brain Res. 9: 288-3 11.
Novick, A. (1977) Acoustic orientation. In Biology of Bats, Vol. 3, W. A. Wimsatt, ed., pp. 74-287, Academic, New York.
O’Neill, W. E., and N. Suga (1979) Target range-sensitive neurons in the auditory cortex of the mustache bat. Science 203: 69-73.
O’Neill, W. E., and N. Suga (1982) Encoding of target range infor- mation and its representation in the auditory cortex of the mustache bat. J. Neurosci. 2: 17-31.
Pfeiffer, R. R. (1966) Anteroventral cochlear nucleus: Wave forms of extracellularly recorded spike potentials. Science 154: 667-668.
Pollak, G. D., D. S. Marsh, R. Bodenhamer, and A. Souther (1977) Characteristics of phasic on neurons in inferior colliculus of unanes- thetized bats with observations relating to mechanisms for echo rang- ing. J. Neurophysiol. 40: 926-942.
Poussin, C., and J. A. Simmons (1982) Low frequency hearing sen- sitivity in the echolocating bat, Eptesicus fuscus. J. Acoust. Sot. Am. 72: 340-342.
Roth, G. L., L. M. Aitkin, R. A. Andersen, and M. M. Merzenich (1978) Some features of the spatial organization of the central nucleus of the inferior colliculus of the cat. J. Comp. Neurol. 182: 661-680.
Simmons, J. A. (1979) Perception of echo phase information in bat sonar. Science 204: 1336-l 338.
Simmons, J. A., and J. A. Vernon (197 1) Echolocation: Discrimination of targets by the bat Eptesicus.fuscus. J. Exp. Zool. 176: 3 15-328.
Simmons, J. A., W. A. Lavender, B. A. Lavender, C. A. Doroshow, S.
W. Kiefer, R. Livingston, A. C. Scallet, and D. E. Crowley (1974) Target structure and echo spectral discrimination by echlocating bats. Science 186: 1130-l 132.
Suga, N. (1970) Echo-ranging neurons in the inferior colliculus of bats. Science 170: 449-452.
Sullivan, W. E. (1982) Neural representation of target distance in auditory cortex of the echolocating bat Myotis luczjiqus. J. Neuro- physiol. 48: 101 l-1032.
Van Noort, J. (1969) The Structure and Connections of the Inferior Colliculus: An Investigation of the Lower Auditory System, Van Gor- cum, Assen, Amsterdam.
Vater, M., and P. Schlegel (1979) Comparative auditory neurophys- iology of the inferior colliculus in two molossid bats, Molossus ater and Molossus molossus. J. Comp. Physiol. 131: 147-160.
Warr, W. B. (1966) Fiber degeneration following lesions in the anterior ventral cochlear nucleus of the cat. Exp. Neurol. 14: 453-474.
Warr, W. B. (1969) Fiber degeneration following lesions in the pos- teroventral cochlear nucleus of the cat. Exp. Neurol. 23: 140-l 55.
Warr, W. B. (1972) Fiber degeneration following lesions in the mul- tipolar and globular cell areas in the ventral cochlear nucleus of the cat. Brain Res. 40: 247-270.
Zook, J. M., and J. H. Casseday (1982a) Cytoarchitecture of auditory system in lower brainstem of the mustache bat, Pteronotus parnellii. J. Comp. Neurol. 207: 1-13.
Zook, J. M., and J. H. Casseday (1982b) Origin of ascending projec- tions to inferior colliculus in the mustache bat, Pteronotus parnellii. J. Comp. Neurol. 207: 14-28.
Zook, J. M., and J. H. Casseday (1985) Projections from the cochlear nuclei in the mustache bat, Pteronotus parnellii. J. Comp. Neurol. 237: 307-324.