connectometry: a statistical approach harnessing the...
TRANSCRIPT
1Q1
2
3Q2
45
6
7
891011
1213141516171819
33
3435
36
37
38
39
40
41
42
43
44
45
46
47
48
49
50
51
52
53
54
55
56
NeuroImage xxx (2015) xxx–xxx
YNIMG-12683; No. of pages: 10; 4C: 2, 4, 6, 7, 8
Contents lists available at ScienceDirect
NeuroImage
j ourna l homepage: www.e lsev ie r .com/ locate /yn img
Connectometry: A statistical approach harnessing the analytical potentialof the local connectome
OFFang-Cheng Yeh a,⁎, David Badre b, Timothy Verstynen a,⁎
a Department of Psychology, Carnegie Mellon University, PA, USAb Department of Cognitive, Linguistic and Psychological Sciences, Brown University, RI, USA
⁎ Corresponding authors at: Department of Psychologyof Computation, Carnegie Mellon University, Pittsburgh, P
E-mail addresses: [email protected] (F.-C. Yeh), tim(T. Verstynen).
http://dx.doi.org/10.1016/j.neuroimage.2015.10.0531053-8119/© 2015 Elsevier Inc. All rights reserved.
Please cite this article as: Yeh, F.-C., et al., CNeuroImage (2015), http://dx.doi.org/10.101
Oa b s t r a c t
a r t i c l e i n f o20
21
22
23
24
25
26
27
28
29
30
31
Article history:Received 18 August 2015Accepted 19 October 2015Available online xxxx
Keywords:ConnectomeConnectometryDiffusion MRIDiffusion spectrum imagingq-Space diffeomorphic reconstructionGeneralized q-sampling imagingQuantitative anisotropy
32
TED PRHere we introduce the concept of the local connectome: the degree of connectivity between adjacent voxelswithin a white matter fascicle defined by the density of the diffusing spins. While most human structuralconnectomic analyses can be summarized as finding global connectivity patterns at either end of anatomicalpathways, the analysis of local connectomes, termed connectometry, tracks the local connectivity patternsalong the fiber pathways themselves in order to identify the subcomponents of the pathways that express signif-icant associations with a study variable. This bottom-up analytical approach is made possible by reconstructingdiffusionMRI data into a common stereotaxic space that allows for associating local connectomes across subjects.The substantial associations can then be tracked along the white matter pathways, and statistical inference isobtained using permutation tests on the length of coherent associations and corrected for multiple comparisons.Using two separate samples, with different acquisition parameters, we show how connectometry can capturevariability within core white matter pathways in a statistically efficient manner and extract meaningful variabil-ity from white matter pathways, complements graph-theoretic connectomic measures, and is more sensitivethan region-of-interest approaches.
© 2015 Elsevier Inc. All rights reserved.
C
57
58
59
60
61
62
63
64
65
66
67
68
69
70
71
72
73
74
75
76
UNCO
RREIntroduction
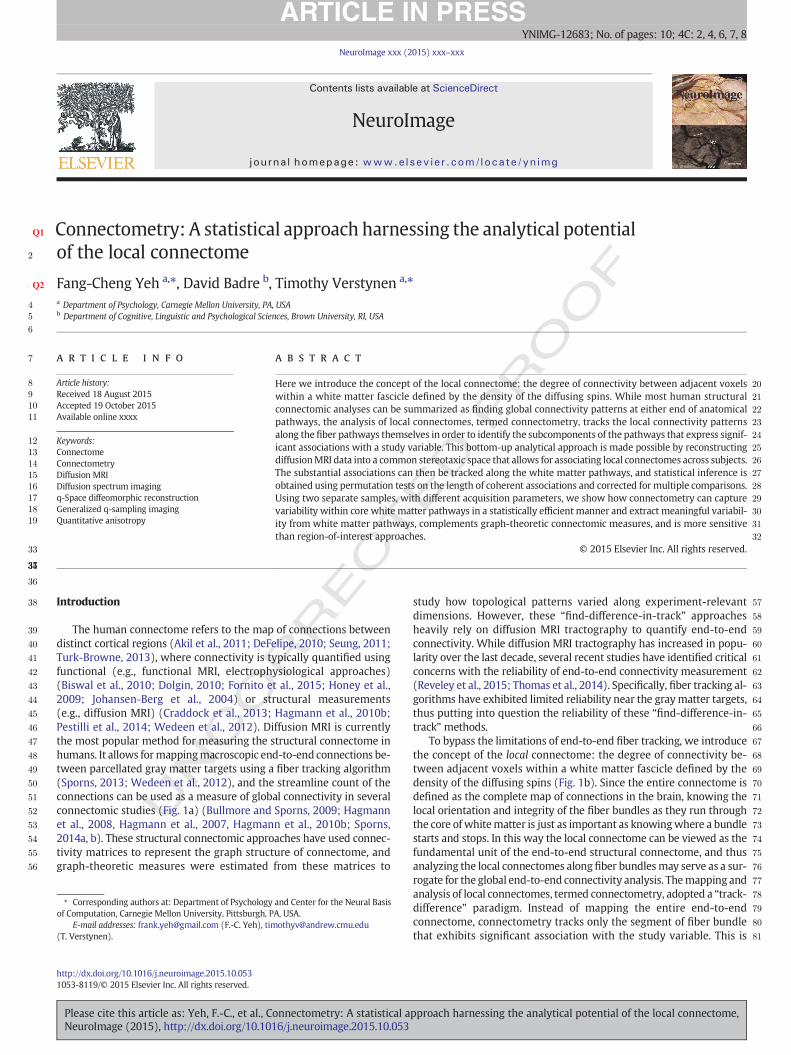
The human connectome refers to the map of connections betweendistinct cortical regions (Akil et al., 2011; DeFelipe, 2010; Seung, 2011;Turk-Browne, 2013), where connectivity is typically quantified usingfunctional (e.g., functional MRI, electrophysiological approaches)(Biswal et al., 2010; Dolgin, 2010; Fornito et al., 2015; Honey et al.,2009; Johansen-Berg et al., 2004) or structural measurements(e.g., diffusion MRI) (Craddock et al., 2013; Hagmann et al., 2010b;Pestilli et al., 2014; Wedeen et al., 2012). Diffusion MRI is currentlythe most popular method for measuring the structural connectome inhumans. It allows formappingmacroscopic end-to-end connections be-tween parcellated gray matter targets using a fiber tracking algorithm(Sporns, 2013; Wedeen et al., 2012), and the streamline count of theconnections can be used as a measure of global connectivity in severalconnectomic studies (Fig. 1a) (Bullmore and Sporns, 2009; Hagmannet al., 2008, Hagmann et al., 2007, Hagmann et al., 2010b; Sporns,2014a, b). These structural connectomic approaches have used connec-tivity matrices to represent the graph structure of connectome, andgraph-theoretic measures were estimated from these matrices to
77
78
79
80
81
and Center for the Neural BasisA, [email protected]
onnectometry: A statistical a6/j.neuroimage.2015.10.053
study how topological patterns varied along experiment-relevantdimensions. However, these “find-difference-in-track” approachesheavily rely on diffusion MRI tractography to quantify end-to-endconnectivity. While diffusion MRI tractography has increased in popu-larity over the last decade, several recent studies have identified criticalconcerns with the reliability of end-to-end connectivity measurement(Reveley et al., 2015; Thomas et al., 2014). Specifically, fiber tracking al-gorithms have exhibited limited reliability near the graymatter targets,thus putting into question the reliability of these “find-difference-in-track” methods.
To bypass the limitations of end-to-end fiber tracking, we introducethe concept of the local connectome: the degree of connectivity be-tween adjacent voxels within a white matter fascicle defined by thedensity of the diffusing spins (Fig. 1b). Since the entire connectome isdefined as the complete map of connections in the brain, knowing thelocal orientation and integrity of the fiber bundles as they run throughthe core of whitematter is just as important as knowingwhere a bundlestarts and stops. In this way the local connectome can be viewed as thefundamental unit of the end-to-end structural connectome, and thusanalyzing the local connectomes along fiber bundlesmay serve as a sur-rogate for the global end-to-end connectivity analysis. Themapping andanalysis of local connectomes, termed connectometry, adopted a “track-difference” paradigm. Instead of mapping the entire end-to-endconnectome, connectometry tracks only the segment of fiber bundlethat exhibits significant association with the study variable. This is
pproach harnessing the analytical potential of the local connectome,
T
PRO
OF
82
83
84
85
86
87
88
89
90
91
92
93
94
95
96
97
98
99
100
101
102
103
104
105
106
107
108
109
110
111
112
113
114
Fig. 1.Differences between the global connectome and local connectome. (a) Themapping of human connectome relies on cortical parcellation to define a set of common regions (nodes)for calculating the connectivity measurements (edges). The connectivity can be measured by the number of the connecting tracks or their mean anisotropy value. The final form can beexpressed as a symmetric connectivity matrix. (b) The mapping of local connectome utilizes local fiber directions from a common atlas to sample the density of diffusing spins as theconnectivity measurement. Multiple measurements can be obtained along the fiber pathways to reveal the change of track compactness within a fiber bundle. The local connectome ofa subject can be represented by a row vector, whereas the local connectomes from a group subject can be compiled as a local connectome matrix..
2 F.-C. Yeh et al. / NeuroImage xxx (2015) xxx–xxx
ORREC
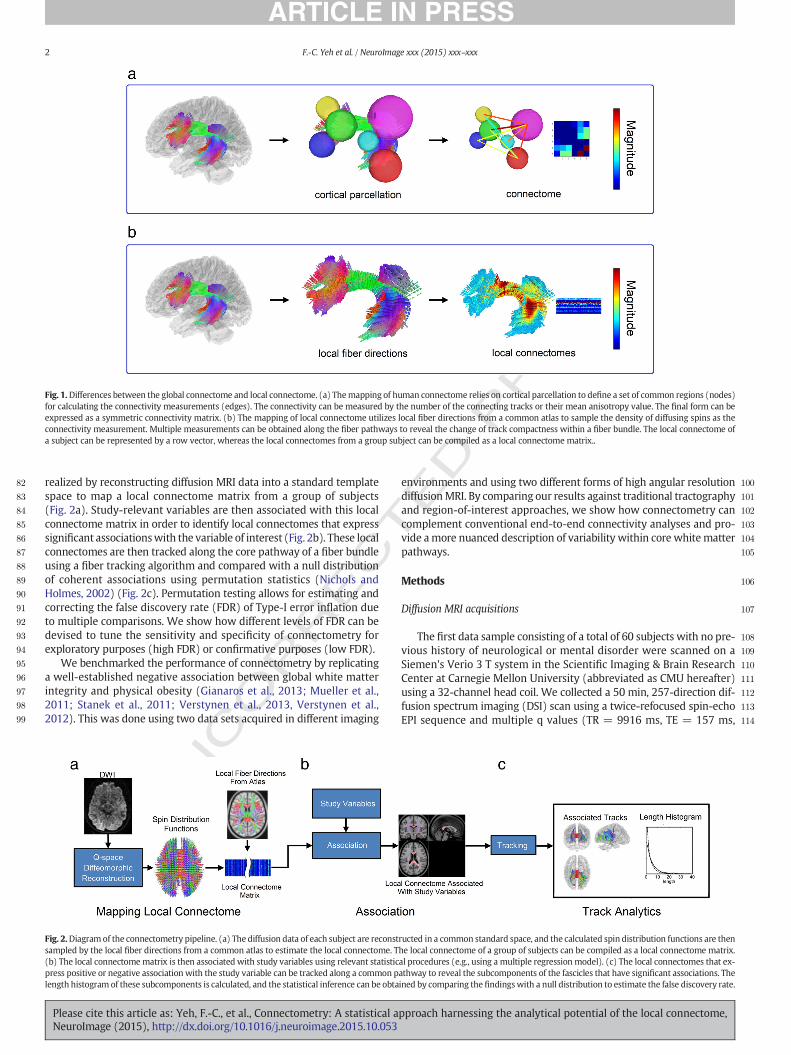
realized by reconstructing diffusion MRI data into a standard templatespace to map a local connectome matrix from a group of subjects(Fig. 2a). Study-relevant variables are then associated with this localconnectome matrix in order to identify local connectomes that expresssignificant associationswith the variable of interest (Fig. 2b). These localconnectomes are then tracked along the core pathway of a fiber bundleusing a fiber tracking algorithm and compared with a null distributionof coherent associations using permutation statistics (Nichols andHolmes, 2002) (Fig. 2c). Permutation testing allows for estimating andcorrecting the false discovery rate (FDR) of Type-I error inflation dueto multiple comparisons. We show how different levels of FDR can bedevised to tune the sensitivity and specificity of connectometry forexploratory purposes (high FDR) or confirmative purposes (low FDR).
We benchmarked the performance of connectometry by replicatinga well-established negative association between global white matterintegrity and physical obesity (Gianaros et al., 2013; Mueller et al.,2011; Stanek et al., 2011; Verstynen et al., 2013, Verstynen et al.,2012). This was done using two data sets acquired in different imaging
UNC
Fig. 2.Diagram of the connectometry pipeline. (a) The diffusion data of each subject are reconstsampled by the local fiber directions from a common atlas to estimate the local connectome. T(b) The local connectomematrix is then associated with study variables using relevant statisticpress positive or negative association with the study variable can be tracked along a common plength histogram of these subcomponents is calculated, and the statistical inference can be obta
Please cite this article as: Yeh, F.-C., et al., Connectometry: A statistical aNeuroImage (2015), http://dx.doi.org/10.1016/j.neuroimage.2015.10.053
EDenvironments and using two different forms of high angular resolution
diffusionMRI. By comparing our results against traditional tractographyand region-of-interest approaches, we show how connectometry cancomplement conventional end-to-end connectivity analyses and pro-vide amore nuanced description of variability within core whitematterpathways.
Methods
Diffusion MRI acquisitions
The first data sample consisting of a total of 60 subjects with no pre-vious history of neurological or mental disorder were scanned on aSiemen's Verio 3 T system in the Scientific Imaging & Brain ResearchCenter at Carnegie Mellon University (abbreviated as CMU hereafter)using a 32-channel head coil. We collected a 50 min, 257-direction dif-fusion spectrum imaging (DSI) scan using a twice-refocused spin-echoEPI sequence and multiple q values (TR = 9916 ms, TE = 157 ms,
ructed in a common standard space, and the calculated spin distribution functions are thenhe local connectome of a group of subjects can be compiled as a local connectome matrix.al procedures (e.g., using a multiple regression model). (c) The local connectomes that ex-athway to reveal the subcomponents of the fascicles that have significant associations. Theined by comparing the findingswith a null distribution to estimate the false discovery rate.
pproach harnessing the analytical potential of the local connectome,
T
115
116
117
118
119
120
121
122
123
124
125
126
127
128
129
130
131
132
133
134
135
136
137
138
139
140
141
142
143
144
145
146
147
148
149
150
151
152
153
154
155
156
157
158
159
160
161
162
163
165165
166
167
168
169
170
171
172
173
174
175
176
177
178
179
180
181
182
183
184
185
186
187
188
189
190
192192
193
194
195
196
197
198
199
200
201
202
203
204
205
206
207
208
209
210
212212
213
214
215
216
217
218
219
220
221
222
223
224
225
226
227
3F.-C. Yeh et al. / NeuroImage xxx (2015) xxx–xxx
UNCO
RREC
voxel size = 2.4 × 2.4 × 2.4 mm, FoV = 231 × 231 mm, b-max =5000 s/mm2, 51 slices). Head-movement was minimized during theimage acquisition through padding supports and all subjects wereconfirmed to have minimal head movement during the scan prior toinclusion in the template. Another set of 20 subjects with no previoushistory of neurological or mental disorder was scanned in a Siemens3 T Tim Trio System at Brown University (abbreviated as BU hereafter).A twice-refocused spin-echo sequence was used to acquire DSI with a32-channel head coil. The total diffusion sampling direction was 257.The spatial resolution was 2.4 mm isotropic. TR = 9900 ms, and TE =157 ms. The maximum b-value was 7000 s/mm2.
The second data set was from the Human Connectome Project con-sortium led by Washington University, University of Minnesota, andOxford University (abbreviated as the WU-Minn HCP). 488 of subjectsreceived diffusion MRI scans. The scan was acquired in a Siemens 3 TSkyra scanner using a 2D spin-echo single-shot multiband EPI sequencewith a multi-band factor of 3 and monopolar gradient pulse(Sotiropoulos et al., 2013). The spatial resolutionwas 1.25mm isotropic.TR = 5500 ms, TE = 89.50 ms. The b-values were 1000, 2000, and3000 s/mm2. The total number of diffusion sampling directions was90, 90, and 90 for each of the shells in addition to 6 b0 images. Thetotal scanning time was approximately 55 min.
Connectometry
The diagram of the connectometry method is shown in Fig. 2. Asshown in this overview figure, the diffusion data of each subject arereconstructed in a standard space using q-space diffeomorphic recon-struction, and the density of diffusing spins is then sampled by thelocal fiber directions from a common atlas to estimate the localconnectome and to construct a local connectome matrix (Fig. 2a).Then the local connectome matrix is associated with study variablesusing relevant statistical procedures (e.g., using a multiple regressionmodel) (Fig. 2b). The local connectomes that express positive or nega-tive association with the study variable can be tracked along a commonpathway to reveal the subcomponents of the fascicles that have signifi-cant associations. The length histogram of these subcomponents iscalculated, and the statistical inference can be obtained by comparingthe findings with a null distribution to estimate the false discoveryrate (Fig. 2c). Each step of the connectometry method is detailed inthe following sections.
Q-space diffeomorphic reconstruction
We reconstructed multiple sets of dMRI data into the MontrealNeurological Institute (MNI) space using q-space diffeomorphic recon-struction (Yeh and Tseng, 2011) (QSDR). QSDR satisfied the conserva-tion of diffusion spins after non-linear spatial transformation andcould be applied to diffusion tensor imaging (DTI), DSI, or multishelldata (Yeh and Tseng, 2011) to calculate a spin distribution function(SDF) (Yeh et al., 2010), Ψ(û), an orientation distribution functiondefined as the density of diffusing spins that have a displacementoriented at direction û during the diffusion time (Yeh and Tseng, 2011):
ψ uð Þ ¼ Jφ���
���Z0
Xi
Wi φ rð Þð Þsinc σffiffiffiffiffiffiffiffiffiffi6Dbi
pbgi;
Jφu
Jφu���
���N
0B@
1CA ð1Þ
where φ is a spatial mapping function that maps a template space coor-dinates r to the subject's space. The mapping function was calculatedusing a non-linear registration between subject anisotropy map andthe anisotropy map in the MNI space (Ashburner and Friston, 1999).Jφ is the Jacobian matrix of the mapping function, whereas |Jφ| is theJacobian determinant. Wi(φ(r)) are the diffusion signals acquired atφ(r). bi is the b-value, and ĝi is the direction of the diffusion sensitizationgradient. σ is the diffusion sampling ratio controlling the detection
Please cite this article as: Yeh, F.-C., et al., Connectometry: A statistical aNeuroImage (2015), http://dx.doi.org/10.1016/j.neuroimage.2015.10.053
ED P
RO
OF
range of the diffusing spins. D is the diffusivity of water, and Z0 is theconstant estimated by the diffusion signals of free water. 2 mm resolu-tion was assigned as the output resolution of the QSDR reconstructionfor CMU and Brown University diffusion data, whereas the HCP datawere reconstructed to 1 mm resolution. The SDFs of 60 subjects fromCMU and 20 subjects from Brown University were averaged to createthe CMU/BU-80 multisite atlas. The SDFs of HCP data at WU-Minnwere averaged to construct the HCP-488 atlas. The SDF was sampledat a total of 642 sampling directions defined by an 8-fold tessellatedicosahedron, and the local maxima (peaks) can be determined usingthe neighboring relation of the sampling directions. The peak directionson the averaged SDFs defined the local fiber directions thatwere used tomeasure the local connectomes in each subject.
Local connectome matrix associated with study variables
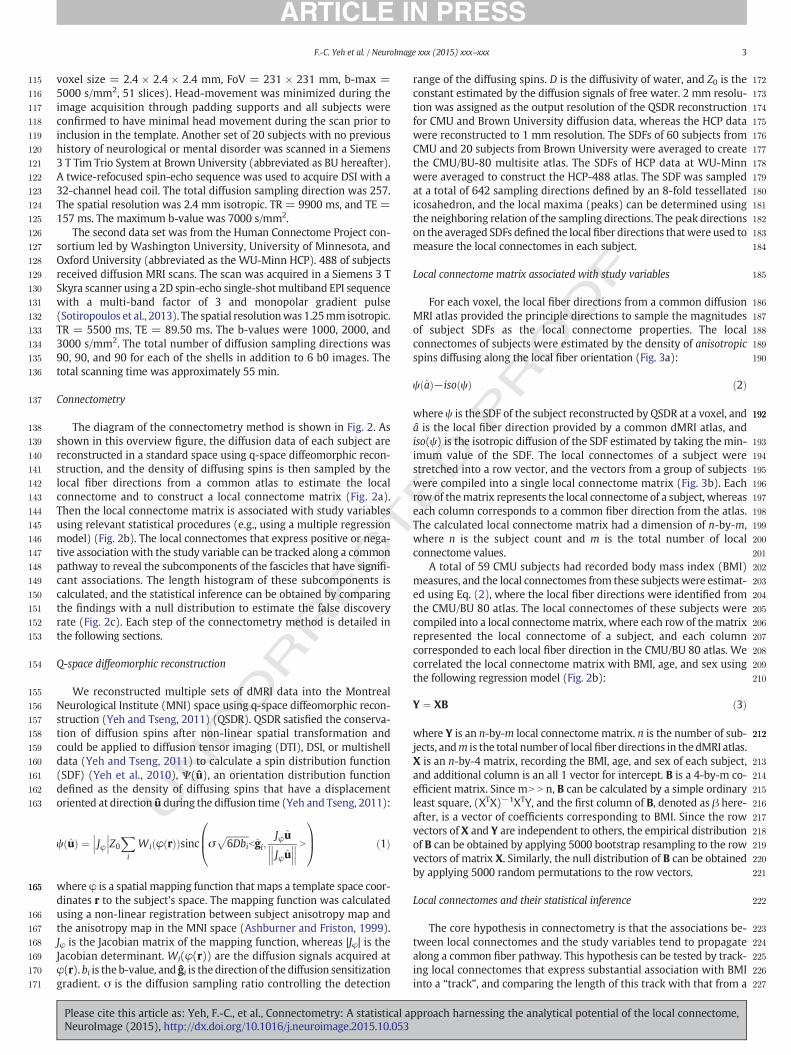
For each voxel, the local fiber directions from a common diffusionMRI atlas provided the principle directions to sample the magnitudesof subject SDFs as the local connectome properties. The localconnectomes of subjects were estimated by the density of anisotropicspins diffusing along the local fiber orientation (Fig. 3a):
ψ að Þ−iso ψð Þ ð2Þ
where ψ is the SDF of the subject reconstructed by QSDR at a voxel, andâ is the local fiber direction provided by a common dMRI atlas, andiso(ψ) is the isotropic diffusion of the SDF estimated by taking the min-imum value of the SDF. The local connectomes of a subject werestretched into a row vector, and the vectors from a group of subjectswere compiled into a single local connectome matrix (Fig. 3b). Eachrow of thematrix represents the local connectome of a subject, whereaseach column corresponds to a common fiber direction from the atlas.The calculated local connectome matrix had a dimension of n-by-m,where n is the subject count and m is the total number of localconnectome values.
A total of 59 CMU subjects had recorded body mass index (BMI)measures, and the local connectomes from these subjects were estimat-ed using Eq. (2), where the local fiber directions were identified fromthe CMU/BU 80 atlas. The local connectomes of these subjects werecompiled into a local connectomematrix, where each row of thematrixrepresented the local connectome of a subject, and each columncorresponded to each local fiber direction in the CMU/BU 80 atlas. Wecorrelated the local connectome matrix with BMI, age, and sex usingthe following regression model (Fig. 2b):
Y ¼ XB ð3Þ
where Y is an n-by-m local connectomematrix. n is the number of sub-jects, andm is the total number of localfiber directions in the dMRI atlas.X is an n-by-4 matrix, recording the BMI, age, and sex of each subject,and additional column is an all 1 vector for intercept. B is a 4-by-m co-efficient matrix. Since mN N n, B can be calculated by a simple ordinaryleast square, (XTX)−1XTY, and the first column of B, denoted as β here-after, is a vector of coefficients corresponding to BMI. Since the rowvectors of X and Y are independent to others, the empirical distributionof B can be obtained by applying 5000 bootstrap resampling to the rowvectors of matrix X. Similarly, the null distribution of B can be obtainedby applying 5000 random permutations to the row vectors.
Local connectomes and their statistical inference
The core hypothesis in connectometry is that the associations be-tween local connectomes and the study variables tend to propagatealong a common fiber pathway. This hypothesis can be tested by track-ing local connectomes that express substantial association with BMIinto a “track”, and comparing the length of this track with that from a
pproach harnessing the analytical potential of the local connectome,
T
PRO
OF
228
229
230
231
232
233
234
235
236
237
238
239
240
241
242
243
244
245
246
247
248
249
250
251
252
253
Fig. 3. (a) Themagnitude of the spin distribution function at thefiber directions is used as the local connectomemeasurements. It is noteworthy thatmultiple fiber populations can coexistlocally within a voxel, and each fiber population, identified by its fiber direction, has its unique local connectome estimation. (b) Compilation of a local connectomematrix from a group ofsubjects. The local connectomematrix provides an easyway to conduct statistical analysis on the local connectome. The local connectomes of each subject are arranged as a row vector inthematrix, and the vectors of a group of subjects can be compiled as amatrix. Since the rows are independent to each other, a distribution of this local connectomematrix can be generatedby applying bootstrapping to the row vectors. Similarly, a null distribution can also be generated by randomly permuting the row vectors.
4 F.-C. Yeh et al. / NeuroImage xxx (2015) xxx–xxx
EC
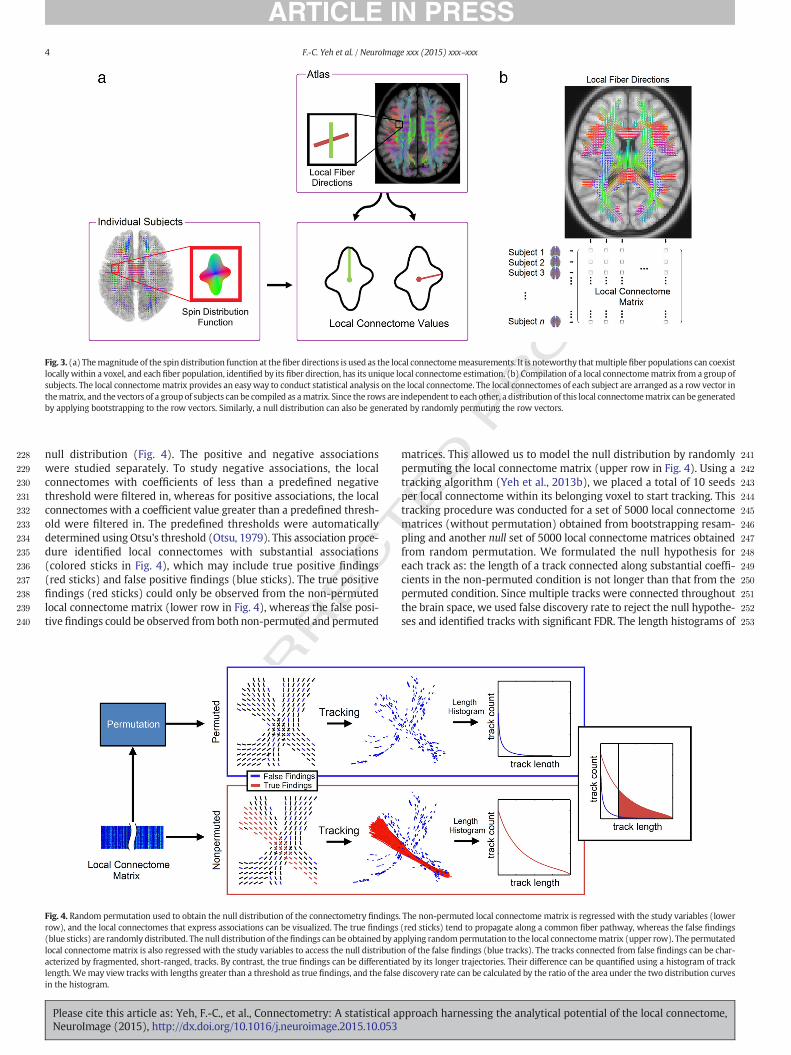
null distribution (Fig. 4). The positive and negative associationswere studied separately. To study negative associations, the localconnectomes with coefficients of less than a predefined negativethreshold were filtered in, whereas for positive associations, the localconnectomes with a coefficient value greater than a predefined thresh-old were filtered in. The predefined thresholds were automaticallydetermined using Otsu's threshold (Otsu, 1979). This association proce-dure identified local connectomes with substantial associations(colored sticks in Fig. 4), which may include true positive findings(red sticks) and false positive findings (blue sticks). The true positivefindings (red sticks) could only be observed from the non-permutedlocal connectome matrix (lower row in Fig. 4), whereas the false posi-tive findings could be observed from both non-permuted and permuted
UNCO
RR
Fig. 4. Random permutation used to obtain the null distribution of the connectometry findingsrow), and the local connectomes that express associations can be visualized. The true findings(blue sticks) are randomly distributed. The null distribution of thefindings can be obtained by aplocal connectomematrix is also regressed with the study variables to access the null distributioacterized by fragmented, short-ranged, tracks. By contrast, the true findings can be differentiatlength. Wemay view tracks with lengths greater than a threshold as true findings, and the falsein the histogram.
Please cite this article as: Yeh, F.-C., et al., Connectometry: A statistical aNeuroImage (2015), http://dx.doi.org/10.1016/j.neuroimage.2015.10.053
ED
matrices. This allowed us to model the null distribution by randomlypermuting the local connectome matrix (upper row in Fig. 4). Using atracking algorithm (Yeh et al., 2013b), we placed a total of 10 seedsper local connectome within its belonging voxel to start tracking. Thistracking procedure was conducted for a set of 5000 local connectomematrices (without permutation) obtained from bootstrapping resam-pling and another null set of 5000 local connectome matrices obtainedfrom random permutation. We formulated the null hypothesis foreach track as: the length of a track connected along substantial coeffi-cients in the non-permuted condition is not longer than that from thepermuted condition. Since multiple tracks were connected throughoutthe brain space, we used false discovery rate to reject the null hypothe-ses and identified tracks with significant FDR. The length histograms of
. The non-permuted local connectome matrix is regressed with the study variables (lower(red sticks) tend to propagate along a common fiber pathway, whereas the false findingsplying randompermutation to the local connectomematrix (upper row). The permutatedn of the false findings (blue tracks). The tracks connected from false findings can be char-ed by its longer trajectories. Their difference can be quantified using a histogram of trackdiscovery rate can be calculated by the ratio of the area under the two distribution curves
pproach harnessing the analytical potential of the local connectome,
T
254
255Q3
256
257
258
259
260
261
262
263
264
265
266
267
268
269
270
271
272
273
274
275
276
277
278
279
280
281
282
283
284
285
286
287
288
289
290
291
292
293
294
295
296
297
298
299
300
301
302
303
304
305
306
307
308
309
310
311
312
313
314
315
316
317
318
319
320
321
322
323
324
325
326
327
328
329
330
331
332
333
334
335
336
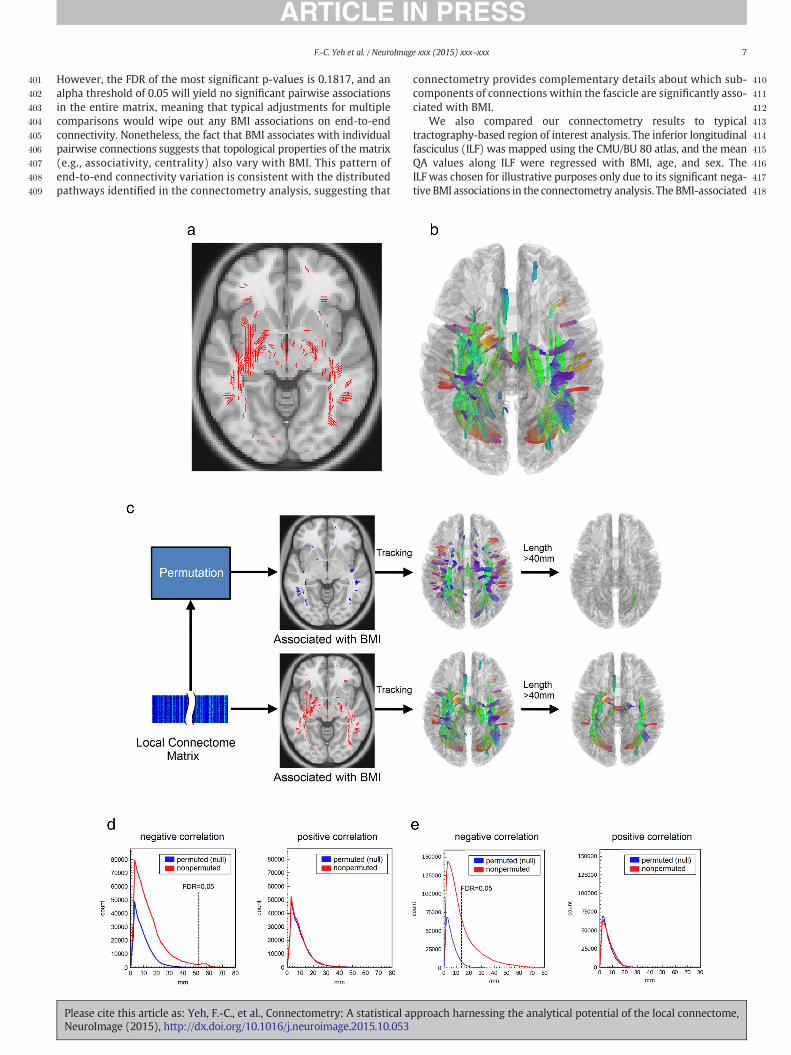
337
338
339
340
341
342
343
344
345
346
347
348
349
350
351
352
353
354
355
356
357
358
359
360
361
362
363
364
365
366
367
368
369
370
371
372
373
374
375
376
5F.-C. Yeh et al. / NeuroImage xxx (2015) xxx–xxx
UNCO
RREC
the tracks were calculated, and the false discovery rate (FDR) of thetracks in non-permuted condition were calculated by the ratio of thearea under the histogram curve.
In CMU 59 subjects' data, the FDR was controlled at 0.10, 0.075, and0.05 to examine the results at different sensitivity/specificity levels. Thesame analysis was repeated on 488 subjects (all had BMI information)from the WU-Minn HCP Consortium to examine whether we couldobtain consistent results from two independently acquired data sets.
Comparison with connectivity matrix
The 59 CMU subjectswith BMI datawere reconstructed using gener-alized q-sampling imaging (Yeh et al., 2010) with a length ratio of 1.25.A total of 100,000 whole brain tracks were obtained using a fiber track-ing algorithm (Yeh et al., 2013b). The default anisotropy threshold andstep size (determined automatically in DSI Studio) were used. The an-gular threshold was 60°. The cortical parcellation was conducted bywarping the subject space to a standard space using non-linear registra-tion (Ashburner and Friston, 1999). The cortex was partitioned usingthe Automated Anatomical Labeling (AAL) atlas. A connectivity matrixwas calculated for each subject, and the entry of the matrix was themean quantitative anisotropy (QA) values of the corresponding tracks.The connectivity matrices of 59 subjects were regressed with theirBMI, sex, and age using a linear regressionmodel. The BMI-related coef-ficients and uncorrected p-value can be calculated for eachmatrix entryusing a linear regression model. The false discovery rate of the uncor-rected p-values was calculated using MATLAB (MathWorks, Inc.).
Comparison with tractography analysis
We chose the inferior longitudinal fasciculus (ILF) as the analysistargets because it showed significant associations with BMI in theconnectometry analysis. The ILF was tracked on the CMU-BU 80 atlasusing the same fiber tracking algorithm (Yeh et al., 2013b), and theQA values (Yeh et al., 2010) along the ILF were correlated with BMI,age, and sex using a linear regressionmodel. The T-score correspondingto BMI were rendered on ILF to examinewhether correlation was local-ized. To test whether the connectivity at ILF was correlated with BMI,the QA values at ILF were averaged for each subject and correlatedwith BMI, age, and sex using a linear regression model. The scatterplot of average QA values against BMI was generated for comparison,and the p-value of the BMI association was calculated using the regres-sion model.
Data analysis
The source code for connectometry described in this work is publiclyavailable at https://github.com/frankyeh/DSI-Studio, and the atlasesdescribed in this paper can be downloaded from http://dsi-studio.labsolver.org. The data analysis was conducted on a personal laptopequipped with a 4.0 GHz quad-core CPU and 32 GB memory. A totalof 8 threads were used in computation. The CMU data (59 subjects,2-mm resolution) used a total of 1B memory, and the computationtimewas around 3 min,whereas theHCP data (488 subjects, 1-mm res-olution) used a total of 18 GB memory, the computation time wasaround 3 h.
Results
Local connectome associations
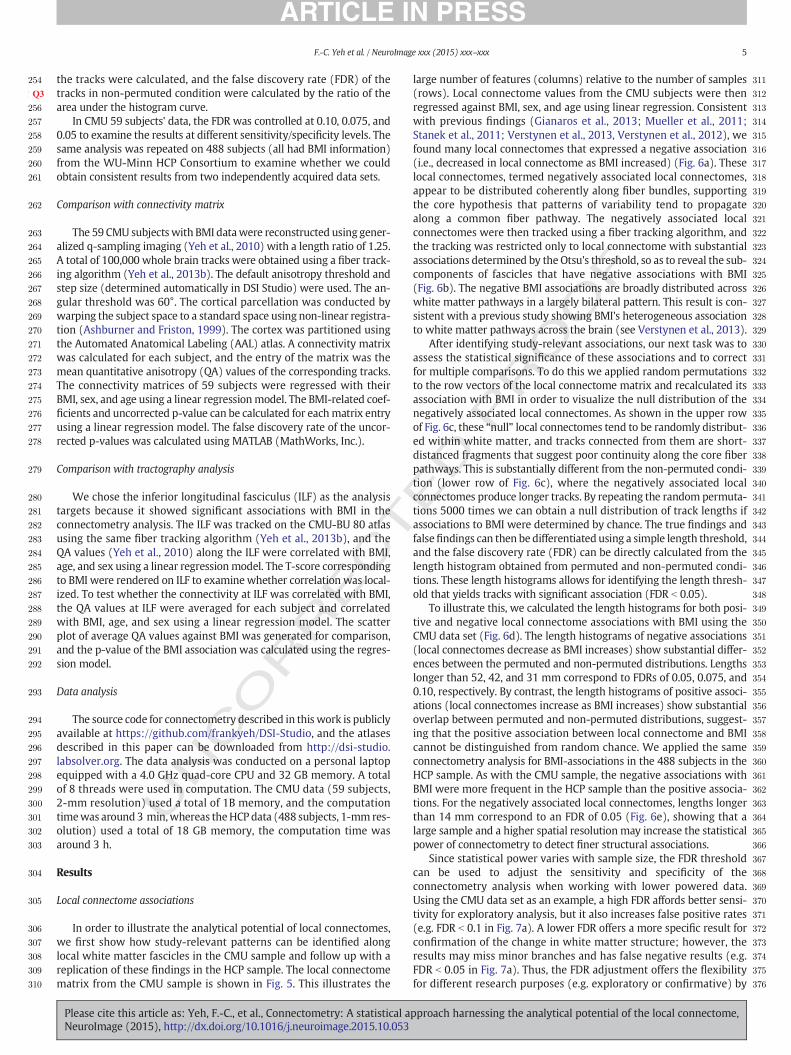
In order to illustrate the analytical potential of local connectomes,we first show how study-relevant patterns can be identified alonglocal white matter fascicles in the CMU sample and follow up with areplication of these findings in the HCP sample. The local connectomematrix from the CMU sample is shown in Fig. 5. This illustrates the
Please cite this article as: Yeh, F.-C., et al., Connectometry: A statistical aNeuroImage (2015), http://dx.doi.org/10.1016/j.neuroimage.2015.10.053
ED P
RO
OF
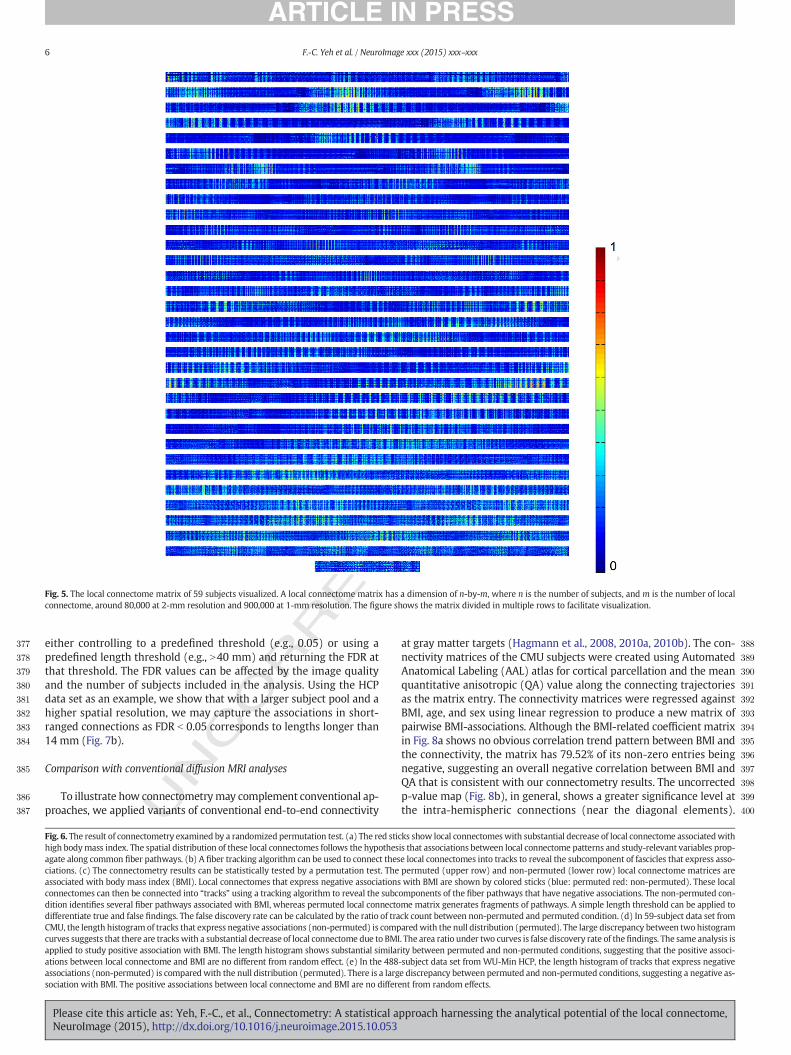
large number of features (columns) relative to the number of samples(rows). Local connectome values from the CMU subjects were thenregressed against BMI, sex, and age using linear regression. Consistentwith previous findings (Gianaros et al., 2013; Mueller et al., 2011;Stanek et al., 2011; Verstynen et al., 2013, Verstynen et al., 2012), wefound many local connectomes that expressed a negative association(i.e., decreased in local connectome as BMI increased) (Fig. 6a). Theselocal connectomes, termed negatively associated local connectomes,appear to be distributed coherently along fiber bundles, supportingthe core hypothesis that patterns of variability tend to propagatealong a common fiber pathway. The negatively associated localconnectomes were then tracked using a fiber tracking algorithm, andthe tracking was restricted only to local connectome with substantialassociations determined by the Otsu's threshold, so as to reveal the sub-components of fascicles that have negative associations with BMI(Fig. 6b). The negative BMI associations are broadly distributed acrosswhite matter pathways in a largely bilateral pattern. This result is con-sistent with a previous study showing BMI's heterogeneous associationto white matter pathways across the brain (see Verstynen et al., 2013).
After identifying study-relevant associations, our next task was toassess the statistical significance of these associations and to correctfor multiple comparisons. To do this we applied random permutationsto the row vectors of the local connectome matrix and recalculated itsassociation with BMI in order to visualize the null distribution of thenegatively associated local connectomes. As shown in the upper rowof Fig. 6c, these “null” local connectomes tend to be randomly distribut-ed within white matter, and tracks connected from them are short-distanced fragments that suggest poor continuity along the core fiberpathways. This is substantially different from the non-permuted condi-tion (lower row of Fig. 6c), where the negatively associated localconnectomes produce longer tracks. By repeating the random permuta-tions 5000 times we can obtain a null distribution of track lengths ifassociations to BMI were determined by chance. The true findings andfalsefindings can then be differentiated using a simple length threshold,and the false discovery rate (FDR) can be directly calculated from thelength histogram obtained from permuted and non-permuted condi-tions. These length histograms allows for identifying the length thresh-old that yields tracks with significant association (FDR b 0.05).
To illustrate this, we calculated the length histograms for both posi-tive and negative local connectome associations with BMI using theCMU data set (Fig. 6d). The length histograms of negative associations(local connectomes decrease as BMI increases) show substantial differ-ences between the permuted and non-permuted distributions. Lengthslonger than 52, 42, and 31 mm correspond to FDRs of 0.05, 0.075, and0.10, respectively. By contrast, the length histograms of positive associ-ations (local connectomes increase as BMI increases) show substantialoverlap between permuted and non-permuted distributions, suggest-ing that the positive association between local connectome and BMIcannot be distinguished from random chance. We applied the sameconnectometry analysis for BMI-associations in the 488 subjects in theHCP sample. As with the CMU sample, the negative associations withBMI were more frequent in the HCP sample than the positive associa-tions. For the negatively associated local connectomes, lengths longerthan 14 mm correspond to an FDR of 0.05 (Fig. 6e), showing that alarge sample and a higher spatial resolution may increase the statisticalpower of connectometry to detect finer structural associations.
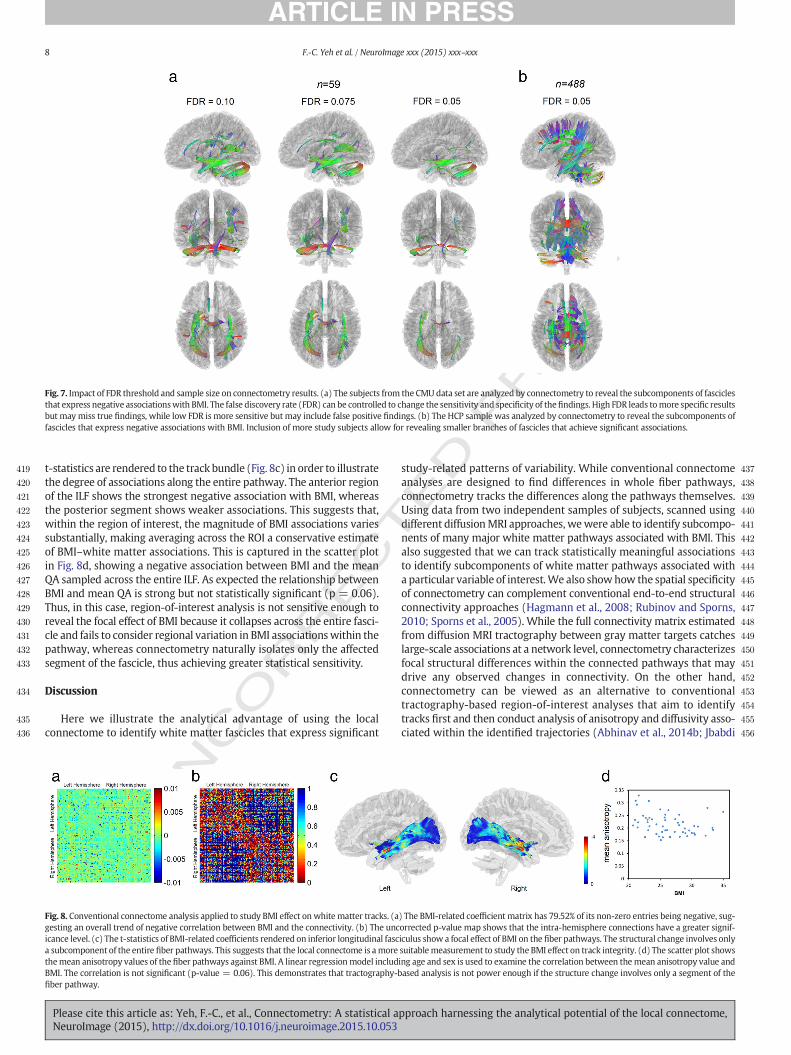
Since statistical power varies with sample size, the FDR thresholdcan be used to adjust the sensitivity and specificity of theconnectometry analysis when working with lower powered data.Using the CMU data set as an example, a high FDR affords better sensi-tivity for exploratory analysis, but it also increases false positive rates(e.g. FDR b 0.1 in Fig. 7a). A lower FDR offers a more specific result forconfirmation of the change in white matter structure; however, theresults may miss minor branches and has false negative results (e.g.FDR b 0.05 in Fig. 7a). Thus, the FDR adjustment offers the flexibilityfor different research purposes (e.g. exploratory or confirmative) by
pproach harnessing the analytical potential of the local connectome,
ECTED P
RO
OF
377
378
379
380
381
382
383
384
385
386
387
388
389
390
391
392
393
394
395
396
397
398
399
400
Fig. 5. The local connectome matrix of 59 subjects visualized. A local connectome matrix has a dimension of n-by-m, where n is the number of subjects, and m is the number of localconnectome, around 80,000 at 2-mm resolution and 900,000 at 1-mm resolution. The figure shows the matrix divided in multiple rows to facilitate visualization.
6 F.-C. Yeh et al. / NeuroImage xxx (2015) xxx–xxx
NCO
RReither controlling to a predefined threshold (e.g., 0.05) or using a
predefined length threshold (e.g., N40 mm) and returning the FDR atthat threshold. The FDR values can be affected by the image qualityand the number of subjects included in the analysis. Using the HCPdata set as an example, we show that with a larger subject pool and ahigher spatial resolution, we may capture the associations in short-ranged connections as FDR b 0.05 corresponds to lengths longer than14 mm (Fig. 7b).
Comparison with conventional diffusion MRI analyses
To illustrate how connectometrymay complement conventional ap-proaches, we applied variants of conventional end-to-end connectivity
UFig. 6. The result of connectometry examined by a randomized permutation test. (a) The red stihigh bodymass index. The spatial distribution of these local connectomes follows the hypothesagate along common fiber pathways. (b) A fiber tracking algorithm can be used to connect thesciations. (c) The connectometry results can be statistically tested by a permutation test. Theassociated with body mass index (BMI). Local connectomes that express negative associationsconnectomes can then be connected into “tracks” using a tracking algorithm to reveal the subcdition identifies several fiber pathways associated with BMI, whereas permuted local connectodifferentiate true and false findings. The false discovery rate can be calculated by the ratio of traCMU, the length histogram of tracks that express negative associations (non-permuted) is compcurves suggests that there are trackswith a substantial decrease of local connectome due to BMIapplied to study positive association with BMI. The length histogram shows substantial similarations between local connectome and BMI are no different from random effect. (e) In the 488associations (non-permuted) is comparedwith the null distribution (permuted). There is a largsociation with BMI. The positive associations between local connectome and BMI are no differ
Please cite this article as: Yeh, F.-C., et al., Connectometry: A statistical aNeuroImage (2015), http://dx.doi.org/10.1016/j.neuroimage.2015.10.053
at gray matter targets (Hagmann et al., 2008, 2010a, 2010b). The con-nectivity matrices of the CMU subjects were created using AutomatedAnatomical Labeling (AAL) atlas for cortical parcellation and the meanquantitative anisotropic (QA) value along the connecting trajectoriesas the matrix entry. The connectivity matrices were regressed againstBMI, age, and sex using linear regression to produce a new matrix ofpairwise BMI-associations. Although the BMI-related coefficient matrixin Fig. 8a shows no obvious correlation trend pattern between BMI andthe connectivity, the matrix has 79.52% of its non-zero entries beingnegative, suggesting an overall negative correlation between BMI andQA that is consistent with our connectometry results. The uncorrectedp-value map (Fig. 8b), in general, shows a greater significance level atthe intra-hemispheric connections (near the diagonal elements).
cks show local connectomeswith substantial decrease of local connectome associatedwithis that associations between local connectome patterns and study-relevant variables prop-e local connectomes into tracks to reveal the subcomponent of fascicles that express asso-permuted (upper row) and non-permuted (lower row) local connectome matrices arewith BMI are shown by colored sticks (blue: permuted red: non-permuted). These local
omponents of the fiber pathways that have negative associations. The non-permuted con-me matrix generates fragments of pathways. A simple length threshold can be applied tock count between non-permuted and permuted condition. (d) In 59-subject data set fromaredwith the null distribution (permuted). The large discrepancy between two histogram. The area ratio under two curves is false discovery rate of thefindings. The same analysis isity between permuted and non-permuted conditions, suggesting that the positive associ--subject data set from WU-Min HCP, the length histogram of tracks that express negativee discrepancy between permuted and non-permuted conditions, suggesting a negative as-ent from random effects.
pproach harnessing the analytical potential of the local connectome,
401
402
403
404
405
406
407
408
409
410
411
412
413
414
415
416
417
418
7F.-C. Yeh et al. / NeuroImage xxx (2015) xxx–xxx
However, the FDR of the most significant p-values is 0.1817, and analpha threshold of 0.05 will yield no significant pairwise associationsin the entire matrix, meaning that typical adjustments for multiplecomparisons would wipe out any BMI associations on end-to-endconnectivity. Nonetheless, the fact that BMI associates with individualpairwise connections suggests that topological properties of the matrix(e.g., associativity, centrality) also vary with BMI. This pattern ofend-to-end connectivity variation is consistent with the distributedpathways identified in the connectometry analysis, suggesting that
UNCO
RRECT
Please cite this article as: Yeh, F.-C., et al., Connectometry: A statistical aNeuroImage (2015), http://dx.doi.org/10.1016/j.neuroimage.2015.10.053
connectometry provides complementary details about which sub-components of connections within the fascicle are significantly asso-ciated with BMI.
We also compared our connectometry results to typicaltractography-based region of interest analysis. The inferior longitudinalfasciculus (ILF) was mapped using the CMU/BU 80 atlas, and the meanQA values along ILF were regressed with BMI, age, and sex. TheILF was chosen for illustrative purposes only due to its significant nega-tive BMI associations in the connectometry analysis. The BMI-associated
ED P
RO
OF
pproach harnessing the analytical potential of the local connectome,
T
PRO
OF
419
420
421
422
423
424
425
426
427
428
429
430
431
432
433
434
435
436
437
438
439
440
441
442
443
444
445
446
447
448
449
450
451
452
453
454
455
456
Fig. 7. Impact of FDR threshold and sample size on connectometry results. (a) The subjects from the CMU data set are analyzed by connectometry to reveal the subcomponents of fasciclesthat express negative associationswith BMI. The false discovery rate (FDR) can be controlled to change the sensitivity and specificity of thefindings. High FDR leads tomore specific resultsbut may miss true findings, while low FDR is more sensitive but may include false positive findings. (b) The HCP sample was analyzed by connectometry to reveal the subcomponents offascicles that express negative associations with BMI. Inclusion of more study subjects allow for revealing smaller branches of fascicles that achieve significant associations.
8 F.-C. Yeh et al. / NeuroImage xxx (2015) xxx–xxx
ORREC
t-statistics are rendered to the track bundle (Fig. 8c) in order to illustratethe degree of associations along the entire pathway. The anterior regionof the ILF shows the strongest negative association with BMI, whereasthe posterior segment shows weaker associations. This suggests that,within the region of interest, the magnitude of BMI associations variessubstantially, making averaging across the ROI a conservative estimateof BMI–white matter associations. This is captured in the scatter plotin Fig. 8d, showing a negative association between BMI and the meanQA sampled across the entire ILF. As expected the relationship betweenBMI and mean QA is strong but not statistically significant (p = 0.06).Thus, in this case, region-of-interest analysis is not sensitive enough toreveal the focal effect of BMI because it collapses across the entire fasci-cle and fails to consider regional variation in BMI associationswithin thepathway, whereas connectometry naturally isolates only the affectedsegment of the fascicle, thus achieving greater statistical sensitivity.
Discussion
Here we illustrate the analytical advantage of using the localconnectome to identify white matter fascicles that express significant
UNC
Fig. 8. Conventional connectome analysis applied to study BMI effect on white matter tracks. (agesting an overall trend of negative correlation between BMI and the connectivity. (b) The uncicance level. (c) The t-statistics of BMI-related coefficients rendered on inferior longitudinal fasca subcomponent of the entire fiber pathways. This suggests that the local connectome is amorethemean anisotropy values of the fiber pathways against BMI. A linear regressionmodel includBMI. The correlation is not significant (p-value = 0.06). This demonstrates that tractography-bfiber pathway.
Please cite this article as: Yeh, F.-C., et al., Connectometry: A statistical aNeuroImage (2015), http://dx.doi.org/10.1016/j.neuroimage.2015.10.053
EDstudy-related patterns of variability. While conventional connectome
analyses are designed to find differences in whole fiber pathways,connectometry tracks the differences along the pathways themselves.Using data from two independent samples of subjects, scanned usingdifferent diffusionMRI approaches, wewere able to identify subcompo-nents of many major white matter pathways associated with BMI. Thisalso suggested that we can track statistically meaningful associationsto identify subcomponents of white matter pathways associated witha particular variable of interest.We also showhow the spatial specificityof connectometry can complement conventional end-to-end structuralconnectivity approaches (Hagmann et al., 2008; Rubinov and Sporns,2010; Sporns et al., 2005). While the full connectivity matrix estimatedfrom diffusion MRI tractography between gray matter targets catcheslarge-scale associations at a network level, connectometry characterizesfocal structural differences within the connected pathways that maydrive any observed changes in connectivity. On the other hand,connectometry can be viewed as an alternative to conventionaltractography-based region-of-interest analyses that aim to identifytracks first and then conduct analysis of anisotropy and diffusivity asso-ciated within the identified trajectories (Abhinav et al., 2014b; Jbabdi
) The BMI-related coefficient matrix has 79.52% of its non-zero entries being negative, sug-orrected p-value map shows that the intra-hemisphere connections have a greater signif-iculus show a focal effect of BMI on the fiber pathways. The structural change involves onlysuitablemeasurement to study the BMI effect on track integrity. (d) The scatter plot showsing age and sex is used to examine the correlation between themean anisotropy value andased analysis is not power enough if the structure change involves only a segment of the
pproach harnessing the analytical potential of the local connectome,
T
457
458
459
460
461
462
463
464
465
466
467
468
469
470
471
472
473
474
475
476
477
478
479
480
481
482
483
484
485
486
487
488
489
490
491
492
493
494
495
496
497
498
499
500
501
502
503
504
505
506
507
508
509
510
511
512
513
514
515
516
517
518
519
520
521
522
523
524
525
526
527
528
529
530
531
532
533
534
535
536
537
538
539
540
541
542
543
544
545
546
547
548
549
550
551
552
553Q4
554
555
556
557
558
559
560
561
562
563
564
565
566
567
568
569
570
571572573574575576577578579580581582583584585
9F.-C. Yeh et al. / NeuroImage xxx (2015) xxx–xxx
UNCO
RREC
and Johansen-Berg, 2011). The tractography-based analysis produces amore conservative estimate of white matter associations that some-times inflates Type II error rates by averaging acrossmanywhitemattervoxels that may not have strong associations with the study variable ofinterest. By contrast, connectometry does not map the connectome it-self. It analyzes difference in local connectome, associates localconnectome with study variables, and then tracks the associationsacross a pathway. It is able to capture focal structural patterns in a sub-component of individual white matter fascicles, rather than the entirepathway itself. This provides a measure that is highly sensitive to re-gional variability in white matter and that can complement or informgraph-based connectomic analyses on the end-to-end connections.
Most diffusion MRI connectomics are conducted in a native subjectspace due to the methodological challenges in warping diffusion infor-mation to the stereotaxic space (Hagmann et al., 2010a, Hagmannet al., 2008, Hagmann et al., 2007, Hagmann et al., 2010b; Spornset al., 2005). Connectometry bridges this gap by using q-spacediffeomorphic reconstruction to reconstruct data directly in the stereo-taxic space, allowing for integrating voxel-wise diffusion models(e.g., SDFs) across subjects and data sets (e.g. different diffusionschemes). This approach also allows for greater integration of structuralanalyses with functional imaging data analyzed in MNI-space, even incases where fMRI data are collected on separate groups of subjects,opening the door to studying generalized structure–function relation-ships across studies.
Another advantage of connectometry is the atlas-based analysis ina standardized stereotaxic space. While atlas-based analysis has beenthe norm in fMRI for nearly two decades, there are only few studiesusing an atlas to analyze diffusion MRI measurements. Tract-basedspatial statistics (TBSS) (Smith et al., 2006) uses a “skeleton” to analyzefractional anisotropy (FA), a diffusion index derived from a tensormodel. The FA measure has been shown to reflect components of fiberintegrity (Huisman et al., 2004; Werring et al., 2000), but studies havealso shown that FA is susceptible to the partial volume of crossing fibers(Alexander et al., 2001, Alexander et al., 2002; Oouchi et al., 2007; Tuchet al., 2002; Yendiki et al., 2013). Amore recent study used a fiber orien-tation distribution (FOD) template to analyze streamline count at eachfiber direction (Raffelt et al., 2015), but whether stream count can bereliably correlated with the underlying anatomy has been put underquestion (Besseling et al., 2012; Jbabdi and Johansen-Berg, 2011; Joneset al., 2013). In comparison, connectometry uses the density of diffusionspins derived fromamodel free approach as the core diffusionmeasure-ment to reveal the compactness of fiber bundles (Yeh and Tseng, 2011;Yeh et al., 2013b). The density measurement is consistent acrossdifferent diffusion schemes (Yeh and Tseng, 2013; Yeh et al., 2010,2011), thus allowing connectometry to be applied to a variety of acqui-sition approaches, including conventional DTI, multi-shell diffusionimages, and DSI. This feature is critical for comparing results acrossmultiple studies and/or test sites. Connectometry also adopts a newparadigm—tracking the difference—to investigate the association ofthe diffusion measurement with a study variable. This paradigm isdifferent from the conventional paradigm that seeks to map corticalconnections (i.e. end-to-end connections) first and then study their as-sociations. Mapping end-to-end connections has been a challenge dueto methodological limitations (Jones et al., 2013; Reveley et al., 2015;Thomas et al., 2014), and a reliable and reproducible approach is stillunder active research. Connectometry bypasses this limitation by firstquantifying the local associations and tracking only a subcomponentof the fiber pathway that expresses substantial association. The lengthof the affected subcomponent is used as the statistical index to help dif-ferentiate true findings from false findings caused by misalignment.Connectometry is also highly extensible tomost regression frameworksdue to the independent and identically distributed (i.i.d.) feature ofthe local connectome matrix. The ordinary least squares regressionmodel used here can be replaced by sparse or non-linear regression ap-proaches for more precise results. Also, non-regression metrics such as
Please cite this article as: Yeh, F.-C., et al., Connectometry: A statistical aNeuroImage (2015), http://dx.doi.org/10.1016/j.neuroimage.2015.10.053
ED P
RO
OF
group mean difference, paired difference, or percentile rank test canalso be used to estimate the first state associations (Fig. 2b). Usingdifferent models, connectometry can examine associations betweentwo groups of subjects, or to examine the change before and after atreatment, or to compare the connectivity differences between an indi-vidual with a normal population. Having a well characterized distribu-tion of healthy normal variability in the normal local connectomecould allow connectometry to be used to identify the white matterareaswithpathological differences in clinical patientswith neurological,psychological, and psychiatric disorders, providing a quantifiable andpotential biomarker for white matter pathologies.While the initial con-cept of connectometry was proposed as a way of identifying pathologi-cal damage by comparing individuals with neurological damage to anormal population (Abhinav et al., 2014a, Abhinav et al., 2014b; Yehet al., 2013a), here we extend the approach to include a regressionmodel as a more general framework for group-wise, atlas-based com-parison. This enables us to study the effect of BMIwhile also consideringage and sex as the confounding factors. The extension can be applied toa large scale study that includes a complex set of demographic informa-tion to study the association between brain structure and a studyvariable.
In conclusion, we show how analyzing local connectomic patternscan be a powerful method for investigating variability in macroscopicwhite matter pathways. Connectometry can serve as a complementaryapproach for conventional structural connectomics. In the future,connectometry may further open the door to applying more sophisti-cated statistical models, such as machine learning classifiers, to investi-gate how brain structure associates with a study variable and highlightsa rich clinical potential connectometry as a classifier for clinicalpathologies.
Uncited references
Fernandez-Miranda et al., 2014Wang et al., 2013Yeatman et al., 2014
Acknowledgments
Data were provided in part by the Human Connectome Project,WU-Minn Consortium (D. Van Essen and K. Ugurbil, 1U54MH091657NIH). This research was sponsored by the Army Research Laboratoryand was accomplished under Cooperative Agreement NumberW911NF-10-2-0022 and NSF BIGDATA grant #1247658. The viewsand conclusions contained in this document are those of the authorsand should not be interpreted as representing the official policies, eitherexpressed or implied, of the Army Research Laboratory or the U.S.Government. The U.S. Government is authorized to reproduce anddistribute reprints for Government purposes notwithstanding anycopyright notation herein. This research was supported by an NSFBIGDATA Grant #1247658.
References
Abhinav, K., Yeh, F.C., El-Dokla, A., Ferrando, L.M., Chang, Y.F., Lacomis, D., Friedlander,R.M., Fernandez-Miranda, J.C., 2014a. Use of diffusion spectrum imaging in prelimi-nary longitudinal evaluation of amyotrophic lateral sclerosis: development of animaging biomarker. Front. Hum. Neurosci. 8, 270.
Abhinav, K., Yeh, F.C., Pathak, S., Suski, V., Lacomis, D., Friedlander, R.M., Fernandez-Miranda, J.C., 2014b. Advanced diffusion MRI fiber tracking in neurosurgical and neu-rodegenerative disorders and neuroanatomical studies: a review. Biochim. Biophys.Acta 1842, 2286–2297.
Akil, H., Martone,M.E., Van Essen, D.C., 2011. Challenges and opportunities inmining neu-roscience data. Science 331, 708–712.
Alexander, A.L., Hasan, K.M., Lazar, M., Tsuruda, J.S., Parker, D.L., 2001. Analysis of partialvolume effects in diffusion-tensor MRI. Magn. Reson. Med. 45, 770–780.
Alexander, D.C., Barker, G.J., Arridge, S.R., 2002. Detection and modeling of non-Gaussianapparent diffusion coefficient profiles in human brain data. Magn. Reson. Med. 48,331–340.
pproach harnessing the analytical potential of the local connectome,
T
586587588589590591592593594595596597598599600601602603604605606607608609610611612613614615616617618619620621622623624625626627628629630631632633634635636637638639640641642643644645646647648649650651652653654655656
657658659660661662663664665666667668669670671672673674675676677678679680681682683684685686687688689690691692693694695696697698699700701702703704705706707708709710711712713714715716717718719720721722723724725726
727
10 F.-C. Yeh et al. / NeuroImage xxx (2015) xxx–xxx
UNCO
RREC
Ashburner, J., Friston, K.J., 1999. Nonlinear spatial normalization using basis functions.Hum. Brain Mapp. 7, 254–266.
Besseling, R.M., Jansen, J.F., Overvliet, G.M., Vaessen, M.J., Braakman, H.M., Hofman, P.A.,Aldenkamp, A.P., Backes, W.H., 2012. Tract specific reproducibility of tractographybased morphology and diffusion metrics. PLoS One 7, e34125.
Biswal, B.B., Mennes, M., Zuo, X.N., Gohel, S., Kelly, C., Smith, S.M., Beckmann, C.F.,Adelstein, J.S., Buckner, R.L., Colcombe, S., Dogonowski, A.M., Ernst, M., Fair, D.,Hampson, M., Hoptman, M.J., Hyde, J.S., Kiviniemi, V.J., Kotter, R., Li, S.J., Lin, C.P.,Lowe, M.J., Mackay, C., Madden, D.J., Madsen, K.H., Margulies, D.S., Mayberg, H.S.,McMahon, K., Monk, C.S., Mostofsky, S.H., Nagel, B.J., Pekar, J.J., Peltier, S.J., Petersen,S.E., Riedl, V., Rombouts, S.A., Rypma, B., Schlaggar, B.L., Schmidt, S., Seidler, R.D.,Siegle, G.J., Sorg, C., Teng, G.J., Veijola, J., Villringer, A., Walter, M., Wang, L., Weng,X.C., Whitfield-Gabrieli, S., Williamson, P., Windischberger, C., Zang, Y.F., Zhang,H.Y., Castellanos, F.X., Milham, M.P., 2010. Toward discovery science of humanbrain function. Proc. Natl. Acad. Sci. U. S. A. 107, 4734–4739.
Bullmore, E., Sporns, O., 2009. Complex brain networks: graph theoretical analysis ofstructural and functional systems. Nat. Rev. Neurosci. 10, 186–198.
Craddock, R.C., Jbabdi, S., Yan, C.G., Vogelstein, J.T., Castellanos, F.X., Di Martino, A., Kelly,C., Heberlein, K., Colcombe, S., Milham, M.P., 2013. Imaging human connectomes atthe macroscale. Nat. Methods 10, 524–539.
DeFelipe, J., 2010. From the connectome to the synaptome: an epic love story. Science330, 1198–1201.
Dolgin, E., 2010. This is your brain online: the Functional Connectomes Project. Nat. Med.16, 351.
Fernandez-Miranda, J.C., Wang, Y., Pathak, S., Stefaneau, L., Verstynen, T., Yeh, F.C., 2014.Asymmetry, connectivity, and segmentation of the arcuate fascicle in the humanbrain. Brain Struct. Funct. 220, 1665–1680.
Fornito, A., Zalesky, A., Breakspear, M., 2015. The connectomics of brain disorders. Nat.Rev. Neurosci. 16, 159–172.
Gianaros, P.J., Marsland, A.L., Sheu, L.K., Erickson, K.I., Verstynen, T.D., 2013. Inflammatorypathways link socioeconomic inequalities to white matter architecture. Cereb. Cortex23, 2058–2071.
Hagmann, P., Kurant, M., Gigandet, X., Thiran, P., Wedeen, V.J., Meuli, R., Thiran, J.P., 2007.Mapping human whole-brain structural networks with diffusion MRI. PLoS One 2,e597.
Hagmann, P., Cammoun, L., Gigandet, X., Meuli, R., Honey, C.J., Wedeen, V.J., Sporns, O.,2008. Mapping the structural core of human cerebral cortex. PLoS Biol. 6, e159.
Hagmann, P., Cammoun, L., Gigandet, X., Gerhard, S., Grant, P.E., Wedeen, V., Meuli, R.,Thiran, J.P., Honey, C.J., Sporns, O., 2010a. MR connectomics: principles and chal-lenges. J. Neurosci. Methods 194, 34–45.
Hagmann, P., Sporns, O., Madan, N., Cammoun, L., Pienaar, R., Wedeen, V.J., Meuli, R.,Thiran, J.P., Grant, P.E., 2010b. White matter maturation reshapes structural connec-tivity in the late developing human brain. Proc. Natl. Acad. Sci. U. S. A. 107,19067–19072.
Honey, C.J., Sporns, O., Cammoun, L., Gigandet, X., Thiran, J.P., Meuli, R., Hagmann, P.,2009. Predicting human resting-state functional connectivity from structural connec-tivity. Proc. Natl. Acad. Sci. U. S. A. 106, 2035–2040.
Huisman, T.A., Schwamm, L.H., Schaefer, P.W., Koroshetz, W.J., Shetty-Alva, N., Ozsunar,Y., Wu, O., Sorensen, A.G., 2004. Diffusion tensor imaging as potential biomarker ofwhite matter injury in diffuse axonal injury. AJNR Am. J. Neuroradiol. 25, 370–376.
Jbabdi, S., Johansen-Berg, H., 2011. Tractography: where do we go from here? Brain Con-nect. 1, 169–183.
Johansen-Berg, H., Behrens, T.E., Robson, M.D., Drobnjak, I., Rushworth, M.F., Brady, J.M.,Smith, S.M., Higham, D.J., Matthews, P.M., 2004. Changes in connectivity profiles de-fine functionally distinct regions in humanmedial frontal cortex. Proc. Natl. Acad. Sci.U. S. A. 101, 13335–13340.
Jones, D.K., Knosche, T.R., Turner, R., 2013. White matter integrity, fiber count, and otherfallacies: the do's and don'ts of diffusion MRI. NeuroImage 73, 239–254.
Mueller, K., Anwander, A., Moller, H.E., Horstmann, A., Lepsien, J., Busse, F., Mohammadi,S., Schroeter, M.L., Stumvoll, M., Villringer, A., Pleger, B., 2011. Sex-dependent influ-ences of obesity on cerebral white matter investigated by diffusion-tensor imaging.PLoS One 6, e18544.
Nichols, T.E., Holmes, A.P., 2002. Nonparametric permutation tests for functional neuro-imaging: a primer with examples. Hum. Brain Mapp. 15, 1–25.
Oouchi, H., Yamada, K., Sakai, K., Kizu, O., Kubota, T., Ito, H., Nishimura, T., 2007. Diffusionanisotropy measurement of brain white matter is affected by voxel size: underesti-mation occurs in areas with crossing fibers. AJNR Am. J. Neuroradiol. 28, 1102–1106.
Otsu, N., 1979. A threshold selection method from gray-level histograms. IEEE Trans. Syst.Man Cybern. 9, 62–66.
Pestilli, F., Yeatman, J.D., Rokem, A., Kay, K.N., Wandell, B.A., 2014. Evaluation and statisti-cal inference for human connectomes. Nat. Methods 11, 1058–1063.
Please cite this article as: Yeh, F.-C., et al., Connectometry: A statistical aNeuroImage (2015), http://dx.doi.org/10.1016/j.neuroimage.2015.10.053
ED P
RO
OF
Raffelt, D.A., Smith, R.E., Ridgway, G.R., Tournier, J.D., Vaughan, D.N., Rose, S., Henderson,R., Connelly, A., 2015. Connectivity-based fixel enhancement: whole-brain statisticalanalysis of diffusion MRI measures in the presence of crossing fibres. NeuroImage117, 40–55.
Reveley, C., Seth, A.K., Pierpaoli, C., Silva, A.C., Yu, D., Saunders, R.C., Leopold, D.A., Ye, F.Q.,2015. Superficial white matter fiber systems impede detection of long-range corticalconnections in diffusion MR tractography. Proc. Natl. Acad. Sci. U. S. A. 112,E2820–E2828.
Rubinov, M., Sporns, O., 2010. Complex networkmeasures of brain connectivity: uses andinterpretations. NeuroImage 52, 1059–1069.
Seung, H.S., 2011. Neuroscience: towards functional connectomics. Nature 471, 170–172.Smith, S.M., Jenkinson, M., Johansen-Berg, H., Rueckert, D., Nichols, T.E., Mackay, C.E.,
Watkins, K.E., Ciccarelli, O., Cader, M.Z., Matthews, P.M., Behrens, T.E., 2006. Tract-based spatial statistics: voxelwise analysis of multi-subject diffusion data.NeuroImage 31, 1487–1505.
Sotiropoulos, S.N., Jbabdi, S., Xu, J., Andersson, J.L., Moeller, S., Auerbach, E.J., Glasser, M.F.,Hernandez, M., Sapiro, G., Jenkinson, M., Feinberg, D.A., Yacoub, E., Lenglet, C., VanEssen, D.C., Ugurbil, K., Behrens, T.E., 2013. Advances in diffusion MRI acquisitionand processing in the Human Connectome Project. NeuroImage 80, 125–143.
Sporns, O., 2013. The human connectome: origins and challenges. NeuroImage 80, 53–61.Sporns, O., 2014a. Contributions and challenges for network models in cognitive neuro-
science. Nat. Neurosci. 17, 652–660.Sporns, O., 2014b. Towards network substrates of brain disorders. Brain 137, 2117–2118.Sporns, O., Tononi, G., Kotter, R., 2005. The human connectome: a structural description of
the human brain. PLoS Comput. Biol. 1, e42.Stanek, K.M., Grieve, S.M., Brickman, A.M., Korgaonkar, M.S., Paul, R.H., Cohen, R.A.,
Gunstad, J.J., 2011. Obesity is associated with reduced white matter integrity in oth-erwise healthy adults. Obesity (Silver Spring) 19, 500–504.
Thomas, C., Ye, F.Q., Irfanoglu, M.O., Modi, P., Saleem, K.S., Leopold, D.A., Pierpaoli, C., 2014.Anatomical accuracy of brain connections derived from diffusion MRI tractography isinherently limited. Proc. Natl. Acad. Sci. U. S. A. 111, 16574–16579.
Tuch, D.S., Reese, T.G., Wiegell, M.R., Makris, N., Belliveau, J.W., Wedeen, V.J., 2002. Highangular resolution diffusion imaging reveals intravoxel white matter fiber heteroge-neity. Magn. Reson. Med. 48, 577–582.
Turk-Browne, N.B., 2013. Functional interactions as big data in the human brain. Science342, 580–584.
Verstynen, T.D., Weinstein, A.M., Schneider, W.W., Jakicic, J.M., Rofey, D.L., Erickson, K.I.,2012. Increased body mass index is associated with a global and distributed decreasein white matter microstructural integrity. Psychosom. Med. 74, 682–690.
Verstynen, T.D., Weinstein, A., Erickson, K.I., Sheu, L.K., Marsland, A.L., Gianaros, P.J., 2013.Competing physiological pathways link individual differences in weight and abdom-inal adiposity to white matter microstructure. NeuroImage 79, 129–137.
Wang, Y., Fernandez-Miranda, J.C., Verstynen, T., Pathak, S., Schneider, W., Yeh, F.C., 2013.Rethinking the role of themiddle longitudinal fascicle in language and auditory path-ways. Cereb. Cortex 23, 2347–2356.
Wedeen, V.J., Rosene, D.L., Wang, R., Dai, G., Mortazavi, F., Hagmann, P., Kaas, J.H., Tseng,W.Y., 2012. The geometric structure of the brain fiber pathways. Science 335,1628–1634.
Werring, D.J., Toosy, A.T., Clark, C.A., Parker, G.J., Barker, G.J., Miller, D.H., Thompson, A.J.,2000. Diffusion tensor imaging can detect and quantify corticospinal tract degenera-tion after stroke. J. Neurol. Neurosurg. Psychiatry 69, 269–272.
Yeatman, J.D., Weiner, K.S., Pestilli, F., Rokem, A., Mezer, A., Wandell, B.A., 2014. The ver-tical occipital fasciculus: a century of controversy resolved by in vivo measurements.Proc. Natl. Acad. Sci. U. S. A. 111, E5214–E5223.
Yeh, F.C., Tseng, W.Y., 2011. NTU-90: a high angular resolution brain atlas constructed byq-space diffeomorphic reconstruction. NeuroImage 58, 91–99.
Yeh, F.C., Tseng, W.Y., 2013. Sparse solution of fiber orientation distribution function bydiffusion decomposition. PLoS One 8, e75747.
Yeh, F.C., Wedeen, V.J., Tseng, W.Y., 2010. Generalized q-sampling imaging. IEEE Trans.Med. Imaging 29, 1626–1635.
Yeh, F.C., Wedeen, V.J., Tseng, W.Y., 2011. Estimation of fiber orientation and spin densitydistribution by diffusion deconvolution. NeuroImage 55, 1054–1062.
Yeh, F.C., Tang, P.F., Tseng, W.Y., 2013a. Diffusion MRI connectometry automaticallyreveals affected fiber pathways in individuals with chronic stroke. NeuroImage Clin.2, 912–921.
Yeh, F.C., Verstynen, T.D., Wang, Y., Fernandez-Miranda, J.C., Tseng, W.Y., 2013b. Deter-ministic diffusion fiber tracking improved by quantitative anisotropy. PLoS One 8,e80713.
Yendiki, A., Koldewyn, K., Kakunoori, S., Kanwisher, N., Fischl, B., 2013. Spurious groupdifferences due to head motion in a diffusion MRI study. NeuroImage 88C, 79–90.
pproach harnessing the analytical potential of the local connectome,