consequences of global warming and metal pollution on the...
TRANSCRIPT

2017
UNIVERSIDADE DE LISBOA
FACULDADE DE CIÊNCIAS
DEPARTAMENTO DE BIOLOGIA VEGETAL
Consequences of Global Warming and Metal Pollution on the
metabolism of omega-3 and -6 fatty acids of Phaeodactylum
tricornutum
Eduardo Miguel Onofre Feijão
Mestrado em Biologia Molecular e Genética
Dissertação orientada por:
Doutora Carla Gameiro
Professora Doutora Ana Rita Matos


I
Declaração
De acordo com o disposto no artigo n.º 19 do Regulamento de Estudos de Pós – Graduação da
Universidade de Lisboa, Despacho n.º 2950/2015, publicado no Diário da República, 2.ª série — N.º 57
— 23 de março de 2015, foram incluídos nesta dissertação resultados das seguintes publicações:
1 - Feijão, E., Gameiro, C., Duarte, B., Caçador, I., Cabrita, M.T., Matos, A.R., 2017. Consequences of
global warming and metal pollution on the metabolism of omega-3 and -6 fatty acids of Phaeodactylum
tricornutum. The 3rd general meeting of COST action FA1306 with the title "Field phenotyping
technologies from woody perennials to annual crops". Poster available at: https://www.plant-
phenotyping.org/about_3rd_general_meeting
2 - Feijão, E., Gameiro, C., Franzitta, M., Duarte, B., Caçador, I., Cabrita, M.T., Matos, A.R., 2017.
Heat wave impacts on the model diatom Phaeodactylum tricornutum: Searching for photochemical and
fatty acid biomarkers of thermal stress. Ecological Indicators. (in press)
doi:10.1016/j.ecolind.2017.07.058
Em cumprimento com o disposto no referido despacho, esclarece-se ser da minha responsabilidade a
execução das experiências que estiverem na base dos resultados apresentados (exceto quando referido
em contrário), assim como a interpretação e discussão dos mesmos.
Este trabalho específico foi abrangido pela o projeto Hg- Planktartic, parte do Programa Polar Português
(PROPOLAR, financiado pela FCT).
Lisboa, 28 de Setembro de 2017
Eduardo Miguel Onofre Feijão

II
Agradecimentos
Eu gostaria de agradecer à Doutora Carla Gameiro e à Professora Ana Rita Matos pelo suporte
continuado e orientação durante este último ano. A Doutora Carla Gameiro ensinou-me tudo sobre meios
de crescimento e técnicas de contagem de células. A Professora Ana Rita Matos permitiu-me trabalhar
no laboratório do Grupo de Biologia Funcional de Plantas do Instituto de Biossistemas e Ciências
Integrativas (C2.4.27/28, FCUL) onde aprofundei os meus conhecimentos sobre o metabolismo de
lípidos e técnicas de biologia molecular. A ambas eu gostaria de agradecer por me terem dado esta
oportunidade de trabalhar no projeto que juntas desenvolveram. Gostaria de agradecer ao Doutor
Bernardo Duarte por me ter ajudado a aprofundar o meu conhecimento em fotossíntese e técnicas de
análise de fluorescência da clorofila e à Doutora Teresa Cabrita pelo apoio nas culturas celulares. Sem
o envolvimento e apoio de ambos esta tese não teria sido possível. A todos os mencionados acima, um
muito obrigado pelo apoio na elaboração e publicação do meu primeiro artigo.
Gostaria de agradecer à Daniela Ferreira, ao Miguel ‘migagas do mal’ Gaspar e ao Marco Franzitta com
dois T’s por toda a palhaçada durante as horas de almoço.
Dona Manuela ‘Nela’ Lucas, a melhor amiga, conselheira e mãe de laboratório que alguém podia ter.
Obrigado pelas plantas, pelos conselhos e pelo chocolate.
Gostaria também de agradecer a todos os professores e investigadores do laboratório porque também
eles ajudaram a que o ambiente de trabalho fosse tão acolhedor.
Numa nota mais privada, gostaria de agradecer aos meus pais e ‘maninha’ por todo o esforço que têm
feito para eu conseguir avançar nos estudos. Muitas vezes ficam mais orgulhosos das minhas conquistas
do que eu. Não posso também esquecer de agradecer aos meus amigos que também ajudaram a esquecer
os momentos de trabalho quando nem tudo estava a correr bem.
A todos,
Obrigado!

III
Table of contents
Declaração............................................................................................................................................... I
Agradecimentos ..................................................................................................................................... II
Resumo ................................................................................................................................................. V
Palavras-chave .................................................................................................................................... VII
Summary ............................................................................................................................................. VII
Keywords ............................................................................................................................................ VIII
Abbreviations ........................................................................................................................................ IX
List of tables and figures ...................................................................................................................... XII
1. Introduction ....................................................................................................................................... 1
2. Materials and methods ...................................................................................................................... 4
2.1. Experiment set-up........................................................................................................................ 4
2.2. Cell growth rates ......................................................................................................................... 4
2.3. Oxygen evolution rates ................................................................................................................ 4
2.4. Pulse Amplitude Modulated (PAM) Fluorometry ....................................................................... 5
2.5. Pigment analysis .......................................................................................................................... 5
2.6. Fatty acid and Lipid classes analysis ........................................................................................... 5
2.6.1. Extraction of Total Fatty Acids ............................................................................................ 5
2.6.2. Gas Chromatography and Thin-layer Chromatography ........................................................ 6
2.7. Quantification of lipid peroxidation products .............................................................................. 6
2.8. Gene expression analysis ............................................................................................................. 6
2.8.1. RNA extraction ..................................................................................................................... 6
2.8.2. cDNA Synthesis ................................................................................................................... 7
2.8.3. Real-time PCR analysis ........................................................................................................ 7
2.9. Statistical analysis ....................................................................................................................... 7
3. Results ................................................................................................................................................ 8
3.1. Growth parameters ...................................................................................................................... 8
3.2. Photosynthetic and respiratory rates ............................................................................................ 8
3.3. PAM fluorometry ........................................................................................................................ 9
3.4. Pigment analysis ........................................................................................................................ 10
3.5. Fatty acid and Lipid classes analysis ......................................................................................... 12
3.6. Lipid peroxidation products ....................................................................................................... 16
3.7. Gene expression ........................................................................................................................ 16
4. Discussion ......................................................................................................................................... 17

IV
5. Conclusions ...................................................................................................................................... 22
6. References ........................................................................................................................................ 23
7. Supplementary data ......................................................................................................................... 30

V
Resumo
Atividades antropogénicas tais como o consumo de combustíveis fósseis ou a desflorestação induzem a
emissão de gases de efeito de estufa para a atmosfera, aumentando a já existente barreira natural à
dissipação do calor terrestre para o espaço, que sendo aprisionado leva a um aumento da temperatura
média da superfície da terra – o Aquecimento Global. De acordo com o Painel Intergovernamental para
as Alterações Climáticas (IPCC), o planeta Terra está a sofrer um aumento no número de eventos
térmicos extremos, mais concretamente ondas de calor, que apresentam duração e intensidade cada vez
maiores. As ondas de calor, embora tenham a sua maior expressão em termos de subida da temperatura
do ar, tendem também a aumentar a temperatura dos oceanos tal como ocorreu em 2005 durante uma
onda de calor, em que a água superficial do estuário do Tejo atingiu os 26 ºC.
No que diz respeito à poluição dos oceanos por metais pesados, esta tende a ser igualmente potenciada
por atividades antropogénicas como realização crescente de dragagens, atividade industrial, metalúrgica
e o uso de pesticidas na agricultura que deixam em suspensão metais pesados como o cobalto, o cobre,
o zinco, o mercúrio, o chumbo e o níquel, capazes de atingir facilmente a coluna de água. Estes dois
fatores de stress abiótico têm um impacto negativo nos ecossistemas expondo os organismos a condições
subótimas.
O fitoplânton marinho é frequentemente dominado por diatomáceas e por esse motivo estas têm uma
grande importância como produtores primários nos oceanos. As diatomáceas apresentam uma grande
biodiversidade. Sendo na sua maioria dotadas de atividade fotossintética (autotróficas) estão na base da
cadeia trófica, estimando-se que sejam responsáveis por 20 % da produção primária global. Entre as
moléculas de maior importância produzidas pelas microalgas estão os ácidos gordos essenciais como os
ómega-3 e -6, ácidos linoénico e linoleico, que através de sucessivas reações de elongação e
dessaturação dão origem a ácidos gordos polinsaturados de cadeia longa. Entre eles estão os ácidos
eicosapentaenóico (EPA) e docosa-hexaenóico (DHA), ambos ómega-3, com elevada importância na
saúde cardiovascular e cerebral, tal como em várias funções membranares e celulares. Uma vez que nos
humanos, tal como em muitos animais, a taxa biossintética de EPA e DHA é pouco eficaz, a obtenção
destes ácidos gordos é apenas alcançada através da dieta.
A diatomácea modelo Phaeodactylum tricornutum é uma microalga que pode apresentar quatro
morfologias distintas - oval, fusiforme, triradiada e cruciforme. Esta espécie tem a capacidade de uma
interconversão de morfologias normalmente induzida por estímulos ambientais. Por ser uma espécie
com o genoma já sequenciado, tolerante a inúmeros stresses e capaz de produzir uma quantidade
significativa de EPA, o P. tricornutum é um bom modelo para a realização de estudos visando elucidar
os mecanismos genéticos, metabólicos e fisiológicos relacionados com a sua capacidade de resistência
a stresses ambientais.
O principal objetivo desta dissertação foi avaliar o impacto de uma onda de calor, e da poluição por
metais pesados, mais concretamente, por níquel, no crescimento, fotossíntese, metabolismo dos ácidos
gordos omega-3 e -6 e expressão de genes em P. tricornutum.
Após a realização de alguns ensaios preliminares visando o estabelecimento do protocolo experimental
a seguir, o estudo fez uso de técnicas não-destrutivas como a medição polarográfica da concentração de
oxigénio com elétrodo do tipo Clark e fluorometria PAM que avaliam taxas de consumo de oxigénio e
fluorescência da clorofila a, respetivamente; e técnicas bioquímicas e moleculares como cromatografia
gasosa e de camada fina e PCR quantitativo, permitindo avaliar a composição lipídica e a expressão de
genes do metabolismo lipídico e fotossintético.
VI
A exposição a níquel não se revelou tão nefasta como o efeito do aumento da temperatura ou o efeito
combinado de ambos os stresses. Com o aumento da concentração de Ni, o P. tricornutum apresentou
uma taxa de crescimento com menor acumulação de biomassa. Embora as taxas de produção de O2
tenham sido menores, a eficiência do fotossistema II (PSII) e as taxas de transporte eletrónico
permaneceram inalteradas na concentração mais elevada do metal. Os conteúdos em pigmentos
fotossintéticos e carotenoides, como a clorofila a e a fucoxantina, respetivamente, diminuíram,
sugerindo que a taxa fotossintética baixa poderá ter estado relacionada com alterações na concentração
de pigmentos. O aumento da temperatura de crescimento para 26 ºC, durante 3 dias após o início da fase
exponencial, demonstrou ter consequências severas na taxa fotossintética, diminuindo não só a taxa de
produção de O2 mas também a eficiência do PSII. Observou-se uma maior atividade do lado dador do
PSII, onde ocorre a fotólise da água, o que levou a uma absorção excessiva de energia, que não terá sido
devidamente transportada através da cadeia transportadora de eletrões, sendo por isso dissipada. De
forma a evitar danos causados por espécies reativas de oxigénio e compensar a eficiência baixa do PSII,
verificou-se um aumento de carotenoides (fucoxantina, diadinoxantina e diatoxantina) e pigmentos
fotossintéticos como a clorofila a. Ao expor a cultura de P. tricornutum simultaneamente aos dois tipos
de stress, verificou-se o aumento na intensidade dos danos, assim como alterações mais severas no
metabolismo lipídico.
A exposição do P. tricornutum a temperaturas de crescimento elevadas e combinadas com a exposição
a concentrações elevadas de Ni levou a uma diminuição na percentagem do ómega-3 ácido
eicosapentaenóico (EPA) (~30 % vs ~18 %), que se fez sentir igualmente nas classes lipídicas que
compõem as membranas dos tilacoides, principalmente no monogalactosildiacilglicerol (MGDG). O
stress combinado levou, por outro lado a um aumento de ácidos gordos saturados (C16:0) e
monoinsaturados (C16:1), abundantes nos lípidos de reserva. Como consequência destas alterações o
índice de duplas ligações, que é um indicador da fluidez da membrana, tendeu a diminuir e o rácio
ómega-6 / ómega-3 a aumentar o que causou uma diminuição do valor nutricional da diatomácea. O
conteúdo em ácidos gordos totais aumentou em resposta aos tratamentos testados, sendo esta, uma
resposta característica em condições de stress que induzem um desvio do metabolismo fotossintético
ótimo, e a respetiva acumulação de açúcares. Enquanto a exposição ao Ni levou a uma diminuição da
abundância em MGDG, devido à ação de fosfolipases A com atividade galactolipásica, a exposição à
onda de calor, levou a um aumento deste lípido, provavelmente como consequência de uma maior
expressão do gene que codifica a MGDG sintetase, responsável pela sua biossíntese. Igualmente, em
resposta ao aumento da temperatura, uma diminuição da quantidade de fosfatidilglicerol, foi observada,
uma resposta característica de tilacoides senescentes, e uma correspondente compensação em
sulfoquinovosildiacilglicerol (ambos aniónicos). O estudo da expressão génica revelou uma maior
abundância de transcritos de duas dessaturases de ácidos gordos (Δ6 e Δ5), que se pensa estarem
envolvidas nos passos finais das vias biossintéticas do C16:3 e C20:5, respetivamente. Embora a
percentagem de C16:3 aumente na classe MGDG, a abundância de C20:5 não, o que pode revelar
regulações pós-transcricionais ou inibição da atividade enzimática. A expressão génica da anidrase
carbónica, responsável pelo transporte de CO2 para a Rubisco aumentou nos organismos expostos a
26 ºC, possivelmente de forma a favorecer a atividade da Rubisco, inibida a temperaturas crescentes.
Comparando os resultados da análise de consumo de oxigénio com os dados referentes à fotobiologia
dos organismos, foi possível concluir que a capacidade de oxigenação da água do mar pelo
P.- tricornutum será negativamente afetada quando sujeito ao stresses analisados.
A análise integrada de métodos biofísicos, bioquímicos e moleculares permitiu aprofundar o
conhecimento sobre os mecanismos de defesa do P. tricornutum quando exposto a stresses térmicos e a
metais pesados. Ao longo desta dissertação foram discutidos os prováveis impactos destes stresses mas
também propostos possíveis biomarcadores de stress térmico e de exposição ao Ni, tais como a

VII
eficiência do PSII, a abundância de ácidos gordos C16:0 e EPA e o rácio ómega-6 / ómega-3. O valor
da diatomácea P. tricornutum como espécie sentinela foi mais uma vez confirmado e o seu uso
biotecnológico para produção de lípidos para biodiesel ou aquacultura ou fucoxantina para uso
farmacêutico e nutricional apresenta um caráter promissor para estudos futuros.
Palavras-chave: Aquecimento global, EPA, Fotossíntese, Níquel, Phaeodactylum tricornutum
Summary
Global warming and heavy metal pollution are being aggravated by anthropogenic activities. The
average atmospheric temperature is increasing and the once rare thermal events are becoming more
frequent. Since the 1980s, the Mediterranean, more specifically the Iberian Peninsula, has been subject
to phenomena such as heat waves that have become increasingly frequent with longer duration and
intensity. These events mainly affect air temperature, but the surface of the sea water has slightly
increased in recent years, and the surface water of the Tagus estuary reached 26 °C during the
particularly hot summer of 2005. In addition to heavy metal pollution, these heat waves can induce
stresses with harmful consequences for organisms and ecosystems that are forced to live in sub-optimal
conditions.
The objective of this dissertation was to evaluate the impact of a heat wave of similar magnitude of the
one felt in 2005 in the Tagus estuary and pollution by heavy metals, more specifically, by nickel, in the
growth, photosynthesis, metabolism of omega-3 and -6 fatty acids and gene expression of
Phaeodactylum tricornutum, a model diatom that is one of the components of the estuarine ecosystem
basis. For this, the physiological performance of Phaeodactylum tricornutum cells at two temperatures
- control (18 ° C) and heat wave (26 °C, for 3 days) - and exposure to three concentrations of nickel - 1,
2 and 5 μg L-1 was assessed through nondestructive methods such as PAM fluorometry and biochemical
methods such as gas- and thin layer chromatography and quantitative PCR.
The results suggested that the effect of nickel and a temperature increase differently affected
photosynthesis. While nickel did not affect the efficiency of photosystem II at the highest concentrations,
there was a decrease in the abundance of the main photosynthetic pigments - chlorophyll a and the
carotenoid fucoxanthin, reducing the rate of O2 production. The temperature rise caused a decrease in
the efficiency of photosystem II (PSII) and an increase in the activity of its donor side where the
complexes involved in the water photolysis can be found. Also observed was a decrease in the quality
of the electron transport, which lead to an increase of absorbed energy dissipation. Moreover, an
increased concentration of the photosynthetic pigments, such as chlorophyll a, was observed, as a
possible compensation mechanism due to the low efficiency of PSII and an increase of carotenoids such
as diatoxanthin involved in the protection against reactive oxygen species. The combined effect of both
stresses caused the most severe damage to lipid metabolism. There was a decrease in eicosapentaenoic
acid (EPA) abundance, double bond index and an increase in the value of the ratio inversely related to
the nutritional value (omega-6 / omega-3 ratio). There were also changes in the abundance of the lipid
classes that build thylakoid membranes and in their composition - such as a decrease of EPA in
monogalactosyldiacylglycerol (MGDG), decrease of phosphatidylglycerol and variations in abundance
of MGDG and digalactosyldiacylglycerol. Those results were supported by gene expression analyses of
enzymes related to the synthesis and degradation of lipids via quantitative PCR. The temperature rise
induced an increase in the gene expression of MGDG synthase and the desaturase responsible for the

VIII
synthesis of C16:3 in MGDG also increased its expression, in agreement with the increasing abundance
of this fatty acid in this lipid class.
Possible impacts of metal pollution and heat waves on the ecosystems and trophic chains were proposed.
Also, possible biomarkers of thermal stress and heavy metals were identified, such as photosystem II
efficiency, abundance of C16:0 and EPA fatty acids and the omega-6 / omega-3 ratio. The value of
P. tricornutum as a sentinel species has again been confirmed and its biotechnological value for
biodiesel production or fucoxanthin synthesis for pharmaceutical and nutritional purposes showed to be
promising features for future studies.
Keywords: EPA, Global warming, Nickel, Phaeodactylum tricornutum, Photosynthesis

IX
Abbreviations
AOEC – Activated oxygen-evolving complex
ASQ – Acyl-SQDG
C14:0 – Myristic acid
C16:0 – Palmitic acid
C16:1 – Palmitoleic acid
C16:2n-4 – Hexadecadienoic acid
C16:2n-7 – Hexadecadienoic acid
C16:3 – Hexadecatrienoic acid
C16:4 – Hexadecatetraenoic acid
C18:3 – γ-linolenic acid
C18:4 – Stearidonic acid
C20:4 – Arachidonic acid
C20:5 – Eicosapentaenoic acid
C22:6 – Docosahexaenoic acid
CA-7 – Carbonic anhydrase 7
cDNA – Complementary DNA
Chl – Chlorophyll
DAG – Diacylglycerol
DBI – Double bond index
Ddx – Diadinoxanthin
DES – Deepoxidation state
DGAT – Diacylglycerol acyl transferase
DGDG – Digalactosyldiacylglycerol
DHA – Docosahexaenoic acid
Dtx – Diatoxanthin
EFA – Essential fatty acids
Elo – Elongase
EPA – Eicosapentaenoic acid
ER – Endoplasmic Reticulum
FA – Fatty acid

X
FAD – Fatty Acid Desaturase
FAMEs – Fatty acid methyl esters
FAS – Fatty acid synthase
FCP – Fucoxanthin-chlorophyll protein
Fx – Fucoxanthin
GC-FID – Gas chromatography-flame ionization detection
GPS – Gauss-Peak spectra
IPCC – The Intergovernmental Panel on Climate Change
LC – Light Curve
LC - PUFA – Long Chain - Polyunsaturated fatty acids
MDA – Malondialdehyde
MGDG – Monogalactosyldiacylglycerol
NL – Neutral lipids
NPQ – Non-photochemical quenching
OECD – Organization for Economic Cooperation and Development
PAM Fluorometry – Pulse Amplitude Modulated Fluorometry
PAR – Photon flux density
PC – Phosphatidylcholine
PE – Phosphatidylethanolamine
PG – Phosphatidylglycerol
PI – Phosphatidylinositide
PLA2 – Phospholipase A2
PNPLA 3 – Patatin-like phospholipase domain-containing protein 3
PSII – Photosystem II
QA – Quinone A
QB – Quinone B
qPCR – Quantitative Polymerase chain reaction
RC – Reaction centres
RLC – Rapid light curves
ROS – Reactive oxygen species
Rubisco – Ribulose-1,5-bis-phosphate carboxylase/oxygenase

XI
SQDG – Sulfoquinovosyldiacylglycerol
TAG – Triacylglycerol
TBARS – Thiobarbituric acid reactive substances
TBP – Tata Box binding protein
TCA – Trichloroacetic acid
TLC – Thin layer chromatography
WMO – World Meteorological Organization

XII
List of tables and figures
Figure 1.1 – Phaeodactylum tricornutum cell cultures (left) and fusiform morphotype (right).
Fusiform morphotype microscopy image was published on DiatomCyc (v1.0), an online database of
P. tricornutum.
Figure 1.2 – Overview of the metabolic fatty acid synthesis pathways in P. tricornutum. Prokaryotic
and eukaryotic pathways are represented in green and blue, respectively, and the enzymes involved
include elongases (Elo) and desaturases (ΔD) which are represented in purple. Putative genes and
enzymes encoded by genes already identified are marked in red and bold, respectively. Question marks
indicate that the reaction and respective enzymes are not predicted. Red circles mark desaturases
analysed in this dissertation. This figure was published by Mühlroth et al. (2013).
Figure 3.1 – Growth parameters of P. tricornutum grown at 18 °C (black) and exposed to a heat
wave treatment (26 °C, for three days) (grey) with increasing nickel concentrations (1, 2 and
5 µg L-1). A) Specific growth rate; B) Relative abundance of clamps (aggregates of more than two cells);
C) Fresh weight. Values correspond to average ± standard errors, n = 3; asterisks indicate significant
differences between treatments and control cultures grown at 18 ºC without nickel (p ≤ 0.05).
Figure 3.2 – Photosynthetic and respiratory O2 flux rates of P. tricornutum grown at 18 °C (black)
and exposed to a heat wave treatment (26 °C, for three days) (grey) with increasing nickel
concentrations (1, 2 and 5 µg L-1). A) Photosynthetic rate; B) Respiration rate. Values correspond to
average ± standard error, n = 3; asterisks indicate significant differences between treatments and control
cultures grown at 18 °C without nickel (p ≤ 0.05).
Table 3.1 – Rapid Light Curves (RLC) and JIP- derived parameters in samples of P. tricornutum
grown at 18 °C and exposed to a heat wave (26 °C, for three days) with increasing nickel
concentrations (1, 2 and 5 µg L-1). Values correspond to average of n = 3 samples; Bold values indicate
significant differences between treatments and control cultures grown at 18 ºC without nickel exposure
(p ≤ 0.05). Abbreviations in appearance order include: α (photosystem II efficiency), ETRmax (maximum
relative electron transport), β (photoinhibition parameter); AOECs (activated oxygen-evolving
complexes), Area (pool of oxidized quinones), N (Number of electrons transferred into the electron
transport chain), SM (energy needed to close all reaction centres), PG (grouping probability, a direct
measure of the connectivity between PSII antennae). Other meanings to each parameter can be found in
supplemental Table S1.
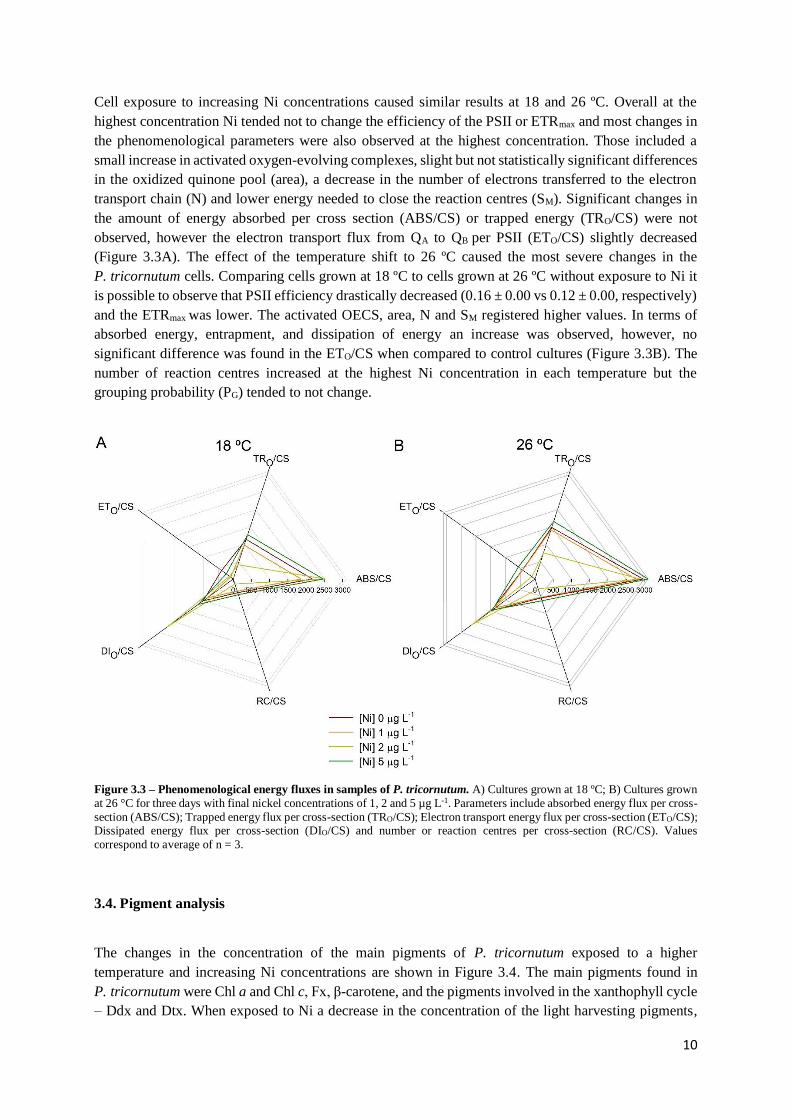
Figure 3.3 – Phenomenological energy fluxes in samples of P. tricornutum. A) Cultures grown at
18 ºC; B) Cultures grown at 26 °C for three days with final nickel concentrations of 1, 2 and 5 µg L-1.
Parameters include absorbed energy flux per cross-section (ABS/CS); Trapped energy flux per cross-
section (TRO/CS); Electron transport energy flux per cross-section (ETO/CS); Dissipated energy flux per
cross-section (DIO/CS) and number or reaction centres per cross-section (RC/CS). Values correspond to
average of n = 3.
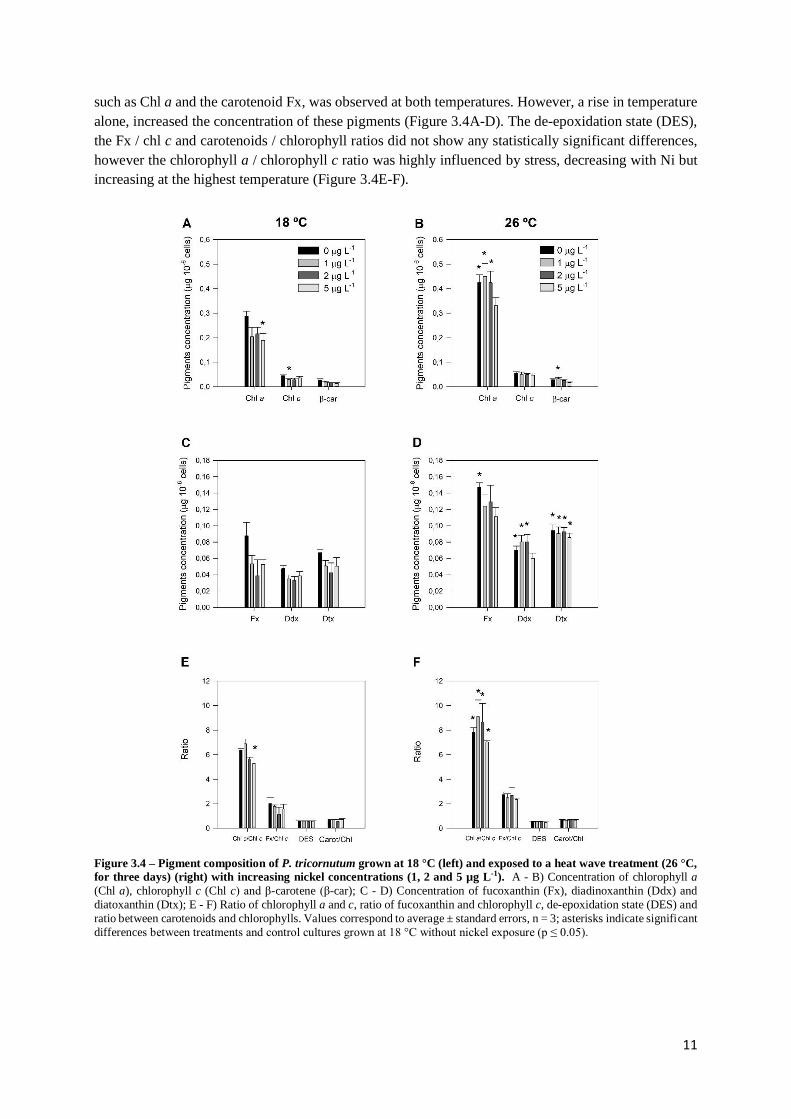
Figure 3.4 – Pigment composition of P. tricornutum grown at 18 °C (left) and exposed to a heat
wave treatment (26 °C, for three days) (right) with increasing nickel concentrations (1, 2 and
5 µg L-1). A - B) Concentration of chlorophyll a (Chl a), chlorophyll c (Chl c) and β-carotene (β-car);
C - D) Concentration of fucoxanthin (Fx), diadinoxanthin (Ddx) and diatoxanthin (Dtx); E - F) Ratio of
chlorophyll a and c, ratio of fucoxanthin and chlorophyll c, de-epoxidation state (DES) and ratio
between carotenoids and chlorophylls. Values correspond to average ± standard errors, n = 3; asterisks
XIII
indicate significant differences between treatments and control cultures grown at 18 °C without nickel
exposure (p ≤ 0.05).
Figure 3.5 – Fatty acid composition of P. tricornutum samples grown at 18 °C (black) and exposed
to a heat wave treatment (26 °C, for three days) (dark grey) with nickel exposure (5 µg L-1, medium
and light grey). A) Relative abundance of fatty acids; B) Total fatty acids; C) Double bond index (DBI).
Values correspond to average ± standard error, n = 3; asterisks indicate significant differences between
treatments and control cultures grown at 18 °C without nickel exposure (p ≤ 0.05).
Figure 3.6 – Lipid class analysis and derived parameters of P. tricornutum samples grown at 18 °C
(black) and exposed to a heat wave treatment (26 °C, for three days) (dark grey) with nickel
exposure (5 µg L-1, medium and light grey). A) Relative abundance of lipid classes; B) Ratio between
MGDG and DGDG and ratio between the neutral and negatively charged lipid classes composing the
thylakoid membrane; C) Relative abundance of glycolipids and non-glycolipids. Lipid classes identified
included neutral lipids (NL), monogalactosyldiacylglycerol (MGDG), sulfoquinovosyldiacylglycerol
(SQDG), acylSQDG (ASQ), digalactosyldiacylglycerol (DGDG), phosphatidylglycerol (PG), phosph-
atidylcholine (PC) and phosphatidylethanolamine (PE). Values correspond to average ± standard error,
n = 2.
Figure 3.7 – Composition and relative abundance of fatty acids in neutral lipids (NL) of
P. tricornutum samples grown at 18 °C (black) and exposed to a heat wave treatment (26 °C, for
three days) (dark grey) with nickel exposure (5 µg L-1, medium and light grey). Values correspond
to average relative percentage ± standard error, n = 2.
Figure 3.8 – Fatty acid composition of lipid classes of P. tricornutum samples grown at 18 °C
(black) and 26 °C (for three days) (dark grey) with nickel exposure (5 µg L-1, medium and light
grey). A) MGDG; B) DGDG; C) SQDG. Values correspond to average ± standard error, n = 2;
Figure 3.9 – Lipid peroxidation products of P. tricornutum samples grown at 18 °C (black) and
exposed to a heat wave treatment (26 °C, for three days) (grey) with increasing nickel
concentrations (1, 2 and 5 µg L-1). Values correspond to average ± standard error, n = 3; asterisks
indicate significant differences between treatments and control cultures grown at 18 °C without nickel
exposure (p ≤ 0.05).
Figure 3.10 – Fold change in the expression of lipid metabolism and photosynthetic genes of
P. tricornutum samples grown at 18 °C and exposed to a heat wave treatment (26 °C, for three
days) (grey) with nickel exposure (5 µg L-1, black and medium grey). Data obtained by qPCR
analysis and expressed according to the Livak method. Tested genes encoded the endoplasmic reticulum
Δ5 fatty acid desaturase (Δ5FAD), the plastidΔ6 fatty acid desaturase (Δ6FAD), the diacylglycerol acyl
transferase (DGAT), patatin-like phospholipase domain- containing protein 3 (PNPLA3), the phospho-
lipase A2 (PLA2), the monogalactosyldiacylglycerol synthase (MGDG synth), the carbonic anhydrase 7
(AC-7) and urease α-subunit (Ur α-subunit). Positive values correspond to upregulation and negative
values correspond to downregulation. Values correspond to average ± standard error, n = 3; asterisks
indicate significant differences between treatments and control cultures grown at 18 °C without nickel
exposure (p ≤ 0.05).
Figure 4.1 – Carotenoid biosynthesis pathways in P. tricornutum. Blue and green define alternative
pathways. Bold marks the carotenoids analysed in this study. Adapted from Kuczynska et al. (2015).
Supplemental Table S1 - Summary of fluorometric analysis parameters and their description.

XIV
Supplemental Figure S1 – Fatty acid distribution in P. tricornutum samples grown at 18 ºC and
exposed to a heat wave treatment (26 ºC, for three days) and increasing nickel concentrations (1,
2 and 5 µg L-1). Results were obtained through direct methylation of 8 mL pellets; Shades of green,
orange, blue and purple mark samples without Ni exposure and exposure to final Ni concentrations of
1, 2 and 5 µg L-1, respectively; Shades of each colour mark exposure to stress conditions in a period of
24, 48 and 72 hours; n = 1.
Supplemental Figure S2 – Total fatty acid content and DBI of P. tricornutum samples grown at
18 ºC and exposed to a heat wave treatment (26 ºC, for three days) and increasing nickel
concentrations (1, 2 and 5 µg L-1). Results were obtained through direct methylation of 10 mL pellets;
Shades of green, orange, blue and purple mark samples without Ni exposure and exposure to final Ni
concentrations of 1, 2 and 5 µg L-1, respectively; Shades of each colour mark exposure to stress
conditions in a period of 24, 48 and 72 hours; n = 1.

1
1. Introduction
Fossil fuel combustion, agriculture and industrial activity have been altering the chemistry of the oceans,
not only on coastal waters but also in the open ocean (Doney, 2010). Climate change is mainly caused
by changes in the atmospheric composition due to these activities (Herring et al., 2015; Karl and
Trenberth, 2003; Khandekar et al., 2005) and often induces multiple stresses on marine ecosystems,
from gradual acidification and salinity alterations to ocean warming (Doney et al., 2012). According to
The Intergovernmental Panel on Climate Change (IPCC) WG2 5th Assessment Report (IPCC, 2014),
Earth is suffering an enhancement of global air temperature and an increase in the frequency and
duration of extreme heat events such as heat waves. These phenomena last at least five consecutive days,
with maximum daily temperature exceeding the average maximum temperature by 5 °C (World
Meteorological Organization, WMO). This enhancement in the global air temperature is occurring at a
much greater rate per decade than previous observations. For example, in the last 45 years the average
increase of temperature hit 0.17 ºC per decade (Dahlman, 2017). Although this effect is mostly felt in
terms of air temperature, there is also a rise in the average ocean temperature (approximately 0.06 ºC
per decade) (Dahlman, 2017). Western Europe but mostly the Iberian Peninsula have faced a stronger
warming since the 1980s, mostly during the summer (Baldi et al., 2005; Dasari et al., 2014; EEA, 2012)
and surface water temperature has reached 26 ºC in the Tagus estuary in 2005 (Gameiro et al., 2007).
Metal pollution is also a result of anthropogenic activity such as sediment removal at the bottom of water
bodies (dredging) which leaves contaminated sediments that can contain several toxic elements such as
cobalt, copper, zinc, mercury, lead and nickel (Ni) capable of reaching the water column in elevated
concentrations (Eggleton and Thomas, 2004). Nickel is the 24th most abundant element in the Earth’s
crust (Bencko, 1983) and is classified as an essential trace metal for several species playing key roles in
metabolic processes as a cofactor of numerous metalloenzymes such as glyoxalase I or urease, the latter
being involved in nitrogen uptake through urea assimilation (Boer et al., 2014; Seregin and
Kozhevnikova, 2006; Thauer et al., 1980). This means that variations in the concentration of this trace
metal can induce deficit or toxicity problems (Bencko, 1983) via disruption of the homeostasis of
divalent cations such as Ca2+ and Mg2+ and damage to cell components through the formation of reactive
oxygen species (ROS) (Brix et al., 2017). Therefore, heat waves and metal pollution, alone or combined,
can dramatically change the structure of marine ecosystems but also the quality and composition of the
primary production at the marine food webs and affect the organisms relying on its unique metabolites
(Galloway and Winder, 2015; Maazouzi et al., 2008).
Diatoms are a major group of microalgae at the base of the marine food webs responsible for
approximately 20 % of the global primary photosynthetic production (Domingues et al., 2012). The
pennate diatom Phaeodactylum tricornutum is a photosynthetic unicellular alga with a fully sequenced
genome (Bowler et al., 2008) capable of producing up to 35 % of eicosapentaenoic acid (EPA, C20:5)
(Hamilton et al., 2014) and face multiple stresses (Cabrita et al., 2016; Jiang and Gao, 2004; Kudo et
al., 2000; Sigaud and Aidar, 1993). It has been described to present three different morphologies – oval,
fusiform and triradiate – and a recently reported cruciform morphology, that can be interconverted when
stimulated by stress (He et al., 2014). The fusiform morphotype is the most common in laboratory
experiments (Figure 1.1) and the oval morphotype mostly occurs when P. tricornutum leaves the water
column and therefore is considered a benthic morphotype (Tesson et al., 2009). These features make it

2
a powerful tool to study the impact of stressors on metabolic processes and their regulation through gene
expression and predict possible consequences on the food web and marine ecosystems.
Figure 1.1 – Phaeodactylum tricornutum cell cultures (left) and fusiform morphotype (right). Fusiform morphotype
microscopy image was published on DiatomCyc (v1.0), an online database of P. tricornutum.
The de novo fatty acid biosynthesis begins with acetyl-CoA and malonyl-CoA precursors and the
activity of fatty acid synthases (FAS). In P. tricornutum it has been described to follow two main
pathways, as in higher plants (Dolch and Maréchal, 2015). The prokaryotic pathway takes place inside
the chloroplast stroma where usually four enzymatic processes lead to incorporation of two carbons each
cycle forming fatty acids from 14 carbons up to 18 carbons. Fatty acids with more than 18 carbons are
elongated by elongases in the eukaryotic pathway which occurs in the endoplasmic reticulum. The
synthesised fatty acids are then used to build membrane lipids such as glycerolipids and other products.
From FA incorporation results thylakoid membrane lipids such as monogalactosyldiacylglycerol
(MGDG) and digalactosyldiacylglycerol (DGDG) but also the negatively charged phosphatidylglycerol
(PG), sulfoquinovosyldiacylglycerol (SQDG) and the acyl-SQDG (Seiwert et al., 2017). Other lipid
classes include phosphatidylcholine (PC), phosphatidylethanolamine (PE) and phosphatidylinositide
(PI) which are likely synthesised at extraplastidic membranes (Abida et al., 2015). These lipid classes
and mostly MGDG, possess a high percentage of the long-chain polyunsaturated fatty acid (LC-PUFA),
EPA (Abida et al., 2015) the synthesis of which has not been well elucidated and is believed to be a
result from a combination of an omega 6 (ɷ-6) and omega-3 (ɷ-3) pathways in which essential fatty
acids (EFA) such as the ɷ-6 linoleic acid (C18:2) and ɷ-3 linolenic acid (C18:3) through consecutive
elongation and desaturation lead to EPA synthesis being the last step possibly catalyzed by activity of
two fatty acid desaturases - ERΔ5FAD.1 and ERΔ5FAD.2 (Arao and Yamada, 1994; Domergue et al.,
2002; Mühlroth et al., 2013) (Figure 1.2). The benefits of EPA and docosahexaenoic acid (DHA, C22:6),
another ɷ-3 fatty acid, are well established in animals and involve stabilization of blood pressure,
membrane fluidity regulation, anti-inflammatory properties and good neurological development
(Wiktorowska-Owczarek et al., 2015).

3
Figure 1.2 – Overview of the metabolic fatty acid synthesis pathways in P. tricornutum. Prokaryotic and eukaryotic
pathways are represented in green and blue, respectively, and the involved enzymes include elongases (Elo) and desaturases
(ΔD) which are represented in purple. Putative genes and enzymes encoded by genes already identified are marked in red and bold, respectively. Question marks indicate that the reaction and respective enzymes are not predicted. Red circles mark
desaturases analysed in this dissertation. This figure was published by Mühlroth et al. (2013).
The objective of this dissertation was to evaluate the impact of a heat wave of similar magnitude of the
one felt in the Tagus estuary in 2005 and pollution by heavy metals, more specifically, by nickel (Ni2+)
on growth, photosynthesis, metabolism of omega-3 and -6 fatty acids and gene expression of
Phaeodactylum tricornutum, which is one of the components of the ecosystem basis of the estuary
(Gameiro and Brotas, 2010). For this, the performance at two temperatures - control (18 °C) and heat
wave (26 °C, for 3 days) - and exposure to three concentrations of nickel - 1, 2 and 5 μg L-1 was assessed.
To assess possible changes in the photochemistry of P. tricornutum, non-destructive methods such as
Pulse Amplitude Modulation (PAM) Fluorometry and Clark-type oxygen electrode were used. PAM
fluorometry evaluates the photonic energy harvest and consequent transformation into electronic energy
using chlorophyll a (Chl a) fluorescence, giving important insights on photon capture, energy
transduction and dissipation (Anjum et al., 2016) while Clark-type electrode measures O2 production
and consumption rates (Armstrong, 1994). Thin Layer Chromatography (TLC) and Gas
Chromatography-flame ionization detection (GC-FID) are methods that separate lipids into individual
classes and allow a precise identification and quantification of fatty acids present in those classes (Abida
et al., 2015; Popko et al., 2016; Shen et al., 2016) which have distinct fatty acid signatures. Real-Time
PCR or quantitative PCR (qPCR) was used to detect changes in the expression of genes related to lipid
metabolism and photosynthesis and allow a molecular integration of the biochemical and physiological
parameters.

4
2. Materials and methods
2.1. Experiment set-up
Control axenic cultures of the diatom Phaeodactylum tricornutum Bohlin, 1898 (Bacillariophyceae) (IO
108-01, IPMA) were maintained in 250 mL flasks containing f/2 medium (Guillard and Ryther, 1962),
in a growth chamber (Fytoscope FS130), at temperature-controlled conditions (18 ± 1 °C), with constant
aeration, during 5 days. The chamber was programmed with a sinusoidal function simulating sunrise
and sunset, with a light intensity at noon to simulate a natural light environment (RGB 1:1:1, Maximum
PAR 80 µmol photons m-2 s-1, 14/10 h day/night rhythm). Initial cell concentration was approximately
2.7x10⁵ cells mL-1, following the Organization for Economic Cooperation and Development (OECD)
guidelines for algae bioassays (OECD, 2002) and the therein recommended initial cell density for
microalgae cells with similar size to P. tricornutum. In parallel, P. tricornutum cultures at the beginning
of the exponential phase (48 hours later) were grown as the control cultures, but subjected to a
temperature of 26 ± 1 °C, mimicking the maximum water temperature registered by Gameiro et al.
(2007) in the Tagus Estuary, during the 2005 heat wave. For both temperatures, three concentrations of
Ni were tested through addiction of NiCl2 to a final concentration of 1, 2 and 5 µg L-1. Concentrations
were chosen to match the Ni concentration determined during dredging in the Tagus estuary (1 µg L-1)
(Cabrita, 2014) and plausible higher concentrations (2 and 5 µg L-1). All materials used were cleaned
with HNO3 (20 %) for two days and rinsed thoroughly with Milli-Q water (18.2 M cm) and autoclaved
to avoid contamination. Culture manipulations were performed in a laminar air flow chamber.
2.2. Cell growth rates
Samples of P. tricornutum of both control and stresses (temperature and/or Ni exposed) experiments
were taken for cell counting on a Neubauer improved counting chamber, under an Olympus BX50
(Tokyo, Japan) inverted microscope, at 400 ampliation. Growth was estimated as the mean specific
growth rate per day, calculated from the difference between initial and final logarithmic cell densities
divided by the exposure period, as proposed by Santos-Ballardo et al. (2015). The number of cells
aggregated in pairs or in groups of more than two (clamps) was also registered, in order to calculate
their relative abundance. For determination of fresh weight and collection of samples for biochemical
and molecular analyses, cells were collected at the end of the experiments, centrifuged at 4000 g for
15 min at 4 °C and after supernatant removal, immediately frozen in liquid nitrogen and stored at -80 °C.
Three biological replicates for each analysis were used.
2.3. Oxygen evolution rates
At the end of the experiments, the photosynthetic and respiratory oxygen production and consumption,
were assessed, respectively, using 1 mL culture samples exposed to white light (LS2 light source)
emitting 100 µmol photons m-2 s-1 using a Clark-type electrode (S1 Electrode Disc, Hansatech
Instruments, England) with constant mixing (Matos et al., 2009). Temperature was maintained at
experimental growth conditions (18 °C and 26 °C) by a circulating water bath directly connected to the
electrode chamber. Data analysis was made with OxygraphPlus software.

5
2.4. Pulse Amplitude Modulated (PAM) Fluorometry
Pulse amplitude modulated (PAM) chlorophyll fluorescence measurements were performed using a
FluoroPen FP100 (Photo System Instruments, Czech Republic), on samples using a 1 mL cuvette. All
fluorometric analyses were carried out at the end of the experimental period in dark-adapted samples.
Rapid Light Curves (RLC) were achieved using the pre-programmed light curve (LC1) protocol which
performs successive measurements of the sample photosystem II efficiency (ɸPSII) under various light
intensities (20, 50, 100, 200, 300 and 500 µmol photons m-2 s-1) of continuous illumination relating the
rate of photosynthesis to photon flux density (PAR). Chlorophyll transient light curves were also
assessed by the OJIP test. In short, the level O represents all the open reaction centres (RC) at the onset
of illumination with no reduction of quinone a (QA) (fluorescence intensity lasts for 10 ms). The rise of
transient fluorescence from O to J indicates the net photochemical reduction of QA (the stable primary
electron acceptor of PSII) to QA- (lasts for 2 ms). The phase from J to I was due to all reduced states of
closed RCs such as QA- QB-, QA QB2- and QA- QB H2 (lasts for 2-30 ms). The level P (300 ms) coincides
with maximum concentration of QA- QB2 with plastoquinol pool maximally reduced. The phase P also
reflects a balance between light incident at the PSII side and the rate of utilization of the chemical
(potential) energy and the rate of heat dissipation (Zhu et al., 2005). Supplemental Table S1 summarizes
all the parameters that were computed from the fluorometric data.
2.5. Pigment analysis
Pigments were extracted with 100 % acetone and maintained in a cold ultra-sound bath for 2 min to
ensure complete disaggregation of the cell material. Pigments were extracted at -20 °C for 24 h in the
dark to prevent degradation (Cabrita et al., 2016) and then centrifuged for 15 min at 4000 g at 4 °C. The
supernatants were scanned in a dual beam spectrophotometer from 350 nm to 750 nm at 0.5 nm steps.
The absorbance spectrum was introduced in the Gauss-Peak Spectra (GPS) fitting library, using
SigmaPlot Software. Pigment concentrations were determined using the algorithm developed by Küpper
et al. (2007). Thus, Chlorophyll a and c, Pheophytin a, β-carotene, Fucoxanthin (Fx), Diadinoxanthin
(Ddx) and Diatoxanthin (Dtx) were detected. The De-Epoxidation State (DES) was calculated as:
2.1 DES = ([Dtx] / ([Dtx] + [Ddx])
2.6. Fatty acid and Lipid classes analysis
2.6.1. Extraction of Total Fatty Acids
Samples were boiled in 1 mL of Milli-Q water (18.2 M cm) for 3 min to inactivate lipases and then
sonicated to assure complete cell disruption. Lipophilic compounds were extracted with chloroform:
methanol: water (7:7:7, v/v/v), on a mortar and pestle to ensure cell disruption and maximum lipid
extraction. After homogenization through vortex, extraction samples were centrifuged at 4000 g for
5 min at room temperature. The lower phase was collected, the solvent evaporated under a N2 flow in a
water bath with 30 ºC, and re-suspended in 1 mL of ethanol toluene (1:4, v/v).

6
2.6.2. Gas Chromatography and Thin-layer Chromatography
Trans-esterification of 100 µL of the lipid extract solution was performed, in freshly prepared methanol-
sulfuric acid (97.5:2.5, v/v), at 70 °C for 60 min, as previously described for higher plants leaves
(Gameiro et al., 2016; Duarte et al., 2017) using pentadecanoic acid (C15:0) as an internal standard.
Fatty acids methyl esters (FAMEs) were rescued using petroleum ether, dried under a N2 flow and re-
suspended in an appropriate amount of hexane. One microlitre of the FAME solution was analysed in a
gas chromatograph (Varian 430-GC gas chromatograph) equipped with a hydrogen flame ionization
detector set at 300 °C. The temperature of the injector was set to 270 °C, with a split ratio of 50. The
fused-silica capillary column (50 m x 0.25 mm; WCOT Fused Silica, CP-Sil 88 for FAME; Varian) was
maintained at a constant nitrogen flow of 2.0 mL min-1 and the oven temperature set at 190 °C. Fatty
acids were identified by comparison of their retention times with standards (Sigma-Aldrich) and
chromatograms analysed by the peak surface method, using the Galaxy software. The double bond index
(DBI) and the ɷ-6 / ɷ-3 ratios were calculated as follows:
2.2 . DBI = 2 [(% monoenes) + (2 x % dienes) + (3 x % trienes) + (4 x % tetraenes) + (5 x %
pentaenes)] / 100
2.3 . ɷ-6 / ɷ-3 = (C18:3 + C20:4) / (C18:4 + C20:5)
Separation of lipids into various classes was performed using one-dimensional TLC on silica gel plates
(G-60, Merck, VWR, Fontenay-sous-bois, France) with a solvent system developed by Lepage (1967).
The various lipid classes were observed under UV light after the silica gel plate was sprayed with
primulin (0.01 % in 80 % acetone). The bands were scrapped off and methylated as described above and
analyzed through GC to determine the fatty acid composition and content. Triplicate total lipid samples
of P. tricornutum were pooled into one combined extract treatment and TLC analysis was performed in
duplicate.
2.7. Quantification of lipid peroxidation products
Quantification of the lipid peroxidation products was performed as described before (Duarte et al.,
2015), with minor modifications, such as homogenization in 10 % (v/v) Trichloroacetic acid (TCA) and
brief sonication. Absorbance values at 532 nm and 600 nm were registered and the concentration of
TBARS was calculated using the molar extinction coefficient, 155 mM-1 cm-1 (Heath and Packer, 1968).
2.8. Gene expression analysis
2.8.1. RNA extraction
Samples of P. tricornutum previously collected for gene expression analysis were frozen in liquid N2
after being taken out of storage. Extraction of RNA was performed using the Qiagen RNeasy Mini Kit
according to manufacturer’s instructions with small modifications which included a 5 min sonication of
the samples to disrupt diatom cells. The used buffer was RLT with 1% (v/v) freshly added β-
mercaptoethanol. To eliminate remaining DNA, digestion “on column” was performed with DNase
(RNase-Free DNase Set by Qiagen) for 15 min at room temperature. RNA concentration was determined
in a Nanodrop analyzer (Thermo Fisher Scientific NanoDrop 1000). The ratios A260/280 and A260/230 were
calculated to determine protein and solvent contamination, respectively. RNA integrity was evaluated
7
by electrophoresis in a 1 % Agarose gel with 0.005% (v/v) ethidium bromide (Mini-Sub Cell-GT and
PowerPack Basic, BioRad). After migration, results were observed under UV light in a Bio-Rad
Molecular Imager Gel Doc XR Imaging System.
2.8.2. cDNA Synthesis
The cDNA synthesis was performed following the protocol proposed by the NZY M-MuLV First-Strand
cDNA Synthesis Kit (NZYTech) using 1 µg of RNA in a final volume of 20 µL. Incubations steps at 25
and 37 ºC for 10 and 50 min, respectively. Inactivation of the reaction by heating at 85 ºC for 5 min and
cooling on ice. One microlitre of NZY RNase H (E. coli) was added and samples were incubated at
37 ºC for 20 min. Samples were then stored at -20 ºC. This was performed on a Bio-Rad MJ Mini
Personal Thermal Cycler.
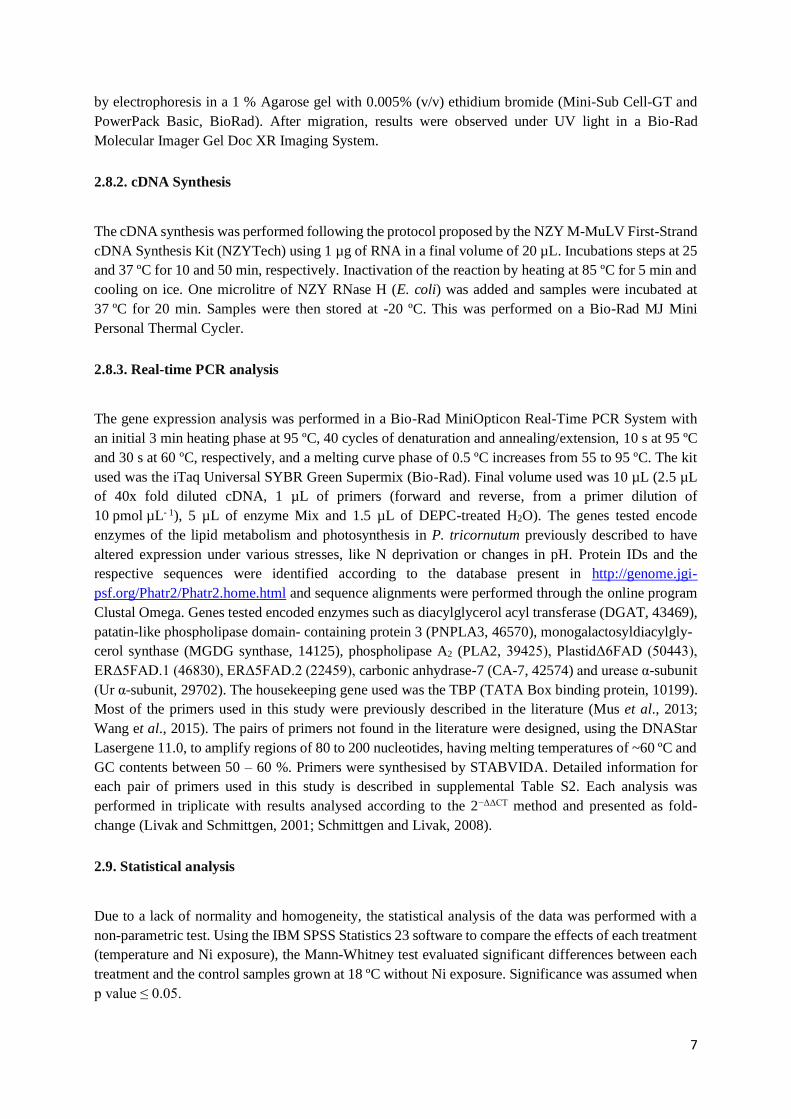
2.8.3. Real-time PCR analysis
The gene expression analysis was performed in a Bio-Rad MiniOpticon Real-Time PCR System with
an initial 3 min heating phase at 95 ºC, 40 cycles of denaturation and annealing/extension, 10 s at 95 ºC
and 30 s at 60 ºC, respectively, and a melting curve phase of 0.5 ºC increases from 55 to 95 ºC. The kit
used was the iTaq Universal SYBR Green Supermix (Bio-Rad). Final volume used was 10 µL (2.5 µL
of 40x fold diluted cDNA, 1 µL of primers (forward and reverse, from a primer dilution of
10 pmol µL- 1), 5 µL of enzyme Mix and 1.5 µL of DEPC-treated H2O). The genes tested encode
enzymes of the lipid metabolism and photosynthesis in P. tricornutum previously described to have
altered expression under various stresses, like N deprivation or changes in pH. Protein IDs and the
respective sequences were identified according to the database present in http://genome.jgi-
psf.org/Phatr2/Phatr2.home.html and sequence alignments were performed through the online program
Clustal Omega. Genes tested encoded enzymes such as diacylglycerol acyl transferase (DGAT, 43469),
patatin-like phospholipase domain- containing protein 3 (PNPLA3, 46570), monogalactosyldiacylgly-
cerol synthase (MGDG synthase, 14125), phospholipase A2 (PLA2, 39425), PlastidΔ6FAD (50443),
ERΔ5FAD.1 (46830), ERΔ5FAD.2 (22459), carbonic anhydrase-7 (CA-7, 42574) and urease α-subunit
(Ur α-subunit, 29702). The housekeeping gene used was the TBP (TATA Box binding protein, 10199).
Most of the primers used in this study were previously described in the literature (Mus et al., 2013;
Wang et al., 2015). The pairs of primers not found in the literature were designed, using the DNAStar
Lasergene 11.0, to amplify regions of 80 to 200 nucleotides, having melting temperatures of ~60 ºC and
GC contents between 50 – 60 %. Primers were synthesised by STABVIDA. Detailed information for
each pair of primers used in this study is described in supplemental Table S2. Each analysis was
performed in triplicate with results analysed according to the 2−ΔΔCT method and presented as fold-
change (Livak and Schmittgen, 2001; Schmittgen and Livak, 2008).
2.9. Statistical analysis
Due to a lack of normality and homogeneity, the statistical analysis of the data was performed with a
non-parametric test. Using the IBM SPSS Statistics 23 software to compare the effects of each treatment
(temperature and Ni exposure), the Mann-Whitney test evaluated significant differences between each
treatment and the control samples grown at 18 ºC without Ni exposure. Significance was assumed when
p value ≤ 0.05.

8
3. Results
3.1. Growth parameters
Control cultures, grown at 18 ºC without Ni exposure, presented a specific growth rate of 0.35 ± 0.02.
When exposed to the highest concentration of Ni, P. tricornutum grew 1.3 times faster (0.45 ± 0.03).
The temperature shift to 26 ºC caused a decrease in the specific growth rate to 0.31 but the combined
effect of both stresses did not change it (Figure 3.1A). The percentage of clamps (aggregates of more
than 2 cells) did not change when Ni was introduced in the medium at regular growth temperature,
however, the increase in temperature alone, significantly changed it from 17.33 % to 12.38 %
(Figure 3.1B). The P. tricornutum cells fresh weight showed a tendency to decrease at 18 ºC with
increasing Ni concentrations. At 26 ºC the fresh weight of the samples also significantly decreased but
mostly due to the temperature shift (Figure 3.1C).
Figure 3.1 – Growth parameters of P. tricornutum grown at 18 °C (black) and exposed to a heat wave treatment (26 °C,
for three days) (grey) with increasing nickel concentrations (1, 2 and 5 µg L-1). A) Specific growth rate; B) Relative abundance of clamps (aggregates of more than two cells); C) Fresh weight. Values correspond to average ± standard errors, n
= 3; asterisks indicate significant differences between treatments and control cultures grown at 18 ºC without nickel (p ≤ 0.05).
3.2. Photosynthetic and respiratory rates
The photosynthesis rates measured in a Clark-type oxygen electrode showed a clear decrease in samples
exposed to Ni and/or heat wave conditions being the lowest photosynthetic rate registered in samples
exposed to 26 ºC and to a Ni concentration of 5 µg L-1 (Figure 3.2A). Respiration rates only showed
statistically significant differences in samples exposed to the highest concentration of Ni, for both
growth temperatures (Figure 3.2B).

9
Figure 3.2 – Photosynthetic and respiratory O2 flux rates of P. tricornutum grown at 18 °C (black) and exposed to a heat
wave treatment (26 °C, for three days) (grey) with increasing nickel concentrations (1, 2 and 5 µg L-1). A) Photosynthetic
rate; B) Respiration rate. Values correspond to average ± standard error, n = 3; asterisks indicate significant differences between
treatments and control cultures grown at 18 °C without nickel (p ≤ 0.05).
3.3. PAM fluorometry
The PAM-derived parameters of P. tricornutum samples grown at 18 and 26 ºC with and without
exposure to increasing Ni concentrations are presented in Table 3.1.
Table 3.1 – Rapid Light Curves (RLC) and JIP- derived parameters in samples of P. tricornutum grown at 18 °C and
exposed to a heat wave (26 °C, for three days) with increasing nickel concentrations (1, 2 and 5 µg L-1). Values correspond to average of n = 3 samples; Bold values indicate significant differences between treatments and control cultures grown at
18 ºC without nickel exposure (p ≤ 0.05). Abbreviations in appearance order include: α (photosystem II efficiency), ETRmax
(maximum relative electron transport), β (photoinhibition parameter); AOECs (activated oxygen-evolving complexes), Area
(pool of oxidized quinones), N (Number of electrons transferred into the electron transport chain), SM (energy needed to close all reaction centres), PG (grouping probability, a direct measure of the connectivity between PSII antennae). Other meanings to
each parameter can be found in supplemental Table S1.
18 °C 26 °C
0 µg L-1 1 µg L-1 2 µg L-1 5 µg L-1 0 µg L-1 1 µg L-1 2 µg L-1 5 µg L-1
α 0.16 0.15 0.15 0.16 0.12 0.11 0.12 0.12
ETRmax 34.67 33.33 32.67 34.33 28.33 27.00 28.00 28.33
β 0.11 0.11 0.06 0.05 0.09 0.09 0.05 0.05
AOECS 0.26 0.29 0.27 0.28 0.30 0.32 0.32 0.33
Area 1.20x10⁶ 8.91x10⁵ 9.93x10⁵ 9.30x10⁵ 4.62x10⁶ 4.16x10⁶ 2.80x10⁶ 2.70x10⁶
N 1459.55 1207.81 1000.38 985.33 4272.27 3864.75 2474.97 2010.53
SM 501.19 439.67 349.46 348.36 1567.17 1434.04 917.19 760.90
PG 1.11 1.02 1.04 0.99 1.13 1.09 1.061 1.06
10
Cell exposure to increasing Ni concentrations caused similar results at 18 and 26 ºC. Overall at the
highest concentration Ni tended not to change the efficiency of the PSII or ETRmax and most changes in
the phenomenological parameters were also observed at the highest concentration. Those included a
small increase in activated oxygen-evolving complexes, slight but not statistically significant differences
in the oxidized quinone pool (area), a decrease in the number of electrons transferred to the electron
transport chain (N) and lower energy needed to close the reaction centres (SM). Significant changes in
the amount of energy absorbed per cross section (ABS/CS) or trapped energy (TRO/CS) were not
observed, however the electron transport flux from QA to QB per PSII (ETO/CS) slightly decreased
(Figure 3.3A). The effect of the temperature shift to 26 ºC caused the most severe changes in the
P. tricornutum cells. Comparing cells grown at 18 ºC to cells grown at 26 ºC without exposure to Ni it
is possible to observe that PSII efficiency drastically decreased (0.16 ± 0.00 vs 0.12 ± 0.00, respectively)
and the ETRmax was lower. The activated OECS, area, N and SM registered higher values. In terms of
absorbed energy, entrapment, and dissipation of energy an increase was observed, however, no
significant difference was found in the ETO/CS when compared to control cultures (Figure 3.3B). The
number of reaction centres increased at the highest Ni concentration in each temperature but the
grouping probability (PG) tended to not change.
Figure 3.3 – Phenomenological energy fluxes in samples of P. tricornutum. A) Cultures grown at 18 ºC; B) Cultures grown
at 26 °C for three days with final nickel concentrations of 1, 2 and 5 µg L-1. Parameters include absorbed energy flux per cross-
section (ABS/CS); Trapped energy flux per cross-section (TRO/CS); Electron transport energy flux per cross-section (ETO/CS); Dissipated energy flux per cross-section (DIO/CS) and number or reaction centres per cross-section (RC/CS). Values
correspond to average of n = 3.
3.4. Pigment analysis
The changes in the concentration of the main pigments of P. tricornutum exposed to a higher
temperature and increasing Ni concentrations are shown in Figure 3.4. The main pigments found in
P. tricornutum were Chl a and Chl c, Fx, β-carotene, and the pigments involved in the xanthophyll cycle
– Ddx and Dtx. When exposed to Ni a decrease in the concentration of the light harvesting pigments,
11
such as Chl a and the carotenoid Fx, was observed at both temperatures. However, a rise in temperature
alone, increased the concentration of these pigments (Figure 3.4A-D). The de-epoxidation state (DES),
the Fx / chl c and carotenoids / chlorophyll ratios did not show any statistically significant differences,
however the chlorophyll a / chlorophyll c ratio was highly influenced by stress, decreasing with Ni but
increasing at the highest temperature (Figure 3.4E-F).
Figure 3.4 – Pigment composition of P. tricornutum grown at 18 °C (left) and exposed to a heat wave treatment (26 °C,
for three days) (right) with increasing nickel concentrations (1, 2 and 5 µg L-1). A - B) Concentration of chlorophyll a
(Chl a), chlorophyll c (Chl c) and β-carotene (β-car); C - D) Concentration of fucoxanthin (Fx), diadinoxanthin (Ddx) and
diatoxanthin (Dtx); E - F) Ratio of chlorophyll a and c, ratio of fucoxanthin and chlorophyll c, de-epoxidation state (DES) and
ratio between carotenoids and chlorophylls. Values correspond to average ± standard errors, n = 3; asterisks indicate significant
differences between treatments and control cultures grown at 18 °C without nickel exposure (p ≤ 0.05).

12
3.5. Fatty acid and Lipid classes analysis
Preliminary results of fatty acid distribution in P. tricornutum samples exposed to each Ni concentration,
during the culture days, indicated that the strongest impact occurred for the highest concentration tested
(Supplemental Figure S1 and S2). Therefore, fatty acid composition and contents of P. tricornutum cells
were analysed in samples grown at 18 and 26 ºC and with exposure to a final concentration of Ni of
5 µg L-1. The major fatty acids identified in P. tricornutum cells were the saturated myristic (C14:0) and
palmitic (C16:0) acids, the monounsaturated palmitoleic acid (C16:1), the di-unsaturated
hexadecadienoic acid (C16:2n-4), the tri-unsaturated hexadecatrienoic acid (C16:3) and the LC-PUFA
EPA. Smaller amounts of hexadecatetraenoic acid (C16:4), γ-linolenic acid (C18:3), stearidonic acid
(C18:4), arachidonic acid (C20:4), as well as another hexadecadienoic acid (C16:2n-7) were also
detected (Figure 3.5). The observed trend was a decrease in the percentage of EPA (~18 %) at 26 ºC
with Ni exposure when compared to control conditions at 18 ºC without metal exposure (~30 %). A
decrease in the abundance of the chloroplastidial PUFAs C16:4n-1 and C16:3n-4 was also observed,
mainly in Ni-treated cells, whereas the opposite trend was observed for C16:2n-4. In contrast, the
proportion of the saturated C16:0 increased for all stress conditions and the ɷ-6 fatty acid C20:4
increased in heat wave exposed samples (Figure 3.5A).
Figure 3.5 – Fatty acid composition of P. tricornutum samples grown at 18 °C (black) and exposed to a heat wave
treatment (26 °C, for three days) (dark grey) with nickel exposure (5 µg L-1, medium and light grey). A) Relative
abundance of fatty acids; B) Total fatty acids; C) Double bond index (DBI). Values correspond to average ± standard error, n = 3; asterisks indicate significant differences between treatments and control cultures grown at 18 °C without nickel exposure
(p ≤ 0.05).

13
The total fatty acid content increased with both stresses (Figure 3.5B) while the DBI decreased when
samples were exposed to a higher growth temperature and a final Ni concentration of 5µg L-1
(Figure 3.5C).
The identification of lipid classes and their respective fatty acid composition were assessed by TLC
coupled to GC. The main lipid classes identified were the neutral lipids (NL) which include free fatty
acids (FFA), diacylglycerol (DAG) and triacylglycerol (TAG), the non-ionic MGDG and DGDG and
the negatively charged lipids PG and SQDG (Figure 3.6). Other lipid classes identified were PC, PE and
ASQ.
Figure 3.6 – Lipid class analysis and derived parameters of P. tricornutum samples grown at 18 °C (black) and exposed
to a heat wave treatment (26 °C, for three days) (dark grey) with nickel exposure (5 µg L-1, medium and light grey). A)
Relative abundance of lipid classes; B) Ratio between MGDG and DGDG and ratio between the neutral and negatively charged lipid classes composing the thylakoid membrane; C) Relative abundance of glycolipids and non-glycolipids. Lipid classes
identified included neutral lipids (NL), monogalactosyldiacylglycerol (MGDG), sulfoquinovosyldiacylglycerol (SQDG), acyl-
SQDG (ASQ), digalactosyldiacylglycerol (DGDG), phosphatidylglycerol (PG), phosphatidylcholine (PC) and phosphatidyle-
thanolamine (PE). Values correspond to average ± standard error, n = 2.
Overall the heat wave exposure decreased the percentage of neutral lipids but increased the relative
amounts of MGDG, DGDG and SQDG, while metal exposure at 18 ºC induced a decrease in MGDG
with no significant changes in the other plastidial lipids. The combined effects of both stresses presented,
or attenuated, the profiles of each stress when applied alone (Figure 3.6A). Exposure to Ni at 18 ºC had
an influence in the galactolipid MGDG / DGDG ratio and also on the ratio between the neutrally and

14
negatively charged lipids forming the thylakoid membrane (Figure 3.6B). The shift of growth
temperature to 26 ºC caused a decrease in glycolipids and a consequent increase in non-glycolipids
(Figure 3.6C).
The relative abundance and composition in fatty acids of the main lipid classes is shown in Figures 3.7
and 3.8. The NL fraction was composed mostly by C16:0, C16:1 and C16:3 fatty acids. The temperature
shift to 26 ºC caused a decrease in C16:3 together with a slight increase in C16:2n-4, while exposure to
Ni markedly increased the percentages of C16:0 and C16:1n-7, with the opposite effect on C16:3n-4
and C16:4n-1 regardless of the growth temperature (Figure 3.7). These stress-induced changes are
similar to the ones obtained in the figure 3.6 since NL is the most abundant lipid class.
Figure 3.7 – Composition and relative abundance of fatty acids in neutral lipids (NL) of P. tricornutum samples grown
at 18 °C (black) and exposed to a heat wave treatment (26 °C, for three days) (dark grey) with nickel
exposure (5 µg L- 1, medium and light grey). Values correspond to average relative percentage ± standard error, n = 2.
The galactolipids were essentially composed of EPA and C16 fatty acids. In control conditions, MGDG
presented a higher EPA content of more than 30 %. The second most abundant fatty acid was C16:3.
When P. tricornutum was grown at 26 ºC and exposed to Ni, the EPA percentage decreased while the
percentage of C16:3 increased. It was also observed that the content of C16:1 and C16:4 increased and
decreased, respectively (Figure 3.8A). The fatty acid profile of DGDG was mostly built of C16:0, C16:1,
C16:2n-4 and EPA (Figure 3.8B). Exposure to both stresses had a tendency to increase the C16:0
content. The fatty acids found in SQDG were C14:0, C16:0, C16:1 and EPA (Figure 3.8C). While EPA
content only registered a small decrease in samples exposed to both stresses, the abundance of C16:0
increased, accounting for more than 35 %.

15
Figure 3.8 – Fatty acid composition of lipid classes of P. tricornutum samples grown at 18 °C (black) and 26 °C (for
three days) (dark grey) with nickel exposure (5 µg L-1, medium and light grey). A) MGDG; B) DGDG; C) SQDG. Values
correspond to average ± standard error, n = 2;

16
3.6. Lipid peroxidation products
The formation of lipid peroxidation products is shown in Figure 3.9. It is possible to observe that the
lipid peroxidation contents decreased when P. tricornutum was exposed to increasing Ni concentrations
at control temperature. However, the results obtained at 26 ºC showed that the strongest impact was
caused by the temperature rise since exposing heat wave treated cells to increasing Ni concentrations
did not change the MDA.
Figure 3.9 – Lipid peroxidation products of P. tricornutum samples grown at 18 °C (black) and exposed to a heat wave
treatment (26 °C, for three days) (grey) with increasing nickel concentrations (1, 2 and 5 µg L-1). Values correspond to
average ± standard error, n = 3; asterisks indicate significant differences between treatments and control cultures grown at
18 °C without nickel exposure (p ≤ 0.05).
3.7. Gene expression
The expression of genes encoding enzymes of the lipid and photosynthetic metabolism is presented as
fold-change, from control values, in Figure 3.10. The expression of the two desaturases tested tended to
increase in the heat wave exposed samples. The ERΔ5FAD had a tendency to be upregulated under both
stresses, however, statistically significant changes were only detected in samples exposed to 26 ºC with
Ni exposure. The expression of the PlastidΔ6FAD increased the most in samples exposed to the
combined stresses. The TAG synthesis related genes showed different results. While DGAT tended to
be downregulated PNPLA3 was slightly upregulated in samples exposed to heat wave conditions with
and without Ni. The expression of PLA2 which removes fatty acids from membrane lipids did not show
statistically significant differences, but was slightly upregulated in heat wave exposed samples. The
gene encoding MGDG synthase was heavily upregulated in each stress and the highest fold-change
value was registered in samples grown at 26 ºC. The CO2 uptake related gene, CA-7, was downregulated
in samples exposed to Ni but upregulated with the temperature shift. The gene which encodes the urease
α-subunit tended to be downregulated when cells were exposed to Ni, but was significantly upregulated
when P. tricornutum was exposed to 26 ºC without Ni.

17
Figure 3.10 – Fold change in the expression of lipid and photosynthetic metabolism genes of P. tricornutum samples
grown at 18 °C and exposed to a heat wave treatment (26 °C, for three days) (grey) with nickel exposure (5 µg L-1, black
and medium grey). Data obtained by qPCR analysis and expressed according to the Livak method. Tested genes encoded the endoplasmic reticulum Δ5 fatty acid desaturase (Δ5FAD), the plastidΔ6 fatty acid desaturase (Δ6FAD), the diacylglycerol acyl
transferase (DGAT), patatin-like phospholipase domain-containing protein 3 (PNPLA3), the phospholipase A2 (PLA2), the
monogalactosyldiacylglycerol synthase (MGDG synth), the carbonic anhydrase 7 (AC-7) and urease α-subunit (Ur α-subunit).
Positive values correspond to upregulation and negative values correspond to downregulation. Values correspond to average ± standard error, n = 3; asterisks indicate significant differences between treatments and control cultures grown at 18 °C without
nickel exposure (p ≤ 0.05).
4. Discussion
The IPCC report on climate changes (IPCC, 2014) and studies presented by Eggleton and Thomas
(2004) pointed to an increase in stress induction caused by extreme thermic events and metal exposure,
respectively, on marine organisms and ecosystems. The impact of these stressors needs to be studied on
major components of the marine food webs to help identify the physiological alterations not only on the
base of the food chain but also throughout it. Since diatoms are capable of withstanding various types
of stress (Cabrita et al., 2016; Falciatore et al., 2000) and produce approximately 20 % of the global
primary photosynthetic production, these organisms are widely used to unravel metabolic alterations
caused by common stressors (De Martino et al., 2011; Domingues et al., 2012; Janssen et al., 2001).
In the present work, the performance of the same P. tricornutum strain previously used by our team to
study the impacts of other types of stressors such as trace metal pollution and high light (Cabrita et al.,
2017, 2016; Matos et al., 2016; Domingues et al., 2012) was evaluated. Cells were analysed during the
exponential phase to minimize the effects of nutrient depletion and culture aging which result from long
experimental periods (Cabrita et al., 2016). Exposure to heat wave conditions alone caused a significant
decrease in the growth rate, abundance of clamps and fresh weight. Although, Ni caused an increase in
growth rate and a decrease in fresh weight. These results are in agreement with previous studies
regarding optimal and lethal temperatures for this diatom (Cabrita et al., 2017; Goldman, 1977; Sigaud
and Aidar, 1993; Yongmanitchai and Ward, 1991). Since Ni is known to work as a cofactor of urease
and increase nitrogen uptake, this could have explained the increase in growth rate as previously
observed by Rees and Bekheet (1982) who noticed that P. tricornutum presented a higher specific
growth rate when grown in a medium with nickel sulfate and urea. The decrease in fresh weight for both

18
stresses could have been caused by the lower photosynthesis and higher respiration rates. Similar results
were previously obtained by Stratton and Corke (1979) in studies with the cyanobacteria Anabaena
inaequalis which showed a photosynthetic inhibition of 91.5 % when exposed to a Ni concentration of
20 ppm and by Kudo et al. (2000) on P. tricornutum cells exposed to high temperature. Phaeodactylum
tricornutum is a heterokont possessing a C4 metabolism, in which carbon fixation occurs via
phosphoenolpyruvate carboxylase and Rubisco (Valenzuela J; Mazurie, 2012). The analysis of gene
expression of CA-7, a periplasmic membrane located protein that supplies CO2 to Rubisco, revealed an
increase in expression at 26 ºC. This gene has been shown to change its expression when P. tricornutum
faces stresses such as variations in pH and N depletion (Mus et al., 2013) and since CO2 solubility
decreases in water with increasing temperature (Wiebe and Gaddy, 1940) and Rubisco has lower activity
at higher temperatures (William and Morris, 1982), it is possible that the increase in gene expression
could have been a mechanism to amplify the amount of CO2 supplied to Rubisco. Presenting a similar
gene expression pattern as CA-7, the gene encoding the urease α-subunit was also up regulated with
temperature but downregulated with Ni exposure. Urease is a Ni-dependent enzyme that hydrolyses
urea into CO2 and NH3 (Boer et al., 2014). The lower expression of this gene in response to higher Ni
availabilitty could have resulted from a negative fedback type of gene expression regulation. Moreover,
under high temperature the CO2 release by urease activity, could have contributed to an increase in the
internal CO2 concentration. The factors mentiond aboved could possibly have influenced the fresh
weight of P. tricornutum. Another factor which could have likely influenced the changes observed in
the photosynthetic metabolism is the structure of silicified walls, which has been reported to be affected
by temperature, in studies with Thalassiosira pseudonana (Javaheri et al., 2015). The frustule of diatoms
like P. tricornutum and Coscinodiscus wailesii and Coscinodiscus centralis are complex biosilica
nanostructures that not only exhibit protection functions but are also involved in a photosynthetic
ehnancment mechanism. Romann et al. (2015) proposed that the frustule of C. centralis tends to focus
light and change its wavelenghts to the ones absorbed by the photosynthetic pigments and threfore
enhance photosynthesis. Townley et al. (2007) reported that in C. wailesii exposure to nickel sulfate
resulted in actual physical alterations in the size and number of pores, those being twice as large when
compared to control samples. It was then proposed that nickel sulfate could change the frustules’
structure by inactivating enzymes related with its biosynthesis, that Ni could form complex ions within
the hydrated amorphous silica and it was also mentioned that temperature could affect the silicification
process as well. The lower O2 eflux and higher consumption rates suggested that P. tricornutum will
contribute less to sea water oxygenation when exposed to increasing temperatures and metal pollution.
The combined analysis of the photosynthetic processes assessed with the Clark-type electrode and PAM
fluorometry, together with pigment profiling, allowed a better understanding of the impact of an
exposure to heat wave conditions and metal pollution. The oxygen evolving complexes located at the
donor side of the PSII are responsible for fueling the quinone pool with the necessary energy for the
electron transport from PSII to PSI (Strasser et al., 2000). These complexes are usually heat-sensitive
in higher plants (Duarte et al., 2016), however in P.tricornutum samples, OECs were shown to be
thermostable when exposed to heat wave conditions and Ni, as observed by the increase in the
percentage of activated OECs. The temperature shift increased the light harvesting pigments abundance
explaining the higher energy absorption and QA turnover. This increase in the FCP pigments may have
been a compensation mechanism to compensate the lower PSII efficiency. However, this increase in the
amount of energy absorbed caused an increase of trapped energy due to the lower electron trasport rate.
This excessive energy appeared to be dissipated as heat. The exposure to the highest Ni concentration
did change PSII efficiency, however, the concentration of light harvesting pigments tended to decrease,
suggesting that the slight increase in energy absorption observed was not influenced by this decrease.
The electron transport per cross section decreased at 18 ºC with Ni exposure which could have been

19
related to lower turnover of the QA and the smaller pool of oxidized quinones, suggesting that the slight
increase in energy dissapation could be caused by quinone damage. The energy dissipation increase can
activate photoprotective mechanisms to avoid cellular damage involving pigments such as Ddx, Dtx and
β-carotene (Kuczynska et al., 2015) which lead to non-photochemical quenching (NPQ) in the antenna
pigment-protein complexes reducing the excitation of PSII reaction centres. Indeed, an increase in Ddx
and Dtx concentrations was observed in heat wave exposed samples, which showed the highest values
of dissipation. The decrease observed in concentration of β – carotene was unexpected since it has been
described to increase with temperature (Haubner et al., 2014) in P. tricornutum. However, the
hypothesis of a higher biosynthetic rate of this antioxidant pigment cannot be excluded, since it might
be rapidly consumed, in order to generate increased levels of Fx and Dtx through the diatoxanthin cycle
(Mulders et al., 2014) to aid protection against ROS damage (Figure 4.1).
Figure 4.1 – Carotenoid biosynthesis pathways in P. tricornutum. Blue and green define alternative pathways. Bold marks
the carotenoids analysed in this study. Adapted from Kuczynska et al. (2015).
The decrease of the concentration in the main pigments also suggested that exposure to Ni may have
influenced the turnover between synthesis and degradation which has been reported for extremely toxic
metals such as Hg and Cr (Yadav, 2010). This was already observed by Cabrita et al. (2017) in samples
of P. tricornutum exposed to a Ni concentration of 2 µg L-1 and other trace metals which showed a lower
content of Chl a, Chl c and β-carotene. The decrease in photosynthetic pigments could also explain the
lower photosynthesis rate as Ni has been described as being cabpable of replacing the Mg2+ in
chlorophyll in aquatic plants so a similar interacting mechanism in P. tricornutum is possible (Brix et
al., 2017). The parameter previously reported by Kuczynska et al. (2015) as a stress biomarker in
stresses such as high- and low light, Fx / Chl c ratio, did not show statiscally significant differences
between treatments and control samples. However, there was a tendency to decrease with Ni and a
temperature rise.
An adequate fatty acid composition of membrane lipids, especially those of thylakoid membranes, is
essential for a fully operating photosynthesis (Gombos et al., 1994) since there is a permanent interaction
between pigments and lipids (Kuczynska et al., 2015). The fatty acid analysis showed that both stresses
decreased the relative abundance of PUFA which includes the ɷ-3 fatty acid EPA and chloroplastidial
fatty acids such as C16:3, and increased the abundance of saturated fatty acids such as C16:0 leading to

20
a decrease in the DBI and nutritional value (higher ɷ-6 / ɷ-3 ratio). This and the increase in total fatty
acids is a stress related response previously described in P. tricornutum when exposed to abiotic stresses
(Dodson et al., 2014; Siron et al., 1989; Yang et al., 2013; Yongmanitchai and Ward, 1991) which is
also caused by a deviation from a healty photosynthesis and sugar metabolism, here, possibly caused by
a decrease in the activity of Rubisco (William and Morris, 1982) in heat wave exposed samples. The
lower DBI could have contributed to a decrease of membrane fluidity as a protection mechanism against
high temperatures (Dodoson et al., 2014). The gene expression of the ERΔ5FAD.1/ ERΔ5FAD2
desaturases, that are probably involved in C20:5 synthesis, showed that there was an increase in the
combined expression of both desaturases which did not support the overall decrease of EPA content.
However, an increase in gene expression does not always mean an increase in protein activity (Heppard
et al., 1996; Matsuda et al., 2005). There is also the possibility that the increase in gene expression could
have been caused by a possible lower activity of the protein, acting as a feedback mechanism or that
other desaturase may be limiting this pathway. In fact, Zhu et al. (2017) proposed that the ERΔ6FAD
was a limiting step in EPA synthesis.
It was also observed that high temperature increased the ɷ-6/ɷ-3 ratio which is inversely related to the
nutritional value (Mühlroth et al., 2013). This not only implied that the nutritional value of
P. tricornutum was lower, due to the decrease in EPA content, but also shows that organisms feeding
on diatioms, which include marine fish, will have a deficient intake of ɷ-3 fatty acids and therefore
influence the structure of marine food webs. Arachidonic acid is an ɷ-6 unsaturated fatty acid which
increased concentration when growth temperature was shifted to 26 ºC. This could have resulted from a
decreased EPA biosynthetic rate as C20:4 is likelly its precursor.
When we delved into the identification and profile analysis of the lipid classes present in P. tricornutum
through GC and TLC, a relatively high percentage of neutral lipids was detected which include DAG,
TAG and free FA in control samples. The percentage of storage lipids such as TAG can vary in different
P. tricornutum ecotypes and also change during culture phase (Abida et al., 2015). TAG is known to be
a storage lipid that increases in stress conditions (Mühlroth et al., 2013) but since the Lepage method
does not allow separation of these lipid classes we cannot be certain if this high percentage directly
corresponds to TAG. However, TAG has been reported as a main component before (Yang et al., 2017)
but the culture method was different especially in growth temperature (18 ºC vs 30 ºC). Studies in
P. tricornutum by Yongmanitchai and Ward (1992) reported that the main lipid classes were MGDG
(31.4 %), TAG (19.1 %), DGDG (16.4 %) and SQDG (19.4 %) which showed a higher percentage of
TAG than studies published by Abida et al. (2015) highlighting the influence of different growth
conditions and type of strain studied on the fatty acid and lipid composition. By analysing the cell fatty
acid composition after nitrogen depletion, Shen et al. (2016) observed that some fatty acids such as
C16:0 and C16:1 were positively correlated with TAG content while EPA content was negatively
correlated and this pattern was found in this study, but only for the Ni-treated cells. Since temperature
is a major factor influencing fatty acid desaturation (Matsuda et al., 2005) in heat wave-treated samples
there is no obvious relationship between C16:0 percentages in total lipids and the NL content. To get
further insights regarding the impact of the stresses under study on the expression of TAG metabolism
genes, both DGAT and PNPLA3 were analysed since both have been reported to display altered
expression profiles under stress conditions (Mus et al., 2013; Wang et al., 2015), although such studies
have not been conducted for temperature or metal stress. Here while DGAT was downregulated in
response to both stresses, PNPLA3, which can act as a TAG lipase was slightly upregulated in heat
wave exposed samples. These samples showed the lowest NL values suggesting that the lower NL
percentage could have been caused by a higher TAG degradation. Since increasing TAG concentrations
have been reported to be essential for rapid synthesis of chloroplastidial lipids after stress conditions are
over (Cohen et al., 2000), and increase when diatoms face stresses such as nutrient deprivation (Abida
et al., 2015; Du and Benning, 2016), it is also possible that other DGAT encoding genes present in

21
P. tricornutum (49426, 49544 and 31662) may be up-regulated under the stresses tested in the present
work. Nevertheless, the high percentage of NL presented by this strain in control conditions is promising
for biodiesel production.
The MGDG content decreased with Ni exposure at 18 ºC, while it tended to increase at 26 ºC.
Furthermore, the relative abundance of EPA in this lipid class decreased and a tendency to C16:3
increase was observed. Gene expression analysis of the MGDG synthase demonstrated that the gene
expression increased with both stresses. The MGDG synthase was ~8.0 times more expressed at 26 ºC
than at 18 ºC and exposure to Ni tended to slightly decrease the expression (samples grown at 26 ºC
without Ni exposure: 7.9 ± 0.3; samples grown at 26 ºC with Ni exposure: 5.1 ± 0.4). The decrease in
MGDG content at 18 ºC with Ni exposure when it was observed a fold increase of the MGDG synthase,
could have been a feedback mechanism to try to restore the MGDG abundance and quality in thylakoid
membranes. Gene expression analysis of the PlastidΔ6FAD desaturase which produces C16:3Δ6,9,12-sn2-
MGDG (Dolch and Maréchal, 2015), strengthened the results here obtained. The expression of the
desaturase was 2 times higher in samples grown at 26 ºC and exposed to Ni than in control samples.
It was observed that both stresses, seperately, increased the abundance of DGDG but increased its
composition in C16:0, increased the abundance in SQDG with higher abundance of C16:0 and
decreased the abundance of PG. Since these are the four main components of thylakoid membranes
(Seiwert et al., 2017), changes in their propotion can affect photosynthesis. A reduced MGDG-DGDG
ratio has previously been associated with chloroplasts with impaired photosynthesis (Boudière et al.,
2014) and a decrease was observed in samples of P. tricornutum exposed to Ni at 18 ºC, however the
ratio did not change in samples exposed to a temperature increase or combined stresses. The low MGDG
ratio in samples exposed to metal pollution could have been a consequence of an increased activity of
the galactolipases which degrade galactolipids such as MGDG and DGDG and release FFAs
(Skórzyńska et al., 1991) . The changes observed in the MGDG abundance can be a constant interaction
between the galactolipases and the MGDG synthase. Metal exposure could have increased degradation
and therefore overlaped the MGDG synthesis from DAG, however, when temperature was shifted there
was an increase in MGDG synthase expression that could have resulted in increased activity of the
enzyme and consequently overlaped the degradation process or attempt to compensate it. The decrease
in PG abundance was more linear because there was a tendency to decrease with each stress, alone or
combined, which has been associated with thylakoid senescense and with low growth (Yu and Banning,
2003). Samples with the lowest PG percentage also registered the lowest growth rate and O2 production.
Since both PG and SQDG are negatively charged and both are located in the thylakoid membrane, it is
possible for one to compensate for the absense of the other in plastids (Jouhet et al., 2010) and this was
supported by a higher SQDG - PG ratio (data not shown). A ratio measured between the neutral and
negatively charged lipid classes that are present in thylakoid membranes was slightly lower at 18 ºC
with Ni exposure probably caused by the decrease in MGDG observed in the same coditions. The lower
ratio indicated a negative enviroment of the thylakoid membrane and could have also impaired
photosynthesis.
These changes observed in thylakoid lipids were in agreement with results obtained by PAM
fluorometry. Since DGDG is known to be especially bound to PSII and play an important role in the
stabilization of the OECs, it enforced the results obtained by PAM fluorometry (Mizusawa and Wada,
2012; Sakurai et al., 2007) The lipid distribution around QA an QB (MGDG is closer to QA and SQDG
and PG are closer to QB) diverges, allowing electron transport modulation (Kern and Guskov, 2011).
Nickel exposed samples displayed less MGDG content and smaller turnover of QA probably caused by
a less stable quinone environment.
The concentration of lipid peroxidation products decreased with exposure to stress. This response could
have been caused by the lower DBI or the increase in antioxidant pigments. Reactive oxygen species
are naturally formed in metabolic processes such as electron transport, however, these can react to

22
double bonds in mebrane lipids causing damage (Sewelam et al., 2016). The lower DBI suggested that
ROS had less probability to interact with double bonds of the fatty acids and the increase in antioxidant
pigments could have contributed to prevent ROS impact in membrane lipids.
As discussed above, an increase in temperature and Ni exposure at normal growth temperature (18 ºC),
allowed to assess the different effects of each stress in the physiology and metabolism of P. tricornutum.
Although the combined effect of both stresses was not always linear and just an increase in temperature
had the tendency to negatively affect the most (ex: fresh weight), the EPA content and other fatty acid
related parameters, such as DBI, registered the lowest values when both stresses were combined. This
synergistic effect may be caused by a relationship between Ni2+ absorption and temperature which has
been reported to be higher between 23 and 30 ºC (Seregin and Kozhevnikova, 2006).
As positive acheivements of this study, we obtained strong and matching results related to the effects of
global warming and metal pollution on the metabolism of P. tricornutum through destructive and non
destructive methods, allowing the use of less time-consuming and non-destructive methods such as
PAM fluorometry and Clark-type oxygen electrode to assess the quality of diatom photosynthesis. Some
biomarkers of heat stress and metal pollution were also identified, including the content in saturated
fatty acids such as C16:0, the double bond index, EPA content and PAM-derived paramenters such as
the photosynthetic efficiency of PSII. These parameters can efficiently indicate deviations from optimal
growth conditions. From a biotechnological point of view, P. tricornutum showed to be a good organism
to produce high amounts of Fx when grown at 26 ºC which has been described as having strong
antioxidant, anti-inflammatory, anti-obesity, antidiabetic and anticancer properties (Xia et al., 2013) and
also the high amounts of neutral lipids present in the P. tricornutum strain used in this work, even under
control conditions, together with a high amount of EFA suggest, that it is a possible source of FA for
biotecnological porpuses such as aquaculture and biodiesel production.
5. Conclusions
The results of this study where P. tricornutum cells were exposed to two stresses – temperature and
metal pollution – alone and combined, provided valuable information about the acting mechanisms of
these stressors in key metabolic processes. Decreases were observed in photosynthesis, the contents of
light harvesting pigments, nutritional value due to low EPA content, changes in abundance of membrane
lipids and expression of photosynthesis and lipid metabolism related genes. These results highlighted
the importance of early stress detection to avoid severe consequences on marine ecosystems and global
trophic chains. For this, efficient and fast biomarkers, mostly related to the non-invasive JIP test, can be
used in the field to assess physiological alterations caused by these stresses while biochemical analysis
derived parameters such as pigments concentration, EPA percentage and saturated fatty acids (C16:0)
allow a precise and more comprehensive understanding of the changes behind stress responses.

23
6. References
Abida, H., Dolch, L.J., Meï, C., Villanova, V., Conte, M., Block, M.A., Finazzi, G., Bastien, O., Tirichine, L.,
Bowler, C., Rébeillé, F., Petroutsos, D., Jouhet, J., Maréchal, E., 2015. Membrane glycerolipid remodeling
triggered by nitrogen and phosphorus starvation in Phaeodactylum tricornutum. Plant Physiol. 167, 118–136.
doi:10.1104/pp.114.252395
Anjum, N.A., Duarte, B., Caçador, I., Sleimi, N., Duarte, A.C., Pereira, E., 2016. Biophysical and Biochemical
Markers of Metal/Metalloid-Impacts in Salt Marsh Halophytes and Their Implications. Front. Environ. Sci. 4, 1–
13. doi:10.3389/fenvs.2016.00024
Arao, T., Yamada, M., 1994. Biosynthesis of polyunsaturated fatty acids in the marine diatom, Phaeodactylum
tricornutum. Phytochemistry 35, 1177–1181. doi:10.1016/S0031-9422(00)94817-9
Armstrong, W., 1994. Polarographic oxygen electrodes and their use in plant aeration studies. Proc. R. Soc.
Edinburgh. 102B, 511–527. doi:10.1017
Baldi, M., Pasqui, M., Cesarone, F., Chiara, G. De, 2005. Heat Waves in the Mediterranean Region: Analysis and
Model Results. 16th Conf. Clim. Var. Chang.
Bencko, V., 1983. Nickel: a review of its occupational and environmental toxicology. J. Hyg. Epidemiol.
Microbiol. Immunol. 27, 237–47. PMID: 6224846
Boer, J.L., Mulrooney, S.B., Hausinger, R.P., 2014. Nickel-Dependent Metalloenzymes. Arch. Biochem. Biophys.
doi:10.1016/j.abb.2013.09.002
Boudière, L., Michaud, M., Petroutsos, D., Rébeillé, F., Falconet, D., Bastien, O., Roy, S., Finazzi, G., Rolland,
N., Jouhet, J., Block, M.A., Maréchal, E., 2014. Glycerolipids in photosynthesis: Composition, synthesis and
trafficking. Biochim. Biophys. Acta - Bioenerg. 1837, 470–480. doi:10.1016/j.bbabio.2013.09.007
Bowler, C., Allen, A.E., Badger, J.H., Grimwood, J., Jabbari, K., Kuo, A., Maheswari, U., Martens, C., Maumus,
F., Otillar, R.P., Rayko, E., Salamov, A., Vandepoele, K., Beszteri, B., Gruber, A., Heijde, M., Katinka, M., Mock,
T., Valentin, K., Verret, F., Berges, J.A., Brownlee, C., Cadoret, J.-P., Chiovhti, A., Choi, C.J., Coesel, S., De
Martino, A., Detter, J.C., Durkin, C., Falciatore, A., Fournet, J., Haruta, M., Huysman, M.J.J., Jenkins, B.D.,
Jiroutova, K., Jorgensen, R.E., Joubert, Y., Kaplan, A., Kröger, N., Kroth, P.G., La Roche, J., Lindquist, E.,
Lommer, M., Martin-JÈZÈQuel, V., Lopez, P.J., Lucas, S., Mangogna, M., Mcginnis, K., Medlin, L.K., Montsant,
A., Oudot-Le, S.M.-P., Napoli, C., Obornik, M., Schnitzler, P.M., Petit, J.-L., Porcel, B.M., Poulsen, N., Robison,
M., Rychlewski, L., Rynearson, T.A., Schmutz, J., Shapiro, H., Siaut, M., Stanley, M., Sussman, M.R., Taylor,
A.R., Vardi, A., Von Dassow, P., Vyverman, W., Willis, A., Wyrwicz, L.S., Rokhsar, D.S., Weissenbach, J.,
Armbrust, E. V, Green, B.R., Van De Peer, Y., Grigoriev, I. V., 2008. The Phaeodactylum genome reveals the
evolutionary history of diatom genomes. Nature 456, 239. doi:10.1038/nature07410;
Brix, K. V., Schlekat, C.E., Garman, E.R., 2017. The mechanisms of nickel toxicity in aquatic environments: An
adverse outcome pathway analysis. Environ. Toxicol. Chem. 36, 1128–1137. doi:10.1002/etc.3706
Cabrita, M.T., 2014. Phytoplankton community indicators of changes associated with dredging in the Tagus
estuary (Portugal). Environ. Pollut. 191, 17–24. doi:10.1016/j.envpol.2014.04.001
Cabrita, M.T., Duarte, B., Gameiro, C., Godinho, R.M., Caçador, I., 2017. Photochemical features and trace
element substituted chlorophylls as early detection biomarkers of metal exposure in the model diatom
Phaeodactylum tricornutum. Ecol. Indic. 0–1. doi:10.1016/j.ecolind.2017.07.057
Cabrita, M.T., Gameiro, C., Utkin, A.B., Duarte, B., Caçador, I., Cartaxana, P., 2016. Photosynthetic pigment
laser-induced fluorescence indicators for the detection of changes associated with trace element stress in the diatom
model species Phaeodactylum tricornutum. Environ. Monit. Assess. 188. doi:10.1007/s10661-016-5293-4
24
Cohen, Z., Khozin-Goldberg, I., Adlerstein, D., Bigogno, C., 2000. The role of triacylglycerol as a reservoir of
polyunsaturated fatty acids for the rapid production of chloroplastic lipids in certain microalgae. Biochem. Soc.
Trans. 28, 740 LP-743. PMID: 11171190
Dahlman, L., 2017. Climate Change: Global Temperature. Found in: https://www.climate.gov/news-
features/understanding-climate/climate-change-global-temperature
Dasari, H.P., Pozo, I., Ferri-Yáñez, F., Araújo, M.B., 2014. A Regional Climate Study of Heat Waves over the
Iberian Peninsula. Atmos. Clim. Sci. 4, 841–853. doi:10.4236/acs.2014.45074
De Martino, A., Bartual, A., Willis, A., Meichenin, A., Villazán, B., Maheswari, U., Bowler, C., 2011.
Physiological and molecular evidence that environmental changes elicit morphological interconversion in the
model diatom Phaeodactylum tricornutum. Protist 162, 462–481. doi:10.1016/j.protis.2011.02.002
Dodson, V.J., Mouget, J.L., Dahmen, J.L., Leblond, J.D., 2014. The long and short of it: Temperature-dependent
modifications of fatty acid chain length and unsaturation in the galactolipid profiles of the diatoms Haslea ostrearia
and Phaeodactylum tricornutum. Hydrobiologia 727, 95–107. doi:10.1007/s10750-013-1790-4
Dolch, L.J., Maréchal, E., 2015. Inventory of fatty acid desaturases in the pennate diatom Phaeodactylum
tricornutum. Mar. Drugs 13, 1317–1339. doi:10.3390/md13031317
Domergue, F., Lerchl, J., Zähringer, U., Heinz, E., 2002. Cloning and functional characterization of
Phaeodactylum tricornutum front-end desaturases involved in eicosapentaenoic acid biosynthesis. Eur. J.
Biochem. 269, 4105–4113. doi:10.1046/j.1432-1033.2002.03104.x
Domingues, N., Matos, A.R., da Silva, J.M., Cartaxana, P., 2012. Response of the Diatom Phaeodactylum
tricornutum to photooxidative stress resulting from high light exposure. PLoS One 7, 1–6.
doi:10.1371/journal.pone.0038162
Doney, S., Ruckelshaus, M., Duffy, J., Barry, J., Chan, F., English, C., Galindo, H., Grebmeier, J., Hollowed, A.,
Knowlton, N., Polovina, J., Rabalais, N., Sydeman, W., Talley, L., 2012. Climate Change Impacts on Marine
Ecosystems. Ann. Rev. Mar. Sci. doi:10.1146/annurev-marine-041911-111611
Doney, S.C., 2010. The growing human footprint on coastal and open-ocean biogeochemistry. Science (1512-
1516). 328, 1512–1516. doi:10.1126/science.1185198
Du, Z.-Y., Benning, C., 2016. Triacylglycerol Accumulation in Photosynthetic Cells in Plants and Algae, in:
Nakamura, Y., Li-Beisson, Y. (Eds 1), Lipids in Plant and Algae Development. Springer International Publishing,
Cham, pp. 179–205. doi:10.1007/978-3-319-25979-6_8
Duarte, B., Cabrita, M.T., Gameiro, C., Matos, A.R., Godinho, R., Marques, J.C., Caçador, I., 2017. Disentangling
the photochemical salinity tolerance in Aster tripolium L.: connecting biophysical traits with changes in fatty acid
composition. Plant Biol. 19. http://dx.doi.org/10.1111/plb.12517.
Duarte, B., Goessling, J.W., Marques, J.C., Caçador, I., 2015. Ecophysiological constraints of Aster tripolium
under extreme thermal events impacts: Merging biophysical, biochemical and genetic insights. Plant Physiol.
Biochem. 97, 217–228. doi:10.1016/j.plaphy.2015.10.015
Duarte, B., Marques, J.C., Caçador, I., 2016. Ecophysiological response of native and invasive Spartina species
to extreme temperature events in Mediterranean marshes. Biol. Invasions 18, 2189–2205. doi:10.1007/s10530-
015-0958-4
EEA, 2012. Climate Change, Impacts and Vulnerability in Europe 2012, An Indicator Based Report. EEA Report
No.12/2012. European Environment Agency (EEA), Copenhagen, Denmark 304 pp.
Eggleton, J., Thomas, K. V., 2004. A review of factors affecting the release and bioavailability of contaminants
during sediment disturbance events. Environ. Int. 30, 973–980. doi:10.1016/j.envint.2004.03.001

25
Falciatore, A., d'Alcalà, M.R., Croot, P., Bowler, C., 2000. Perception of Environmental Signals by a Marine
Diatom. Science. 288, 2363 LP-2366. doi:10.1126/science.288.5475.2363
Feijão, E., Gameiro, C., Duarte, B., Caçador, I., Cabrita, M.T., Matos, A.R., 2017. Consequences of global
warming and metal pollution on the metabolism of omega-3 and -6 fatty acids of Phaeodactylum tricornutum. The
3rd general meeting of COST action FA1306 with the title "Field phenotyping technologies from woody perennials
to annual crops". Poster available at: https://www.plant-phenotyping.org/about_3rd_general_meeting
Feijão, E., Gameiro, C., Franzitta, M., Duarte, B., Caçador, I., Cabrita, M.T., Matos, A.R., 2017. Heat wave
impacts on the model diatom Phaeodactylum tricornutum: Searching for photochemical and fatty acid biomarkers
of thermal stress. Ecol. Indic. 0–1. doi:10.1016/j.ecolind.2017.07.058
Galloway, A.W.E., Winder, M., 2015. Partitioning the Relative Importance of Phylogeny and Environmental
Conditions on Phytoplankton Fatty Acids. PLoS One 10, 1–23. doi:10.1371/journal.pone.0130053
Gameiro, C., Brotas, V., 2010. Patterns of Phytoplankton variability in the Tagus estuary (Portugal). Estuar. Coasts
33, 311–323. http://dx.doi.org/10.1007/s12237-009- 9194-4.
Gameiro, C., Cartaxana, P., Brotas, V., 2007. Environmental drivers of phytoplankton distribution and
composition in Tagus Estuary, Portugal. Estuar. Coast. Shelf Sci. 75, 21–34. doi:10.1016/j.ecss.2007.05.014
Gameiro, C., Utkin, A.B., Cartaxana, P., da Silva, J.M., Matos, A.R., 2016. The use of laser induced chlorophyll
fluorescence (LIF) as a fast and non-destructive method to in-vestigate water deficit in Arabidopsis. Agric. Water
Manag. 164, 127–136. http://dx. doi.org/10.1016/j.agwat.2015.09.008.
Goldman, J.C., 1977. Temperature effects on phytoplankton growth in continuous culture. Limnol.Oceanogr. 22,
932–936. doi: 10.4319/lo.1977.22.5.0932
Gombos, Z., Wada, H., Hideg, E., Murata, N., 1994. The Unsaturation of Membrane Lipids Stabilizes
Photosynthesis against Heat Stress. Plant Physiol. 104, 563–567. doi:10.1104/pp.104.2.563
Guillard, R.R.L., Ryther, J.H., 1962. Studies of marine planktonic diatoms: I. Cyclotella nana Hustedt, and
Detonula confervacea (Cleve) Gran. Can. J. Microbiol. 8, 229–239. doi:10.1139/m62-029
Haubner, N., Sylvander, P., Vuori, K., Snoeijs, P., 2014. Abiotic stress modifies the synthesis of alpha-tocopherol
and beta-carotene in phytoplankton species. J. Phycol. 50, 753–759. doi:10.1111/jpy.12198
Hamilton, M.L., Haslam, R.P., Napier, J.A., Sayanova, O., 2014. Metabolic engineering of Phaeodactylum
tricornutum for the enhanced accumulation of omega-3 long chain polyunsaturated fatty acids. Metab. Eng. 22,
3–9. doi:10.1016/j.ymben.2013.12.003
He, L., Han, X., Yu, Z., 2014. A rare Phaeodactylum tricornutum cruciform morphotype: Culture conditions,
transformation and unique fatty acid characteristics. PLoS One 9, 1–8. doi:10.1371/journal.pone.0093922
Heath, R.L., Packer, L., 1968. Photoperoxidation in isolated chloroplasts. Arch. Biochem. Biophys. 125, 189–198.
doi:10.1016/0003-9861(68)90654-1
Heppard, E.P., Kinney, a J., Stecca, K.L., Miao, G.H., 1996. Developmental and growth temperature regulation of
two different microsomal omega-6 desaturase genes in soybeans. Plant Physiol. 110, 311–319.
doi:10.1104/pp.110.1.311
Herring, S.C., Hoerling, M.P., Kossin, J.P., Peterson, T.C., Stott, P.A. (Eds), 2015. Explaining Extreme Events of
2014 from a Climate Perspective. Bull. Am. Meteorol. Soc. 96, S1–S172. doi:10.1175/BAMS-D-15-00157.1
IPCC., 2014. Climate Change 2014: Impacts, Adaptation and Vulnerability. Part A. Global and Sectoral Aspects.
Contribution of Working Group II to the Fifth Assessment Report of the Intergovernmental Panel on Climate
Change. In: Field, C.B. (Ed.), Cambridge University Press, Cambridge, UK.

26
Janssen, M., Bathke, L., Marquardt, J., Krumbein, W.E., Rhiel, E., 2001. Changes in the photosynthetic apparatus
of diatoms in response to low and high light intensities. Int. Microbiol. 4, 27–33. doi:10.1007/s101230100005
Javaheri, N., Dries, R., Burson, a., Stal, L.J., Sloot, P.M. a., Kaandorp, J. a., 2015. Temperature affects the silicate
morphology in a diatom. Sci. Rep. 5, 11652. doi:10.1038/srep11652
Jiang, H., Gao, K., 2004. Effects of lowering temperature during culture on the production of polyunsaturated fatty
acids in the marine diatom Phaeodactylum tricornutum (Bacillariophyceae). J. Phycol. 40, 651–654.
doi:10.1111/j.1529-8817.2004.03112.x
Jouhet, J., Dubots, E., Maréchal, E., Block, M.A., 2010. Lipid Trafficking in Plant Photosynthetic Cells, in: Wada,
H., Murata, N. (Eds.), Lipids in Photosynthesis: Essential and Regulatory Functions. Springer Netherlands,
Dordrecht, pp. 349–372. doi:10.1007/978-90-481-2863-1_16
Karl, T.R., Trenberth, K.E., 2003. Modern Global Climate Change. Science 302, 1719–1723.
doi:10.1126/science.1090228
Kern, J., Guskov, A., 2011. Lipids in photosystem II: Multifunctional cofactors. J. Photochem. Photobiol. B Biol.
104, 19–34. doi:10.1016/j.jphotobiol.2011.02.025
Khandekar, M.L., Murty, T.S., Chittibabu, P., 2005. The global warming debate: A review of the state of science.
Pure Appl. Geophys. 162, 1557–1586. doi:10.1007/s00024-005-2683-x
Kuczynska, P., Jemiola-Rzeminska, M., Strzalka, K., 2015. Photosynthetic pigments in diatoms. Mar. Drugs 13,
5847–5881. doi:10.3390/md13095847
Kudo, I., Miyamoto, M., Noiri, Y., Maita, Y., 2000. Combined Effects of Temperature and Iron on the Growth
and Physiology of the Marine Diatom Phaeodactylum Tricornutum (Bacillariophyceae). J. Phycol. 36, 1096–1102.
doi:10.1046/j.1529-8817.2000.99042.x
Küpper, H., Seibert, S., Parameswaran, A., 2007. Fast, sensitive, and inexpensive alternative to analytical pigment
HPLC: Quantification of chlorophylls and carotenoids in crude extracts by fitting with Gauss peak spectra. Anal.
Chem. 79, 7611–7627. doi:10.1021/ac070236m
Lepage, M., 1967. Identification and composition of turnip root lipids. Lipids 2, 244–250.
doi:10.1007/BF02532563
Livak, K.J., Schmittgen, T.D., 2001. Analysis of Relative Gene Expression Data Using Real-Time Quantitative
PCR and the 2−ΔΔCT Method. Methods 25, 402–408. doi:10.1006/meth.2001.1262
Maazouzi, C., Masson, G., Izquierdo, M.S., Pihan, J.C., 2008. Midsummer heat wave effects on lacustrine
plankton: Variation of assemblage structure and fatty acid composition. J. Therm. Biol. 33, 287–296.
doi:10.1016/j.jtherbio.2008.03.002
Matos, A.R., Gameiro, C.L., Duarte, B., Caçador, I., Cabrita, M.T., 2016. Effects of nickel on the fatty acid
composition of the diatom Phaeodactylum tricornutum. Front. Mar. Sci. doi:10.3389/conf.FMARS.2016.04.00033
Matos, A.R., Mendes, A.T., Scotti-Campos, P., Arrabaça, J.D., 2009. Study of the effects of salicylic acid on
soybean mitochondrial lipids and respiratory properties using the alternative oxidase as a stress-reporter protein.
Physiol. Plant. 137, 485–497. doi:10.1111/j.1399-3054.2009.01250.x
Matsuda, O., Sakamoto, H., Hashimoto, T., Iba, K., 2005. A temperature-sensitive mechanism that regulates post-
translational stability of a plastidial ω-3 fatty acid desaturase (FAD8) in Arabidopsis leaf tissues. J. Biol. Chem.
280, 3597–3604. doi:10.1074/jbc.M407226200
Mizusawa, N., Wada, H., 2012. The role of lipids in photosystem II. Biochim. Biophys. Acta - Bioenerg. 1817,
194–208. doi:10.1016/j.bbabio.2011.04.008

27
Mühlroth, A., Li, K., Røkke, G., Winge, P., Olsen, Y., Hohmann-Marriott, M.F., Vadstein, O., Bones, A.M., 2013.
Pathways of lipid metabolism in marine algae, co-expression network, bottlenecks and candidate genes for
enhanced production of EPA and DHA in species of chromista. Mar. Drugs 11, 4662–4697.
doi:10.3390/md11114662
Mulders, K.J.M., Lamers, P.P., Martens, D.E., Wijffels, R.H., 2014. Phototrophic pigment production with
microalgae: Biological constraints and opportunities. J. Phycol. 50, 229–242. doi:10.1111/jpy.12173
Mus, F., Toussaint, J.-P., Cooksey, K.E., Fields, M.W., Gerlach, R., Peyton, B.M., Carlson, R.P., 2013.
Physiological and molecular analysis of carbon source supplementation and pH stress-induced lipid accumulation
in the marine diatom Phaeodactylum tricornutum. Appl. Microbiol. Biotechnol. 97, 3625–3642.
doi:10.1007/s00253-013-4747-7
OECD, Organisation for Economic Co-operation and Development, Freshwater algal and cyanobacteria, growth
inhibition test – test guideline 201, 2002. OECD Guidelines for the testing of chemicals, Paris, France, vol. 1 (2),
pp. 1–25.
Popko, J., Herrfurth, C., Feussner, K., Ischebeck, T., Iven, T., Haslam, R., Hamilton, M., Sayanova, O., Napier,
J., Khozin-Goldberg, I., Feussner, I., 2016. Metabolome Analysis Reveals Betaine Lipids as Major Source for
Triglyceride Formation, and the Accumulation of Sedoheptulose during Nitrogen-Starvation of Phaeodactylum
tricornutum. PLoS One 11, 1–23. doi:10.1371/journal.pone.0164673
Rees, T.A. V, Bekheet, I.A., 1982. The role of nickel in urea assimilation by algae. Planta 156, 385–387.
doi:10.1007/BF00393307
Romann, J., Valmalette, J.C., Chauton, M.S., Tranell, G., Einarsrud, M.A., Vadstein, O., 2015. Wavelength and
orientation dependent capture of light by diatom frustule nanostructures. Sci. Rep. 5, 17403.
doi:10.1038/srep17403
Sakurai, I., Mizusawa, N., Wada, H., Sato, N., 2007. Digalactosyldiacylglycerol Is Required for Stabilization of
the Oxygen-Evolving Complex in Photosystem II. Plant Physiol. 145, 1361–1370. doi:10.1104/pp.107.106781
Santos-Ballardo, D.U., Rossi, S., Hernández, V., Gómez, R.V., del Carmen Rendón-Unceta, M., Caro-Corrales,
J., Valdez-Ortiz, A., 2015. A simple spectrophotometric method for biomass measurement of important microalgae
species in aquaculture. Aquaculture 448, 87–92. doi:10.1016/j.aquaculture.2015.05.044
Schmittgen, T.D., Livak, K.J., 2008. Analyzing real-time PCR data by the comparative CT method. Nat. Protoc.
3, 1101–1108. doi:10.1038/nprot.2008.73
Seiwert, D., Witt, H., Janshoff, A., Paulsen, H., 2017. The non-bilayer lipid MGDG stabilizes the major light-
harvesting complex (LHCII) against unfolding. Sci. Rep. 7, 5158. doi:10.1038/s41598-017-05328-7
Seregin, I. V., Kozhevnikova, a. D., 2006. Physiological role of nickel and its toxic effects on higher plants. Russ.
J. Plant Physiol. 53, 257–277. doi:10.1134/S1021443706020178
Sewelam, N., Kazan, K., Schenk, P.M., 2016. Global Plant Stress Signaling: Reactive Oxygen Species at the
Cross-Road. Front. Plant Sci. 7, 1–21. doi:10.3389/fpls.2016.00187
Shen, P.L., Wang, H.T., Pan, Y.F., Meng, Y.Y., Wu, P.C., Xue, S., 2016. Identification of Characteristic Fatty
Acids to Quantify Triacylglycerols in Microalgae. Front. Plant Sci. 7, 162. doi:10.3389/fpls.2016.00162
Sigaud, T.C.S., Aidar, E., 1993. Salinity and temperature effects on the growth and chlorophyll-a content of some
planktonic algae. Bol. do Inst. Ocean. 41, 95–103. doi:10.1590/S0373-55241993000100008
Siron, R., Giusti, G., Berland, B., 1989. Changes in the fatty acid composition of Phaeodactylum tricornutum and
Dunaliella tertiolecta during growth and under phosphorus deficiency. Mar. Ecol. Prog. Ser. 55, 95–100.
doi:10.3354/meps055095
28
Skórzyńska, E., Urbanik-Sypniewska, T., Russa, R., Baszyński, T., 1991. Galactolipase Activity of Chloroplasts
in Cadmium-treated Runner Bean Plants. J. Plant Physiol. 138, 454–459. doi:10.1016/S0176-1617(11)80522-5
Strasser, R.J., Srivastava, A., Tsimilli-Michael, M., 2000. The fluorescence transient as a tool to characterize and
screen photosynthetic samples. Probing Photosynth. Mech. Regul. Adapt. 443–480. ISBN 9780748408214.
Stratton, G.W., Corke, C.T., 1979. The effect of nickel on the growth, photosynthesis, and nitrogenase activity of
Anabaena inaequalis. Can. J. Microbiol. 25, 1094–1099. PMID: 120221
Tesson, B., Gaillard, C., Martin-Jézéquel, V., 2009. Insights into the polymorphism of the diatom Phaeodactylum
tricornutum Bohlin. Bot. Mar. 52, 104–116. doi:10.1515/BOT.2009.012
Thauer, R.K., Diekert, G., Schönheit, P., 1980. Biological role of nickel. Trends Biochem. Sci. 5, 304–306.
doi:10.1016/0968-0004(80)90166-8
Townley, H.E., Woon, K.L., Payne, F.P., White-Cooper, H., Parker, A.R., 2007. Modification of the physical and
optical properties of the frustule of the diatom Coscinodiscus wailesii by nickel sulfate. Nanotechnology 18,
295101. doi:10.1088/0957-4484/18/29/295101
Valenzuela, J., Mazurie, A., Carlson, R.P., Gerlach, R., Cooksey, E.K., Peyton, B.M., Fields, M.W., 2012.
Potential role of multiple carbon fixation pathways during lipid accumulation in Phaeodactylum tricornutum.
Biotechnol. Biofuels 5, 40. doi:http://dx.doi.org/10.1186/1754-6834-5-40
Wang, X., Liu, Y.H., Hu, D.X., Balamurugan, S., Lu, Y., Yang, W.D., Liu, J.S., Li, H.Y., 2015. Identification of
a putative patatin-like phospholipase domain-containing protein 3 (PNPLA3) ortholog involved in lipid
metabolism in microalga Phaeodactylum tricornutum. Algal Res. 12, 274–279. doi:10.1016/j.algal.2015.09.005
Wiebe, R., Gaddy, V.L., 1940. The Solubility of Carbon Dioxide in Water at Various Temperatures from 12 to
40° and at Pressures to 500 Atmospheres. Critical Phenomena. J. Am. Chem. Soc. 62, 815–817.
doi:10.1021/ja01861a033
Wiktorowska-Owczarek, A., Berezinska, M., Nowak, J.Z., 2015. PUFAs: Structures, metabolism and functions.
Adv. Clin. Exp. Med. 24, 931–941. doi:10.17219/acem/31243
William, K.W.L., Morris, I., 1982. Temperature adaptation in Phaeodactylum tricornutum Bohlin: Photosynthetic
rate compensation and capacity. J. Exp. Mar. Bio. Ecol. 58, 135–150. doi:10.1016/0022-0981(82)90125-3
Xia, S., Wang, K., Wan, L., Li, A., Hu, Q., Zhang, C., 2013. Production, characterization, and antioxidant activity
of fucoxanthin from the marine diatom odontella aurita. Mar. Drugs 11, 2667–2681. doi:10.3390/md11072667
Yadav, S.K., 2010. Heavy metals toxicity in plants: An overview on the role of glutathione and phytochelatins in
heavy metal stress tolerance of plants. South African J. Bot. 76, 167. doi:10.1016/j.sajb.2009.10.007
Yang, Y., Du, L., Hosokawa, M., Miyashita, K., Kokubun, Y., Arai, H., Taroda, H., 2017. Fatty Acid and Lipid
Class Composition of the Microalga Phaeodactylum tricornutum 2016, 1–6. doi:10.5650/jos.ess16205
Yang, Z.K., Niu, Y.F., Ma, Y.H., Xue, J., Zhang, M.H., Yang, W.D., Liu, J.S., Lu, S.H., Guan, Y., Li, H.Y., 2013.
Molecular and cellular mechanisms of neutral lipid accumulation in diatom following nitrogen deprivation.
Biotechnol. Biofuels 6, 67. doi:10.1186/1754-6834-6-67
Yongmanitchai, W., Ward, O.P., 1992. Separation of lipid classes from Phaeodactylum tricornutum using silica
cartridges. Phytochemistry 31, 3405–3408. doi:10.1016/0031-9422(92)83694-T
Yongmanitchai, W., Ward, O.P., 1991. Growth of and omega-3 fatty acid production by Phaeodactylum
tricornutum under different culture conditions. Appl. Environ. Microbiol. PMID: 2014989.
Yu, B., Banning, C., 2003. Anionic lipids are required for chloroplast structure and function in Arabidopsis. Plant
J. 36, 762–770. doi:10.1046/j.1365-313X.2003.01918.x

29
Zhu, B.H., Tu, C.C., Shi, H.P., Yang, G.P., Pan, K.H., 2017. Overexpression of endogenous delta-6 fatty acid
desaturase gene enhances eicosapentaenoic acid accumulation in Phaeodactylum tricornutum. Process Biochem.
doi:10.1016/j.procbio.2017.03.013
Zhu, X.G., Govindjee, Baker, N.R., DeSturler, E., Ort, D.R., Long, S.P., 2005. Chlorophyll a fluorescence
induction kinetics in leaves predicted from a model describing each discrete step of excitation energy and electron
transfer associated with Photosystem II. Planta 223, 114–133. doi:10.1007/s00425-005-0064-4

30
7. Supplementary data
Supplemental Table S1 - Summary of fluorometric analysis parameters and their description.
Rapid Light Curves (RLC)
rETR
ETRmax
α
β
Relative electron transport rate at each light intensity (rETR
= QY x PAR x 0.5)
Maximum ETR obtained from the RLC after which photo-
inhibition can be observed
Photosynthetic efficiency, obtained from the initial slope of
the RLC
RLC related respiration, obtained from the final slope;
Photo-inhibition parameter
JIP-test
Area Corresponds to the oxidized quinone pool size available for
reduction and is a function of the area above the Kautsky plot
N
SM
Total number of electrons transferred into electron transport
chain
A measure of the energy needed to close all RCs
AOECs Activated oxygen-evolving complexes
ABS/CS Absorbed energy flux per cross-section
TRO/CS Trapped energy flux per cross-section
ETO/CS Electron transport energy flux per cross-section
DIO/CS Energy dissipated as heat per cross-section
RC/CS Number of available reaction centres per cross section
PG The grouping probability is a direct measure of the
connectivity between the two PSII units
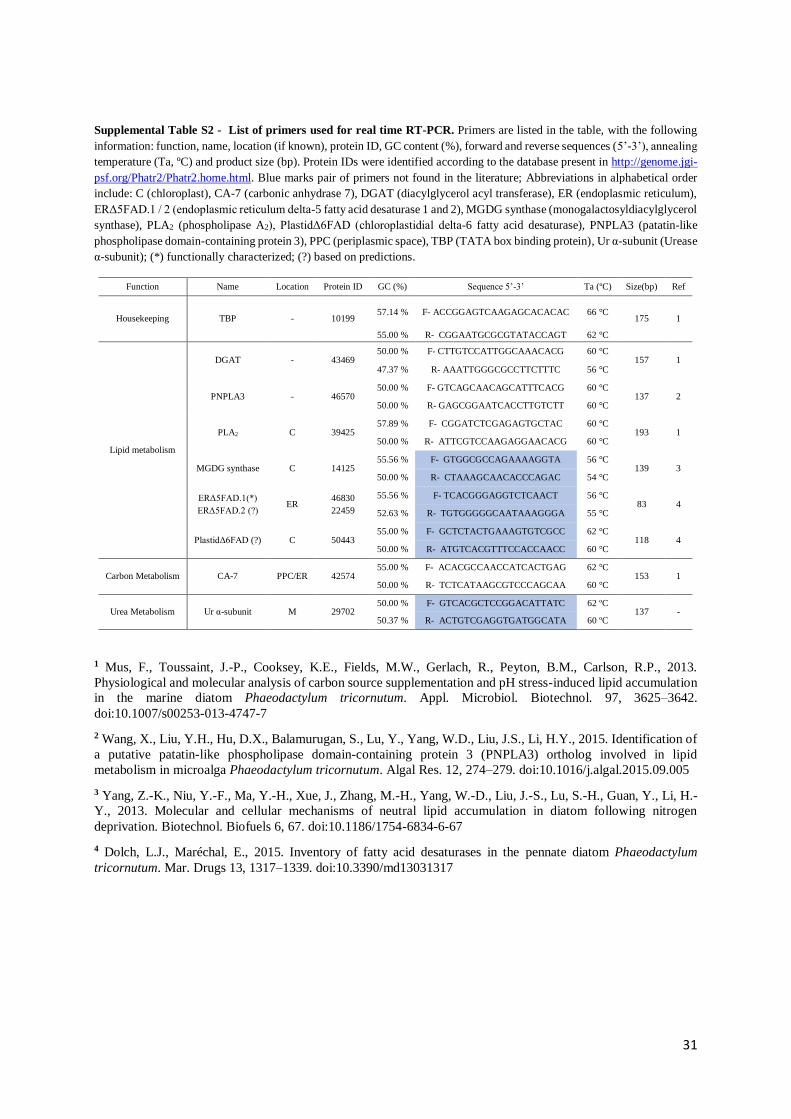
31
Supplemental Table S2 - List of primers used for real time RT-PCR. Primers are listed in the table, with the following
information: function, name, location (if known), protein ID, GC content (%), forward and reverse sequences (5’-3’), annealing
temperature (Ta, ºC) and product size (bp). Protein IDs were identified according to the database present in http://genome.jgi-
psf.org/Phatr2/Phatr2.home.html. Blue marks pair of primers not found in the literature; Abbreviations in alphabetical order
include: C (chloroplast), CA-7 (carbonic anhydrase 7), DGAT (diacylglycerol acyl transferase), ER (endoplasmic reticulum),
ERΔ5FAD.1 / 2 (endoplasmic reticulum delta-5 fatty acid desaturase 1 and 2), MGDG synthase (monogalactosyldiacylglycerol
synthase), PLA2 (phospholipase A2), PlastidΔ6FAD (chloroplastidial delta-6 fatty acid desaturase), PNPLA3 (patatin-like
phospholipase domain-containing protein 3), PPC (periplasmic space), TBP (TATA box binding protein), Ur α-subunit (Urease
α-subunit); (*) functionally characterized; (?) based on predictions.
1 Mus, F., Toussaint, J.-P., Cooksey, K.E., Fields, M.W., Gerlach, R., Peyton, B.M., Carlson, R.P., 2013.
Physiological and molecular analysis of carbon source supplementation and pH stress-induced lipid accumulation
in the marine diatom Phaeodactylum tricornutum. Appl. Microbiol. Biotechnol. 97, 3625–3642.
doi:10.1007/s00253-013-4747-7
2 Wang, X., Liu, Y.H., Hu, D.X., Balamurugan, S., Lu, Y., Yang, W.D., Liu, J.S., Li, H.Y., 2015. Identification of
a putative patatin-like phospholipase domain-containing protein 3 (PNPLA3) ortholog involved in lipid
metabolism in microalga Phaeodactylum tricornutum. Algal Res. 12, 274–279. doi:10.1016/j.algal.2015.09.005
3 Yang, Z.-K., Niu, Y.-F., Ma, Y.-H., Xue, J., Zhang, M.-H., Yang, W.-D., Liu, J.-S., Lu, S.-H., Guan, Y., Li, H.-
Y., 2013. Molecular and cellular mechanisms of neutral lipid accumulation in diatom following nitrogen
deprivation. Biotechnol. Biofuels 6, 67. doi:10.1186/1754-6834-6-67
4 Dolch, L.J., Maréchal, E., 2015. Inventory of fatty acid desaturases in the pennate diatom Phaeodactylum
tricornutum. Mar. Drugs 13, 1317–1339. doi:10.3390/md13031317
Function Name Location Protein ID GC (%) Sequence 5’-3’ Ta (ºC) Size(bp) Ref
Housekeeping TBP - 10199 57.14 % F- ACCGGAGTCAAGAGCACACAC 66 °C
175 1
55.00 % R- CGGAATGCGCGTATACCAGT 62 °C
Lipid metabolism
DGAT - 43469 50.00 % F- CTTGTCCATTGGCAAACACG 60 °C
157 1 47.37 % R- AAATTGGGCGCCTTCTTTC 56 °C
PNPLA3 - 46570 50.00 % F- GTCAGCAACAGCATTTCACG 60 °C
137 2 50.00 % R- GAGCGGAATCACCTTGTCTT 60 °C
PLA2 C 39425 57.89 % F- CGGATCTCGAGAGTGCTAC 60 °C
193 1 50.00 % R- ATTCGTCCAAGAGGAACACG 60 °C
MGDG synthase C 14125 55.56 % F- GTGGCGCCAGAAAAGGTA 56 °C
139 3 50.00 % R- CTAAAGCAACACCCAGAC 54 °C
ERΔ5FAD.1(*)
ERΔ5FAD.2 (?) ER
46830
22459
55.56 % F- TCACGGGAGGTCTCAACT 56 °C 83 4
52.63 % R- TGTGGGGGCAATAAAGGGA 55 °C
PlastidΔ6FAD (?) C 50443 55.00 % F- GCTCTACTGAAAGTGTCGCC 62 °C
118 4 50.00 % R- ATGTCACGTTTCCACCAACC 60 °C
Carbon Metabolism CA-7 PPC/ER 42574 55.00 % F- ACACGCCAACCATCACTGAG 62 °C
153 1 50.00 % R- TCTCATAAGCGTCCCAGCAA 60 °C
Urea Metabolism Ur α-subunit M 29702 50.00 % F- GTCACGCTCCGGACATTATC 62 ºC
137 - 50.37 % R- ACTGTCGAGGTGATGGCATA 60 ºC

32
Supplemental Figure S1 – Fatty acid distribution in P. tricornutum samples grown at 18 ºC and exposed to a heat wave
treatment (26 ºC, for three days) and increasing nickel concentrations (1, 2 and 5 µg L-1). Results were obtained through
direct methylation of 8 mL pellets; Shades of green, orange, blue and purple mark samples without Ni exposure and exposure
to final Ni concentrations of 1, 2 and 5 µg L-1, respectively; Shades of each colour mark exposure to stress conditions in a
period of 24, 48 and 72 hours; n = 1.

33
Supplemental Figure S2 – Total fatty acid content and DBI of P. tricornutum samples grown at 18 ºC and exposed to a
heat wave treatment (26 ºC, for three days) and increasing nickel concentrations (1, 2 and 5 µg L-1). Results were obtained
through direct methylation of 10 mL pellets; Shades of green, orange, blue and purple mark samples without Ni exposure and
exposure to final Ni concentrations of 1, 2 and 5 µg L-1, respectively; Shades of each colour mark exposure to stress conditions
in a period of 24, 48 and 72 hours; n = 1.