consequences of the lack of health insurance on health and
TRANSCRIPT

Consequences of the Lackof Health Insurance on
Health and Earnings
MIS
SOU
RIFO
UN
DAT
ION
FOR
HEA
LTH
Cover Missouri Project: Report 1

Established in 2000, the Missouri Foundation for Health is dedicated to its mission ofempowering the people of the communities we serve to achieve equal access to qualityhealth services that promote prevention and encourage healthy behaviors. In support of itsmission, the Foundation undertakes policy research to educate the public and decisionmakers on effective health policies that will result in long-term, positive health system changein the state of Missouri. Formulating sound health policies advances the Foundation’s effortsto increase access to high quality, cost-effective preventive and curative care, especially forthe uninsured, underinsured, and underserved in our service region of 84 Missouri countiesand the City of St. Louis.
The Missouri Foundation for Health does not take responsibility for any analysis, errors, oromissions of fact found in this report.
MIS
SOU
RIFO
UN
DAT
ION
FOR
HEA
LTH
About MFH

Cover Missouri ProjectPreface
In an effort to inform the discussion regarding practical policy options to expandhealth care coverage for the uninsured in Missouri, the Missouri Foundation forHealth (MFH) has established the Cover Missouri Project. Under this project, MFHhas engaged The Urban Institute to produce a series of papers which considersstrengths and weaknesses of the current health care system in Missouri and explores options for decreasing the number of uninsured. MFH offers these studies as a means to further understand and ultimately improve access to health care coverage.
Missouri currently faces considerable challenges related to creating an equitable and comprehensive system of health care for all Missourians. In 2005, between635,000 and 707,000 Missouri residents were without health insurance. In addition,eligibility cuts and cost-sharing changes to Missouri’s Medicaid program made in2005 increased the number of uninsured. Ultimately, these changes may shiftMissouri from being one of the 12 states with the lowest uninsurance rates to beingamong the 12 states with the highest rates of uninsurance.
Research broadly documents the serious health and financial consequencesassociated with being uninsured. The uninsured live sicker and die younger thanthose with insurance. They forego preventive care and seek health care at moreadvanced stages of disease. Society then bears these costs through lowerproductivity, increased rates of communicable diseases, and higher insurancepremiums. Those without health insurance often must choose between visiting adoctor and paying for other essentials.
This paper, “Consequences of the Lack of Health Insurance on Health and Earnings,” represents the first in the series emerging under the Cover Missouri Project. It examines the serious health and financial consequences associated withbeing uninsured, as well as the importance of health insurance as it relates topeople’s access to care, use of services, and ultimately to their health outcomes.
Leslie ReedVice President for Health PolicyMissouri Foundation for Health

About the Author
Jack Hadley, PhD, is a Principal Research Associate with The Urban Institute’s Health PolicyCenter and a Senior Fellow at the Center for Studying Health System Change. He is a pastpresident of AcademyHealth (the Association for Health Services Research) and a former editorof Inquiry, a professional journal devoted to health services research and policy. His researchhas emphasized statistical analysis of various issues in health care organization and financing,including determinants of health insurance coverage, the consequences of lack of healthinsurance, access to care, physician and hospital payment, and the effects of managed care onhealth care delivery systems.
“Consequences of the Lack of Health Insurance on Health and Earnings” builds on prior workfunded by the Kaiser Family Foundation. Dr. Hadley acknowledges Matt Cravens for hisexcellent research assistance in the preparation of Report 1 for the Cover Missouri Project.
About The Urban Institute
The Urban Institute is a nonprofit nonpartisan policy research and educational organizationestablished to examine the social, economic, and governance problems facing the nation. Itprovides information and analysis to public and private decision makers to help them addressthese challenges and strives to raise citizen understanding of the issues and tradeoffs in policymaking. The Urban Institute works to promote sound social policy and public debate on national priorities through gathering and analyzing data, conducting policy research, eval-uating programs and services, and educating all Americans. More information about The UrbanInstitute may be found at www.urban.org.

In 2005, between 635,000 and 707,000Missouri residents were without healthinsurance. Additionally, changes to thestate’s Medicaid program in 2005substantially increased the number ofuninsured. This first Cover Missouri Projectreport presents an overview of the serioushealth and financial consequences associatedwith being uninsured and examines howmuch insurance matters in relation topeople’s access to care, use of services, andultimately health outcomes.
The link between health insurance andhealth status has been documented in majorreports1-6 published between 2000 and 2004by the American College of Physicians, theInstitute of Medicine (IOM), and others.Those reports established that lack of healthinsurance creates substantial financial
barriers to receiving medical care. Anextensive body of research found that, onaverage, the uninsured receive about half asmuch medical care as the insured.7
More important, the reports collected asolid base of evidence supporting theconclusion that lower use of medical care bythe uninsured results in poorer health statusfor these individuals. The uninsured usefewer screening and prevention services anddelay seeking care when sick. As a result,when they do enter the medical care system,they tend to be sicker and at more advanceddisease stages than the insured. Moreover,even when seriously ill or suffering from anidentified chronic condition, the uninsuredreceive less care than the insured. Together,these factors result in higher rates ofmorbidity and mortality for the uninsured,both in general and for specific diseases.
Poor health exacts an obvious and directphysical impact on people. It also has asignificant economic impact in the form oflost earnings due to fewer years of healthylife and lower productivity while at work.These economic costs are substantial andrepresent a hidden cost of uninsurance, overand above the cost of the medical care usedby the uninsured.
This Cover Missouri Project report high-lights and updates key findings fromresearch studies, organizing the resultsaround a series of propositions about the useof health services and health outcomes ofthe uninsured. Specifically, this report posesand presents evidence in support of the
Consequences of the Lack of HealthInsurance on Health and Earnings
Cover Missouri Project: Report 1
Table of Contents
1 Introduction3 The Uninsured Are More Likely To
Postpone or Fail To Receive NeededMedical Care
4 The Uninsured Are Less Likely To BeScreened for Serious Illnesses
5 The Uninsured Are More Likely To Enter theHealth Care System in Poorer Health orMore Advanced Disease Stage
8 The Uninsured Receive Less TherapeuticCare, Even for Serious Acute or PotentiallyLife Threatening Chronic Conditions
11 The Uninsured Have Worse HealthOutcomes Than the Insured, Both inGeneral and for Specific Diseases
15 The Value of Lost Health19 Endnotes

2MISSOURI FOUNDATION FOR HEALTH
HealthInsurance
MedicalCare
Health
Work Income
Education
Environment, Culture, Attitudes,Preferences, Health Behaviors
Fig. 1. Relationships Among Health Insurance, Medical Care Use, Health, Education, and Income
following hypotheses. Relative to the privatelyinsured, the uninsured are:
n more likely to postpone or fail to receiveneeded medical care;
n less likely to be screened for seriousillnesses;
n more likely to enter the health caresystem in poorer health;
n more likely to receive less treatment, even for serious acute or chronic healthconditions; and
n more likely to have worse healthoutcomes, both in general and for specific diseases.
The last section addresses the economicconsequences of uninsurance and poor health.Not surprisingly, poor health associated withlack of insurance reduces earning capacity.However, the larger economic impact stemsfrom the value of good health and longevitylost because individuals lack health insurance.If insurance coverage was expanded to coverthe uninsured, the “benefit” would be thevalue of lost health that would be gained byan increase in coverage for the currentlyuninsured. It would then be possible tocompare this “benefit” to estimates of theextra cost of medical care that the uninsuredwould receive if they had coverage. A
comparison of the cost and benefit ofexpanding insurance coverage shows thatcovering the uninsured would be a goodinvestment for the nation.
Although the propositions listed above seemrelatively straightforward, empiricalverification can be difficult because of theinability to conduct experiments thatrandomly assign people to be insured oruninsured and then follow their experiencesover a sustained period of time. As illustratedby Figure 1, the relationships among healthinsurance coverage, medical care use, health,work, education, and income are complexbecause causation moves in multipledirections and outcomes are affected by manydifficult to observe factors.
Critical literature reviews by Jack Hadley6 andthe IOM3, 4 assessed a large body of researchin considerable detail, focusing on issues ofresearch design, methodological rigor, anddata quality. Because these issues have beenaddressed extensively by those recent reviews,this current effort focuses on the results ofkey studies using charts to facilitate andsimplify the presentation of findings for abroad, policy-oriented audience.

3COVER MISSOURI PROJECT: REPORT 1
Numerous general household surveys havefound that the uninsured, both adults andchildren, are more likely than the insured to report having had an unmet medical careneed in the last year. For example, usingdata from national surveys conducted in1997, 1999, 2001, and 2003, Strunk andCunningham8 showed that the uninsured are more than three times as likely to reportan unmet medical need. Other nationalsurveys9 confirm these results and show thatpeople with intermittent insurance coverageare also more likely than the continuouslyinsured to report that they did not receiveneeded medical care.
While the differences in reports of unmetmedical needs between the uninsured andthe insured are striking, most Americans(57%) nevertheless believe that theuninsured are able to obtain medical care ifit is truly required.10 This general opinion of the uninsured reflects the idea thatsurveys of self-reported unmet needs
illustrate differences between the perceptionsof the uninsured and the insured in terms ofwhat is needed medical care or an unmetneed, rather than differences in real need forcare. For example, the uninsured may have alower threshold of perceiving a need for carebecause of greater concerns than the insuredabout being able to pay for care if theybecome seriously ill.
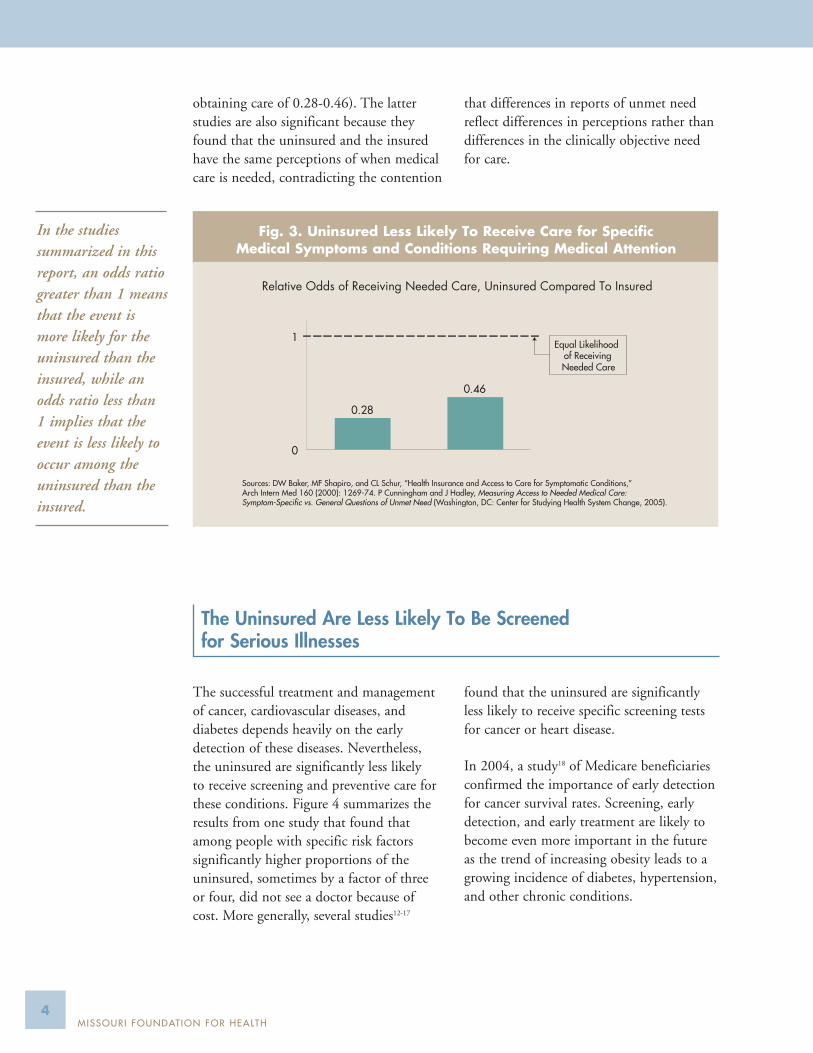
The studies summarized in Figures 2 and 3show that the gap in access to care persistseven when survey questions ask explicitlyabout serious conditions. For example, theuninsured are almost seven times more likelythan the insured (20% compared to 3%) tonot obtain needed medical care for a seriouscondition. This gap persists even whenpeople are asked about seeking medical carein response to the onset of specific medicalconditions or symptoms that physiciansjudge to require medical attention. Theuninsured are much less likely to obtain carein these situations (relative odds11 of not
The Uninsured Are More Likely To Postpone or Fail To Receive Needed Medical Care
Source: C Hoffman and A Schlobohm, Uninsured in America – A Chart Book (Washington, DC: The Kaiser Commission on Medicaid and the Uninsured, 2000).
Fig. 2. Uninsured More Likely To Postpone or Fail To Get NeededMedical Care for Serious Conditions Because of Cost
4MISSOURI FOUNDATION FOR HEALTH
obtaining care of 0.28-0.46). The latterstudies are also significant because theyfound that the uninsured and the insuredhave the same perceptions of when medicalcare is needed, contradicting the contention
that differences in reports of unmet needreflect differences in perceptions rather thandifferences in the clinically objective needfor care.
The successful treatment and managementof cancer, cardiovascular diseases, anddiabetes depends heavily on the earlydetection of these diseases. Nevertheless, the uninsured are significantly less likely to receive screening and preventive care forthese conditions. Figure 4 summarizes theresults from one study that found thatamong people with specific risk factorssignificantly higher proportions of theuninsured, sometimes by a factor of three or four, did not see a doctor because of cost. More generally, several studies12-17
found that the uninsured are significantlyless likely to receive specific screening testsfor cancer or heart disease.
In 2004, a study18 of Medicare beneficiariesconfirmed the importance of early detectionfor cancer survival rates. Screening, earlydetection, and early treatment are likely tobecome even more important in the futureas the trend of increasing obesity leads to agrowing incidence of diabetes, hypertension,and other chronic conditions.
The Uninsured Are Less Likely To Be Screened for Serious Illnesses
Relative Odds of Receiving Needed Care, Uninsured Compared To Insured
Sources: DW Baker, MF Shapiro, and CL Schur, “Health Insurance and Access to Care for Symptomatic Conditions,” Arch Intern Med 160 (2000): 1269-74. P Cunningham and J Hadley, Measuring Access to Needed Medical Care: Symptom-Specific vs. General Questions of Unmet Need (Washington, DC: Center for Studying Health System Change, 2005).
0.46
0.28
0
1Equal Likelihood
of ReceivingNeeded Care
Fig. 3. Uninsured Less Likely To Receive Care for Specific Medical Symptoms and Conditions Requiring Medical Attention
In the studiessummarized in thisreport, an odds ratiogreater than 1 meansthat the event ismore likely for theuninsured than theinsured, while anodds ratio less than1 implies that theevent is less likely tooccur among theuninsured than theinsured.

5COVER MISSOURI PROJECT: REPORT 1
People with:
34.8%
36.9%
10.4%
10.1%
11.7%
12.7%
40.3%
45.9%Diabetes
Hypertension
HighCholesterol
Overweight
90.4%
19.5%
75.0%
6.3%
11.0%
32.2%
Cancer:
Mammogram
Pap Test
Fecal OccultBlood Test
40.5%
19.5%
18.1%
5.8%
Heart Disease:
HypertensionScreening
CholesterolScreeningInsured Uninsured
% Not Receiving Screening% Unable To See a Physician Last YearBecause of Cost, by Risk Group
Source: JZ Ayanian et al, “Unmet Health Needs of Uninsured Adults in the United States,” JAMA 284.16 (2000): 2061-9.
Fig. 4. Uninsured Less Likely To Be Screened for Serious Illnesses
If the uninsured have greater difficultyobtaining needed care or are more likely toforego clinically validated screening services,then it would be expected that when they doenter the health care system, especially for aserious illness, they would more likely be inpoorer health or at a more advanced diseasestage than the privately insured. Figures 5and 6 summarize studies of cancer patientsin Florida and of diabetics who enterMedicare’s End Stage Renal Disease (ESRD)program.
Uninsured cancer patients are much morelikely to be diagnosed at an advanced diseasestage when the cancer has spread beyond the
local site where it first occurs and successfultreatment becomes more difficult. Forexample, the relative odds of 2.6 for a late-stage melanoma diagnosis reflects underlyingproportions of 31.9 percent of uninsuredmelanoma patients diagnosed at a late stagecompared to 10.8-15.6 percent ofcommercially insured melanoma patients.The underlying proportions for late-stagebreast cancer diagnosis were 42.6 percent forthe uninsured compared to about 32 percentfor the commercially insured. Similar resultswere found in studies involving breast cancerpatients in New Jersey and California.19, 20
The Uninsured Are More Likely To Enter the Health Care Systemin Poorer Health or More Advanced Disease Stage

Relative Odds of Late- vs. Early-Stage Cancer Diagnosis, Uninsured/Privately Insured
1.51.4 1.51.7
2.6
0
1
2
3
BreastCancer
CervicalCancer
ColonCancer
Melanoma ProstateCancer
Equal Odds of Late-StageDiagnosis
Sources: RG Roetzheim et al, “Effects of Health Insurance and Race on Early Detection of Cancer,” Journal of the National Cancer Institute 91.16 (1999): 1409-15. JM Ferrante et al, “Clinical and Demographic Predictors of Late-Stage Cervical Cancer,” Archivesof Family Medicine 9 (May 2000): 439-45.
Fig. 5. Uninsured Cancer Patients More Likely To Be Diagnosed with Late-Stage Disease
Similarly, the studies of the initial healthcondition of diabetics qualifying for theESRD program (Figure 6) found thatuninsured diabetics have worse ratings thanthe insured for several kidney functionindicators, which have been shown to beimportant indicators of successful treatment.
For example, 62 percent of previouslyuninsured people beginning dialysis underthe ESRD program had low hematocritlevels, compared to 49 percent of peoplewho had private insurance (relativeodds = 1.3).
6MISSOURI FOUNDATION FOR HEALTH
1.61.31.4
0
1
2
Serum AlbuminBelow Lower Limitof Normal Range
Hematocrit < 28%
Suboptimal KidneyFunction
(GFR<5 ml/min/1.73 m2)
Equal Odds ofWorse Health
Sources: GT Obrador et al, “Prevalence of and Factors Associated with Suboptimal Care Before Initiation of Dialysisin the United States,” J Am Society of Nephrology 10.8 (1999): 1793-800. AT Kauss et al, “Late Initiation of DialysisAmong Women and Ethnic Minorities in the United States,” J Am Society of Nephrology 11 (2000) 2351-7.
Fig. 6. Uninsured Diabetics in Worse Health When They Enter ESRD Program

7COVER MISSOURI PROJECT: REPORT 1
Two large national studies of hospitaladmissions (Figure 7) found that when theuninsured are admitted to a hospital, it isfor a more serious mix of diseases andconditions, based on expected mortality,than the privately insured. Figure 7 alsopresents evidence of the consequences of
delayed care associated with the lack ofinsurance. Two studies of people admittedto the hospital for appendicitis found thatthe uninsured are significantly more likelyto have a ruptured appendix. For example,in the California study, 34.3 percent of theuninsured adult appendicitis patients
EqualExpected Mortality
1.091.13
0
1
ERAdmissions
Non-ERAdmissions
Relative Expected Mortality Ratefor Admission Diagnoses
1.69
0
1
Average Relative SeverityIndex on Admission
EqualSeverity
Source: J Hadley, EP Steinberg, and J Feder,“Comparison of Uninsured and Privately InsuredHospital Patients: Condition on Admission,Resource Use, and Outcome,” JAMA 265.3(1991): 374-9.
Source: RC Bradbury, JH Golec, and PM Steen, “ComparingUninsured and Privately Insured Hospital Patients: AdmissionSeverity, Health Outcomes and Resource Use,” Health Services Management Research 14.3 (2001): 203-10.
1.77
1.441.46
0
1
2
California,1984-1989
Children, 6-18 Women, 19-50
Relative Odds of Ruptured Appendix
National Hospital Data
1.56
Relative Probability of Abnormal Tissue Pathology
National Hospital Data
Equal Oddsof WorseHealth
Sources: P Braveman et al, “Insurance-Related Differences in the Risk of Ruptured Appendix,” New England J Medicine 331(1994): 444-49. J Hadley and E Steinberg, Access to Care in the Medicaid Program: Analyses of Hospital Discharge Data forWomen and Children (Institute for Health Care Research and Policy, Washington, DC: Georgetown Univ. Medical Center, 1996). J Hadley, EP Steinberg, and J Feder, “Comparison of Uninsured and Privately Insured Hospital Patients: Condition on Admission,Resource Use, and Outcome.” JAMA 265.3 (1991): 374-9.
Fig. 7. Uninsured Admitted to the Hospital for More SeriousConditions Than Privately Insured

8MISSOURI FOUNDATION FOR HEALTH
experienced a ruptured appendix, comparedto 28.1 percent of the privately insuredpatients. In another study, an analysis of tissue pathology results for people who had
in-hospital colonoscopies or endoscopiesfound that the uninsured were 50 percentmore likely to have an abnormal tissuereport.
Although many studies7 have shown that theuninsured receive less medical care than theinsured, many people believe that once aperson enters the health care system with aserious illness or injury, he or she will receivethe care needed regardless of insurancecoverage.10 However, studies of care receivedby cancer, heart, and trauma patientsindicate that the uninsured receive less carethan the insured, even for serious illnesses orconditions. Similarly, studies have foundthat uninsured people with potentially lifethreatening chronic conditions are less likelyto receive treatment or to have theirconditions monitored on a regular basis. Figures 8-12 summarize the results of several
studies supporting the hypothesis that theuninsured receive less care even when ill. Forexample (from Figure 8), 36.7 percent ofuninsured people with high blood pressuredid not take blood pressure medication,even though advised to do so by a doctor;the proportion of insured patients nottaking recommended blood pressuremedication was 23.7 percent. Similarly, 43.3 percent of uninsured people withelevated cholesterol were not takingcholesterol medication, compared to 29.1percent of insured people with elevatedcholesterol. Uninsured diabetics are abouthalf as likely as insured diabetics to receiverecommended monitoring or treatment for
The Uninsured Receive Less Therapeutic Care, Even for SeriousAcute or Potentially Life Threatening Chronic Conditions
9.9%
22.1%
% Without BP Check-In Last Year
23.7%
36.7%
% Not Taking BP Medication Who Were
Advised by Doctor
Source: Families USA, Getting Less Care: The Uninsured with Chronic Health Conditions (Washington, DC: Families USA Foundation, 2001).
Non-Elderly Adults with High Blood Pressure Non-Elderly Adults withElevated Cholesterol
29.1%
43.3%
% Not Taking Cholesterol Medication
Insured Uninsured
Fig. 8. Uninsured Receive Less Treatment When Sick: High Blood Pressure and Elevated Cholesterol

0.490.4
0.50.4
0
1
Dilated Eye Examin Last Year
Foot Exam byHealth Prof. in
Last Year
Blood GlucoseCheck in Last
Year
EPO Use toImprove Anemia
Equal Odds ofTreatment
Sources: KM Nelson et al, “The Association Between Health Insurance Coverage and Diabetes Care: Data from the 2000 BehavioralRisk Factor Surveillance System,” Health Services Research 40.2 (2005): 261-372. GT Obrador et al, “Prevalence of and FactorsAssociated with Suboptimal Care before Initiation of Dialysis in the United States, J Am Society of Nephrology 10.8 (1999): 1793-800.
86%75%
Angiography
Insured
Uninsured
36%29%
Angioplasty
Percent Receiving a Cardiac Procedure
19%14%
Bypass Surgery
Source: MJ Sada et al, “Influence of Payor on Use of Invasive Cardiac Procedures and Patient Outcome after Myocardial Infarction in the United States,” J Am College of Cardiology 31.7 (1998): 1474-80.
9COVER MISSOURI PROJECT: REPORT 1
Fig. 9. Uninsured Receive Less Treatment When Sick: Diabetes
Fig. 10. Uninsured Receive Less Treatment When Sick: Heart Attack Patients
their condition (Figure 9). Several otherstudies have found similar results for treatingpeople with hypertension,21, 22 cardiovasculardisease,23-25 and cardiovascular disease andchronic kidney disease.26, 27
Even more striking are the studies thatcompare care received by people who haveheart attacks or experience serious traumas,which are arguably independent of priorinsurance status and do not reflect people’schoices about whether to be covered or not.Roughly 5-10 percent fewer uninsured heart
attack patients (Figure 10) receivedangiography, angioplasty, or bypass surgery.Figure 11 shows that uninsured traumapatients in Massachusetts were 20-30 percentless likely to undergo surgery, even in casesof severe trauma or when treated in a Level Itrauma unit. Additionally, in a study ofserious automobile accident victims inWisconsin, the uninsured spent almost threefewer days in the hospital and received aboutone-third less care (measured by totalhospital charges) compared to the insured.In a study of care received by sick newborns

10MISSOURI FOUNDATION FOR HEALTH
in California (Figure 12), uninsurednewborns had significantly shorter stays (by1.8-5.9 days) and received significantly lesscare (measured by total hospital charges)than privately insured newborns for severalspecific medical diagnoses. Finally, anotherstudy28 found that the uninsured are at
much greater risk of substandard hospitalcare due to negligence or poor quality: 40.3percent of adverse events among theuninsured were due to negligence, comparedto 20.3 percent for the privately insuredwho experienced adverse events.
0.700.78
0.68
AllTrauma
SevereTrauma
Level ITraumaUnits
Equal Odds of Having Surgery
Source: JS Haas and L Goldman, “Acutely Injured Patientswith Trauma in Masssachusetts: Differences in Care andMortality, by Insurance Status,” Am J Public Health 84.10(1994): 1605-8.
Avg. TotalHospital Charges
Severe Auto Accidents(10,842 Cases in Wisconsin Hospitals, 1992-1997)
9.17
6.44
Avg. Daysin Hospital
Source: JJ Doyle Jr, Health Insurance, Treatment andOutcomes: Using Auto Accidents as Health Shocks,(Washington, DC: National Bureau of Economic Research(working paper 11099), 2005).
1
$20.7k
$13.1k
Insured
Uninsured
Trauma(15,008 Cases in Mass. Hospitals, 1990)
Fig. 11. Uninsured Receive Less Treatment When Sick: Trauma and Severe Auto Accidents
-3.8
-5.9
-3.9
-1.8-2.3
CongenitalAnomalies
RespirationProblems
Jaundice orHemolyticDisease Infections
Low BirthWeight or Fetal
MalnutritionEqual Avg.
Days of Care
Source: P Braveman et al, “Difference in Hospital Resource Allocation Among Sick Newborns According to Insurance Coverage,”JAMA 266:23 (1991): 3300-8.
0
-$6,507
-$9,776
-$6,724
-$3,294
-$6,119
0Equal Avg.
Total Charges
Fig. 12. Uninsured Receive Less Treatment When Sick: Sick Newborns (California 1987)

11COVER MISSOURI PROJECT: REPORT 1
The Uninsured Have Worse Health Outcomes Than the Insured,Both in General and for Specific Diseases
Despite the documented differences in accessto care and service use, some might stillbelieve that these differences reflect overuseof unnecessary services by the insured, ratherthan underuse of needed services by theuninsured. The ultimate resolution of thisquestion lies in comparisons of healthoutcomes. If the “access gap” between theuninsured and the insured primarily reflectsa lower likelihood of receiving neededmedical care when sick, then this differenceshould show up in the form of worse healthoutcomes.
The studies summarized in Figures 13-17support this conclusion. Each presentsevidence that the uninsured have worsehealth outcomes than the privately insured.Three different studies of trauma cases, two of which also documented that theuninsured receive less care, showsignificantly higher odds of in-hospital deathfor uninsured cases (Figure 13). The studies
of trauma cases in Massachusetts hospitalsand of pediatric trauma cases nationwidefound that the relative odds of death wereabout twice as large for the uninsured as the insured. Among pediatric trauma cases, 2.1 percent of children with commercialinsurance died, compared to 4.2 percent ofuninsured children.
Two studies of infant health, one nationaland one in California, found a significantlygreater likelihood of either infant mortalityor other adverse infant health outcomes(Figure 14). Although infant death is arelatively rare event, the national study oflow-income mothers found that 1.7 percentof uninsured mothers’ babies died during theneonatal period, compared to 0.8 percent ofprivately insured mothers’ babies. Studies ofdifferent cancers in Florida and New Jerseyand of heart attack victims nationally and inMassachusetts found lower survival rates foruninsured cancer patients and higher
2.151.90
2.02
1.23
AllTrauma
SevereTrauma
PediatricTrauma
SevereAuto
Accidents
Equal Oddsof Death
Sources: JS Haas and L Goldman “Acutely Injured Patients with Trauma in Massachusetts: Differences in Care and Mortality, byInsurance Status,” Am J Public Health 84.10 (1994): 1605-8. G Li and G Davis, “Insurance Status and Survival Outcome in PediatricTrauma Patients,” Academic Emergency Medicine 8.5 (2001) 517. JJ Doyle Jr, Health Insurance, Treatment and Outcomes: Using Auto Accidents as Health Shocks, (Washington, DC: National Bureau of Economic Research (working paper 11099), 2005).
Massachusetts, 1990
National, 1996-1999(23,134 cases)
Wisconsin,1992-1997
1
2
Fig. 13. Uninsured Have Worse Health Outcomes:Trauma Deaths

12MISSOURI FOUNDATION FOR HEALTH
mortality rates (both in-hospital and within30 days of discharge) for uninsured patientswho had a heart attack (Figure 15). Thehigher relative odds of death for theuninsured reported in Figure 15 reflectsignificant differences by insurance status inthe underlying probabilities of dying. Forexample, without controlling for the effectsof other factors 5.4 percent of the uninsuredheart patients in the national study died inthe hospital, compared to 3.8 percent of the privately insured patients. In theMassachusetts study, which was limited toheart attack victims but included 30-daypost-hospital follow-up, 13.1 percent of theuninsured died, compared to 8.3 percent ofthe privately insured. In the Florida study of breast cancer patients, 18 percent of theuninsured died within 3-4 years ofdiagnosis, compared to 13-14 percent ofprivately insured patients.
Research that followed a group of medicallyindigent people in California who lost theirMedicaid coverage found that the group that lost coverage experienced a significant
worsening of their hypertensive conditionand also experienced higher mortality,although the difference was not statisticallysignificant due to the small sample size.29
However, that study’s findings were similarto those reported by the National HealthInsurance Experiment,30 which found thatlow-income people assigned to the highcost-sharing plan had a significant decreasein blood pressure control and an increase of10 percent in expected mortality as a result.Similarly, another analysis of a small sampleof veterans who lost access to free care fromthe Veterans Administration found that thegroup that lost coverage had a higherincidence of uncontrolled high bloodpressure.31
Findings of higher death rates for uninsuredtrauma patients, newborns, cancer patients,and heart attack patients are the culminationof less preventive care and screening forserious chronic conditions, poorer health, ormore advanced disease upon entry into thehealth care system and less therapeutic careeven when seriously ill or injured. Figures 16
1.39
Post-Neonatal Neonatal
Infant Mortality(Births to Low-Income Mothers)
Sources: NE Moss and K Carver, “The Effect of WIC and Medicaid on Infant Mortality in the United States,” Am J of Public Health88.9 (1998): 1354-6. P Braveman et al, “Adverse Outcomes and Lack of Health Insurance Among Newborns in an Eight-County Area of California, 1982 to 1986,” New England J Medicine 321.8 (1989): 508-13.
1.20
* Death, transfer to another hospital, or stay > 5 days.
Adverse Events*California, 1982-1986
EqualOdds of
Death or Adverse
Outcome
1
1.46
Fig. 14. Uninsured Have Worse Health Outcomes:Infant Mortality

13COVER MISSOURI PROJECT: REPORT 1
1.411.31
Colorectal Cancer Breast Cancer
Cancer
Sources: RG Roetzheim et al, “Effects of Health Insurance and Race on Colorectal Cancer Treatments and Outcomes,” Am J Public Health 90.11 (2000): 1746-54. RG Roetzheim et al, “Effects of Health Insurance and Race on Breast Carcinoma Treatments and Outcomes,” Cancer 89.11 (2000): 2202-13. JZ Ayanian et al, “The Relationship Between Health Insurance Coverage and Clinical Outcomes Among Women with Breast Cancer,” New England J Medicine 329 (July 1993): 326-31.
EqualOdds ofDeath
Florida
Breast Cancer,New Jersey
1
2
1.54
In-Hospital 30-day
Heart Attacks
Sources: JG Canto et al, “Payer Status and the Utilization of Hospital Resources in Acute Myocardial Infarction,” Arch Intern Med 160 (2000): 817-23. GJ Young and BB Cohen, “Inequities in Hospital Care, the Massachusetts Experience,” Inquiry 28 (Fall 1991): 255-62.
1.29
Massachusetts, 1987
In-Hospital:National
1
2
1.59
1.49
EqualOdds ofDeath
Fig. 15. Uninsured Have Worse Health Outcomes:Cancer and Heart Attack Deaths
and 17 extrapolate the pattern shown toexist for specific diseases to adult deathsfrom all causes of mortality and for increasedmorbidity among the near-elderly, who maybe especially vulnerable to the lack ofinsurance because of the increasing incidenceof serious health conditions during latermiddle age.
The studies reported in Figure 16 followedthe same people from five to 14 years and,with the one exception of African Americanwomen, found that the uninsured had asignificantly higher mortality rate than the
privately insured. The relative odds of 1.25found in the 1993 study by Franks, Clancy,and Gold reflects an almost twofolddifference in mortality rates between adultsuninsured at baseline compared to thoseinsured at baseline, 18.4 percent vs. 9.6 percent. Based on this study, the IOMestimated that there are approximately18,000 excess deaths among non-elderlyadults each year due to the lack of healthinsurance.3 The relative odds found bySorlie et al in 1994 suggest that this estimatemay be conservative.

14MISSOURI FOUNDATION FOR HEALTH
25-74 Year Olds,1971/75-1987
1.1
1.71.6
1.25
1.6
0
1
WhiteMen
WhiteWomen
BlackMen
BlackWomen
Sources: P Franks, CM Clancy, and MR Gold, “Health Insurance and Mortality: Evidence from a National Cohort,”JAMA 270.6 (1993): 737-41. PD Sorlie et al, “Mortality in the Uninsured Compared with that in Persons withPublic and Private Health Insurance,” Arch Intern Med 154 (Nov 1994): 2409-16.
25-64 Year Olds, 1982-1987
EqualOdds ofDeath
Fig. 16. Uninsured Have Worse Health Outcomes:Adult Mortality, All Causes
Sources: DW Baker et al, “Lack of Health Insurance and Decline in Overall Health in Late Middle Age,” New England J Med 345.15 (2001): 1106-12. JM McWilliams et al, “Health Insurance Coverage and Mortality Among the Near-Elderly,” Health Affairs 23.4 (2004): 223-33. J Hadley and T Waidmann, “Health Insurance and Health at Age 65: Implications for Medicare,” Health Services Research (forthcoming 2005).
1.77
1.451.63
1.23
0
1
New MobilityDifficulty
Major Decline in Health
Mortality Mortality
Equal Oddsof Death or
Major Declinein Health
1.451.26
0
1
New MobilityDifficulty
Major Decline in Health
Near-Elderly Who Became Uninsured, 1992-1996
Source: DW Baker et al, “Loss of Health Insurance and the Risk for a Decline in Self-Reported Health and Physical Functioning,”Medical Care 40.11(2002): 1126-31.
Equal Odds ofMajor Decline
in Health
Fig. 17. Uninsured Have Worse Health Outcomes:Mortality and Morbidity in the Near Elderly
Figure 17 summarizes the primary results of three studies that used very differentstatistical methods and measures of healthchange in analyses of the same near-elderlypopulation participating in the longitudinalNational Health and Retirement Survey.
All three found that the uninsured near-elderly were significantly more likely to dieprematurely or to experience a significantdecline in health status. Relative odds variedin these studies from 1.23 to 1.77.

15COVER MISSOURI PROJECT: REPORT 1
The Value of Lost Health
Although public policy tends to focusprimarily on the cost of paying for medicalcare used by the uninsured, research showsthat the uninsured use much less care thanthe insured and that the uninsured pay for about one-third of the care they receiveout of their own pockets.32 In 2001,uncompensated care, i.e., care received bythe uninsured but paid for by some othersource of payment, was estimated to be$34.5 billion, which represented about 2.6 percent of total health care spending.As much as 75-85 percent of the cost of
uncompensated care was financed by acombination of government grants,subsidies, indirect payments to privatehealth care providers, and care delivered by public health care providers.32
Subsequent research updated the cost ofuncompensated care to be $40.7 billion in2004.33 This research also estimated that ifthe uninsured had coverage comparable tothe range of coverage held by lower andlower-middle income families, medical carespending by the uninsured would increaseby $48 billion per year, which representsabout 3 percent of total health carespending and 0.4 percent of the nation’sgross domestic product.
These costs, however, represent only afraction of the total economic costsassociated with the reduction in health thatcan be attributed to the lack of healthinsurance. The bulk of the economic costdue to the lack of insurance takes the formof lower productivity, time lost from work,lower earnings, and the lost intrinsic valuethat people place on a year of healthy life.
Figure 18 summarizes the results of twostudies that focused on one portion of theeconomic cost of poor health, the
relationship between health and annualearnings, which combines the effects of bothreduced wages and fewer hours of work. Thecross-sectional study, which used data from1999 on almost 54,000 wage and salaryworkers, found that after controlling forfirm size, industry, age, marital status, andrace and ethnicity, workers in poor healthearned about 11 percent less per year thanworkers in good health. An earlier studyanalyzed annual earnings of older middle-aged (45-64 years) workers who participatedin a 10-year longitudinal study that beganin the mid-1960s and found that healthproblems over time reduced annual earningsby about 20 percent for men, 12.5 percentfor white women, and 27.8 percent for black women.
While these estimates imply substantialeconomic losses incurred by the uninsured,they do not account for the subjective valuethat people place on a year of healthy life.This broader concept of value includesfreedom from morbidity and physicaldiscomfort, reduced emotional stress forone’s self and family, and the ability to enjoyphysical and mental activities during timeaway from work. These elements of the costof poor health were assessed in a studyconducted by the IOM,34 which used adollar value of $160,000 as its benchmarkfor the subjective worth of a year of healthylife.35 Relying on an extensive priorliterature, the IOM developed annualestimates of the value of health lost thatranged between $1,645 and $3,280 peruninsured person in 2001. The lowerestimate assumes that lack of insuranceaffects only mortality while the higherestimate assumes that it also influencesmorbidity. Applying these per-personestimates to the number of uninsured peoplein 2001 produced an annual national total

16MISSOURI FOUNDATION FOR HEALTH
value of lost health ranging from $65 billionto $130 billion.
The midpoint of this range is $97.5 billion,which can be thought of as the totalnational value of the health that is lost in asingle year because of lack of insurance.Updating this figure to 2004 dollarsincreases the estimate to $104 billion, morethan two times the estimated additional$48 billion cost of providing coverage forthe nation’s uninsured.33
The IOM study used these figures tocalculate the “cost-effectiveness” of treatingexpanded health insurance coverage as a life-saving measure and compared it to avariety of both medical and non-medicalapproaches to saving lives and improvinghealth. Using the metric of “cost per quality-adjusted life-year (QALY) saved,” this studyshowed that covering all of the uninsuredhas a mid-range cost-effectiveness value of$115,000 per QALY. As summarized inTable 1, this compares favorably to coronary
-11.5%
-16.1%
-6.2%
-8.6%
-12.9%-11.2%-11.9%
-9.3%
M F M F M F M FNo Difference in Earnings
Source: Calculated from P Fronstin and AG Holtmann, Workers and Access to Health Care: Consequences of BeingUninsured (EBRI-ERF Policy Forum, Washington, DC: Employee Benefit Research Institute, May 2000).
0%
LT 100Workers
100-499 Workers
500-999Workers
1000+Workers
Percentage Reduction in Annual Earnings Due to Poor HealthAmong Workers, 1999, by Firm Size and Gender*
-20.7%-22.3%
-12.5%
-27.8%
White Men Black Men White Women Black WomenNo Difference in Annual Earnings
Source: TN Chirikos and G Nestel, “Further Evidence on the Economic Effects of Poor Health,” Review of Economicsand Statistics 67 (1985): 61-9.
0%
Percentage Reduction in Annual Earnings Due to Health Problems,1966-1976, by Race and Gender*
* Estimates represent averages across smaller firm size categories.
* Estimates represent averages across smaller firm size categories.
Fig. 18. Poor Health Reduces Annual Earnings from Work

17COVER MISSOURI PROJECT: REPORT 1
angiography for people with mild angina,annual mammograms for women betweenthe ages of 40 and 65, screening health careworkers to prevent HIV transmission topatients, and annual Pap smears to detectcervical cancer.
Although these dollar estimates convey asense of precise valuation of the costsimposed on society by the lack of insurance,it is important to remember that they arestill estimates. They rely on numerousassumptions regarding the impact of the lack of insurance on mortality andmorbidity, the incidence of those effects over a person’s lifetime, including theconsequences of adverse health events thatoccur when a person is uninsured and carry
over to periods when a person has coverage,for example, when the uninsured turn 65and qualify for Medicare.36
Table 2 provides a conceptual framework fororganizing the broad cost consequences of the lack of insurance. While theconsequences are probably greatest for theuninsured themselves, there are undoubtedlyeffects on their families and, in the aggregate,on their employers and communities.Although many, if not most of these impactsare difficult or impossible to quantify, theyshould nevertheless be considered andincluded in the policy debate over the valueof providing insurance coverage for theuninsured.
Cost per Intervention Comparison Target Population QALY Saved
Annual coloectal screening No Screening People 50-75 $22,000
Frontal airbags with manual belts Manual belts (50% use) Drivers of passenger cars $30,000
Dual passenger airbags Driver side only Front right passenger $75,000
Universal Coverage 16.5% uninsured Currently uninsured $115,000population under age 65
Coronary angioplasty No revascularization Patients with mild angina $136,000and one-vessel disease
Annual mammography Annual clinical breast exam Women ages 55-65 $186,000
Annual mammography Annual clinical breast exam Women ages 40-50 $297,000
Screening to prevent HIV Universal precautions Health care workers in $606,000transmission to patients acute care setting
Annual Pap smear Pap smear every 2 years Women ages 20-75 $2,000,000
Table 1. Cost-Effectiveness Ratios for Selected Life-Saving Measures*
Source: Institute of Medicine, Hidden Costs, Value Lost: Uninsurance in America (Washington, DC: National Academy Press, 2003).
* All dollars adjusted to 2001 dollars by the medical care price index.

18MISSOURI FOUNDATION FOR HEALTH
Table 2. Cost Consequences of Being Uninsured
Internal or Private Costs (for Individuals, Families, and Firms)
• Greater morbidity and premature mortality
• Developmental losses for children
• Family financial uncertainty and stress, depletion of assets including bankruptcy
• Lost income of uninsured breadwinner in ill health
• Lower business productivity (e.g., absenteeism, reduced efficiency on the job)
External or Spillovers Costs
• Diminished quality and availability of personal health services (e.g., emergencyrooms)
• Diminished public health system capacity because of diversion of resources foracute care services for the uninsured
• Diminished population health (e.g., higher rates of vaccine-preventable disease)
• Higher public program costs connected with worse health (e.g., Medicare,disability payments) (primarily transfer costs)
• Diminished workforce productivity, lower tax payments

19COVER MISSOURI PROJECT: REPORT 1
1 American College of Physicians, No HealthInsurance? It's Enough to Make You Sick(Philadelphia, PA: American College ofPhysicians/American Society of InternalMedicine, 2000).
2 American College of Physicians, No HealthInsurance? It's Enough to Make You Sick —Uninsured Women at Risk (Philadelphia, PA:American College of Physicians/AmericanSociety of Internal Medicine, 2001).
3 Institute of Medicine, Care withoutCoverage (Washington, DC: NationalAcademy Press, 2002).
4 Institute of Medicine, Health Insurance is aFamily Matter (Washington, DC: NationalAcademy Press, 2002).
5 Institute of Medicine, Hidden Costs, ValueLost: Uninsurance in America (Washington,DC: National Academy Press, 2003).
6 J Hadley, “Sicker and Poorer – TheConsequences of Being Uninsured: AReview of the Research on the Relationshipbetween Health Insurance, Medical CareUse, Health, Work, and Income,” MedicalCare 60.2 (Supplement to June 2003): 3S-75S.
7 TC Buchmueller et al, “Book Review: TheEffect of Health Insurance on Medical CareUtilization and Implications for InsuranceExpansion: A Review of the Literature,”Medical Care Research and Review 62.1(2005): 3-30.
8 BC Strunk and PJ Cunningham, “Trendsin Americans’ Access to Needed MedicalCare, 2001-2003,” Center for StudyingHealth System Change. Results from theCommunity Tracking Study – TrackingReport: No. 10, Aug 2004.
9 C Schoen and C DesRoches, “Role ofAmerica in Promoting Access to Care –Uninsured and Unstably Insured: TheImportance of Continuous InsuranceCoverage,” Health Services Research 35.1,Part II (April 2000): 187-206.
10 RJ Blendon, JT Young, and C DesRoches,“Report on Americans’ Views on theConsequences of Not Having HealthInsurance,” Presented at the Institute ofMedicine (Washington, DC, 14 Dec 2000).
11 Relative odds, or odds ratios, are definedas [pi/(1-pi)]/ [pj/(1-pj)], where pi and pj arethe probabilities of a particular eventoccurring in populations i and j (orproportions of people in the twopopulations who experience the particularevent). The odds ratio is similar but notidentical to the relative risk or probability,which is simply pi/pj. Both measures,however, indicate the relative likelihood ofan event, not the absolute likelihood. Forexample, a relative risk of 2 applies equallyto probabilities of 2/1 and 66/33. In the firstcase, the higher probability represents a 2%chance that the event occurs, while in thesecond case the higher probability representsa 66% chance that the event occurs. In thestudies summarized in this report, an oddsratio greater than 1 means that the event ismore likely for the uninsured than theinsured, while an odds ratio less than 1implies that the event is less likely to occuramong the uninsured than the insured.
12 N Breen et al, “Progress in CancerScreening Over a Decade: Results of CancerScreening from the 1987, 1992, and 1998National Health Interview Surveys,” J National Cancer Institute 93.22 (2001):1704-13.
ENDNOTES

20MISSOURI FOUNDATION FOR HEALTH
13 J Hsia et al, “The Importance of HealthInsurance as a Determinant of CancerScreening: Evidence from the Women'sHealth Initiative,” Preventive Medicine 31.3 (2000): 261-70.
14 LA Faulkner and H Schauffler, “TheEffect of Health Insurance Coverage on theAppropriate Use of Recommended ClinicalPreventive Services,” Am J PreventiveMedicine 13 (1997): 453-8.
15 KM Nelson et al, “The AssociationBetween Health Insurance Coverage andDiabetes Care; Data from the 2000Behavioral Risk Factor Surveillance System,” Health Services Research 40.2 (2005): 261-372.
16 E Powell-Griner, J Bolen, and S Bland,“Health Care Coverage and Use ofPreventive Services among the Near Elderlyin the United States,” Am J Public Health89.6 (1999): 882-6.
17 GL Beckles et al, “Population-BasedAssessment of the Level of Care AmongAdults with Diabetes in the U.S.,” Diabetes Care 21.9 (1998): 1432-8.
18 ME Gornick, PW Eggers, and GF Riley,“Patients and Ambulatory Care –Associations of Race, Education, andPatterns of Preventive Service Use with Stageof Cancer at Time of Diagnosis,” HealthServices Research 39.5 (2004): 1403-28.
19 JZ Ayanian et al, “The RelationshipBetween Health Insurance Coverage andClinical Outcomes Among Women withBreast Cancer,” New England J Medicine329 (29 July 1993): 326-31.
20 A Lee-Feldstein et al, “The Relationshipof HMOs, Health Insurance, and DeliverySystems to Breast Cancer Outcomes,”Medical Care 38.7 (2000): 705-18.
21 C Huttin, JF Moeller, and RS Stafford,“Patterns and Costs for HypertensionTreatment in the United States: Clinical,Lifestyle and Socioeconomic Predictors fromthe 1987 National Medical ExpendituresSurvey,” Clinical Pharmacoeconomics 20.3(2000): 181-95.
22 E Moy, BA Bartman, and MR Weir,“Access to Hypertensive Care: Effects ofIncome, Insurance, and Source of Care,”Archives of Internal Medicine 155 (July1995): 1497-502.
23 LL Leape et al, “Underuse of CardiacProcedures: Do Women, Ethnic Minorities,and the Uninsured Fail to Receive NeededRevascularization?” Annals of InternalMedicine 130.3 (1999): 183-92.
24 DM Carlisle et al, “Racial and EthnicDisparities in the Use of CardiovascularProcedures: Associations with Type ofHealth Insurance,” Am J Public Health 87.2 (1997): 263-7.
25 MB Wenneker, JS Weissman, and AMEpstein, “The Association of Payer withUtilization of Cardiac Procedures inMassachusetts,” JAMA 264.10 (1990):1255-60.
26 GL Daumit, JA Hermann, and NR Powe,“Relation of Gender and Health Insuranceto Cardiovascular Procedure Use in Personswith Progression of Chronic Renal Disease,”Medical Care 38.4 (2000): 354-65.

21COVER MISSOURI PROJECT: REPORT 1
27 GL Daumit and NR Powe, “FactorsInfluencing Access to CardiovascularProcedures in Patients with Chronic KidneyDisease: Race, Sex, and Insurance,”Seminars in Nephrology 21.4 (2001): 367-76.
28 HR Burstin, SR Lipsitz, and TA Brennan,“Socioeconomic Status and Risk forSubstandard Medical Care,” JAMA 268.17(1992): 2383-7.
29 N Lurie et al, “Special Report:Termination of Medi-Cal Benefits: AFollow-up Study One Year Later,” NewEngland J Medicine 314.19 (1986): 1266-8.
30 W Manning et al, “Health Insurance andthe Demand for Medical Care: Evidencefrom a Randomized Experiment,” AmEconomic Review 77.3 (1987): 251-77.
31 SD Fihn and JB Wicher, “WithdrawingRoutine Outpatient Medical Services,” J General Internal Medicine 3 (July/Aug1988): 356-62.
32 J Hadley and J Holahan, “How MuchMedical Care Do the Uninsured Use, andWho Pays for It?” (Washington, DC: TheKaiser Commission on Medicaid and theUninsured) Health Affairs – Web Exclusive.W3-66 – W3-81, 2003.
33 J Hadley and J Holahan, The Cost of Carefor the Uninsured, What Do We Spend, WhoPays, and What Would Full Coverage Add toMedical Spending? (Issue Update),(Washington, DC: The Kaiser Commissionon Medicaid and the Uninsured, 2004).
34 W Miller, E Vigdor, and W Manning,“Covering the Uninsured: What Is ItWorth?” Health Affairs –Web Exclusive (31March 2004): W4-157 – W4-167.
35 This value is the mid-point of a range ofestimates employed by both government andprivate sources in a broad range of studiesthat assess the health impacts of variousactivities and government regulations.
36 J Hadley and T Waidmann, “HealthInsurance and Health at Age 65:Implications for Medicare,” Health ServicesResearch (forthcoming 2005).
MIS
SOU
RIFO
UN
DAT
ION
FOR
HEA
LTH
The Cover Missouri Project includes a series of reports and fact sheets produced in early2006. All materials are available online at www.mffh.org. Printed fact sheets and reports areavailable while supplies last. For more information about the Cover Missouri Project, contactthe MFH Health Policy Group at [email protected] or toll-free at 1-800-655-5560.
Cover Missouri Project Publications

Grand Central Building, Suite 400 • 1000 St. Louis Union Station • St. Louis, MO 63103314-345-5500 Voice • 314-345-5599 Fax • 1-800-655-5560 Toll-Free • www.mffh.org
FMFH1205CMP1RPT - 2M