conservation because it pays: shaded cocoa agroforests in
TRANSCRIPT
(Disclaimer: This paper is for discussion purposes only)
Conservation Because It Pays: Shaded Cocoa Agroforests in West Africa. James Gockowski1, Stephan Weise1, Denis Sonwa1, Mathurin Tchtat2, Martine Ngobo1
1International Institute of Tropical Agriculture 2Institut de Recherche Agricole pour le Développement
Abstract The shaded cocoa cropping system found throughout West Africa but particularly well represented in Cameroon and Nigeria is a sustainable agricultural land use system that provides relatively high values of environmental services. The paper describes and quantifies some of its non-cocoa economic and environmental values and examines the economic logic underlying smallholder management. Estimates of these values are developed from field surveys and on-farm research conducted with cocoa producers in West Africa over the last four years. The secondary products evaluated include the fruits of shade trees commonly associated and occupying the mid and upper canopy such as the African plum (Dacryodes edulis) and ndjassang (Ricinodendron heudolotii) along with introduced fruit species such as citrus and avocado. The nutritional contribution of selected associated species such as the bush mango, avocado, wild oil palm (Elaeis guineensis), and African plum is also examined. Timber is another economically important component of the upper canopy, with some species managed and maintained at densities above those found in primary and secondary forests for local exploitation in rural construction. Many medicinal plants are also maintained in the cocoa farm, which often serves as an in-situ herbal pharmacy for the household. The environmental and ecological benefits of these systems include habitat conservation, climate change mitigation, hydrological cycling and watershed protection. The degree to which these services are provided depends in large part on the type and degree of shade maintained as well as their spatial coverage in the landscape. An econometric model of the determinants of shade level explores some of the driving forces behind shade management in Côte d’Ivoire, Ghana, Nigeria, and Cameroon. We conclude by arguing that because of the significant public goods associated with this land use system that there is a need for directed efforts to publicly support the development and maintenance of shaded systems.
2
Introduction Rapid rural population growth in the moist humid tropics of West Africa has been accompanied by the wide scale conversion of forestland to agricultural uses. The ensuing environmental degradation has called this development process into question. The inevitable tradeoffs between agricultural development and ecosystem functions depend in large part on: (i) the attributes of land use systems and (ii) the spatial coverage of the various land-use components. Information on the scope, nature and variation in these tradeoffs is needed in order to better manage natural resources and the development process. Cocoa cropping systems are one of the significant land uses in West Africa occupying somewhere between five and six million hectares of the moist tropics of Côte d’Ivoire, Ghana, Nigeria and Cameroon. Together these four countries produce more than 3/5ths of the world cocoa supply, roughly 2 million tons annually. The level of ecosystem functions and consumptive value produced by any particular cocoa land use system is largely a function of the level and composition of associated shade species (Figure 1). We look in-depth at shaded cocoa agroforestry systems as currently managed by hundreds of thousands of smallholders in parts of West Africa and consider their full contribution to rural livelihoods and ecosystem functionality. Estimations of their consumptive values are developed from field surveys and on-farm research conducted with cocoa producers in West Africa. Ferren et al. (n.d.) in discussing ecosystem assessment considers four major categories of functions and the four major categories of socio-economic values. The ecosystem functions are:
i. Food chain support and nutrient & carbon cycling functions, including primary production, decomposition, nutrient export, and nutrient utilization;
ii. Habitat functions, including habitat for endangered, rare, and other "sensitive" species, native plants, invertebrates, fisheries, birds including resident and migratory species, and mammals and herpetofauna;
iii. Hydrology, including flood conveyance, sediment control, ground water recharge and discharge; and,
iv. Water quality functions, including water supply, wastewater treatment, detoxification of toxic substances, and modification of pollution from nutrient enrichment.
Categories of socio-economic value, which can be applied as metrics to these functions include:
1) Consumptive values of "harvestable" physical resources such as water, gravel, and petrochemicals and biotic resources such as fisheries, lumber, and crops;
2) Cultural values and local knowledge by indigenous persons, including activities such as basketry, knowledge of wild foods and medicinal plants, and acquisition of house building materials; and,
3) Aesthetic and Natural Heritage values including natural landscape features, setting, and other aspects of our natural heritage.
4) Non-Consumptive values such as recreation and education;
2
3
The consumptive values of shaded systems include fruit of indigenous mid and upper canopy trees such as the African oil palm (Elaeis guineensis Jacq.), African plum (Dacryodes edulis (G.Don) H.J. Lam), bush mango (Irvingia gabonenis), cola-nut (Cola acuminata & C. nitida) and ndjanssang (Ricinodendron heudelotii) along with introduced fruit species such as citrus, mango, guava, and avocado. Species such as the African plum, bush mango, and avocado play important roles in local diets and provide a source of revenues (Schreckenberg et al. 2002, Gockowski and Ndoumbé 1999; Gockowski and Dury 1998, Ndoye, 1995). Stands of volunteer oil palm across West Africa provide cooking oil, palm wine and an abundant source of beta-carotene. In southwest Nigeria, the cola-nut trade with the north (a traditional source of income long before the introduction of cocoa) has been maintained in part through adapting the cocoa cropping system to accommodate cola-nut production (even though this is not recommended for optimal cocoa production as the cola tree belongs to the same botanical family (Steruliaceae) and serves as a host for capsid plant sucking bugs, a major economic pest of cocoa). Many medicinal plants are also maintained in cocoa farms, which serve as in-situ pharmacies for local communities. Timber is another economically important component of the upper canopy with many rapidly growing species selectively maintained by farmers resulting in densities above those found in secondary forests (e.g. Lovoa trichilioides, Terminalia superba, Milicia excelsa, and Triplochiton scleroxylon). This timber is mainly destined for local construction and furniture making both within the village and urban economies. Currently these smallholder resources are mainly exploited at values significantly below those of the global economy. Some specific ecosystem functions of shaded agroforestry systems that are worth highlighting include:
i. Habitat conservation and biodiversity refugia for primary and secondary forest tree species including increasingly threatened species such as Diospyros spp. (Zapfack et al., 2003, Bidzanga et al., in press,)
ii. Enhanced nutrient cycling iii. Global climate change mitigation, and iv. Hydrological cycling.
The degree to which these functions occur depends in large part on the shade composition and level. No-shade cocoa systems as found in parts of the West African cocoa belt, would be expected to generate a minimum of such services (Figure 1). Shade manipulation is a key management parameter of the cropping system, whose choice is a function of numerous social, economic, and agro-ecological factors. Data from baseline surveys recently conducted by the Sustainable Tree Crops Program are used to explore the amount of shade maintained on cocoa farms and to develop a model to predict the degree of shade for a given cocoa farm. Regarding ecosystem functions, our main focus is on climate change mitigation and to a lesser degree the potential hydrological benefits and biodiversity/habitat functions that these systems can generate. This is not to say that the latter functions are less significant. The paper develops four subjects: (1) a description and model of the extent of shade in cocoa farms for the four main producing countries in West Africa, (2) estimation of the consumptive values of secondary (non cocoa) products and resources produced by shaded cocoa agroforests based on field work in southern Cameroon, (3) estimation of the value of carbon cycling/sequestration by shaded cocoa agroforestry and (4) analysis of the hydrological and habitat functions of cocoa agroforestry. The paper concludes
3
4
by arguing that directed public support for shaded systems would be welfare enhancing because of the significant public goods associated with this land use system.
Area Description and Methodology
Agro-ecological description of cocoa growing areas in West Africa The cocoa growing region of West Africa lies within the boundaries of the Upper Guinean and Guineo-Congolian Humid Forest of West and Central Africa, and generally is located between latitudes N 5o and 7o. Mean annual rainfall ranges from 1200 to 4000 mm with dry season lengths varying from less than one to four months. A wide range of soil textures characterizes the region and many are suitable for cocoa production, however shallow and poorly drained soils are generally avoided. A soil pH of 6.7 is considered optimal, but cocoa is grown on soils with pH much lower than this in southern Cameroon. The climax vegetation of most the zone is moist closed canopy tropical forest now replaced by a patchwork mosaic of rotational fallow slash and burn agricultural systems and perennial crop systems. Remaining closed canopy forests are increasingly confined to reserves and national parks such as the Dja and Korup forest reserves in Cameroon, Kakum National Park in Ghana, Cross River National Park in Nigeria and Tai National Park in Côte d’Ivoire.
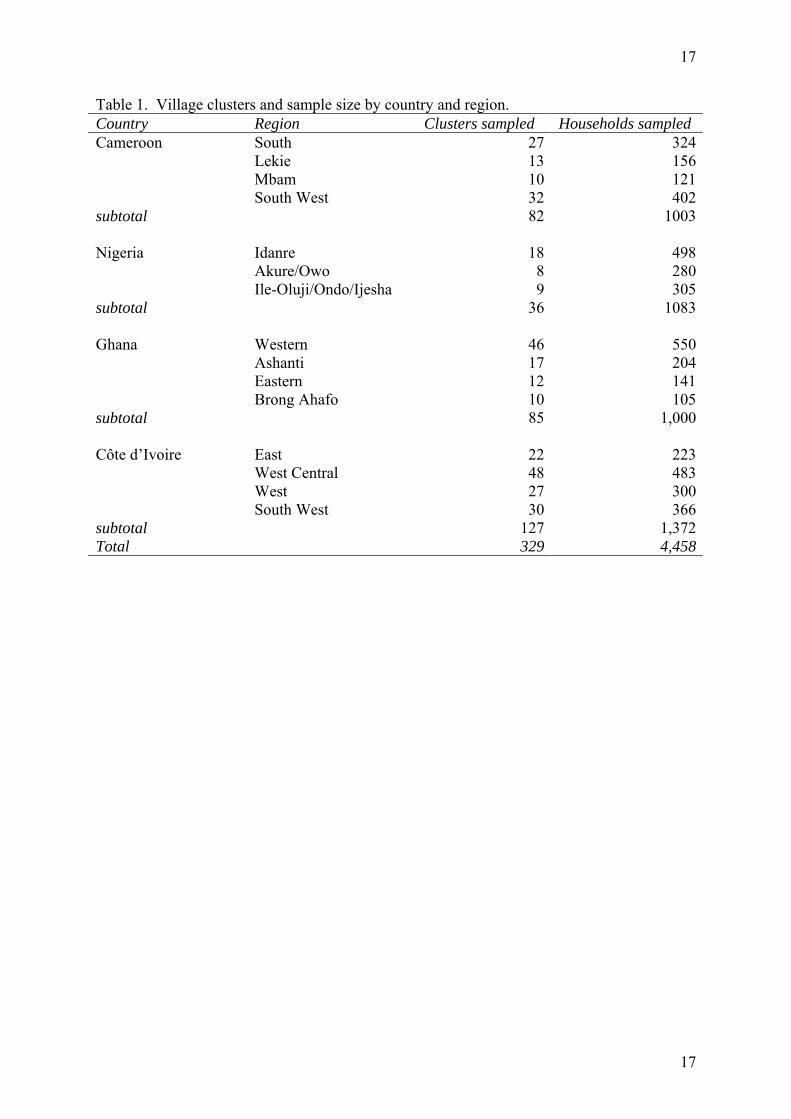
Extent of shaded cocoa agroforests in West Africa The 2001 Sustainable Tree Crops Program baseline survey collected a significant amount of information surrounding smallholder tree stocks in West Africa including a focus on the shade canopy of the system. Information from the survey is used to establish estimates of the level of shade (no shade, low shade, medium shade, heavy shade) across the four major cocoa producing countries of West Africa. The survey was administered to a random cluster sample of 4,458 households in 329 villages in the major cocoa growing regions of Côte d’Ivoire, Ghana, Cameroon and Nigeria from May 2001 to March 2002. The administrative regions sampled and the clusters and samples per region are given in Table 1. With the exception of Côte d’Ivoire comprehensive lists of cocoa producing households were not available. In the other countries, the number of clusters selected per region was proportional to the production of the region (determined from the latest available disaggregated national agricultural statistics). Because of the logistical costs of including all cocoa producing areas, sampling was restricted to those regions falling in the four largest quintiles of national cocoa production. The regions accounting for the remaining 20 percent of production were excluded (typically these regions were marginal and remote). The Nigerian sample was an exception to the above rule, with only Ondo State, which accounts for an estimated 40 to 45 percent of national production included in the sample. During the second stage of sampling, households in each cluster were enumerated and randomly sampled without replacement. Structured interviews were conducted with the head of the household using a questionnaire administered by trained enumerators literate either in English or French and the local language of the producer. The survey gathered information inter alia on practices regarding cocoa establishment and replanting, shade levels, fruit tree planting in cocoa farms, and the retention of timber and indigenous fruit tree species in the shade canopy. Descriptive analysis of these parameters was conducted using the LIMDEP statistical package.
4
5
Model of shade choice The choice of shade levels in cocoa production systems was modeled using ordered probit techniques developed by Zavoina and McElvey (1975). The model representing the producer classification of shade level y for farm i is specified as: yi* = b’xi + ei, ei ~ N[0,1], yi = 0 if yi* = 0, (i.e. no shade) 1 if 0 < yi* ≤ 30% canopy coverage, 2 if 30% < yi* ≤ 60% canopy coverage, 3 if yi* > 60% canopy coverage where yi* is the evaluation by producer of the percentage shade coverage in his/her cocoa farm and yi is the observed shade score of the farm recorded by the enumerator. The value of yi* is posited to be a function of a vector of independent variables xi. The model was estimated separately for Ghana, Nigeria, Côte d’Ivoire, and Cameroon using information gathered from producer interviews on a total of 6,430 spatially distinct cocoa cropping systems. Regressions were estimated using the Limdep 7.0 statistical package and maximum likelihood techniques.
Secondary consumptive values Estimates of revenue streams from fruit production associated with cocoa production are developed for three common indigenous fruit tree species in cocoa plantations—Dacryodes edulis, Ricinodendron heudelotii, and Elaeis guineensis Jacq. and three introduced fruit species—Persea americana, Citrus sinensis, and C. reticulata. Annual revenues per ha for the associated fruit trees are calculated using results establishing the productivity and densities of fruit species drawn from field studies conducted by IITA. For those cases where estimates were not available, secondary sources were drawn upon. This information is used in conjunction with Yaounde market prices for fruits after accounting for internal marketing costs. Additionally estimates are made of the value of standing timber for Lovoa trichilodites and Milletia excelsa. The estimated gross standing timber volume for these common timber species was based on an inventory conducted by IITA (2000) of 60 cocoa agroforests in southern Cameroon. Volumes were derived using Huber’s formula:
V = L(gm) where V = volume L=length of bole and gm = area of bole at L/2
The timber height (L) was defined as the length of clean bole, which would be suitable for sale as a sawlog. This would usually be up to the lowest major limb. An average taper for both species of 1:50 was assumed and the value of gm calculated. For comparative purposes, the costs and returns of cocoa production are also developed.
5
6
Climate mitigation and cocoa agroforestry Global warming concern has led to consideration of carbon trading under the framework of the Clean Development Mechanism of the Kyoto protocol including the possibility of land use changes that lead to higher net carbon stocks. Although there are serious issues yet to be resolved concerning verification and leakages, one of the first questions that needs to be answered is what are the potential gains from land use change. The Alternatives to Slash and Burn program, (ASB) a system-wide effort of the Consultative Group on International Agricultural Research, (CGIAR) estimated carbon stocks in various land use systems in southern Cameroon including several shaded cocoa forests (Kotto-Same et al. 1997). From those measures, a C sequestration function measured in t C ha-1, f(xt) was derived for cocoa agroforests, where : f(xt) = 79.8 + 4.216 xt for 0 ≤ xt ≤ 25
= 185.2 for 25< xt < T xt is the age of the perennial crop system, year 0 is the start of the cocoa production cycle and T is the terminal age of the plantation. Plantations older than 25 years were assumed to be in a steady state at 185 t C ha-1 (the steady state carbon stock of a forest in Cameroon was estimated at 307 t C ha-1). Taking the integral of f(xt ) and dividing by T results in an estimate of the time averaged carbon stock. From the comparison of steady state C levels, one immediately deduces that conversion of forest land to shaded cocoa will result in a net loss of carbon to atmosphere. However conversion of either short fallow lands or savannah land, which have much lower stocks of carbon will likely result in a net sequestration of carbon and thereby contribute to climate mitigation. Utilizing discounting techniques to account for the long time horizons involved, we estimate the net discounted present value of the net C stocks accumulated.
Hydrological and habitat functions of cocoa agroforestry The contribution of shaded cocoa agroforests to hydrological functionality depends on the capacity for sediment control and ground water recharge & discharge relative to (1) natural forest land use systems and (2) short fallow annual crop systems, which are the other predominant land uses in the degraded forest-agricultural mosaic that characterizes most cocoa growing areas. On an intuitive basis we would expect sediment control and groundwater recharge of the cocoa agroforest to be intermediate between these two land uses but verification of our intuition is beyond the scope of this paper and is an area for further research. The spatial coverage of this land use system is also an important factor and a brief look is given to the this issue in one of the most densely populated regions of the Cameroonian cocoa belt which in turn raises the question to what extent do cocoa agroforests in this area contribute to hydrological functions. The importance of cocoa agroforests as biodiversity refuges has been largely overlooked and unfortunately we do not address this issue here except to note possible interactions between the high degree of indigenous fruit trees in these systems and their attraction for important mammalian and avian tropical seed dispersers with important ramifications for forest regeneration.
6
7
Results
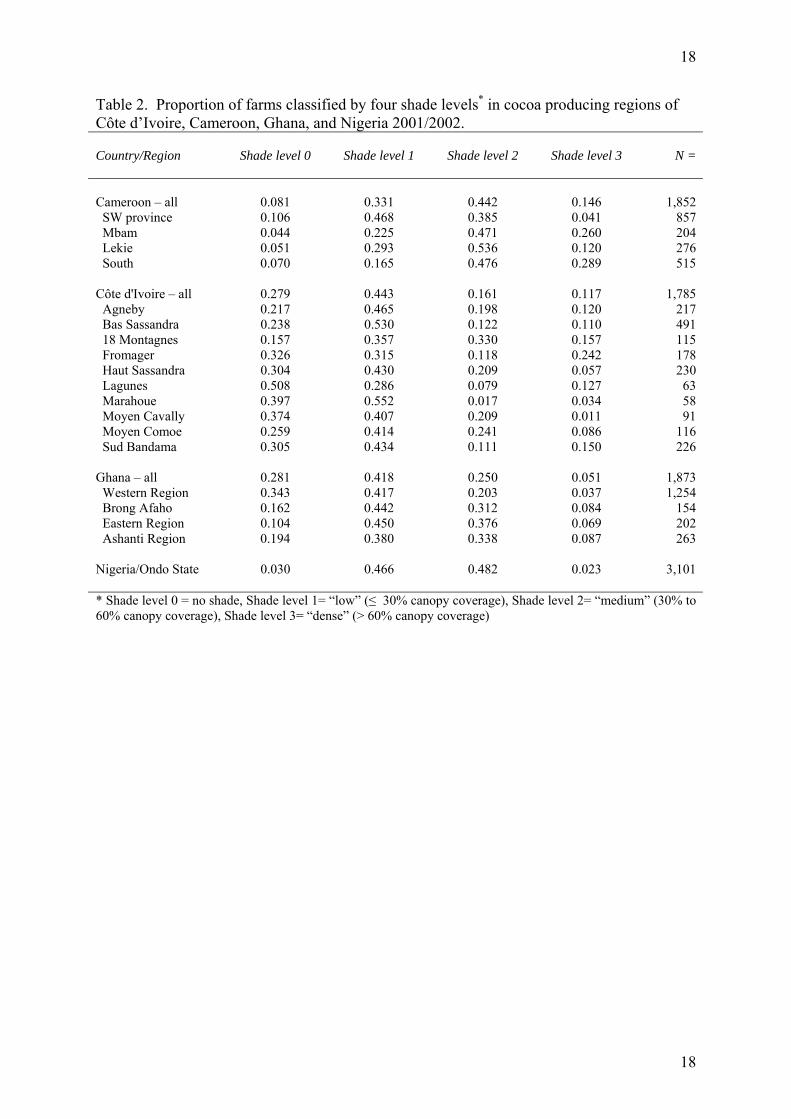
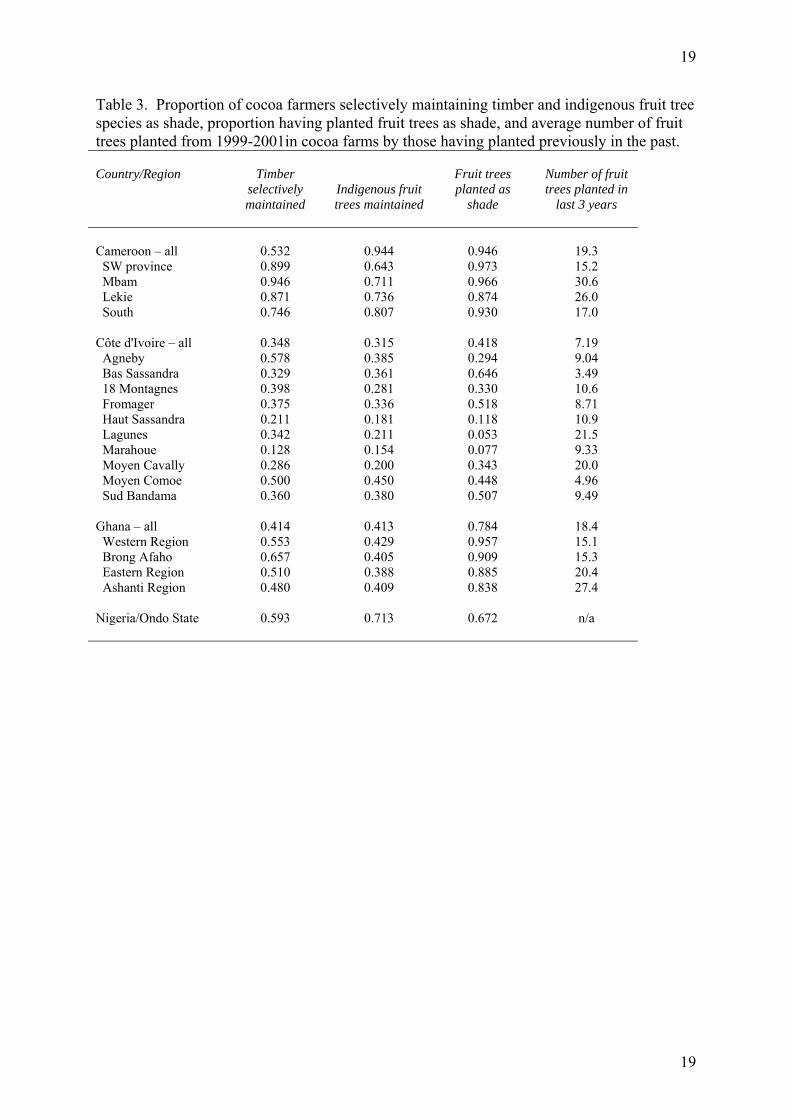
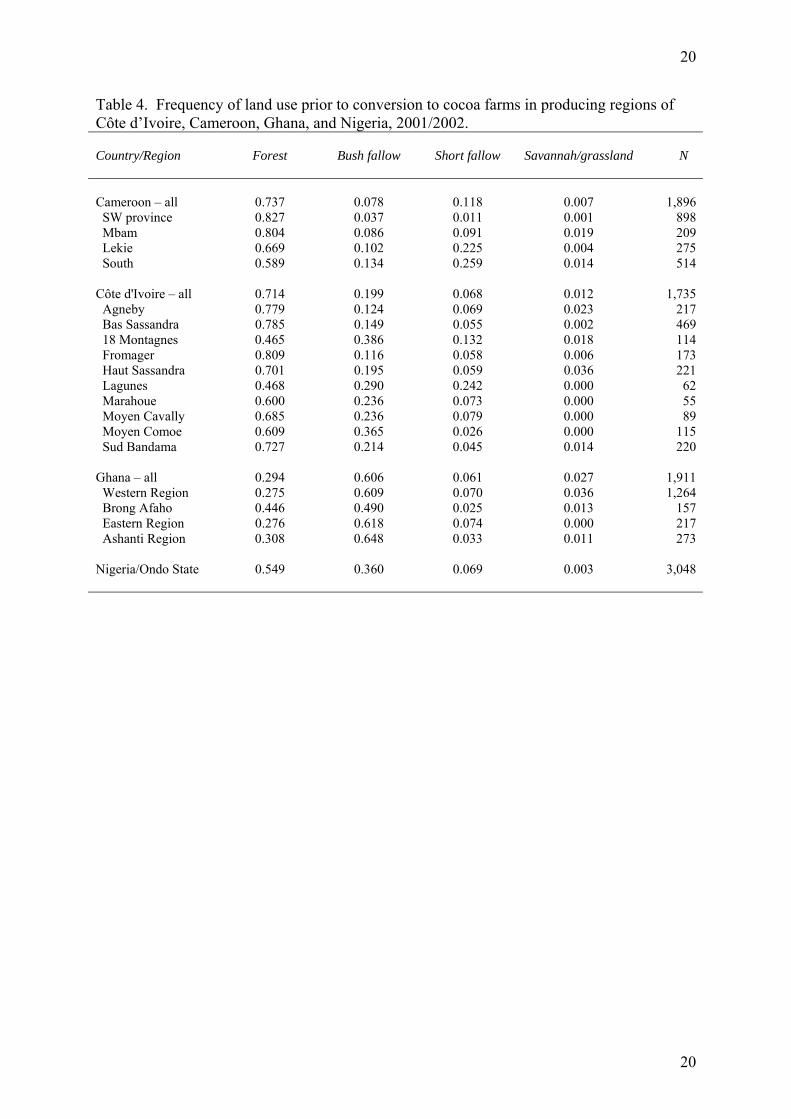
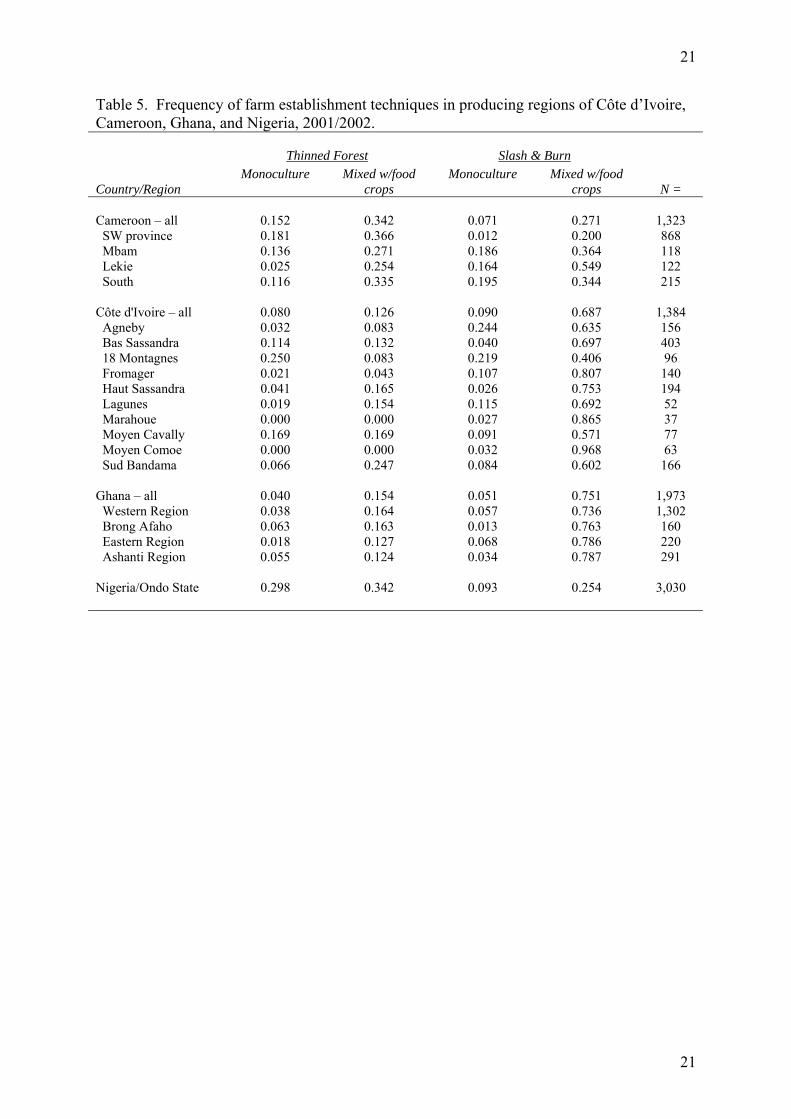
Shaded cocoa agroforestry in West Africa Descriptive and spatial results Table 2 presents the classifications by producers of the shade levels retained in their various farms. Regionally the frequency of no shade farms expressed as a proportion of all farms varied from a low of 3 percent in Ondo State Nigeria to a high of 51 percent in the Lagune Region of Côte d’Ivoire. At the country level, Ghana and Côte d’Ivoire had the highest frequency of no shade cocoa farms while Cameroon had the highest frequency of farms with shade level 3 (densely shaded). In total over half the cocoa farms in Cameroon and Ondo State Nigeria were classified at either level 2 or 3 (medium and high shade) in contrast to less than a third of farms in these categories in Côte d’Ivoire and Ghana. Within countries, significant differences by regions were noted. The composition of tree shade is important from the standpoint of biodiversity conservation. The survey sought information on whether farmers had: (i) purposively maintained either timber or indigenous fruit tree species as shade in their farms, and (ii) the type and number of fruit trees if any, planted in their cocoa farms. As shown in Table 3 the majority of cocoa producers with the exception of Côte d’Ivoire indicated planting fruit trees in their cocoa farms. At the country level the number of planted fruit trees in the 36 months prior to the date of the interview ranged from an average of 7 per producer in Côte d’Ivoire to 18 in Ghana (considering only cocoa farmers, who indicated having planted fruit trees in cocoa farms). Locally, fruit tree planting was higher in certain regions such the Lekie and Mbam divisions in Cameroon, Agneby in Côte d’Ivoire and the Eastern and Ashanti regions in Ghana. In Ghana the two most commonly planted species were orange and avocado pear while in Cameroon the semi-domesticated African plum, D. edulis, and orange were the most commonly cited. In Cameroon, nearly all cocoa producers indicated selectively maintaining indigenous fruit trees in their farms as did more than two-thirds of producers in Nigeria, versus less than one third and two out of five producers in Côte d’Ivoire and Ghana respectively. Likewise, a majority of Nigerian and Cameroonian producers affirmed the purposive maintenance of timber species in cocoa farms, while in Ghana and Côte d’Ivoire the overall percentage of farmers was less than 50 percent. The type of land conversion to cocoa cropping systems has implications for productivity of the system and net environmental impacts. The two countries with the lowest population densities, Cameroon and Côte d’Ivoire, (approximately 28 and 45 persons km-2 respectively), had the highest proportion of farms converted from forest to cocoa (Table 4). Ondo State in Nigeria also had a majority of its farms converted from forest to cocoa. In Ghana with a population density of 78 persons km-2 the predominant land use prior to conversion was bush fallow followed by forest (Table 4). The conversion of savannah land to cocoa was the least common, with the highest frequencies (still less than four percent of all farms) occurring in the forest-savannah transition zones of the Western and Brong Afaho regions of Ghana, Haut Sassandra (Vavoua/Daloa) in Côte d’Ivoire, and the Mbam division of Cameroon. Cocoa systems were established either by planting into a thinned overstorey of forest species or by slashing and burning the forest first and then planting cocoa (Table 5). A majority of
7
8
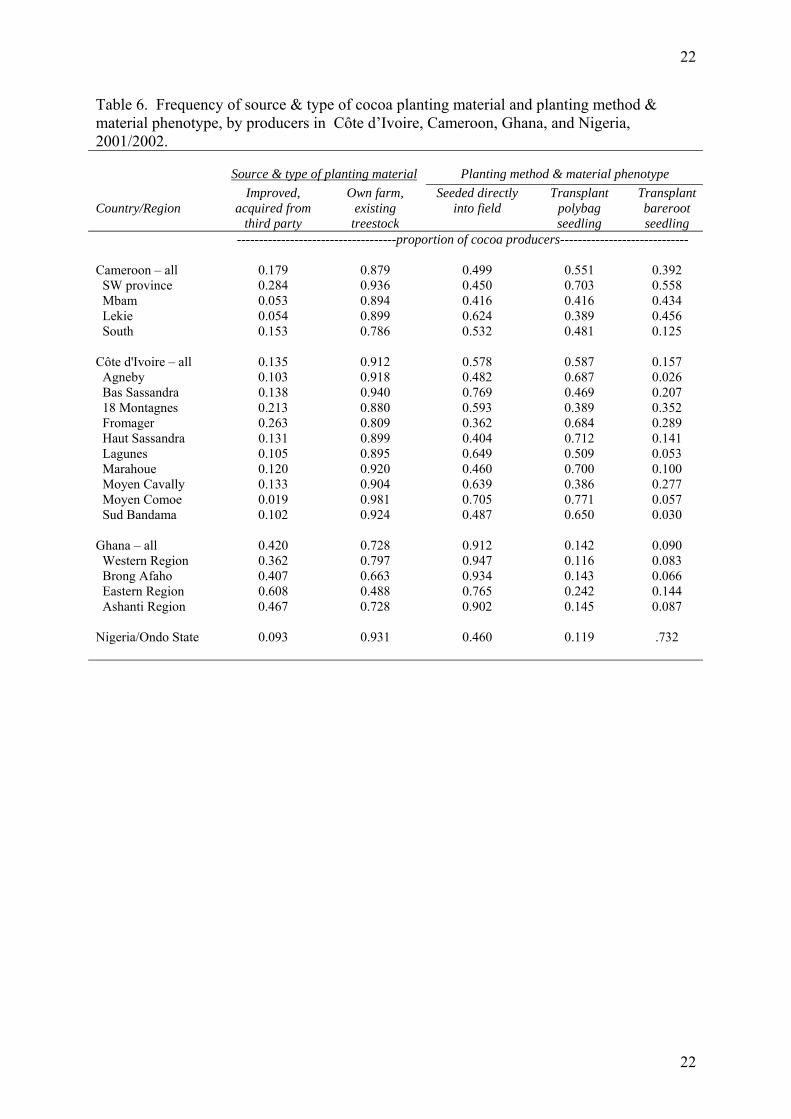
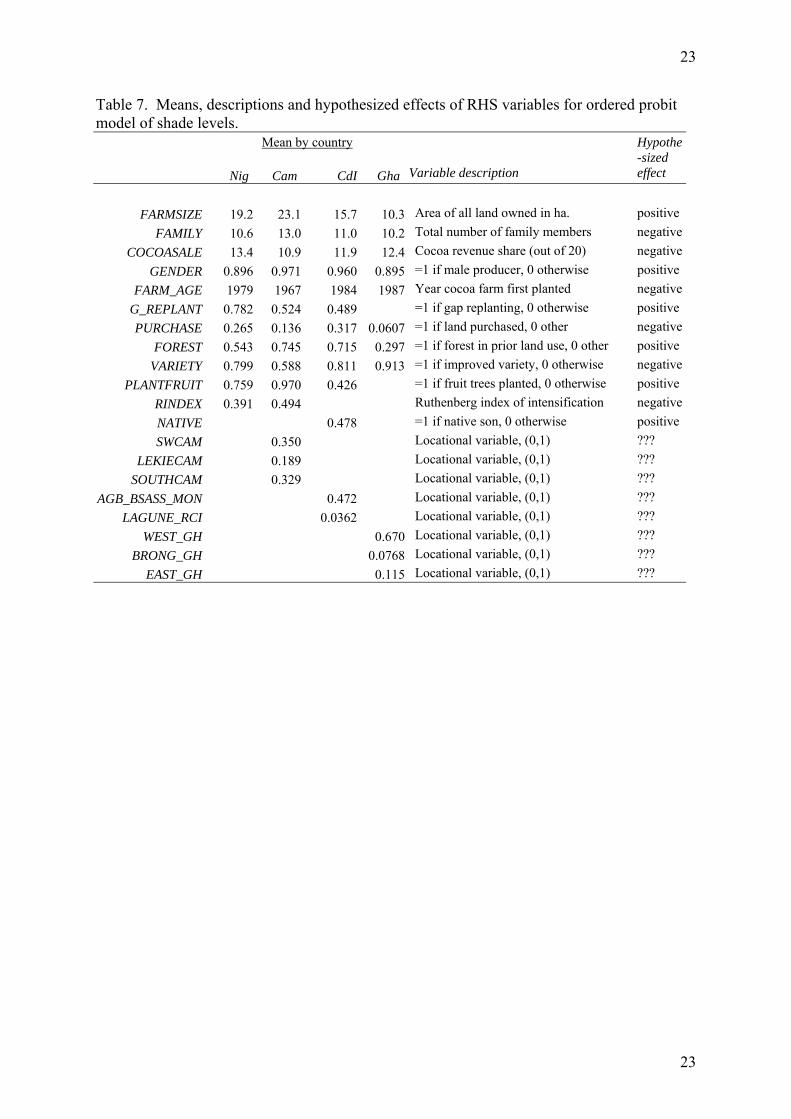
farmers in Nigeria and Cameroon planted into thinned forests while in Ghana and Côte d’Ivoire land was first slashed and burned before planting. Regardless the form of conversion, most cocoa farms were established in association with food crops for the first two or three years; in the case of thinned forest conversion, shade tolerant plantains and cocoyams (Xanthosoma sagittifolium) are the most commonly associated, while in the case of slash and burn systems a wider range of food crops are planted. By and large, farmers had limited access to improved planting material (usually from a third party e.g. government authorities but also occasionally cooperatives and private sellers) and predominantly used open pollinated seedlings from their own tree stocks for establishing cocoa farms (Table 6). Ghana’s farmers had the best access but nonetheless more than half did not indicate acquiring the improved hybrid seed developed by the Cocoa Research Institute of Ghana. Farmers in Ondo State Nigeria were the most limited in terms of access. Three methods of planting cocoa are common: direct seeding, transplanting from polybags and transplanting bareroot seedlings. In Côte d’Ivoire and Cameroon the majority of producers transplanted seedlings from polybags, while in Ghana the large majority of producers established cocoa farms by direct seeding whereas in Nigeria transplanting of bareroot seedlings was most common. The determinants of shade choice The descriptive parameters of the set of independent variables proposed for the ordered probit model of shade choice and their hypothesized effects are given in Table 7. The variables FARMSIZE, FAMILY, COCOASALE, G_REPLANT, RINDEX and VARIETY are related to an intensification hypothesis which holds that as the producer’s cocoa system is intensified the shade level declines. Producers with an abundant endowment of land resources (FARMSIZE), scarce family labor (FAMILY), and with diversified sources of income (low value of COCOASALE) are hypothesized to include more shade, ceteris paribus, as a component in an extensive cocoa strategy. RINDEX is the Ruthenberg index of food crop intensification defined as:
RINDEX i = ii
i
periodcroppingfallowperiodcropping
+
where the cropping and fallow period are in reference to the producer’s main food production system (the majority of cocoa producers also produce food crops for own consumption and sale). This variable, which ranges from 0 to 1 is a proxy indicator of the overall intensification of the producer’s farming system including cocoa and is hypothesized to have a negative effect on shade level. COCOASALE measures the relative share of cocoa in the household’s cash income and ranges from one to 20. Higher values indicate households specialized in cocoa production and we posit that its effect should be negative on shade levels. The use of improved varieties as indicated by VARIETY, is hypothesized to have a negative effect on shade as improved varieties have in some regions been promoted along with no-shade recommendations and intensive use of agrochemicals. Gap replanting, G_REPLANT, is expected to positively influence the level of shade, as it reflects an extensive farmer practice for maintaining the productivity of the cocoa farm. The year in which the cocoa farm was planted (FARM_AGE) is expected to negatively affect the amount of shade. As the age of the plantation progresses (and perhaps that of the farmer as well) more shade develops unless the farmer is vigilant in pruning. Forestland prior to conversion, FOREST, is hypothesized as leading to higher shade levels than alternative prior
8
9
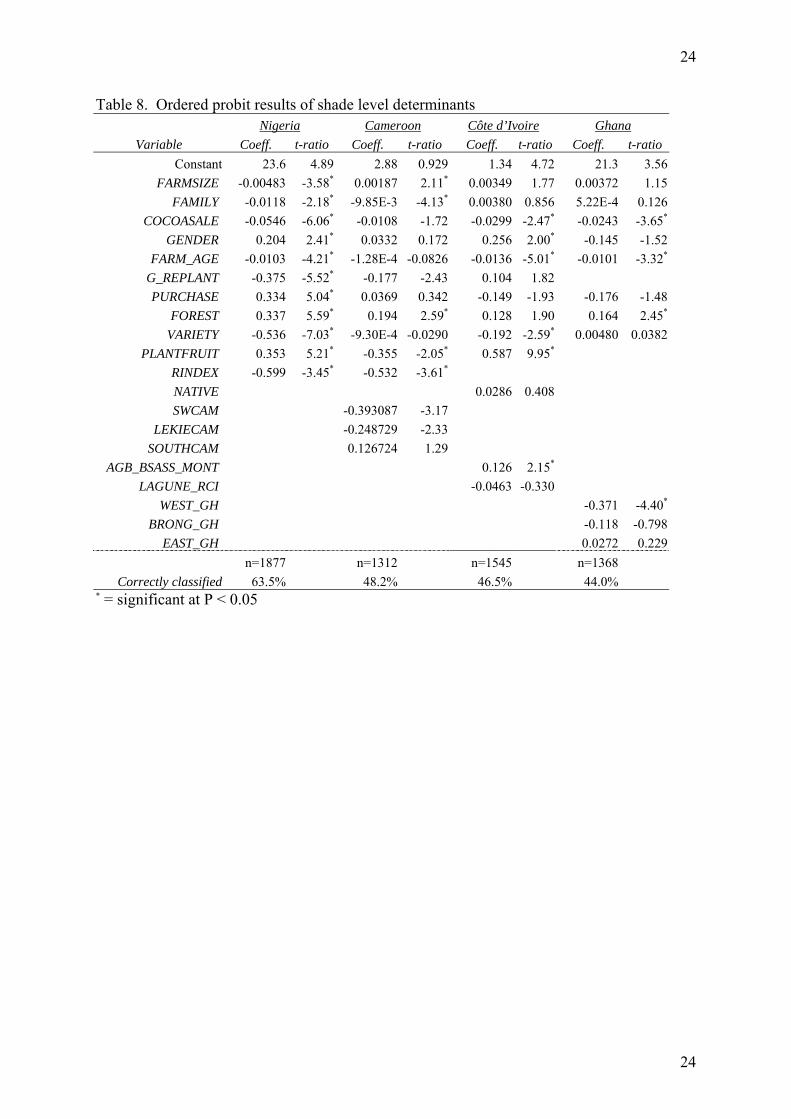
land uses because of the greater frequency and more rapid regrowth of cut saplings and small trees in this land use type. An indicator variable NATIVE for village native (=1) or migrant settler (=0) was included in the Côte d’Ivoire model to test the hypothesis that the level of shade depends on the stock of local knowledge concerning forest species, ecological functions and economic uses. The supposition is that this knowledge is greater among native sons and daughters relative to migrants from savannah ecological zones. A land tenure variable, PURCHASE, indicates land, which was purchased and then used to establish a cocoa farm. Given generally attenuated property rights across most of West Africa, it is hypothesized that persons purchasing land would want to establish a clear change in land use in order to secure their rights and that establishment of a cocoa holding with low or no shade would demonstrate a change in property rights within the local community. The results of the maximum likelihood model estimations are presented in Table 8. Overall the models were reasonably well behaved although the percentage of correctly assigned cocoa farms only ranged from 44 to 64%. Of the 8 variables included in all four country models, 25 of the 32 coefficients had the predicted qualitative effect, of which 20 were significantly different from zero (P < 0.10, two-tail test). Of the total of 41 variables estimated (not including locational variables) five had qualitative effects opposite those predicted and were significantly different from zero. These were GAP_REPLANT, FARMSIZE, and PURCHASE in Nigeria, PLANTFRUIT and GAP_REPLANT in Cameroon. The coefficients on RINDEX, COCOSALES and FOREST were significant for all countries for which they were estimated while FARM_AGE was significant for three of the four countries. Data to accurately compute RINDEX were not available for Ghana and Côte d’Ivoire.
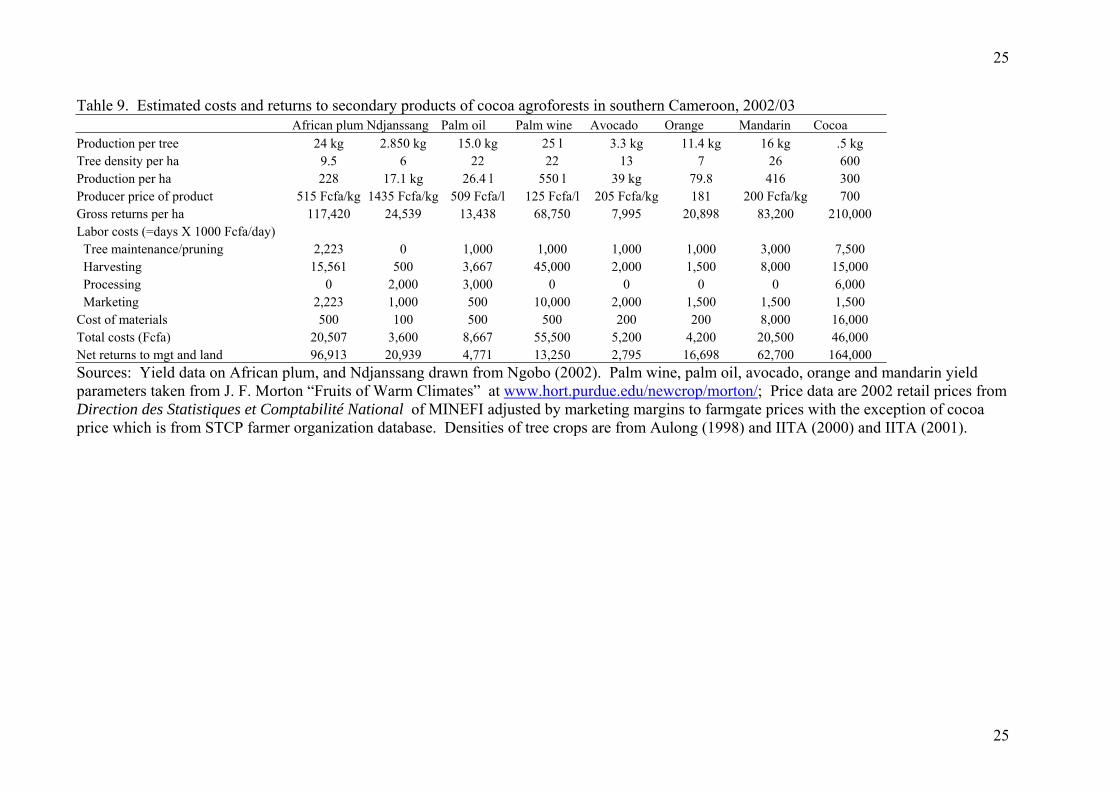
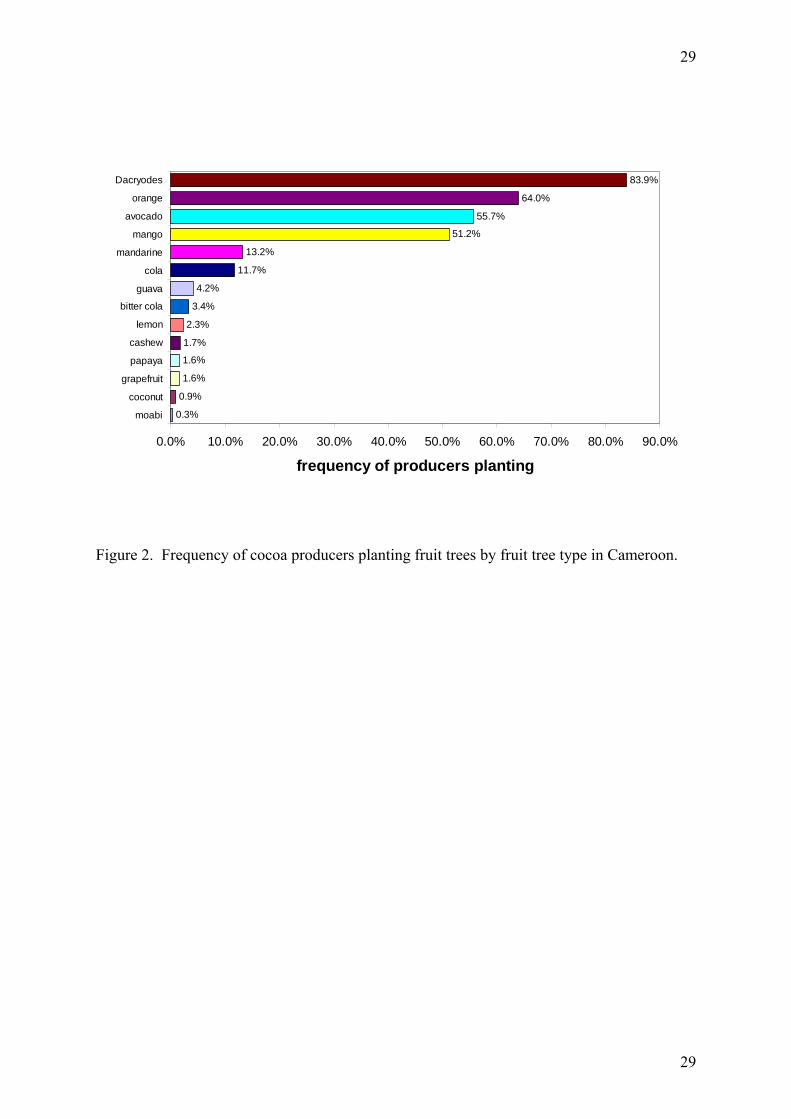
Consumptive values from shaded cocoa systems in Cameroon Results from the STCP baseline survey revealed that over 90 percent of Cameroon producers had at some point planted fruit trees in their cocoa farms. A total of 14 different fruit tree species were cited with an average of three tree species named per farmer (Figure 2). In the three years prior to the administration of the survey, the average producer had planted 19.4 fruit trees. Table 9 presents a partial budget analysis for the annual costs and revenues associated with the production of African plum (D. edulis), avocado pear, orange, mandarin (Citrus reticulata), palm oil, palm wine, and ndjanssang (R. heudelotii). We do not consider establishment costs and assume that the trees are already mature and bearing. A density of 19 African plum trees per ha of cocoa was assumed which lies in between the measured mean estimates for cocoa farms reported by IITA (2001) and Aulong (1998). Mean fruit production measured for 9 trees in 2001 was 12.5 kg and 34.3 kg in 2002 for the same trees (three of the nine trees did not bear in the second year, which is apparently a common trait of D. edulis) (Ngobo 2002). An average productivity of 24 kg of marketable fruit per tree per year was assumed but because of high intra-tree variability in the organoleptic qualities of fruit (Leakey et al., 2002) only one-half of the trees are deemed to
9
10
produce marketable fruit. Productivity for avocado in cocoa farms has not been measured, instead we assume a per tree yield equal to 10% of the level reported in the horticultural literature for best practice production systems (i.e. 10% of 33 kgs). Aulong (1998) reported orange and mandarin trees at a density of 7 and 26 trees per ha in the cocoa farms of southern Cameroon. As with avocado, measures of orange and mandarin productivity are assumed to be 10% of per tree yields under “best practice” management. Oil palm production in the form of cooking oil is calculated for 20 “dura” genotypes of Elaeis guineensis Jacq. This density reflects the findings of Aulong (1998), while being lower than those reported by IITA. The “dura” is the semi-domesticated landrace variety of oil palm common to the humid tropics of West Africa. Although not normally planted, farmers usually take care to maintain wild seedlings in their fallow fields and perennial crop systems . The average productivity of a stand of 100 “dura” trees ha-1 is estimated at 1.5 tons of fruits ha-1. With traditional oil extraction techniques approximately 12.5 kg of palm fruits are needed for each liter of palm oil produced. Palm wine is another very important product that is produced by tapping the male infloresence. It is estimated that annually approximately 25 liters of wine is produced per tree. The revenues from ndjassang (R. heudelotii) were estimated under the assumption of 6 fruit bearing trees ha-1 of cocoa agroforest. This estimate is above the value reported by Van Dijk (2001) for cocoa lands and above the values reported by IITA (2000). However in certain localities, such as the Sa’a sous-prefecture in the Lekie division, that are major supply sources, densities of this important indigenous fruit tree can be much higher. Ngompeck et al. (2003) in a study of R. heudelotii found an average of 1.8 kernels per fruit (mode = 2) with the average kernel mass per fruit equal to 1.41 g in an overall sample of 1,920 fruits taken from 64 R. heudelotii trees. Women gather the fallen fruits which are then piled together for two weeks during which time the mesocarp deteriorates. The nuts are then washed and boiled for approximately 2 hours, which facilitates the kernel extraction. Ngobo (2002) measured an average yield of 2,018 fruits tree-1 in a sample of 12 trees. Combining these estimates, we arrive at an average annual production per tree of 2.850 kg of marketable kernels. Cocoa productivity at 300 kg per ha is representative of productivity in southern Cameroon. The farmgate cocoa price of 700 Fcfa/kg lies within the range of farmgate prices paid to farmers in last two years. The low density of cocoa reflects the findings of Aulong (1998) for the cocoa-fruit agroforests of southern Cameroon. The costs of tree maintenance, harvesting. processing, marketing and materials were also estimated (Table 9). The highest costs were estimated for palm wine production, followed by cocoa. Palm wine production is labor intensive, requiring twice daily climbing and tapping of the male inflorescence during the 30 to 40 days during which a tree is productive. The largest single cost for cocoa in Cameroon are material costs of fungicides to control cocoa blackpod disease caused by Phytophthora megakarya. The value of timber stocks on cocoa farms is an area of ongoing investigation and results presented here are preliminary. IITA (2001) reported densities of between 6 and 7 Milletia excelsa and Lovoa trichilioides trees ha-1 in the mid and upper canopies (>10 m).1 Assuming 1 Overall, 98 timber trees (includes all specimens over 1.5 cm DBH) per ha were reported.
10
11
an average diameter of 50 cm DBH, a bole length of 9 m and a taper of 1:50 results in an estimated gross volume of 7.73 cu. m ha-1 of standing Milletia and Lovoa timber. However as pointed out by Lanly and Lapitre (1970), the quantity commercially available for sale will differ significantly from the gross standing volume due to losses to sawing, unforeseen problems in harvesting, inaccessible trees, diseased boles, misshapen boles, and other wastage in the processing process. They estimate that on average in West Africa the actual amount of sawnwood commercialized from mature stands of iroko (M. excelsa) and Lovoa are only 42 and 58 percent of the gross volume of standing timber. Applying this proportion, we arrive at an estimated 3.25 cu m ha-1 and 4.48 cu m ha-1 of commercially exploitable Milletia and Lovoa timber, the value of which depends on the market in which the commodity is sold. A dual market structure characterizes in the timber sector of Cameroon–an expatriate dominated modern enclave sector with high capital investment characterized by the export of high quality hardwoods and an internal timber sector characterized by low prices, low capital investment and production of poorer quality timber mainly to meet local construction needs (Essama et al., 2002, Essama and Gockowski 2001). The two sectors have very different pricing and policy regimes. The timber currently on farmer’s cocoa farms can not legally be sold unless they can produce a land certificate establishing their legal ownership and proof that they planted the trees in question. They are allowed to exploit timber only for their own household construction purposes. A lack of enforcement has led to an illegal market mainly to meet internal construction demand, in which crews fell and then mill the timber on the spot using gasoline power chainsaws. Farmers are typically paid only a fraction of the international value of the timber by these crews. Information on this price is difficult to obtain but anecdotally reports of 10,000 FCFA payments for Milletia and Lovoa with DBHs of over 100 cm are not uncommon. Assuming that such a tree would yield between 7 and 8 cu m of roundwood, this works out to a price of between 1250 and 1430 FCFA per cu m. Current international roundwood prices for Milletia range from 150,000 Fcfa to 180,000 Fcfa per cu m. and for Lovoa from 70,000 to 95,000 Fcfa per cu m depending on the log grade (see www.ITTO.or.jp/market/). In the retail timber market of Yaounde, Milletia planks sell at cubic meter equivalent prices which are approximately half the price for unsawn Milletia logs. That is retail sawn planks that sell for half the roundwood world price.
The potential for climate mitigation A change in land use from either short fallow or savannah grassland to shaded cocoa agroforest will reduce the stock of atmospheric carbon. The time-averaged carbon stock of a rotational two year Chromolaena odorata fallow/one year cropping system is estimated by to be 84 t C. Using cocoa agroforests as a tool to reforest degraded short fallow lands could sequester up to 95 t C ha-1 of atmospheric carbon (Table 3). The economic value of this carbon will depend on its price in carbon trading schemes, the social discount rate, the production cycle of the agroforest, and the rate of sequestration over time. The time-averaged carbon in the cocoa agroforest was calculated for each year over a 200-year period and the corresponding time-averaged carbon that would have existed if the land had remained in the 2-year fallow—1-year cropping system was subtracted to arrive at the net increment in time-average carbon per annum per hectare. This increment was then multiplied by the assumed price of carbon ($20 t-1) and discounted to its present value. A social discount rate of 4% results in a discounted net present value of carbon ranging from $550 to $740 ha-1 (Table 10).
11
12
Hydrological and habitat functions of cocoa agroforestry Assuming that shaded cocoa agroforests do a better job than short fallow/annual food crop rotations at controlling sediment load and water recharge as well as habitat function, leads to the question as to how extensive must these systems be in order to maintain these ecosystem functions. In terms of percentage area coverage, shaded cocoa agro forests are most important in the Lekie Division where they account for over 38,000 ha and cover 13 percent of the total land area (versus less than ten percent for secondary forest remnants) (Gockowski et al. 1998). Further investigation into the impact of these land uses on hydrological functions is indicated. Regarding the issue of habitat preservation, results from the ongoing ecological characterization of this land use system has revealed that certain increasingly rare plant species such as the ebony woods (genus Diospyros) and Dacryodes butteri are still to be found in these systems. The high incidence of fruit trees maintained in the cocoa systems of the Lekie Division undoubtedly accounts for the abundant populations of lesser hornbills and gray parrots that reside in the region. Again more formal study is warranted.
Discussion On a regional basis, approximately 6 million hectares in the four countries has been converted to cocoa production systems. By comparison, the World Resource Institute (http://www.wri.org/earthtrends/) estimates that approximately 2.4 million ha, 1.2 million 2.6 million and 19.5 million ha of tropical forest (i.e. > 75% canopy coverage) remains in Côte d’Ivoire, Ghana, Nigeria and Cameroon, respectively. Considering only Nigeria, Côte d’Ivoire and Ghana (ignoring Cameroon’s approximate 400,000 ha of cocoa), the approximately 5.6 million ha of cocoa in Côte d’Ivoire, Ghana, and Nigeria is equivalent to approximately 90% of the area remaining in tropical forest, establishing the importance at the landscape scale of the cocoa land use system. The net environmental consequences of cocoa land conversion will depend on the prior land use, the type of land conversion process and the characteristics of the new land use. Most of the cocoa farms in West Africa have been created at the expense of forest. As the results of ASB in Cameroon show, even if the conversion is to shaded cocoa agroforest, significant emissions and loss of biodiversity will still result. The amount of C emissions is, of course, even higher with conversion to no shade cocoa systems. On the other hand the carbon sequestration potential for conversion from savannah lands or short fallow lands is high and carbon payments could provide the financial means for reclaiming these relatively degraded lands, that is, if all the problems with verification and monitoring can be worked. Research and development efforts for the establishment of cocoa on degraded lands are also providing new insights into issues associated with degraded lands. In the forest savannah transition zone innovative methods have been developed by farmers themselves. In the Mbam division of Cameroon, savannah lands are converted to shaded cocoa agroforests by planting Dacryodes edulis into mixed food crop fields, allowing the trees to achieve four or five years of development and then planting cocoa into the understorey (Schreckenberg et al., 2002). As a carbon investement project, conversion of savannah lands to shaded cocoa systems as described above is likely to be more easily implemented than an effort to convert short fallow lands in a degraded forest mosaic. The main reason lies in the potential for leakage in the latter case. Although a farmer may be willing if paid to convert a short fallow annual crop system to shaded cocoa (indeed a non-insignificant proportion of cocoa farms were derived
12
13
from such sources, see Table 4), there is a subsequent risk that to compensate for the decline in land for food crop production, the farmer will convert longer fallow or secondary forest land uses to short fallow systems and in the process emitting C into the atmosphere. In a forest savanna setting like the Mbam Division the extensive availability of savannah land eliminates this problem. On average, the level of shade was higher in Nigeria and Cameroon and farmers here have more commonly maintained native fruit, timber and medicinal tree species. The conservation of these indigenous forest species is particularly important for wildlife habitat and ecosystem functionality. Cocoa agroforests are a livelihood option for local communities surrounding the Dja Reserve in southern Cameroon working with the ECOFAC project. The maintenance of indigenous forest species such as Dacryodes edulis and others provides important food sources for monkeys and avian seed dispersers such as the black casqued hornbill and African gray parrot and the forest like nature of shaded cocoa systems effectively provides a buffer for protecting the biodiversity of the reserve. The analysis of the factors motivating the choice of shade level on cocoa farms suggests that the processes of cocoa intensification and specialization contribute to lower levels of shade as producers seek to maximize cocoa production. Where farms are large in size and labor is relatively scarce producers tend to opt for a low risk extensive production strategy. As part of this strategy, shade is encouraged as a means of stabilizing production and providing a reliable albeit low level of production. The influence of the farm age on shade levels may suggest that biological lags are important for the development of shade. The role that extension and research has played in determining shade levels was not directly ascertained in the survey of producers but evidence of a negative effect can be deduced from the effect of VARIETY in the model of shade determinants. While most farmers in West Africa plant and replant their cocoa farms using seedlings from their own existing tree stock, in a majority of cases they have at some time received, either from other farmers, extension or government authorities, improved planting material. VARIETY had a negative impact on shade level in Côte d’Ivoire where the diffusion of high yielding Amazon varieties was accompanied by recommendations to reduce shade and apply fertilizers. For a time in the 1980s similar recommendations were made in Cameroon by the cocoa development parastatal SODECAO. While the model was useful in eliciting some of the important factors associated with the level of shade, perhaps the most important factor relates to the consumptive values derived from shaded versus non-shaded systems. The underlying hypothesis is that the consumptive value generated by cocoa revenue is a declining function of shade level whereas the consumptive value of the other secondary components is increasing. As the analysis of cocoa and non cocoa revenues shows, certain of the fruits marketed from cocoa agroforests contribute significantly to the overall well being of the household. In terms of gender equity many of these secondary commodities are processed and marketed by women. Another positive aspect of the shaded cocoa agroforest is a more constant stream of revenue over the year, whereas for cocoa monoculture, cash flow is lumpy, with revenue usually received in several transactions over a two or three month period. For instance, revenues from the African plum usually coincides with the beginning of the school year in September which is generally considered the month with peak household liquidity demand (Schreckenberg et al.
13
14
2002). Finally the contribution of some of these commodities to household nutrition can be substantial, particularly Dacryodes edulis which is rich in fatty acids and amino acids. The average number of fruit trees planted was higher in the Lekie and Mbam Divisions of Cameroon, the Agneby region in Côte d’Ivoire and the Eastern and Ashanti regions of Ghana. All of these regions have in common relatively good access to large urban centers, which highlights the importance of public roads infrastructure and market access for cocoa fruit agroforests. Another distinction is the importance of local markets for indigenous fruits which with the exception of the cola nut appear appears to be better developed in Cameroon and Nigeria. The value of the African plum market in Cameroon was estimated at more than $7 million dollars by Ndoye et al. (1997) and exports to the expatriate African community in Europe and the U.S. worth over $2.2 million annually (Awono et al. 2002).
Conclusions Most cocoa producers in West Africa maintain shade on their cocoa farms and the majority in Cameroon, Nigeria, and Ghana had planted fruit trees. The secondary products generated from this shade contribute significantly to household revenues and nutrition. The environmental services provided by over 5 million ha of shaded cocoa are an added benefit. These include habitat conservation and hydrological functions ranging from sediment control to conservation of indigenous fruit tree species. Given the positive externalities of shade, we argue that there is an underallocation of resources for the promotion and development of shaded cocoa systems. Better information is still needed on the environmental services provided by shaded systems and the tradeoffs between cocoa productivity and shade (if any). The development of improved varieties adapted to shaded systems is also a research gap. Finally, promotion of shaded, biologically diverse cocoa production systems by national extension services and NGOs is advocated.
14
15
References
Aulong S (1998) Conditions d’éxtension de l’agrumiculture: Etude de cas village de Ntsan. Montpellier France, Memoire de Fin d’Etude (Ingenieur agricole), CNEARC. 114 p
Awono, A., Ndoye, O., Schreckenberg, K., Tabuna, H., Isseri, H., and Temple, L., (2002)
Production and marketing of Safou (Dacryodes edulis) in Cameroon and internationally: Market development issues. Forests, Trees and Livelihoods, Vol. 12 (1&2): 125-148,
Dury, S., Aulong, S.T. and Temple, L. (2000). Dynamique et structure floristique des
agroforêts à agrumes au centre du Cameroun. Fruits 55: 103:114. Essama B. and Gockowski J. (2001) “Cameroon: Forest sector development in a difficult
political economy”. OEB Evaluation Country Case Study Series, The World Bank, Washington DC.
Essama B., Gockowski J., Kelly, L. (2002) Cameroon: Managing International and National
Interests. in U. Lele (editor) Managing Global Commons: Challenges of Forest Conservation and Development; Transaction Publishers, New Brunswick, USA and London, UK, ISBN: 0-758-0137
Ferren Jr., W.R., Fiedler, P.L., and Leidy, R.A. (n.d.) Untitled volume on environmental
assessment methodology applied to California wetlands. http://www.tucson.ars.ag.gov/icrw/Proceedings/McQuaid.pdf.
Gockowski J and Dury S (1999) The economics of cocoa-fruit agroforests in southern Cameroon. Paper present to International Workshop on Multi-strata Systems with Perennial Tree Crops. CATIE, Costa Rica, 22-25 February. Organized by the International Union of Forestry Research Organisations.
Gockowski, J, Baker D, Tonye J, Weise S, Ndoumbé M, Tiki-Manga T, and Fouaguégué A
(1998). Characterization and diagnosis of farming systems in the ASB Forest Margins Benchmark of southern Cameroon. Report prepared for the Alternatives to Slash and Burn Systemwide Initiative, Yaoundé, IITA Humid Forest Ecoregional Center. 65 p
Gockowski, J., Ndoumbe, M., 1999. An analysis of horticultural production and marketing
systems in the forest margins ecoregional benchmark of southern Cameroon. Resource and Crop Management. Research Monograph No. 27. Ibadan, Nigeria, IITA.
IITA (2000) Project Report on Integrated Perennial and Annual Cropping Systems (InPACS):
Building Household Assets, IITA, Ibadan, Nigeria IITA (2001) Project Report on Integrated Perennial and Annual Cropping Systems (InPACS):
Building Household Assets, IITA, Ibadan, Nigeria
15
16
Kotto-Same, J., Woomer, P., Moukam, A, Zapfack, L. (1997). Carbon dynamics in slash-and-burn agriculture and land use alternatives in the humid forest zone of Cameroon. Agriculture, Ecosystems and Environment, 65, 245-256.
Lanly, J.P., and Lapitre, C. (1970). Estimation des volumes commercialisables dans les
inventaires forestiers tropicaux par sondage. Bois et Forets des Tropiques. 129(1): 57-68.
Morton, J. F., (2001). Fruits of Warm Climates, Creative Resource Systems, Inc.\Box 890,
Winterville, N.C. 28590 Ndoye, O., (1995). The markets for non-timber forest products in the humid forest zone of
Cameroon and its borders: Structure, conduct and performance and policy implications. Unpublished report. CIFOR Bogor, Indonesia.
Ndoye, O., Ruiz-Perez, M. and Eyebe, A. (1997). The markets of non-timber tropical forest
products in the humid forest zone of Cameroon. ODI Network Paper 22c. Ngo Mpeck, M.L., Asaah, E., Tchoundjeu, Z., and Atangana, A.R. (2003). Strategies for the
domestication of Ricinodendron heudelotii: Evaluation of variability in natural populations from Cameroon. Food, Agriculture & Environment, Vol.1(3&4) : 257-262.
Ngobo, M. 2002. Ecology and socio-economic importance of short fallows in the humid
forest zone of southern Cameroon. Ph.D. dissertation, School of Agriculture, University of Wales, Bangor, United Kingdom
Schreckenberg, K., Degrande, Mbosso, C., Boli Baboule, Z., Boyd, C., Enyong, L.,
Kanmegne, J., and Ngong, C. (2002). The social and economic importance of Dacryodes edulis (G.Don) H.J. Lam in southern Cameroon. Forests, Trees and Livelihoods, Vol. 12 (1&2): 15-40.
Van Dijk (1999). Non-timber forest products in the Bipindi-Akom II region, Cameroon: A
socio-economic and ecological assessment. Tropenbos Cameroon Series 1. The Tropenbos Cameroon Programme, Kribi, Cameroon, 197 p
16
17
Table 1. Village clusters and sample size by country and region. Country Region Clusters sampled Households sampled Cameroon South 27 324 Lekie 13 156 Mbam 10 121 South West 32 402subtotal 82 1003 Nigeria Idanre 18 498 Akure/Owo 8 280 Ile-Oluji/Ondo/Ijesha 9 305subtotal 36 1083 Ghana Western 46 550 Ashanti 17 204 Eastern 12 141 Brong Ahafo 10 105subtotal 85 1,000 Côte d’Ivoire East 22 223 West Central 48 483 West 27 300 South West 30 366subtotal 127 1,372Total 329 4,458
17
18
Table 2. Proportion of farms classified by four shade levels* in cocoa producing regions of Côte d’Ivoire, Cameroon, Ghana, and Nigeria 2001/2002. Country/Region
Shade level 0
Shade level 1
Shade level 2
Shade level 3 N =
Cameroon – all 0.081 0.331 0.442 0.146 1,852 SW province 0.106 0.468 0.385 0.041 857 Mbam 0.044 0.225 0.471 0.260 204 Lekie 0.051 0.293 0.536 0.120 276 South 0.070 0.165 0.476 0.289 515 Côte d'Ivoire – all 0.279 0.443 0.161 0.117 1,785 Agneby 0.217 0.465 0.198 0.120 217 Bas Sassandra 0.238 0.530 0.122 0.110 491 18 Montagnes 0.157 0.357 0.330 0.157 115 Fromager 0.326 0.315 0.118 0.242 178 Haut Sassandra 0.304 0.430 0.209 0.057 230 Lagunes 0.508 0.286 0.079 0.127 63 Marahoue 0.397 0.552 0.017 0.034 58 Moyen Cavally 0.374 0.407 0.209 0.011 91 Moyen Comoe 0.259 0.414 0.241 0.086 116 Sud Bandama 0.305 0.434 0.111 0.150 226 Ghana – all 0.281 0.418 0.250 0.051 1,873 Western Region 0.343 0.417 0.203 0.037 1,254 Brong Afaho 0.162 0.442 0.312 0.084 154 Eastern Region 0.104 0.450 0.376 0.069 202 Ashanti Region 0.194 0.380 0.338 0.087 263 Nigeria/Ondo State 0.030 0.466 0.482 0.023 3,101 * Shade level 0 = no shade, Shade level 1= “low” (≤ 30% canopy coverage), Shade level 2= “medium” (30% to 60% canopy coverage), Shade level 3= “dense” (> 60% canopy coverage)
18
19
Table 3. Proportion of cocoa farmers selectively maintaining timber and indigenous fruit tree species as shade, proportion having planted fruit trees as shade, and average number of fruit trees planted from 1999-2001in cocoa farms by those having planted previously in the past. Country/Region
Timber
selectively maintained
Indigenous fruit trees maintained
Fruit trees planted as
shade
Number of fruit trees planted in
last 3 years Cameroon – all 0.532 0.944 0.946 19.3 SW province 0.899 0.643 0.973 15.2 Mbam 0.946 0.711 0.966 30.6 Lekie 0.871 0.736 0.874 26.0 South 0.746 0.807 0.930 17.0 Côte d'Ivoire – all 0.348 0.315 0.418 7.19 Agneby 0.578 0.385 0.294 9.04 Bas Sassandra 0.329 0.361 0.646 3.49 18 Montagnes 0.398 0.281 0.330 10.6 Fromager 0.375 0.336 0.518 8.71 Haut Sassandra 0.211 0.181 0.118 10.9 Lagunes 0.342 0.211 0.053 21.5 Marahoue 0.128 0.154 0.077 9.33 Moyen Cavally 0.286 0.200 0.343 20.0 Moyen Comoe 0.500 0.450 0.448 4.96 Sud Bandama 0.360 0.380 0.507 9.49 Ghana – all 0.414 0.413 0.784 18.4 Western Region 0.553 0.429 0.957 15.1 Brong Afaho 0.657 0.405 0.909 15.3 Eastern Region 0.510 0.388 0.885 20.4 Ashanti Region 0.480 0.409 0.838 27.4 Nigeria/Ondo State 0.593 0.713 0.672 n/a
19
20
Table 4. Frequency of land use prior to conversion to cocoa farms in producing regions of Côte d’Ivoire, Cameroon, Ghana, and Nigeria, 2001/2002. Country/Region
Forest
Bush fallow
Short fallow
Savannah/grassland N
Cameroon – all 0.737 0.078 0.118 0.007 1,896 SW province 0.827 0.037 0.011 0.001 898 Mbam 0.804 0.086 0.091 0.019 209 Lekie 0.669 0.102 0.225 0.004 275 South 0.589 0.134 0.259 0.014 514 Côte d'Ivoire – all 0.714 0.199 0.068 0.012 1,735 Agneby 0.779 0.124 0.069 0.023 217 Bas Sassandra 0.785 0.149 0.055 0.002 469 18 Montagnes 0.465 0.386 0.132 0.018 114 Fromager 0.809 0.116 0.058 0.006 173 Haut Sassandra 0.701 0.195 0.059 0.036 221 Lagunes 0.468 0.290 0.242 0.000 62 Marahoue 0.600 0.236 0.073 0.000 55 Moyen Cavally 0.685 0.236 0.079 0.000 89 Moyen Comoe 0.609 0.365 0.026 0.000 115 Sud Bandama 0.727 0.214 0.045 0.014 220 Ghana – all 0.294 0.606 0.061 0.027 1,911 Western Region 0.275 0.609 0.070 0.036 1,264 Brong Afaho 0.446 0.490 0.025 0.013 157 Eastern Region 0.276 0.618 0.074 0.000 217 Ashanti Region 0.308 0.648 0.033 0.011 273 Nigeria/Ondo State 0.549 0.360 0.069 0.003 3,048
20
21
Table 5. Frequency of farm establishment techniques in producing regions of Côte d’Ivoire, Cameroon, Ghana, and Nigeria, 2001/2002.
Thinned Forest
Slash & Burn
Country/Region
Monoculture Mixed w/food crops
Monoculture Mixed w/food crops N =
Cameroon – all 0.152 0.342 0.071 0.271 1,323 SW province 0.181 0.366 0.012 0.200 868 Mbam 0.136 0.271 0.186 0.364 118 Lekie 0.025 0.254 0.164 0.549 122 South 0.116 0.335 0.195 0.344 215 Côte d'Ivoire – all 0.080 0.126 0.090 0.687 1,384 Agneby 0.032 0.083 0.244 0.635 156 Bas Sassandra 0.114 0.132 0.040 0.697 403 18 Montagnes 0.250 0.083 0.219 0.406 96 Fromager 0.021 0.043 0.107 0.807 140 Haut Sassandra 0.041 0.165 0.026 0.753 194 Lagunes 0.019 0.154 0.115 0.692 52 Marahoue 0.000 0.000 0.027 0.865 37 Moyen Cavally 0.169 0.169 0.091 0.571 77 Moyen Comoe 0.000 0.000 0.032 0.968 63 Sud Bandama 0.066 0.247 0.084 0.602 166 Ghana – all 0.040 0.154 0.051 0.751 1,973 Western Region 0.038 0.164 0.057 0.736 1,302 Brong Afaho 0.063 0.163 0.013 0.763 160 Eastern Region 0.018 0.127 0.068 0.786 220 Ashanti Region 0.055 0.124 0.034 0.787 291 Nigeria/Ondo State 0.298 0.342 0.093 0.254 3,030
21
22
Table 6. Frequency of source & type of cocoa planting material and planting method & material phenotype, by producers in Côte d’Ivoire, Cameroon, Ghana, and Nigeria, 2001/2002.
Source & type of planting material
Planting method & material phenotype
Country/Region
Improved, acquired from
third party
Own farm, existing
treestock
Seeded directly into field
Transplant polybag seedling
Transplant bareroot seedling
------------------------------------proportion of cocoa producers----------------------------- Cameroon – all 0.179 0.879 0.499 0.551 0.392 SW province 0.284 0.936 0.450 0.703 0.558 Mbam 0.053 0.894 0.416 0.416 0.434 Lekie 0.054 0.899 0.624 0.389 0.456 South 0.153 0.786 0.532 0.481 0.125 Côte d'Ivoire – all 0.135 0.912 0.578 0.587 0.157 Agneby 0.103 0.918 0.482 0.687 0.026 Bas Sassandra 0.138 0.940 0.769 0.469 0.207 18 Montagnes 0.213 0.880 0.593 0.389 0.352 Fromager 0.263 0.809 0.362 0.684 0.289 Haut Sassandra 0.131 0.899 0.404 0.712 0.141 Lagunes 0.105 0.895 0.649 0.509 0.053 Marahoue 0.120 0.920 0.460 0.700 0.100 Moyen Cavally 0.133 0.904 0.639 0.386 0.277 Moyen Comoe 0.019 0.981 0.705 0.771 0.057 Sud Bandama 0.102 0.924 0.487 0.650 0.030 Ghana – all 0.420 0.728 0.912 0.142 0.090 Western Region 0.362 0.797 0.947 0.116 0.083 Brong Afaho 0.407 0.663 0.934 0.143 0.066 Eastern Region 0.608 0.488 0.765 0.242 0.144 Ashanti Region 0.467 0.728 0.902 0.145 0.087 Nigeria/Ondo State 0.093 0.931 0.460 0.119 .732
22
23
Table 7. Means, descriptions and hypothesized effects of RHS variables for ordered probit model of shade levels.
Mean by country Nig Cam CdI Gha
Variable description
Hypothe-sized effect
FARMSIZE 19.2 23.1 15.7 10.3 Area of all land owned in ha. positive
FAMILY 10.6 13.0 11.0 10.2 Total number of family members negativeCOCOASALE 13.4 10.9 11.9 12.4 Cocoa revenue share (out of 20) negative
GENDER 0.896 0.971 0.960 0.895 =1 if male producer, 0 otherwise positive FARM_AGE 1979 1967 1984 1987 Year cocoa farm first planted negative
G_REPLANT 0.782 0.524 0.489 =1 if gap replanting, 0 otherwise positive PURCHASE 0.265 0.136 0.317 0.0607 =1 if land purchased, 0 other negative
FOREST 0.543 0.745 0.715 0.297 =1 if forest in prior land use, 0 other positive VARIETY 0.799 0.588 0.811 0.913 =1 if improved variety, 0 otherwise negative
PLANTFRUIT 0.759 0.970 0.426 =1 if fruit trees planted, 0 otherwise positive RINDEX 0.391 0.494 Ruthenberg index of intensification negativeNATIVE 0.478 =1 if native son, 0 otherwise positive SWCAM 0.350 Locational variable, (0,1) ???
LEKIECAM 0.189 Locational variable, (0,1) ??? SOUTHCAM 0.329 Locational variable, (0,1) ???
AGB_BSASS_MON 0.472 Locational variable, (0,1) ??? LAGUNE_RCI 0.0362 Locational variable, (0,1) ???
WEST_GH 0.670 Locational variable, (0,1) ??? BRONG_GH 0.0768 Locational variable, (0,1) ???
EAST_GH 0.115 Locational variable, (0,1) ???
23
24
Table 8. Ordered probit results of shade level determinants Nigeria Cameroon Côte d’Ivoire Ghana
Variable Coeff. t-ratio Coeff. t-ratio Coeff. t-ratio Coeff. t-ratio Constant 23.6 4.89 2.88 0.929 1.34 4.72 21.3 3.56
FARMSIZE -0.00483 -3.58* 0.00187 2.11* 0.00349 1.77 0.00372 1.15FAMILY -0.0118 -2.18* -9.85E-3 -4.13* 0.00380 0.856 5.22E-4 0.126
COCOASALE -0.0546 -6.06* -0.0108 -1.72 -0.0299 -2.47* -0.0243 -3.65*
GENDER 0.204 2.41* 0.0332 0.172 0.256 2.00* -0.145 -1.52FARM_AGE -0.0103 -4.21* -1.28E-4 -0.0826 -0.0136 -5.01* -0.0101 -3.32*
G_REPLANT -0.375 -5.52* -0.177 -2.43 0.104 1.82 PURCHASE 0.334 5.04* 0.0369 0.342 -0.149 -1.93 -0.176 -1.48
FOREST 0.337 5.59* 0.194 2.59* 0.128 1.90 0.164 2.45*
VARIETY -0.536 -7.03* -9.30E-4 -0.0290 -0.192 -2.59* 0.00480 0.0382PLANTFRUIT 0.353 5.21* -0.355 -2.05* 0.587 9.95*
RINDEX -0.599 -3.45* -0.532 -3.61* NATIVE 0.0286 0.408 SWCAM -0.393087 -3.17
LEKIECAM -0.248729 -2.33 SOUTHCAM 0.126724 1.29
AGB_BSASS_MONT 0.126 2.15* LAGUNE_RCI -0.0463 -0.330
WEST_GH -0.371 -4.40*
BRONG_GH -0.118 -0.798EAST_GH 0.0272 0.229
n=1877 n=1312 n=1545 n=1368 Correctly classified 63.5% 48.2% 46.5% 44.0%
* = significant at P < 0.05
24
25
Tahle 9. Estimated costs and returns to secondary products of cocoa agroforests in southern Cameroon, 2002/03 African plum Ndjanssang Palm oil Palm wine Avocado Orange Mandarin Cocoa Production per tree 24 kg 2.850 kg 15.0 kg 25 l 3.3 kg 11.4 kg 16 kg .5 kg Tree density per ha 9.5 6 22 22 13 7 26 600 Production per ha 228 17.1 kg 26.4 l 550 l 39 kg 79.8 416 300 Producer price of product 515 Fcfa/kg 1435 Fcfa/kg 509 Fcfa/l 125 Fcfa/l 205 Fcfa/kg 181 200 Fcfa/kg 700 Gross returns per ha 117,420 24,539 13,438 68,750 7,995 20,898 83,200 210,000 Labor costs (=days X 1000 Fcfa/day)
Tree maintenance/pruning 2,223
0 1,000 1,000 1,000 1,000 3,000 7,500 Harvesting 15,561 500 3,667 45,000 2,000 1,500 8,000 15,000 Processing 0 2,000 3,000 0 0 0 0 6,000 Marketing 2,223 1,000 500 10,000 2,000 1,500 1,500 1,500 Cost of materials 500 100 500 500 200 200 8,000 16,000Total costs (Fcfa) 20,507 3,600 8,667 55,500 5,200 4,200 20,500 46,000 Net returns to mgt and land 96,913 20,939 4,771 13,250 2,795 16,698 62,700 164,000 Sources: Yield data on African plum, and Ndjanssang drawn from Ngobo (2002). Palm wine, palm oil, avocado, orange and mandarin yield parameters taken from J. F. Morton “Fruits of Warm Climates” at www.hort.purdue.edu/newcrop/morton/; Price data are 2002 retail prices from Direction des Statistiques et Comptabilité National of MINEFI adjusted by marketing margins to farmgate prices with the exception of cocoa price which is from STCP farmer organization database. Densities of tree crops are from Aulong (1998) and IITA (2000) and IITA (2001).
25

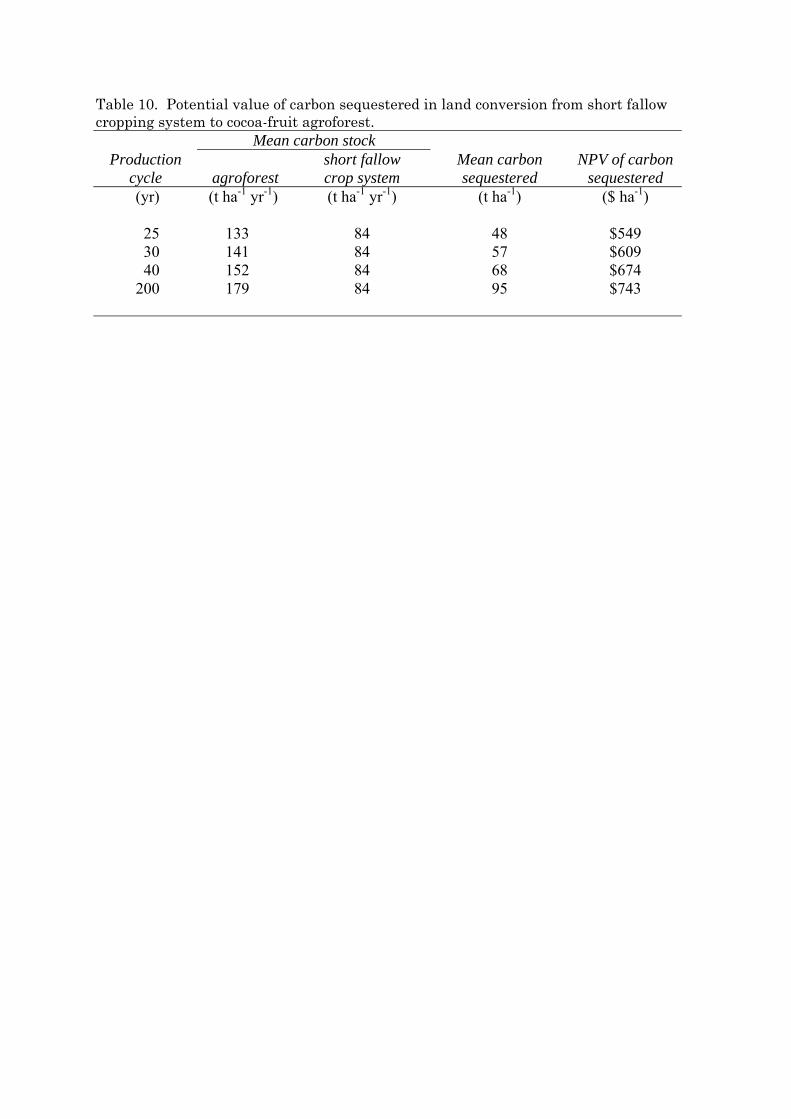
Table 10. Potential value of carbon sequestered in land conversion from short fallow cropping system to cocoa-fruit agroforest.
Mean carbon stock Production
cycle
agroforest short fallow crop system
Mean carbon sequestered
NPV of carbon sequestered
(yr) (t ha-1 yr-1) (t ha-1 yr-1) (t ha-1) ($ ha-1)
25 133 84 48 $549 30 141 84 57 $609 40 152 84 68 $674
200 179 84 95 $743
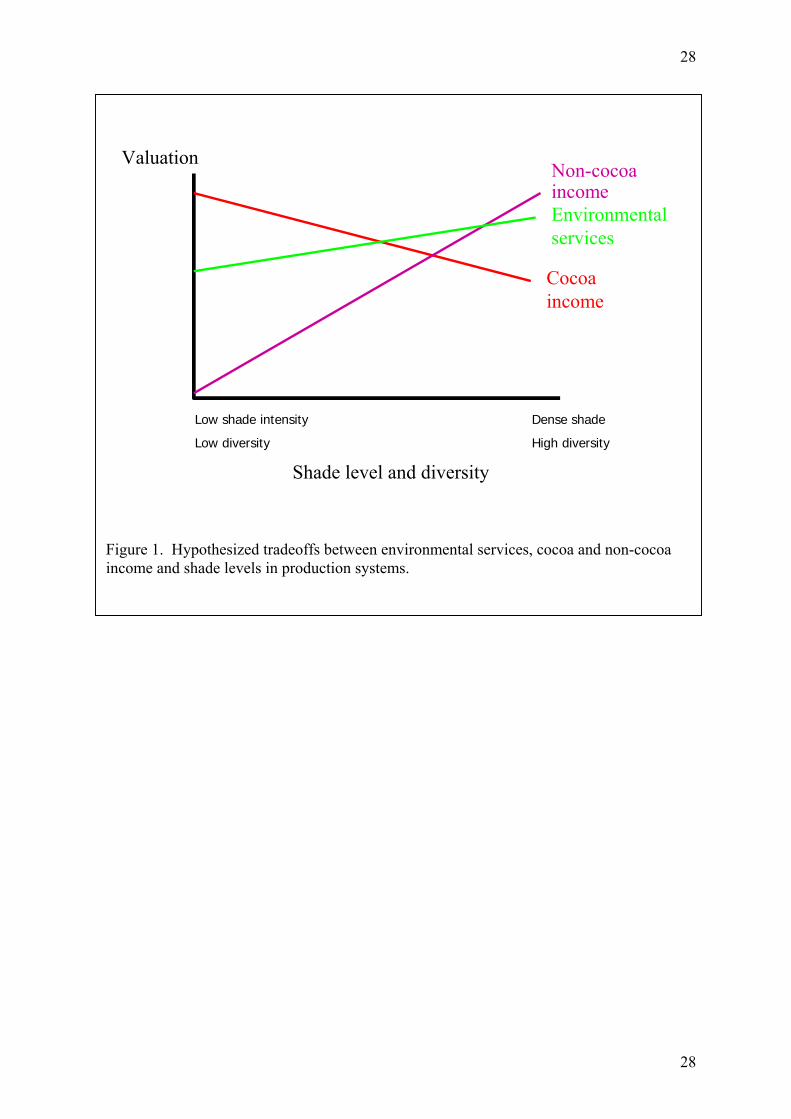
28
Shade level and diversity
Cocoaincome
Non-cocoa incomeEnvironmental services
Valuation
Low shade intensity
Low diversity
Dense shade
High diversity
Figure 1. Hypothesized tradeoffs between environmental services, cocoa and non-cocoa income and shade levels in production systems.
28
29
0.3%
0.9%
1.6%
1.6%
1.7%
2.3%
3.4%
4.2%
11.7%
13.2%
51.2%
55.7%
64.0%
83.9%
0.0% 10.0% 20.0% 30.0% 40.0% 50.0% 60.0% 70.0% 80.0% 90.0%
moabi
coconut
grapefruit
papaya
cashew
lemon
bitter cola
guava
cola
mandarine
mango
avocado
orange
Dacryodes
frequency of producers planting
Figure 2. Frequency of cocoa producers planting fruit trees by fruit tree type in Cameroon.
29