consideration of ground variability over an area of ... papers/russell 236.00_.pdf · earthquake...
TRANSCRIPT
6th International Conference on Earthquake Geotechnical Engineering 1-4 November 2015 Christchurch, New Zealand
Consideration of Ground Variability Over an Area of Geological
Similarity as Part of Liquefaction Assessment for Foundation Design
J. Russell1, S. van Ballegooy2, E. Torvelainen3, R. Gulley4
ABSTRACT Ground investigations are used to inform the expected land performance for the design of building
foundations. How many investigation points are necessary to sufficiently capture the soil variability as part of liquefaction assessment across a residential building foundation? Further, can investigations across a wider area of geologic similarity be used as an indicator of the potential soil variability across a site? On 4 September 2010 the magnitude 7.1 Darfield Earthquake struck the Canterbury Area in New Zealand. This and three further major earthquakes caused substantial and extensive liquefaction related land and residential building damage. This case study looks at the use of Cone Penetration Tests (CPT) to predict land performance in the North New Brighton suburb of Christchurch. The earthquakes showed that the liquefaction related land damage was reasonably consistent over a wider area of geologic similarity, yet the results of CPT-based liquefaction vulnerability assessments indicate the land damage across such areas could be highly variable. Analyses presented in this paper show that two site specific CPT can be insufficient to capture the soil profile variability across a residential building foundation, but wider ground investigations in an area of geologic similarity should be used in addition to site specific investigations to indicate the variability that can be expected across the building footprint, to better characterise the soil performance and inform appropriate foundation design.
Introduction
On the 4 September 2010 the magnitude (Mw) 7.1 Darfield Earthquake struck the Canterbury Area affecting the city of Christchurch. There have been more than 50 earthquakes having a magnitude of 5 or greater making up what is known as the 2010 - 2011 Canterbury Earthquake Sequence (CES). Four major earthquakes in the sequence caused substantial land damage around Canterbury. This land damage included significant manifestation of liquefaction, lateral spreading and widespread ground surface subsidence (Rogers et al., 2015). These main earthquakes were on; 4 September 2010 (Mw 7.1), 22 February 2011 (Mw 6.2), 13 June 2011 (Mw 5.6 followed by a Mw 6.0 event) and 23 December 2011 (Mw 5.8 followed by a Mw 5.9 event). Ground investigations are used to indicate future liquefaction related land performance for the design of building foundations. How many investigation points are necessary to sufficiently capture the soil variability across a residential building foundation? Further, can investigations in the wider area of geologic similarity be used as an indicator of the potential soil variability on a site? In this paper we present a case study of an area in an eastern suburb of Christchurch which experienced substantial liquefaction related damage and has subsequently had extensive Cone 1Geotechnical Hazard Specialist, Tonkin & Taylor, Auckland, New Zealand, [email protected] 2Senior Geotechnical Engineer, Tonkin & Taylor, Auckland, New Zealand, [email protected] 3Geotechnical Engineer, Tonkin & Taylor, Auckland, New Zealand, [email protected] 4Geotechnical Engineer, Tonkin & Taylor, Auckland, New Zealand, [email protected]
Penetration (CPT) investigations undertaken. The purpose of this paper is to examine how these questions inform foundation design for residential buildings using the New Zealand Ministry of Building Innovation and Employment (MBIE) 2012 guidelines (for repairing and rebuilding houses affected by the CES) for rebuilding on Technical Category 3 (TC3) land which is potentially vulnerable to liquefaction. Canterbury Land and Foundation Damage and Geotechnical Investigation Requirements
Land and foundation damage to residential buildings on flat ground in Canterbury was caused predominantly by liquefaction of the near surface soils. Near water-courses and areas of sloping ground lateral spreading occurred with liquefaction of underlying soil layers. Away from these topographical features liquefaction damage was primarily associated with ground surface subsidence, which caused differential settlement resulting in distortion of building foundations Rogers et al. (2014). After the 22 February 2011 earthquake, MBIE assigned the residential areas of Christchurch with three Technical Categories (TC1, TC2 and TC3) for the purpose of informing the requirements for geotechnical investigations and foundation design. Generally, land with poor performance during the CES was categorized as TC3. Further, the Canterbury Earthquake Recovery Authority (CERA) designated areas that were no longer economical to run infrastructure to, as no build zones, also termed residential Red Zone. To guide engineers in selecting appropriate foundation solutions in design, the MBIE guidelines (2012) recommend that prior to undertaking foundation design for residential buildings in TC3 areas, MBIE recommends that deep investigations be undertaken on the site. They recommended in TC3 areas for each new building foundation “…at least two deep investigation points (Cone Penetration Tests (CPTs), boreholes with Standard Penetration Tests (SPTs), etc) should be undertaken to enable site characterisation to 10 to 15m Depth” (MBIE, 2012). The MBIE guidelines also indicate that fewer investigations can be undertaken if there are sufficient investigations (6 to 8 investigations per hectare) in the surrounding area. To assess future land damage performance for residential building foundation design, the MBIE (2012) guidance recommends using the vertical one dimensional volumetric reconsolidation settlement calculated over the top 10m of soil profile (SV1D) as an index to determine the appropriate foundation options listed in the guidance document. SV1D is calculated using the procedure by Zhang et al. (2002) and the liquefaction triggering procedure by Boulanger and Idriss (2014). MBIE (2012 & 2014) guidance provides criteria at Serviceability Limit State (SLS), and Ultimate Limit State (ULS) design cases (representing the 25 and 500 year return period levels of earthquake shaking in Christchurch). An Intermediate Limit State (ILS) design check (representing the 100 year return period levels of earthquake shaking) is also included. The Magnitude (M) and Peak Ground Acceleration (PGA) values for the SLS, ILS and ULS design cases are specified in the MBIE (2012 & 2014) guidelines. For the SLS and ILS cases the design PGA values are 0.19g and 0.30g for a M6 earthquake and for ULS are 0.35g for a M7.5 earthquake. Studies undertaken by van Ballegooy et al. (2015) show that the ULS M7.5 0.35g ground motions results in virtually the same SV1D values in Christchurch compared to the equivalent M6 0.52g ground motions, when using the Boulanger and Idriss (2014) liquefaction triggering assessment methodology. Therefore, for simplicity, the ULS case has been modelled
using the M6 0.52g ground motions. Extensive ground investigations have been undertaken in TC3 areas by the New Zealand Earthquake Commission (EQC) and private insurance companies to inform the assessment of land damage and building damage claims across Christchurch and inform the foundation rebuild requirements for the houses which were damaged by the CES and are uneconomic to repair. More than 4,000 boreholes, 18,000 CPT soundings, and 900 groundwater monitoring piezometers have been undertaken across Canterbury as of April 2015 (Scott et al., 2015). These ground investigations are available on the Canterbury Geotechnical Database (CGD).
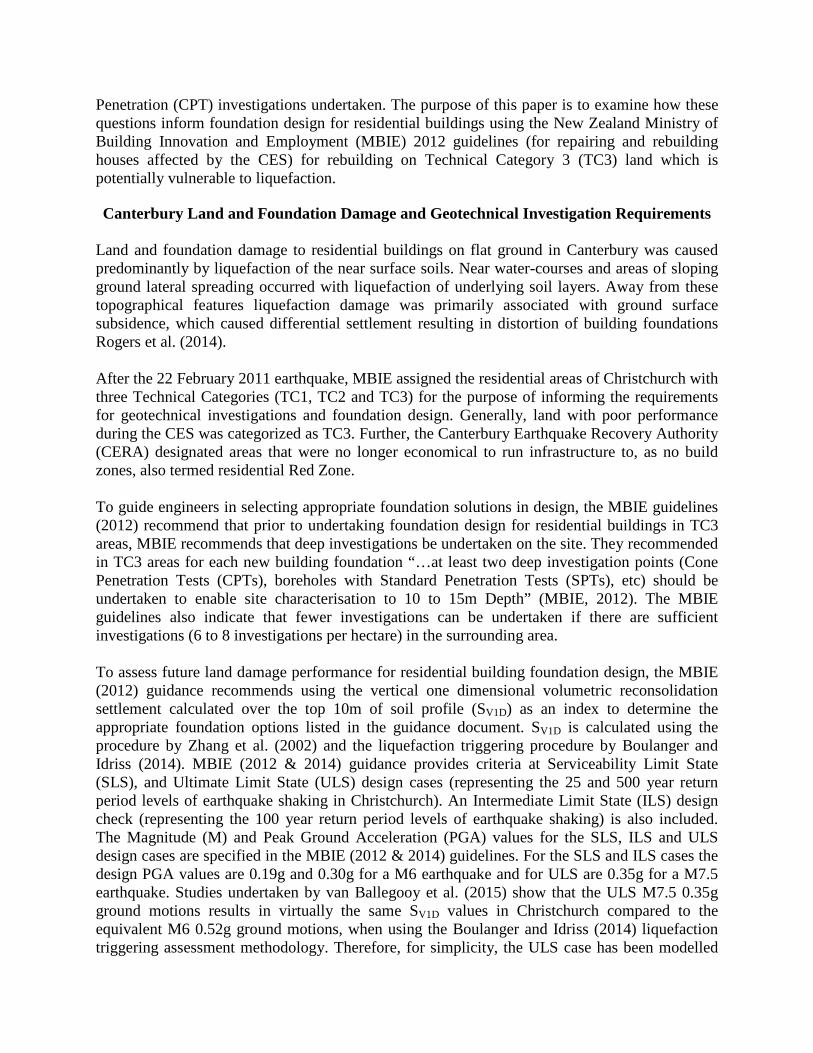
Case Study Area General Setting, Ground Profile and Groundwater The case study area, shown in Figure 1, is in the eastern Christchurch suburb of North New Brighton. The sub surface soils are predominantly composed of marine deposits. The ground has been re-graded close to flat, with a slight suburb wide grade southwards towards the Avon River. The soil deposits in this area are generally consistent in material type (sand with some silt layers), with a variable density over short distances (shown in Figure 2). This rapid change in density (referred to as the geologic variability) is as a result of the change in topography of sand dunes or change in grade from sand banks to natural channels in a marginal marine estuarine environment.
Figure 1. The North New Brighton case study area showing the liquefaction related land damage, liquefaction related ground surface subsidence, foundation damage and CPT-based SV1D.
Property 1 Property 2 Property 3 Property 4 De
pth
belo
w g
roun
d su
rfac
e (m
)
De
pth
belo
w g
roun
d su
rfac
e (m
)
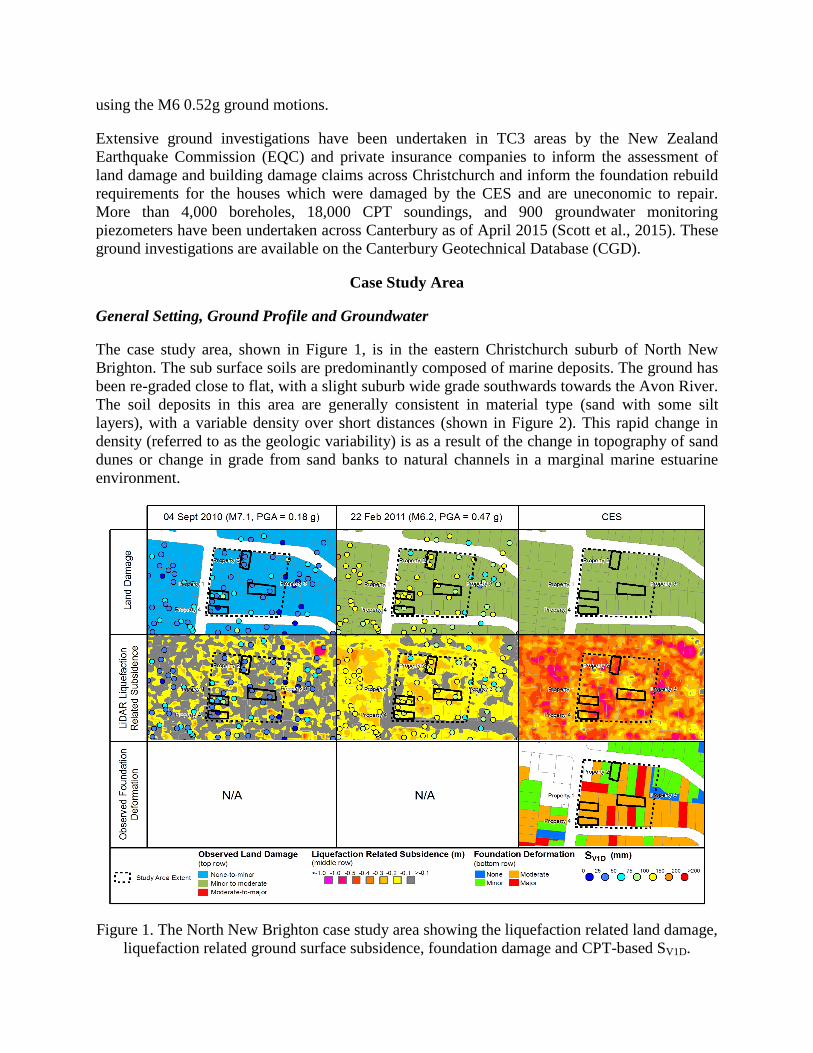
Figure 2. qc and Ic profiles for the four properties in the case study areas (shown as colour traces)
overlaid on the other CPT qc and Ic profiles in the case study area (shown as grey traces). The extents of the case study area is approximately 130m by 120m. There are 27 CPT investigations in this area which is equivalent to having 17 investigations per hectare across the study area. This is more than the minimum recommendation of 6 to 8 CPTs per hectare (MBIE, 2012). Within the study area there are 25 land parcels and 28 residential buildings, excluding secondary structures. Therefore on average across the study area, there is approximately one investigation per land parcel and residential building. In Figure 2, the ground profile in the case study area is inferred by the CPT tip resistances (qc) and soil behaviour type index (Ic) plotted with depth. Four properties have been labelled in Figure 1 and the CPT for the labelled properties are presented as colour traces in Figure 2 over the other CPTs in the case study area as grey traces. For soils of the same type within the same geologic area, notable variation in the qc represents variation in the relative density of the soil. On the qc plots, curves indicating liquefaction triggering, at a liquefaction factor of safety FS = 1.0, are shown for SLS, ILS and ULS shaking levels. These are based on the Boulanger and Idriss (2014) liquefaction triggering methods assuming clean sand soil (Ic < 1.8), PL = 15%, CFC = 0 and depth to groundwater of 1 m below
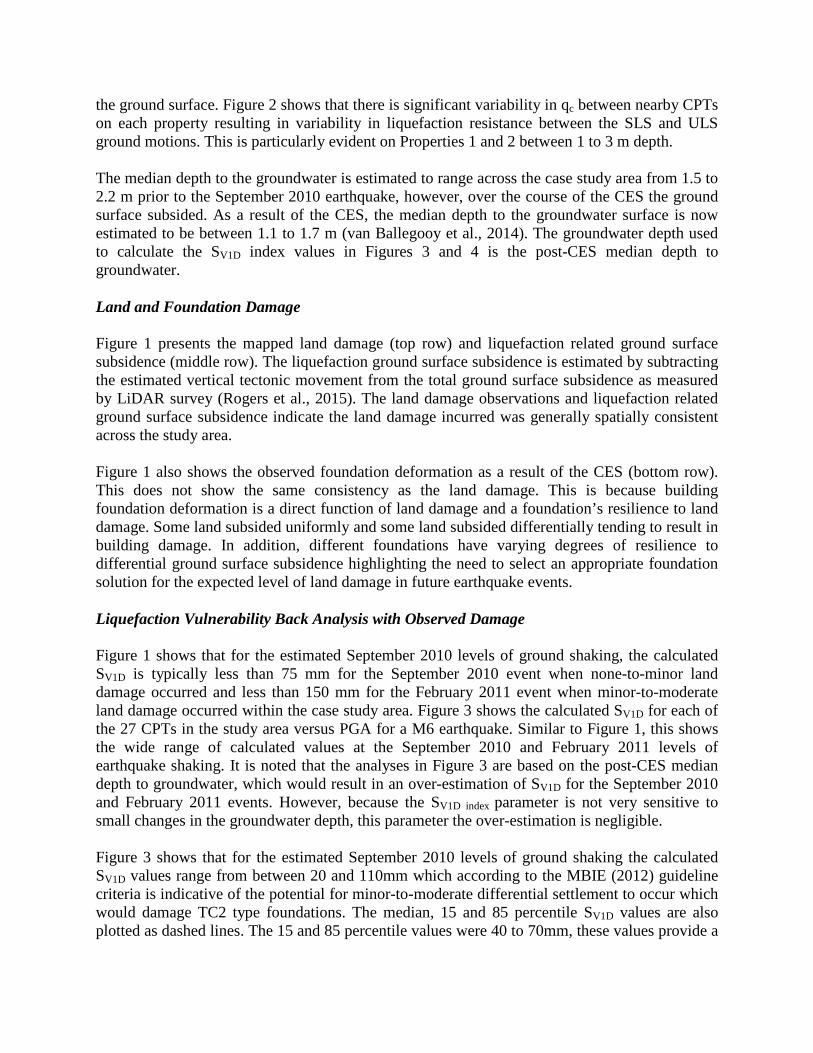
the ground surface. Figure 2 shows that there is significant variability in qc between nearby CPTs on each property resulting in variability in liquefaction resistance between the SLS and ULS ground motions. This is particularly evident on Properties 1 and 2 between 1 to 3 m depth. The median depth to the groundwater is estimated to range across the case study area from 1.5 to 2.2 m prior to the September 2010 earthquake, however, over the course of the CES the ground surface subsided. As a result of the CES, the median depth to the groundwater surface is now estimated to be between 1.1 to 1.7 m (van Ballegooy et al., 2014). The groundwater depth used to calculate the SV1D index values in Figures 3 and 4 is the post-CES median depth to groundwater. Land and Foundation Damage Figure 1 presents the mapped land damage (top row) and liquefaction related ground surface subsidence (middle row). The liquefaction ground surface subsidence is estimated by subtracting the estimated vertical tectonic movement from the total ground surface subsidence as measured by LiDAR survey (Rogers et al., 2015). The land damage observations and liquefaction related ground surface subsidence indicate the land damage incurred was generally spatially consistent across the study area. Figure 1 also shows the observed foundation deformation as a result of the CES (bottom row). This does not show the same consistency as the land damage. This is because building foundation deformation is a direct function of land damage and a foundation’s resilience to land damage. Some land subsided uniformly and some land subsided differentially tending to result in building damage. In addition, different foundations have varying degrees of resilience to differential ground surface subsidence highlighting the need to select an appropriate foundation solution for the expected level of land damage in future earthquake events. Liquefaction Vulnerability Back Analysis with Observed Damage Figure 1 shows that for the estimated September 2010 levels of ground shaking, the calculated SV1D is typically less than 75 mm for the September 2010 event when none-to-minor land damage occurred and less than 150 mm for the February 2011 event when minor-to-moderate land damage occurred within the case study area. Figure 3 shows the calculated SV1D for each of the 27 CPTs in the study area versus PGA for a M6 earthquake. Similar to Figure 1, this shows the wide range of calculated values at the September 2010 and February 2011 levels of earthquake shaking. It is noted that the analyses in Figure 3 are based on the post-CES median depth to groundwater, which would result in an over-estimation of SV1D for the September 2010 and February 2011 events. However, because the SV1D index parameter is not very sensitive to small changes in the groundwater depth, this parameter the over-estimation is negligible. Figure 3 shows that for the estimated September 2010 levels of ground shaking the calculated SV1D values range from between 20 and 110mm which according to the MBIE (2012) guideline criteria is indicative of the potential for minor-to-moderate differential settlement to occur which would damage TC2 type foundations. The median, 15 and 85 percentile SV1D values are also plotted as dashed lines. The 15 and 85 percentile values were 40 to 70mm, these values provide a
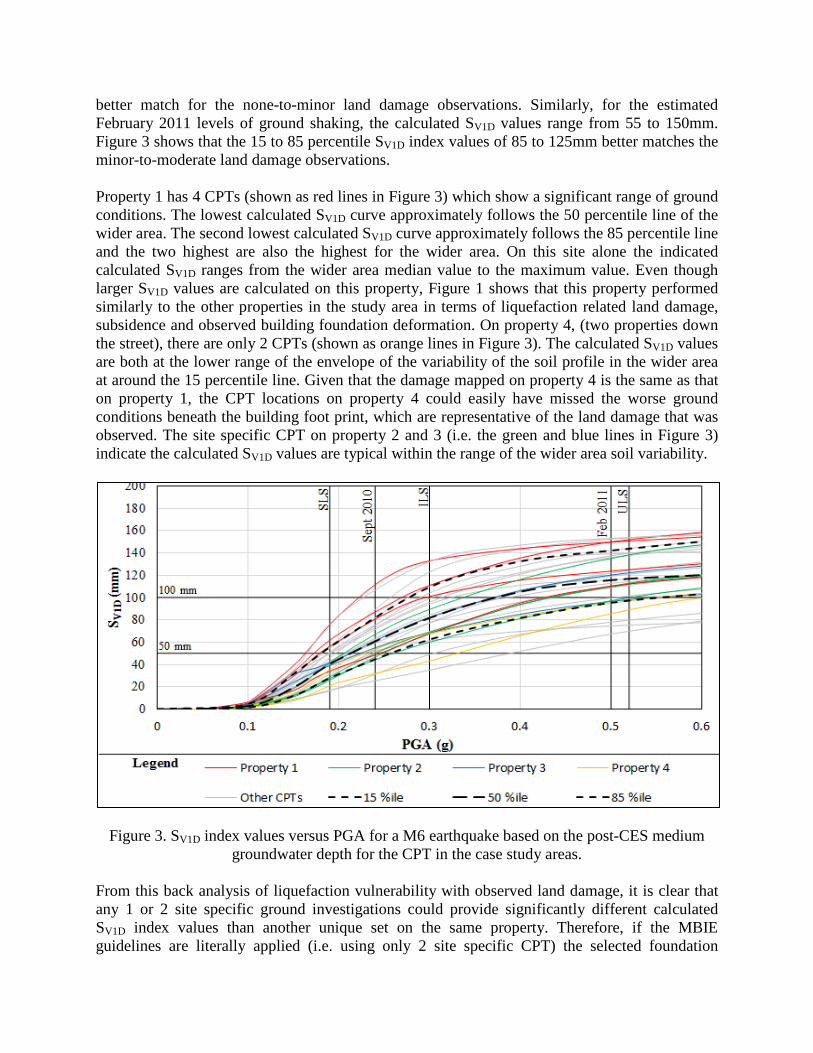
better match for the none-to-minor land damage observations. Similarly, for the estimated February 2011 levels of ground shaking, the calculated SV1D values range from 55 to 150mm. Figure 3 shows that the 15 to 85 percentile SV1D index values of 85 to 125mm better matches the minor-to-moderate land damage observations. Property 1 has 4 CPTs (shown as red lines in Figure 3) which show a significant range of ground conditions. The lowest calculated SV1D curve approximately follows the 50 percentile line of the wider area. The second lowest calculated SV1D curve approximately follows the 85 percentile line and the two highest are also the highest for the wider area. On this site alone the indicated calculated SV1D ranges from the wider area median value to the maximum value. Even though larger SV1D values are calculated on this property, Figure 1 shows that this property performed similarly to the other properties in the study area in terms of liquefaction related land damage, subsidence and observed building foundation deformation. On property 4, (two properties down the street), there are only 2 CPTs (shown as orange lines in Figure 3). The calculated SV1D values are both at the lower range of the envelope of the variability of the soil profile in the wider area at around the 15 percentile line. Given that the damage mapped on property 4 is the same as that on property 1, the CPT locations on property 4 could easily have missed the worse ground conditions beneath the building foot print, which are representative of the land damage that was observed. The site specific CPT on property 2 and 3 (i.e. the green and blue lines in Figure 3) indicate the calculated SV1D values are typical within the range of the wider area soil variability.
Figure 3. SV1D index values versus PGA for a M6 earthquake based on the post-CES medium groundwater depth for the CPT in the case study areas.
From this back analysis of liquefaction vulnerability with observed land damage, it is clear that any 1 or 2 site specific ground investigations could provide significantly different calculated SV1D index values than another unique set on the same property. Therefore, if the MBIE guidelines are literally applied (i.e. using only 2 site specific CPT) the selected foundation
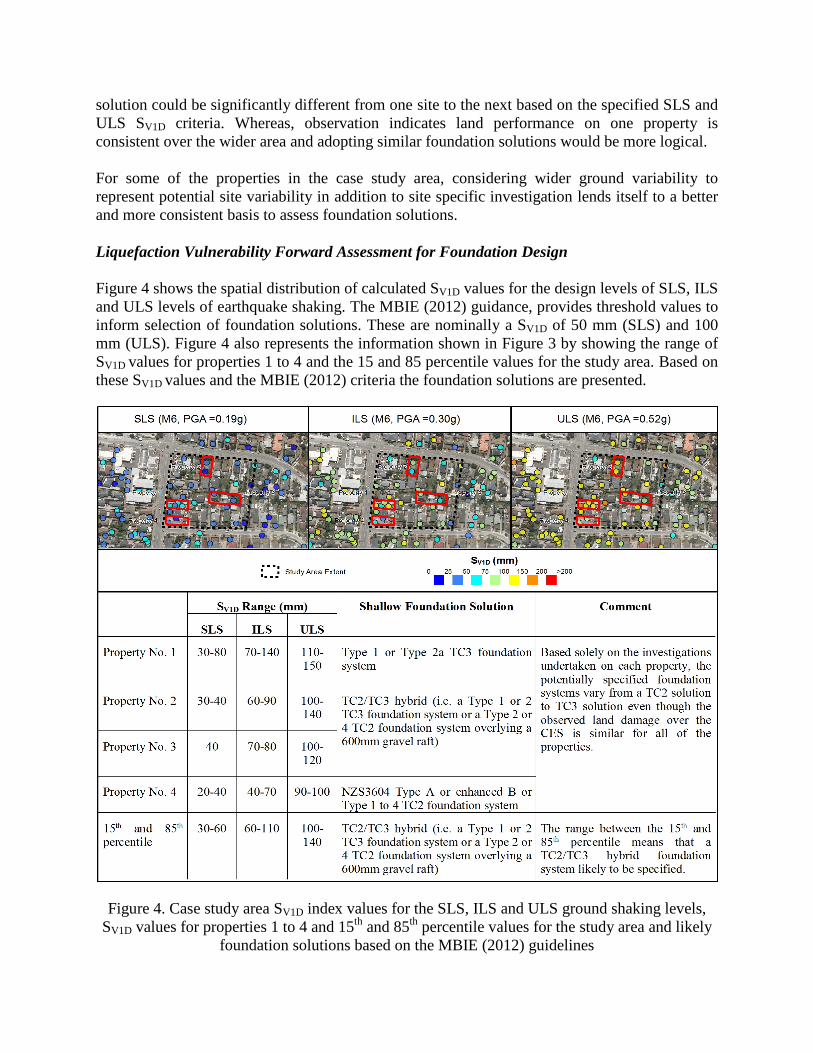
solution could be significantly different from one site to the next based on the specified SLS and ULS SV1D criteria. Whereas, observation indicates land performance on one property is consistent over the wider area and adopting similar foundation solutions would be more logical. For some of the properties in the case study area, considering wider ground variability to represent potential site variability in addition to site specific investigation lends itself to a better and more consistent basis to assess foundation solutions. Liquefaction Vulnerability Forward Assessment for Foundation Design Figure 4 shows the spatial distribution of calculated SV1D values for the design levels of SLS, ILS and ULS levels of earthquake shaking. The MBIE (2012) guidance, provides threshold values to inform selection of foundation solutions. These are nominally a SV1D of 50 mm (SLS) and 100 mm (ULS). Figure 4 also represents the information shown in Figure 3 by showing the range of SV1D values for properties 1 to 4 and the 15 and 85 percentile values for the study area. Based on these SV1D values and the MBIE (2012) criteria the foundation solutions are presented.
Figure 4. Case study area SV1D index values for the SLS, ILS and ULS ground shaking levels, SV1D values for properties 1 to 4 and 15th and 85th percentile values for the study area and likely
foundation solutions based on the MBIE (2012) guidelines
On inspection of Figure 4 building foundations selected using only 2 CPT in isolation could lead to foundation solutions which are under scoped (e.g. Property 4) or over scoped (e.g. Property 1) and inconsistent with the foundations for the other residential buildings in the area. The MBIE (2012) recommendation of 2 CPT per property is sufficient provided the wider ground variability of the geologic area is also considered. The MBIE guidelines recommend that engineers exercise appropriate judgement. Like all problems in engineering understanding of the problem (liquefaction related land and building damage) and solution (CPT-based assessment of SV1D, to select foundation solutions) is required to make an engineering decision that is appropriate. These decisions are, however, situation specific and further considerations may include geological unit boundaries, the range of wider variability and the foundation solutions available.
Discussion and Conclusions The CES and the CGD has provided a unique opportunity to understand wider ground variability with reference to liquefaction related land performance. Wider ground variability can also be understood in areas outside of Christchurch when site investigation data is made available on a shared database. This case study showed that liquefaction related land damage was consistent across a relatively uniform geological area by soil type, yet this same area varied in density enough to predict, using CPT, significantly different expected performance with the SV1D liquefaction vulnerability parameter. The case study has shown that consideration of 2 site specific CPT can be insufficient to capture the site variability for residential foundation design for liquefaction resilience. This can lead to an under or over estimate of the likely land damage and, therefore, under or over scoping of necessary foundation solutions. Wider ground variability, indicated by the wider area CPTs within a similar geologic area, provides a guide to the potential site ground variability which can be expected. This provides an improved basis for foundation design for liquefaction resilience rather than consideration of site specific ground investigations alone.
Acknowledgments This work was made possible by the site investigation data provided courtesy of the Earthquake Commission and Canterbury Earthquake Recovery Authority accessed through the CGD.
References Boulanger, R. W., & Idriss, I. M. (2014). CPT and SPT based liquefaction triggering
procedures. Center for Geotechnical Modeling, Department of Civil and Environmental Engineering, University of California, Davis, CA. Report No. UCD/CGM-14/01.
Canterburygeotechnicaldatabase.projectoribt.com. (2015). Retrieved from Log In. [online]: https://canterburygeotechnicaldatabase.projectorbit.com
Jackson, M., Taylor, M., Ng, K., & Fisher, T. (2015). Increased flooding vulnerability - A new recognised type of land damage. Proceedings of the 12th Australia New Zealand Conference on Geomechanics (pp. 1123-1130). Wellington, New Zealand: NZGS & AGS.
MBIE. (2012). Repairing and rebuilding houses affected by the Canterbury earthquakes. Ministry of Business, Innovation and Employment. December 2012. Retrieved from http://www.dbh.govt.nz/guidance-on-repairs-after-earthquake
MBIE. (2015, May 29). Updated guidance on site ground improvement (section 15.3) to the Guidance 'Repairing and rebuilding houses affected by the Canterbury earthquakes. Christchurch.
New Zealand Standards. (2004). NZS 1170.5:2004. Structural Design Actions - Earthquake Actions.
Robertson, P. K., & Wride, C. E. (1998). Evaluating cyclic liquefaction potential using the cone penetration test. Canadian Geotechnical Journal, 35, 442-459.
Rogers, N., van ballegooy, S., Williams, K., & Johnson, L. (2015). Considering Post-Disaster Damage to Residential Buidling Construction - Is Our Modern Building Construction Resilient? In review. 6th International Conference on Earthquake Geotechnical Engineering, (p. 8). Christchurch.
Russell, J., van Ballegooy, S., Rogers, N., Lacrosse, V., & Jacka, M. (2015). The effect of subsidence on liquefaction vulnerability following the 2010-2011 Canterbury Earthquake Sequence. Proceedings of the 12th Australia New Zealand Conference on Geomechanics (pp. 610-617). Wellington, New Zealand: NZGS & AGS.
van Ballegooy, S., Cox, S. C., Thurlow, C., Rutter, H. K., Reynolds, T., Harrington, G., & Smith, T. (2014). Median water elevation in Christchurch and surrounding area after the 4 September 2010 Darfield Earthquake, Version 2. GNS Science Report 2014/18.
Zhang, G., Robertson, P., & Brachman, R. (2002). Estimating liquefaction-induced ground settlements from CPT for level ground. Canadian Geotechnical Journal, 39(5), 1168-1180.