consolidated financial results for the first six months of
TRANSCRIPT

Consolidated Financial Results for the First Six Months
of the Fiscal Year Ending October 31, 2018 (Under Japanese GAAP)
* Please note this document is a translation of the original Japanese document “Financial Results for the 6
months ended April 30, 2018 (Kessan Tanshin)” and is only for reference purposes. In the event of any
discrepancy between this translated document and the original Japanese document, the latter shall prevail.
May 31, 2018
Company Name: H.I.S. Co., Ltd.
Stock Code: 9603, URL: http://www.his.co.jp/english/info.html
Representative Director: Hideo Sawada, Representative Director, Chairman and President
Contact: Shigeru Nakatani, Director and CFO
Scheduled date to file Quarterly Securities Report:June 04, 2018
Scheduled date to commence dividend payments: ―
Preparation of supplementary material on quarterly financial results: Yes
Holding of quarterly financial results meeting: Yes ( for analysts and institutional investors )
(Rounded down to the nearest million Japanese Yen)
1. Consolidated Financial Results for the First Six Months of the Fiscal Year Ending October 31, 2018
(November 1, 2017 – April 30, 2018)
(1) Consolidated Operating Results (Cumulative) (% shows year-on-year changes)
Sales Operating Income Ordinary Income Net Income Attributable
to Owners of Parent
6 months ended JPY million % JPY million % JPY million % JPY million %
Apr 30, 2018 341,247 25.5 7,623 22.1 7,814 △25.8 3,555 △31.3
Apr 30, 2017 271,825 6.2 6,242 △26.9 10,531 134.4 5,172 5,115.9
(*Note) Comprehensive Income: JPY4,414 million (△59.3%) for the 6 months ended April 30, 2018
JPY10,834 million (-%) for the 6 months ended April 30, 2017
EPS Diluted EPS
6 months ended JPY JPY
Apr 30, 2018 61.92 53.46
Apr 30, 2017 84.14 78.47
(*Note) As of the end of October 2017, provisional accounting for consolidation was finalized. As a result, the
figures for the 2nd quarter of the fiscal year ended October 2017 reflect the finalization of the provisional
accounting treatment.
(2) Consolidated Financial Position
Total Assets Net Assets Equity Ratio BPS
As of JPY million JPY million % JPY
Apr 30, 2018 464,608 108,741 17.7 1,440.35
Oct 31, 2017 422,809 111,247 20.3 1,466.13
(*Reference) Shareholders’ Equity : JPY82,454 million as of April 30, 2018
JPY85,773 million as of October 31, 2017
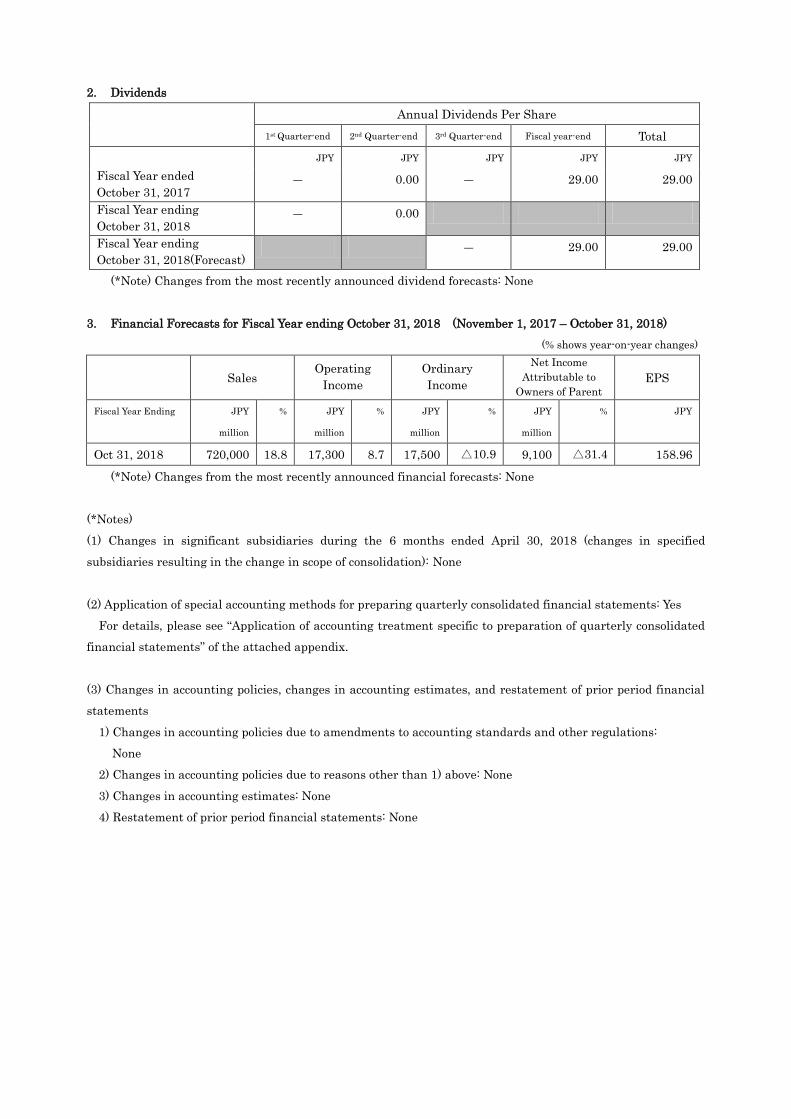
2. Dividends
Annual Dividends Per Share
1st Quarter-end 2nd Quarter-end 3rd Quarter-end Fiscal year-end Total
JPY JPY JPY JPY JPY
Fiscal Year ended
October 31, 2017 ― 0.00 ― 29.00 29.00
Fiscal Year ending
October 31, 2018 ― 0.00
Fiscal Year ending
October 31, 2018(Forecast) ― 29.00 29.00
(*Note) Changes from the most recently announced dividend forecasts: None
3. Financial Forecasts for Fiscal Year ending October 31, 2018 (November 1, 2017 – October 31, 2018)
(% shows year-on-year changes)
Sales Operating
Income
Ordinary
Income
Net Income
Attributable to
Owners of Parent
EPS
Fiscal Year Ending JPY
million
% JPY
million
% JPY
million
% JPY
million
% JPY
Oct 31, 2018 720,000 18.8 17,300 8.7 17,500 △10.9 9,100 △31.4 158.96
(*Note) Changes from the most recently announced financial forecasts: None
(*Notes)
(1) Changes in significant subsidiaries during the 6 months ended April 30, 2018 (changes in specified
subsidiaries resulting in the change in scope of consolidation): None
(2) Application of special accounting methods for preparing quarterly consolidated financial statements: Yes
For details, please see “Application of accounting treatment specific to preparation of quarterly consolidated
financial statements” of the attached appendix.
(3) Changes in accounting policies, changes in accounting estimates, and restatement of prior period financial
statements
1) Changes in accounting policies due to amendments to accounting standards and other regulations:
None
2) Changes in accounting policies due to reasons other than 1) above: None
3) Changes in accounting estimates: None
4) Restatement of prior period financial statements: None

(4) The Number of Issued and Outstanding Shares (Common Shares)
1) Number of Issued and Outstanding Shares (Including Treasury Stocks) at the end of the period
As of Apr 30, 2018 68,522,936 shares
As of Oct 31, 2017 68,522,936 shares
2) Number of Treasury Stocks at the end of the period
As of Apr 30, 2018 11,276,750 shares
As of Oct 31, 2017 10,019,506 shares
3) Average Number of Shares during the period
6 months ended Apr 30, 2018 57,418,962 shares
6 months ended Apr 30, 2017 61,473,124 shares
(*Note) The stocks of the company held by H.I.S. Employee Stock Ownership Trust are included in the
number of treasury stock at the end of period (237,400 shares as of April 30, 2018 and 363,100 shares as of
October 31, 2017) and the number of treasury stock deducted in calculating the average number of shares
during the period (341,843 shares during 6 months ended April 30, 2018 and 427,900 shares as of April 30,
2017).
(*Note) Explanations regarding the Quarterly Review Procedures
This document is not subject to the quarterly review procedures as promulgated by the Financial Instruments
and Exchange Act.
(*Note) Explanations regarding the Appropriate Use of Financial Forecasts and Other Special Instructions
The financial forecasts above are based on information that is available to management as of the date of
announcement of this document and certain assumptions as of the date of announcement of this document that
are related to uncertain factors that could influence financial forecasts. Actual results may be significantly
different from these financial forecasts due to various factors. For more information, please see “Explanation
regarding financial forecasts and other forward-looking information” on the attached appendix.

1
1. Qualitative Information regarding the Financial Results for the 6 Months Ended April 30,
2018
(1) Explanation of Operating Results
Regarding the business environment during the 6 months ended April 30, 2018, despite the
economic uncertainties and geopolitical risks outside of Japan, domestic economic conditions in
Japan showed moderate recovery partly due to the effects of various governmental policies
while the employment and income environments continued to improve.
Under such circumstances, H.I.S. Group reorganized its business execution structure to
respond to its expanding business domain and promoted work style reforms. H.I.S. Group also
continued its efforts to build a new business model that can contribute to world peace as a
company constantly changing and developing not only through travel but also through various
businesses with the corporate philosophy “Contributing to the creative development of
humanity and world peace by complying with the law of nature".
Operating results by business segment are as follows. The amount of each segment is the
amount before eliminating intersegment transactions.
(Travel Business)
The number of Japanese travelers departing Japan during the 6 months ended April 30 2018
was solid, increasing by 3.3% as compared to the same period last year to 8.99 million, due to
continued recovery of demand for travel to Europe in addition to major sightseeing
destinations remaining safe. With respect to foreign visitors to Japan, the number of visitors
continued to be strong and increased by 18.2% to 15.41 million, a record high, due to
continued high demand for visiting Japan. (Source: JNTO).
The travel business in Japan was solid due to the recovering trend for travel to Europe and
successful campaigns for major destinations such as Bali and Okinawa, partially offset by
the deterioration of seating environments departing from / arriving at Japan due to the
increased visitors to Japan from Asian countries during the Chinese New Year. In addition,
H.I.S. Group made its efforts to improve customer satisfaction by renewing domestic air
ticket comparison websites and starting new services using VR at sales outlets.
In the overseas travel business, JONVIEW CANADA INC., a major tour operator in Canada,
became a subsidiary of H.I.S. with a view to further strengthening the travel business in
North America. Together with Merit Holdings Inc. and GROUP MIKI HOLDINGS LIMITED,
which had become subsidiaries in the previous fiscal year, it contributed significantly to
expanding overseas business. Overseas subsidiaries, especially those in Southeast Asia,
actively deployed charter flights to Japan. Regarding the inbound business overseas, efforts
were made to expand the market, such as multi-lingualization of tour desks.

2
In addition to the increase in the number of passengers due to the Chinese New Year in
Asian countries, the inbound travel business to Japan was favorable due to the success of
tour products for the popular cherry blossom season, mainly in Southeast Asian and Western
countries.
In the meantime, the number of H.I.S. Group’s sales locations was 281 in Japan and 274 in
158 cities in 70 countries outside of Japan as of the end of April 2018 as a result of opening
new locations and consolidation.
As a result of the above, the Travel Business recorded net sales of 303,688 million yen
(127.1% of the same period last year), and operating income of 4,189 million yen (115.9% of
the same period last year).
(Huis Ten Bosch Group)
Celebrating its 25th anniversary, Huis Ten Bosch focused on further enhancing customer
satisfaction and experience value by providing only one and number one contents. Huis Ten
Bosch offered “World Flower Festival & Gardening Show”, the only one in Japan, “Kingdom
of Light” with one of the world's largest 13 million lights as well as 3D projection mapping of
110 meters, the largest in Japan that was newly added, and "Phalaenopsis Orchid
Exhibition" that offers 200 varieties of Phalaenopsis orchids, the largest in Japan, all of
which can only be experienced at Huis Ten Bosch. Huis Ten Bosch also launched new
developments such as hosting a giant fireworks event that is held for the first time at this
time of year, opening a "Golden Hall" where visitors can enjoy the world of pure gold worth
800 million yen, and starting a new attraction "Rail Coaster in the Sky" tailored to spring
vacation.
Due to the initiatives above, the number of visitors during the 1st and 2nd quarters was
1,396,000 (94.4% of the same period last year), a moderate recovery from 92.4% during the
1st quarter only which was negatively affected by bad weather during weekends and
decreased long holidays.
As a result of the above, Huis Ten Bosh Group recorded net sales of 20,823 million yen
(122.5% of the same period last year) and operating income of 3,620 million yen (96.0% of the
same period last year) due to decrease in the number of visitors to Laguna Ten Bosch during
year-end and New Year holidays and during spring vacation as well as increased fuel costs at
HTB ENERGY CO., LTD., an electric power retailing business.
(Hotel Business)
In the Hotel Business, which H.I.S. Group is aiming to strengthen as the third pillar
following Travel Business and Huis ten Bosh Group, “Henn na Hotel”, aiming to be the most
efficient hotel in the world, is the mainstream of business, opening “Henn na Hotel Ginza” in
February 2018. “Henn na Hotel Maihama, Tokyo Bay" where one year has passed since the
start of business, is steadily attracting customers during the leisure season. H.I.S. Group
plans to accelerate the development by opening 3 “Henn na Hotel” in Tokyo and 5 in Western
Japan.

3
As a result of the above, Hotel Business recorded net sales of 6,240 million yen (172.4% of the
same period last year), operating income of 713 million yen (144.4% of the same period last
year) and EBITDA of 1,386 million yen (153.9% of the same period last year), due partly to
the contribution of Green World Hotels Co., Ltd., that had become a consolidated subsidiary
in the 3rd quarter of the previous fiscal year. The Watermark Hotel Sapporo, a real estate
owned by Watermark Hotel Japan Co., Ltd., which had been included in this business
segment was sold to a 3rd party in March 2018.
(The Kyushu Sanko Group)
The Kyushu Sanko Group recorded net sales of 10,845 million yen (97.0% of the same period
last year) and operating income of 349 million yen (143.1% of the same period last year) as a
result of reduction in charter buses, bus trips, and service area sales due to traffic closure on
February snowfall. On the other hand, the Sakuramachi redevelopment project progressed
as planned.
As a result of the above, H.I.S. Group recorded net sales of 341,247 million yen (125.5% of the
same period last year), a record high, and operating income of 7,623 million yen (122.1% of the
same period last year) during the 6 months ended April 30, 2018. Ordinary income was 7,814
million yen (74.2% of the same period last year) with 1,308 million yen of foreign exchange
losses (2,741 million yen of foreign exchange gains in the same period last year), and net
income attributable to parent company’s shareholders was 3,555 million yen (68.7% of the
same period last year).
(2) Explanation of Financial Position
Total assets as of April 30, 2018 increased by 41,798 million yen as compared to October 31,
2017 to 464,608 million yen. This was due mainly to 15,211 million yen increase in property,
plant and equipment, 8,347 million yen increase in cash and deposits, 3,758 million yen
increase in travel advance payments, 2,729 million yen increase in goodwill, and 2,273 million
yen increase in investment securities.
Total liabilities as of April 30, 2018 increased by 44,304 million yen as compared to October 31,
2017 to 355,866 million yen. This was due mainly to 25,097 million yen of issuance of
convertible bond-type bonds with subscription rights to shares, 9,309 million yen increase in
operating accounts payable, and 4,416 million yen increase in loans payable.
Net assets as of April 30, 2018 decreased by 2,505 million yen as compared to October 31, 2017
to 108,741 million yen. This was due mainly to 4,999 million yen of purchase of treasury shares
in accordance with the resolution of board of directors on October 31, 2017, partially offset by
1,841 million yen increase in retained earnings by recording quarterly net income, etc.
Capital ratio as of April 30, 2018 was 17.7% as compared to 20.3% as of October 31, 2017. This
was due to fund raising through bonds payable, convertible bond-type bonds with subscription
rights to shares and loans payable. Capital ratio excluding the impact of the fund raising was
31.2% as of April 30, 2018 and 34.1% as of October 31, 2017.

4
(Cash Flows)
The balance of cash and cash equivalents (hereinafter referred to as "funds") as of April 30,
2018 increased by 8,278 million yen to 176,937 million yen. The status of respective cash flow
and major factors during the 6 months ended April 30, 2018 are as follows;
[Cash flows from operating activities]
Cash flow generated by operating activities during the 6 months ended April 30, 2018 was
12,231 million yen, as compared to 19,740 million yen generated during the 6 months ended
April 30, 2017. This was due mainly to 8,713 million yen of income before income taxes, 6,161
million yen increase in travel advance received, 4,011 million yen of depreciation, a non-cash
item, partially offset by 4,880 million yen income taxes paid.
Cash flow generated by operating activities during the 6 months ended April 30, 2017 (the
previous fiscal year) was due mainly to 9,894 million yen of income before income taxes,
5,106 million yen increase in travel advance received, and 3,359 million yen of depreciation,
a non-cash item.
[Cash flows from investing activities]
Cash flow used by investing activities during the 6 months ended April 30, 2018 was 25,895
million yen, as compared to 10,351 million yen used during the 6 months ended April 30,
2017. This was due mainly to 19,057 million yen of purchase of property, plant and
equipment and intangible assets, 3,303 million yen purchase of investment securities, and
3,298 million yen purchase of shares of subsidiaries resulting in change in scope of
consolidation.
Cash flow used by investing activities during the 6 months ended April 30, 2017 was due
mainly to 7,917 million yen purchase of property, plant and equipment and intangible assets,
and 2,817 million yen purchase of shares of subsidiaries resulting in change in scope of
consolidation.
[Cash flows from financing activities]
Cash flow generated by financing activities during the 6 months ended April 30, 2018 was
22,147 million yen, as compared to 26,117 million yen generated during the 6 months ended
April 30, 2017. This was due mainly to 25,100 million yen (*) issuance of convertible
bond-type bonds with subscription rights to shares, 7,991 million yen of proceeds from long
and short terms loans payable, partially offset by 5,000 million yen of purchase of treasury
shares, 3,546 million yen repayments of long and short term loans payable, and 1,707 million
yen of cash dividends paid.
Cash flow generated by financing activities during the 6 months ended April 30, 2017 was
due mainly to 38,383 million yen of proceeds from long and short term loans payable and
19,909 million yen issuance of bonds, partially offset by 30,565 million yen repayments of
long and short term loans payable and 1,361 million yen of cash dividends paid.

5
As a result of the above, the amount of funds as of April 30, 2018 increased by 8,278 million yen
as compared to October 31, 2017 to 176,937 million yen.
(*) This is the amount of issuance proceeds after deducting issuance costs.
(3) Explanation of Forward-Looking Statements including Financial Forecasts
Despite a moderate recovery, the environment surrounding the global economy is expected to
remain uncertain, such as the future of the economies of China and Asian emerging countries,
the uncertainty of policies of each country, trade problems, and fluctuations in the financial
capital market. In the travel industry, major changes beyond market boundaries, such as the
continued expansion of online travel agents, the penetration of direct sales, and the emergence
of services using new technologies are expected. Under such circumstances, H.I.S. Group will
promote business developments that respond to market changes by maximizing synergies of
each company in H.I.S. Group’s global network, further evolving existing businesses, and
expanding into new areas via M&A, etc.
There is no change to the consolidated financial forecasts for the full year that were announced
on “Revision of Financial Forecasts dated April 27, 2018”.
The following events could possibly have an impact on the financial forecasts for the full year.
1. Foreign Exchange Fluctuations
H.I.S. Group has transactions denominated in foreign currencies, resulting in income,
expenses, assets and liabilities denominated in foreign currencies. Risks are hedged via
foreign exchange contracts to reduce the impact of fluctuations in exchange rates, but if the
exchange rate fluctuates significantly, there is a possibility that the financial forecasts for
the full year could be affected.
2. Reduction of Fuel Surcharges
Fuel surcharges included in the sales of the Travel Business may be reduced or be
unnecessary with the decline of fuel oil price. There is a possibility that consolidated sales
forecasts could be affected by this, but there is no impact on consolidated operating income,
ordinary income, net income attributable to parent company shareholders, and EPS
forecasts.

6
Consolidated Balance Sheet
(Millions of yen)
As of October 31, 2017 As of April 30, 2018
Assets
Current assets
Cash and deposits 193,039 201,387
Notes and accounts receivable - trade 34,801 36,340
Operating accounts receivable 6,194 5,351
Securities 39 41
Travel advance payments 28,062 31,820
Prepaid expenses 2,909 2,881
Deferred tax assets 2,328 2,421
Short-term loans receivable 5,634 5,993
Short-term loans receivable from
subsidiaries and associates 373 353
Accounts receivable - other 2,381 1,725
Other 7,954 14,448
Allowance for doubtful accounts △234 △313
Total current assets 283,485 302,452
Non-current assets
Property, plant and equipment
Buildings, net 22,015 22,208
Tools, furniture and fixtures, net 5,442 6,324
Vessels, net 62 54
Land 28,744 31,157
Leased assets, net 2,701 3,063
Construction in progress 18,086 29,430
Other, net 5,949 5,974
Total property, plant and equipment 83,001 98,213
Intangible assets
Goodwill 6,237 8,967
Other 11,428 11,316
Total intangible assets 17,666 20,284
Investments and other assets
Investment securities 10,957 13,230
Shares of subsidiaries and
associates 1,681 1,783
Investments in capital of
subsidiaries and associates 632 632
Long-term loans receivable 1,371 1,109
Long-term loans receivable from
subsidiaries and associates 128 1,150
Net defined benefit asset 622 572
Deferred tax assets 4,362 3,988
Guarantee deposits 7,643 8,303
Other 11,210 12,784
Allowance for doubtful accounts △181 △183
Total investments and other assets 38,427 43,370
Total non-current assets 139,095 161,868
Deferred assets 227 286
Total assets 422,809 464,608

7
(Millions of yen)
As of October 31, 2017 As of April 30, 2018
Liabilities
Current liabilities
Operating accounts payable 23,590 32,900
Short-term loans payable 7,474 13,116
Current portion of long-term loans
payable 1,847 855
Accounts payable - other 3,199 3,327
Accrued expenses 10,049 3,285
Income taxes payable 3,929 3,441
Accrued consumption taxes 724 745
Travel advance received 58,437 64,985
Lease obligations 864 986
Provision for bonuses 4,077 3,800
Provision for directors' bonuses 162 81
Other 17,509 24,046
Total current liabilities 131,866 151,573
Non-current liabilities
Bonds payable 40,000 40,000
Convertible bond-type bonds with
subscription rights to shares 20,073 45,170
Long-term loans payable 101,603 101,368
Deferred tax liabilities 4,786 4,820
Net defined benefit liability 7,588 6,849
Provision for directors' retirement
benefits 861 302
Provision for repairs 159 62
Lease obligations 2,211 2,415
Other 2,410 3,303
Total non-current liabilities 179,694 204,293
Total liabilities 311,561 355,866
Net assets
Shareholders' equity
Capital stock 11,000 11,000
Capital surplus 3,581 3,599
Retained earnings 92,731 94,572
Treasury shares △23,875 △28,750
Total shareholders' equity 83,437 80,421
Accumulated other comprehensive income
Valuation difference on available-for-
sale securities 283 435
Deferred gains or losses on hedges 265 △53
Foreign currency translation adjustment 1,716 1,640
Remeasurements of defined benefit plans 70 10
Total accumulated other comprehensive
income 2,336 2,033
Subscription rights to shares 252 340
Non-controlling interests 25,221 25,946
Total net assets 111,247 108,741
Total liabilities and net assets 422,809 464,608

8
Consolidated Statements of Income
(Millions of yen)
Six months ended
April 30, 2017
Six months ended
April 30, 2018
Net sales 271,825 341,247
Cost of sales 219,284 277,809
Gross profit 52,541 63,438
Selling, general and administrative expenses 46,298 55,814
Operating profit 6,242 7,623
Non-operating income
Interest income 867 794
Foreign exchange gains 2,741 -
Share of profit of entities accounted for
using equity method 99 0
Other 1,069 1,382
Total non-operating income 4,777 2,177
Non-operating expenses
Interest expenses 202 276
Foreign exchange losses - 1,308
Other 285 401
Total non-operating expenses 487 1,986
Ordinary profit 10,531 7,814
Extraordinary income
Gain on sales of non-current assets - 2,632
Gain on revision of retirement benefit
plan - 284
Total extraordinary income - 2,916
Extraordinary losses
Loss on sales of non-current assets 637 -
Loss on valuation of investment
securities - 330
affiliated company debt waiver - 1,687
Total extraordinary losses 637 2,018
Profit before income taxes 9,894 8,713
Income taxes 3,366 4,035
Profit 6,527 4,677
Profit attributable to non-controlling
interests 1,354 1,122
Profit attributable to owners of parent 5,172 3,555

9
Consolidated Statements of Cash Flows
(Millions of yen)
Six months ended
April 30, 2017
Six months ended
April 30, 2018
Cash flows from operating activities
Profit before income taxes 9,894 8,713
Depreciation 3,359 4,011
Amortization of goodwill 158 435
Increase (decrease) in provision for
bonuses 287 △290
Increase (decrease) in provision for
directors' bonuses △24 △80
Increase (decrease) in net defined benefit
liability 435 △6
Increase (decrease) in provision for
directors' retirement benefits 25 △569
Increase (decrease) in provision for
repairs △348 △108
Interest and dividend income △868 △843
Share of (profit) loss of entities
accounted for using equity method △99 △0
Foreign exchange losses (gains) △2,148 1,568
Interest expenses 202 276
Loss (gain) on sales of property, plant and
equipment 637 △2,632
Loss (gain) on sales of investment
securities - 330
Gain on revision of retirement benefit plan - △284
Loss on disposal of affiliate receivables - 1,687
Other loss (gain) △258 59
Decrease (increase) in notes and accounts
receivable - trade △409 642
Decrease (increase) in travel advance
payments △4,137 △4,674
Decrease (increase) in other assets 1,110 △4,430
Increase (decrease) in notes and accounts
payable - trade 3,257 8,060
Increase (decrease) in accrued consumption
taxes 76 81
Increase (decrease) in accrued expenses △90 △7,063
Increase (decrease) in travel advances
received 5,106 6,161
Increase (decrease) in other liabilities 3,594 5,408
Subtotal 19,759 16,454
Interest and dividend income received 1,031 934
Interest expenses paid △187 △277
Income taxes (paid) refund △862 △4,880
Net cash provided by (used in) operating
activities 19,740 12,231

10
(Millions of yen)
Six months ended
April 30, 2017
Six months ended
April 30, 2018
Cash flows from investing activities
Payments into time deposits △31,174 △20,389
Proceeds from withdrawal of time deposits 32,555 18,964
Proceeds from redemption of securities 3,000 -
Purchase of property, plant and equipment
and intangible assets △7,917 △19,057
Proceeds from sales of property, plant and
equipment 464 3,578
Purchase of investment securities △496 △3,303
Proceeds from sales of investment
securities - 736
Purchase of shares of subsidiaries and
associates △2,159 △117
Purchase of shares of subsidiaries
resulting in change in scope of
consolidation
△2,817 △3,298
Payments of loans receivable △1,781 △2,539
Collection of loans receivable 1,841 1,281
Payments for guarantee deposits △327 △1,001
Proceeds from collection of guarantee
deposits 166 323
Other, net △1,704 △1,071
Net cash provided by (used in) investing
activities △10,351 △25,895
Cash flows from financing activities
Increase in short-term loans payable 25,383 7,841
Decrease in short-term loans payable △29,930 △2,169
Proceeds from long-term loans payable 13,000 150
Repayments of long-term loans payable △635 △1,376
Purchase of treasury shares - △5,000
Cash dividends paid △1,361 △1,707
Proceeds from issuance of bonds 19,909 -
Proceeds from issuance of bonds with
subscription rights to shares - 25,100
Dividends paid to non-controlling
interests △11 △462
Proceeds from share issuance to non-
controlling shareholders - 14
Other, net △235 △242
Net cash provided by (used in) financing
activities 26,117 22,147
Effect of exchange rate change on cash and
cash equivalents 2,295 △215
Net increase (decrease) in cash and cash
equivalents 37,802 8,267
Cash and cash equivalents at beginning of
period 129,842 168,659
Increase (decrease) in cash and cash
equivalents resulting from change of scope of
consolidation
- 10
Cash and cash equivalents at end of period 167,645 176,937
11
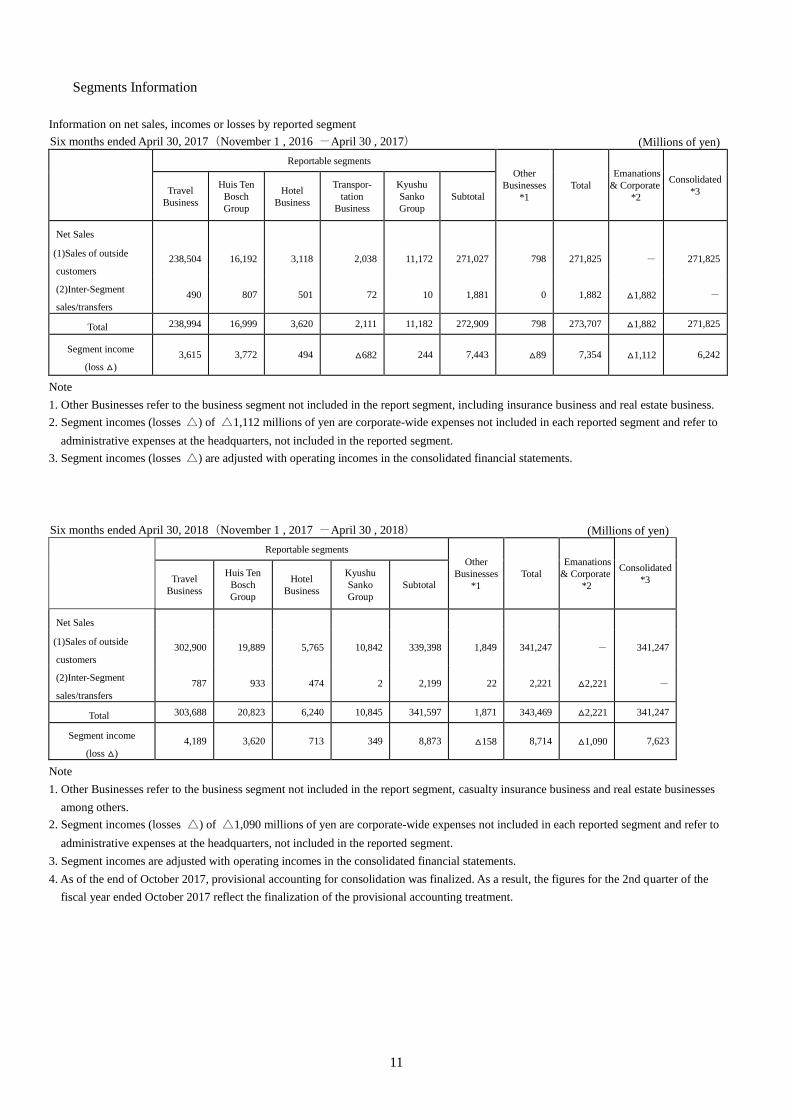
Segments Information
Information on net sales, incomes or losses by reported segment
Six months ended April 30, 2017(November 1 , 2016 -April 30 , 2017) (Millions of yen)
Reportable segments Other
Businesses
*1 Total
Emanations
& Corporate
*2
Consolidated
*3
Travel
Business
Huis Ten
Bosch
Group
Hotel
Business
Transpor-
tation
Business
Kyushu
Sanko
Group Subtotal
Net Sales
(1)Sales of outside
customers 238,504 16,192 3,118 2,038 11,172 271,027 798 271,825 - 271,825
(2)Inter-Segment
sales/transfers 490 807 501 72 10 1,881 0 1,882 △1,882 -
Total 238,994 16,999 3,620 2,111 11,182 272,909 798 273,707 △1,882 271,825
Segment income
(loss △) 3,615 3,772 494 △682 244 7,443 △89 7,354 △1,112 6,242
Note
1. Other Businesses refer to the business segment not included in the report segment, including insurance business and real estate business.
2. Segment incomes (losses △) of △1,112 millions of yen are corporate-wide expenses not included in each reported segment and refer to
administrative expenses at the headquarters, not included in the reported segment.
3. Segment incomes (losses △) are adjusted with operating incomes in the consolidated financial statements.
Six months ended April 30, 2018(November 1 , 2017 -April 30 , 2018) (Millions of yen)
Reportable segments Other
Businesses
*1 Total
Emanations
& Corporate
*2
Consolidated
*3
Travel
Business
Huis Ten
Bosch
Group
Hotel
Business
Kyushu
Sanko
Group Subtotal
Net Sales
(1)Sales of outside
customers 302,900 19,889 5,765 10,842 339,398 1,849 341,247 - 341,247
(2)Inter-Segment
sales/transfers 787 933 474 2 2,199 22 2,221 △2,221 -
Total 303,688 20,823 6,240 10,845 341,597 1,871 343,469 △2,221 341,247
Segment income
(loss △) 4,189 3,620 713 349 8,873 △158 8,714 △1,090 7,623
Note
1. Other Businesses refer to the business segment not included in the report segment, casualty insurance business and real estate businesses
among others.
2. Segment incomes (losses △) of △1,090 millions of yen are corporate-wide expenses not included in each reported segment and refer to
administrative expenses at the headquarters, not included in the reported segment.
3. Segment incomes are adjusted with operating incomes in the consolidated financial statements.
4. As of the end of October 2017, provisional accounting for consolidation was finalized. As a result, the figures for the 2nd quarter of the
fiscal year ended October 2017 reflect the finalization of the provisional accounting treatment.