consolidated financial results for the three months ended ... · 4 three months ended march 31,...
TRANSCRIPT

Company name: Kao Corporation Tokyo Stock Exchange in Japan
Stock code: 4452 (URL: http://www.kao.com/jp/en/corp_ir/investors.html)
Representative: Michitaka Sawada, President and CEO
Contact person: Mitsuhiro Watanabe, Vice President, Investor Relations E-mail: [email protected]
Scheduled starting date of the dividend payments: -
Supplementary documents of the financial results for the period: None
Holding quarterly financial results information meeting: None
(Millions of yen, except per share amounts)
(Amounts less than one million yen are rounded)
1. Consolidated financial results for the three months ended March 31, 2016
(from January 1, 2016 to March 31, 2016)
(1) Consolidated operating results
(Percentages indicate year-on-year changes)
% %
Net sales 1.7 -
Operating income 51.5 -
Income before income taxes 40.5 -
Net income 74.1 -
Net income, attributable to owners of the parent 73.1 -
Comprehensive income 8.5 -
Basic earnings per share (Yen)
Diluted earnings per share (Yen)
(2) Consolidated financial position
Total assets
Total equity
Equity attributable to owners of the parent
2. Dividends
Annual cash dividends per share (Yen)
1st quarter end
2nd quarter end
3rd quarter end
Fiscal year end
Total
Note: Revisions to the cash dividends forecasts most recently announced: None
21,047
20,801
5,648
41.47
41.43
Year ending
Consolidated Financial Results for the Three Months Ended March 31, 2016 [IFRS]
329,549
22,741
23,428
(Forecast)
March 31, 2016 December 31, 2015
Three months ended
March 31, 2015
Three months ended
March 31, 2016
12,086
1,327.29
Year ended
December 31, 2015
Year ending
December 31, 2016
Ratio of equity attributable to owners
of the parent to total assets
38.00
Equity attributable to owners of the
parent per share (Yen)
12,020
5,204
April 27, 2016
23.98
23.95
1,311,064
691,987
680,996
1,230,933
676,145
665,771
54.1% 51.9%
1,358.03
335,092
34,449
32,927
46.00
December 31, 2016
-
-
42.00
80.00
-
46.00
92.00
-

Three Months Ended March 31, 2016
3.
(from January 1, 2016 to December 31, 2016)
(Percentages indicate year-on-year changes)
% %
Net sales 1.9 2.4
Operating income 1.5 10.0
Income before income taxes 3.5 10.2
Net income, attributable to owners of the parent 3.0 14.1
Basic earnings per share (Yen) - -
Notes:1)
2) Revisions to the consolidated operating results forecasts most recently announced: None
4. Others
(1)
(2) Changes in accounting policies and changes in accounting estimates
1) Changes in accounting principles required by IFRS: None
2) Changes in accounting principles due to reasons other than 1): None
3) Changes in accounting estimates: Yes
(3) Number of issued shares outstanding at the end of the periods (ordinary shares)
Number of issued shares including treasury shares
Number of treasury shares
Notice regarding execution of quarterly review procedures
Explanation regarding the appropriate use of forecast of operating results and other special items
Adoption of International Financial Reporting Standards (IFRS)
This quarterly financial results report is exempt from quarterly review based on the Financial Instruments and
Exchange Law of Japan. At the time of disclosure of this report, quarterly review procedures for the quarterly financial
statements are in progress.
Forward-looking statements such as earnings forecasts and other projections contained in this release are based on
information available at the time of disclosure and assumptions that management believes to be reasonable, and do
not constitute guarantees of future performance. Actual results may differ materially from expectations due to various
factors.
Please refer to "1. Qualitative Information on Financial Results for the Three Months Ended March 31, 2016 - (3)
Description of Information on Outlook, including Forecasts of Consolidated Results" for the suppositions that form the
assumptions for earnings forecasts and cautions concerning the use of earnings forecasts.
The Group has adopted International Financial Reporting Standards (IFRS) from the first quarter of the fiscal year
ending December 31, 2016. Presentation of figures in the consolidated financial statements for the period of the
previous year also conforms to IFRS.
For differences between IFRS and Japanese GAAP in the financial statements, see the Investor Relations section of the
Company’s website, where information on first-time adoption of IFRS is scheduled to be presented.
183,000
120,000
239.23
710,000
65,000
65,000
38,000
75.76
June 30, 2016 December 31, 2016
The figures for the results of the fiscal year ended December 31, 2015 used for the growth rate
compared with the previous fiscal year and the same period a year earlier are final figures that conform
to International Financial Reporting Standards (IFRS).
Because the actual IFRS figures used in the Business Results for the Fiscal Year Ended December 31,
2015 were estimates, growth rates have changed.
For details, please refer to "2. Items Related to Summary Information (Notes), (2) Changes in accounting
principles and changes in accounting estimates"
Changes in significant subsidiaries during the period (changes in specified subsidiaries resulting in change in scope
of consolidation): None
501,198,858 shares501,557,747 shares
2,541,816 shares 2,397,174 shares
March 31, 2016 March 31, 2015
March 31, 2016 December 31, 2015
1,510,000
184,000
Three months ended Three months ended
504,000,000 shares504,000,000 shares
Forecast of consolidated operating results for the year ending December 31, 2016
Weighted average number of shares outstanding
during the period
Six months ending Year ending
1
Three Months Ended March 31, 2016
1. Qualitative Information on Financial Results for the Three Months Ended March 31,
2016
(1) Description of Operating Results
The Kao Group has adopted International Financial Reporting Standards (IFRS) from the first quarter of
2016 (January 1, 2016 to March 31, 2016). In addition, financial figures for the previous first quarter and the
previous fiscal year have been restated using IFRS for comparative analysis.
(Billions of yen, except per share amounts)
Three months ended March 31 2016 2015 Growth
Net sales 335.1 329.5 1.7%
Operating income 34.4 22.7 51.5%
Income before income taxes 32.9 23.4 40.5%
Net income 21.0 12.1 74.1%
Net income, attributable to owners of the parent 20.8 12.0 73.1%
Basic earnings per share (Yen) 41.47 23.98 72.9%
During the three months ended March 31, 2016, the global economy recovered moderately, although
weakness was apparent in some emerging countries in Asia. The Japanese economy continued on a
moderate recovery track, although weakness has also become apparent recently. The household and
personal care products market in Japan, a key market for the Kao Group, grew by 3% on a value basis and
consumer purchase prices increased compared with the same period a year earlier. The cosmetics market in
Japan grew by 2%, excluding inbound demand (demand from visitors to Japan).
Under these circumstances, the Kao Group worked to launch and nurture products with high added value in
response to changes in consumer needs based on its concept of “Yoki-Monozukuri,”* which emphasizes
research and development geared to customers and consumers. The Kao Group also conducted cost
reduction activities and other measures.
* The Kao Group defines Yoki-Monozukuri as a strong commitment by all members to provide products and
brands of excellent value for consumer satisfaction. In Japanese, Yoki literally means “good/excellent,”
and Monozukuri means “development/manufacturing of products.”
Net sales increased 1.7% compared with the same period a year earlier to 335.1 billion yen. Excluding the
effect of currency translation, net sales would have increased 4.3%. In the Consumer Products Business,
sales increased in Japan due to factors including market growth, launches of new and improved products,
and further enhancement of sales promotion activities. Outside Japan, sales growth in Asia continued from
the previous year. In the Chemical Business, sales decreased with the impact of a decline in demand in some
customer industries.
As for profits, due to the effect of increased sales in the Consumer Products Business in Japan and Asia, a
decrease in the cost of petrochemical raw materials and other factors, operating income was 34.4 billion yen,

2
Three Months Ended March 31, 2016
an increase of 11.7 billion yen compared with the same period a year earlier, and income before income
taxes was 32.9 billion yen, an increase of 9.5 billion yen compared with the same period a year earlier. Net
income was 21.0 billion yen, an increase of 9.0 billion yen compared with the same period a year earlier.
The main exchange rates used for translating the financial statement items (income and expenses) of
foreign consolidated subsidiaries and affiliates were as shown below.
First quarter Jan. – Mar.
Yen/U.S. dollar 115.31 (119.15)
Yen/Euro 127.15 (134.43)
Yen/Chinese yuan 17.63 (19.11)
Note: Figures in parentheses represent the exchange rates for the same period a year earlier.
(Remainder of page intentionally left blank.)

3
Three Months Ended March 31, 2016
Summary of Segment Information
Consolidated Results by Segment
Consolidated Net Sales Composition
(Billions of yen)
Three months ended
March 31
Like-
for-like*
Beauty Care 138.4 134.2 3.1 5.2 6.8 (0.5) 7.3 4.9
Human Health Care 67.1 65.4 2.6 5.8 8.5 6.8 1.7 12.6
Fabric and Home Care 71.0 67.9 4.5 6.3 12.9 10.1 2.8 18.2
Total Consumer Products 276.6 267.5 3.4 5.6 28.2 16.4 11.8 10.2
Chemical 66.8 70.8 (5.7) (1.8) 6.5 6.6 (0.0) 9.8
Total 343.3 338.4 1.5 4.1 34.7 22.9 11.7 10.1
Reconciliations (8.2) (8.8) - - (0.2) (0.2) (0.0) -
Consolidated 335.1 329.5 1.7 4.3 34.4 22.7 11.7 10.3
Note:
Like-for-like growth rates exclude the currency translation effect related to translation of local currencies into
Japanese yen.
*
Net sales
Growth %
Change2016 2015 2016 2015
Operating income
% of
net
sales
(Billions of yen)
Three months ended
March 31
Like-for-like*
Beauty Care 94.0 88.3 6.4 6.4
Human Health Care 50.0 50.7 (1.3) (1.3)
Fabric and Home Care 59.8 56.6 5.6 5.6
Total Japan 203.8 195.6 4.2 4.2
Asia 48.4 44.3 9.2 19.3
Americas 20.3 21.6 (6.2) (2.3)
Europe 20.0 20.1 (0.7) 5.0
Eliminations (15.8) (14.1) - -
Total Consumer Products 276.6 267.5 3.4 5.6
Japan 29.5 31.0 (4.6) (4.6)
Asia 24.0 27.2 (11.6) (4.0)
Americas 11.4 12.4 (7.5) 0.8
Europe 15.2 16.6 (8.3) (3.1)
Eliminations (13.4) (16.3) - -
Total Chemical 66.8 70.8 (5.7) (1.8)
Total 343.3 338.4 1.5 4.1
Reconciliations (8.2) (8.8) - -
Consolidated 335.1 329.5 1.7 4.3
Note:
*
Net sales
Growth %2016 2015
Like-for-like growth rates exclude the currency translation effect related to translation of local currencies into
Japanese yen.

4
Three Months Ended March 31, 2016
Reference: Consolidated Results by Geographic Area1
Net sales to foreign customers were 37.3% of net sales compared with 38.3% for the same period a year
earlier.
Consumer Products Business
Sales increased 3.4% compared with the same period a year earlier to 276.6 billion yen. Excluding the effect
of currency translation, sales would have increased 5.6%.
In Japan, sales increased 4.2% to 203.8 billion yen. The Kao Group made efforts that included responding
to changing consumer lifestyles and social issues such as the environment, health, the aging society and
hygiene, launching numerous high-value-added products and enhancing proposal-oriented sales activities.
In Asia, sales increased 9.2% to 48.4 billion yen. Excluding the effect of currency translation, sales would
have increased 19.3%. Growth continued as the Kao Group worked in areas such as launching and nurturing
products targeting the middle-class consumer segment, collaborating with retailers, utilizing wholesale
channels and expanding sales regions.
In the Americas, sales decreased 6.2% to 20.3 billion yen. Excluding the effect of currency translation, sales
would have decreased 2.3%. Although sales of skin care products and professional hair care products grew,
sales of hair care products decreased compared with the same period a year earlier.
In Europe, sales decreased 0.7% to 20.0 billion yen. Excluding the effect of currency translation, sales would
have increased 5.0%. Sales of hair care products grew.
Operating income increased 11.8 billion yen compared with the same period a year earlier to 28.2 billion yen
due to the effect of increased sales in the Beauty Care Business and the Fabric and Home Care Business in
(Billions of yen)
Three months ended
March 31
Like-
for-like2
Japan 226.1 219.2 3.1 3.1 21.7 13.4 8.4 9.6
Asia 71.7 70.5 1.6 10.8 9.0 7.0 1.9 12.5
Americas 31.7 33.9 (6.6) (1.2) 0.3 0.2 0.1 1.0
Europe 35.1 36.6 (4.1) 1.4 2.4 2.2 0.2 6.9
Total 364.6 360.3 1.2 4.1 33.4 22.8 10.7 9.2
Reconciliations (29.5) (30.8) - - 1.0 (0.0) 1.1 -
Consolidated 335.1 329.5 1.7 4.3 34.4 22.7 11.7 10.3
Notes:
Information on consolidated results by geographic area is for reference.1.
2. Like-for-like growth rates exclude the currency translation effect related to translation of local currencies into
Japanese yen.
Operating incomeNet sales
Growth %
2016 2015 2016 2015 Change
% of
net
sales

5
Three Months Ended March 31, 2016
Japan, as well as the Consumer Products Business in Asia.
Note: The Kao Group’s Consumer Products Business consists of the Beauty Care Business, the Human
Health Care Business, and the Fabric and Home Care Business.
Beauty Care Business
Sales increased 3.1% compared with the same period a year earlier to 138.4 billion yen. Excluding the effect
of currency translation, sales would have increased 5.2%.
Sales of cosmetics increased 5.9% compared with the same period a year earlier to 56.1 billion yen.
Excluding the effect of currency translation, sales would have increased 7.3%. In Japan, sales increased due
to factors including good performance by new products launched in the previous year and enhanced in-store
sales promotion activities. Among counseling cosmetics, the ALBLANC skin brightening brand, which was
renewed in the previous year, performed well, while sales of self-selection cosmetics KATE TOKYO makeup
and ALLIE sunscreen grew. Outside Japan, sales increased excluding the effect of currency translation, due
in part to strong performance in China and elsewhere in Asia.
Sales of skin care products increased compared with the same period a year earlier. In Japan, sales
increased due to growth in sales of Bioré facial cleanser, which was improved in February 2016, and Curél
derma care products. In Asia, sales grew. In the Americas, sales grew as Bioré sold well.
Sales of hair care products decreased compared with the same period a year earlier. In Japan, new
easy-to-use, environmentally conscious refill products for shampoos and conditioners steadily increased
market share by gaining consumer support, among other factors, but overall sales of hair care products
including hair coloring products decreased. In Asia and the Americas, sales decreased due to factors
including intensifying competition. In Europe, sales increased, with solid sales of John Frieda.
Operating income increased 7.3 billion yen compared with the same period a year earlier to 6.8 billion yen,
due to the effect of increased sales in Japan, more efficient use of expenses and other factors.
Human Health Care Business
Sales increased 2.6% compared with the same period a year earlier to 67.1 billion yen. Excluding the effect
of currency translation, sales would have increased 5.8%.
Sales of food and beverage products decreased compared with the same period a year earlier, although signs
of recovery became apparent for the Healthya brand of functional drinks that promote body fat utilization as
the Kao Group strengthened its promotion of the function of highly concentrated tea catechins.
Sales of sanitary products increased compared with the same period a year earlier. Sales of the Laurier
brand of sanitary napkins increased in Japan with growth in the market share of high-value-added products
such as Laurier F, which wicks moisture away to be gentle on the skin, and Laurier Slim Guard, which offers

6
Three Months Ended March 31, 2016
both high absorbency and comfort. Laurier sales also increased in Asia with good performance by
high-value-added products. Sales of Merries baby diapers grew steadily. In Japan, the Kao Group took
measures including a continuing increase in production and on-shelf inventory levels in stores began to
return to normal. In China, sales of imports from Japan grew substantially, continuing from last year. In
Indonesia, sales of locally produced products targeting the middle-class consumer segment grew steadily.
Sales of personal health products increased compared with the same period a year earlier. Sales of oral care
products increased compared with the same period a year earlier, with good performance by improved Pure
Oral toothpaste, which was improved in the previous year. Sales of bath additives increased compared with
the same period a year earlier. Sales of MegRhythm steam thermo sheets increased substantially, mainly for
MegRhythm Steam Eye Masks.
Operating income increased 1.7 billion yen compared with the same period a year earlier to 8.5 billion yen,
mainly due to the effect of increased sales in Asia.
Fabric and Home Care Business
Sales increased 4.5% compared with the same period a year earlier to 71.0 billion yen. Excluding the effect
of currency translation, sales would have increased 6.3%.
Sales of fabric care products increased compared with the same period a year earlier. In Japan, the Kao
Group improved Attack Neo Antibacterial EX W Power ultra-concentrated liquid laundry detergent in an
intensely competitive environment, and sales of laundry detergents increased compared with the same
period a year earlier. Sales and market share of fabric softeners both increased compared with the same
period a year earlier due to factors including the popularity of Humming Fine, which has a strong deodorizing
effect. In Asia, sales increased compared with the same period a year earlier. Sales of Attack laundry
detergent grew, with good performance in Indonesia by Attack Jaz1, a powder detergent for hand washing
targeting the middle-class consumer segment.
Sales of home care products increased compared with the same period a year earlier. In Japan, CuCute
dishwashing detergent continued its strong sales from last year. Sales of Magiclean household cleaners for
the bath, toilet, kitchen and other areas grew with value-added offerings such as deodorizing, disinfecting
and stainproofing.
Operating income increased 2.8 billion yen compared with the same period a year earlier to 12.9 billion yen
due to factors including the effect of increased sales and a decrease in the cost of raw materials.
Chemical Business
Sales decreased 5.7% compared with the same period a year earlier to 66.8 billion yen. Excluding the effect
of currency translation, sales would have decreased 1.8%.

7
Three Months Ended March 31, 2016
The Kao Group was impacted by a trend toward a decrease in demand in some customer industries in Japan.
Outside Japan, conditions also remained severe.
Sales of oleo chemicals increased as the Kao Group worked to adjust selling prices in line with the uptrend
in raw material prices of natural fats and oils. In performance chemicals, the Kao Group worked to develop
and expand sales of high-value-added products with a reduced environmental footprint, but was impacted
by worsening conditions in the construction materials and other markets. Sales of specialty chemicals
decreased compared with the same period a year earlier due to ongoing sluggish demand and structural
changes in the personal computer market.
Operating income remained almost flat compared with the same period a year earlier at 6.5 billion yen due
to the lower cost of petrochemical raw materials and cost reduction activities.
(Remainder of page intentionally left blank.)

8
Three Months Ended March 31, 2016
(2) Description of Financial Condition
Summary of Consolidated Financial Position
(Billions of yen)
March 31, 2016 December 31,
2015 Incr./(Dcr.)
Total assets 1,230.9 1,311.1 (80.1)
Total liabilities 554.8 619.1 (64.3)
Total equity 676.1 692.0 (15.8)
Ratio of equity attributable to owners of the parent to total assets
54.1% 51.9% -
Equity attributable to owners of the parent per share (Yen)
1,327.29 1,358.03 (30.74)
Total debt 120.5 120.5 (0.1)
Summary of Consolidated Cash Flows
(Billions of yen)
Three months ended March 31 2016 2015 Incr./(Dcr.)
Cash flows from operating activities (1.6) 0.0 (1.6)
Cash flows from investing activities (17.3) (14.6) (2.7)
Free cash flow* (18.9) (14.6) (4.3)
Cash flows from financing activities (20.4) 1.6 (22.0)
*Free cash flow is the sum of cash flows from operating activities and cash flows from investing activities.
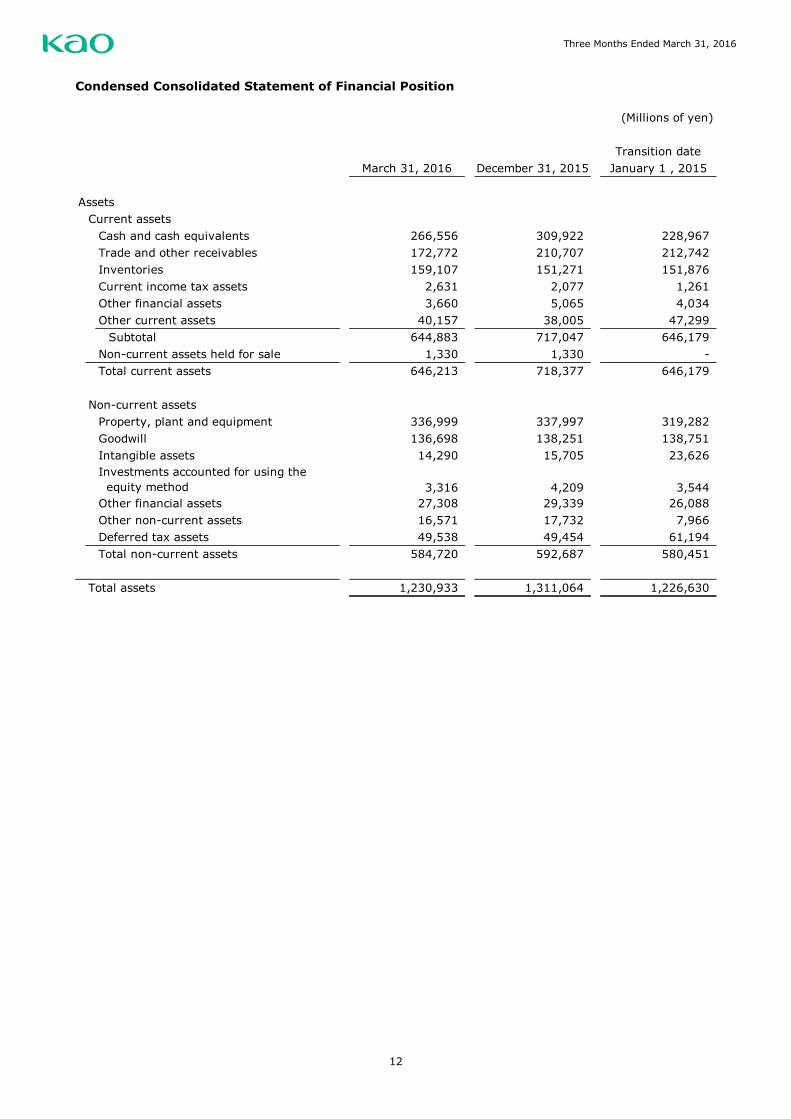
Total assets decreased 80.1 billion yen from December 31, 2015 to 1,230.9 billion yen. The principal
increase in assets was a 7.8 billion yen increase in inventories. The principal decreases in assets were a 43.4
billion yen decrease in cash and cash equivalents and a 37.9 billion yen decrease in trade and other
receivables.
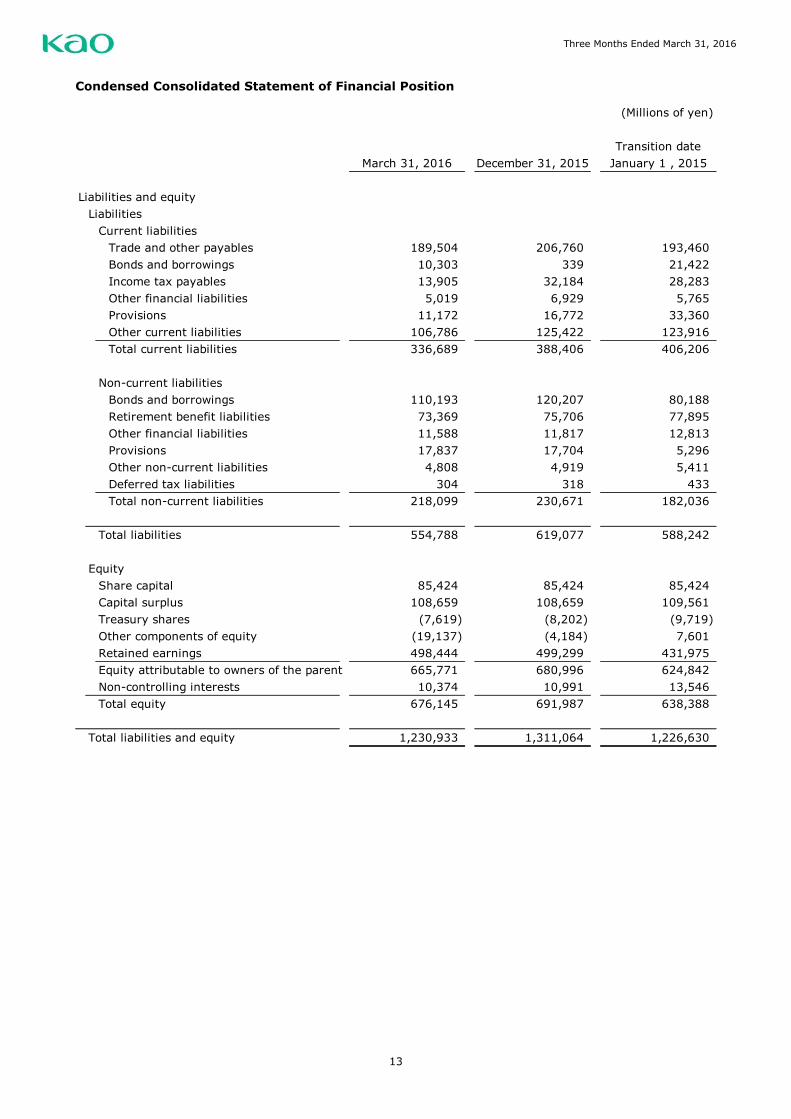
Total liabilities decreased 64.3 billion yen from December 31, 2015 to 554.8 billion yen. The principal
decreases in liabilities were a 17.3 billion yen decrease in trade and other payables, an 18.3 billion yen
decrease in income taxes payable and an 18.6 billion yen decrease in other current liabilities.
Total equity decreased 15.8 billion yen from December 31, 2015 to 676.1 billion yen. The principal increase
in equity was net income totaling 21.0 billion yen. The principal decreases in equity were exchange
differences on translation of foreign operations of 13.8 billion yen and dividends totaling 21.8 billion yen.
As a result of the above factors, the ratio of equity attributable to owners of the parent to total assets was
54.1% compared with 51.9% at December 31, 2015.
Cash flows from operating activities totaled negative 1.6 billion yen. The principal increases in net cash were
income before income taxes of 32.9 billion yen, depreciation and amortization of 13.9 billion yen and change
in trade and other receivables of 32.4 billion yen. The principal decreases in net cash were change in
inventories of 11.4 billion yen, change in trade and other payables of 12.7 billion yen, other, net, which
includes accrued expenses, of 26.4 billion yen and income taxes paid of 30.3 billion yen.

9
Three Months Ended March 31, 2016
Cash flows from investing activities totaled negative 17.3 billion yen. This primarily consisted of purchase of
property, plant and equipment of 18.4 billion yen.
Free cash flow, the sum of cash flows from operating activities and cash flows from investing activities, was
negative 18.9 billion yen.
Cash flows from financing activities totaled negative 20.4 billion yen. This primarily consisted of 20.4 billion
yen for dividends paid to owners of the parent and non-controlling interests.
The balance of cash and cash equivalents at March 31, 2016 decreased 43.4 billion yen compared with
December 31, 2015 to 266.6 billion yen.
(Remainder of page intentionally left blank.)

10
Three Months Ended March 31, 2016
(3) Description of Information on Outlook, Including Forecasts of Consolidated Results
A continuing moderate recovery of the global economy is expected, although there are concerns about the
risk of a downturn due to factors including the impact of moves to normalize monetary policy in the United
States and Europe, the economic outlook for China and other emerging nations, and the effects of crude oil
and other prices and foreign exchange fluctuations. In Japan, the economy is expected to recover
moderately, underpinned by the effects of economic measures, but there is a possibility of impact from an
economic downturn overseas. Moreover, the outlook for the operating environment remains unclear,
including market conditions for raw materials and trends in exchange rates.
Amid these circumstances, the Kao Group will promote “Yoki-Monozukuri,” which emphasizes research and
development geared to customers and consumers, and aim for sustained “profitable growth” through the
development of high-value-added products. In addition, the Kao Group aims to become a company with a
global presence as it also works for “contributions to the sustainability of the world” by offering proposals to
resolve social issues and conducting social contribution activities through its business activities.
With regard to operating structure, through the global management integration of the Consumer Products
Business, the Kao Group is strengthening its matrix management of business units and functional divisions,
and promoting reformation of its profit structure from a perspective of what is best for the Group as a whole.
In the Chemical Business, the Kao Group’s efforts will include developing high-value-added products that are
not affected by fluctuations in the cost of raw materials and enhancing its eco-chemicals with a reduced
environmental footprint.
Fiscal 2016 has been positioned as a year of preparation for continuing growth toward the next mid-term
plan. Through these activities, the Kao Group intends to achieve its results forecast.
The forecasts of consolidated results for the six months ending June 30, 2016 and the fiscal year ending
December 31, 2016 remain the same as announced on February 3, 2016.
The main exchange rates used in the forecast of consolidated results are 115 yen per U.S. dollar, 126 yen
per euro and 17.2 yen per Chinese yuan.

11
Three Months Ended March 31, 2016
2. Items Related to Summary Information (Notes)
(1) Changes in material subsidiaries during this quarterly period: None
(2) Changes in accounting principles and changes in accounting estimates:
Change in useful lives of property, plant and equipment
In conducting proactive capital investment, mainly in machinery and equipment, the Kao Group recognizes
that the comparability of manufacturing costs for consideration on a global level of optimization of
production bases is one of the issues it must address from a management perspective.
Consequently, the Kao Group globally unified its fixed asset systems in January 2016. The Kao Group
decided to take advantage of this change to make the useful lives of machinery and equipment consistent
(generally 9 or 10 years depending on the type of equipment) as of the first quarter ended March 31, 2016
to better reflect the actual use of machinery and equipment in global production. The effect of this change
in accounting estimates on the consolidated financial statements is immaterial.
(Remainder of page intentionally left blank.)
12
Three Months Ended March 31, 2016
Condensed Consolidated Statement of Financial Position
(Millions of yen)
Transition date
March 31, 2016 December 31, 2015 January 1 , 2015
Assets
Current assets
Cash and cash equivalents 266,556 309,922 228,967
Trade and other receivables 172,772 210,707 212,742
Inventories 159,107 151,271 151,876
Current income tax assets 2,631 2,077 1,261
Other financial assets 3,660 5,065 4,034
Other current assets 40,157 38,005 47,299
Subtotal 644,883 717,047 646,179
Non-current assets held for sale 1,330 1,330 -
Total current assets 646,213 718,377 646,179
Non-current assets
Property, plant and equipment 336,999 337,997 319,282
Goodwill 136,698 138,251 138,751
Intangible assets 14,290 15,705 23,626
3,316 4,209 3,544
Other financial assets 27,308 29,339 26,088
Other non-current assets 16,571 17,732 7,966
Deferred tax assets 49,538 49,454 61,194
Total non-current assets 584,720 592,687 580,451
Total assets 1,230,933 1,311,064 1,226,630
Investments accounted for using the
equity method
13
Three Months Ended March 31, 2016
Condensed Consolidated Statement of Financial Position
(Millions of yen)
Transition date
March 31, 2016 December 31, 2015 January 1 , 2015
Liabilities and equity
Liabilities
Current liabilities
Trade and other payables 189,504 206,760 193,460
Bonds and borrowings 10,303 339 21,422
Income tax payables 13,905 32,184 28,283
Other financial liabilities 5,019 6,929 5,765
Provisions 11,172 16,772 33,360
Other current liabilities 106,786 125,422 123,916
Total current liabilities 336,689 388,406 406,206
Non-current liabilities
Bonds and borrowings 110,193 120,207 80,188
Retirement benefit liabilities 73,369 75,706 77,895
Other financial liabilities 11,588 11,817 12,813
Provisions 17,837 17,704 5,296
Other non-current liabilities 4,808 4,919 5,411
Deferred tax liabilities 304 318 433
Total non-current liabilities 218,099 230,671 182,036
Total liabilities 554,788 619,077 588,242
Equity
Share capital 85,424 85,424 85,424
Capital surplus 108,659 108,659 109,561
Treasury shares (7,619) (8,202) (9,719)
Other components of equity (19,137) (4,184) 7,601
Retained earnings 498,444 499,299 431,975
Equity attributable to owners of the parent 665,771 680,996 624,842
Non-controlling interests 10,374 10,991 13,546
Total equity 676,145 691,987 638,388
Total liabilities and equity 1,230,933 1,311,064 1,226,630

14
Three Months Ended March 31, 2016
Condensed Consolidated Statement of Income
(Millions of yen)
Three months ended Three months ended
March 31, 2016 March 31, 2015
Net sales 3 335,092 329,549
Cost of sales (150,348) (156,001)
Gross profit 184,744 173,548
Selling, general and administrative expenses 4 (150,552) (151,032)
Other operating income 2,914 3,212
Other operating expenses (2,657) (2,987)
Operating income 3 34,449 22,741
Financial income 362 822
Financial expenses (2,508) (605)
624 470
Income before income taxes 32,927 23,428
Income taxes (11,880) (11,342)
Net income 21,047 12,086
Attributable to:
Owners of the parent 20,801 12,020
Non-controlling interests 246 66
Net income 21,047 12,086
Earnings per share
Basic (Yen) 41.47 23.98
Diluted (Yen) 41.43 23.95
Notes
Share of profit in investments accounted for using the
equity method
15
Three Months Ended March 31, 2016
Condensed Consolidated Statement of Comprehensive Income
(Millions of yen)
Three months ended Three months ended
March 31, 2016 March 31, 2015
Net income 21,047 12,086
Other comprehensive income
Items that will not be reclassified to profit or loss:
(860) 1,193
Remeasurements of defined benefit plans (468) (374)
(162) 76
Total of items that will not be reclassified to profit or loss (1,490) 895
Items that may be reclassified subsequently to profit or loss:
Exchange differences on translation of foreign operations (13,896) (7,776)
Net gain (loss) on derivatives designated as cash flow hedges - 12
(13) (13)
(13,909) (7,777)
Other comprehensive income, net of taxes (15,399) (6,882)
Comprehensive income 5,648 5,204
Attributable to:
Owners of the parent 5,524 5,614
Non-controlling interests 124 (410)
Comprehensive income 5,648 5,204
Net gain (loss) on revaluation of financial assets measured
at fair value through other comprehensive income
Share of other comprehensive income of investments
accounted for using the equity method
Share of other comprehensive income of investments
accounted for using the equity method
Total of items that may be reclassified subsequently to
profit or loss

16
Three Months Ended March 31, 2016
Condensed Consolidated Statement of Changes in Equity
(Millions of yen)
Share
capital
Capital
surplus
Treasury
shares
Subscription
rights to
shares
Exchange
differences
on
translation
of foreign
operations
Net gain
(loss) on
derivatives
designated
as cash flow
hedges
Net gain
(loss) on
revaluation
of financial
assets
measured at
fair value
through
other
compre-
hensive
income
Remeasur-
ements of
defined
benefit plans
Total
January 1, 2016 85,424 108,659 (8,202) 902 (13,513) (3) 8,430 - (4,184) 499,299 680,996 10,991 691,987
Net income - - - - - - - - - 20,801 20,801 246 21,047
Other comprehensive income - - - - (13,783) (4) (1,022) (468) (15,277) - (15,277) (122) (15,399)
Comprehensive income - - - - (13,783) (4) (1,022) (468) (15,277) 20,801 5,524 124 5,648
Disposal of treasury shares - - 587 (65) - - - - (65) (206) 316 - 316
Purchase of treasury shares - - (4) - - - - - - - (4) - (4)
Dividends - - - - - - - - - (21,061) (21,061) (710) (21,771)
- - - - - - (79) 468 389 (389) - - -
Other increase (decrease) - - - - - - - - - - - (31) (31)
Total transactions with the owners - - 583 (65) - - (79) 468 324 (21,656) (20,749) (741) (21,490)
March 31, 2016 85,424 108,659 (7,619) 837 (27,296) (7) 7,329 - (19,137) 498,444 665,771 10,374 676,145
January 1, 2015 85,424 109,561 (9,719) 980 - (4) 6,625 - 7,601 431,975 624,842 13,546 638,388
Net income - - - - - - - - - 12,020 12,020 66 12,086
Other comprehensive income - - - - (7,299) (2) 1,270 (375) (6,406) - (6,406) (476) (6,882)
Comprehensive income - - - - (7,299) (2) 1,270 (375) (6,406) 12,020 5,614 (410) 5,204
Disposal of treasury shares - - 812 (100) - - - - (100) (163) 549 - 549
Purchase of treasury shares - - (14) - - - - - - - (14) - (14)
Dividends - - - - - - - - - (18,039) (18,039) (931) (18,970)
- (902) - - - - - - - - (902) (334) (1,236)
- - - - - - (7) 375 368 (368) - - -
Other increase (decrease) - - - - - - - - - - - (31) (31)
Total transactions with the owners - (902) 798 (100) - - (7) 375 268 (18,570) (18,406) (1,296) (19,702)
March 31, 2015 85,424 108,659 (8,921) 880 (7,299) (6) 7,888 - 1,463 425,425 612,050 11,840 623,890
Total equity
Equity attributable to owners of the parent
Other components of equity
Non-
controlling
interestsRetained
earningsTotal
Transfer from other components
of equity to retained earnings
Changes in the ownership
interest in a subsidiary
Transfer from other components
of equity to retained earnings

17
Three Months Ended March 31, 2016
Condensed Consolidated Statement of Cash Flows
(Millions of yen)
Three months ended Three months ended
March 31, 2016 March 31, 2015
Cash flows from operating activities
Income before income taxes 32,927 23,428
Depreciation and amortization 13,950 13,691
Interest and dividend income (287) (242)
Interest expense 432 350
(624) (470)
619 563
(Increase) decrease in trade and other receivables 32,398 35,308
(Increase) decrease in inventories (11,395) (6,771)
Increase (decrease) in trade and other payables (12,652) (13,648)
Increase (decrease) in retirement benefit liabilities (1,560) (645)
Other (26,371) (23,007)
Subtotal 27,437 28,557
Interest received 295 246
Dividends received 1,387 1,052
Interest paid (382) (404)
Income taxes paid (30,300) (29,436)
Net cash flows from operating activities (1,563) 15
Cash flows from investing activities
Proceeds from withdrawal of time deposits 1,502 336
Purchase of property, plant and equipment (18,430) (13,773)
Purchase of intangible assets (773) (1,336)
Other 369 126
Net cash flows from investing activities (17,332) (14,647)
Cash flows from financing activities
Increase (decrease) in short-term borrowings (32) 266
Proceeds from long-term borrowings 0 40,000
Repayments of long-term borrowings (19) (20,015)
Dividends paid to owners of the parent (19,721) (16,818)
Dividends paid to non-controlling interests (701) (892)
Other 83 (946)
Net cash flows from financing activities (20,390) 1,595
Net increase (decrease) in cash and cash equivalents (39,285) (13,037)
Cash and cash equivalents at the beginning of the period 309,922 228,967
Effect of exchange rate changes on cash and cash equivalents (4,081) (2,530)
Cash and cash equivalents at the end of the period 266,556 213,400
Share of profit in investments accounted for using the equity
method
(Gains) losses on sale and disposal of property, plant and
equipment, intangible assets

18
Three Months Ended March 31, 2016
Notes to Consolidated Financial Statements
1. Significant Accounting Policies
The accounting policies of Kao Corporation (herein after, the “Company”) and its subsidiaries (hereinafter,
collectively, the “Group”) have been prepared in accordance with the mandatory provisions of IFRS which
are required to be adopted as of March 31, 2016, except for exemptions and mandatory exceptions
recognized in the provisions of IFRS 1 First-time Adoption of International Financial Reporting Standards
(hereinafter, “IFRS 1”) and IFRS 9 Financial Instruments (issued in November 2009, revised in July 2014)
(hereinafter, IFRS 9), which the Group has early adopted.
Significant accounting policies are applied consistently for all periods presented in these quarterly financial
statements (including the consolidated statement of financial position on the transition date), except as
otherwise provided.
(1) Basis of Consolidation
1) Subsidiaries
Subsidiaries refer to all business entities controlled by the Company. The Company controls an entity
when it has exposure, or rights, to variable returns from involvement with an investee and has the
ability to affect those returns through its power over the investee.
The financial statements of subsidiaries are included in the consolidated financial statements of the
Company from the date the Company gains control until the date it ceases to control the subsidiary.
All intergroup balances, transactions, income and expenses and unrealized gains and losses arising
from transactions are eliminated in preparing the consolidated financial statements.
A change in the Company’s ownership interest in a subsidiary, without a loss of control, is accounted
for as an equity transaction. Any difference between the amount by which the non-controlling
interests are adjusted and the fair value of the consideration paid or received is recognized directly
in equity attributable to the Group.
Non-controlling interests in subsidiaries are identified separately from the Group’s equity therein.
Comprehensive income of subsidiaries is attributed to owners of the parent company and to the
non-controlling interests even if this results in the non-controlling interests having a deficit balance.
All subsidiaries have the same fiscal year end as the Company.
2) Associates
An associate is defined as an entity over which the Company has significant influence on financial
and operating policy decisions but does not have control over those policies. The Company is
presumed to have significant influence over another entity when it directly or indirectly holds at least
20% but less than 50% of the voting rights of that entity. Entities over which the Company is able to
exercise significant influence on financial and operating policy decisions are also included in

19
Three Months Ended March 31, 2016
associates, even if it holds less than 20% of voting rights.
Investments in associates are initially recognized at cost, and are accounted for by the equity
method from the date the Company gains significant influence until the date it loses that influence.
Goodwill recognized on acquisition (less any accumulated impairment losses) is included in
investments in associates.
The fiscal year-end dates of some associates differ from that of the Company. Associates with
different fiscal year-end dates prepare additional financial information as of the reporting date of the
Company.
(2) Business Combinations
Business combinations are accounted for using the acquisition method. The cost of an acquisition is
measured as the aggregate of the acquisitiondate fair value of the assets transferred, liabilities
assumed and equity instruments issued by the Company to the former owners of the acquiree in
exchange for control of the acquiree.
Identifiable assets and liabilities of the acquiree in business combinations are measured at their
acquisitiondate fair value, with the following exceptions:
• Deferred tax assets or liabilities and assets or liabilities related to employee benefit arrangements
are recognized and measured in accordance with IAS 12 Income Taxes and IAS 19 Employee
Benefits.
• Non-current assets and disposal groups that are classified as held for sale in accordance with IFRS
5 Non-current Assets Held for Sale and Discontinued Operations are measured in accordance with
that Standard.
• Liabilities or equity instruments related to share-based payment transactions of the acquiree or
share-based payment transactions of the Company entered into to replace such transactions of the
acquiree are measured in accordance with IFRS 2 Share-based Payment.
Any excess of the consideration transferred over the net fair value of identifiable assets acquired and
liabilities assumed at the acquisition date is recognized as goodwill in the consolidated statement of
financial position. Conversely, any deficit is immediately recognized as income in the consolidated
statement of income.
Costs associated with business combinations, such as advisory fees, attorney fees and due diligence
costs, are expensed as incurred.
The additional acquisition of non-controlling interests is accounted for as a capital transaction, and
therefore no goodwill is recognized with respect to such a transaction.
Business combinations under common control are business combinations in which all of the combining
entities or combining businesses are ultimately controlled by the same party or parties both before and

20
Three Months Ended March 31, 2016
after the business combination, and that control is not transitory. These business combinations are
accounted for based on the carrying amounts.
(3) Foreign Currency Translation
1) Functional currency and reporting currency
The reporting currency used in the Group’s consolidated financial statements is Japanese yen, which
is the Company’s functional currency. Subsidiaries and associates in the Group determine their own
functional currencies and each company’s transactions are measured in its functional currency.
2) Foreign currency transactions
Foreign currency transactions are translated into the functional currency at the spot exchange rate
at the date of the transaction, or an exchange rate that approximates the spot rate.
At the end of each reporting period, foreign currency monetary items are translated into the
functional currency using the closing rate. Non-monetary items that are measured in terms of
historical cost in a foreign currency are translated using the exchange rate at the date of the
transaction. Non-monetary items that are measured at fair value in a foreign currency are
translated into the functional currency using the exchange rates at the date when the fair value was
measured. Exchange differences arising from such translations and settlements are recognized in
profit or loss. However, exchange differences arising from financial assets measured at fair value
through other comprehensive income and cash flow hedges are recognized in other comprehensive
income.
3) Financial statements of foreign operations
Assets and liabilities of foreign operations are translated at the closing rates. Income and expenses
are translated at the average exchange rates for the period, provided that there were no significant
changes in the exchange rates during the period. Exchange differences arising from translation of
the financial statements of foreign operations are recognized in other comprehensive income. On the
disposal of a foreign operation, the cumulative amount of exchange differences relating to that
foreign operation is reclassified from equity to profit or loss when the gain or loss on disposal is
recognized.
(4) Financial Instruments
The Group has early adopted IFRS 9 effective from the IFRS transition date.
1) Financial assets
(i) Initial recognition and measurement
The Group initially recognizes trade and other receivables on the date they are originated. Other
financial assets are initially recognized on the transaction date when the Group becomes a party
to the contractual provisions of the financial instrument.
At initial recognition, all financial assets are measured at fair value, but those that are not
classified as financial assets measured at fair value through profit or loss are measured at fair
value plus transaction costs directly attributable to acquisition of the financial asset. Transaction
21
Three Months Ended March 31, 2016
costs of financial assets measured at fair value through profit or loss are recognized in profit or
loss.
(ii) Classification and subsequent measurement
The Group classifies the financial assets it holds as (a) financial assets measured at amortized
cost; (b) debt instruments measured at fair value through other comprehensive income; (c)
equity instruments measured at fair value through other comprehensive income; or (d)
financial assets measured at fair value through profit or loss. This classification is determined at
initial recognition, and measurement of financial assets after initial recognition is performed as
follows according to the classification of the financial asset.
(a) Financial assets measured at amortized cost
Financial assets held by the Group are measured at amortized cost if both of the following
conditions are met:
• The financial asset is held in a business model whose objective is to hold financial assets
in order to collect contractual cash flows; and
• The contractual terms of the financial asset give rise on specified dates to cash flows
that are solely payments of principal and interest on the principal amount outstanding.
After initial recognition, the carrying amounts of financial assets measured at amortized
cost are recognized using the effective interest method less impairment loss, if any.
Amortization using the effective interest method and gains and losses on derecognition
are recognized in profit or loss for the period.
(b) Debt instruments measured at fair value through other comprehensive income
Financial assets held by the Group are classified as debt instruments measured at fair
value through other comprehensive income if both of the following conditions are met:
• The financial asset is held within a business model whose objective is achieved by both
collecting contractual cash flows and selling the financial asset; and
• The contractual terms of the financial asset give rise on specified dates to cash flows
that are solely payments of principal and interest on the principal amount outstanding.
(c) Equity instruments measured at fair value through other comprehensive income
The Group has made an irrevocable election to disclose changes in fair value of certain
equity instruments in other comprehensive income, and classifies them in equity
instruments measured at fair value through other comprehensive income.
These financial assets are measured at fair value after initial recognition, and changes in
fair value are included in other comprehensive income. If the Group disposes of an
investment, or if the fair value of the investment declines significantly, the cumulative gain
or loss recognized in other comprehensive income is reclassified from other components of
equity to retained earnings.
Dividends from financial assets measured at fair value through other comprehensive

22
Three Months Ended March 31, 2016
income are recognized as financial income in profit or loss.
(d) Financial assets measured at fair value through profit or loss
Financial assets that are not classified as financial assets measured at amortized cost, debt
instruments measured at fair value through other comprehensive income, or equity
instruments measured at fair value through other comprehensive income are classified as
financial assets measured at fair value through profit or loss. The Group’s financial assets
that are measured at fair value through profit or loss include short-term investments and
derivative assets. The Group has not irrevocably designated any financial assets as
measured at fair value through profit or loss.
These financial assets are measured at fair value after initial recognition, and changes in
their fair value are recognized in profit or loss. Gains and losses on financial assets
measured at fair value through profit or loss are recognized in profit or loss.
(iii) Impairment of financial assets
With respect to impairment of financial assets measured at amortized cost, the Group
recognizes a loss allowance for expected credit losses on such financial assets.
At each reporting date, the Group assesses whether the credit risks on the financial assets have
increased significantly since initial recognition.
If credit risk on a financial asset has not increased significantly since initial recognition, the loss
allowance for that financial asset is measured at an amount equal to the 12-month expected
credit losses. If credit risk on a financial asset has increased significantly since initial recognition,
the loss allowance is measured in an amount equal to the lifetime expected credit losses.
However, the loss allowance on trade receivables is always measured in an amount equal to the
lifetime expected credit losses.
The expected credit losses of financial assets are estimated in a way that reflects the following:
• An unbiased and probability-weighted amount determined by evaluating a range of possible
outcomes
• The time value of money
• Reasonable and supportable information about past events, current conditions and forecasts
of economic conditions that is available without undue cost or effort at the reporting date
The amounts of these measurements are recognized in profit or loss.
If an event that reduces an impairment loss occurs after the impairment loss has been
recognized, the impairment loss will be reversed to the extent of the decrease and credited to
profit or loss.

23
Three Months Ended March 31, 2016
(iv) Derecognition of financial assets
The Group derecognizes financial assets only when the contractual rights to the cash flows from
the financial assets expire, or when the Group transfers financial assets and substantially all the
risks and rewards of ownership of the financial assets.
2) Financial liabilities
(i) Initial recognition and measurement
The Group initially recognizes bonds and borrowings at the date they are issued, and other
financial liabilities at the transaction date.
Upon initial recognition, all financial liabilities are measured at fair value. However, financial
liabilities measured at amortized value are measured in the full amount after deducting directly
attributable transaction costs from the fair value.
Transaction costs of financial liabilities measured at fair value through profit or loss are
recognized in profit or loss.
(ii) Classification and subsequent measurement
The Group classifies financial liabilities as either financial liabilities measured at fair value
through profit or loss, or financial liabilities measured at amortized cost. This classification is
determined at initial recognition. Measurement of financial liabilities after initial recognition is
performed as follows, according to the classification of the financial liability.
The Group’s financial liabilities measured at fair value through profit or loss are derivative
liabilities. The Group has not irrevocably designated any financial liabilities as measured at fair
value through profit or loss at initial recognition. Financial liabilities measured at fair value
through profit or loss are measured at fair value after initial recognition, and any changes in
their fair value are recognized in profit or loss for the period.
Financial liabilities measured at amortized cost are subsequently measured at amortized cost
using the effective interest method. Amortization using the effective interest method and gains
and losses on derecognition are recognized in profit or loss for the period.
(iii) Derecognition of financial liabilities
The Group derecognizes financial liabilities when they are extinguished (i.e., when the
obligation specified in the contract is discharged, cancelled or expired).
3) Offsetting of financial assets and financial liabilities
Financial assets and financial liabilities are offset and the net amount is presented in the
consolidated statement of financial position only when the Group currently has a legally enforceable
right to set off the recognized amount and intends either to settle on a net basis or realize the assets
and settle the liabilities simultaneously.
4) Fair value of financial instruments

24
Three Months Ended March 31, 2016
The Group recognizes the fair value of financial instruments using various valuation methodologies
and inputs. The fair values recognized based on the observability of inputs into the valuation
methodologies are grouped into the following three levels:
Level 1: Fair value measured with quoted prices in active markets for identical assets or liabilities
Level 2: Fair value measured with inputs other than quoted prices included within Level 1 that are
observable for the asset or liability, either directly or indirectly
Level 3: Fair value measured with unobservable inputs for the asset or liability
5) Hedge accounting
The Group uses interest rate swaps and other derivatives to hedge interest rate risk. At the inception
of a hedging relationship, the Group formally designates and documents the hedging relationship
and the interest rate risk management objective and strategy for undertaking the hedge. The
documentation includes identification of the hedging instrument, the hedged item, the nature of the
risk being hedged, and the methods of assessing whether the hedging relationship meets the hedge
effectiveness requirements. In addition, the Group assesses whether the hedging relationship meets
the hedge effectiveness requirements, both at the inception and on an ongoing basis. Ongoing
assessments are conducted either at each reporting date or upon a significant change in the
circumstances affecting the hedge effectiveness requirements, whichever comes first.
In accordance with the Group’s risk management policy, derivatives that meet the criteria for hedge
accounting with respect to interest rate risk are designated as cash flow hedges and accounted for
as follows.
Derivatives designated as hedging instruments in cash flow hedges are interest rate swaps to
convert floating-rate financial liabilities to fixed-rate financial liabilities. The effective portion of
changes in the fair values of derivatives designated as cash flow hedges are recognized in other
components of equity until the associated hedged transactions are executed and profit or loss is
recognized. Gains or losses on derivatives recognized in other components of equity are reclassified
into profit or loss at the time that the associated hedged transactions are recognized in profit or loss.
However, any ineffective portion of the change in fair value of the derivatives is recognized
immediately in profit or loss.
Hedge accounting is discontinued prospectively only when the hedging relationship ceases to meet
the qualifying criteria. This includes instances when the hedging instrument expires or is sold,
terminated or exercised.
The Group does not use fair value hedges or net investment hedges in foreign operations.
(5) Cash and Cash Equivalents
Cash and cash equivalents consist of cash on hand, demand deposits and short-term investments that
are readily convertible to known amounts of cash, subject to an insignificant risk of changes in value
and highly liquid, and that mature or become due within three months from the date of acquisition.
Cash and cash equivalents include certificates of deposit, time deposits, commercial paper, public and

25
Three Months Ended March 31, 2016
corporate bonds in investment trusts, and money in trust.
(6) Inventories
Inventories are measured at the lower of cost and net realizable value. Net realizable value is the
estimated selling price in the ordinary course of business less the estimated costs of completion and the
estimated costs necessary to make the sale. The cost of inventories includes all costs of purchase, costs
of conversion and other costs incurred in bringing the inventories to their present location and condition,
and are determined principally by the weighted average method.
(7) Property, Plant and Equipment
Property, plant and equipment are measured using the cost model and carried at cost less any
accumulated depreciation and any accumulated impairment losses.
The cost of an item of property, plant and equipment comprises any costs directly attributable to
acquisition of the asset and the initial estimate of the costs of dismantling and removing the item and
restoring the site on which it is located.
Depreciation of assets other than land and construction in progress is calculated on a straight-line basis
over the useful lives of the assets.
The useful lives of major asset items are as follows:
• Buildings and structures: 10 to 35 years
• Machinery and vehicles: 7 to 14 years
• Tools, furniture and fixtures: 3 to 10 years
The useful lives, residual values and depreciation method are reviewed at each fiscal year end, and any
revisions are applied prospectively as changes in accounting estimates.
The Group changed useful lives as of the first quarter ended March 31, 2016. For details, see “2. Items
Related to Summary Information (Notes) (2) Changes in accounting principles and changes in
accounting estimates” on page 7 of the attached materials to the quarterly business results.
(8) Goodwill and Intangible Assets
1) Goodwill
Goodwill is not amortized, and is carried at cost less any accumulated impairment losses.
Goodwill measurements at initial recognition are presented in Note 1 – Significant Accounting
Policies (2) Business Combinations.
2) Intangible assets
Intangible assets are measured using the cost model and carried at cost less any accumulated
amortization and any accumulated impairment losses.

26
Three Months Ended March 31, 2016
The costs of separately acquired intangible assets comprise any costs directly attributable to
acquisition of the assets.
The costs of intangible assets acquired in business combinations are measured at fair value at the
acquisition date.
Expenditures related to internally generated intangible assets are recognized as expenses when
incurred, with the exception of development expenses that meet the criteria for capitalization.
Software development expense only meets the criteria for capitalization.
After initial recognition, with the exception of intangible assets with indefinite useful lives, intangible
assets are amortized on a straight-line basis over their useful lives.
The Group has no intangible assets with indefinite useful lives. The useful lives of major intangible
assets are as follows:
• Trademarks: 10 years
• Software: 5 years
The useful lives, residual values and amortization method are reviewed at each fiscal year end, and
any revisions are applied prospectively as changes in accounting estimates.
3) Research and development expenses
Research expenditures are expensed as incurred. Development expenditures are capitalized only if
they can be measured reliably, future economic benefits are probable, and the Group intends to, and
has sufficient resources to, complete development and to use or sell the asset. If research
expenditures and development expenditures cannot be clearly distinguished, they are expensed as
incurred as research expenditures.
(9) Leases
The Group classifies a lease that transfers substantially all the risks and rewards incidental to ownership
of an asset as a finance lease and a lease other than a finance lease as an operating lease.
In finance lease transactions, leased assets and lease obligations are initially recognized at the lower of
the fair value of leased property and the present value of the minimum lease payments, each
determined at the inception of the lease.
Leased assets are depreciated on a straight-line basis over the shorter of their useful lives and lease
terms. Lease payments are apportioned between the finance charges and the reduction of the
outstanding liability using the interest method.
Lease payments under operating leases are recognized as an expense on a straight-line basis over the
lease term.
Determination of whether an arrangement is, or contains, a lease is based on the substance of the

27
Three Months Ended March 31, 2016
arrangement, in accordance with IFRIC Interpretation 4, Determining Whether an Arrangement
Contains a Lease.
(10) Investment Property
Investment property is property held to earn rentals or for capital appreciation or both.
Investment property is measured using the cost model and carried at cost less any accumulated
depreciation and any accumulated impairment losses.
(11) Impairment of Non-financial Assets
Non-financial assets, excluding inventories, deferred tax assets, non-current assets classified as held
for sale and assets arising from employee benefits, are assessed at the end of each reporting period to
determine whether there is any indication of impairment. If there is an indication of impairment, the
recoverable amount of the asset is estimated. For goodwill, the recoverable amount is estimated at
least once a year by each fiscal year end, irrespective of whether there is any indication of impairment.
The recoverable amount of an asset or a cash-generating unit is the higher of its value in use and fair
value less cost of disposal. The discount rate used in calculating the asset’s value in use is a pre-tax rate
that reflects current market assessments of the time value of money and the risks specific to the asset,
for which the future cash flow estimates have not been adjusted.
If it is not possible to estimate the recoverable amount of an individual asset, the recoverable amount
of the cash-generating unit to which the asset belongs is measured. Goodwill acquired in business
combinations is allocated to each of the cash-generating units or groups of cash-generating units of the
Group that is expected to benefit from synergies of the business combinations, and is tested for
impairment.
Because corporate assets do not generate separate cash inflows, the recoverable amount of individual
corporate assets cannot be measured unless management has decided to dispose of the asset. If there
is an indication that a corporate asset may be impaired, the recoverable amount of the cash-generating
unit or group of cash-generating units to which the asset belongs is measured and compared with the
carrying amount.
Impairment losses are recognized as loss whenever the recoverable amount is less than the carrying
amount. Such impairment losses of the cash-generating unit or group of cash-generating units are
recognized by first reducing the carrying amount of any goodwill allocated to the cash-generating unit
or group of cash-generating units, and then allocating the rest of losses to other assets of the unit pro
rata on the basis of the carrying amount of each asset in the unit.
The Group reviews assets other than goodwill at each fiscal year end to determine whether there is any
indication that previously recognized impairment losses may no longer exist or may have decreased. If
there are any such indications, the Group estimates the recoverable amount of the asset.
Impairment losses on assets other than goodwill that were recognized in prior fiscal years are reversed

28
Three Months Ended March 31, 2016
only when there have been changes in the estimates used to determine the recoverable amount of the
asset since the last impairment loss was recognized. In this case, the carrying amount of the asset is
increased as a reversal of impairment loss to the recoverable amount.
Impairment losses are reversed up to the carrying amount, net of amortization or depreciation, that
would have been determined had no impairment loss for the asset been recognized in prior fiscal years.
(12) Employee Benefits
1) Post-employment benefits
The Group sponsors a defined benefit plan and a defined contribution plan as post-employment
benefit plans for employees.
The projected unit credit method is used to individually determine the present value of defined
benefit obligations, related current service costs and past service costs of each plan.
The discount rate is determined by reference to market yields at the end of the fiscal year on high
quality corporate bonds corresponding to the period until the expected date of future benefit
payment.
For the defined benefit plan, the net amount of the present value of defined benefit obligations and
the fair value of plan assets is accounted for as a liability or asset. However, if the defined benefit
plan has surplus, the net defined benefit asset is limited to the present value of any economic
benefits available in the form of refunds from the plan or reductions in the future contributions to the
plan. Net interest on the net defined benefit liability (asset) is recognized in profit or loss as financial
expenses (financial income).
Remeasurements of the net defined benefit liability (asset) are recognized in other comprehensive
income and immediately reclassified to retained earnings in the period in which they occur.
Past service costs are recognized in profit or loss for the period in which they are incurred.
Payments to defined contribution benefits are recognized as expenses when employees have
rendered service entitling them to the contributions.
2) Other employee benefits
Short-term employee benefit obligations are measured on an undiscounted basis, and are
recognized as an expense when the related services are rendered.
For bonuses, when there is a present legal or constructive obligation to make payments of bonuses,
and a reliable estimate of the obligation can be made, the estimated amount to be paid is accounted
for as a liability.
For the paid absence expenses, when there is a legal or constructive obligation with respect to
accumulating paid absence systems and a reliable estimate of the obligation can be made, the

29
Three Months Ended March 31, 2016
estimated amount to be paid based on those systems is accounted for as a liability.
(13) Share-based Payments
The Company has a stock option plan accounted for as an equity-settled share-based payment plan.
Stock options are estimated using its fair value at the grant date and recognized in profit or loss as
expense over the vesting periods with corresponding increases to equity and taking into account the
estimated number of options to be vested. The fair value of options granted is measured using the
Black-Scholes model based on the terms and conditions of the options.
The terms and conditions are periodically reviewed and the estimated number of options vested is
revised as necessary.
(14) Provisions
Provisions are recognized when the Group has a present obligation (legal or constructive) as a result of
a past event, it is probable that an outflow of resources embodying economic benefit will be required to
settle the obligation, and a reliable estimate can be made of the amount of the obligation.
The amounts recognized as provisions are the best estimates of necessary expenditures to settle the
present obligation at the end of the fiscal period, taking into account the risks and uncertainties
associated with the obligation. When the effect of the time value of money is material, the amount of
provision is measured at the present value of the expenditures expected to be required to settle the
obligation.
(15) Revenue
The Group is engaged in the sale of consumer products, including cosmetics, skin care products, hair
care products, sanitary products and fabric care products, as well as chemical products, including fatty
alcohols and surfactants. Revenue from the sale of these goods is recognized when the Group has
transferred the significant risks and rewards of ownership of the goods to the buyer; the Group retains
neither continuing managerial involvement nor effective control over the goods sold; it is probable that
economic benefits related to the transaction will flow to the Group; and these benefits and
corresponding costs can be measured reliably. Therefore, revenue is usually recognized at the time of
delivery of goods to customers. Revenue is measured at the fair value of the consideration received or
receivable less any discounts, rebates, consumption taxes and other taxes.
(16) Government Grants
Government grants are recognized at fair value when there is reasonable assurance that the conditions
attaching to them will be complied with and that the grants will be received. Grants related to income
are recognized as income in the same fiscal year in reporting the related expenses. When the grant
relates to an asset, the amount of the grants is deducted from the acquisition cost of the asset. And the
amount of grants is recognized in profit or loss on a systematic and rational basis over the useful life of
the depreciable asset as a reduction of depreciation expenses.
(17) Income Taxes

30
Three Months Ended March 31, 2016
Income taxes consist of current income taxes and deferred income taxes. Income taxes are recognized
as income or expense and included in profit or loss, except for taxes related to business combinations
and taxes related to items that are recognized directly in equity or in other comprehensive income.
1) Current income taxes
Current income taxes are recognized in the amount of the expected taxes payable to or receivable
from the taxation authorities. Calculation of the amount of tax is based on the tax rates and tax laws
enacted or substantively enacted by the end of the fiscal year in countries where the Group conducts
businesses and earns taxable income.
2) Deferred income taxes
Deferred tax assets and liabilities are recognized for taxable temporary differences between the
carrying amounts of assets or liabilities in the statement of financial position and its tax base, and for
tax loss carryforwards and tax credits.
Deferred tax assets are recognized for deductible temporary differences, the carryforwards of
unused tax losses and the carryforwards of unused tax credits to the extent that it is probable that
future taxable income will be available against which such deferred tax assets can be utilized.
Deferred tax liabilities are recognized, in principle, for all taxable temporary differences.
The carrying amount of deferred tax assets is reviewed each period and reduced to the extent that
it is no longer probable that sufficient future taxable income will be available to realize benefits from
all or part of the assets. Unrecognized deferred tax assets are reassessed each period and are
recognized to the extent that it has become probable that future taxable income will allow the
deferred tax assets to be recovered.
Deferred tax assets and liabilities are not recognized for the following taxable temporary differences:
• Taxable temporary differences arising from initial recognition of goodwill
• Taxable temporary differences arising from initial recognition of assets and liabilities from
transactions that are not business combinations and affect neither accounting income nor taxable
income
• Taxable temporary differences on investments in subsidiaries and associates, when the timing of
the reversal of the temporary differences can be controlled and it is probable that the temporary
differences will not reverse in the foreseeable future
• Deductible temporary differences on investments in subsidiaries and associates, when it is
probable that the temporary differences will not reverse in the foreseeable future
Deferred tax assets and liabilities are measured at the tax rates that are expected to apply to the
period when the assets are realized or the liabilities are settled, based on the tax rates and tax laws
enacted or substantively enacted by the fiscal year end.
Deferred tax assets and liabilities are offset if the Group has a legally enforceable right to set off
current tax assets against current tax liabilities and income taxes are levied by the same taxation
31
Three Months Ended March 31, 2016
authority on the same taxable entity.
The Company and some of its subsidiaries have adopted the consolidated tax system.
Quarterly income taxes are recognized based on the estimated annual effective tax rate.
(18) Earnings per Share
Basic earnings per share are calculated by dividing net income, attributable to owners of the parent by
the weighted average number of ordinary shares outstanding during the period, adjusted for treasury
shares held. Diluted earnings per share are calculated by adjusting for the effects of all dilutive potential
ordinary shares.
(19) Non-current Assets Held for Sale
A non-current asset or disposal group whose carrying amount is expected to be recovered principally
through a sale transaction rather than through continuing use is classified as a non-current asset or
disposal group held for sale if it is highly probable that the asset or disposal group will be sold within one
year and is available for immediate sale in its present condition, and the Group’s management is
committed to a plan to sell. Non-current assets are not depreciated or amortized while they are
classified as held for sale or are part of a disposal group classified as held for sale. Non-current assets
or disposal groups classified as held for sale are measured at the lower of the carrying amount and fair
value less costs to sell.
(20) Equity and Other Capital
1) Ordinary shares
Ordinary shares are recognized in share capital and capital surplus at their issue price. Share
issuance costs are deducted from the issue price.
2) Treasury shares
Treasury shares are recognized at cost and deducted from equity. No gain or loss is recognized on
the purchase, sale or retirement of the Company’s treasury shares. Any difference between the
carrying amount and consideration received on the sale of treasury shares is recognized directly in
equity.
(21) Dividends
Dividend distributions to shareholders of the Company are recognized as liabilities in the period in which
year-end dividends are resolved upon by the General Meeting of Shareholders and interim dividends are
resolved upon by the Board of Directors.
2. Significant Accounting Estimates and Judgments
The Group’s quarterly consolidated financial statements include estimates and assumptions made by the
Group’s management regarding income and expenses, measurement of assets and liabilities, and disclosure
of contingencies as of the reporting date. These estimates and assumptions are based on management’s
best judgment as of the reporting date, and take into account historical experience and various other factors
32
Three Months Ended March 31, 2016
that can be considered as reasonable. However, due to their nature, actual results may differ from these
estimates.
The estimates and their underlying assumptions are reviewed by management on an ongoing basis. The
effects of revisions to accounting estimates and assumptions are recognized in the period in which the
estimates are revised and in future periods.
Estimates and assumptions that significantly affect the amounts recognized in the Group’s quarterly
consolidated financial statements are as follows.
(1) Impairment of Property, Plant and Equipment, Goodwill and Intangible Assets
The Group conducts impairment tests for property, plant and equipment, goodwill and intangible assets
when there is an indication that the recoverable amount of the asset or cash-generating unit is less than
the carrying amount.
Triggering events for impairment testing include, for example, significant changes with adverse effects
on past or projected business performance, significant changes in the use of acquired assets, or
changes in overall business strategy.
Goodwill is tested for impairment at least once a year by each fiscal year end, irrespective of indication
of impairment, to verify that the recoverable amount of the cash-generating unit to which goodwill is
allocated exceeds the carrying amount.
Impairment tests are performed by comparing the carrying amount and the recoverable amount of the
asset or cash-generating unit. If the recoverable amount is less than the carrying amount, the carrying
amount is reduced to the recoverable amount and the reduction is recognized as an impairment loss.
The recoverable amount is the higher of the value in use and the fair value less cost of disposal of the
asset or cash-generating unit.
In calculating the value in use, the Group makes certain assumptions about the remaining useful life
and future cash flows of the asset, discount rate, growth rate and other factors. These assumptions are
based on management’s best estimates and judgments, but may be affected by changes in future
business plans, economic conditions or other factors. If revisions to the assumptions become necessary,
such revisions could have a material effect on the amounts recognized in the consolidated financial
statements in future quarterly periods.
(2) Useful Lives of Property, Plant and Equipment
The Group reviews the useful lives of property, plant and equipment at each fiscal year end, and any
revisions are applied prospectively as changes in accounting estimates.
If revisions to the useful lives become necessary, such revisions could have a material effect on the
amounts recognized in the consolidated financial statements in future quarterly periods.
(3) Provisions

33
Three Months Ended March 31, 2016
The Group has recognized a provision for loss related to cosmetics, a provision for sales returns, a
provision for asset retirement obligations and other provisions in the consolidated statement of financial
position.
The amounts recognized are the best estimates of the expenditures required to settle the present
obligations, taking into account historical experience and other factors as of the reporting date.
The provision for loss related to cosmetics may be affected by changes in compensation-related and
other expenses.
The provision for sales returns may be affected by factors such as plans to discontinue production and
sales of products.
The provision for asset retirement obligations and other provisions may be affected by factors such as
changes in future business plans.
If the actual amounts paid differ from the estimates, such differences could have a material effect on
the amounts recognized in the consolidated financial statements in future quarterly periods.
(4) Income Taxes
The Group recognizes and measures current income taxes payable and income taxes based on
reasonable estimates of the amounts to be paid to the taxation authorities in each country. Such
estimates are made using the tax rates and tax laws enacted or substantively enacted by the reporting
date.
Calculating income taxes payable and income taxes requires estimates and judgments of various
factors, including interpretations of tax regulations by the Group and the taxation authorities and the
experience of past tax audits.
Therefore, if the final tax outcome is different from the amount initially recognized, the difference is
recognized in the period for current tax of prior periods.
Deferred tax assets are recognized for deductible temporary differences, the carryforwards of unused
tax losses and the carryforwards of unused tax credits to the extent that it is probable that future
taxable income will be available. The realizability of deferred tax assets is assessed using the tax rates
that are expected to apply to the period when the asset is realized, based on tax rates and tax laws
enacted or substantively enacted by the reporting date.
Recognition and measurement of deferred tax assets are based on management’s best estimates and
judgments, but may be affected by future changes in business plans or other conditions, or by the
amendment or promulgation of related laws. Any revisions that become necessary could have a
material effect on the consolidated financial statements in future quarterly periods.
(5) Fair Value

34
Three Months Ended March 31, 2016
The Group uses various inputs, including unobservable inputs, and valuation methodologies to estimate
the fair value of specific assets and liabilities. When measuring fair value, the Group maximizes the use
of relevant observable inputs and minimizes the use of unobservable inputs, and management’s best
estimates and judgments are required in that process.
The fair value of these assets and liabilities is based on management’s best estimates and judgments,
but could be affected by factors including changes in inputs due to changes in economic conditions. Any
revisions that become necessary could have a material effect on the amounts recognized in the
consolidated financial statements in future quarterly periods.
In its first-time adoption of IFRS, the Group applies the exemption under IFRS 1 and uses the deemed
cost as the acquisition cost for certain property, plant and equipment. For fair value measurement
methods and amounts for these assets, see the Investor Relations section of the Company’s website,
where information on first-time adoption of IFRS is scheduled to be presented.
(6) Contingencies
Contingencies are disclosed when there were items that could have a material effect on future business
after considering the probability of occurrence and the impact, taking into account all available evidence
as of the reporting date.
(Remainder of page intentionally left blank.)

35
Three Months Ended March 31, 2016
3. Segment Information
(1) Summary of reportable segments
The Group’s reportable segments are the components of the Group for which discrete financial
information is available and which are regularly reviewed by the Board of Directors in deciding how to
allocate resources and in assessing their performance. Net sales and operating income are the key
measures used by the Board of Directors to evaluate the performance of each segment.
The Group is an organization comprising four main business units – the Beauty Care Business, the
Human Health Care Business, the Fabric and Home Care Business (collectively, the “Consumer Products
Business”) and the Chemical Business. In each business unit, the Group plans comprehensive business
strategies and carries out business activities on a global basis.
Therefore, the Group has four reportable segments: the Beauty Care Business, the Human Health Care
Business, the Fabric and Home Care Business and the Chemical Business.
Major products by reportable segment are as follows:
Cosmetics Counseling cosmetics, Self-selection cosmetics
Skin care products Soaps, Facial cleansers, Body cleansers
Hair care products Shampoos, Conditioners, Hair styling agents,
Hair coloring agents
Food and beverage products Beverages
Sanitary products Sanitary napkins, Baby diapers
Personal health products Bath additives, Oral care products, Men's products
Fabric care products Laundry detergents, Fabric treatments
Home care products Kitchen cleaning products, House cleaning products,
Paper cleaning products, Commercial-use products
Oleo chemicals Fatty alcohols, Fatty amines, Fatty acids,
Glycerin, Commercial-use edible fats and oils
Performance chemicals Surfactants, Plastics additives,
Superplasticizers for concrete admixtures
Specialty chemicals
Toner and toner binder for copiers and printers,
Ink and colorants for inkjet printers,
Fragrances and aroma chemicals
Chemical Business
Reportable Segments Major Products
Consumer
Products
Business
Beauty Care
Business
Human Health Care
Business
Fabric and Home
Care Business

36
Three Months Ended March 31, 2016
(2) Sales and results of reportable segments
(Millions of yen)
Three months ended
March 31, 2016
Beauty Care
Business
Human Health
Care Business
Fabric and
Home Care
Business
Subtotal
Net sales
Sales to customers 138,447 67,093 71,015 276,555 58,537 335,092 - 335,092
Intersegment sales and transfers2 - - - - 8,245 8,245 (8,245) -
Total net sales 138,447 67,093 71,015 276,555 66,782 343,337 (8,245) 335,092
Operating income (loss) 6,797 8,468 12,895 28,160 6,529 34,689 (240) 34,449
% of net sales 4.9 12.6 18.2 10.2 9.8 10.1 - 10.3
Financial income 362
Financial expenses (2,508)
Share of profit in investments accounted for using the
equity method 624
Income before income taxes 32,927
Notes:
1. The operating income reconciliation of -240 million yen includes corporate expenses not allocated to reportable segments, as well as elimination of intersegment inventory transactions.
2. Intersegment sales and transfers are mainly calculated based on market price and manufacturing cost.
Three months ended
March 31, 2015
Beauty Care
Business
Human Health
Care Business
Fabric and
Home Care
Business
Subtotal
Net sales
Sales to customers 134,230 65,365 67,948 267,543 62,006 329,549 - 329,549
Intersegment sales and transfers2 - - - - 8,824 8,824 (8,824) -
Total net sales 134,230 65,365 67,948 267,543 70,830 338,373 (8,824) 329,549
Operating income (loss) (544) 6,799 10,111 16,366 6,575 22,941 (200) 22,741
% of net sales (0.4) 10.4 14.9 6.1 9.3 6.8 - 6.9
Financial income 822
Financial expenses (605)
Share of profit in investments accounted for using the
equity method 470
Income before income taxes 23,428
Notes:
1. The operating income reconciliation of -200 million yen includes corporate expenses not allocated to reportable segments, as well as elimination of intersegment inventory transactions.
2. Intersegment sales and transfers are mainly calculated based on market price and manufacturing cost.
Reportable Segments
Total Reconciliations1 Consolidated
Reportable Segments
Chemical
Business
Consumer Products Business
Consumer Products Business
Chemical
BusinessTotal Reconciliations
1 Consolidated

37
Three Months Ended March 31, 2016
4. Selling, General and Administrative Expenses
The breakdown of selling, general and administrative expenses is as follows:
(Millions of yen)
Three months ended Three months ended
March 31, 2016 March 31, 2015
Freight/warehouse 13,960 13,955
Advertising 21,502 21,428
Sales promotion 18,091 18,297
Employee benefits 47,127 47,186
Depreciation 2,810 2,816
Amortization 2,105 3,568
Research and development 13,203 13,298
Other 31,754 30,484
Total 150,552 151,032