consolidated financial results for the three months of the
TRANSCRIPT
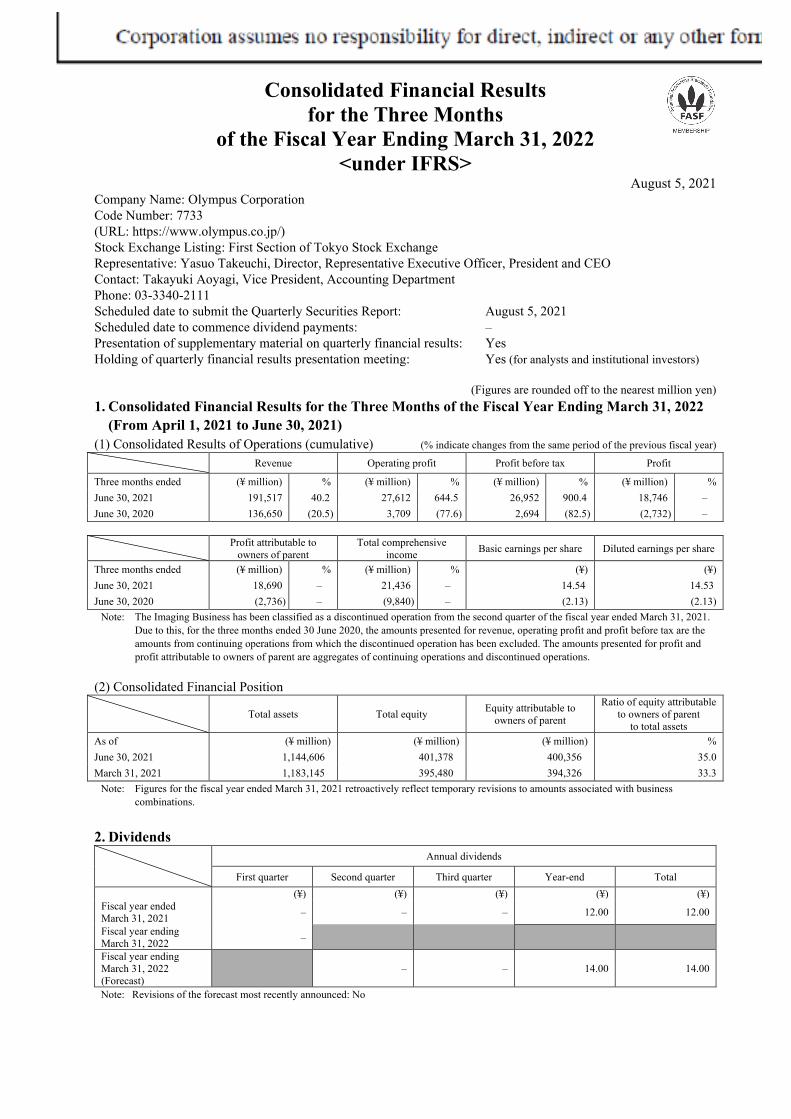
Consolidated Financial Results for the Three Months
of the Fiscal Year Ending March 31, 2022 <under IFRS>
August 5, 2021 Company Name: Olympus Corporation Code Number: 7733 (URL: https://www.olympus.co.jp/) Stock Exchange Listing: First Section of Tokyo Stock Exchange Representative: Yasuo Takeuchi, Director, Representative Executive Officer, President and CEO Contact: Takayuki Aoyagi, Vice President, Accounting Department Phone: 03-3340-2111 Scheduled date to submit the Quarterly Securities Report: August 5, 2021 Scheduled date to commence dividend payments: – Presentation of supplementary material on quarterly financial results: Yes Holding of quarterly financial results presentation meeting: Yes (for analysts and institutional investors)
(Figures are rounded off to the nearest million yen) 1. Consolidated Financial Results for the Three Months of the Fiscal Year Ending March 31, 2022
(From April 1, 2021 to June 30, 2021)(1) Consolidated Results of Operations (cumulative) (% indicate changes from the same period of the previous fiscal year)
Revenue Operating profit Profit before tax Profit
Three months ended (¥ million) % (¥ million) % (¥ million) % (¥ million) % June 30, 2021 191,517 40.2 27,612 644.5 26,952 900.4 18,746 – June 30, 2020 136,650 (20.5) 3,709 (77.6) 2,694 (82.5) (2,732) –
Profit attributable to owners of parent
Total comprehensive income Basic earnings per share Diluted earnings per share
Three months ended (¥ million) % (¥ million) % (¥) (¥) June 30, 2021 18,690 – 21,436 – 14.54 14.53 June 30, 2020 (2,736) – (9,840) – (2.13) (2.13)
Note: The Imaging Business has been classified as a discontinued operation from the second quarter of the fiscal year ended March 31, 2021. Due to this, for the three months ended 30 June 2020, the amounts presented for revenue, operating profit and profit before tax are the amounts from continuing operations from which the discontinued operation has been excluded. The amounts presented for profit and profit attributable to owners of parent are aggregates of continuing operations and discontinued operations.
(2) Consolidated Financial Position
Total assets Total equity Equity attributable to owners of parent
Ratio of equity attributable to owners of parent
to total assets As of (¥ million) (¥ million) (¥ million) % June 30, 2021 1,144,606 401,378 400,356 35.0 March 31, 2021 1,183,145 395,480 394,326 33.3
Note: Figures for the fiscal year ended March 31, 2021 retroactively reflect temporary revisions to amounts associated with business combinations.
2. DividendsAnnual dividends
First quarter Second quarter Third quarter Year-end Total (¥) (¥) (¥) (¥) (¥)
Fiscal year ended March 31, 2021 – – – 12.00 12.00
Fiscal year ending March 31, 2022 –
Fiscal year ending March 31, 2022 (Forecast)
– – 14.00 14.00
Note: Revisions of the forecast most recently announced: No
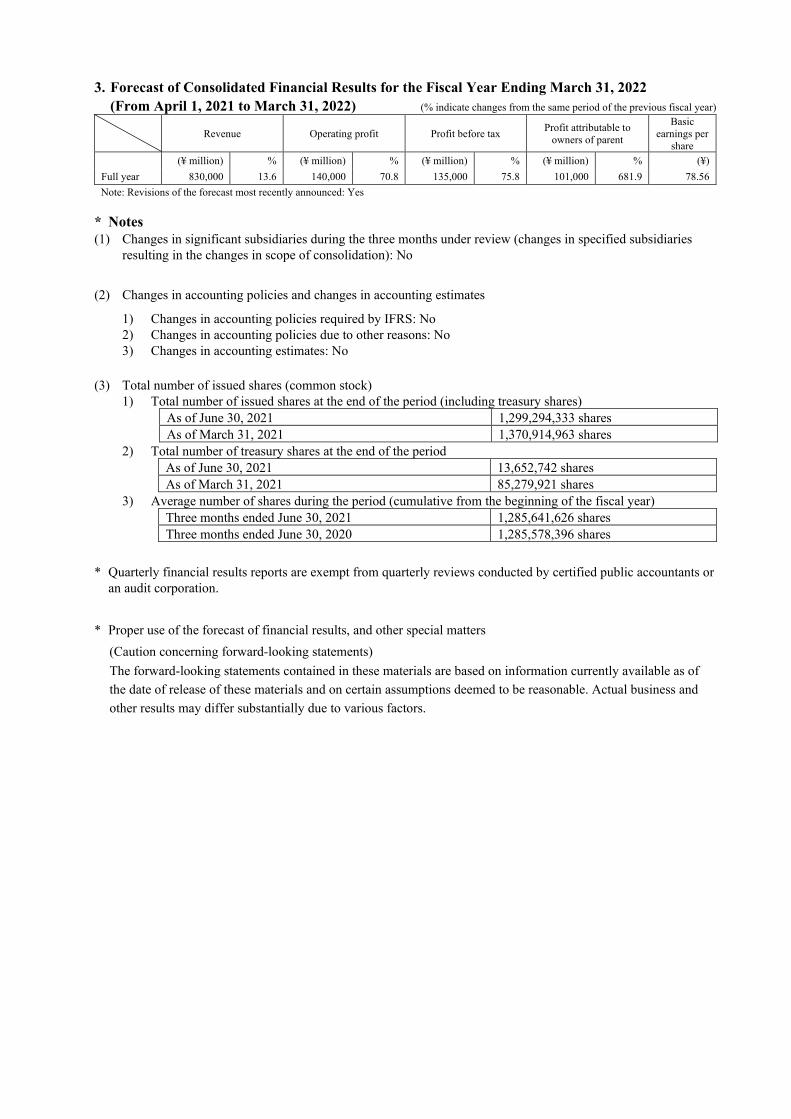
3. Forecast of Consolidated Financial Results for the Fiscal Year Ending March 31, 2022 (From April 1, 2021 to March 31, 2022) (% indicate changes from the same period of the previous fiscal year)
Revenue Operating profit Profit before tax Profit attributable to
owners of parent
Basic earnings per
share (¥ million) % (¥ million) % (¥ million) % (¥ million) % (¥)
Full year 830,000 13.6 140,000 70.8 135,000 75.8 101,000 681.9 78.56 Note: Revisions of the forecast most recently announced: Yes
* Notes (1) Changes in significant subsidiaries during the three months under review (changes in specified subsidiaries
resulting in the changes in scope of consolidation): No
(2) Changes in accounting policies and changes in accounting estimates
1) Changes in accounting policies required by IFRS: No 2) Changes in accounting policies due to other reasons: No 3) Changes in accounting estimates: No
(3) Total number of issued shares (common stock)
1) Total number of issued shares at the end of the period (including treasury shares) As of June 30, 2021 1,299,294,333 shares As of March 31, 2021 1,370,914,963 shares
2) Total number of treasury shares at the end of the period As of June 30, 2021 13,652,742 shares As of March 31, 2021 85,279,921 shares
3) Average number of shares during the period (cumulative from the beginning of the fiscal year) Three months ended June 30, 2021 1,285,641,626 shares Three months ended June 30, 2020 1,285,578,396 shares
* Quarterly financial results reports are exempt from quarterly reviews conducted by certified public accountants or
an audit corporation. * Proper use of the forecast of financial results, and other special matters
(Caution concerning forward-looking statements) The forward-looking statements contained in these materials are based on information currently available as of the date of release of these materials and on certain assumptions deemed to be reasonable. Actual business and other results may differ substantially due to various factors.

1
Attached Material Contents
1. Qualitative Information Regarding Settlement of Accounts for the Three Months .............................................. 2 (1) Explanation of Results of Operations .............................................................................................................. 2 (2) Financial Position ............................................................................................................................................ 6 (3) Cash Flows ...................................................................................................................................................... 8 (4) Explanation of Forecast of Consolidated Financial Results and Other Forward-looking Statements ............. 8 (5) Explanation of Revisions to Evaluation Table and Calculation Method of Compensation for Executive
Officers for the Fiscal Year Ending March 31, 2022 Due to Revision of Forecast of Consolidated Financial Results for the Fiscal Year Ending March 31, 2022 ........................................................................................ 8
2. Condensed Consolidated Financial Statements and Significant Notes Thereto .................................................. 14 (1) Condensed Consolidated Statements of Financial Position ........................................................................... 14 (2) Condensed Consolidated Statements of Profit or Loss .................................................................................. 16 (3) Condensed Consolidated Statements of Comprehensive Income .................................................................. 17 (4) Condensed Consolidated Statements of Changes in Equity .......................................................................... 18 (5) Condensed Consolidated Statements of Cash Flows ..................................................................................... 19 (6) Notes to Condensed Consolidated Financial Statements ............................................................................... 21
(Notes on premise of going concern) ............................................................................................................. 21 (Reporting entity) .......................................................................................................................................... 21 (Basis of preparation) .................................................................................................................................... 21 (Significant accounting policies) ................................................................................................................... 21 (Significant accounting estimates and associated judgments) ....................................................................... 21 (Segment information) ................................................................................................................................... 22 (Per-share data) .............................................................................................................................................. 23 (Business combinations) ................................................................................................................................ 25 (Discontinued operations) .............................................................................................................................. 29 (Additional information) ................................................................................................................................ 30 (Important subsequent events) ....................................................................................................................... 30

Olympus Corporation (7733) Financial Results for the Three Months of the Fiscal Year Ending March 31, 2022
2
1. Qualitative Information Regarding Settlement of Accounts for the Three Months
(1) Explanation of Results of Operations
Trends in overall business results
The global economy faced challenging conditions in the three months ended June 30, 2021 due to the impact of the global spread of the novel coronavirus disease (COVID-19). Although the global economy continued to face highly uncertain conditions including a second (or more) wave of infection in some regions, economic activities are recovering along with gradual vaccination progressing. The Japanese economy faced challenging conditions, as was the case for the global economy, due to the impact of COVID-19, despite showing signs of recovery in exports and a diminished effect of COVID-19 on corporate earnings.
Even under such circumstances, the Olympus Group are promoting initiatives toward sustainable growth according to its business transformation plan “Transform Olympus” announced in January 2019, aiming to develop itself as a truly global medtech company and the medium- and long-term management strategy announced in November 2019 based on “Transform Olympus.”
Business results
Business results of continuing operations are presented in (1) to (7) below. Due to the transfer of the Imaging Business to OJ Holdings, Ltd., a special purpose company established by Japan Industrial Partners, Inc. in the previous fiscal year, the profit (loss) of the Imaging Business is presented in discontinued operations.
(Millions of yen)
Three months ended June 30, 2020
Three months ended June 30, 2021 Increase (Decrease) Increase (Decrease)
ratio (%) (1) Revenue 136,650 191,517 54,867 40.2 (2) Cost of sales 51,398 68,201 16,803 32.7 (3) Selling, general and
administrative expenses 80,332 95,797 15,465 19.3
(4) Share of profit (loss) of investments accounted for using equity method/Other income/Other expenses
(1,211) 93 1,304 –
(5) Operating profit 3,709 27,612 23,903 644.5 (6) Finance income (loss) (1,015) (660) 355 – (7) Income taxes 2,868 8,206 5,338 186.1 (8) Profit attributable to
owners of parent (2,736) 18,690 21,426 –
Exchange rate (Yen/U.S. dollar)
107.62 109.49 1.87 –
Exchange rate (Yen/Euro) 118.48 131.96 13.48 – Exchange rate (Yen/Renminbi) 15.17 16.96 1.79 –
(1) Revenue
Revenue increased by ¥54,867 million year on year to ¥191,517 million. This increase was due to an increase in revenue in all business of the Endoscopic Solutions Business, Therapeutic Solutions Business, Scientific Solutions Business and other businesses. Details are as described in “Analysis of the performance by segment” below.
(2) Cost of sales
Cost of sales increased by ¥16,803 million year on year to ¥68,201 million. The cost-to-sales ratio improved 2.0 percentage points year on year to 35.6%. In the previous fiscal year, the impact of COVID-19 led to reduced production volume, which in turn led to reduced factory operating capacity. However, the cost-to-sales ratio improved due to increased revenue during the current period and subsequent improved operating capacity.
Olympus Corporation (7733) Financial Results for the Three Months of the Fiscal Year Ending March 31, 2022
3
(3) Selling, general and administrative expenses
Selling, general and administrative expenses increased by ¥15,465 million year on year to ¥95,797 million. In the previous fiscal year, the spread of COVID-19 led to restrictions on sales activities, which caused a decline in travel and transportation expenses, advertising and promotion expenses, and promotion expenses, etc. However, in the current period, the reopening of sales activities led to an increase in expenses centered on North America.
(4) Share of profit (loss) of investments accounted for using equity method/Other income/Other expenses
The sum of share of profit (loss) of investments accounted for using equity method, other income, and other expenses amounted to ¥93 million, and the profit or loss improved by ¥1,304 million year on year. Other income increased due to factors such as recording of approximately ¥2,800 million in gain on step acquisition associated with the acquisition of Medi-Tate Ltd. and approximately ¥1,400 million in gain on sale of fixed assets. For details on the gain of step acquisition associated with the acquisition of Medi-Tate Ltd., please see the notes (page 25) on (Business combinations). On the other hand, other expenses increased due to factors such as recording of approximately ¥1,700 million in impairment losses related to an equity investment in associates accounted for using equity method located in Europe, an increase of approximately ¥900 million for the cost related to promotion of the business transformation plan “Transform Olympus.”
(5) Operating profit
Reflecting the factors stated above, operating profit increased by ¥23,903 million year on year to ¥27,612 million.
(6) Finance income (loss)
Finance loss, which reflects finance income and finance costs, improved ¥355 million year on year to ¥660 million. The improvement in finance loss was due mainly to the shift from foreign exchange losses to foreign exchange gains.
(7) Income taxes
The increased profit before tax led income taxes to increase by ¥5,338 million year on year to ¥8,206 million.
(8) Profit attributable to owners of parent (the aggregate of continuing operations and discontinued operations)
Reflecting the factors stated above, profit attributable to owners of parent increased by ¥21,426 million year on year to ¥18,690 million.
(Impact of foreign exchanges rates)
Compared to the same period of the previous fiscal year, the yen depreciated against the U.S. dollar, euro, and renminbi. The average exchange rate during the current period was ¥109.49 against the U.S. dollar (¥107.62 in the previous fiscal year), ¥131.96 against the euro (¥118.48 in the previous fiscal year) and ¥16.96 against the renminbi (¥15.17 in the previous fiscal year), which caused revenue and operating profit to increase by ¥10,802 million and ¥429 million, respectively, year on year.

Olympus Corporation (7733) Financial Results for the Three Months of the Fiscal Year Ending March 31, 2022
4
Analysis of the performance by segment
In the first quarter under review, to strengthen business in the endoscopic solutions field, we transferred bronchoscopes from the Endoscopic Solutions Business to the Therapeutic Solutions Business. Segment information for the same period in the previous fiscal year has been reclassified and disclosed based on the reporting segment following the transfer. Endoscopic Solutions Business (Millions of yen)
Three months ended June 30, 2020
Three months ended June 30, 2021 Increase (Decrease) Increase (Decrease)
ratio (%) Revenue 74,316 100,014 25,698 34.6 Operating profit (loss) 12,417 22,654 10,237 82.4
Consolidated revenue in the Endoscopic Solutions Business amounted to ¥100,014 million (up 34.6% year on year), while operating profit amounted to ¥22,654 million (up 82.4% year on year).
The gastrointestinal endoscopes field recovered from the impact of COVID-19 to show positive year-on-year growth in all regions, and sales in Japan, North America and Europe rose. By product, gastrointestinal endoscopic systems, including “EVIS X1,” and each type of scope, such as upper and lower gastrointestinal scopes, contributed to increased sales.
In the surgical endoscopes field, recovery from the effects of COVID-19 resulted in positive growth from the previous quarter. Sales of surgical endoscopy system “VISERA ELITE II” performed well, and in addition to Japan, sales in North America increased, which is promoting the switch to “VISERA ELITE II.”
In the medical services field, the number of repairs increased year-on-year in all regions due to stable sales of service contracts including maintenance services and the significant impact of the new coronavirus during the same period of the previous year.
Operating profit in the Endoscopic Solutions Business recorded an impairment loss of approximately ¥1,700 million for an equity investment in associates accounted for using equity method located in Europe, while at the same time, profit increased mainly due to an increase in revenue as a result of the recovery from the effects of COVID-19.
Therapeutic Solutions Business (Millions of yen)
Three months ended June 30, 2020
Three months ended June 30, 2021 Increase (Decrease) Increase (Decrease)
ratio (%) Revenue 42,982 63,646 20,664 48.1 Operating profit (loss) 3,663 14,072 10,409 284.2
Consolidated revenue in the Therapeutic Solutions Business amounted to ¥63,646 million (up 48.1% year on year), while operating profit amounted to ¥14,072 million (up 284.2% year on year).
In the GI-endotherapy field, the number of procedures is on a trend of recovery, and all regions and product groups saw positive growth. In particular, sales in North America, where the number of procedures has been increasing, were favorable amid socioeconomic activities returning to normal as vaccinations progressed. Furthermore, sales increased due to the sampling of biopsy forceps, etc., which are used for collecting tissue for screening examinations, and product groups for ESD (Endoscopic Submucosal Dissection) and EMR (Endoscopic Mucosal Resection), which are used in lesion resection.
The urology field saw significant positive growth, particularly in North America and Europe, where the number of procedures has been recovering. In particular, the expansion of sales of resection electrodes for BPH (Benign Prostatic Hyperplasia) and lithotripsy machine for kidney stones SOLTIVE SuperPulsed Laser System was successful as sales in North America, where the number of procedures has been recovering toward levels prior to the spread of COVID-19, were favorable.
The respiratory field saw significant positive growth in North America, where sales of the devices, bronchoscopes, etc. mainly used for EBUS-TBNA (Endobronchial Ultrasound-guided Transbronchial Needle Aspiration) were favorable due to recovery from the impact of COVID-19, in addition to the sale of Veran Medical Technologies,

Olympus Corporation (7733) Financial Results for the Three Months of the Fiscal Year Ending March 31, 2022
5
Inc., which became a subsidiary in December 2020.
In other therapeutic areas, sales were favorable in energy devices, rhinology/otology and gynecology. In particular, sales of THUNDERBEAT and endoscopes for ENT contributed.
Operating profit in the Therapeutic Solutions Business increased due to the increase in revenue as a result of recovery from the effects of COVID-19 as well as a gain on step acquisition of approximately ¥2,800 million related to the acquisition of Medi-Tate Ltd. For details on the gain on step acquisition of Medi-Tate Ltd., please see the note (page 25) related to (Business combinations).
Scientific Solutions Business (Millions of yen)
Three months ended June 30, 2020
Three months ended June 30, 2021 Increase (Decrease) Increase (Decrease)
ratio (%) Revenue 17,757 24,829 7,072 39.8 Operating profit (loss) (1,604) 1,873 3,477 –
Consolidated revenue in Scientific Solutions Business amounted to ¥24,829 million (up 39.8% year on year), while operating profit amounted to ¥1,873 million (compared with an operating loss of ¥1,604 million in the same period of the previous fiscal year).
In the life science field, recovery from the effects of COVID-19 resulted in positive year-on-year growth in all regions. Contributing factors included the progress of budget deployment at research institutes and universities and the expansion of sales of biological microscopes in North America, whose market environment is seeing remarkable recovery, due to the relaxation of restrictions on sales activities.
For the industrial field, in the wake of the overall recovery in market conditions, the capital investment situation of customers improved, and all fields showed positive year-on-year growth. Especially in China, industrial microscopes performing well due to the brisk market for 5G-related electronic components and semiconductors, and non-destructive testing equipment, whose market is expected to recover, contributed to the increase of sales. In addition, sales of X-ray fluorescence analyzers expanded, driven by the high-priced gold market and the strong recycling market for precious metals.
Operating profit in the Scientific Solutions Business increased due to an increase in revenue as a result of the recovery from the effects of COVID-19.

Olympus Corporation (7733) Financial Results for the Three Months of the Fiscal Year Ending March 31, 2022
6
Others (Millions of yen)
Three months ended June 30, 2020
Three months ended June 30, 2021 Increase (Decrease) Increase (Decrease)
ratio (%) Revenue 1,595 3,028 1,433 89.8 Operating profit (loss) (519) (565) (46) –
In other businesses, the Olympus Group conducts R&D and exploratory activities for new businesses in addition to engaging in R&D, manufacturing, and sales of biomedical materials, such as synthetic bone filler, and orthopedic equipment.
Consolidated revenue in other businesses amounted to ¥3,028 million (up 89.8% year on year), while operating loss amounted to ¥565 million (compared with an operating loss of ¥519 million in the same period of the previous fiscal year).
Revenue increased with the addition of revenue of approximately ¥1,100 million from FH ORTHO SAS, which became a subsidiary in November 2020. Operating profit for other businesses was at the same level as the same period of the previous fiscal year due to an increase of revenue despite the addition of expenses for FH ORTHO SAS.
(2) Financial Position
In the first quarter under review, the Olympus Group retroactively adjusted the consolidated statements of financial position as of the end of the previous fiscal year due to the adjustment of the fair value of assets acquired and liabilities undertaken of Veran Medical Technologies, Inc. and Quest Photonic Devices B.V., which were acquired in December 2020 and February 2021, respectively. For details regarding this retroactive adjustment, please refer to the note (page 25) related to (Business combinations).”
[Assets]
As of the end of the first quarter under review, total assets decreased by ¥38,539 million compared to the end of the previous fiscal year to ¥1,144,606 million. This was mainly because cash and cash equivalents decreased by ¥48,765 million due to repayments of borrowings, dividends paid, etc. even though goodwill increased by ¥21,551 million due to the impact of the acquisition of Medi-Tate Ltd.
[Liabilities]
Total liabilities decreased by ¥44,437 million from the end of the previous fiscal year to ¥743,228 million. This was mainly because bonds and borrowings in current liabilities decreased by ¥20,317 million due to repayments of short-term borrowings and repayments of long-term borrowings in addition to trade and other payables decreasing by ¥16,254 million due to a decrease in other payable, etc. as a result of the decrease of notes and accounts payable - trade and the payment of special additional payment associated with implementing the career support for external opportunity.
[Equity]
Total equity increased by ¥5,898 million from the end of the previous fiscal year to ¥401,378 million. This was mainly due to recording profit attributable to owners of parent of ¥18,690 million while paying dividends from retained earnings.
At the meeting of the Board of Directors held on May 7, 2021, the Company resolved the cancellation of treasury shares as provided for under Article 178 of the Companies Act and concluded the disposal on June 4, 2021. The impact of this cancellation is that treasury shares decreased by ¥82,340 million (contraction of negative stated amount in equity), and retained earnings decreased by ¥82,340 million.
The amount of the above cancellation was deducted from other capital surplus in capital surplus, but the amount that exceeds other capital surplus was deducted from retained earnings.
As a result of the foregoing, equity attributable to owners of parent to total assets increased from 33.3% as of the
Olympus Corporation (7733) Financial Results for the Three Months of the Fiscal Year Ending March 31, 2022
7
end of the previous fiscal year to 35.0%.

Olympus Corporation (7733) Financial Results for the Three Months of the Fiscal Year Ending March 31, 2022
8
(3) Cash Flows
Cash and cash equivalents at the end of the first quarter under review reached ¥168,715 million, a decrease of ¥48,763 million from the end of the previous fiscal year. The following is the cash flows for the three months ended June 30, 2021.
Cash flows from operating activities
Net cash provided by operating activities for the three months ended June 30, 2021 was ¥23,681 million (compared with ¥8,388 million provided for the three months ended June 30, 2020). This was mainly due to the recording of ¥26,952 million in profit before tax, adjustment for depreciation and amortization of ¥15,739 million, decrease in trade and other payables of ¥15,049 million, which includes the payment of special additional payment associated with implementing the career support for external opportunity, and income taxes paid of ¥4,045 million.
Cash flows from investing activities
Net cash used in investing activities for the three months ended June 30, 2021 was ¥33,503 million (compared with ¥12,291 million used for the three months ended June 30, 2020). The main factors were ¥21,274 million for payments for the acquisition of Medi-Tate Ltd. In addition, uses of cash included purchase of property, plant and equipment, such as manufacturing equipment, of ¥9,371 million and purchase of intangible assets, such as R&D assets, of ¥4,970 million.
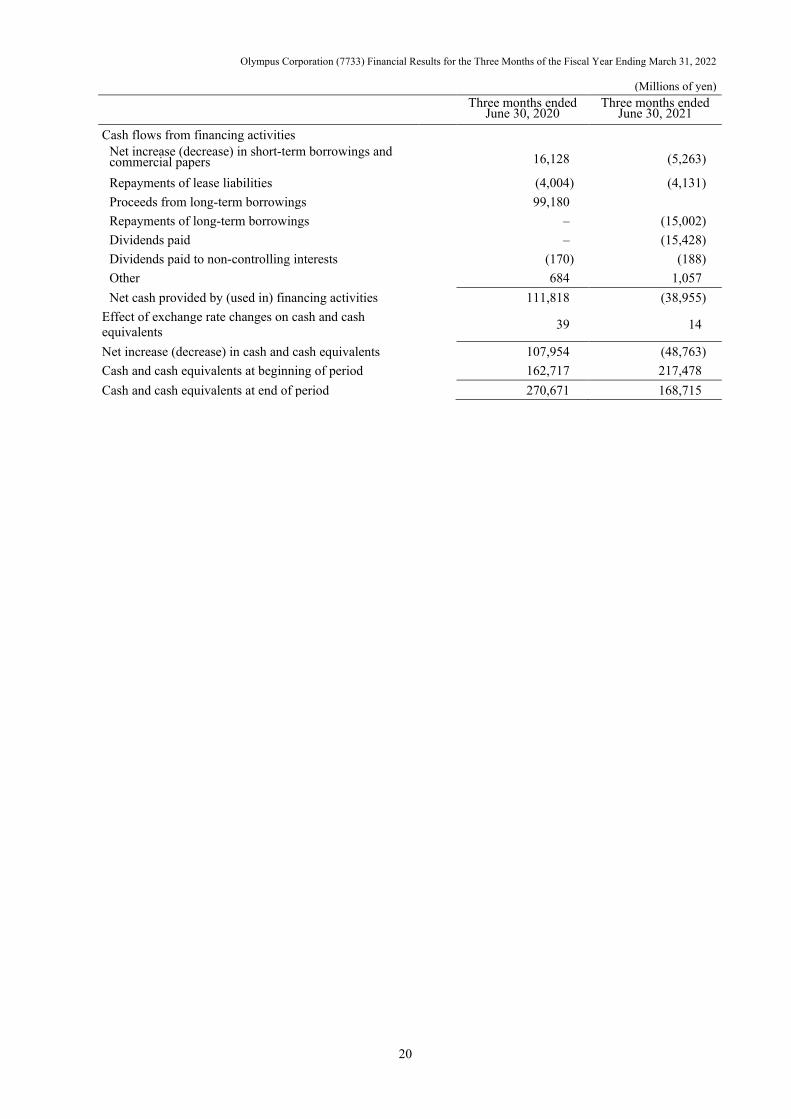
Cash flows from financing activities
Net cash used in financing activities for the three months ended June 30, 2021 was ¥38,955 million (compared with ¥111,818 million provided for the three months ended June 30, 2020). This was mainly due to ¥5,263 million for payments for repayments of short-term borrowings and ¥15,002 million for payments for repayments of long-term borrowings in addition to the payment of ¥15,428 million for dividends.
(4) Explanation of Forecast of Consolidated Financial Results and Other Forward-looking Statements
In light of the recovery of the market environment, primarily in the medical field, and the further progression of measures for cost reductions, the forecast of consolidated financial results for the fiscal year ending March 31, 2022 has been revised from the forecast announced in the “Consolidated Financial Results for the Fiscal Year Ended March 31, 2021,” which was released on May 7, 2021. Foreign exchange rates for the fiscal year ending March 31, 2022, which are a precondition for the forecast, are expected to be ¥108.37 per U.S. dollar, ¥130.49 per euro and ¥17.06 per renminbi.
(Millions of yen)
Revenue Operating profit
Profit before tax
Profit attributable to
owners of parent
Basic earnings per share
Previous Forecast (A) 806,000 126,000 121,000 89,000 ¥69.23 Revised Forecast (B) 830,000 140,000 135,000 101,000 ¥78.56 Increase (Decrease) (B-A) 24,000 14,000 14,000 12,000 – Increase (Decrease) ratio (%) 3.0 11.1 11.6 13.5 –
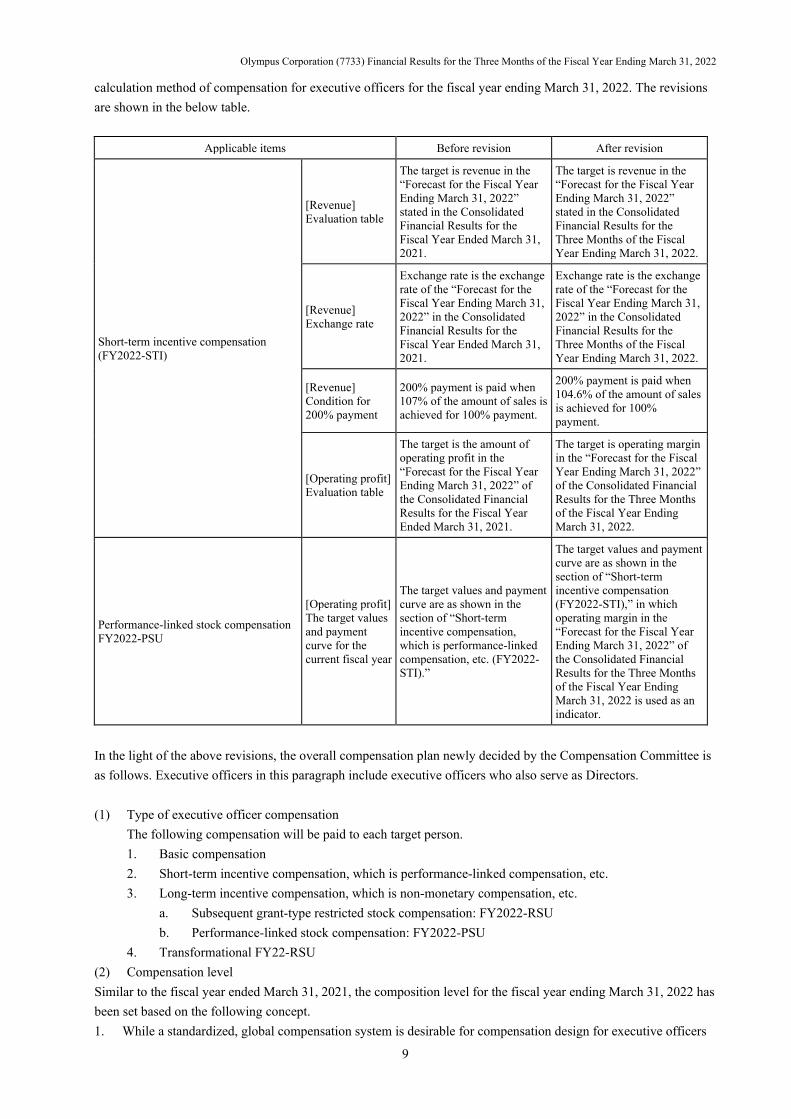
(5) Explanation of Revisions to Evaluation Table and Calculation Method of Compensation for Executive Officers for the Fiscal Year Ending March 31, 2022 Due to Revision of Forecast of Consolidated Financial Results for the Fiscal Year Ending March 31, 2022
Evaluation table of compensation for executive officers was determined based on the forecast of consolidated financial results for the fiscal year ending March 31, 2022 stated in the Consolidated Financial Results for the Fiscal Year Ended March 31, 2021. Responding to the revision of the forecast of consolidated financial results for the fiscal year ending March 31, 2022, the Compensation Committee decided to revise part of the evaluation table and
Olympus Corporation (7733) Financial Results for the Three Months of the Fiscal Year Ending March 31, 2022
9
calculation method of compensation for executive officers for the fiscal year ending March 31, 2022. The revisions are shown in the below table.
Applicable items Before revision After revision
Short-term incentive compensation (FY2022-STI)
[Revenue] Evaluation table
The target is revenue in the “Forecast for the Fiscal Year Ending March 31, 2022” stated in the Consolidated Financial Results for the Fiscal Year Ended March 31, 2021.
The target is revenue in the “Forecast for the Fiscal Year Ending March 31, 2022” stated in the Consolidated Financial Results for the Three Months of the Fiscal Year Ending March 31, 2022.
[Revenue] Exchange rate
Exchange rate is the exchange rate of the “Forecast for the Fiscal Year Ending March 31, 2022” in the Consolidated Financial Results for the Fiscal Year Ended March 31, 2021.
Exchange rate is the exchange rate of the “Forecast for the Fiscal Year Ending March 31, 2022” in the Consolidated Financial Results for the Three Months of the Fiscal Year Ending March 31, 2022.
[Revenue] Condition for 200% payment
200% payment is paid when 107% of the amount of sales is achieved for 100% payment.
200% payment is paid when 104.6% of the amount of sales is achieved for 100% payment.
[Operating profit] Evaluation table
The target is the amount of operating profit in the “Forecast for the Fiscal Year Ending March 31, 2022” of the Consolidated Financial Results for the Fiscal Year Ended March 31, 2021.
The target is operating margin in the “Forecast for the Fiscal Year Ending March 31, 2022” of the Consolidated Financial Results for the Three Months of the Fiscal Year Ending March 31, 2022.
Performance-linked stock compensation FY2022-PSU
[Operating profit] The target values and payment curve for the current fiscal year
The target values and payment curve are as shown in the section of “Short-term incentive compensation, which is performance-linked compensation, etc. (FY2022-STI).”
The target values and payment curve are as shown in the section of “Short-term incentive compensation (FY2022-STI),” in which operating margin in the “Forecast for the Fiscal Year Ending March 31, 2022” of the Consolidated Financial Results for the Three Months of the Fiscal Year Ending March 31, 2022 is used as an indicator.
In the light of the above revisions, the overall compensation plan newly decided by the Compensation Committee is as follows. Executive officers in this paragraph include executive officers who also serve as Directors. (1) Type of executive officer compensation
The following compensation will be paid to each target person. 1. Basic compensation 2. Short-term incentive compensation, which is performance-linked compensation, etc. 3. Long-term incentive compensation, which is non-monetary compensation, etc.
a. Subsequent grant-type restricted stock compensation: FY2022-RSU b. Performance-linked stock compensation: FY2022-PSU
4. Transformational FY22-RSU (2) Compensation level Similar to the fiscal year ended March 31, 2021, the composition level for the fiscal year ending March 31, 2022 has been set based on the following concept. 1. While a standardized, global compensation system is desirable for compensation design for executive officers
Olympus Corporation (7733) Financial Results for the Three Months of the Fiscal Year Ending March 31, 2022
10
who are responsible for global management, differences in compensation levels by region make it difficult to attract and retain talented executives by pay levels of Japan. As such all executive officers will be compensated within a standard structure and set of ratios for basic compensation (BS: Base Salary), short-term incentive compensation (STI: Short Term Incentive), which is performance-linked compensation, etc., and long-term incentive compensation (LTI: Long Term Incentive), which is non-monetary compensation, etc. However, actual compensation levels are determined by considering differences in pay levels in the country of origin of the executive officer. Basic compensation for executive officers from Japan was set by comparing with basic compensation of companies included in TOPIX500 in the medical or life science field (peer groups). The total compensation will also consider the pay ratio (the ratio of the median between CEO compensation and employee salary). A similar approach will be used for executive officers whose country of origin is outside of Japan using appropriate local and regional benchmarks.
2. Compensation levels for the peer group will be verified using objective compensation survey data from external specialist organizations.
(3) Compensation composition Similar to the fiscal year ended March 31, 2021, the fiscal year ending March 31, 2022 has been set based on the following concept. 1. Compensation for executive officer is a combination of fixed base compensation (BS), short-term incentive
compensation (STI), which is performance-linked compensation, etc., and long-term incentive compensation (LTI), which is non-monetary compensation, etc.
2. For executive officers who are not from Japan, time-sum payments and Severance Pay, as well as housing allowances and pensions, are established to make adjustments to the previous compensation agreements on an individual basis. The Compensation Committee decides on the amount and terms that are set individually. The payment of Severance Pay at the time of retirement and the amount of the allowance are determined based on multiple conditions such as the term of office.
3. Focusing on achieving management strategies to improve medium- to long-term corporate value and shareholder value, the Company has set the ratio of short-term incentive compensation (STI) and long-term incentive compensation (LTI) to the base salary (BS) in the case of the CEO as follows. a. BS:STI:LTI = 1 (25%) : 1 (25%) : 2 (50%)
4. With respect to executive officers other than the CEO, the following ratios were adopted based on the same concept. a. BS:STI:LTI = 1 (28.5%) : 1 (28.5%) : 1.5 (43%)
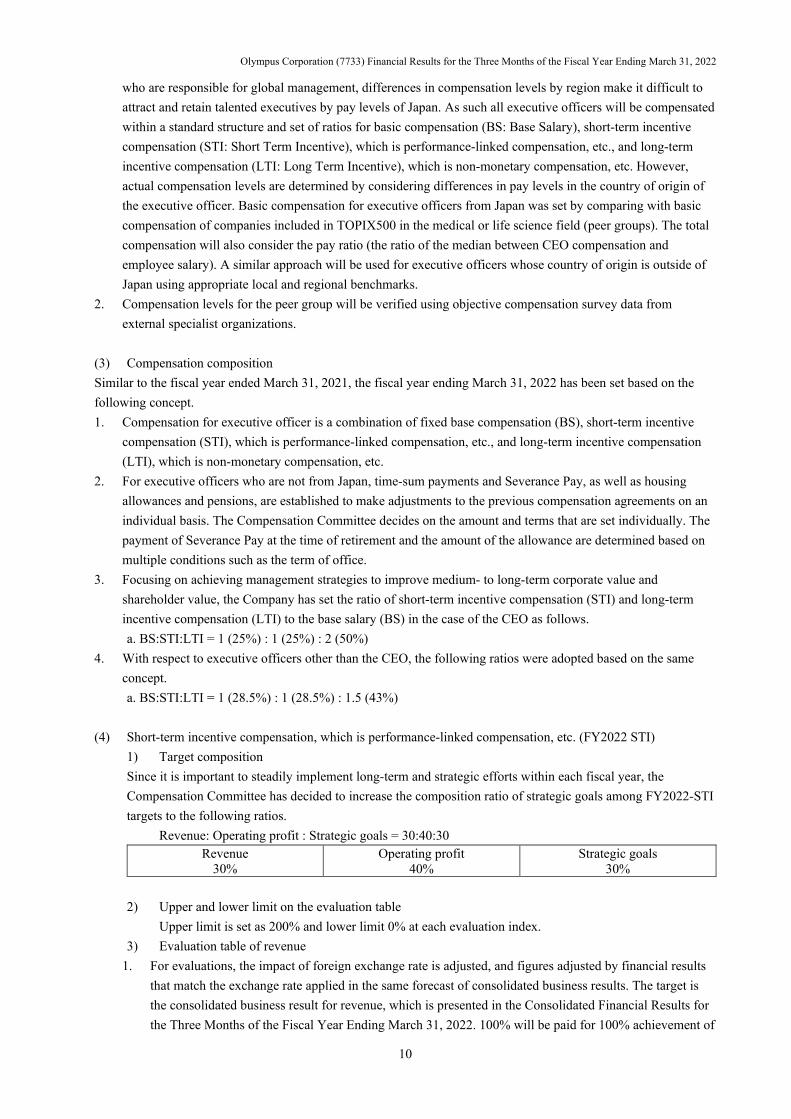
(4) Short-term incentive compensation, which is performance-linked compensation, etc. (FY2022 STI)
1) Target composition Since it is important to steadily implement long-term and strategic efforts within each fiscal year, the Compensation Committee has decided to increase the composition ratio of strategic goals among FY2022-STI targets to the following ratios.
Revenue: Operating profit : Strategic goals = 30:40:30 Revenue
30% Operating profit
40% Strategic goals
30% 2) Upper and lower limit on the evaluation table
Upper limit is set as 200% and lower limit 0% at each evaluation index. 3) Evaluation table of revenue
1. For evaluations, the impact of foreign exchange rate is adjusted, and figures adjusted by financial results that match the exchange rate applied in the same forecast of consolidated business results. The target is the consolidated business result for revenue, which is presented in the Consolidated Financial Results for the Three Months of the Fiscal Year Ending March 31, 2022. 100% will be paid for 100% achievement of
Olympus Corporation (7733) Financial Results for the Three Months of the Fiscal Year Ending March 31, 2022
11
the target amount. 2. 200% payment is paid when 104.6% of the amount of sales is achieved for 100% payment. The payment
table between 100% and 200% payments is a straight line connecting the respective sales. 3. The 50% payment will be the same amount of sales as the actual sales for the fiscal year ended March 31,
2020. The payment table between 50% payment and 100% payment shall be a straight line connecting the respective sales.
4. If the sales amount for the fiscal year ending March 31, 2022 is less than the actual sales for the fiscal year ended March 31, 2020, the payment rate will be 0%.
5. The payment rate is rounded to the first decimal place.
4) Evaluation table of operating profit 1. For evaluations, operating margin, which is calculated from operating profit after adjustments that deduct
other income and other expenses from operating profit (hereinafter “adjusted operating margin”), is used. Evaluations are carried out assuming the actual exchange rate without adjustments to the impact of foreign exchange rate. The target is the adjusted operating margin, which is calculated from the forecast of consolidated financial results in the statements of profit or loss and presented in the Consolidated Financial Results for the Three Months of the Fiscal Year Ending March 31, 2022. 100% will be paid for 100% achievement of the target amount.
2. 200% will be paid in the event that the adjusted operating margin increases by 20%. For the table for payment between 100% and 200%, a straight line connects the operating margins of both.
3. 50% will be paid in the event that adjusted operating margin is at the same level as the actual results in the fiscal year ended March 31, 2020. For the table for payment between 50% and 100%, a straight line connects the operating margins of both.
4. 0% will be paid in the event that Adjusted Profit Margin falls below the actual results in the fiscal year ended March 31, 2020.
5. The payment rate is rounded to the first decimal place.
5) Strategic goals Target items are set on important company-wide issues in the fiscal year ending March 31, 2022 explained at the financial results meeting for the fiscal year ended March 31, 2021 held on May 7, 2021 and set them as common goals for all executive officers. The payment curve between 0% and 200% in the evaluation table is set for each item. Deepening profitable growth strategy in Medical business Further improvement of efficiency and effectiveness through Transform Olympus Continued steady investment in product development for future growth ESG initiatives that contribute to a sustainable society (Set indicators for FY2022-LTI)
(5) Long-term incentive compensation, which is non-monetary compensation, etc. (FY2022-LTI) This section describes long-term incentive compensation, which is non-monetary compensation, etc. (FY2022-LTI) starting in the fiscal year ending March 31, 2022 and ending in the fiscal year ending March 31, 2024. Long-term incentive compensation (LTI), which is non-monetary compensation, etc., in the new compensation system established in the fiscal year ended March 31, 2021 consisted of 25% stock compensation (RSU: Restricted Stock Unit) and 75% performance-linked stock compensation (PSU: Performance Share Unit). Every assessment period is three years. However, the spread of COVID-19 significantly affected the initiatives in the first year (the fiscal year ended March 31, 2021) of the management strategy announced in November 2019, and increased uncertainty in the business environment in the second year (the fiscal year ending March 31, 2022). As a result of discussions on the ratio of RSUs and PSUs of FY2022-LTI at the Compensation Committee, we set 40% of RSU and 60% of PSU.
Olympus Corporation (7733) Financial Results for the Three Months of the Fiscal Year Ending March 31, 2022
12
1) Subsequent grant-type restricted stock compensation: FY2022-RSU 1. Vesting
a. Three years after the payment, the rights will be vested after confirmation by the Compensation Committee. b. When retiring as an executive officer, the rights shall be vested after confirmation by the Compensation Committee six months after the retirement.
2. Grant date and number of units provided a. The grant date shall be April 1, 2021. b. The calculated stock price shall be the closing price of the Company’s common shares on the First Section of the Tokyo Stock Exchange on the business day prior to the grant date. c. For foreign exchange, apply TTM on the business day before the grant date. d. The total basic salary of executive officers, which is the basis for granting, is 324,983,375 yen, and the total number of units paid is 91,866 units.
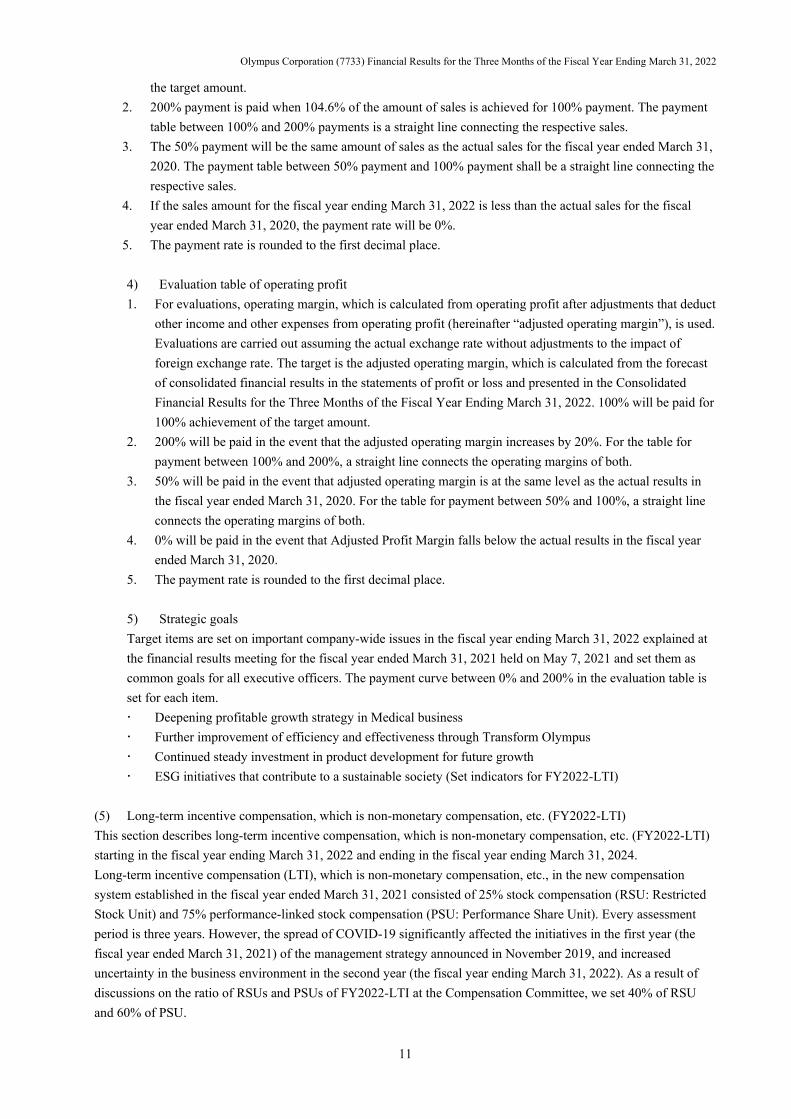
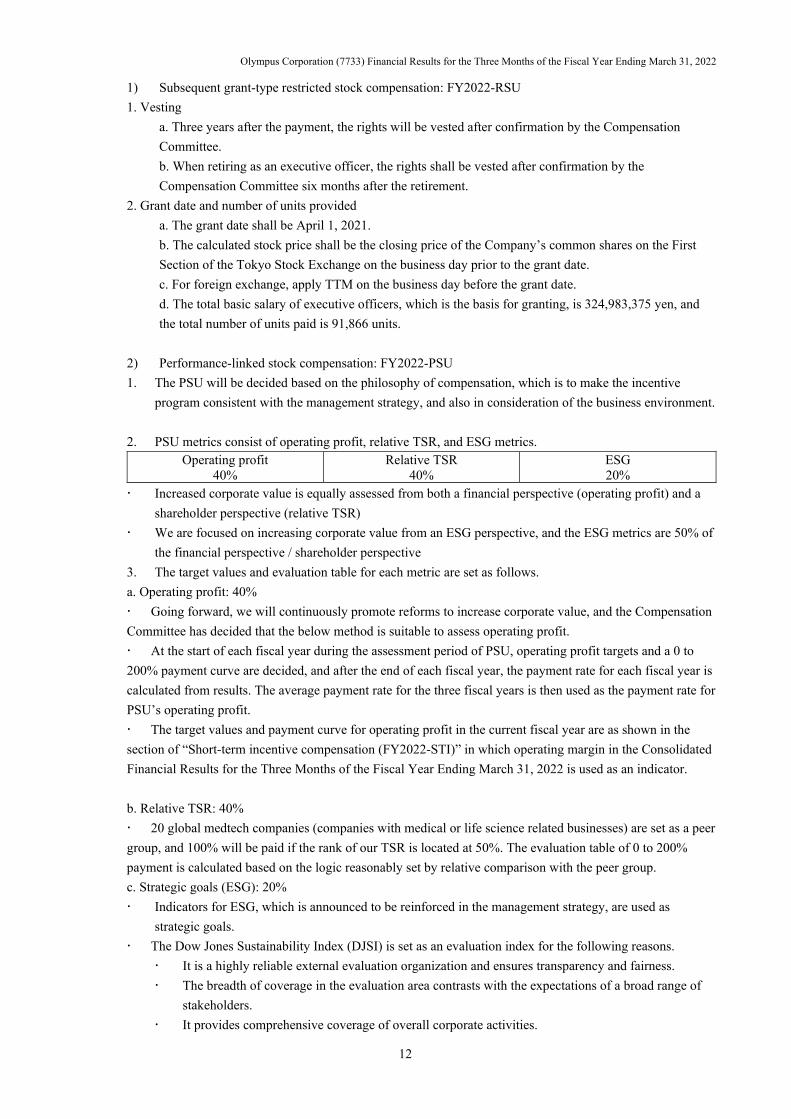
2) Performance-linked stock compensation: FY2022-PSU 1. The PSU will be decided based on the philosophy of compensation, which is to make the incentive
program consistent with the management strategy, and also in consideration of the business environment. 2. PSU metrics consist of operating profit, relative TSR, and ESG metrics.
Operating profit 40%
Relative TSR 40%
ESG 20%
Increased corporate value is equally assessed from both a financial perspective (operating profit) and a shareholder perspective (relative TSR)
We are focused on increasing corporate value from an ESG perspective, and the ESG metrics are 50% of the financial perspective / shareholder perspective
3. The target values and evaluation table for each metric are set as follows. a. Operating profit: 40% Going forward, we will continuously promote reforms to increase corporate value, and the Compensation Committee has decided that the below method is suitable to assess operating profit. At the start of each fiscal year during the assessment period of PSU, operating profit targets and a 0 to 200% payment curve are decided, and after the end of each fiscal year, the payment rate for each fiscal year is calculated from results. The average payment rate for the three fiscal years is then used as the payment rate for PSU’s operating profit. The target values and payment curve for operating profit in the current fiscal year are as shown in the section of “Short-term incentive compensation (FY2022-STI)” in which operating margin in the Consolidated Financial Results for the Three Months of the Fiscal Year Ending March 31, 2022 is used as an indicator. b. Relative TSR: 40% 20 global medtech companies (companies with medical or life science related businesses) are set as a peer group, and 100% will be paid if the rank of our TSR is located at 50%. The evaluation table of 0 to 200% payment is calculated based on the logic reasonably set by relative comparison with the peer group. c. Strategic goals (ESG): 20% Indicators for ESG, which is announced to be reinforced in the management strategy, are used as
strategic goals. The Dow Jones Sustainability Index (DJSI) is set as an evaluation index for the following reasons.
It is a highly reliable external evaluation organization and ensures transparency and fairness. The breadth of coverage in the evaluation area contrasts with the expectations of a broad range of
stakeholders. It provides comprehensive coverage of overall corporate activities.

Olympus Corporation (7733) Financial Results for the Three Months of the Fiscal Year Ending March 31, 2022
13
DJSI ratings are “World Index (W),” “Asia Pacific Index (AP),” and “Non-Index (N)” from the top ranks. Establish an assessment table that emphasizes Index to be acquired in the third year, considering the outcome in the first and second years, and decide payment rates of 200%, 150%, 100%, 50%, and 0%.
(6) Transformational FY22-RSU The Compensation Committee has decided to provide the following Transformational FY22-RSU apart from Long-term incentive compensation, which is non-monetary compensation, etc. (FY2022-LTI) in the above section. The Compensation Committee believes that providing appropriate compensation to executive officers responsible for management to be highly motivated in their efforts to achieve the management strategies and for the results they produce will lead to the subsequent maximization of corporate value and enhancement of shareholder value. A new management strategy announced in November 2019 replaces the 2016 Corporate Strategic Plan (“16CSP”) and has progressed significantly in line with the long-term direction of the Company. Performance-linked stock compensation, for which the evaluation period was the three-year period from the fiscal year ended March 31, 2019, to the fiscal year ended March 31, 2021, was set based on the 2016 Corporate Strategic Plan (“16CSP”) and was not provided because the actual value in the performance evaluation index fell below the minimum value. Considering the various reform themes being promoted in the business transformation plan “Transform Olympus” based on the management strategy, the one-time costs due to the transfer of the Imaging Business implemented in the fiscal year ended March 31, 2021, and the impact of the spread of COVID-19, etc. from the fiscal year ended March 31, 2020, and onward, although the actual value of the performance evaluation index fell below the performance target minimum value linked to officers’ compensation, the Compensation Committee has determined that the management efforts of executive officers have produced results that will lead into the fiscal year ending March 31, 2022, and onward. In light of the above results and management efforts of the executive officers, and in the midst of an uncertain business environment, the Company considered it necessary to provide effective compensation to the executive officers to encourage them to continue to strive to maximize corporate value and increase shareholder value in the fiscal year ending March 31, 2022, and onward, as well as to encourage them to hold shares in order to further strengthen the sharing of interests with shareholders. Therefore, the Compensation Committee, after consulting with “Pay Governance,” an independent compensation consultant, decided at the discretion of the Compensation Committee to grant the following “Transformational FY22-RSU” as subsequent grant-type restricted stock compensation. (1) Grantees CEO and CTO (2) Form of payment The unit grant date for “Transformational FY22-RSU” is April 1, 2021, and the rights will be vested three years later or upon retirement at the Company’s request. In the event of retirement that is not due to the Company’s request, the Compensation Committee will decide how to respond. (3) Units granted The standard amount for “Transformational FY22-RSU” is set at 18% of the basic compensation for the fiscal year ending March 31, 2022. The number of shares to be given will be calculated based on the share price on the business day prior to the grant date, and the number of shares will be given after vesting.
Olympus Corporation (7733) Financial Results for the Three Months of the Fiscal Year Ending March 31, 2022
14
2. Condensed Consolidated Financial Statements and Significant Notes Thereto
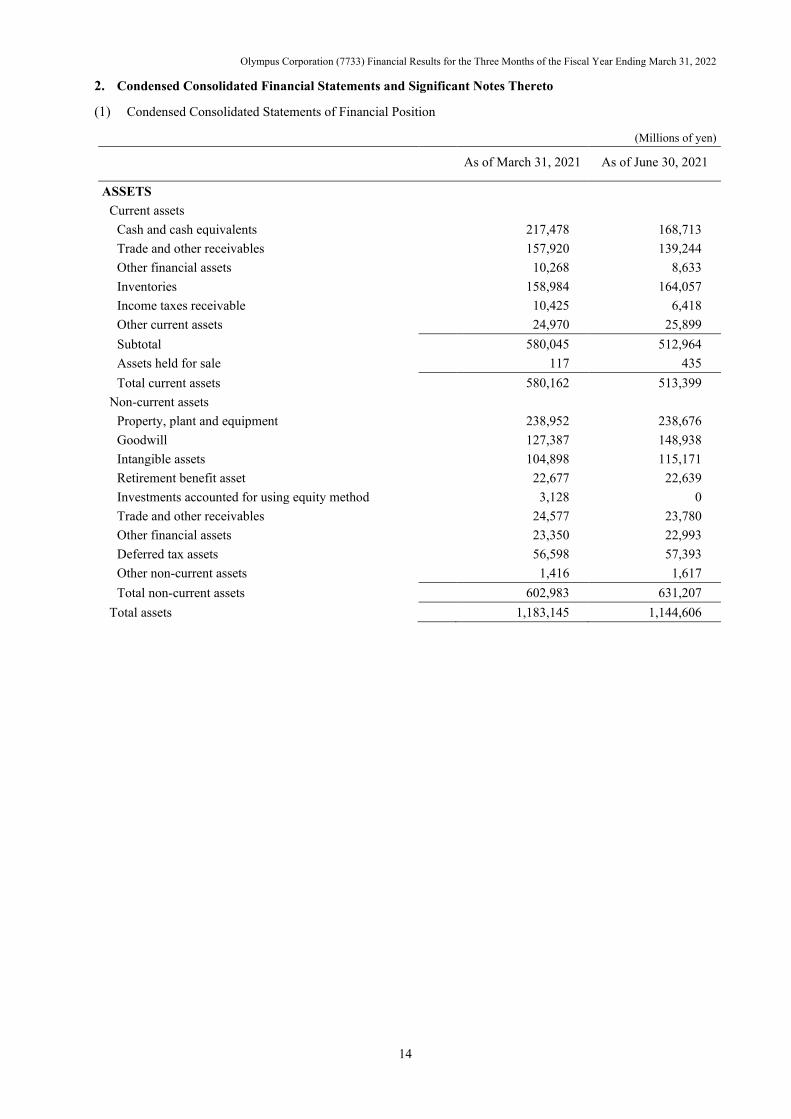
(1) Condensed Consolidated Statements of Financial Position
(Millions of yen)
As of March 31, 2021 As of June 30, 2021
ASSETS Current assets
Cash and cash equivalents 217,478 168,713 Trade and other receivables 157,920 139,244 Other financial assets 10,268 8,633 Inventories 158,984 164,057 Income taxes receivable 10,425 6,418 Other current assets 24,970 25,899 Subtotal 580,045 512,964 Assets held for sale 117 435 Total current assets 580,162 513,399
Non-current assets Property, plant and equipment 238,952 238,676 Goodwill 127,387 148,938 Intangible assets 104,898 115,171 Retirement benefit asset 22,677 22,639 Investments accounted for using equity method 3,128 0 Trade and other receivables 24,577 23,780 Other financial assets 23,350 22,993 Deferred tax assets 56,598 57,393 Other non-current assets 1,416 1,617 Total non-current assets 602,983 631,207
Total assets 1,183,145 1,144,606
Olympus Corporation (7733) Financial Results for the Three Months of the Fiscal Year Ending March 31, 2022
15
(Millions of yen)
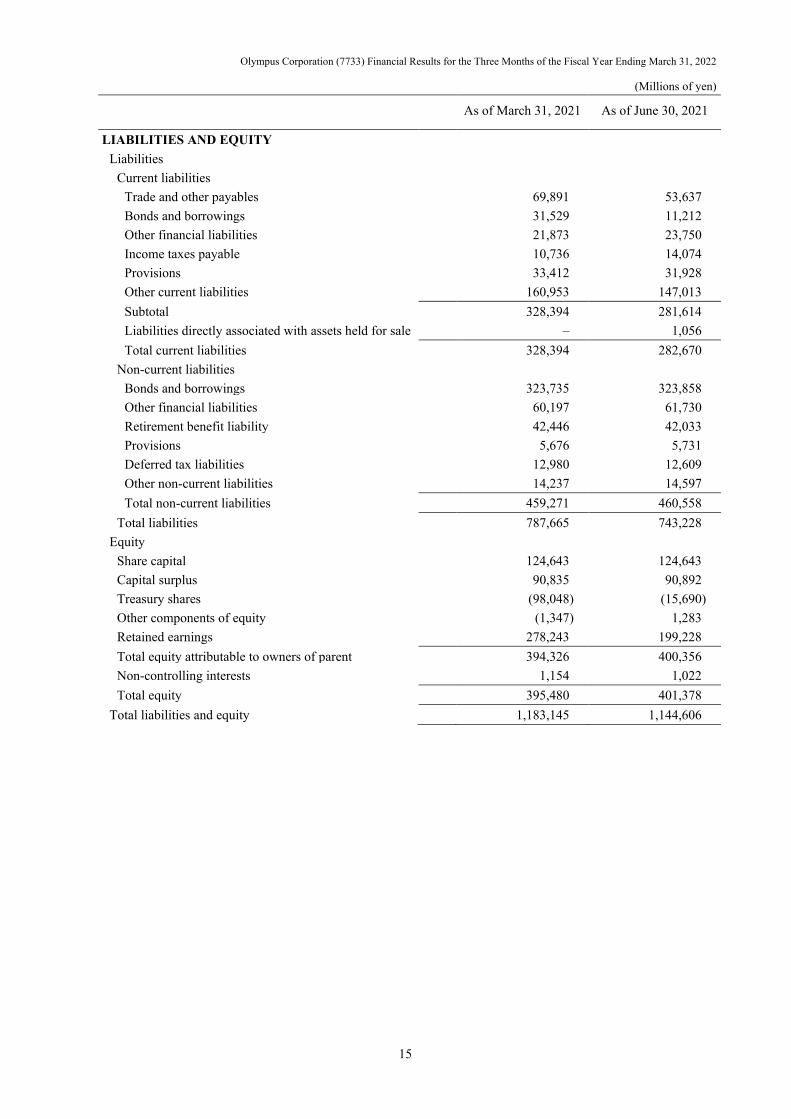
As of March 31, 2021 As of June 30, 2021
LIABILITIES AND EQUITY Liabilities
Current liabilities Trade and other payables 69,891 53,637 Bonds and borrowings 31,529 11,212 Other financial liabilities 21,873 23,750 Income taxes payable 10,736 14,074 Provisions 33,412 31,928 Other current liabilities 160,953 147,013 Subtotal 328,394 281,614 Liabilities directly associated with assets held for sale – 1,056 Total current liabilities 328,394 282,670
Non-current liabilities Bonds and borrowings 323,735 323,858 Other financial liabilities 60,197 61,730 Retirement benefit liability 42,446 42,033 Provisions 5,676 5,731 Deferred tax liabilities 12,980 12,609 Other non-current liabilities 14,237 14,597 Total non-current liabilities 459,271 460,558
Total liabilities 787,665 743,228 Equity
Share capital 124,643 124,643 Capital surplus 90,835 90,892 Treasury shares (98,048) (15,690) Other components of equity (1,347) 1,283 Retained earnings 278,243 199,228 Total equity attributable to owners of parent 394,326 400,356 Non-controlling interests 1,154 1,022 Total equity 395,480 401,378
Total liabilities and equity 1,183,145 1,144,606

Olympus Corporation (7733) Financial Results for the Three Months of the Fiscal Year Ending March 31, 2022
16
(2) Condensed Consolidated Statements of Profit or Loss
(Millions of yen)
Three months ended June 30, 2020
Three months ended June 30, 2021
Continuing operations Revenue 136,650 191,517 Cost of sales 51,398 68,201 Gross profit 85,252 123,316 Selling, general and administrative expenses 80,332 95,797 Share of profit (loss) of investments accounted for using equity method
28 35
Other income 900 5,402 Other expenses 2,139 5,344 Operating profit 3,709 27,612 Finance income 344 423 Finance costs 1,359 1,083 Profit before tax 2,694 26,952 Income taxes 2,868 8,206 Profit (loss) from continuing operations (174) 18,746
Discontinued operations Loss from discontinued operations (2,558) –
Profit (loss) (2,732) 18,746 Profit (loss) attributable to:
Owners of parent (2,736) 18,690 Non-controlling interests 4 56 Profit (loss) (2,732) 18,746
Earnings per share
Basic earnings (loss) per share Continuing operations ¥(0.14) ¥14.54 Discontinued operations ¥(1.99) ¥– Basic earnings per share ¥(2.13) ¥14.54
Diluted earnings (loss) per share Continuing operations ¥(0.14) ¥14.53 Discontinued operations ¥(1.99) ¥– Diluted earnings per share ¥(2.13) ¥14.53
Olympus Corporation (7733) Financial Results for the Three Months of the Fiscal Year Ending March 31, 2022
17
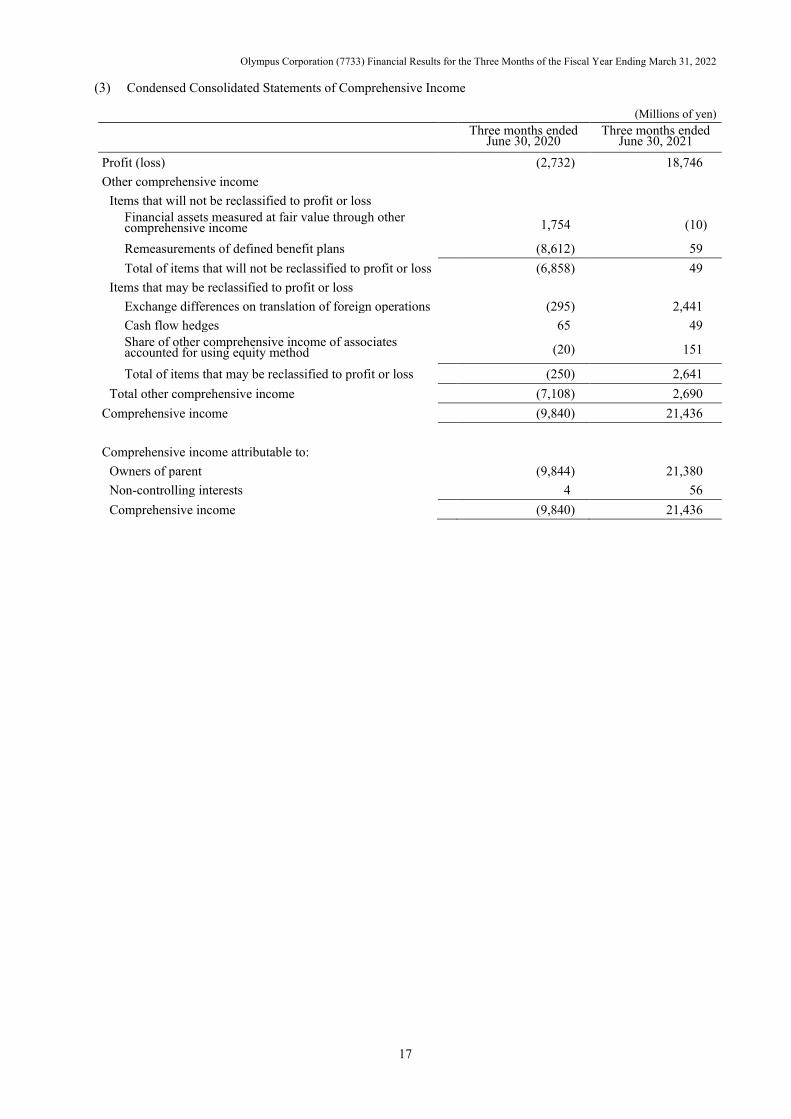
(3) Condensed Consolidated Statements of Comprehensive Income
(Millions of yen)
Three months ended June 30, 2020
Three months ended June 30, 2021
Profit (loss) (2,732) 18,746 Other comprehensive income
Items that will not be reclassified to profit or loss Financial assets measured at fair value through other comprehensive income 1,754 (10)
Remeasurements of defined benefit plans (8,612) 59 Total of items that will not be reclassified to profit or loss (6,858) 49
Items that may be reclassified to profit or loss Exchange differences on translation of foreign operations (295) 2,441 Cash flow hedges 65 49 Share of other comprehensive income of associates accounted for using equity method (20) 151
Total of items that may be reclassified to profit or loss (250) 2,641 Total other comprehensive income (7,108) 2,690
Comprehensive income (9,840) 21,436 Comprehensive income attributable to:
Owners of parent (9,844) 21,380 Non-controlling interests 4 56 Comprehensive income (9,840) 21,436

Olympus Corporation (7733) Financial Results for the Three Months of the Fiscal Year Ending March 31, 2022
18
(4) Condensed Consolidated Statements of Changes in Equity
Three months ended June 30, 2020
(Millions of yen)
Equity attributable to owners of parent Non-
controlling interests
Total equity Share capital Capital
surplus Treasury
shares
Other components
of equity
Retained earnings Total
Balance at April 1, 2020 124,643 91,157 (98,135) (22,751) 275,833 370,747 1,211 371,958 Profit (loss) (2,736) (2,736) 4 (2,732) Other comprehensive income (7,108) (7,108) (7,108)
Comprehensive income – – – (7,108) (2,736) (9,844) 4 (9,840) Disposal of treasury shares (24) 24 0 0 Dividends from surplus – (170) (170) Transfer from other components of equity to retained earnings
8,612 (8,612) – –
Share-based payment transactions 7 7 7
Total transactions with owners – (17) 24 8,612 (8,612) 7 (170) (163)
Balance at June 30, 2020 124,643 91,140 (98,111) (21,247) 264,485 360,910 1,045 361,955
Three months ended June 30, 2021
(Millions of yen)
Equity attributable to owners of parent Non-
controlling interests
Total equity Share capital Capital
surplus Treasury
shares
Other components
of equity
Retained earnings Total
Balance at April 1, 2021 124,643 90,835 (98,048) (1,347) 278,243 394,326 1,154 395,480 Profit (loss) 18,690 18,690 56 18,746 Other comprehensive income 2,690 2,690 2,690
Comprehensive income – – – 2,690 18,690 21,380 56 21,436 Purchase of treasury shares (0) (0) (0) Disposal of treasury shares (18) 18 0 0 Cancellation of treasury shares (82,340) 82,340 – –
Dividends from surplus (15,428) (15,428) (188) (15,616) Transfer from retained earnings to capital surplus 82,337 (82,337) – –
Transfer from other components of equity to retained earnings
(60) 60 – –
Share-based payment transactions 78 78 78
Total transactions with owners – 57 82,358 (60) (97,705) (15,350) (188) (15,538)
Balance at June 30, 2021 124,643 90,892 (15,690) 1,283 199,228 400,356 1,022 401,378
Olympus Corporation (7733) Financial Results for the Three Months of the Fiscal Year Ending March 31, 2022
19
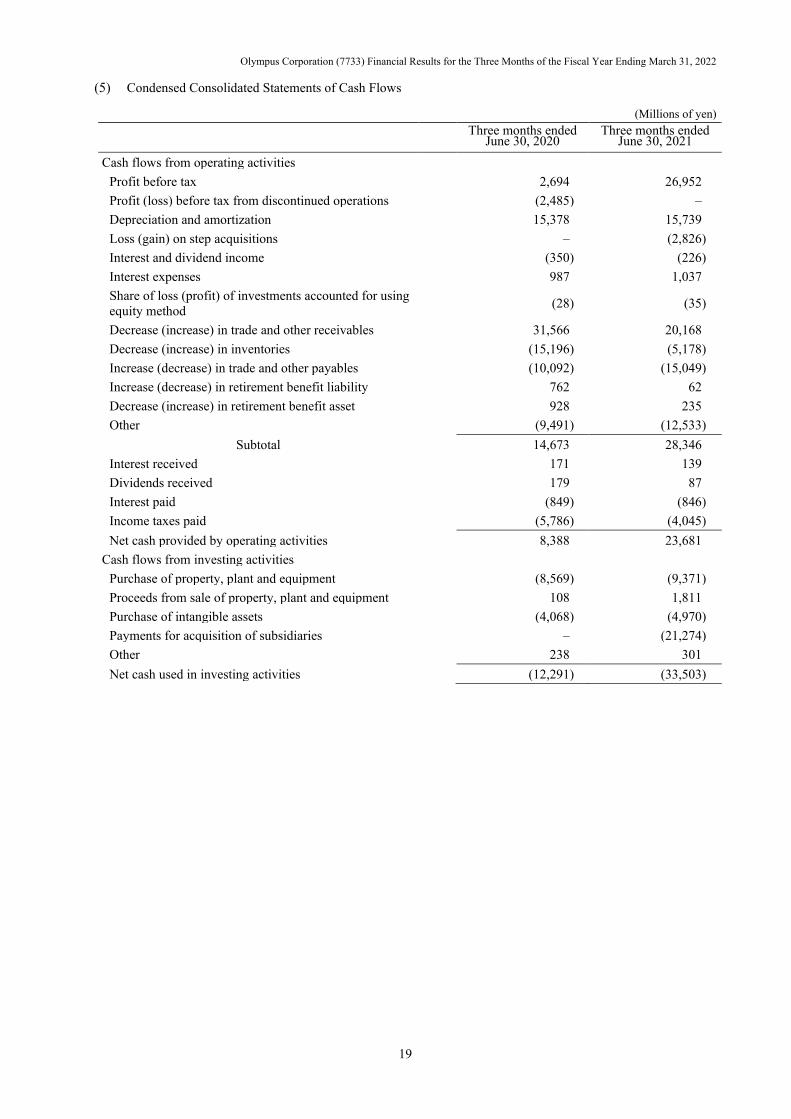
(5) Condensed Consolidated Statements of Cash Flows
(Millions of yen)
Three months ended June 30, 2020
Three months ended June 30, 2021
Cash flows from operating activities Profit before tax 2,694 26,952 Profit (loss) before tax from discontinued operations (2,485) – Depreciation and amortization 15,378 15,739 Loss (gain) on step acquisitions – (2,826) Interest and dividend income (350) (226) Interest expenses 987 1,037 Share of loss (profit) of investments accounted for using equity method (28) (35)
Decrease (increase) in trade and other receivables 31,566 20,168 Decrease (increase) in inventories (15,196) (5,178) Increase (decrease) in trade and other payables (10,092) (15,049) Increase (decrease) in retirement benefit liability 762 62 Decrease (increase) in retirement benefit asset 928 235 Other (9,491) (12,533)
Subtotal 14,673 28,346 Interest received 171 139 Dividends received 179 87 Interest paid (849) (846) Income taxes paid (5,786) (4,045) Net cash provided by operating activities 8,388 23,681
Cash flows from investing activities Purchase of property, plant and equipment (8,569) (9,371) Proceeds from sale of property, plant and equipment 108 1,811 Purchase of intangible assets (4,068) (4,970) Payments for acquisition of subsidiaries – (21,274) Other 238 301 Net cash used in investing activities (12,291) (33,503)
Olympus Corporation (7733) Financial Results for the Three Months of the Fiscal Year Ending March 31, 2022
20
(Millions of yen)
Three months ended June 30, 2020
Three months ended June 30, 2021
Cash flows from financing activities Net increase (decrease) in short-term borrowings and commercial papers 16,128 (5,263)
Repayments of lease liabilities (4,004) (4,131) Proceeds from long-term borrowings 99,180 Repayments of long-term borrowings – (15,002) Dividends paid – (15,428) Dividends paid to non-controlling interests (170) (188) Other 684 1,057 Net cash provided by (used in) financing activities 111,818 (38,955)
Effect of exchange rate changes on cash and cash equivalents 39 14
Net increase (decrease) in cash and cash equivalents 107,954 (48,763) Cash and cash equivalents at beginning of period 162,717 217,478 Cash and cash equivalents at end of period 270,671 168,715

Olympus Corporation (7733) Financial Results for the Three Months of the Fiscal Year Ending March 31, 2022
21
(6) Notes to Condensed Consolidated Financial Statements
(Notes on premise of going concern) No items to report
(Reporting entity) Olympus Corporation (hereinafter, the “Company”) is a joint stock company located in Japan. The address of its registered head office is Hachioji-shi, Tokyo. The Company’s condensed consolidated financial statements comprise the Company and its subsidiaries (hereinafter, the “Olympus Group”) and interests in the Company’s associates.
The Olympus Group is principally engaged in the manufacturing and sales of endoscopic, therapeutic and scientific, and other products. Details of each business are as described in Note “Segment information.”
(Basis of preparation) (1) Statement of the condensed consolidated financial statements’ compliance with IFRS
The condensed consolidated financial statements of the Olympus Group have been prepared in accordance with IAS 34. Since the requirements for “Specified Company of Designated International Accounting Standards” set forth in Article 1-2 of the “Regulation on Terminology, Forms, and Preparation Methods of Quarterly Consolidated Financial Statements” are satisfied, the Olympus Group adopts the provisions of Article 93 of the same Regulation. The condensed consolidated financial statements do not include all the information and disclosures required in the annual consolidated financial statements and should be used in conjunction with the Olympus Group’s annual consolidated financial statements as of March 31, 2021.
These condensed consolidated financial statements were approved by Director, Representative Executive Officer, President and CEO Yasuo Takeuchi, and Executive Officer and CFO Chikashi Takeda on August 5, 2021.
(2) Basis of measurement
The Olympus Group’s condensed consolidated financial statements have been prepared on an acquisition cost basis, except for specific financial instruments measured at fair value.
(3) Functional currency and presentation currency
The Olympus Group’s condensed consolidated financial statements are presented in Japanese yen, which is also the Company’s functional currency, and figures are rounded off to the nearest million yen.
(Significant accounting policies) The significant accounting policies adopted for the condensed consolidated financial statements of the Olympus Group for the three months ended June 30, 2021 are the same as those applied for the fiscal year ended March 31, 2021.
(Significant accounting estimates and associated judgments) In preparing IFRS-based consolidated financial statements, the management is required to make judgment, estimates and assumptions that affect the adoption of accounting policies and the amounts of assets, liabilities, revenues and expenses. Actual results may differ from such estimates.
The estimates and underlying assumptions are reviewed on an ongoing basis and the effect is recognized in the period in which the estimates are revised and in future periods.
The details of significant accounting estimates and associated judgments in the condensed consolidated financial statements are unchanged from the contents described in the consolidated financial statements for the previous fiscal year.
Although the impact of the spread of COVID-19 differs by region, the impact is currently expected to continue diminishing overall as vaccinations become available worldwide, and we have assumed that the Company’s sales activities will also begin to normalize.
Olympus Corporation (7733) Financial Results for the Three Months of the Fiscal Year Ending March 31, 2022
22
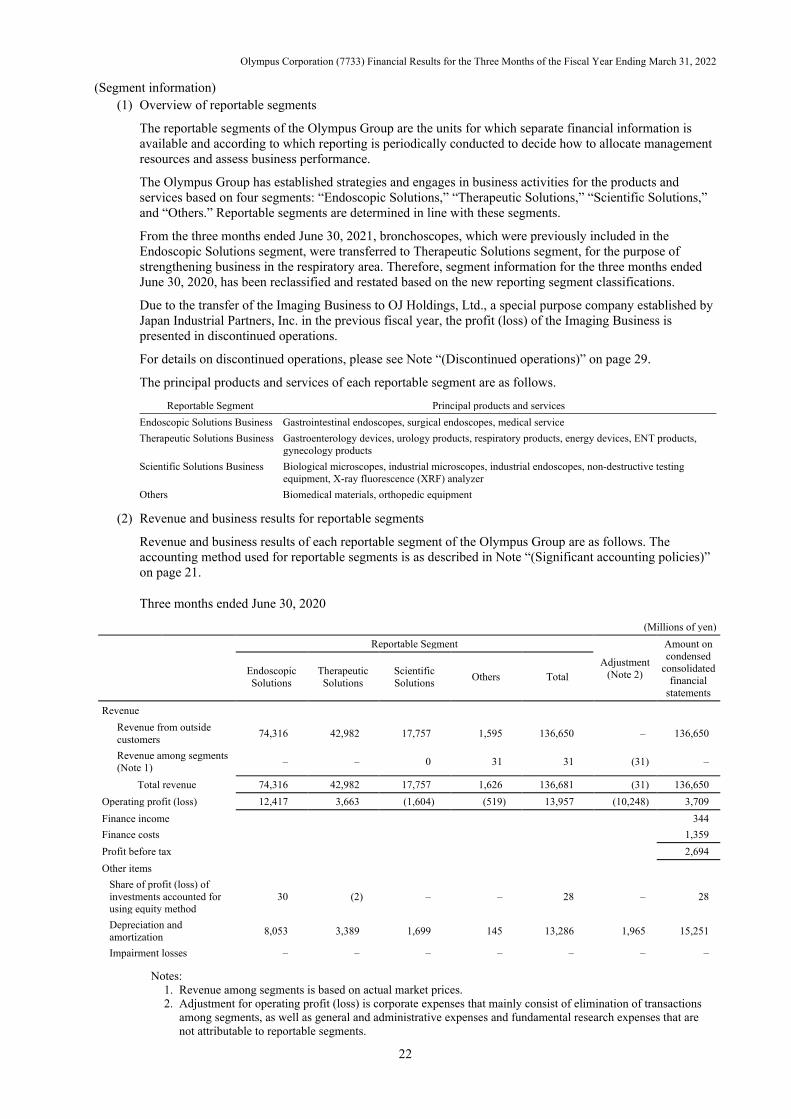
(Segment information) (1) Overview of reportable segments
The reportable segments of the Olympus Group are the units for which separate financial information is available and according to which reporting is periodically conducted to decide how to allocate management resources and assess business performance.
The Olympus Group has established strategies and engages in business activities for the products and services based on four segments: “Endoscopic Solutions,” “Therapeutic Solutions,” “Scientific Solutions,” and “Others.” Reportable segments are determined in line with these segments.
From the three months ended June 30, 2021, bronchoscopes, which were previously included in the Endoscopic Solutions segment, were transferred to Therapeutic Solutions segment, for the purpose of strengthening business in the respiratory area. Therefore, segment information for the three months ended June 30, 2020, has been reclassified and restated based on the new reporting segment classifications.
Due to the transfer of the Imaging Business to OJ Holdings, Ltd., a special purpose company established by Japan Industrial Partners, Inc. in the previous fiscal year, the profit (loss) of the Imaging Business is presented in discontinued operations.
For details on discontinued operations, please see Note “(Discontinued operations)” on page 29.
The principal products and services of each reportable segment are as follows.
Reportable Segment Principal products and services Endoscopic Solutions Business Gastrointestinal endoscopes, surgical endoscopes, medical service Therapeutic Solutions Business Gastroenterology devices, urology products, respiratory products, energy devices, ENT products,
gynecology products Scientific Solutions Business Biological microscopes, industrial microscopes, industrial endoscopes, non-destructive testing
equipment, X-ray fluorescence (XRF) analyzer Others Biomedical materials, orthopedic equipment
(2) Revenue and business results for reportable segments
Revenue and business results of each reportable segment of the Olympus Group are as follows. The accounting method used for reportable segments is as described in Note “(Significant accounting policies)” on page 21.
Three months ended June 30, 2020
(Millions of yen)
Reportable Segment
Adjustment (Note 2)
Amount on condensed
consolidated financial
statements
Endoscopic Solutions
Therapeutic Solutions
Scientific Solutions Others Total
Revenue Revenue from outside customers 74,316 42,982 17,757 1,595 136,650 – 136,650
Revenue among segments (Note 1) – – 0 31 31 (31) –
Total revenue 74,316 42,982 17,757 1,626 136,681 (31) 136,650 Operating profit (loss) 12,417 3,663 (1,604) (519) 13,957 (10,248) 3,709 Finance income 344 Finance costs 1,359 Profit before tax 2,694 Other items
Share of profit (loss) of investments accounted for using equity method
30 (2) – – 28 – 28
Depreciation and amortization 8,053 3,389 1,699 145 13,286 1,965 15,251
Impairment losses – – – – – – –
Notes: 1. Revenue among segments is based on actual market prices. 2. Adjustment for operating profit (loss) is corporate expenses that mainly consist of elimination of transactions
among segments, as well as general and administrative expenses and fundamental research expenses that are not attributable to reportable segments.
Olympus Corporation (7733) Financial Results for the Three Months of the Fiscal Year Ending March 31, 2022
23
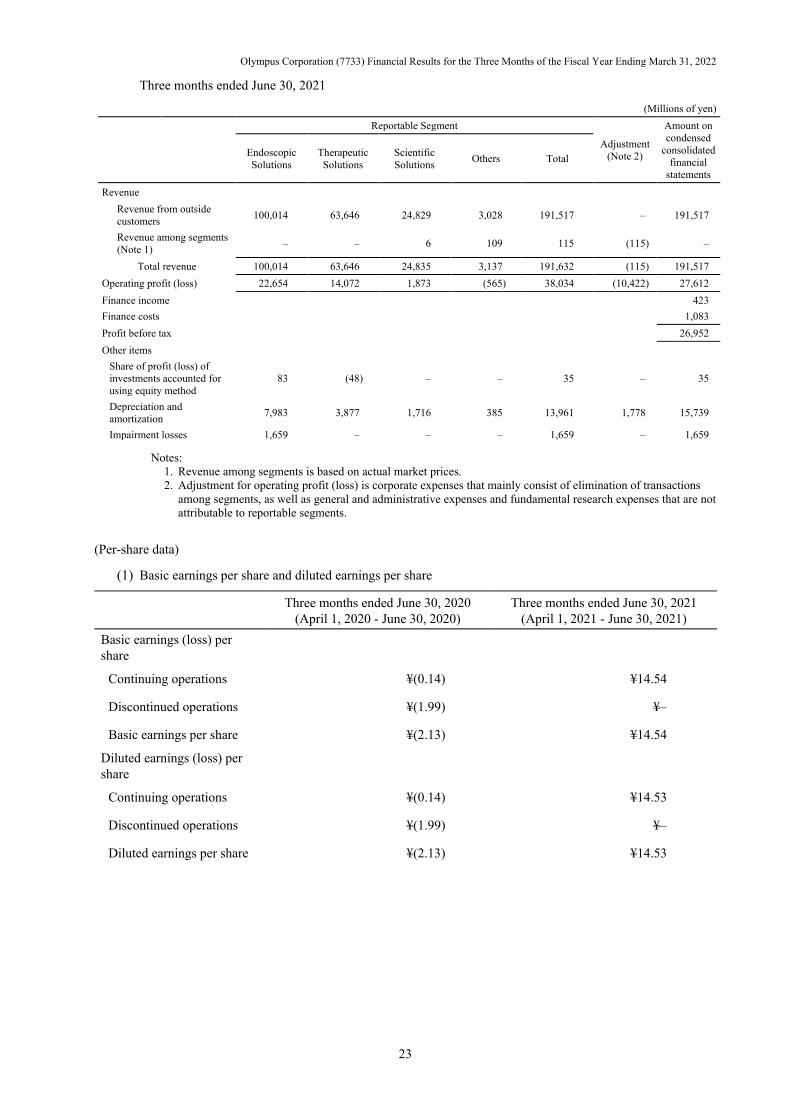
Three months ended June 30, 2021
(Millions of yen)
Reportable Segment
Adjustment (Note 2)
Amount on condensed
consolidated financial
statements
Endoscopic Solutions
Therapeutic Solutions
Scientific Solutions Others Total
Revenue Revenue from outside customers 100,014 63,646 24,829 3,028 191,517 – 191,517
Revenue among segments (Note 1) – – 6 109 115 (115) –
Total revenue 100,014 63,646 24,835 3,137 191,632 (115) 191,517 Operating profit (loss) 22,654 14,072 1,873 (565) 38,034 (10,422) 27,612 Finance income 423 Finance costs 1,083 Profit before tax 26,952 Other items
Share of profit (loss) of investments accounted for using equity method
83 (48) – – 35 – 35
Depreciation and amortization 7,983 3,877 1,716 385 13,961 1,778 15,739
Impairment losses 1,659 – – – 1,659 – 1,659
Notes: 1. Revenue among segments is based on actual market prices. 2. Adjustment for operating profit (loss) is corporate expenses that mainly consist of elimination of transactions
among segments, as well as general and administrative expenses and fundamental research expenses that are not attributable to reportable segments.
(Per-share data)
(1) Basic earnings per share and diluted earnings per share
Three months ended June 30, 2020 (April 1, 2020 - June 30, 2020)
Three months ended June 30, 2021 (April 1, 2021 - June 30, 2021)
Basic earnings (loss) per share
Continuing operations ¥(0.14) ¥14.54
Discontinued operations ¥(1.99) ¥–
Basic earnings per share ¥(2.13) ¥14.54
Diluted earnings (loss) per share
Continuing operations ¥(0.14) ¥14.53
Discontinued operations ¥(1.99) ¥–
Diluted earnings per share ¥(2.13) ¥14.53
Olympus Corporation (7733) Financial Results for the Three Months of the Fiscal Year Ending March 31, 2022
24
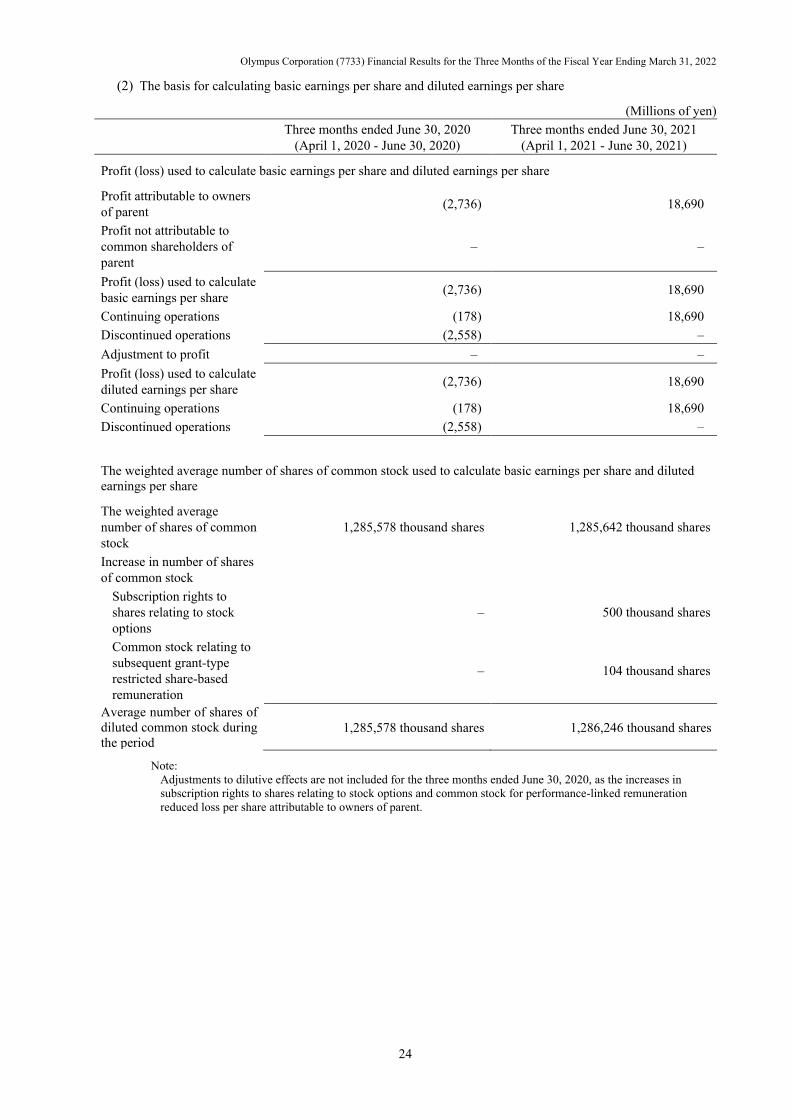
(2) The basis for calculating basic earnings per share and diluted earnings per share
(Millions of yen) Three months ended June 30, 2020
(April 1, 2020 - June 30, 2020) Three months ended June 30, 2021
(April 1, 2021 - June 30, 2021)
Profit (loss) used to calculate basic earnings per share and diluted earnings per share
Profit attributable to owners of parent (2,736) 18,690
Profit not attributable to common shareholders of parent
– –
Profit (loss) used to calculate basic earnings per share (2,736) 18,690
Continuing operations (178) 18,690 Discontinued operations (2,558) – Adjustment to profit – – Profit (loss) used to calculate diluted earnings per share (2,736) 18,690
Continuing operations (178) 18,690 Discontinued operations (2,558) –
The weighted average number of shares of common stock used to calculate basic earnings per share and diluted earnings per share
The weighted average number of shares of common stock
1,285,578 thousand shares 1,285,642 thousand shares
Increase in number of shares of common stock
Subscription rights to shares relating to stock options
– 500 thousand shares
Common stock relating to subsequent grant-type restricted share-based remuneration
– 104 thousand shares
Average number of shares of diluted common stock during the period
1,285,578 thousand shares 1,286,246 thousand shares
Note: Adjustments to dilutive effects are not included for the three months ended June 30, 2020, as the increases in subscription rights to shares relating to stock options and common stock for performance-linked remuneration reduced loss per share attributable to owners of parent.
Olympus Corporation (7733) Financial Results for the Three Months of the Fiscal Year Ending March 31, 2022
25
(Business combinations) Three months ended June 30, 2020 (April 1, 2020 - June 30, 2020)
No significant business combinations.
Three months ended June 30, 2021 (April 1, 2021 - June 30, 2021)
(Acquisition of Medi-Tate Ltd.)
(1) Outline of business combination
1) Name and description of acquired business
Name of acquired business Medi-Tate Ltd. (hereinafter “Medi-Tate”)
Description of business R&D and manufacturing of Therapeutic Solutions Business products
2) Primary reason for business combination
Medi-Tate is a medical device manufacturer that researches, develops, and manufactures minimally invasive therapeutic devices for benign prostatic hyperplasia (BPH). By adding Medi-Tate’s minimally invasive treatment device for BPH to our Olympus product portfolio, we will contribute to promoting the spread of minimally invasive treatment for diversifying prostate diseases and improving QOL for patients, thereby further strengthening our competitive position in the urology field.
3) Acquired ratio of holding capital with voting rights
100%
4) Acquisition date
May 27, 2021
5) Acquisition method to govern the acquired company
Just prior to the acquisition date, the Company owned 18.46% of Medi-Tate’s voting shares through its consolidated subsidiary Olympus Winter & Ibe GmbH, and it acquired an additional 81.54% for cash as consideration on the acquisition date through Olympus Winter & Ibe GmbH, making it a wholly owned subsidiary.
(2) Acquisition-related expense
The acquisition-related expense of ¥168 million has been booked in “Selling, general and administrative expenses.”
(3) Gain on step acquisition
As a result of revaluing the equity interest of the acquired company held just prior to the acquisition date at fair value on the acquisition date, we recognized a gain on step acquisition of ¥2,826 million. Gains on step acquisition are recorded in “Other income” in the condensed consolidated statements of profit or loss.
Olympus Corporation (7733) Financial Results for the Three Months of the Fiscal Year Ending March 31, 2022
26
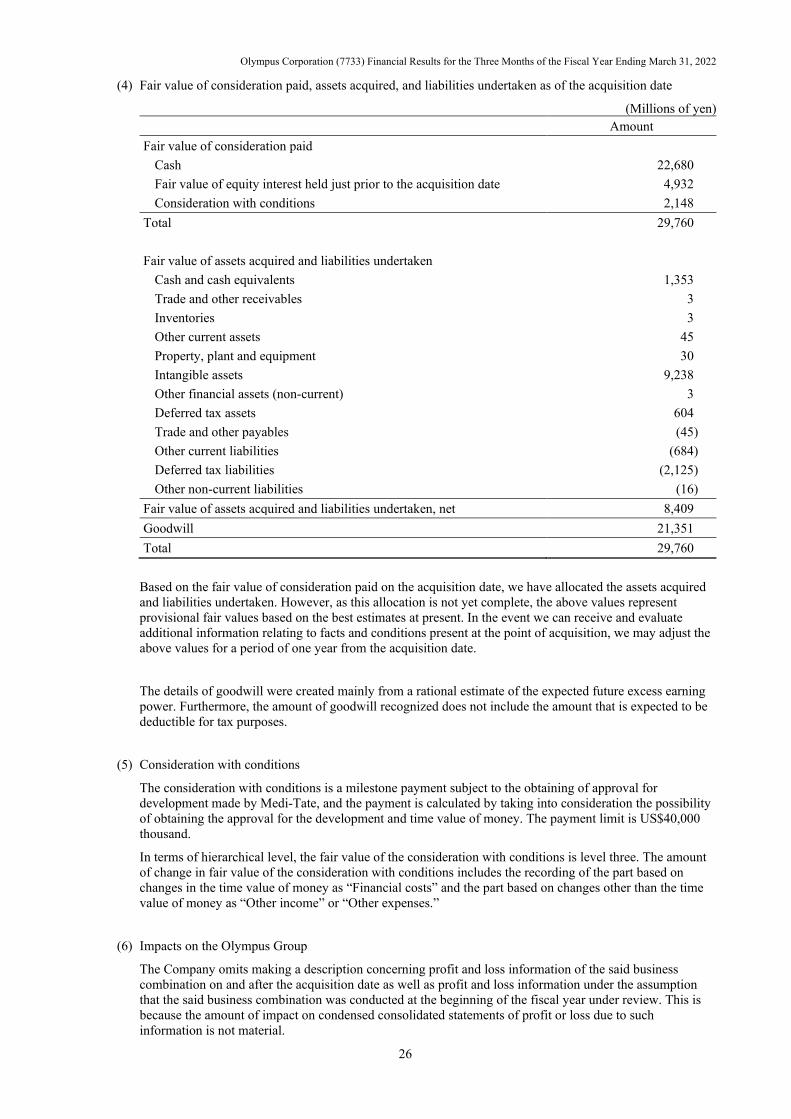
(4) Fair value of consideration paid, assets acquired, and liabilities undertaken as of the acquisition date
(Millions of yen) Amount
Fair value of consideration paid Cash 22,680 Fair value of equity interest held just prior to the acquisition date 4,932 Consideration with conditions 2,148
Total 29,760 Fair value of assets acquired and liabilities undertaken
Cash and cash equivalents 1,353 Trade and other receivables 3 Inventories 3 Other current assets 45 Property, plant and equipment 30 Intangible assets 9,238 Other financial assets (non-current) 3 Deferred tax assets 604 Trade and other payables (45) Other current liabilities (684) Deferred tax liabilities (2,125) Other non-current liabilities (16)
Fair value of assets acquired and liabilities undertaken, net 8,409 Goodwill 21,351 Total 29,760
Based on the fair value of consideration paid on the acquisition date, we have allocated the assets acquired and liabilities undertaken. However, as this allocation is not yet complete, the above values represent provisional fair values based on the best estimates at present. In the event we can receive and evaluate additional information relating to facts and conditions present at the point of acquisition, we may adjust the above values for a period of one year from the acquisition date.
The details of goodwill were created mainly from a rational estimate of the expected future excess earning power. Furthermore, the amount of goodwill recognized does not include the amount that is expected to be deductible for tax purposes.
(5) Consideration with conditions
The consideration with conditions is a milestone payment subject to the obtaining of approval for development made by Medi-Tate, and the payment is calculated by taking into consideration the possibility of obtaining the approval for the development and time value of money. The payment limit is US$40,000 thousand.
In terms of hierarchical level, the fair value of the consideration with conditions is level three. The amount of change in fair value of the consideration with conditions includes the recording of the part based on changes in the time value of money as “Financial costs” and the part based on changes other than the time value of money as “Other income” or “Other expenses.”
(6) Impacts on the Olympus Group
The Company omits making a description concerning profit and loss information of the said business combination on and after the acquisition date as well as profit and loss information under the assumption that the said business combination was conducted at the beginning of the fiscal year under review. This is because the amount of impact on condensed consolidated statements of profit or loss due to such information is not material.
Olympus Corporation (7733) Financial Results for the Three Months of the Fiscal Year Ending March 31, 2022
27
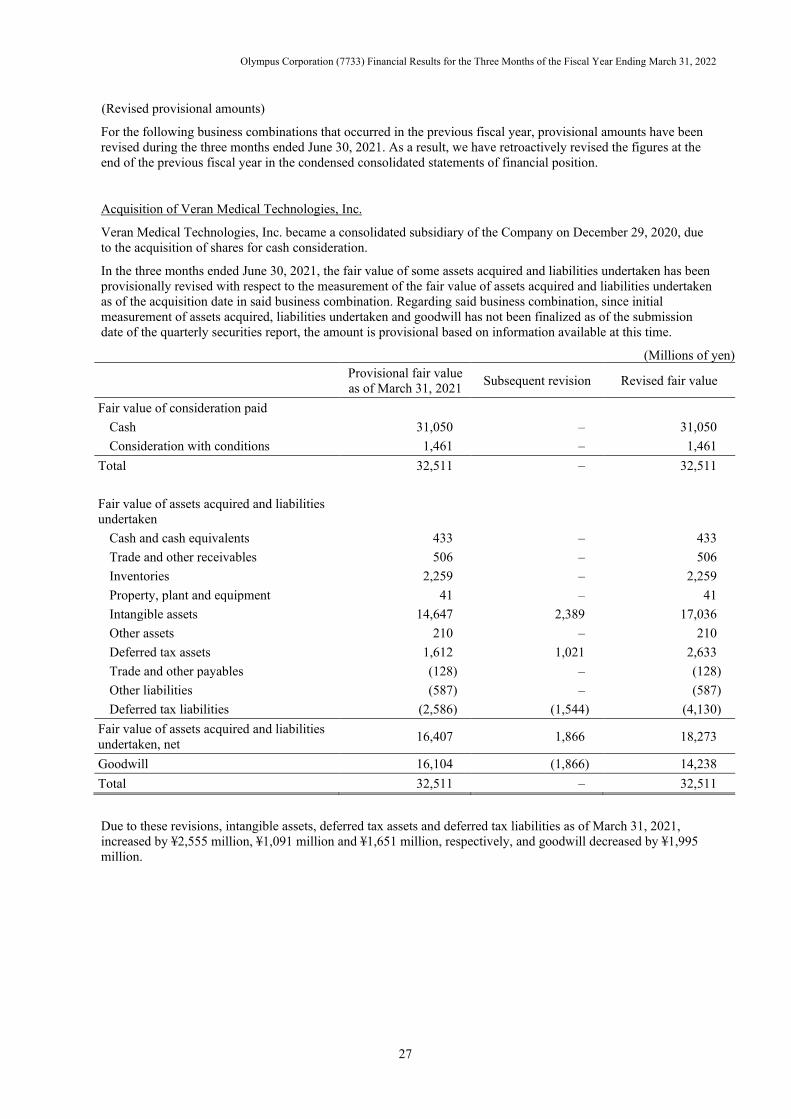
(Revised provisional amounts)
For the following business combinations that occurred in the previous fiscal year, provisional amounts have been revised during the three months ended June 30, 2021. As a result, we have retroactively revised the figures at the end of the previous fiscal year in the condensed consolidated statements of financial position.
Acquisition of Veran Medical Technologies, Inc.
Veran Medical Technologies, Inc. became a consolidated subsidiary of the Company on December 29, 2020, due to the acquisition of shares for cash consideration.
In the three months ended June 30, 2021, the fair value of some assets acquired and liabilities undertaken has been provisionally revised with respect to the measurement of the fair value of assets acquired and liabilities undertaken as of the acquisition date in said business combination. Regarding said business combination, since initial measurement of assets acquired, liabilities undertaken and goodwill has not been finalized as of the submission date of the quarterly securities report, the amount is provisional based on information available at this time.
(Millions of yen)
Provisional fair value as of March 31, 2021 Subsequent revision Revised fair value
Fair value of consideration paid Cash 31,050 – 31,050 Consideration with conditions 1,461 – 1,461
Total 32,511 – 32,511 Fair value of assets acquired and liabilities undertaken
Cash and cash equivalents 433 – 433 Trade and other receivables 506 – 506 Inventories 2,259 – 2,259 Property, plant and equipment 41 – 41 Intangible assets 14,647 2,389 17,036 Other assets 210 – 210 Deferred tax assets 1,612 1,021 2,633 Trade and other payables (128) – (128) Other liabilities (587) – (587) Deferred tax liabilities (2,586) (1,544) (4,130)
Fair value of assets acquired and liabilities undertaken, net 16,407 1,866 18,273
Goodwill 16,104 (1,866) 14,238 Total 32,511 – 32,511
Due to these revisions, intangible assets, deferred tax assets and deferred tax liabilities as of March 31, 2021, increased by ¥2,555 million, ¥1,091 million and ¥1,651 million, respectively, and goodwill decreased by ¥1,995 million.
Olympus Corporation (7733) Financial Results for the Three Months of the Fiscal Year Ending March 31, 2022
28
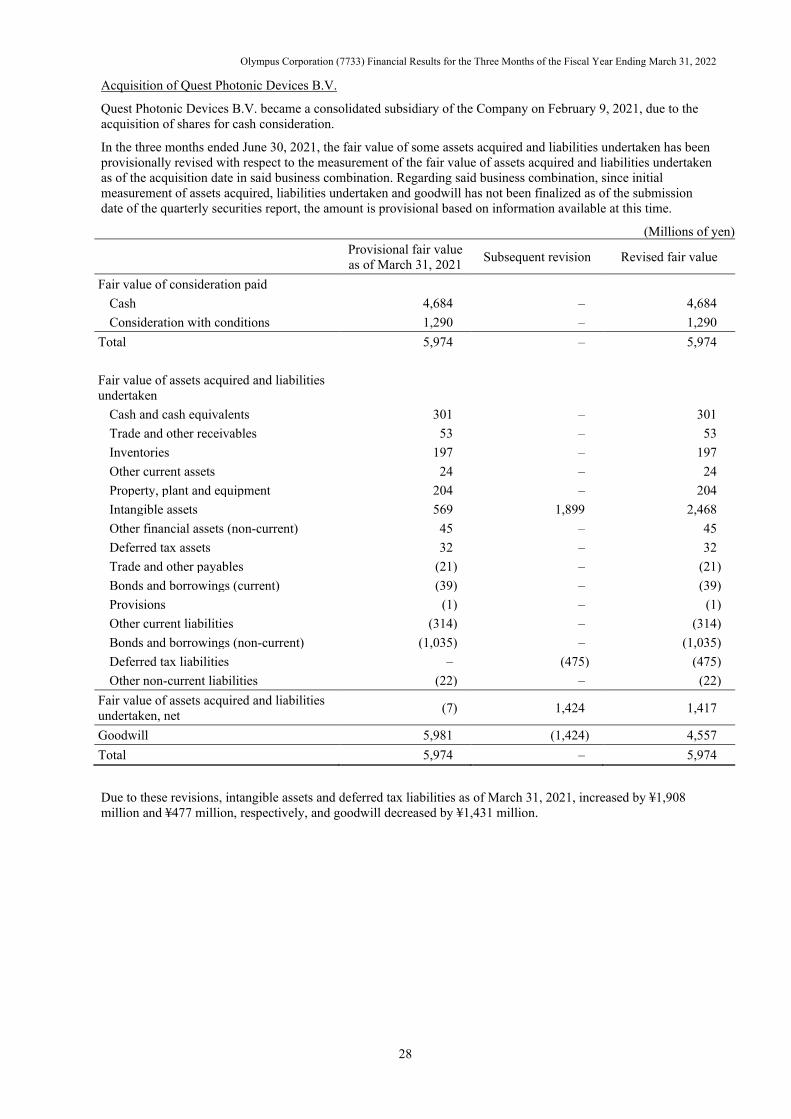
Acquisition of Quest Photonic Devices B.V.
Quest Photonic Devices B.V. became a consolidated subsidiary of the Company on February 9, 2021, due to the acquisition of shares for cash consideration.
In the three months ended June 30, 2021, the fair value of some assets acquired and liabilities undertaken has been provisionally revised with respect to the measurement of the fair value of assets acquired and liabilities undertaken as of the acquisition date in said business combination. Regarding said business combination, since initial measurement of assets acquired, liabilities undertaken and goodwill has not been finalized as of the submission date of the quarterly securities report, the amount is provisional based on information available at this time.
(Millions of yen)
Provisional fair value as of March 31, 2021 Subsequent revision Revised fair value
Fair value of consideration paid Cash 4,684 – 4,684 Consideration with conditions 1,290 – 1,290
Total 5,974 – 5,974 Fair value of assets acquired and liabilities undertaken
Cash and cash equivalents 301 – 301 Trade and other receivables 53 – 53 Inventories 197 – 197 Other current assets 24 – 24 Property, plant and equipment 204 – 204 Intangible assets 569 1,899 2,468 Other financial assets (non-current) 45 – 45 Deferred tax assets 32 – 32 Trade and other payables (21) – (21) Bonds and borrowings (current) (39) – (39) Provisions (1) – (1) Other current liabilities (314) – (314) Bonds and borrowings (non-current) (1,035) – (1,035) Deferred tax liabilities – (475) (475) Other non-current liabilities (22) – (22)
Fair value of assets acquired and liabilities undertaken, net (7) 1,424 1,417
Goodwill 5,981 (1,424) 4,557 Total 5,974 – 5,974
Due to these revisions, intangible assets and deferred tax liabilities as of March 31, 2021, increased by ¥1,908 million and ¥477 million, respectively, and goodwill decreased by ¥1,431 million.

Olympus Corporation (7733) Financial Results for the Three Months of the Fiscal Year Ending March 31, 2022
29
(Discontinued operations)
(1) Outline of discontinued operations
Due to the transfer of the Imaging Business to OJ Holdings, Ltd., a special purpose company established by Japan Industrial Partners, Inc. in the previous fiscal year, the profit (loss) of the Imaging Business is presented in discontinued operations.
(2) Profit (loss) of discontinued operations
Profit (loss) of discontinued operations is as follows.
(Millions of yen)
Three months ended
June 30, 2020 (April 1, 2020 - June
30, 2020)
Three months ended June 30, 2021
(April 1, 2021 - June 30, 2021)
Revenue 5,753 – Cost of sales 3,751 – Gross profit 2,002 – Selling, general and administrative expenses 4,302 – Share of profit (loss) of investments accounted for using equity method
– –
Other income 17 – Other expenses 236 – Operating loss (2,519) – Finance income 60 – Finance costs 26 – Loss before tax (2,485) – Income taxes 73 – Loss from discontinued operations (2,558) –
(3) Cash flows of discontinued operations
Cash flows of discontinued operations are as follows.
(Millions of yen)
Cash flows of discontinued operations Three months ended
June 30, 2020 (April 1, 2020 - June
30, 2020)
Three months ended June 30, 2021
(April 1, 2021 - June 30, 2021)
Net cash used in operating activities (693) – Net cash used in investing activities (440) – Net cash used in financing activities (12) –
Olympus Corporation (7733) Financial Results for the Three Months of the Fiscal Year Ending March 31, 2022
30
(Additional information)
(Cancellation of treasury shares)
Based on resolution of the Board of Directors meeting held on May 7, 2021, the Company canceled treasury shares on June 4, 2021. Due to this cancellation, treasury shares decreased by 71,620,630 shares during the three months ended June 30, 2021.
The impact of this cancellation is that treasury shares decreased by ¥82,340 million (contraction of negative stated amount in equity), and capital surplus decreased by ¥82,340 million.
The amount of the above cancellation was deducted from other capital surplus in capital surplus, but the amount that exceeds other capital surplus was deducted from retained earnings.
(Important subsequent events) No items to report