consolidated financial statements 2017 - … 170401 compte... · 04 /09 consolidated financial...
TRANSCRIPT

CONSOLIDATED FINANCIAL STATEMENTS 2017

04 /09 CONSOLIDATED FINANCIAL STATEMENTS
4 / CONSOLIDATED STATEMENT OF COMPREHENSIVE INCOME
6 / CONSOLIDATED STATEMENT OF FINANCIAL POSITION
8 / CONSOLIDATED CASH FLOW STATEMENT
9 / CONSOLIDATED STATEMENT OF CHANGES IN EQUITY
10 /42NOTES TO THE CONSOLIDATED FINANCIAL STATEMENTS
10 / 1. HIGHLIGHTS OF THE FISCAL YEAR
10 / 2. STANDARDS AND INTERPRETATIONS APPLIED
1 1 / 3. CONSOLIDATION METHODS
12 / 4. ACCOUNTING RULES AND POLICIES
12 / 5. FINANCIAL RISK FACTORS
13 / 6. SCOPE OF CONSOLIDATION
13 / 7. SUBSEQUENT EVENTS
14 / 8. NOTES TO THE CONSOLIDATEDFINANCIAL STATEMENTS 14 / 8.1. Goodwill 16 / 8.2. Change in Other intangible assets 18 / 8.3. Change in property, plant and equipment 20 /8.4. Investments in associates (equity-accounted) 22 / 8.5. Change in financial assets 23 / 8.6. Other non-current assets 23 / 8.7. Income tax and deferred tax 25 / 8.8. Inventories 25 / 8.9. Trade receivables 26 / 8.10. Other current assets 26 / 8.11. Additional information on construction contracts 26 / 8.12. Net cash 27 / 8.13. Working capital requirement 28 / 8.14. Net financial debt 29 / 8.15. Current and non-current provisions 30 / 8.16. End-of-career payments 31 / 8.17. Other current liabilities 32 / 8.18. Financial instruments 34 / 8.19. Income from operating activities 34 / 8.20. Other income from activities 34 / 8.21. External expenses 34 / 8.22. Other operating income and expense 34 / 8.23. Cost of net financial debt 34 / 8.24. Other financial income and expenses 34 / 8.25. EBITDA 35 / 8.26. Equity and Earnings per share 36 / 8.27. Related party transactions 36 / 8.28. Segment information 37 / 8.29. Off-balance sheet commitments 37 / 8.30. Headcount 37 / 8.31. Wages and social charges
CO
NT
EN
TS
/ CONSOLIDATED FINANCIAL STATEMENTS 2017 P 02 - 03

IN THOUSANDS OF EUROS Note 12/31/2017 12/31/2016
Income from operating activities 8.19 1,868,588 1,502,999
Other income from activities 8.20 40,168 47,243
Purchases consumed (325,734) (251,571)
Personnel costs 8.31 (494,863) (424,496)
External expenses 8.21 (957,420) (755,884)
Taxes and levies (21,947) (18,735)
Amortization expenses (75,501) (67,814)
Provisions 6,874 2,245
Change in work-in-progress and finished products inventories 719 713
Other revenue and expense from current operating activities 3,581 8,197
OPERATING INCOME FROM ORDINARY ACTIVITIES 44,465 42,897
% OF REVENUE 2.4% 2.9%
Other operating income and expense 8.22 (6,557) (6,231)
OPERATING INCOME 37,908 36,666
Income from cash and cash equivalents 63 161
Gross borrowing cost (10,148) (9,355)
Cost of net financial debt 8.23 (10,085) (9,194)
Other financial income and expenses 8.24 (8,281) (1,917)
Share in net income of associates 8.4 (185) (229)
Tax expense 8.7 4,619 (5,095)
NET INCOME 23,976 20,231
- Attribuable to owners of the parent 24,352 20,074
- Non-controlling interests (376) 155
EARNING PER SHARE ATTRIBUABLE TO COMPANY SHAREHOLDERS
Earnings per share - Basic 8.26 3.71 3.19
Earnings per share - Diluted 8.26 3.71 3.06
Consolidated Statementof comprehensive income
IN THOUSANDS OF EUROS Note 12/31/2017 12/31/2016
CONSOLIDATED NET INCOME 23,976 20,231
Other comprehensive income that may not be recycled subsequently to net income
Actuarial adjustments 8.16 112 998
Deferred tax on actuarial adjustments 8.7 (39) (344)
Convertible bonds coupon net of tax (676)
Other comprehensive income that may be recycled subsequently to net income
Fair value change on hedging instruments 8.18 1,140 1,050
Translation adjustment (494) (1,294)
Income tax on other comprehensive income 8.7 (393) (105)
NET INCOME AND GAINS AND LOSSES RECOGNIZED DIRECTLY IN EQUITY 24,302 19,860
Comprehensive income attribuable to owners of the parent 24,712 20,350
Comprehensive income attribuable to non-controlling interests (410) (492)
/ Rehabilitation of the Eiffel Bridge – St-André-de-Cubzac (24)
/ CONSOLIDATED FINANCIAL STATEMENTS 2017 P 04 - 05

IN THOUSANDS OF EUROS Note 12/31/2017 12/31/2016
Goodwill 8.1 293,442 257,025
Other intangible assets 8.2 2,809 3,298
Property, plant and equipment 8.3 417,170 348,927
Investments in associates 8.4 8,376 6,993
Available-for-sales financial assets 8.5 19,023 17,323
Other financial assets 8.5 37,374 39,047
Other non-current assets 8.6 8,777 8,607
Deferred tax assets 8.7 7,748 2,194
NON-CURRENT ASSETS 794,719 683,414
Inventories 8.8 27,847 20,887
Trades 8.9 675,648 567,425
Advance payments 7,499 6,662
Other current assets 8.10 147,526 111,302
Current tax assets 4,880 55
Cash and cash equivalents 8.12 193,290 210,785
CURRENT ASSETS 1,056,690 917,116
TOTAL ASSETS 1,851,409 1,600,530
IN THOUSANDS OF EUROS Note 12/31/2017 12/31/2016
Issued share capital 8.26 52,580 51,683
Premiums 22,648 14,487
Reserves 170,375 160,455
Net income for the period 24,352 20,074
SHAREHOLDER'S EQUITY 269,955 246,699
Non-controlling interests 12,022 4,850
TOTAL EQUITY 281,977 251,549
Other long-term borrowings and loans 8.14 305,254 257,330
Long-term provisions 8.15-8.16 93,123 73,916
Deferred tax liabilities 8.7 5,311 9,075
NON-CURRENT LIABILITIES 403,688 340,321
Current loans and borrowings 8.14 65,280 63,859
Bank overdrafts 8.12 125,795 94,736
Short-term provisions 8.15 - -
Advances and payments on account received 48,371 35,932
Trade payables 548,844 455,828
Other current liabilities 8.17 371,825 353,606
Current tax liabilities 5,629 4,699
CURRENT LIABILITIES 1 ,165,744 1,008,660
TOTAL EQUITY AND LIABILITIES 1,851,409 1,600,530
ASSETS EQUITY AND LIABILITIES
Consolidated statement of financial position
/ Improvement access to the Tancarville Bridge (76)
/ CONSOLIDATED FINANCIAL STATEMENTS 2017 P 06 - 07
IN THOUSANDS OF EUROS Note 12/31/2017 12/31/2016CONSOLIDATED NET INCOME 23,976 20,231
Net amortization, depreciation and provisions 76,928 66,429
Other operating income and expenses 919 (216)
Gains and losses on disposals 1,996 (1,394)
Share in net income of associates 8.4 185 229
Dividends collected (Unconsolidated companies and investments under Equity method) (73) (119)
NET CASH PROVIDED BY OPERATING ACTIVITIES AFTER TAX 103,931 85,160
Tax expense (included deferred taxes) 8.7 (4,619) 5,095
NET CASH PROVIDED BY OPERATING ACTIVITIES BEFORE TAX 99,312 90,255
Change of tax payable (2,662) (4,577)
Change in WCR from operations 8.13 (43,777) (10,240)
NET CASH FLOW FROM OPERATING ACTIVITIES 52,873 75,438
Disbursements related to acquisitions of property, plant and equipment and intagible assets 8.2 - 8.3 (99,478) (55,521)
Receipts related to disposals of property, plant and equipment and intagible assets 6,742 10,617
Change in financial assets 8.5 (4,723) (5,376)
Impact of changes in Group structure (14,026) (12,324)
Dividends collected (Unconsolidated companies and investments under Equity method) 152 185
Changes in loans and advances granted 5,268 325
Change in amounts due to non-current assets suppliers 8.13 5,141 (750)
NET CASH FLOW FROM INVESTMENT ACTIVITIES (100,924) (62,844)
Amounts received from shareholders for capital increases
Paid by the shareholders of the parent
Paid by non-controlling interests in consolidated companies
Dividends paid during the period
Dividends paid to shareholders of the parent (9,990) (9,988)
Dividends paid to non-controlling interests in consolidated companies (1,260) (1,668)
Receipts from new borrowings 194,138 69,334
Repayment of borrowings (182,108) (86,311)
NET CASH FLOW FROM FINANCING ACTIVITIES 780 (28,633)
Impact of exchange rate fluctuations (1,282) (1,271)
CHANGE IN NET CASH (48,553) (17,310)
CASH AND CASH EQUIVALENTS AT THE BEGINNING OF THE PERIOD 116,048 133,359
CASH AND CASH EQUIVALENTS AT THE END OF THE PERIOD 8.12 67,495 116,048
ATTRIBUABLE TO OWNERS OF HOLDING NGE NON-CONTROLLING INTERESTS
IN THOUSANDS OF EUROS
Number of shares Capital Premiums Reserves
Currency Translation Reserves
Net income for the period
Total Shareholder's
equityReserves
Currency Translation Reserves
Net income for the period
Total non-controlling
interestsTotal Equity
POSITION AT DECEMBER 31, 2015 6,262,377 50,099 71 176,990 141 18,055 245,355 7,714 78 410 8, 201 253,556
Allocation of net income for the period 2015 18,055 (18,055) - 410 (410) - -
Net income 20,074 20,074 155 155 20,229
Other items of comprehensive income 966 966 - 966
Change on share capital 198,020 1,584 14,416 16,000 - 16,000
Issuance, repayment and coupon on convertible bonds
(25,873) (25,873) - (25,873)
Dividends (9,998) (9,998) (1,668) (1,668) (11,666)
Gains (losses) on hedgind instruments 633 633 - 633
Translation adjustment (648) (648) (647) (647) (1 295)
Changes in Group structure 134 55 189 (1,134) (58) (1,192) (1,003)
POSITION AT DECEMBER 31, 2016 6,460,397 51,683 14,487 160,907 (452) 20,074 246,699 5,322 (627) 155 4,850 251,549
Allocation of net income for the period 2016 20,074 (20,074) - 155 (155) - -
Net income 24,352 24,352 (376) (376) 23,976
Other items of comprehensive income 73 73 - 73
Change on share capital 112,110 897 8,162 9,059 - 9,059
Dividends (9,990) (9,990) (1,251) (1,251) (11,241)
Gains (losses) on hedgind instruments 747 747 - 747
Translation adjustment (460) (460) (34) (34) (494)
Changes in Group structure (525) (525) 8,833 8,833 8,308
POSITION AT DECEMBER 31, 2017 6,572,507 52,580 22,648 171,287 (912) 24,352 269,955 13,059 (661) (376) 12,022 281,977
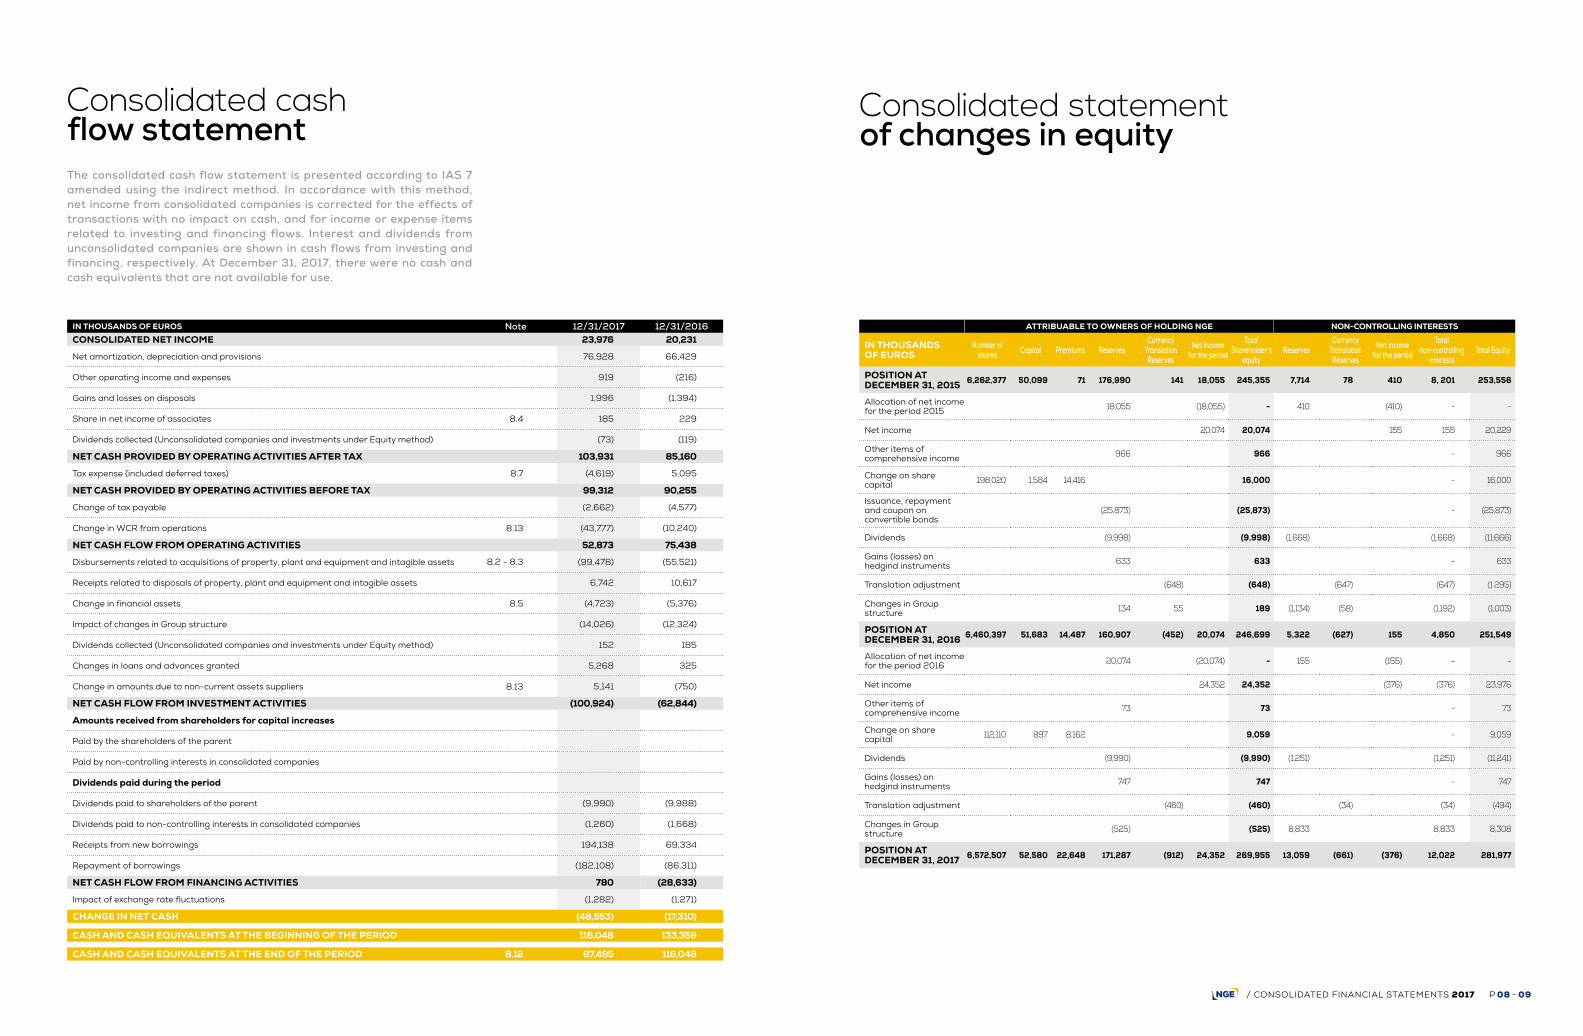
The consolidated cash flow statement is presented according to IAS 7 amended using the indirect method. In accordance with this method, net income from consolidated companies is corrected for the effects of transactions with no impact on cash, and for income or expense items related to investing and financing flows. Interest and dividends from unconsolidated companies are shown in cash flows from investing and financing, respectively. At December 31, 2017, there were no cash and cash equivalents that are not available for use.
Consolidated cash flow statement
Consolidated statement of changes in equity
/ CONSOLIDATED FINANCIAL STATEMENTS 2017 P 08 - 09

The consolidated financial statements at December 31, 2017, include NGE and its subsidiaries (together known as "the Group"), and the Group share in associates and joint arrangements. The NGE Group’s financial statements at December 31, 2017 set out the activity of the NGE Group over the period from January 1 to December 31, 2017 were closed by the President on April 06, 2018.
1. SIGNIFICANT EVENTS OF THE FISCAL YEAR
On January 17, the Group took control of the Dacquin Group, located in Rennes and specialized in deep foundations. Dacquin reinforces the NGE’s geotechnical works division. Under this acquisition, NGE realized a capital increase of 112,110 ordinary shares A, corresponding to an amount of 9.1 million euros.On May 19, the Group took control of the Vaglio Group, a major actor of aggregates production in the Great East area. The acquisitions conditions are detailed in note 6.1 of this rapport.The NGE capital is composed to 6,572,507 shares for an amount of 52,580,056 euros.
2. STANDARDS AND INTERPRETATIONS APPLIED
The Group’s consolidated financial statements for the periods ended December 31, 2016 and December 31, 2017 were prepared in accordance with IFRS (International Financial Reporting Standards) applicable at December 31, 2017, as adopted by the European Union and available on the website: http://ec.europa.eu/internal_market/accounting/ias_fr.htm. (Regulation No. 1606/2002 of the European Council dated July 19, 2002). The accounting principles retained for the preparation of the financial statements are based on the standards and interpretations adopted by the European Union and mandatory at January 1st, 2017.
2.1. New standards and interpretations effective at January 1st, 2017
There are no new standards and interpretations applicable as from January 1st, 2017 but the following amendments:
- Amendments to IAS 7 “Information about financing activities”;
- Amendments to IFRS 12 “Recognition of deferred tax assets for unrealized losses”;
The implementation of these amendments has no signi-ficant impact to the group level.
2.2. Standards adopted by the IASB that are not yet mandatory at December 31, 2017
NGE did not early-adopt any of the new standards and interpretations not mandatory as from January 1, 2017.- IFRS 15 "Revenue from Contracts with Customers- IFRS 9 “Financial Instruments, classification and measure-
ment”- IFRS 16 “Lease”
The Group is currently analyzing impacts of those standard’s application.
Regarding IFRS 15, the Group has analyzed current accounting methods with the new standard’s rules about revenue recognition. IFRS 15 will replace mostly currents standards as IAS 11 and IAS 18. This new standard, adopted by European Union on October 29, 2016 will be applied on January 1st, 2018. The Group has analyzed its type of contracts in its each divisions. The Group does not antici-pate a material effect related to this standard’s appli-cation.
Regarding IFRS 16, adopted by European Union on October 31, 2017 and applied on January 1st, 2019, the Group analyze its lease contracts. IFRS 16 will be replace IAS 17 and will cancel the distinction between “financial lease” and “operational lease”. All long-term contracts (more than one year) should be classified using the same method as financial lease in IAS 17. This standard will have a significant impact on financial position statement: in asset, there will be the right of use asset and in the liabilities a financial debt.
Regarding IFRS 9, the standard’s rules about classification, assessment and depreciation of financial instrument will be applied from January 1st, 2018.
3. CONSOLIDATION METHODS
3.1. Group structure and consolidation methodsThe Group’s consolidated financial statements are prepared at December 31, on the basis of the individual financial statements of the Group’s subsidiaries at this date, restated to comply with the Group’s standards. Additions to and withdrawals from the Group’s structure are recognized on the acquisition or disposal date or, for convenience where the impact is not significant, on the basis of the last balance sheet prior to the date of acquisition.
The following rules are used by the Group: According to the IFRS 10 "Consolidated Financial State-ments" for all aspects related to control and full consoli-dation, the concept of control is based on three criteria:- power over the entity, i.e. the ability to direct the activities
that significantly affect the entity's returns;- exposure to variable returns from the entity, which may
be positive, in the form of dividends or other economic benefit, or negative; and
- the link between its power over the entity and these returns, i.e. the ability to use its power over the entity to affect the amount of the investor's returns.
In practice, the Group is considered to control the compa-nies in which it directly or indirectly holds the majority of the voting rights in Shareholders' Meetings, on the Board of Directors or in equivalent governing bodies. These companies are fully consolidated. To determine control, the Group conducts an in-depth analysis of governance and the rights held by the other shareholders to verify that they are purely protective rights.As and when required, we also conduct an analysis of the instruments held by the Group or by third parties (potential voting rights, dilutive instruments and convertible instru-ments, amongst others), which if exercised, could change the type of influence exercised by each of the parties.In addition to assessing the governance in place with each partner, for some infrastructure project companies operating under concession agreements or under public- private partnership contracts in which NGE is not the only equity investor, NGE may also examine the features of the subcontracting agreements to verify that they do not confer additional powers that could lead to a situation of control.For the most part, these assessments concern building contracts and operation/maintenance contracts for the concession structures.We also carry out an assessment in the event of a specific event that may have an impact on the level of control exercised by the Group (change in the breakdown of the entity's capital or in its governance, exercise of a dilutive instrument, etc.).
According to IFRS 11 “Joint Arrangements“, joint control is established when decisions about the relevant activities require the unanimous consent of the parties sharing control.Joint arrangements are now classed into two categories (joint ventures and joint operations), according to the type of rights and obligations of each of the parties. Generally speaking, this classification is determined according to the legal form of vehicle used for the project.- A joint venture is a joint arrangement whereby the parties
(joint venturers) that have joint control of the entity and have rights to the net assets of the arrangement. Joint ventures are consolidated according to the equity method.
- A joint operation is a joint arrangement whereby the parties (joint operators) that have joint control of the arrangement have rights to the assets, and obligations for the liabilities, relating to the arrangement. Each joint operator must recognize its share of the assets, liabilities, income and expenditure in relation to its interest in the joint operation.
The majority of our joint arrangements are joint operations based on the legal form of the vehicle used, such as in France, where the parties generally establish a "société en participation" (SEP) (defacto partnership) as the legal framework for their operations. In some situations, where the facts and circumstances show that a company has been designed to provide production to the parties, it is regarded as a joint operation even where the vehicle’s legal form does not establish transparency between the joint operators’ assets and those of the joint arrangement. In that situation, the parties have the rights to substantially all of the economic benefits associated with the company’s assets, and will settle its liabilities. Within the Group, this concerns certain coating plants.According to IAS 28 R, Investments in Associate are companies on which the Group has a significant influence. They are consolidated using the Equity method.
Notes to the consolidated financial statements
/ CONSOLIDATED FINANCIAL STATEMENTS 2017 P 10 - 11

3.2. Intra-group operations Intra-group asset and liability or income and expense operations and transactions between consolidated compa-nies are eliminated from the consolidated financial state-ments. This elimination is:- in full where the operation is carried out between two
fully consolidated entities;- to the extent of interests held in the equity-accounted
company where an operation takes place between a fully consolidated entity and an equity-accounted entity.
3.3. Foreign currency transactions The accounts of foreign subsidiaries are kept in their functional currency.Balance sheets whose functional currency differs from the consolidation currency are translated into euros at the closing rate, except for equity, which is translated at historical cost.Translation differences on the balance sheet are recorded as translation adjustments in equity.The consolidated statement of comprehensive income is translated using the average rate over the period. Foreign currency transactions are translated into euros at the exchange rate in force on the date of the transaction. Resulting foreign exchange gains and losses are recognized in foreign exchange profit or loss and presented in other financial income and other financial expenses in the conso-lidated statement of comprehensive income.Foreign exchange gains and losses on borrowings denomi-nated in foreign currency or on derivative foreign exchange instruments which qualify as net investment hedges in subsidiaries are recorded as items of other comprehensive income and presented under translation reserve.Goodwill and fair value adjustment resulting from the acquisition of foreign subsidiaries are considered as the subsidiary’s assets and liabilities and accordingly are expressed in the subsidiary’s functional currency and translated at the closing rate.
4. ACCOUNTING RULES AND POLICIES Estimates and assumptions have been made in order to prepare the financial statements in accordance with IFRS. These estimates are continually reviewed on the basis of past experience, as well as other factors that are used in assessing the carrying amount of the assets and liabilities.
4.1. Presentation of the financial statementsThe Group presents its financial statements in accordance with IAS 1 and the IFRS framework, and based on recom-mendation No. 2013-03 dated November 7, 2013 of the ANC’s Board (Autorité des Normes Comptables) relating to the format of consolidated statements of comprehensive income, cash flow tables and consolidated statements of changes in equity. Accordingly, the following elements, in particular, should be noted:
- the statement of comprehensive income is presented by type of income and expense in order to best represent the type of activity carried out by the Group, including income from disposal of equipment, which forms part of the Group’s current activities;
- the Group’s main performance indicator is income from operating activities. It is calculated from operating income before taking into account estimated fair value of share-based payments, the impact of goodwill impairment tests and other operating income and expenses relating to the Group’s non-operating activities (disposal of activities, acquisition costs);
- net financial income/(loss) presents the Group’s cost of net financial debt and other financial income and expenses as separate items;
- the consolidated statement of financial position shows the breakdown of current and non-current assets and liabilities.
4.2. Significant assessments and estimatesThe preparation of the Group’s financial statements requires that the Executive Management makes use of assessments, estimates and assumptions which impact the amounts recognized in the financial statements as assets and liabilities and income and expenses, as well as the information provided on contingent liabilities.The development of factors underlying these estimates and assumptions, due to the uncertainty involved in such estimates and assumptions, could at a later date result in a significant adjustment to the amounts recognized in a subsequent period.The use of assessments and estimates is particularly signi-ficant in the following areas:
− accounting for contracts; − post-employment benefits; − provisions for risks (notably for termination losses and disputes); − recoverable amount of intangible assets and property, plant and equipment and notably goodwill; − deferred tax assets; − fair value of financial instruments.
5. FINANCIAL RISK FACTORS
5.1. Interest rate riskWith the exception of finance leases, which are fixed-rate, the Group’s debt is primarily at variable rates. The Group takes out hedging options to limit the risk of interest rate increases. Note 8.18 presents the share of debt subject to interest rate risk. Any increase in the level of interest rates would raise the cost of finance for the Group, which in turn would reduce its net financial income and net income and could slow its growth.
5.2. Currency riskThe majority of the Group’s subsidiaries exercise their activities in the euro zone. The Group’s exposure to currency risk is thus limited. Moreover, costs related to the execution of international contracts denominated in local currency other than the euro, are generally paid in this same local currency. Currency risks mainly concern the timing of cash flows during the execution of a contract (financing resources or working capital requirements), as well as translation into euros of overheads and the profit or loss generated by the said contract. The Group occasionally implements a strategy of hedging all or part of these cash flows in order to reduce its exposure to currency risk. A significant change in exchange rates could nevertheless affect the Group’s activities and earnings.
5.3. Liquidity riskLiquidity risk corresponds to the risk that the Group does not have sufficient net financial resources to meet its obligations and operating expenses.On November 21, 2013, the Group set up a five-year trade receivables securitization program of 60 million of euros, increased to 100 million of euros in 2016. This item is presented in Note 8.12.The Group has revolving credit lines of 100 million of euros, unused at December 31, 2017.NGE set up a program of Negotiable European Commer-cial Paper of 150 million of euros, amounting 10 million of euros at December 31, 2017.
5.4. Tax RiskSeveral consolidated companies are under a tax audit for fiscal year 2012, FY2013 and FY2014.At the closing date, tax adjustments preliminary notices were received in 2015 and 2016. Main items included in these notices were seriously contested.
5.5. Market RiskThe group is not exposed to financial market risk, cash surpluses being placed on earning accounts or term accounts.
5.6. Credit RiskThe risk of non-recovery of account receivables is limited, because the majority of Group activity is realized with operator of public service.
5.7. Risk of fluctuation in raw materialProcurement of works on which the Group operates are generally affected by a price adjustment clause backed by a national index that covers the risk of fluctuation in the price of raw materials. Occasionally, on important contracts and not indexed, the Group may need to use hedging contracts on raw materials which changes in price on markets may be significant.
6. SCOPE OF CONSOLIDATION
6.1. Changes in Group structure January 17, 2017, the Dacquin group acquisition was financed by a part paid in cash by the drawdown of the credit acquisition and another part paid with NGE shares. According to the rules of IFRS 3 revised, an assessment of fair value of asset and liabilities and deferred tax corres-ponding were done.The global acquisition cost is 27.8 million of euros and the provisional goodwill is 26.2 million of euros. The Group has took control of Vaglio group in May 2017. The acquisition cost is 2.8 million of euros. The provisional measurement of fair value of asset and liabilities was realized at December 31, 2017 and generating a goodwill at zero.
The Cardinal group goodwill, which was temporarily assessed at December 31, 2016, is now definitively deter-mined at 41.2 million of euros at December 31, 2017.
6.2. Scope of consolidationThe list of consolidated companies can be found on page 38.
7. SUBSEQUENT EVENTS
None.
/ CONSOLIDATED FINANCIAL STATEMENTS 2017 P 12 - 13

Badwill is recognized directly in profit or loss in the year of acquisition. Impairment of non-financial fixed assetsAssets subject to impairment testing are regrouped into cash-generating units (CGU) corresponding to groups of similar assets whose use generates identifiable cash in-flows.
The groups of cash-generating units are:• the Multi-expertise region;• the Specialized National Subsidiaries or a group of in-
tegrated subsidiaries when these exercise their activity outside the "Multi-expertise - Regional" organization;
• the Major Projects.
The recoverable amount of a cash-generating unit is the higher of the fair value (generally the market price), net of costs to sell, and the value in use. Value in use is estimated using the discounted free cash flow method based on the following two items: • Provisional cash flow with zero debt, i.e.: - Current operating income + amortization, - Change in working capital requirements, - Investment in new equipment, - Taxes;• Discount rate (opportunity cost of capital) determined
for each CGU group according to its activity and asso-ciated risk profile.
The use of post-tax rates results in recoverable amounts that are identical to those obtained by applying pre-tax rates to pre-tax cash flows.The assumptions used in these calculations, as in any estimates, include a certain amount of uncertainty and may therefore be adjusted subsequently during later periods.If the carrying amount of the cash-generating unit is higher than the recoverable amount, the cash-generating unit’s assets are impaired to bring them to their recoverable amount. Impairment is deducted in priority from goodwill and recorded in the consolidated statement of comprehen-sive income under other operating income and expense.Cash flows beyond five years are extrapolated using a growth rate estimated at 2%. Total cash flows are dis-counted using a discount rate of 6.5% corresponding to the Group’s weighted average cost of capital after tax.These calculations are based on a five-year forward plan prepared by the regional Management and reviewed by the Group’s Executive Management and Finance Department. A reasonably possible change in assumptions regarding impairment tests for each of the groups of CGUs would not lead to a goodwill impairment expense. The discount rate from which the Group would start to record an impairment loss (the break-even) is 8%.
8. SCOPE OF CONSOLIDATION
8.1. Business combinations and goodwillBusiness combinations are recognized in accordance with the provisions of IFRS 3 revised.In accordance with this revised standard, the Group recognizes the assets acquired and identifiable liabilities taken over at fair value on the date on which control is gained.Acquisition costs correspond to the fair value, on the exchange date, of the assets provided, outstanding liabi-lities and/or equity instruments issued in exchange for the entity acquired. Any price adjustments are measured at fair value at the end of each reporting period.Any subsequent change in this fair value after the acqui-sition date, as a result of events after the date on which control is acquired, is recognized in profit or loss.Costs which are directly attributable to the acquisition, such as due diligence fees, are recognized in expenses when they are incurred.The acquisition value is attributed by recording the assets acquired and identifiable liabilities at fair value, except for assets classified as held-for-sale pursuant to IFRS 5, which are recorded at fair value less cost of sale.The positive difference between the acquisition cost and the fair value of assets and identifiable liabilities acquired constitutes goodwill. Where appropriate, goodwill includes the share of fair value of non-controlling interests in accor-dance with the full goodwill method.The Group has 12 months from the acquisition date to finalize the recognition of operations relating to the compa-nies acquired.In the case of a business combination achieved in stages, the previously held interest in the company is measured at fair value at the date on which control is acquired. Any resulting profit or loss is recognized in profit or loss.In accordance with IAS 27 revised, acquisitions or dispo-sals of non-controlling interests without any change in control are considered to be transactions with the Group’s shareholders. This approach results in the diffe-rence between the price paid to increase the percentage interest in an entity already controlled and the additional share of equity thereby acquired being recorded in Group shareholders’ equity.Similarly, a reduction in the percentage interest held by the Group in an entity with no loss of control is treated from an accounting standpoint as a transaction between shareholders, with no impact on income. Goodwill relating to fully consolidated subsidiaries is recorded in assets in the consolidated balance sheet, under "Goodwill". Goodwill relating to companies consolidated under the equity method is included under "Investments in equity-accounted companies".
Goodwill is not amortized but is subject to impairment testing at least once a year and every time there is an indication of impairment. When impairment is found, the difference between the asset’s carrying amount and its recoverable value is recognized in profit or loss.
GROUPS OF CGU 12/31/2016 Impaiment Changes in Group structure
Translation adjustment Other 12/31/2017
Regional Multi-Expertises Activities 65,493 65,493
Multi-Expertise Major Projects 21,637 (180) 21,457
Specialist French Subsidiaries 169,895 36,597 206,492
TOTAL GOODWILL 257,025 - 36,597 (180) - 293,442
GROUPS OF CGU 12/31/2015 Impaiment Changes in Group structure
Translation adjustment Other 12/31/2016
Regional Multi-Expertises Activities 65,493 65,493
Multi-Expertise Major Projects 21,671 (34) 21,637
Specialist French Subsidiaries 136,927 32,968 169,895
TOTAL GOODWILL 224,091 - 32,968 (34) - 257,025
GROUPS OF CGU Discount rate2017 2016
Regional Multi-Expertises Activities 6.5% 6.5%
Multi-Expertise Major Projects 6.5% 6.5%
Specialist French Subsidiaries 6.5% 6.5%
/ Deep foundations – Chantier du Grand Paris
/ CONSOLIDATED FINANCIAL STATEMENTS 2017 P 14 - 15

8.2. Changes in Other intangibles assetsOther intangibles asset mainly include patents, licenses and IT software, as well as fixed-term quarrying rights.Other acquired intangible assets are recorded in the balance sheet at acquisition cost less, where appropriate, amortization and aggregate impairment losses.Quarrying rights are amortized over the period of excava-tion (the ratio of tonnage excavated during the fiscal year to the quarry’s total estimated excavation capacity over the operating period).Other intangible assets are amortized on a straight-line basis over their useful life.
GROSS AMOUNTS 12/31/2016Changes in Group structure
Increases Decreases Other movements
Translation adjustment 12/31/2017
Research and development expense 154 13 16 183
Concessions, patents and similar rights 3,118 16 367 (321) (1) 3,178
Other intangible assets 2,479 58 (163) 142 2,516
Intangible assets under construction and advances and payments on account 461 41 (131) 371
GROSS INTANGIBLE ASSETS 6,212 16 478 (484) 27 (1) 6,248
NET AMOUNTS 12/31/2016Changes in Group structure
Increases Decreases Other movements
Translation adjustment 12/31/2017
Research and development expense 68 3 16 86
Concessions, patents and similar rights 1,135 16 (465) (2) 683
Other intangible assets 1,635 (85) (1) 121 1,669
Intangible assets under construction and advances and payments on account 461 41 (131) 371
NET AMOUNTS 3,298 16 (507) (1) 4 - 2,809
AMORTIZATION AND PROVISIONS 12/31/2016Changes in Group structure
Increases Decreases Other movements
Translation adjustment 12/31/2017
Research and development expense 87 10 97
Concessions, patents and similar rights 1,983 832 (321) 2 (1) 2,495
Other intangible assets 844 143 (162) 21 847
AMORTIZATION AND PROVISIONS 2,914 - 985 (483) 23 (1) 3,439
FY 2017
GROSS AMOUNTS 12/31/2015Changes in Group structure
Increases Decreases Other movements
Translation adjustment 12/31/2016
Research and development expense 361 6 (213) 154
Concessions, patents and similar rights 3,052 86 146 (217) 52 3,118
Other intangible assets 2,001 39 439 2,479
Intangible assets under construction and advances and payments on account 866 52 59 (515) 461
GROSS INTANGIBLE ASSETS 6,280 138 250 (430) (24) - 6,212
NET AMOUNTS 12/31/2015Changes in Group structure
Increases Decreases Other movements
Translation adjustment 12/31/2016
Research and development expense 68 (1) 68
Concessions, patents and similar rights 1,490 86 (493) 52 1,135
Other intangible assets 1,294 (91) 431 1,635
Intangible assets under construction and advances and payments on account 866 52 59 (515) 461
NET AMOUNTS 3,718 138 (526) - (32) - 3,298
AMORTIZATION AND PROVISIONS 12/31/2015Changes in Group structure
Increases Decreases Other movements
Translation adjustment 12/31/2016
Research and development expense 293 7 (213) 87
Concessions, patents and similar rights 1,562 639 (217) 1,983
Other intangible assets 707 130 8 844
AMORTIZATION AND PROVISIONS 2,562 - 776 (430) 8 - 2,914
FY 2016
/ Geotechnical works – Dunkerque (59)
/ CONSOLIDATED FINANCIAL STATEMENTS 2017 P 16 - 17

8.3. Property, plant and equipmentProperty, plant and equipment are recorded at acquisition or production cost less aggregate depreciation and any impairment losses.Assets are subject to depreciation determined according to the actual useful life of the goods. The depreciable base is the purchase cost less, where appropriate, the final residual value of the goods. The residual value is the amount the Group would currently receive if the asset was already in the condition (age and wear) expected at the end of its useful life.
GROSS AMOUNTS 12/31/2015Changes in Group structure
Increases Decreases Other movements
Translation adjustment 12/31/2016
Land 36,499 1,639 438 (615) 273 10 38,244
Buildings 50,428 (526) 3,241 (391) 3,454 29 56,235
Industrial machinery and equipment 462,039 6,092 50,303 (32,977) 1,576 120 487,155
Other Property, plant and equipment 107,607 1,624 15,475 (9,609) (46) (13) 115,037
Property plant and equipment under construction and Advance payments on fixed assets
5,581 5 3,065 (4,959) 4 3,696
TOTAL GROSS AMOUNT 662,154 8,834 72,522 (43,592) 298 150 700,367
NET AMOUNTS 12/31/2015Changes in Group structure
Increases Decreases Other movements
Translation adjustment 12/31/2016
Land 31,889 1,639 (328) (615) 170 10 32,765
Buildings 31,049 (526) 94 (142) 3,454 24 33,953
Industrial machinery and equipment 226,830 6,092 3,177 (5,776) 1,579 62 231,967
Other Property, plant and equipment 46,825 1,624 (334) (1,506) (46) (17) 46,545
Property plant and equipment under construction and Advance payments on fixed assets
5,581 5 3,065 (4,959) 4 3,696
NET AMOUNTS 342,175 8,834 5,674 (8,039) 198 83 348,927
NET AMOUNTS 12/31/2015Changes in Group structure
Increases Decreases Translation adjustment and other 12/31/2016
TOTAL NET NON-CURRENT ASSETS 146,624 53 (3,264) (453) 173 143,134
AMORTIZATION AND PROVISIONS 12/31/2015Changes in Group structure
Increases Decreases Other movements
Translation adjustment 12/31/2016
Land 4,610 766 103 5,479
Buildings 19,379 3,147 (249) 5 22,282
Industrial machinery and equipment 235,209 47,126 (27,201) (3) 58 255,188
Other Property, plant and equipment 60,782 15,809 (8,103) 4 68,492
TOTAL AMORTIZATION AND PROVISIONS 319,980 - 66,848 (35,553) 100 67 351,441
Impact of finance lease adjustments (IAS 17) on property, plant and equipment.
FY 2016
The main useful lives adopted are:Buildings 15 - 40 yearsPublic works equipment 3 - 10 yearsTransportation equipment 3 - 5 yearsRailway equipment 8 - 30 yearsFittings 5 - 19 yearsOffice furniture and equipment 3 - 10 years
GROSS AMOUNTS 12/31/2016Changes in Group structure
Increases Decreases Other movements
Translation adjustment 12/31/2017
Land 38,244 21,180 434 (295) 29 (43) 59,549
Buildings 56,235 32 424 (1,618) 269 (140) 55,202
Industrial machinery and equipment 487,155 14,185 61,249 (46,759) 1,659 (1,282) 516,207
Other tangible assets 115,037 4,509 24,865 (12,493) (1) (123) 131,794
Property plant and equipment under construction and Advance payments on fixed assets
3,696 24 30,777 (2,034) (7) 32,456
TOTAL GROSS AMOUNT 700,367 39,930 117,749 (61,165) (78) (1,595) 795,208
NET AMOUNTS 12/31/2016Changes in Group structure
Increases Decreases Translation adjustment and other 12/31/2017
TOTAL NET NON-CURRENT ASSETS 143,134 5,544 (3,845) 881 (285) 145,431
NET AMOUNTS 12/31/2016Changes in Group structure
Increases Decreases Other movements
Translation adjustment 12/31/2017
Land 32,765 21,180 (1,703) (295) 12 (43) 51,916
Buildings 33,953 32 (2,819) (369) 269 (108) 30,958
Industrial machinery and equipment 231,967 14,185 8,503 (7,457) 1,679 (1,098) 247,779
Other Property, plant and equipment 46,545 4,509 8,292 (5,187) (21) (78) 54,060
Property plant and equipment under construction and Advance payments on fixed assets
3,696 24 30,777 (2,034) (7) 32,456
NET AMOUNTS 348,927 39,930 43,050 (13,308) (95) (1,334) 417,170
AMORTIZATION AND PROVISIONS 12/31/2016Changes in Group structure
Increases Decreases Other movements
Translation adjustment 12/31/2017
Land 5,479 2,137 17 7,633
Buildings 22,282 3,243 (1,249) (32) 24,244
Industrial machinery and equipment 255,188 52,746 (39,302) (20) (184) 268,428
Other Property, plant and equipment 68,492 16,573 (7,306) 20 (45) 77,734
TOTAL AMORTIZATION AND PROVISIONS 351 ,441 - 74,699 (47,857) 17 (261) 378,039
Impact of finance lease adjustments (IAS 17) on property, plant and equipment.
FY 2017
/ CONSOLIDATED FINANCIAL STATEMENTS 2017 P 18 - 19

8.4. Investments in associatesInvestments in companies in which the Group exercises significant influence (associates) are valued using the equity method: they are initially recorded at acquisition cost including, where appropriate, any goodwill released.Their carrying amount is then adjusted to take changes in the Group share of the net assets of these companies into account. The balance of this share appears in the balance sheet assets. Note that the shares of net negative positions of equity-accounted companies are presented in Other current provisions.Change over the fiscal year is shown in the consolidated statement of comprehensive income (Share in net income of associates).Where there is an indication of impairment, the recoverable amount is tested as described in Note 8.1.
12/31/2017Data on a 100% basis Revenue Operating
income Net income Equity % interest Share in net income
Equity attribuable to owners
of the parent
Atelier Pour La Maintenance Des Engins Mobiles - (43) (34) 1,099 17% (6) 189
Aude Recyclage 1,263 111 72 237 23% 17 55
Bergerac Matériaux et Valorisation 1,026 56 45 171 25% 11 43
Calcaires Du Biterrois 3,928 (100) (145) 1,829 50% (73) 914
Corrèze Enrobés 6,770 49 30 284 43% 13 59
H.P.R.T. 3,259 1,427 38 437 22% 8 197
LCA 571 14 3 114 50% 1 57
Les Carrières Des Puys 1,342 (80) (97) (110) 30% (29) (33)
Les Énergies de la Cité - - - 4 40% - 2
M.T.C. 230 31 16 17 39% 6 7
P2R 7,839 458 360 2,074 23% 83 538
Port Adhoc 6,680 1,114 62 11,604 28% 17 5,746
SAPAG - (36) (812) (807) 33% (269) (268)
SLE 607 22 21 524 39% 8 473
Société des Enrobés Clermontois 2,461 116 81 199 33% 27 398
TOTAL 35,977 3,140 (360) 17,676 (185) 8,376
NET AMOUNTS
AT 12/31/2015 4,710
Net income for the period 2016 (229)
Dividends paid (75)
Change in capital 2,175
Change in group structure 400
Other 12
AT 12/31/2016 6,993
Net income for the period 2017 (185)
Dividends paid (71)
Change in capital 1,650
Change in group structure (12)
Other
AT 12/31/2017 8,376
CHANGE IN INVESTMENTSIN ASSOCIATES IS AS FOLLOWS :
12/31/2016Data on a 100% basis Revenue Operating
income Net income Equity % interest Share in net income
Equity attribuable to owners
of the parent
Atelier Pour La Maintenance Des Engins Mobiles - (13) (13) 507 29% (4) 145
Aude Recyclage 263 97 63 189 23% 15 44
Bergerac Matériaux et Valorisation 154 (68) (77) 125 25% (19) 31
Calcaires Du Biterrois 3,422 (139) (259) 1,975 50% (129) 987
Corrèze Enrobés 7,758 66 46 320 43% 20 75
H.P.R.T. 3,247 1,442 35 429 22% 8 195
LCA 549 3 3 111 50% 1 56
Les Carrières Des Puys 1,093 (195) (215) (13) 30% (65) (4)
M.T.C. 157 7 - 1 39% - -
P2R 8,341 522 400 1,964 23% 92 513
Port Adhoc 3,147 (713) (703) 8,141 25% (173) 4,126
SAPAG - (16) (16) (33) 33% (5) (11)
SLE 589 36 24 503 39% 9 465
Société des Enrobés Clermontois 1,730 99 64 118 33% 21 371
TOTAL 30,451 1,128 (647) 14,336 (229) 6,993
/ Replacement of switches and crossings – Dourdan (91)
/ Nartuby rock works (83)
/ CONSOLIDATED FINANCIAL STATEMENTS 2017 P 20 - 21

8.5. Change of financial assets Non-current financial assets mainly include available-for-sale assets and receivables from investments, as well as deposit guarantees, loans and other financial receivables.• Available-for-sale assets:
Available-for-sale assets include the Group’s equity investments in non-consolidated companies. They are measured at fair value on the balance sheet date. Where their fair value cannot be reliably determined, they are recognized at acquisition cost. Factors taken into consi-deration to determine impairment are a reduction in the share of equity held and a significant and prolonged deterioration in expected profitability. Changes in the fair value of available-for-sale investments are recognized in equity and transferred to profit or loss in the event that they are derecognized;
8.6. Other non-current financial assetsNon-current assets includes refundable receivables taxes over one year. This includes the research tax credit and sponsorship non-deductible and non-refundable in 2018.FY 2017 CICE asset hold by NGE and its tax consoli-dated subsidiaries were totally sold without recourse for13.2 million of euros. In 2016 the sales of this receivables amounted to 9.2 million of euros.Therefore, these receivables have been cleared.
8.7. Income tax and deferred taxIn accordance with IAS 12, deferred taxation is recognized on the differences between the carrying amounts and the values for tax purposes of asset and liability items. They arise: • from temporary differences which occur when the carrying
amount of an asset or liability differs from its value for tax purposes. They are either:
- sources of future taxation (deferred tax liabilities): these include mainly income whose taxation is deferred;
- sources of future deductions (deferred tax assets): these concern mainly temporary non-deductible tax provisions;
• tax loss carry forwards (deferred tax assets). Deferred tax assets are recognized where it is likely that the company will be able to recover them due to the existence of a taxable profit expected during future periods.
GROSS AMOUNT 12/31/2016Changes in Group structure
Increases Decreases Other movements
Translation adjustment 12/31/2017
Available-for-sale assets 17,585 17 3,124 (1,328) (113) 19,285
Other financial assets 47,486 592 4,006 (9,274) 988 (14) 43,785
GROSS AMOUNT 65,071 609 7,130 (10,602) 875 (14) 63,070
PROVISIONS 12/31/2016Changes in Group structure
Increases Decreases Other movements
Translation adjustment 12/31/2017
Available-for-sale assets 262 262
Other financial assets 8,439 (2,028) 6,411
PROVISIONS 8,701 - - - (2,028) - 6,673
NET AMOUNTS 12/31/2016Changes in Group structure
Increases Decreases Other movements
Translation adjustment 12/31/2017
Available-for-sale assets 17,323 17 3,124 (1,328) (113) 19,023
Other financial assets 39,047 592 4,006 (9,274) 3,016 (14) 37,374
NET AMOUNTS 56,370 609 7,130 (10,602) 2,903 (14) 56,397
The carrying amount of deferred tax assets is reviewed at each balance sheet date and reduced when it is no longer likely that sufficient taxable profit will be available to enable the benefit from this deferred tax asset to be used in full or in part. Unrecognized deferred tax assets are assessed at each balance sheet date and recognized to the extent that it becomes likely that a future profit will enable them to be recovered.
Deferred tax balances are determined on the basis of the each company’s tax situation or of the global result for entities included in the scope of the tax integration and are presented in asset or liabilities according to the net position by fiscal entity.
Deferred taxes are recognized at the tax rate applicable expected on the period during the asset will be realized and the liability paid on the basis of tax rate adopted at the closing date. At December 31, 2017, the temporarily differences and carry back losses are recognised with rate voted by National Assembly according to the following schedule:
2018 .....................................................................................34.43%2019 .....................................................................................32.02%2020 ................................................................................... 28.92%2021 ......................................................................................27.37%2022 ....................................................................................25.83%
• Loans, deposits: Loans and deposits are recognized at amortized cost. Where applicable, they may be subject to an impair-ment provision. The impairment corresponds to the difference between the carrying amount and the recoverable amount and is recognized in profit or loss. The provision may be reversed if there is a favorable change in the recoverable amount;
• Derecognition of financial assets: A financial asset as defined by IAS 32 "Financial Instru-ments: Presentation" is derecognized from the balance sheet, in full or in part, when the Group no longer expects any future cash flows from it and transfers substantially all of the risks and rewards of ownership of the asset.
NET AMOUNTS 12/31/2017 12/31/2016Available-for-sale assets - Concessions and PPPs 12,006 10,846
Other financial assets -Concessions and PPPs 32,380 34,228
Investments in associates 5,683 4,311
TOTAL FINANCIAL ASSETS - CONCESSIONS AND PPPS 50,069 49,385
12/31/2017 12/31/2016
Consolidated net income 23,976 20,231
Income tax expenses 4 619 (5,095)
PRE-TAX NET INCOME 19,357 25,326
Theoretical tax rate in force 34.43% 34.43%
THEORETICAL TAX EXPENSE 6,665 8,719
Permanent differences (5,794) (4,942)
DTA not recognized 1,552 254
Share in net income of associates 64 79
Tax rate differences (4,795) (5,323)
Tax on dividend paid (2,311) 6,308
EFFECTIVE TAX EXPENSE (4,619) 5,095
EFFECTIVE TAX RATE -23.86% 20.12%
12/31/2017 12/31/2016
Current taxes (981) 5,871
Deferred taxes (3,638) (776)
TOTAL (4,619) 5,095
SUMMARY OF ASSETS RELATED TO CONCESSIONS AND PPPS
RECONCILIATION BETWEEN THE EFFECTIVE INCOME TAX EXPENSE AND THE THEORETICAL EXPENSE
INCOME TAX EXPENSE
/ CONSOLIDATED FINANCIAL STATEMENTS 2017 P 22 - 23

BALANCE AT 12/31/2017
Net balance
at January 1, 2017
Recognized in net income
Translation adjustment and other
Recognized in other items of
comprehensive income
Recognized directly in
Equity
Balance before
offsetting
Offsetting by fiscal sphere
Assets (Liabilities)
net tax
Temporary differences 12,956 504 (62) 490 13,889
Provisions 5,555 (2,746) (135) 7,544 10,218
Tax losses 15,384 7,208 5,581 28,173
IFC provisions 9,963 159 (39) 215 10,299
DEFERRED TAX ASSETS 43,859 5,126 (197) (39) 13,831 62,580 (54,832) 7,748
Fixed assets (46,919) (1,385) 131 (7,715) (55,888)
Provisions (4,146) (196) (4,342)
Intangible 22 (2) 20
Financial (480) 156 (324)
Financial Instruments 783 (393) 390
DEFERRED TAX LIABILITIES (50,740) (1,425) 129 (393) (7,715) (60,143) 54,832 (5,311)
NET TAX ASSETS (LIABILITIES) (6,881) 3,701 (67) (431) 6,116 2,437 - 2,437
BALANCE AT 12/31/2016
Net balance
at January 1, 2016
Recognized in net income
Translation adjustment and other
Recognized in other items of
comprehensive income
Recognized directly in
Equity
Balance before
offsetting
Offsetting by fiscal sphere
Assets (Liabilities)
net tax
Temporary differences 9,126 760 15 3,055 12,956
Provisions 6,986 (2,460) 37 992 5,555
Tax losses 12,082 2,793 509 15,384
IFC provisions 10,111 (393) (31) 276 9,963
DEFERRED TAX ASSETS 38,306 700 52 (31) 4,832 43,859 (41,664) 2,194
Fixed assets (48,013) 2,268 (33) (1,141) (46,919)
Provisions (1,730) (2,416) (4,146)
Intangible 21 1 22
Financial (699) 219 (480)
Financial Instruments 1,200 (417) 783
DEFERRED TAX LIABILITIES (49,221) 72 (33) (417) (1,141) (50,740) 41,664 (9,075)
NET TAX ASSETS (LIABILITIES) (10,915) 772 19 (449) 3,691 (6,881) - (6,881)
8.8. Inventories Inventories are valued at acquisition or production cost by company or at their net realizable value, if this is lower at each balance sheet date.
12/31/2016 Changes in Group structure Variation Translation
adjustment 12/31/2017
Raw materials and supplies 21,832 2,199 4,846 (127) 28,751
Total Gross amount 21,832 2,199 4,846 (127) 28,751
Raw materials and supplies (946) (1,175) 1,217 (904)
Total depreciation and impairment (946) (1,175) 1,217 - (904)
INVENTORIES 20,887 1,024 6,063 (127) 27,847
12/31/2017 12/31/2016
Trade receivables - gross amount 684,878 574,854
Impaiment (9,230) (7,429)
NET AMOUNTS 675,648 567,425
TOTAL Non yet due < 30 days 30<60 days 60<90 days 90<120 days >120 days
Trade receivables at 12/31/2017 675,648 517,247 73,850 23,473 10,433 13,022 37,623
Trade receivables at 12/31/2016 567,425 442,478 49,372 22,807 13,434 12,966 26,368
8.9. Trade receivablesTrade receivables are valued at nominal value after deduc-tion of provisions for possible recovery.For the accounting of long-term contracts (IAS 11), this item includes, in particular:
− Situations occurring as work is performed and accepted by the developer; − Future billing corresponding to work completed which has not been billed or accepted by the developer.
The schedule of trade receivables breaks down as follows:
INCOME TAX EXPENSE
INCOME TAX EXPENSE
FY2017
FY2016
12/31/2015 Changes in Group structure Variation Translation
adjustment 12/31/2016
Raw materials and supplies 23,604 1,688 (3,289) (171) 21,832
Total Gross amount 23,604 1,688 (3,289) (171) 21,832
Raw materials and supplies (960) (16) 30 (946)
Total depreciation and impairment (960) (16) 30 - (946)
INVENTORIES 22,644 1,672 (3,259) (171) 20,887
/ Improvement of Porsche road turns on the Le Mans circuit (72)
/ CONSOLIDATED FINANCIAL STATEMENTS 2017 P 24 - 25

8.12 Net cashCash and cash equivalents include bank current accounts and cash equivalents corresponding to short-term invest-ments with negligible risk of a change in value. Cash equivalents comprise in particular term accounts, earning accounts and deposit certificates with original maturities of less than three months.Marketable securities are valued at fair value in accor-dance with IAS 39 - Financial instruments. Changes in fair value are recorded in the consolidated statement of comprehensive income.Bank overdrafts are excluded from cash and presented in current borrowings.Net cash includes an amount in foreign currency (mainly US Dollar and British Pound) as 29.6 million of euros at December 31, 2017.Bank overdraft include trade receivables securitization program amounted to 100 million of euros at December 31, 2017, and 80 million of euros at December 31, 2016.
€ 12/31/2017 12/31/2016
State 90,353 75,872
Social charge receivable 2,832 3,883
Other receivables 46,386 23,094
Prepaid expenses 7,955 8,567
Impaiment (114)
OTHER CURRENT ASSETS 147,526 111,302
12/31/2017 12/31/2016
Amount of net income recorded from construction contracts in the fiscal year
1,868,588 1,502,999
From current contracts :
- Advances received on current contracts 48,371 35,932
- Reserves applied by customers 5,779 5,090
- Amounts due from customers 176,088 153,534
- Amounts due to customers 88,084 95,041
12/31/2017 12/31/2016
Investments 2,533 19,949
Cash 190,757 190,835
Cash and cash equivalents 193,290 210,785
Bank overdraft (including securitization) (125,795) (94,736)
Bank overdrafts (125,795) (94,736)
NET CASH IN THE BALANCE SHEET 67,495 116,048
8.11. Additional information on construction contracts
The Group recognizes income and expenses relating to construction contracts in accordance with the percentage of completion method defined by IAS 11 - Construction Contracts. For the Group, percentage of completion is generally deter-mined on the basis of physical progress or costs incurred. Where forecasts for the completion of work result in a deficit, a provision is recognized independently of the percentage of completion of the project, according to the best estimate of the projected loss after taking into account any rights to additional revenue or rights of recourse, to the extent that it is probable that such revenue will be received and can be reliably measured. Provisions for loss on completion are presented under liabilities in the balance sheet.Part payments received under construction contracts, before the corresponding work has been carried out, are recognized under balance sheet liabilities as advance payments received.Revenue determined using the percentage of completion method is based on the estimation of costs upon completion of a contract. This estimation may be adjusted in subse-quent periods and may lead to adjustments in revenue and, potentially, to provisions for loss or completion.
8.13 Working capital requirement
FLOW
12/31/2017 12/31/2016Provided by
operating activities
Non-current asset suppliers
Changes in group structure and other
Inventories 27,847 20,887 (5,639) (1,321)
Trades 675,648 567,425 (85,514) (22,709)
Other assets 155,025 117,965 (25,703) (11,357)
ASSETS 858,520 706,277 (116,856) - (35,387)
Trade payables 548,844 455,828 68,904 5,141 18,971
Other liabilities 420,196 389,538 4,175 26,483
LIABILITIES 969,040 845,366 73,079 5,141 45,454WORKING CAPITAL (REQUIREMENT)/SURPLUS 110, 520 139,089 (43,777) 5,141 10,067
8.10. Other current assets
/ Highway duplication, A9 – Montpellier (34)
/ Construction of the Grande Chaloupe viaduct , Nouvelle Route du Littoral – Réunion island
/ CONSOLIDATED FINANCIAL STATEMENTS 2017 P 26 - 27
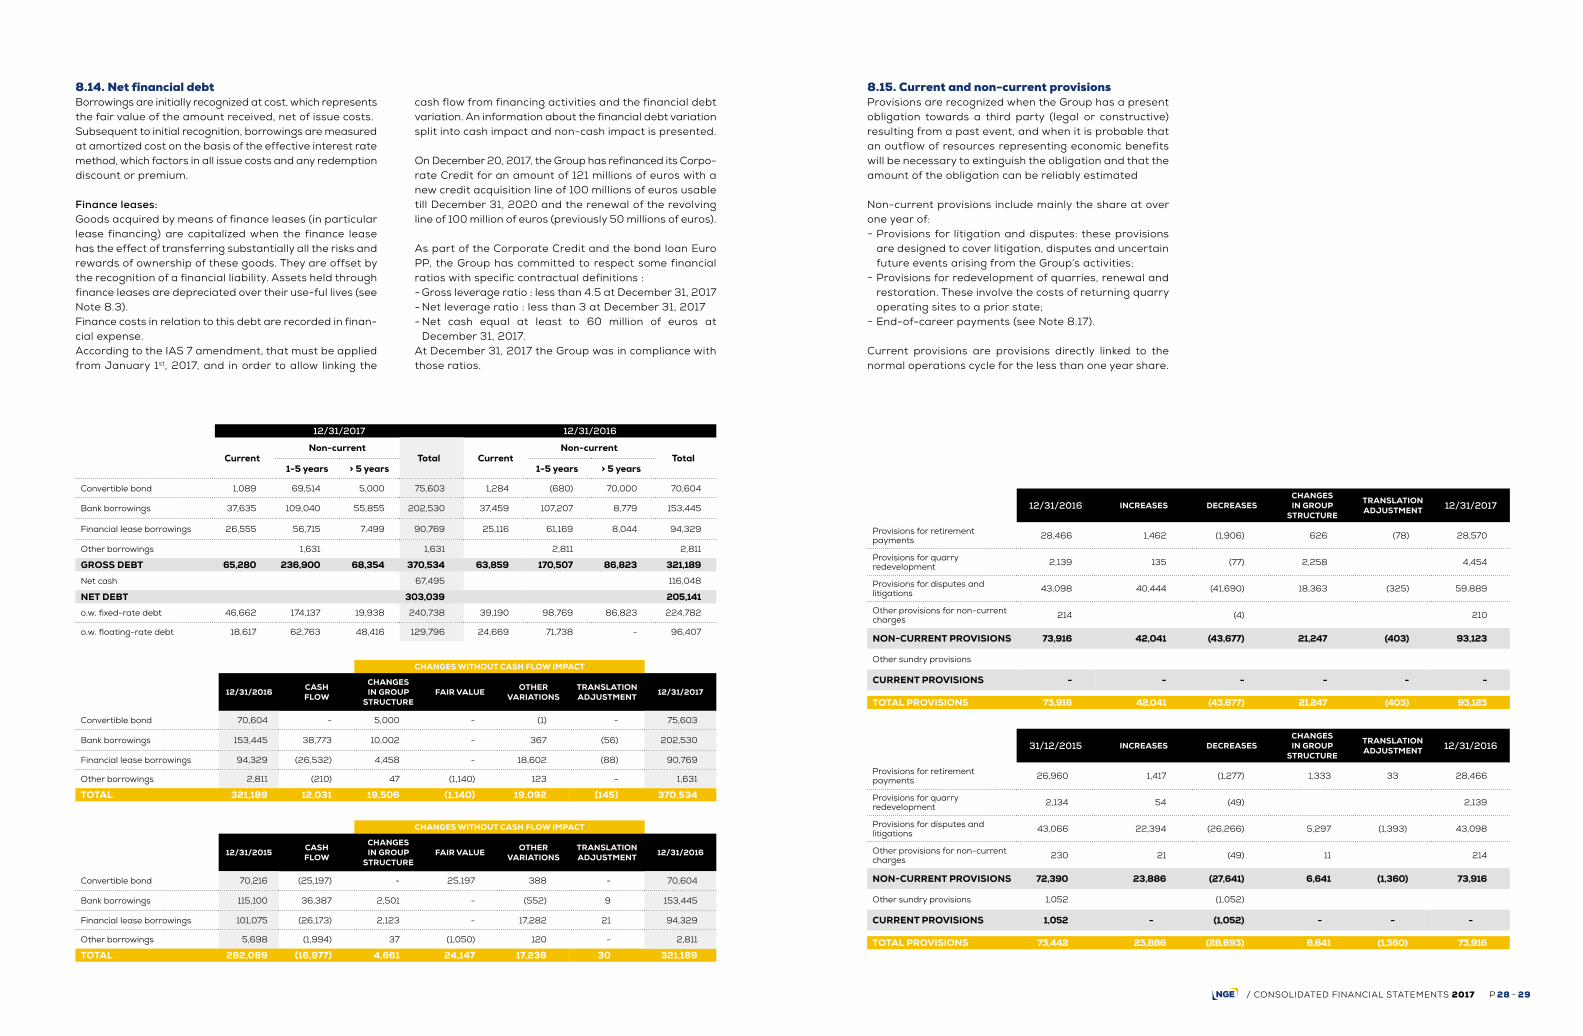
8.14. Net financial debtBorrowings are initially recognized at cost, which represents the fair value of the amount received, net of issue costs.Subsequent to initial recognition, borrowings are measured at amortized cost on the basis of the effective interest rate method, which factors in all issue costs and any redemption discount or premium.
Finance leases:Goods acquired by means of finance leases (in particular lease financing) are capitalized when the finance lease has the effect of transferring substantially all the risks and rewards of ownership of these goods. They are offset by the recognition of a financial liability. Assets held through finance leases are depreciated over their use-ful lives (see Note 8.3).Finance costs in relation to this debt are recorded in finan-cial expense. According to the IAS 7 amendment, that must be applied from January 1st, 2017, and in order to allow linking the
12/31/2017 12/31/2016
CurrentNon-current
Total CurrentNon-current
Total1-5 years > 5 years 1-5 years > 5 years
Convertible bond 1,089 69,514 5,000 75,603 1,284 (680) 70,000 70,604
Bank borrowings 37,635 109,040 55,855 202,530 37,459 107,207 8,779 153,445
Financial lease borrowings 26,555 56,715 7,499 90,769 25,116 61,169 8,044 94,329
Other borrowings 1,631 1,631 2,811 2,811
GROSS DEBT 65,280 236,900 68,354 370,534 63,859 170,507 86,823 321,189
Net cash 67,495 116,048
NET DEBT 303,039 205,141
o.w. fixed-rate debt 46,662 174,137 19,938 240,738 39,190 98,769 86,823 224,782
o.w. floating-rate debt 18,617 62,763 48,416 129,796 24,669 71,738 - 96,407
12/31/2016 INCREASES DECREASESCHANGES IN GROUP
STRUCTURE
TRANSLATION ADJUSTMENT 12/31/2017
Provisions for retirement payments 28,466 1,462 (1,906) 626 (78) 28,570
Provisions for quarry redevelopment 2,139 135 (77) 2,258 4,454
Provisions for disputes and litigations 43,098 40,444 (41,690) 18,363 (325) 59,889
Other provisions for non-current charges 214 (4) 210
NON-CURRENT PROVISIONS 73,916 42,041 (43,677) 21,247 (403) 93,123
Other sundry provisions
CURRENT PROVISIONS - - - - - -
TOTAL PROVISIONS 73,916 42,041 (43,677) 21,247 (403) 93,123
31/12/2015 INCREASES DECREASESCHANGES IN GROUP
STRUCTURE
TRANSLATION ADJUSTMENT 12/31/2016
Provisions for retirement payments 26,960 1,417 (1,277) 1,333 33 28,466
Provisions for quarry redevelopment 2,134 54 (49) 2,139
Provisions for disputes and litigations 43,066 22,394 (26,266) 5,297 (1,393) 43,098
Other provisions for non-current charges 230 21 (49) 11 214
NON-CURRENT PROVISIONS 72,390 23,886 (27,641) 6,641 (1,360) 73,916
Other sundry provisions 1,052 (1,052)
CURRENT PROVISIONS 1,052 - (1,052) - - -
TOTAL PROVISIONS 73,442 23,886 (28,693) 6,641 (1,360) 73,916
cash flow from financing activities and the financial debt variation. An information about the financial debt variation split into cash impact and non-cash impact is presented.
On December 20, 2017, the Group has refinanced its Corpo-rate Credit for an amount of 121 millions of euros with a new credit acquisition line of 100 millions of euros usable till December 31, 2020 and the renewal of the revolving line of 100 million of euros (previously 50 millions of euros).
As part of the Corporate Credit and the bond loan Euro PP, the Group has committed to respect some financial ratios with specific contractual definitions :- Gross leverage ratio : less than 4.5 at December 31, 2017- Net leverage ratio : less than 3 at December 31, 2017- Net cash equal at least to 60 million of euros at
December 31, 2017.At December 31, 2017 the Group was in compliance with those ratios.
CHANGES WITHOUT CASH FLOW IMPACT
12/31/2016 CASH FLOW
CHANGES IN GROUP
STRUCTUREFAIR VALUE OTHER
VARIATIONSTRANSLATION ADJUSTMENT 12/31/2017
Convertible bond 70,604 - 5,000 - (1) - 75,603
Bank borrowings 153,445 38,773 10,002 - 367 (56) 202,530
Financial lease borrowings 94,329 (26,532) 4,458 - 18,602 (88) 90,769
Other borrowings 2,811 (210) 47 (1,140) 123 - 1,631
TOTAL 321,189 12,031 19,506 (1,140) 19,092 (145) 370,534
CHANGES WITHOUT CASH FLOW IMPACT
12/31/2015 CASH FLOW
CHANGES IN GROUP
STRUCTUREFAIR VALUE OTHER
VARIATIONSTRANSLATION ADJUSTMENT 12/31/2016
Convertible bond 70,216 (25,197) - 25,197 388 - 70,604
Bank borrowings 115,100 36,387 2,501 - (552) 9 153,445
Financial lease borrowings 101,075 (26,173) 2,123 - 17,282 21 94,329
Other borrowings 5,698 (1,994) 37 (1,050) 120 - 2,811
TOTAL 292,089 (16,977) 4,661 24,147 17,238 30 321,189
8.15. Current and non-current provisionsProvisions are recognized when the Group has a present obligation towards a third party (legal or constructive) resulting from a past event, and when it is probable that an outflow of resources representing economic benefits will be necessary to extinguish the obligation and that the amount of the obligation can be reliably estimated
Non-current provisions include mainly the share at over one year of:
− Provisions for litigation and disputes: these provisions are designed to cover litigation, disputes and uncertain future events arising from the Group’s activities;
− Provisions for redevelopment of quarries, renewal and restoration. These involve the costs of returning quarry operating sites to a prior state;
− End-of-career payments (see Note 8.17).
Current provisions are provisions directly linked to the normal operations cycle for the less than one year share.
/ CONSOLIDATED FINANCIAL STATEMENTS 2017 P 28 - 29

IAS19R IAS19R
12/31/2017 12/31/2016Assumptions
Discount rate (including inflation) 1.50% 1.50%
Rate of salary increase 2.55% 2.55%
Change in commitment
Commitment at the beginning of the period 30,644 29,101
Service costs over the period 404 1,765
Translation adjustment (78) 33
Interest expense 463 618
Acquisitions / Disposals 661 1,260
Actuarial losses (gains) on the commitment (107) (998)
Benefits paid (1,172) (1,135)
COMMITMENT AT THE END OF PERIOD 30,816 30,644
Change in assets
Fair value of assets at the beginning of the period 2,269 2,141
Interest income 30
Actuarial gains (losses) on the asset 5
Acquisitions / Disposals (58) 128
VALUE OF ASSETS AT THE END OF PERIOD 2,246 2,269
Expense for the period
Service cost over the period 404 1,765
Translation adjustment (78) 33
Net cost of interest 434 618
EXPENSE (INCOME) 760 2,416
Other items of comprehensive income
Stock of actuarial adjustment on OCI at the beginning of the period 2,635 3,633
Actuarial losses (gains) generated on commitment (112) (998)
LOSSES (GAINS) RECOGNIZED IN OTHER COMPREHENSIVE INCOME 2,523 2,635
IAS19R IAS19R
12/31/2017 12/31/2016Change in provision
Provision at the beginning of the period (28,399) (26,960)
(Expense) / Income (747) (2,383)
Translation adjustment 11 33
Actuarial adjustments generated 112 998
Acquisitions / Disposals (661) (1,260)
Benefits paid directly by the employer 1,114 1,173
PROVISION AT THE END OF THE PERIOD (28,570) (28,399)
Sensitivity
Discount rateCommitment with a decrease of -0.25% 29,225 28,990
Expense with a decrease of -0.25% 2,954 2,795
Commitment with a decrease of -0.25% 31,412 30,978
Expense with a decrease of -0.25% 3,077 2,887
Salary increase rateCommitment with a decrease of -0.25% 31,419 30,982
Expense with a decrease of -0.25% 3,161 2,967
Commitment with a decrease of -0.25% 29,213 28,982
Expense with a decrease of -0.25% 2,876 2,719
12/31/2017 12/31/2016
Social security payables 85,096 70,714
Tax payables 155,399 125,206
Gross amount due to customers 88,084 95,041
Loans and advances to silent partnerships and others 6,295 5,633
Prepaid income 15,238 38,082
Dividends for payment 201
Other liabilities 21,713 18,729
OTHER CURRENT LIABILITIES 371,825 353,606
8.16. End-of-career paymentsCommitments in respect of defined-benefit retirement schemes are provisioned in the balance sheet. They are determined using the projected unit credit method based on actuarial valuations carried out at each annual closing date.The assumptions used for the actuarial calculations ofthe defined-benefit retirement commitments includeuncertainties which may affect the value of the financialassets and obligations towards employees. These assum-ptions are reviewed annually and may lead to accounting adjustments.For defined-benefit schemes financed through external management (pension funds or insurance contracts), the excess or shortfall in the fair value of assets compared to the present value of obligations is recognized in assets or liabilities.
Under IAS 19, expenses accounted within the Operating Income include service costs and any change, reductionor liquidation of schemes. Impacts of de-discounting of actuarial debt and interest income from assets are accounted for under Other Financial Expenses and Income. Interest income from hedging are computed using the discounted rate used for Defined benefit schemes. Net liabilities reevaluations for defined benefits schemes are accounted for under Other comprehensive income; including mainly actuarial gain and loss due to change in actuarial hypothesis and adjustments linked to experience.
8.17. Other current liabilities
/ Quarry of Vaglio – Jaumont (57)
/ CONSOLIDATED FINANCIAL STATEMENTS 2017 P 30 - 31

8.18. Financial instrumentsThe Group uses derivative instruments such as forward currency contracts and interest rate swaps to hedge against interest rate risks. These derivative instruments are recognized at fair value.At December 31, 2017, fair value includes credit risk or the entity’s own risk pursuant to IFRS 13; these risks are estimated on the basis of observable market data.All gains and losses due to changes in the fair value of derivatives which are not classified as hedging instru-ments are recognized directly in the consolidated state-ment of comprehensive income.The fair value of forward currency contracts is calculated by reference to quoted prices for contracts with similar maturity profiles. The fair value of interest rate swaps is determined by reference to market values of similar instruments.
For hedge accounting purposes, hedges are classified:• either as fair value hedges when they hedge exposure to
changes in the fair value of a recognized asset or liability, or a firm commitment (except for currency risk);
• or as cash flow hedges when they hedge exposure to changes in cash flow attributable either to a particular risk associated with a recognized asset or liability, or to a highly probable forecast transaction or currency risk on a firm commitment;
• or as net investment hedges in a foreign operation. Hedging instruments that satisfy the criteria laid down in IAS 39 on hedge accounting are recognized as follows: - Fair value hedges.
Changes in the fair value of a derivative that qualifies as a fair value hedge are recognized in profit or loss. Changes in the fair value of the hedged item attributable to the hedged risk adjust the carrying amount of the hedged item and are also recognized in profit or loss;
- Cash flow hedges. Profit or loss corresponding to the effective portion of the hedging instrument is recognized directly in equity, while the ineffective portion is recognized in profit or loss.
FAIR VALUE AT 12/31/2017 NON-CURRENT ASSETS
CURRENT ASSETS
NON-CURRENT LIABILITIES
CURRENT LIABILITIES
NOTIONAL AMOUNT
Cash flow hedging swap 510 60,000
Options qualifying for hedge accounting 624 29,750
Exchange rate hedging
Tunnels
TOTAL INTEREST RATE HEDGING - - 1,134 - 89,750
THE VALUE OF INTEREST RATE HEDGING INSTRUMENTS IS PRESENTED AS FOLLOWS:
METHOD FOR CALCULATING FAIR VALUE
12/31/2017FINANCIAL ASSETS AND LIABILITIES
CARRYING AMOUNT
AVAILABLE-FOR-SALES FINANCIAL
ASSETS
FINANCIAL ASSETS AT
FAIR VALUE THROUGHT
INCOME
LOANS AND RECEIVABLES
LIABILITIES AT
AMORTIZED COST
HEDGING INSTRUMENTS FAIR VALUE
LEVEL 1 QUOTED
MARKET PRICE ON AN ACTIVE
MARKET
LEVEL 2 MODEL USING OBSERVABLE
MARKET DATA
LEVEL 3MODEL
USING NON-OBSERVABLE
DATA
Other financial assets 56,397 19,023 37,374 56,397 37,374 19,023
Group debtors 15,920 15,920 15,920 15,920
Cash and cash equivalents 193,290 193,290 193,290 2,533 190,757
TOTAL ASSETS 265,607 19,023 193,290 53,294 - - 265,607 2,533 244,051 19,023
Borrowing and other financing 496,329 495,195 1,134 496,329 125,795 370,534
Current accounts payable
6,295 6,295 6,295 6,295
TOTAL LIABILITIES 502,624 - - 6,295 495,195 1,134 502,624 132,090 370,534 -
METHOD FOR CALCULATING FAIR VALUE
12/31/2016FINANCIAL ASSETS AND LIABILITIES
CARRYING AMOUNT
AVAILABLE-FOR-SALES FINANCIAL
ASSETS
FINANCIAL ASSETS AT
FAIR VALUE THROUGHT
INCOME
LOANS AND RECEIVABLES
LIABILITIES AT
AMORTIZED COST
HEDGING INSTRUMENTS FAIR VALUE
LEVEL 1 QUOTED
MARKET PRICE ON AN ACTIVE
MARKET
LEVEL 2 MODEL USING OBSERVABLE
MARKET DATA
LEVEL 3MODEL
USING NON-OBSERVABLE
DATA
Other financial assets 56,371 17,323 39,047 56,371 39,047 17,323
Group debtors 2,036 2,036 2,036 2,036
Cash and cash equivalents 210,785 210,785 210,785 19,949 190,835
TOTAL ASSETS 269,192 17,323 210,785 41,083 - - 269,192 19,949 231,918 17,323
Borrowing and other financing 415,925 413,651 2,274 415,925 94,736 321,189
Current accounts payable
5,633 5,633 5,633 5,633
TOTAL LIABILITIES 421,558 - - 5,633 413,651 2,274 421,558 100,369 321,189 -
FAIR VALUE AT 12/31/2016 NON-CURRENT ASSETS
CURRENT ASSETS
NON-CURRENT LIABILITIES
CURRENT LIABILITIES
NOTIONAL AMOUNT
Cash flow hedging swap 1,230 60,000
Options qualifying for hedge accounting 810 38,430
Exchange rate hedging 103 18,995
Tunnels 130 18,790
TOTAL INTEREST RATE HEDGING - 2,274 - 136,215
Amounts recognized directly in equity are included in profit or loss in the period in which the hedged transac-tion affects profit or loss.
If the Group subsequently expects that the forecast transaction or commitment will no longer occur, amounts previously recognized directly in equity are "recycled" into profit or loss. If the hedging instrument expires, is sold, terminated, or exercised without being replaced or renewed, or where its designation as a hedging instru-ment is revoked, amounts previously recognized in equity are retained there until the forecast transaction or firm commitment occurs.
Interest rate hedges: Derivative instruments authorized to hedge debt are swaps or options taken out with leading banking institutions. In terms of interest rate hedging contracts at December 31, 2017, the total amount of gross borrowings subject to uncapped interest rate risk was 140 million of euros, compared with 39.2 million of euros at December 31, 2016. At December 31, 2017, at constant debt and taking into account interest rate derivatives in the portfolio at that date, a 25 basis point rise in variable interest rates would increase annual financial expenses by 4 thousand of euros.
/ Rehabilitation of Matabiau train station – Toulouse (31)
/ CONSOLIDATED FINANCIAL STATEMENTS 2017 P 32 - 33

8.19. Income from operating activitiesTotal revenue is recognized in accordance with IAS 11.
8.20. Other income from activitiesRecognition of other income from activities gathers together mainly equipment sales, studies and fees, in accordance with IAS 18.Other Income from activities include also financial revenue from NGE Concessions activities.
VALEURS EN 12/31/2017 12/31/2016
Other income from activities 31,759 36,626
Income from sale of equipment 8,409 10,617
OTHER INCOME FROM ORDINARY ACTIVITIES 40,168 47,243
12/31/2017 12/31/2016
Subcontracting 344,060 289,865
Purchases not held in inventory 103,745 83,978
Other services (leases, temporary work etc) 509,614 382,042
EXTERNAL EXPENSES 957,420 755,884
12/31/2017 12/31/2016
Income from equity interests 73 119
Other financial income and expenses (8,088) (1,711)
Exchange differences (266) (325)
OTHER FINANCIAL INCOME AND EXPENSES (8,281) (1,917)
12/31/2017 12/31/2016
Operating income from ordinary activities 44,465 42,895
Net depreciation and amortization 68,627 65,570
Net book value of disposals 10,231 8,114
EBITDA 123,323 116,579
8.25. EBITDA
12/31/2017 12/31/2016
Income from cash and cash equivalents 63 162
Interest on bank borrowings (6,799) (6,478)
Interest on leasing and other debt (3,350) (2,878)
COST OF NETFINANCIAL DEBT (10,085) (9,194)
8.22. Other operating income and expenseThe Other operation incomes and expenses are composed exclusively the following expenses :- FCPE
In date of June 20, 2017, the Strategic Board has autho-rized the buy-back of 221,501 shared A by the company at unit price of 44.43 euros, and the sale of those shares by the company to the FCPE “NGE Actionnariat Relais 2017”. The employees took advantage of a discount on the share price as well as an employer contribution.
- Acquisition expenses from external growth, notably Dacquin and Vaglio groups.
8.23. Cost of net financial debt
8.26. Equity and Earnings per shareSHARE CAPITAL NGE has realized a capital increase of 112,110 shares, corresponding to an amount of 9.1 million of euros.At December 31, 2017, share capital is composed of 6,572,507 shares fully paid of 8€ per nominal value. The Group is pursuing its policy of employee ownership in order to involve all staff and to assert the unity of NGE and its subsidiaries. During the year, the Group proceeded to purchase/sale of 221,201 shares NGE; in 2016 the number was of 153,503. EARNINGS PER SHARE Basic earnings per share are calculated by dividing the income attributable to holders of ordinary shares in the parent company by the weighted average number of outstanding ordinary shares during the period. For diluted earnings per share, the income attributable to holders of ordinary shares in the parent company and the weighted average number of outstanding shares are adjusted for the impact of all potentially dilutive equity instruments.There is no more dilutive instruments at December 31, 2017.
12/31/2017 12/31/2016
Net income attribuable to owners of the parents (a) 24,352 20,074
Weighted average number of shares (c) 6,572,507 6,299,268
Weighted average number free shares 261,007
Weighted average number of theoretical equity instruments (e) 6,572,507 6,560,275
EARNINGS PER SHARE (EUROS) (A/C) 3.71 3.19
DILUTED EARNINGS PER SHARE (EUROS) (A/E) 3.71 3.06
12/31/2017 12/31/2016
FCPE (5,091) (3,293)
Acquisitions expenses External growth (1,466) (1,115)
Other (1,823)
OTHER OPERATING INCOME AND EXPENSE (6,557) (6,231)
8.21. External expenses
8.24. Other financial income and expenses
/ Fish ponds – Clermont-Ferrand (63)
/ Earthworks – Haute Savoie (74)
/ CONSOLIDATED FINANCIAL STATEMENTS 2017 P 34 - 35

12/31/2017 12/31/2016
Deposits, guarantees and sureties given 440,698 403,655
Other sureties 265,141 222,260
TOTAL COMMITMENTS GIVEN 705,839 625,915
Deposits, guarantees and sureties held 183,126 157,597
TOTAL COMMITMENTS HELD 183,126 157,597
12/31/2017 12/31/2016
Senior management 1,758 1,502
Junior management 3,128 2,707
Other management 6,225 5,382
AVERAGE WORKFORCE 11,111 9,591
12/31/2017 12/31/2016
Gross compensation 323,534 282,324
Competitiveness and jobs tax credit (13,767) (10,258)
Social charges 174,651 143,088
Incentive and profit-sharing plans 10,445 9,341
TOTAL 494,863 424,496
Retirement payments 404 1,765
PERSONAL COSTS 495,267 426,260
8.29. Off-balance sheet commitments
8.31. Wages and social charges
8.30. Headcount
8.28. Segment information
8.27. Related party transactions
In millions of euros 12/31/2017 12/31/2016
COMPANIES TYPE RECEIVABLES (DEBTS)
INCOME(EXPENSE)
RECEIVABLES (DEBTS)
INCOME(EXPENSE)
Concessions and PPPs Loan 30.2 1.0 34.0 1.2
Other associates Current account 11.3 - (2.0) (0.1)
Managing bodies Total cost (6.2) (6.0)
Significant related party transactions are presented below.
In millions of euros 12/31/2017REGIONAL
MULTI-EXPERTISES ACTIVITIES
MULTI-EXPERTISE MAJOR PROJECTS
SPECIALIST FRENCH SUBSIDIARIES ELIMINATIONS TOTAL
Income from operating activities 683 398 788 1,869
Inter-segment sales 4 21 (25) 0
TOTAL 687 398 809 (25) 1,869Operating income from ordinary activities 6.4 15.2 22.9 44.5
Operating income 37.9
In millions of euros 12/31/2016ACTIVITÉS
RÉGIONALESMULTI-MÉTIERS
MULTI-EXPERTISE MAJOR PROJECTS
SPECIALIST FRENCH SUBSIDIARIES ELIMINATIONS TOTAL
Income from operating activities 650 293 559 1,502
Inter-segment sales 4 1 20 (25) -
TOTAL 654 294 579 (25) 1,502Operating income from ordinary activities (3.3) 11.2 35.0 42.9
Operating income 36.7
In 2016, the Group derived 13% of its revenue from itsinternational operations, compared with 6.80% in 2015.
The group derived 12.3% of its revenue from its international operations.
/ Construction of the National School of Photography – Arles (13)
/ CONSOLIDATED FINANCIAL STATEMENTS 2017 P 36 - 37

12/31/2017 12/31/2016
COMPANY HEAD OFFICE FORM SIRET METHOD % INTEREST METHOD % INTEREST
NGE Parc d’activités de Laurade 13103 SAINT-ETIENNE-DU-GRES SAS 504 124 801 00029 Parent 100 Parent 100
ABTP BIARD ZA Vallade 24100 BERGERAC SAS 423 753 565 00013 Fully
Consolidated 100 Fully Consolidated 100
AGENIA 295 Rue Fontfillol Lot B – ZAC des Cadaux - 81370 ST SULPICE SARL 440 792 836 00031 Fully
Consolidated 100 Fully Consolidated 100
AGILIS 245 Allée du Sirocco - ZA la Cigalière IV 84250 LE THOR SAS 443 222 328 00025 Fully
Consolidated 100 Fully Consolidated 100
AIRCO Parc d’activités de Laurade13103 SAINT-ETIENNE-DU-GRES SARL 390 281 319 00033 TUP - Fully
Consolidated 100
ALBEA EXPLOITATION Parc d’activités de Laurade 13103 SAINT-ETIENNE-DU-GRES SAS 538 012 881 00016 Fully
Consolidated 50 Fully Consolidated 50
ALPILLES PARTICIPATIONS
Parc d’activités de Laurade 13103 SAINT-ETIENNE-DU-GRES SAS 401 065 321 00036 Fully
Consolidated 100 Fully Consolidated 100
ANGEL Parc d’activités de Laurade 13103 SAINT-ETIENNE-DU-GRES SAS 813 767 035 00013 Fully
Consolidated 100 Fully Consolidated 100
ANTARES PARTICIPATIONS
Parc d’activités de Laurade 13103 SAINT-ETIENNE-DU-GRES SAS 813 767 209 00014 Fully
Consolidated 100 Fully Consolidated 100
AQUATECH INTERNATIONAL
Centre d'affaires Edouard VII 20 Rue de Caumartin75009 PARIS
SAS 803 205 665 00018 Fully Consolidated 33.5 Fully
Consolidated 33.5
AQUATECH MAROC 49 impasse Adarissa - Hassan 10020 RABAT SARL Fully
Consolidated 33.5 Fully Consolidated 33.5
AQUATECH SENEGAL Rue Amadou Assane NdoyeDAKAR SA Fully
Consolidated 20.10 - -
ARTES 534, rue Marius Petipa 34080 MONTPELLIER SARL 438 395 071 00030 Fully
Consolidated 100 Fully Consolidated 100
ATELIER POUR LA MAINTENANCE DES ENGINS MOBILES
Parc d'Activités Coriolis TGV Rue Evariste Galois 71210 MONTCHANIN
SAS 811 342 146 00016 Equity method 17.18 Equity
method 28.57
AUDE AGREGATS 11170 MOUSSOULENS SAS 304 636 137 00016 Fully Consolidated 35 Fully
Consolidated 35
AUDE BETON ZA Batipôle 11300 ST MARTIN DE VILLEREGLAN SAS 353 943 954 00027 Fully
Consolidated 35 Fully Consolidated 35
AUDE RECYCLAGE RN 113 Montorgeuil 11000 CARCASSONNE SAS 798 494 621 00013 Equity
method 23.10 Equity method 23.10
AVIC Le Grand Saint Cyran 36250 ST MAUR SAS 794 415 133 00014 Fully
Consolidated 50 Fully Consolidated 50
AWIR 1567 Rue Rostang MONTEVIDEO SA 15315 Fully
Consolidated 100 Fully Consolidated 100
BARAZER TP Zone Industrielle de Guerneach 56110 GOURIN SAS 353 607 294 00033 Fully
Consolidated 100 Fully Consolidated 100
BERENGIER DEPOLLUTION
Lieudit La Perière 49170 SAINT GERMAIN DES PRES SAS 413 395 104 00057 Fully
Consolidated 100 Fully Consolidated 100
BERGERAC MATERIAUX ET VALORISATION
Rue Louis Armand ZI de Camp Réael BP 628 24106 BERGERAC
SARL 812 720 415 00015 Equity method 25 Equity
method 25
BROUTIN TP Zone Industrielle 62440 Harnes SAS 789 188 349 00029 Fully
Consolidated 100 Fully Consolidated 100
CALCAIRES CATALANSRoute d’Opoul Carrière de Sarrat de la traverse 66600 SALSES LE CHÂTEAU
SAS 791 851 900 00013 Fully Consolidated 50 Fully
Consolidated 50
CALCAIRES DU BITERROIS Lieudit Garrigue de Bayssan 34500 BEZIERS SAS 514 743 574 00014 Equity
method 50 Equity method 50
CALCAIRES DU DIJONNAIS
Parc d’activités de Laurade 13103 SAINT-ETIENNE-DU-GRES SAS 788 588 358 00010 Fully
Consolidated 74 Fully Consolidated 74
CALCAIRES DU MONT AURELIEN
Route de la Durance 13860 PEYROLLES EN PROVENCE SAS 805 379 195 00011 Fully
Consolidated 50 Fully Consolidated 50
CARDINAL EDIFICE Zone Artisanale 35330 MERNEL SAS 950 033 555 00026 Fully
Consolidated 100 Fully Consolidated 100
CARRIERE DE BAYSSAN Parc d’activités de Laurade 13103 SAINT-ETIENNE-DU-GRES SAS 413 838 020 00043 Fully
Consolidated 100 Fully Consolidated 100
CARRIERE DE BOULBON Parc d’activités de Laurade 13103 SAINT-ETIENNE-DU-GRES SAS 438 796 252 00015 Fully
Consolidated 100 Fully Consolidated 100
CAZAL 8 Zone Cardona 11410 SALLES-SUR-L’HERS SAS 313 211 864 00027 Fully
Consolidated 100 Fully Consolidated 100
CORREZE ENROBES ZI Tulle Est 19000 TULLE SARL 400 002 218 00016 Equity
method 43 Equity method 43
DACQUIN Parc activités Portes de Bretagne35538 SERVON SUR VILAINE SAS 392 855 599 00040 Fully
Consolidated 100 - -
12/31/2017 12/31/2016
COMPANY HEAD OFFICE FORM SIRET METHOD % INTEREST METHOD % INTEREST
DACQUIN LOGISTIQUE Parc activités Portes de Bretagne35538 SERVON SUR VILAINE SAS 790 654 867 00015 Fully
Consolidated 100 - -
EGENIE 295 Rue Fontfillol Lot B 81370 ST SULPICE SAS 440 856 292 00022 Fully
Consolidated 100 Fully Consolidated 100
EGYFRAIL 62 Ahmed Afifi St. - Media City AGOUZA SA 54517 Fully
Consolidated 49 Fully Consolidated 49
EHTP Parc d’activités de Laurade 13103 SAINT-ETIENNE-DU-GRES SAS 439 987 405 00024 Fully
Consolidated 100 Fully Consolidated 100
ERBIUM 9200, Voie des Clouets27100 LA VAUDREUIL SAS 819 099 169 00016 Fully
Consolidated 50 - -
ERIS PARTICIPATIONS Parc d’activités de Laurade 13103 SAINT-ETIENNE-DU-GRES SCA 501 714 521 00017 Fully
Consolidated 100 Fully Consolidated 100
EXTER Parc d’activités de Laurade 13103 SAINT-ETIENNE-DU-GRES SAS 453 453 045 00016 Fully
Consolidated 50 Fully Consolidated 50
FITWER 1429 Circunvalacion Durango 2D MONTEVIDEO SA 217 540 23 0011 Fully
Consolidated 100 Fully Consolidated 100
FRASCA 12 rue Eugène Freyssinet 77500 CHELLES SAS 572 062 859 00036 Fully
Consolidated 100 Fully Consolidated 100
FVF Chemin du Corps de Garde 77500 CHELLES SAS 483 288 163 00015 Fully
Consolidated 100 Fully Consolidated 100
GARLABAN FINANCES Parc d’activités de Laurade13103 SAINT-ETIENNE-DU-GRES SAS 834 178 394 00013 Fully
Consolidated 100 - -
GENERALE ROUTIERE 719 Boulevard Modibo Keita Polo20420 CASABLANCA
SAde droit
marocain
RCS Casablanca 89363
Fully Consolidated 100 Fully
Consolidated 100
GIPERAIL 38/44 rue Jean Mermoz T 78600 MAISONS-LAFFITE SNC 413 173 238 00044 Fully
Consolidated 50 Fully Consolidated 50
GMS ENROBES Parc d’Activités du Peuras 498 Avenue du Peuras - 38210 TULLINS SAS 482 029 303 00021 Fully
Consolidated 54 Fully Consolidated 54
GRANULATS DE L’EST 8 Chemin Barbier 97412 BRAS PANON SAS 800 730 673 00020 Fully
Consolidated 35 Fully Consolidated 100
GTS 29 rue des Tâches 69800 SAINT-PRIEST SAS 348 099 987 00029 Fully
Consolidated 100 Fully Consolidated 100
GUINTOLI Parc d’activités de Laurade 13103 SAINT-ETIENNE-DU-GRES SAS 447 754 086 00018 Fully
Consolidated 100 Fully Consolidated 100
HAUTES PYRENEES ROCADES TARBAISE (H.P.R.T.)
30 Avenue de Larrieu 31081 TOULOUSE Cedex SAS 523 471 787 00011 Equity
method 21.5 Equity method 21.5
HOLDING GROUPE DACQUIN
Parc activités Portes de Bretagne35538 SERVON SUR VILAINE SAS 790 017 222 00015 Fully
Consolidated 100 - -
HOLDING MAURI 11250 COUFFOULENS SAS 418 598 306 00011 Fully Consolidated 35 Fully
Consolidated 35
HOLDING SLD-ERA Parc d’activités de Laurade 13103 SAINT-ETIENNE-DU-GRES SAS 498 538 628 00013 Fully
Consolidated 100 Fully Consolidated 100
HOLDING TPRN Parc d’activités de Laurade 13103 SAINT-ETIENNE-DU-GRES SAS 513 281 907 00016 Fully
Consolidated 100 Fully Consolidated 100
JAUMONT FINANCESEcart Saint HubertMalancourt-la-Montagne57360 AMNEVILLE
SAS 801 465 352 00020 Fully Consolidated 55 - -
LES CARRIERES D’AVRAINVILLE (L.C.A)
Plaine de Socourt 88130 CHARMES SAS 509 981 833 00015 Equity
method 50 Equity method 50
LA CHAMPENOISELa Champagne 24270 SAINT-CYR-LES-CHAMPAGNES
SAS 307 013 938 00013 Fully Consolidated 65 Fully
Consolidated 65
LA PLANEZE RD 926 Parc d’activités de Laurade13103 SAINT-ETIENNE-DU-GRES SAS 823 827 357 00018 Fully
Consolidated 100 - -
LACIS Parc d’activités de Laurade13103 SAINT-ETIENNE-DU-GRES SAS 513 027 821 00018 Fully
Consolidated 100 Fully Consolidated 100
LAGARRIGUE Place de la République 12300 FIRMI SAS 426 680 187 00017 Fully
Consolidated 100 Fully Consolidated 100
LE CHENE CONSTRUCTIONS
ZA de la Landelle - 5 rue des Echanges 56200 LA GACILLY SAS 388 190 845 00031 Fully
Consolidated 100 Fully Consolidated 100
LES CALCAIRES DU GARD Parc d’activités de Laurade 13103 SAINT-ETIENNE-DU-GRES SAS 801 356 361 00015 Fully
Consolidated 50 Fully Consolidated 50
LES CARRIERES DES PUYS 63230 SAINT PIERRE LE CHASTEL SAS 488 725 995 00010 Equity
method 30 Equity method 30
LES CLES DE SAINT LYS Parc d’activités de Laurade13103 SAINT-ETIENNE-DU-GRES SCI 753 229 863 00026 Fully
Consolidated 95 Fully Consolidated 95
LIST OF CONSOLIDATED COMPANIES
/ CONSOLIDATED FINANCIAL STATEMENTS 2017 P 38 - 39

/ CONSOLIDATED FINANCIAL STATEMENTS 2017 P 40 - 41
12/31/2017 12/31/2016
COMPANY HEAD OFFICE FORM SIRET METHOD % INTEREST METHOD % INTEREST
LES CREPIS D’ARMOR Zone Portuaire 56190 ARZAL SAS 498 109 230 00017 TUP - Fully
Consolidated 100
LES ENERGIES DE LA CITE Chemin de la Lalette65000 TARBES SA 824 391 460 00014 Equity
method 40 - -
LES LIANTS DE L'ESTUAIRE (SLE)
Zone Industrielle du Havre Sandouville 76430 SAINT ROMAIN DE COLBOSC SARL 344 110 572 00015 Equity
method 39 Equity method 39
LIANTS DU SUD OUEST (LSO)
Lacombe 19100 BRIVE SAS 381 801 844 00014 Fully
Consolidated 100 Fully Consolidated 100
LOSANGE EXPLOITATION 9200 Voie des Clouets27100 VAL DE REUIL SAS 831 268 156 00013 Fully
Consolidated 50 - -
LPF TP Rue des Queyries 33100 BORDEAUX SAS 433 689 510 00025 Fully
Consolidated 100 Fully Consolidated 100
MAINTENANCE TARBES CONTOURNEMENT (MTC)
30 Avenue de Larrieu 31081 TOULOUSE Cedex 1 SAS 523 458 529 00014 Equity
method 39 Equity method 39
MARMIN TP Rue Des Verrotières - ZI des Dunes 62100 CALAIS SAS 810 185 025 00014 Fully
Consolidated 100 Fully Consolidated 100
MAURI 11250 COUFFOULENS SAS 302 221 445 00018 Fully Consolidated 35 Fully
Consolidated 35
MEDRAILBurjuman Business tower Bur Dubai DUBAI (UAE)
SA Fully Consolidated 50 Fully
Consolidated 50
MENUISERIE CARDINAL Les Rochelles 35330 MAURE DE BRETAGNE SAS 500 808 845 00035 Fully
Consolidated 100 Fully Consolidated 100
METRICRAIL 38/44 Rue Jean Mermoz T 78600 MAISONS LAFFITE SARL 453 685 307 00036 Fully
Consolidated 50 Fully Consolidated 50
MIRE 12 rue Eugène Freyssinet 77500 CHELLES SAS 432 623 130 00049 Fully
Consolidated 100 Fully Consolidated 100
MISTRAL FINANCES Parc d’activités de Laurade 13103 SAINT-ETIENNE-DU-GRES SAS 812 189 512 00013 Fully
Consolidated 100 Fully Consolidated 100
MONESTIER FINANCES Parc d’activités de Laurade13103 SAINT-ETIENNE-DU-GRES SAS 834 174 641 00011 Fully
Consolidated 100 - -
MOURGUES 46 rue de l'Industrie - ZI du Capitou 83600 FREJUS SAS 305 362 352 00042 Fully
Consolidated 100 Fully Consolidated 100
MULLER TP Domaine de Sabré 57420 COIN-LES-CUVRY SAS 447 754 235 00037 Fully
Consolidated 100 Fully Consolidated 100
NGE AUTOROUTES Parc d’activités de Laurade13103 SAINT-ETIENNE-DU-GRES SAS 834 152 001 00014 Fully
Consolidated 100 - -
NGE CONCESSIONS Parc d’activités de Laurade 13103 SAINT-ETIENNE-DU-GRES SAS 789 270 360 00017 Fully
Consolidated 100 Fully Consolidated 100
NGE CONTRACTING Centre d’affaires Edouard VII 20 rue de Caumartin - 75009 PARIS SAS 789 570 009 00017 Fully
Consolidated 100 Fully Consolidated 100
NGE CONTRACTING LLC Rufaa Tower, al Meena Street DOHA SAR CR no/24722 Fully
Consolidated 69.8 Fully Consolidated 69.8
NGE ENERGIES NOUVELLES
Parc d’activités de Laurade 13103 SAINT-ETIENNE-DU-GRES SAS 513 316 018 00011 Fully
Consolidated 100 Fully Consolidated 100
NGE GENIE CIVIL Parc d’activités de Laurade 13103 SAINT-ETIENNE-DU-GRES SAS 487 469 330 00012 Fully
Consolidated 100 Fully Consolidated 100
NGE INFRANET Parc d’activités de Laurade13103 SAINT-ETIENNE-DU-GRES SAS 501 241 624 00045 Fully
Consolidated 100 Fully Consolidated 45
NGE SAUDI ARABIASheikh Abdullah Al Angari Street Al Worood District - P.O. Box 61295RIYADH 11565
LLCLimited Liability
Company
Fully Consolidated 54 Fully
Consolidated 54
NGEAO 16, Boulevard Djily Mbaye DAKAR SAS 005685922 Fully
Consolidated 50 Fully Consolidated 50
NGS Parc d’activités de Laurade 13103 SAINT-ETIENNE-DU-GRES SAS 814 287 892 00016 Fully
Consolidated 50 Fully Consolidated 50
NICOLO Route de la Baronne ZA St Esteve 06640 SAINT JEANNET LES PLANS SAS 408 822 757 00022 Fully
Consolidated 100 Fully Consolidated 100
OFFROY 12 rue Eugène Freyssinet 77500 CHELLES SAS 745 751 693 00037 Fully
Consolidated 100 Fully Consolidated 100
OLICHONRue Jules Védrines Zone Industrielle de Keryado 56100 LORIENT
SAS 865 500 052 00010 Fully Consolidated 100 Fully
Consolidated 100
ONYX PARTICIPATIONS Parc d’activités de Laurade 13103 SAINT-ETIENNE-DU-GRES SAS 813 767 142 00017 TUP - Fully
Consolidated 100
P2R Rue Ampère - ZI du Mariage 69330 PUSIGNAN SARL 421 063 074 00015 Equity
method 23 Equity method 23
PASS 22 bis rue de Romainville 03300 CUSSET SAS 401 528 971 00013 Fully
Consolidated 55 Fully Consolidated 55
12/31/2017 12/31/2016
COMPANY HEAD OFFICE FORM SIRET METHOD % INTEREST METHOD % INTEREST
PEVERAILChemin du Corps de Garde Zone Industrielle 77500 CHELLES
SNC 432 549 590 00011 Fully Consolidated 50 Fully
Consolidated 50
PLATE-FORME Parc d’activités de Laurade13103 SAINT-ETIENNE-DU-GRES SARL 443 642 731 00014 Fully
Consolidated 100 Fully Consolidated 100
PLATEFORE MAROC FORMATION
CASABLANCA Zone Industrielle Sapino - Lot 854 20240 NOUACEUR
SAR Fully Consolidated 100 Fully
Consolidated 100
PORT-ADHOC 14 Avenue de l’Opéra75001 PARIS SAS 478 972 649 00014 Equity
method 27.63 Equity method 25
POSOCCO Plaine Villalbe Basse 11090 VILLALBE SAS 651 850 349 00036 Fully
Consolidated 35 Fully Consolidated 35
RAILSOURCE
Units 25-03 China Insurance Group Building 141 Des Vœux Road Central HONG KONG
SA Fully Consolidated 100 Fully
Consolidated 100
REHACANA Parc d’activités de Laurade 13103 SAINT-ETIENNE-DU-GRES SAS 501 698 153 00019 Fully
Consolidated 100 Fully Consolidated 100
ROCS9 rue Sully Prud’hommesZI N°3 97420 LE PORT
SAS 352 272 439 00022 Fully Consolidated 100 Fully
Consolidated 100
SABLIERE DE LA SALANQUE
Route d’Opoul D5 Sarrat de la Traverse 66600 SALSES LE CHÂTEAU
SAS 624 200 804 00042 Fully Consolidated 50 Fully
Consolidated 50
SABLIERES DE BRAM (Les) Lieu-dit Le Pigné 11290 MONTREAL SAS 521 103 507 00021 Fully
Consolidated 67.5 Fully Consolidated 67.5
SAGE S RAIL 295 Rue Fontfillol Lot B ZAC Les Cadaux - 81370 ST SULPICE SAS 532 596 418 00022 Fully
Consolidated 100 Fully Consolidated 100
SAPAG Rue du Maréchal de Lattre de Tassigny 59170 CROIX SAS 793 165 341 00017 Equity
method 33.2 Equity method 33.2
SCI 22 BIS HIECO 22 Bis Rue de Romainville 03300 CUSSET SCI 385 279 310 00010 TUP - Fully
Consolidated 55
SCI LES CADAUX 295 Rue Fontfillol Lot B 81370 ST SULPICE SCI 749 935 904 00021 Fully
Consolidated 100 Fully Consolidated 51
SDBECentre d’affaires Edouard VII 20 rue de Caumartin 75009 PARIS
SAS 419 921 200 00038 Fully Consolidated 100 Fully
Consolidated 100
SEGAUTO Parc d’activités de Laurade 13103 SAINT-ETIENNE-DU-GRES SAS 513 027 920 00018 Fully
Consolidated 100 Fully Consolidated 100
SEHB 730 Rue de la Calatière - ZI Ouest 01100 VEYZIAT SAS 799 786 496 00015 Fully
Consolidated 80.1 Fully Consolidated 80.1
SERFOTEX Lieudit La Perière 49170 SAINT GERMAIN DES PRES SAS 402 969 117 00041 Fully
Consolidated 100 Fully Consolidated 100
SGL Le Griffolet 19270 USSAC SAS 424 034 056 00020 Fully
Consolidated 95 Fully Consolidated 95
SGTPS16 Rue Claude Chappe ZAC Développement 2000 97420 LE PORT
SAS 383 108 214 00024 TUP - Fully Consolidated 100
SIFEL 12 rue Eugène Freyssinet 77500 CHELLES SAS 385 045 091 00035 Fully
Consolidated 100 Fully Consolidated 100
SIORAT Le Griffolet 19270 USSAC SAS 676 820 137 00054 Fully
Consolidated 100 Fully Consolidated 100
SLD TPPôle Industriel Toul Europe - Secteur B 610 Rue Marie Marvingt 54200 TOUL
SAS 329 702 773 00030 Fully Consolidated 100 Fully
Consolidated 100
SNPT Parc d’activités de Laurade13103 SAINT-ETIENNE-DU-GRES SAS 753 158 666 00028 Fully
Consolidated 100 Fully Consolidated 100
SOC Avenue de Pagnot - Lieudit Maudas 33160 SAINT-MEDARD-EN-JALLES SAS 449 336 924 00013 Fully
Consolidated 100 Fully Consolidated 100
SOCAL 11400 LABECEDE LAURAGAIS SAS 382 184 315 00010 Fully Consolidated 100 Fully
Consolidated 100
SOCIETE DES ENROBES GENEVOIS
Parc d'Activités du Peuras 498 Avenue du Peuras 38210 TULLINS
SAS 808 303 044 00016 Fully Consolidated 35 Fully
Consolidated 35
SOCIETE GENERALE DU CALCAIRE – S.G.C.
Ecart Saint HubertMalancourt-la-Montagne57360 AMNEVILLE
SAS 492 166 905 00025 Fully Consolidated 55 - -
SOCIETES DES ENROBES CLERMONTOIS
ZAC du Chancet 63530 VOLVIC SAS 812 397 602 00010 Equity
method 33 Equity method 33
LIST OF CONSOLIDATED COMPANIES

12/31/2017 12/31/2016
COMPANY HEAD OFFICE FORM SIRET METHOD % INTEREST METHOD % INTEREST
SOTRAC1 Rue Charles FavreZI Nord 39260 MOIRANS-EN-MONTAGNE
SAS 384 713 137 00030 Fully Consolidated 100 Fully
Consolidated 100
SUD FONDATIONS 9 Chemin de Monfaucon33127 MARTIGNAS-SUR-JALLE SAS 399 050 251 00038 Fully
Consolidated 100 Fully Consolidated 100
TCP RAIL IncAvenida Domingo DiazDISTRITO DE SAN MIGUELITOPANAMA
SA Fully Consolidated 50 Fully
Consolidated 50
TP LYAUDET ZA la Courtine 63820 SAINT-JULIEN-PUY-LAVEZE SAS 343 940 490 00018 Fully
Consolidated 100 Fully Consolidated 100
TPRNZone Acticentre – Bâtiment G1156/220 Rue des Famards59273 FRETIN
SAS 332 346 857 00029 Fully Consolidated 100 Fully
Consolidated 100
TSO Chemin du Corps de Garde77508 CHELLES Cedex SAS 747 252 120 00015 Fully
Consolidated 100 Fully Consolidated 100
TSO CATENAIRES Chemin du Corps de Garde77508 CHELLES Cedex SAS 432 455 764 00014 Fully
Consolidated 100 Fully Consolidated 100
TSO-NGE MEXICOAvenida Insurgentes sur NO.813 C.P. 03810CIUDAD DE MEXICO
SA TME1407028Q5 Fully Consolidated 100 Fully
Consolidated 100
TSO RAIL UK 30 Independent Place, London E8 2HE LONDON SARL 10056562 Fully
Consolidated 100 Fully Consolidated 100
TSO SIGNALISATIONChemin du Corps de GardeZone Industrielle77500 CHELLES
SAS 817 401 581 00019 Fully Consolidated 100 Fully
Consolidated 100
VAGLIO SAS Ecart de Saint Hubert57360 AMNEVILLE SAS 302 638 424 00028 Fully
Consolidated 55 - -
VAGLIO LUX 37, rue des Trois CantonsL-3961 EHLANGE-SUR-MESS SA B73.532 Fully
Consolidated 55 - -
VAL TP 730 rue de la Calatière - ZI Ouest Veyziat 01100 OYONNAX SAS 344 187 992 00021 TUP - Fully
Consolidated 100
VALSERHONE Parc d’activités de Laurade 13103 SAINT-ETIENNE-DU-GRES SAS 818 381 675 00011 Fully
Consolidated 100 Fully Consolidated 100
VGC Ecart de Saint Hubert 57360 AMNEVILLE SAS 507 607 307 00018 Fully
Consolidated 77.5 Fully Consolidated 50
Publication manager : NGE Finance DepartmentDesign / Production : horizon-bleu.comPictures supply : photographic library NGEImprimerie LACROIX – Imprim’vert – May 2018

FRENCH MULTI-EXPERTISE BUILDING & PUBLIC WORKS GROUP
PARC D’ACTIVITÉS DE LAURADESAINT-ETIENNE-DU-GRÈS
BP22- 13156 TARASCON CEDEX
TÉL : (+33)4 90 91 60 00
www.nge.fr