consolidated financial statements 2021
TRANSCRIPT
FUJIKURA KASEI Group
Consolidated Financial Statements
as of March 31, 2021
1 Consolidated Balance Sheet
3 Consolidated Statement of Income
4 Consolidated Statement of Changes in Net Assets
6 Notes to Consolidated Financial Statements
Independent Auditor’s Report

1
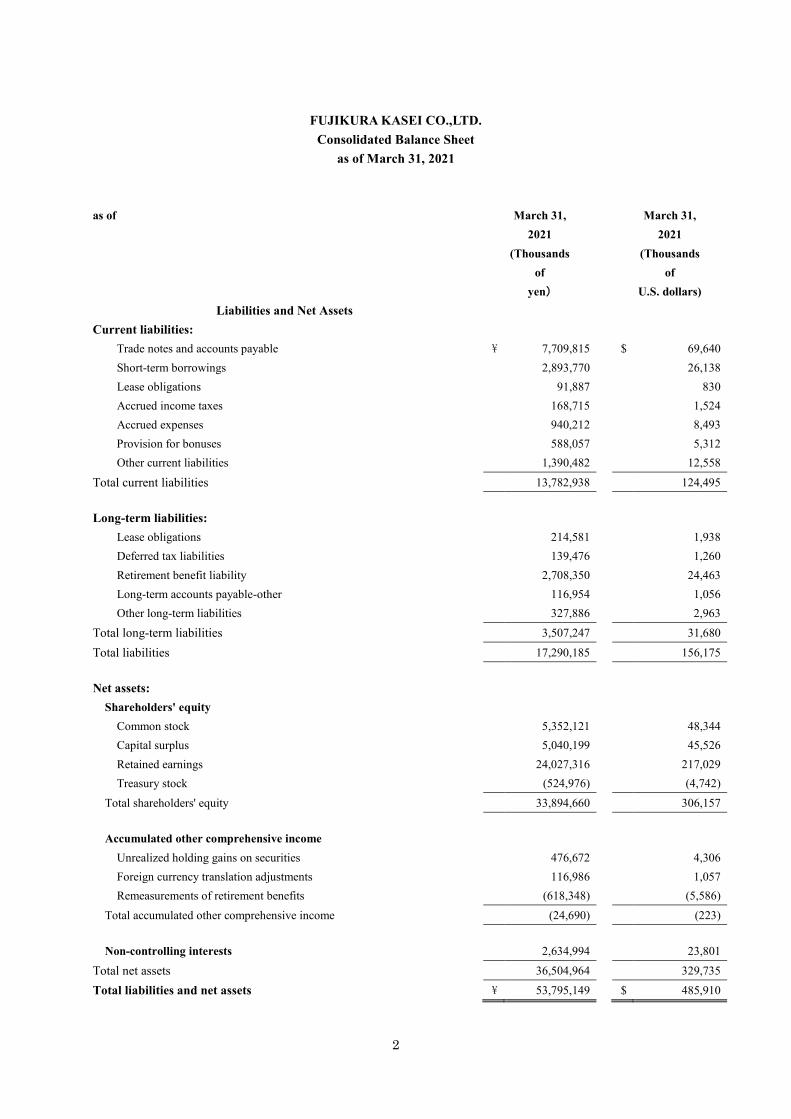
FUJIKURA KASEI CO.,LTD.
Consolidated Balance Sheet as of March 31, 2021
as of March 31, March 31, 2021 2021 (Thousands (Thousands of of yen) U.S. dollars)
Assets
Current assets:
Cash on hand and in banks \ 12,730,767 $ 114,992 Trade notes and accounts receivable 12,866,377 116,217 Merchandise and finished products 3,969,448 35,854 Work in process 56,747 513 Raw materials and supplies 2,353,552 21,259 Other current assets 1,031,110 9,313 Allowance for doubtful accounts (150,949) (1,363)
Total current assets 32,857,052 296,785
Fixed assets:
Property, plant and equipment:
Buildings and structures 5,493,706 49,622 Machinery, equipment and vehicles 2,367,224 21,382 Tools, furniture and fixtures 852,679 7,702 Land 4,492,078 40,575 Lease assets 415,259 3,751 Construction in progress 198,661 1,795 Total property, plant and equipment 13,819,607 124,827
Intangible fixed assets:
Software 150,785 1,362 Others 812,926 7,343 Total intangible fixed assets 963,711 8,705
Investments and other assets
Investment securities 3,038,212 27,443 Long-term loans receivable 67,950 614 Deferred tax assets 599,185 5,412 Other assets 2,888,403 26,089 Allowance for doubtful accounts (438,971) (3,965) Total investments and other assets 6,154,779 55,593 Total fixed assets 20,938,097 189,125
Total assets \ 53,795,149 $ 485,910
2
FUJIKURA KASEI CO.,LTD.
Consolidated Balance Sheet as of March 31, 2021
as of March 31, March 31, 2021 2021 (Thousands (Thousands of of yen) U.S. dollars)
Liabilities and Net Assets
Current liabilities:
Trade notes and accounts payable \ 7,709,815 $ 69,640 Short-term borrowings 2,893,770 26,138 Lease obligations 91,887 830 Accrued income taxes 168,715 1,524 Accrued expenses 940,212 8,493 Provision for bonuses 588,057 5,312 Other current liabilities 1,390,482 12,558
Total current liabilities 13,782,938 124,495
Long-term liabilities:
Lease obligations 214,581 1,938 Deferred tax liabilities 139,476 1,260 Retirement benefit liability 2,708,350 24,463 Long-term accounts payable-other 116,954 1,056 Other long-term liabilities 327,886 2,963 Total long-term liabilities 3,507,247 31,680
Total liabilities 17,290,185 156,175
Net assets:
Shareholders' equity
Common stock 5,352,121 48,344 Capital surplus 5,040,199 45,526 Retained earnings 24,027,316 217,029 Treasury stock (524,976) (4,742) Total shareholders' equity 33,894,660 306,157
Accumulated other comprehensive income
Unrealized holding gains on securities 476,672 4,306 Foreign currency translation adjustments 116,986 1,057 Remeasurements of retirement benefits (618,348) (5,586) Total accumulated other comprehensive income (24,690) (223)
Non-controlling interests 2,634,994 23,801 Total net assets 36,504,964 329,735 Total liabilities and net assets \ 53,795,149 $ 485,910
3
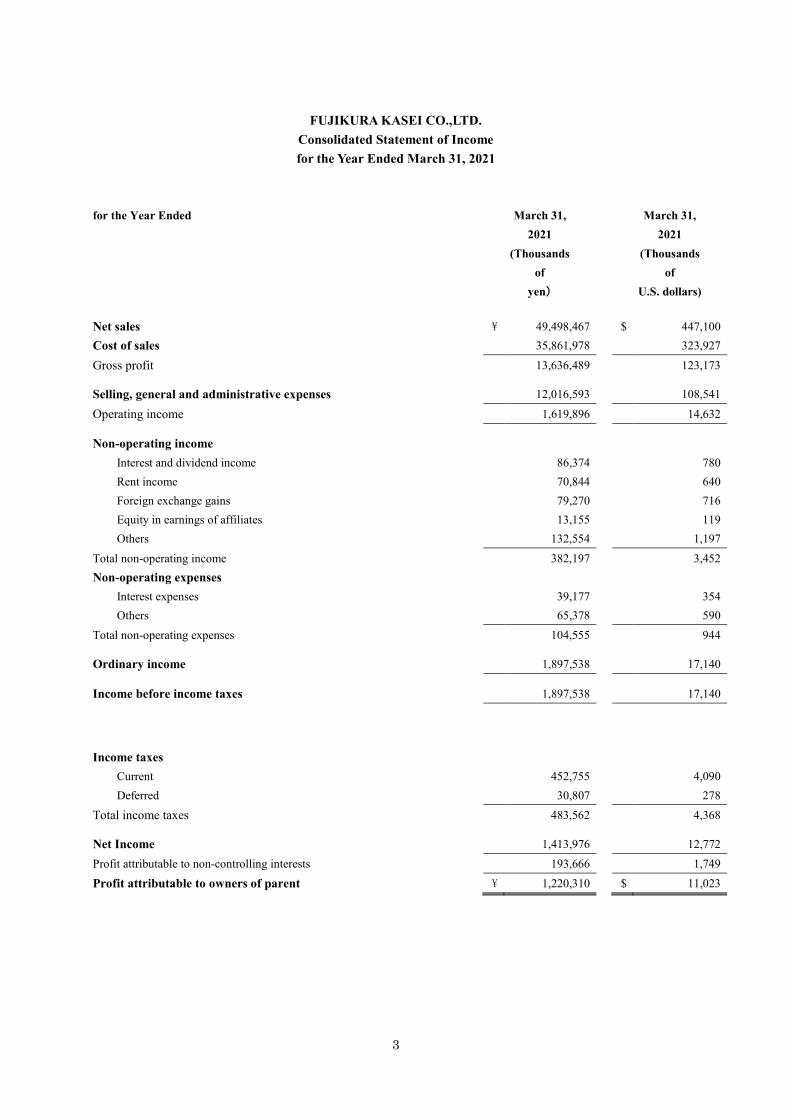
FUJIKURA KASEI CO.,LTD.
Consolidated Statement of Income for the Year Ended March 31, 2021
for the Year Ended March 31, March 31, 2021 2021 (Thousands (Thousands of of yen) U.S. dollars)
Net sales \ 49,498,467 $ 447,100 Cost of sales 35,861,978 323,927
Gross profit 13,636,489 123,173
Selling, general and administrative expenses 12,016,593 108,541
Operating income 1,619,896 14,632
Non-operating income
Interest and dividend income 86,374 780 Rent income 70,844 640 Foreign exchange gains 79,270 716 Equity in earnings of affiliates 13,155 119 Others 132,554 1,197 Total non-operating income 382,197 3,452 Non-operating expenses
Interest expenses 39,177 354 Others 65,378 590 Total non-operating expenses 104,555 944
Ordinary income 1,897,538 17,140
Income before income taxes 1,897,538 17,140
Income taxes
Current 452,755 4,090 Deferred 30,807 278 Total income taxes 483,562 4,368
Net Income 1,413,976 12,772 Profit attributable to non-controlling interests 193,666 1,749 Profit attributable to owners of parent \ 1,220,310 $ 11,023

4
FUJIKURA KASEI CO.,LTD.
Consolidated Statement of Changes in Net Assets for the Year Ended March 31, 2021
(Thousands of yen) Shareholders' equity
Common stock
Capital surplus
Retained earnings
Treasury stock
Total shareholders'
equity Balance at the beginning of the period
\ 5,352,121 \ 5,040,199 \ 23,316,273 \ (524,976) \ 33,183,617
Changes during the year
Cash dividends paid (509,267) (509,267)
Profit attributable to owners 1,220,310
1,220,310
of parent
Net changes in items
- other than those in
shareholders' equity
Total changes during the year - - 711,043 - 711,043
Balance at the end of the period
\ 5,352,121 \ 5,040,199 \ 24,027,316 \ (524,976) \ 33,894,660
(Thousands of yen) Accumulated other comprehensive income
Non-
controlling
interests
Total
net assets
Unrealized
holding gains
on securities
Foreign
currency
translation
adjustments
Remeasure-
ments of
retirement
benefits
Total
accumulated
other
comprehensive
income
Balance at the beginning of the period
\ 153,425 \ 812,968 \ (438,512) \ 527,881 \ 2,674,949 \ 36,386,447
Changes during the year
Cash dividends paid - (509,267)
Profit attributable to owners -
1,220,310
of parent
Net changes in items 323,247 (695,982) (179,836) (552,571) (39,955) (592,526) other than those in
shareholders' equity Total changes during the year 323,247 (695,982) (179,836) (552,571) (39,955) 118,517
Balance at the end of the period
\ 476,672 \ 116,986 \ (618,348) \ (24,690) \ 2,634,994 \ 36,504,964

5
FUJIKURA KASEI CO.,LTD.
Consolidated Statement of Changes in Net Assets for the Year Ended March 31, 2021
(Thousands of U.S. dollars) Shareholders' equity
Common stock
Capital surplus
Retained earnings
Treasury stock
Total shareholders'
equity Balance at the beginning of the period
$ 48,344 $ 45,526 $ 210,606 $ (4,742) $ 299,734
Changes during the year
Cash dividends paid (4,600) (4,600)
Profit attributable to owners 11,023
11,023
of parent
Net changes in items
- other than those in
shareholders' equity
Total changes during the year - - 6,423 - 6,423
Balance at the end of the period
$ 48,344 $ 45,526 $ 217,029 $ (4,742) $ 306,157
(Thousands of U.S. dollars) Accumulated other comprehensive income
Non-
controlling
interests
Total
net assets
Unrealized
holding gains
on securities
Foreign
currency
translation
adjustments
Remeasure-
ments of
retirement
benefits
Total
accumulated
other
comprehensive
income
Balance at the beginning of the period
$ 1,386 $ 7,343 $ (3,961) $ 4,768 $ 24,162 $ 328,664
Changes during the year
Cash dividends paid - (4,600)
Profit attributable to owners -
11,023
of parent
Net changes in items 2,920 (6,286) (1,625) (4,991) (361) (5,352) other than those in
shareholders' equity Total changes during the year 2,920 (6,286) (1,625) (4,991) (361) 1,071
Balance at the end of the period
$ 4,306 $ 1,057 $ (5,586) $ (223) $ 23,801 $ 329,735

6
Notes to Consolidated Financial Statements 1. Notes on significant matters serving as the basis for the preparation of consolidated financial statements,
etc.
(1) Matters related to the scope of consolidation
1) Number of consolidated subsidiaries and names of major consolidated subsidiaries
Number of consolidated subsidiaries: 19 (companies) Names of major consolidated subsidiaries:
Fujichemi Tokyo Co.,Ltd. TOHKOH JUSHI CO.,LTD.
RED SPOT PAINT & VARNISH CO.,INC.
2) Names of major non-consolidated subsidiaries, etc.
Names of major non-consolidated subsidiaries: Chukyo Paint Service Co.,Ltd. FUJIKURA KASEI COATING INDIA PRIVATE LIMITED
Reason for exclusion from the scope of consolidation: Non-consolidated subsidiaries are excluded from the scope of consolidation as they are all small in size and
their total assets, sales, net income or loss (the amount corresponding to equity interest), retained earnings (the amount corresponding to equity interest), etc. in aggregate, do not have significant effect on the consolidated financial statements.
(2) Matters related to the application of the equity method
1) Number of non-consolidated subsidiaries and affiliates to which the equity method is applied and names of
those major companies
Number of non-consolidated subsidiaries and affiliates to which the equity method is applied: 2 (companies) Name of major companies: RED SPOT KOREA INC. PT. FUJIKURA KASEI INDONESIA
2) Names of non-consolidated subsidiaries and affiliates to which the equity method is not applied, etc.
Names of major companies: (Non-consolidated subsidiaries)
Chukyo Paint Service Co.,Ltd. FUJIKURA KASEI COATING INDIA PRIVATE LIMITED
Reason for not applying the equity method: The equity method is not applied to these companies as the impact of excluding these non-consolidated subsidiaries from applying the equity method is insignificant on the consolidated financial statements in view of the net income or loss (the amount corresponding to equity interest) and retained earnings (the amount corresponding to equity interest), etc., and their is immaterial on the whole.
7
3) Matters to be specially mentioned concerning the procedure for applying the equity method Of the companies to which the equity method is applied, we use the financial statements of their most recent
business years when the business year end dates differ from the consolidated account closing date.
(3) Matters related to the business year of consolidated subsidiaries, etc. Of the consolidated subsidiaries, the business year end dates of RED SPOT PAINT & VARNISH CO.,INC. and
15 other companies are December 31, 2020. On preparation of the consolidated financial statements, we use the financial statements as of the business year
end date mentioned above. With respect to significant transactions arising between such date and the consolidated account closing date, we make relevant adjustments required in consolidation.
(4) Matters related to accounting policies
1) Valuation policies and methods for significant assets
i) Valuation policies and methods for securities: Other securities
Marketable securities Marketable securities are stated at market values prevailing on the account closing date. Any
valuation difference is recorded directly in net assets, and the cost of securities sold is calculated on the basis of the moving average method.
Non-marketable securities Non-marketable securities are stated at cost based on the moving average method.
ii) Valuation policies and methods for inventories Inventories are mainly stated at cost based on the gross average method (devaluated on the balance
sheet in the event of profitability deterioration). iii) Valuation method of derivative financial instruments
Consolidated subsidiaries adopt the market value method.
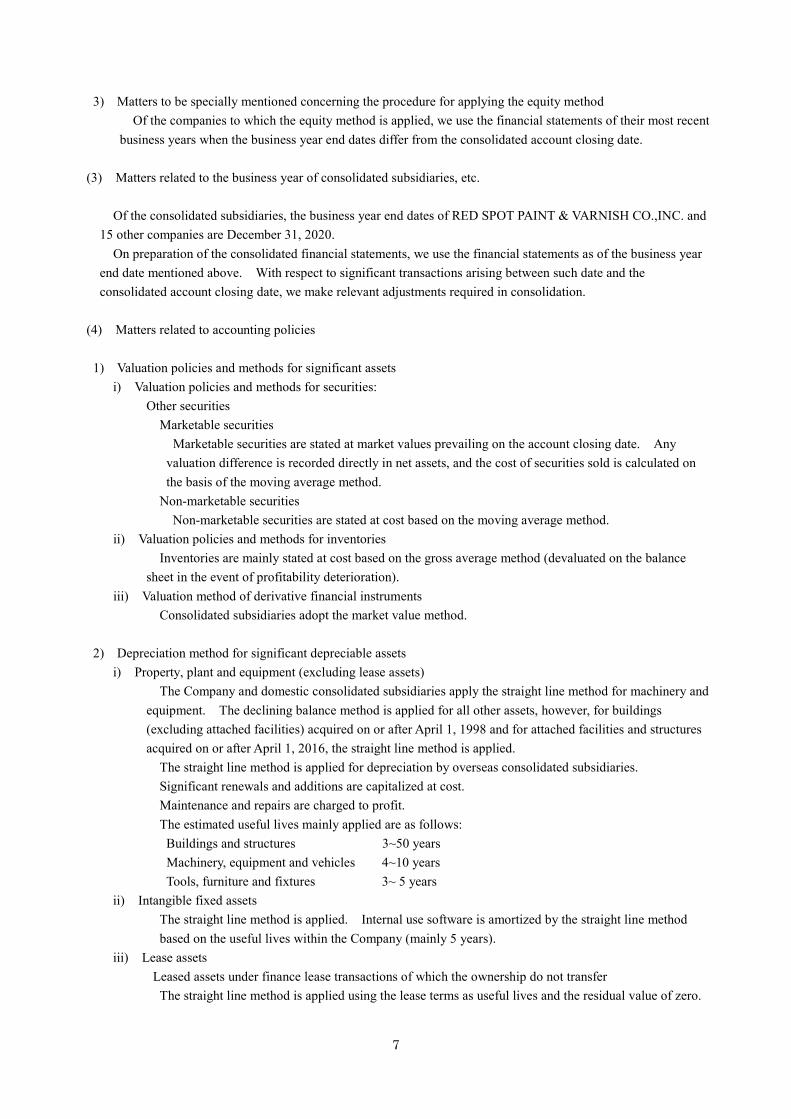
2) Depreciation method for significant depreciable assets i) Property, plant and equipment (excluding lease assets)
The Company and domestic consolidated subsidiaries apply the straight line method for machinery and equipment. The declining balance method is applied for all other assets, however, for buildings (excluding attached facilities) acquired on or after April 1, 1998 and for attached facilities and structures acquired on or after April 1, 2016, the straight line method is applied.
The straight line method is applied for depreciation by overseas consolidated subsidiaries. Significant renewals and additions are capitalized at cost. Maintenance and repairs are charged to profit.
The estimated useful lives mainly applied are as follows: Buildings and structures 3~50 years Machinery, equipment and vehicles 4~10 years Tools, furniture and fixtures 3~ 5 years
ii) Intangible fixed assets The straight line method is applied. Internal use software is amortized by the straight line method based on the useful lives within the Company (mainly 5 years).
iii) Lease assets Leased assets under finance lease transactions of which the ownership do not transfer
The straight line method is applied using the lease terms as useful lives and the residual value of zero.

8
3) Accounting policy for significant allowances and provisions i) Allowance for doubtful accounts
For possible losses on uncollectable receivables, estimates of irrecoverable amounts are based on historical loss ratios for general receivables, and on an individual consideration of recoverability for specific receivables from companies in financial difficulty.
ii) Provision for bonuses For future payment of employee bonuses, the provision for bonuses is attributable to the current fiscal
year.
4) Other significant matters serving as the basis for the preparation of consolidated financial statements i) Accounting policy for consumption taxes Consumption taxes are accounted for by the tax exclusion method.
ii) Accounting policy for retirement benefit liability The Company provides for employee retirement benefits based on the estimated retirement benefit
obligations and plan assets as of March 31, 2021. Upon calculating the retirement benefit obligations, the estimated retirement benefit obligations are
attributed to each period by the benefit formula method. Actuarial gains and losses are mainly amortized from the following year in which the gain or loss is
recognized by the straight line method over certain periods, which are shorter than the average remaining years of service of the employees (mainly 3 years).
(U.S. dollar amounts) The accompanying consolidated financial statements are expressed in yen, and solely for the convenience of the reader, have been translated into U.S. dollars at the rate of ¥110.71=U.S.$1, the approximate rate of exchange prevailing at March 31, 2021. This translation should not be construed as a representation that all amounts shown could be converted into U.S. dollars at such rate.
(Shareholders’ Equity) The Company Law of Japan (the “Law”) provides that an amount equal to 10% of the amount to be distributed as distributions of capital surplus (other than the capital reserve) and retained earnings (other than the legal reserve) be transferred to the capital reserve and the legal reserve, respectively, until the sum of the capital reserve and the legal reserve equals 25% of the common stock account. Such distributions can be made at any time by resolution of the shareholders or by the Board of Directors if certain conditions are met, but neither the capital reserve nor the legal reserve is available for distributions. 2. Notes on changes in presentation (Application of the “Accounting Standard for Disclosure of Accounting Estimates”)
The Company has adopted Accounting Standard for Disclosure of Accounting Estimates (ASBJ Statement No. 31, March 31, 2020) effective from the end of the current consolidated fiscal year. Notes on accounting estimates are provided in the consolidated financial statements.

9
3. Notes on Accounting Estimates (1) Impairment of Fixed assets for Fujichem Sonneborn Ltd 1) Amount recorded in the consolidated financial statements as of March 31, 2021.
An impairment loss: - thousands yen (- thousand U.S. dollars) Property, plant and equipment and intangible fixed assets: 1,456,164 thousand yen (13,153 thousand U.S. dollars)
2) Information that contributes to understanding related to the content of accounting estimates i) Computation method In the consolidated financial statements as of March 31, 2021, the company recognized indication of impairment due to a decrease in profitability by changing an environment about business for cash generation unit related to property, plant and equipment and intangible fixed assets for the consolidated subsidiary, Fujichem Sonneborn Ltd that belongs to the coating segment. But the company reached not to recognized an impairment loss, because the discounted future cash flows which is generated from the cash generation unit would exceed the book balance of them according to the accounting procedure of impairment test. The estimate of future cash flow that would be gained from continuing use of the cash generation unit is based on the business plan and the estimated growth rate covered after the plan within long average growth rate in a market. ii) Key assumptions Key assumptions used for estimates of discounted future cash flows are sales volume which become the basis for the business plan, growth rate applied after the business plan and the discount rate. iii) Impact on the consolidated financial statements in the following fiscal year Key assumptions used for estimates of discounted future cash flows which mentioned above entail uncertainty. On the occurrence of decrease of sales volume in the business plan, slow down the rate of growth or increase of the discount rate, there is a possibility that an impairment loss will be recorded.
4. Notes to the consolidated balance sheet
Thousands of Thousands of yen U.S. dollars
(1) Accumulated depreciation of property, plant and equipment 23,510,886 212,365 (2) Amount of notes endorsed 59,456 537 (3) Guaranteed obligations The Company and consolidated subsidiaries provide the following guarantee to loans from financial institutions of unconsolidated company. TOHOKU TOHKOH CO.,LTD. 80,000 723 (4) Assets pledged as collateral and corresponding liabilities Assets pledged as collateral are as follows: Buildings and structures 24,087 218
Land 47,649 430 total 71,736 648
Liabilities corresponding to the above: Short-term borrowings 842,880 7,613
10
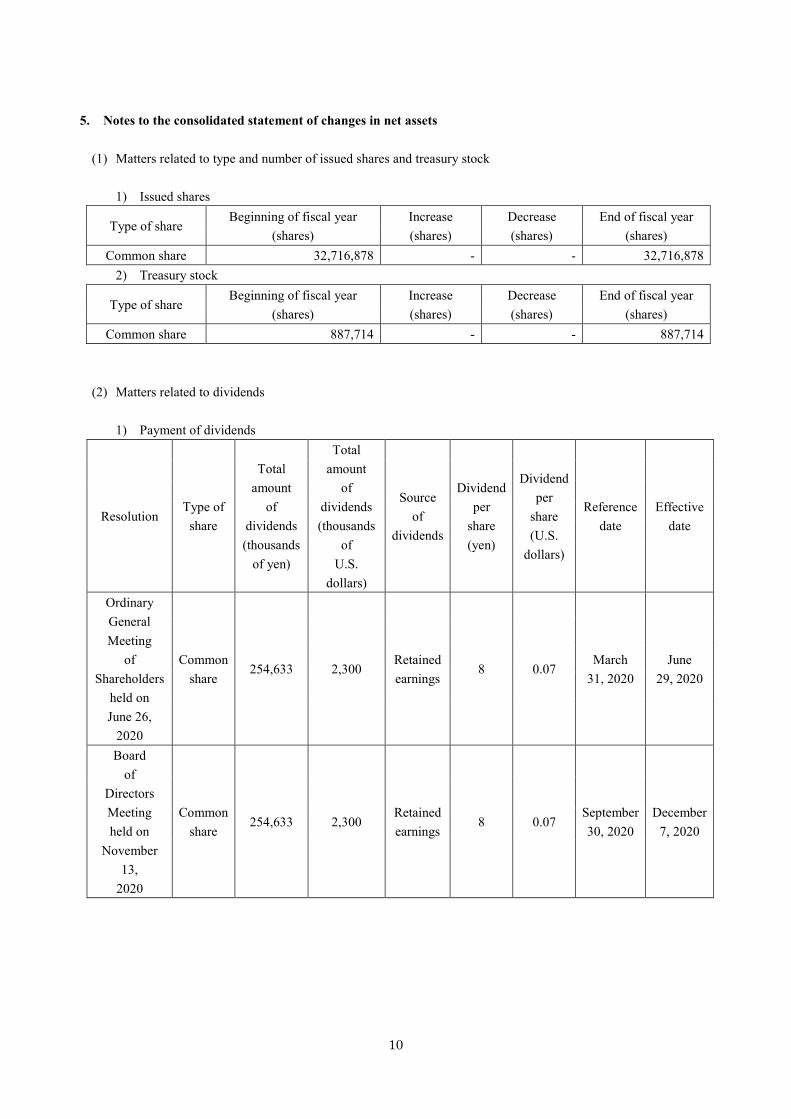
5. Notes to the consolidated statement of changes in net assets
(1) Matters related to type and number of issued shares and treasury stock
1) Issued shares
Type of share Beginning of fiscal year
(shares) Increase (shares)
Decrease (shares)
End of fiscal year (shares)
Common share 32,716,878 - - 32,716,878 2) Treasury stock
Type of share Beginning of fiscal year
(shares) Increase (shares)
Decrease (shares)
End of fiscal year (shares)
Common share 887,714 - - 887,714
(2) Matters related to dividends
1) Payment of dividends
Resolution Type of
share
Total amount
of dividends (thousands
of yen)
Total amount
of dividends (thousands
of U.S.
dollars)
Source of
dividends
Dividend per
share (yen)
Dividend per
share (U.S.
dollars)
Reference date
Effective date
Ordinary General Meeting
of Shareholders
held on June 26,
2020
Common share
254,633 2,300 Retained earnings
8 0.07 March
31, 2020 June
29, 2020
Board of
Directors Meeting held on
November 13,
2020
Common share
254,633 2,300 Retained earnings
8 0.07 September 30, 2020
December 7, 2020

11
2) Dividends with reference date in the current consolidated fiscal year, which will become effective after
March 31, 2021 The Company proposes the following agendum to the ordinary general meeting of shareholders which will be held on June 29, 2021.
Type of share
Total amount of dividends (thousands
of yen)
Total amount
of dividends (thousands of U.S. dollars)
Source of dividends
Dividend per share
(yen)
Dividend per share
(U.S. dollars)
Reference date
Effective date
Common share
254,633 2,300 Retained earnings
8 0.07 March
31, 2021 June
30, 2021
6. Notes related to financial instruments
(1) Matters related to conditions of financial instruments The policy of the Company and consolidated subsidiaries is to manage funds only by short-term deposits,
etc. and to raise funds by borrowings from financial institutions such as banks. The Company and consolidated subsidiaries keep credit risks involving customers with notes receivable and
accounts receivable lower by managing them in accordance with its credit management rules. Investment securities are mainly equity securities, and market values of listed shares are reviewed on a quarterly basis.
Derivative transactions are executed and managed based on the authorizations and amount limitations approved by the board of directors, and are carried out within actual requirements.
(2) Matters related to fair value of financial instruments Carrying amount on the consolidated balance sheet, fair value and difference between the two as of March
31, 2021 are as follows:
(Thousands of yen)
Carrying amount on the consolidated
balance sheet (*1)
Fair value (*1) Difference
(1) Cash on hand and in banks 12,730,767 12,730,767 - (2) Trade notes and accounts receivable 12,866,377 12,866,377 - (3) Investment securities Other securities 1,526,998 1,526,998 - (4) Trade notes and accounts payable (7,709,815) (7,709,815) - (5) Short-term borrowings (2,893,770) (2,893,770) - (6) Derivative transactions (9,875) (9,875) - (*2)
12
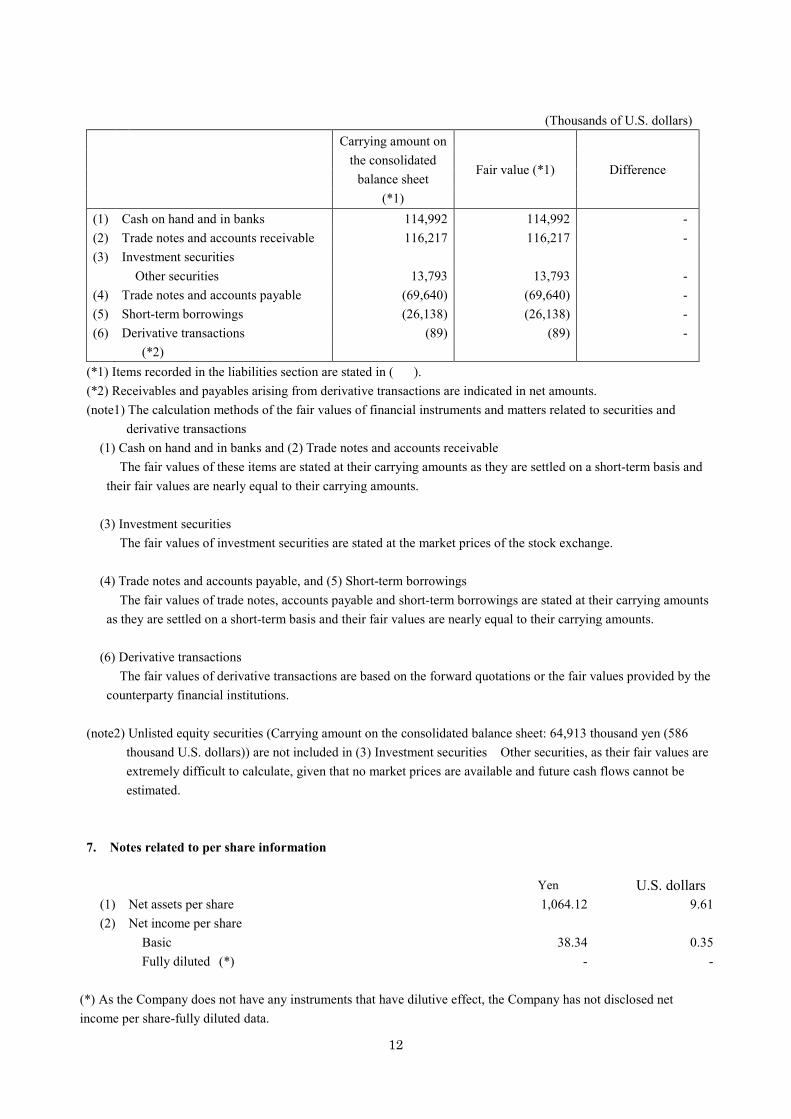
(Thousands of U.S. dollars)
Carrying amount on the consolidated
balance sheet (*1)
Fair value (*1) Difference
(1) Cash on hand and in banks 114,992 114,992 - (2) Trade notes and accounts receivable 116,217 116,217 - (3) Investment securities Other securities 13,793 13,793 - (4) Trade notes and accounts payable (69,640) (69,640) - (5) Short-term borrowings (26,138) (26,138) - (6) Derivative transactions (89) (89) - (*2)
(*1) Items recorded in the liabilities section are stated in ( ). (*2) Receivables and payables arising from derivative transactions are indicated in net amounts. (note1) The calculation methods of the fair values of financial instruments and matters related to securities and
derivative transactions (1) Cash on hand and in banks and (2) Trade notes and accounts receivable
The fair values of these items are stated at their carrying amounts as they are settled on a short-term basis and their fair values are nearly equal to their carrying amounts.
(3) Investment securities The fair values of investment securities are stated at the market prices of the stock exchange. (4) Trade notes and accounts payable, and (5) Short-term borrowings The fair values of trade notes, accounts payable and short-term borrowings are stated at their carrying amounts
as they are settled on a short-term basis and their fair values are nearly equal to their carrying amounts. (6) Derivative transactions The fair values of derivative transactions are based on the forward quotations or the fair values provided by the
counterparty financial institutions. (note2) Unlisted equity securities (Carrying amount on the consolidated balance sheet: 64,913 thousand yen (586
thousand U.S. dollars)) are not included in (3) Investment securities Other securities, as their fair values are extremely difficult to calculate, given that no market prices are available and future cash flows cannot be estimated.
7. Notes related to per share information
Yen U.S. dollars
(1) Net assets per share 1,064.12 9.61 (2) Net income per share
Basic 38.34 0.35 Fully diluted (*) - -
(*) As the Company does not have any instruments that have dilutive effect, the Company has not disclosed net income per share-fully diluted data.

13
The bases for calculation are as follows: Thousands of Thousands of
yen U.S. dollars Profit attributable to owners of parent 1,220,310 11,022.58
Profit attributable to common shareholders 1,220,310 11,022.58
Shares Number of weighted average shares 31,829,164