consolidated financial statements · financial statements consolidated income statement 4...
TRANSCRIPT

blanc
Consolidated financial statements
Year ended December 31, 2018
This document is a free translation into English of the yearly financial report prepared in French and is provided solely for the
convenience of English speaking readers.

Consolidated financial statements 2018 2
Significant events 2018
Notes 2.3.1 and 2.3.2
IFRS
Adoption of IFRS 15 and IFRS 9
IFRS 15 and IFRS 9 standards were applied from January 1, 2018. Information concerning the initial application of IFRS 15 "Revenue from contracts with customers" as at January 1, 2016 and IFRS 9 "Financial instruments" as at January 1, 2018 are presented in Note 2.3 "New standards and interpretations applied from January 1, 2018".
Note 6.2
French part-time for
seniors plans
Signing of a new intergenerational
agreement In December 2018, as part of renegotiations of intergenerational plans in France, the part-time for seniors plans were extended for three years.
Note 3.2
Changes in the scope of
consolidation
Acquisition of Business &
Decision and Basefarm
In June and July 2018, Orange took over the Business & Decision group. In August 2018, Orange acquired 100% of the Basefarm group.

Consolidated financial statements 2018 3
Table of contents
Financial statements
Consolidated income statement 4 Consolidated statement of comprehensive income 5 Consolidated statement of financial position 6 Consolidated statements of changes in shareholders' equity 8 Analysis of changes in shareholders' equity related to components of the other comprehensive income 9 Consolidated statement of cash flows 10
Notes to the consolidated financial statements
NOTE 1 Segment information 12 1.1 Segment revenues 12 1.2 Segment revenues to segment reported EBITDA 14 1.3 Segment reported EBITDA to segment operating income
and segment investments 16 1.4 Segment assets 18 1.5 Segment equity and liabilities 20 1.6 Simplified statement of cash flows on telecommunication
and Orange Bank activities 22 1.7 Reconciliation from adjusted EBITDA to reported EBITDA. 25
NOTE 2 Description of business and basis of preparation of the consolidated financial statements 27
2.1 Description of business 27 2.2 Basis of preparation of the 2018 consolidated financial
statements 27 2.3 New standards and interpretations applied from January 1,
2018 28 2.4 Main standards and interpretations compulsory after
December 31, 2018 with no early application elected by the Group 35
2.5 Accounting policies, use of estimates and judgment 37 NOTE 3 Gains and losses on disposal and main changes in
scope of consolidation 39 3.1 Gains (losses) on disposal of securities and businesses 39 3.2 Main changes in the scope of consolidation 39
NOTE 4 Sales 43 4.1 Revenue 43 4.2 Other operating income 45 4.3 Trade receivables 46 4.4 Customer contract net assets and liabilities 48 4.5 Deferred income 50 4.6 Other assets 51 4.7 Related party transactions 51
NOTE 5 Purchases and other expenses 52 5.1 External purchases 52 5.2 Other operating expenses 52 5.3 Restructuring and integration costs 53 5.4 Broadcasting rights and equipment inventories 54 5.5 Prepaid expenses 55 5.6 Trade payables 55 5.7 Other liabilities 56 5.8 Related party transactions 56
NOTE 6 Employee benefits 57 6.1 Labor expenses 57 6.2 Employee benefits 57 6.3 Share-based payment 61 6.4 Executive compensation 63
NOTE 7 Impairment losses and goodwill 64 7.1 Impairment losses 64 7.2 Goodwill 65 7.3 Key assumptions used to determine recoverable amounts 66 7.4 Sensitivity of recoverable amounts 67
NOTE 8 Fixed assets 70
8.1 Depreciation and amortization 70 8.2 Impairment of fixed assets 71 8.3 Other intangible assets 72 8.4 Property, plant and equipment 74 8.5 Fixed assets payables 75 8.6 Dismantling provision 75
NOTE 9 Taxes 76 9.1 Operating taxes and levies 76 9.2 Income tax 78
NOTE 10 Interests in associates and joint ventures 84 NOTE 11 Financial assets, liabilities and financial results
(excluding Orange Bank) 85 11.1 Financial assets and liabilities of telecom activities 85 11.2 Profits and losses related to financial assets and liabilities 85 11.3 Net financial debt 86 11.4 TDIRA 89 11.5 Bonds 90 11.6 Loans from development organizations and multilateral
lending institutions 91 11.7 Financial assets 92 11.8 Derivatives instruments 95
NOTE 12 Information on market risk and fair value of financial assets and liabilities (excluding Orange Bank) 97
12.1 Interest rate risk management 97 12.2 Foreign exchange risk management 98 12.3 Liquidity risk management 99 12.4 Financial ratios 101 12.5 Credit risk and counterparty risk management 101 12.6 Equity market risk 102 12.7 Capital management 103 12.8 Fair value of financial assets and liabilities 103
NOTE 13 Shareholders' equity 106 13.1 Changes in share capital 106 13.2 Treasury shares 106 13.3 Dividends 107 13.4 Subordinated notes 107 13.5 Translation adjustment 108 13.6 Non-controlling interests 110 13.7 Earnings per share 111
NOTE 14 Unrecognized contractual commitments (excluding Orange Bank) 112
14.1 Operating activities commitments 112 14.2 Consolidation scope commitments 115 14.3 Financing commitments 116
NOTE 15 Activities of Orange Bank 116 15.1 Financial assets and liabilities of Orange Bank 116 15.2 Information on market risk management with respect to
Orange Bank activities 122 15.3 Orange Bank’s unrecognized contractual commitments 124
NOTE 16 Litigation 125 16.1 Litigation in France 125 16.2 Litigation in Spain 127 16.3 Litigation in Europe 127 16.4 Litigation in other entities 128 16.5 Litigation related to banking activities 128 16.6 Other Group litigation 128
NOTE 17 Subsequent events 128 NOTE 18 Main consolidated entities 128 NOTE 19 Auditors’ fees 130 Statutory auditors’ report on the consolidated financial statements 131
The accompanying notes form an integral part of the consolidated financial statements.
The accounting principles are split within each note in gray areas.
Consolidated financial statements 2018 4
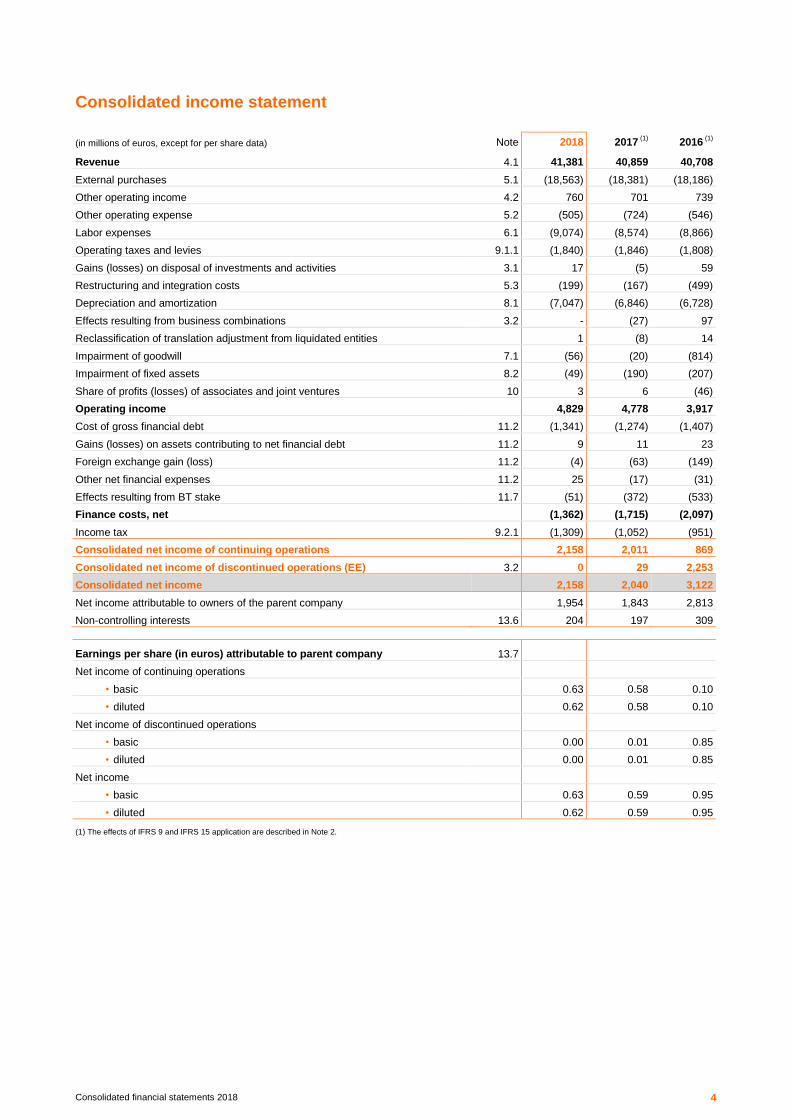
Consolidated income statement
(in millions of euros, except for per share data) Note 2018 2017 (1)
2016 (1)
Revenue 4.1 41,381 40,859 40,708
External purchases 5.1 (18,563) (18,381) (18,186)
Other operating income 4.2 760 701 739
Other operating expense 5.2 (505) (724) (546)
Labor expenses 6.1 (9,074) (8,574) (8,866)
Operating taxes and levies 9.1.1 (1,840) (1,846) (1,808)
Gains (losses) on disposal of investments and activities 3.1 17 (5) 59
Restructuring and integration costs 5.3 (199) (167) (499)
Depreciation and amortization 8.1 (7,047) (6,846) (6,728)
Effects resulting from business combinations 3.2 - (27) 97
Reclassification of translation adjustment from liquidated entities 1 (8) 14
Impairment of goodwill 7.1 (56) (20) (814)
Impairment of fixed assets 8.2 (49) (190) (207)
Share of profits (losses) of associates and joint ventures 10 3 6 (46)
Operating income 4,829 4,778 3,917
Cost of gross financial debt 11.2 (1,341) (1,274) (1,407)
Gains (losses) on assets contributing to net financial debt 11.2 9 11 23
Foreign exchange gain (loss) 11.2 (4) (63) (149)
Other net financial expenses 11.2 25 (17) (31)
Effects resulting from BT stake 11.7 (51) (372) (533)
Finance costs, net (1,362) (1,715) (2,097)
Income tax 9.2.1 (1,309) (1,052) (951)
Consolidated net income of continuing operations 2,158 2,011 869
Consolidated net income of discontinued operations (EE) 3.2 0 29 2,253
Consolidated net income 2,158 2,040 3,122
Net income attributable to owners of the parent company 1,954 1,843 2,813
Non-controlling interests 13.6 204 197 309
Earnings per share (in euros) attributable to parent company 13.7
Net income of continuing operations
• basic 0.63 0.58 0.10
• diluted 0.62 0.58 0.10
Net income of discontinued operations
• basic 0.00 0.01 0.85
• diluted 0.00 0.01 0.85
Net income
• basic 0.63 0.59 0.95
• diluted 0.62 0.59 0.95
(1) The effects of IFRS 9 and IFRS 15 application are described in Note 2.
Consolidated financial statements 2018 5
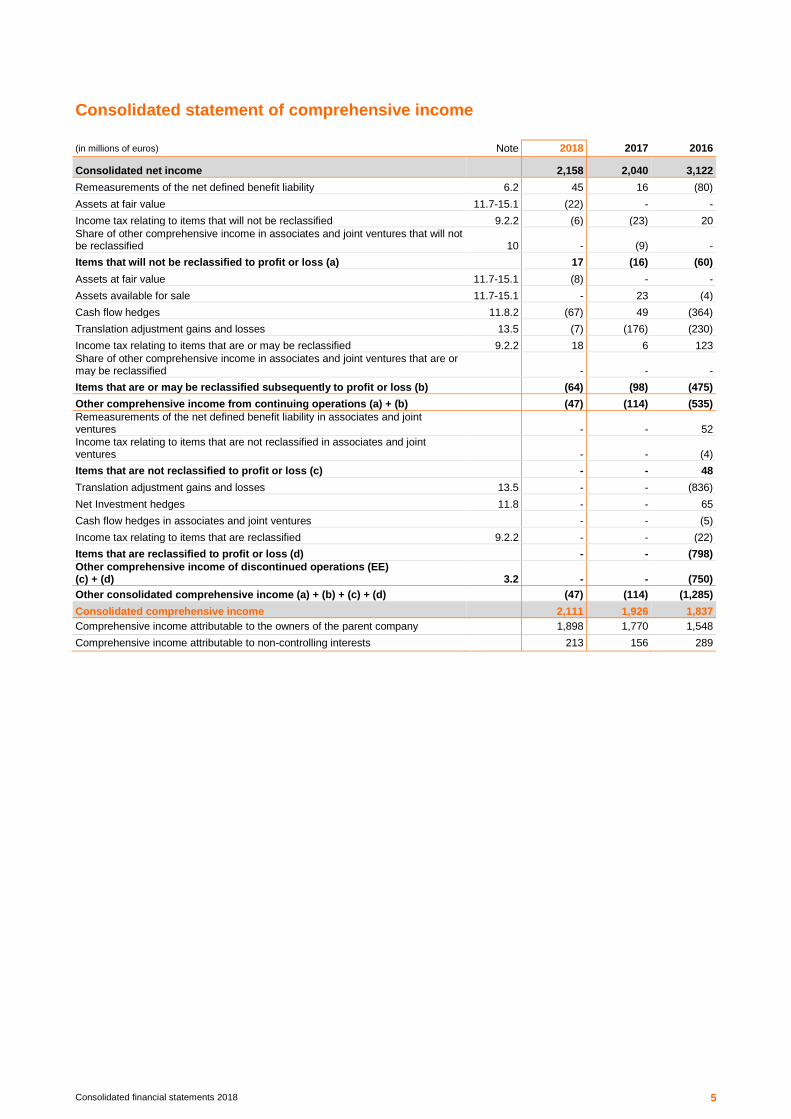
Consolidated statement of comprehensive income
(in millions of euros) Note 2018 2017 2016
Consolidated net income 2,158 2,040 3,122
Remeasurements of the net defined benefit liability 6.2 45 16 (80)
Assets at fair value 11.7-15.1 (22) - -
Income tax relating to items that will not be reclassified 9.2.2 (6) (23) 20
Share of other comprehensive income in associates and joint ventures that will not be reclassified 10 - (9) -
Items that will not be reclassified to profit or loss (a) 17 (16) (60)
Assets at fair value 11.7-15.1 (8) - -
Assets available for sale 11.7-15.1 - 23 (4)
Cash flow hedges 11.8.2 (67) 49 (364)
Translation adjustment gains and losses 13.5 (7) (176) (230)
Income tax relating to items that are or may be reclassified 9.2.2 18 6 123
Share of other comprehensive income in associates and joint ventures that are or may be reclassified
- - -
Items that are or may be reclassified subsequently to profit or loss (b) (64) (98) (475)
Other comprehensive income from continuing operations (a) + (b) (47) (114) (535)
Remeasurements of the net defined benefit liability in associates and joint ventures
- - 52
Income tax relating to items that are not reclassified in associates and joint ventures - - (4)
Items that are not reclassified to profit or loss (c) - - 48
Translation adjustment gains and losses 13.5 - - (836)
Net Investment hedges 11.8 - - 65
Cash flow hedges in associates and joint ventures - - (5)
Income tax relating to items that are reclassified 9.2.2 - - (22)
Items that are reclassified to profit or loss (d) - - (798)
Other comprehensive income of discontinued operations (EE) (c) + (d)
3.2 - - (750)
Other consolidated comprehensive income (a) + (b) + (c) + (d) (47) (114) (1,285)
Consolidated comprehensive income 2,111 1,926 1,837
Comprehensive income attributable to the owners of the parent company 1,898 1,770 1,548
Comprehensive income attributable to non-controlling interests 213 156 289

Consolidated financial statements 2018 6
Consolidated statement of financial position
(in millions of euros) Note December 31,
2018 December 31,
2017 (1)
December 31,
2016 (1)
Assets
Goodwill 7.2 27,174 26,911 26,979
Other intangible assets 8.3 14,073 14,339 14,602
Property, plant and equipment 8.4 27,693 26,665 25,912
Interests in associates and joint ventures 10 104 77 130
Non-current financial assets related to Orange Bank activities 15.1 1,617 1,464 1,523
Non-current financial assets 11.1 2,282 2,247 2,359
Non-current derivatives assets 11.1 263 213 915
Other non-current assets 4.6 129 110 106
Deferred tax assets 9.2.3 1,366 1,586 1,847
Total non-current assets 74,701 73,612 74,373
Inventories 5.4 965 827 819
Trade receivables 4.3 5,295 5,175 4,964
Other customer contract assets 4.4 1,166 1,204 1,335
Current financial assets related to Orange Bank activities 15.1 3,075 3,275 3,336
Current financial assets 11.1 2,748 2,686 1,617
Current derivatives assets 11.1 139 34 57
Other current assets 4.6 1,152 1,094 1,073
Operating taxes and levies receivables 9.1.2 1,027 1,045 918
Current tax assets 9.2.3 119 132 170
Prepaid expenses 5.5 571 455 394
Cash and cash equivalents 11.1 5,634 5,810 6,355
Total current assets 21,891 21,737 21,038
Assets held for sale - - -
Total assets 96,592 95,349 95,411
(1) The effects of IFRS 9 and IFRS 15 application are described in Note 2.

Consolidated financial statements 2018 7
(in millions of euros) Note December 31,
2018 December 31,
2017 (1)
December 31,
2016 (1)
Equity and liabilities
Share capital 10,640 10,640 10,640
Share premiums and statutory reserve 16,859 16,859 16,859
Subordinated notes 5,803 5,803 5,803
Retained earnings (2,633) (2,327) (2,061)
Equity attributable to the owners of the parent company 30,669 30,975 31,241
Non-controlling interests 2,580 2,537 2,604
Total equity 13 33,249 33,512 33,845
Non-current financial liabilities 11.1 26,749 26,293 28,908
Non-current derivatives liabilities 11.1 775 1,002 578
Non-current fixed assets payables 8.5 612 610 907
Non-current financial liabilities related to Orange Bank activities 15.1 0 0 1
Non-current employee benefits 6.2 2,823 2,674 3,029
Non-current provision for dismantling 8.6 765 774 716
Non-current restructuring provision 5.3 230 251 185
Other non-current liabilities 5.7 462 521 608
Deferred tax liabilities 9.2.3 631 655 706
Total non-current liabilities 33,047 32,780 35,638
Current financial liabilities 11.1 7,270 6,030 4,616
Current derivatives liabilities 11.1 133 34 50
Current fixed assets payables 8.5 2,835 3,046 2,800
Trade payables 5.6 6,736 6,527 6,214
Customer contract liabilities 4.4 2,002 2,021 2,071
Current financial liabilities related to Orange Bank activities 15.1 4,835 4,941 4,507
Current employee benefits 6.2 2,392 2,448 2,266
Current provision for dismantling 8.6 11 15 21
Current restructuring provision 5.3 159 126 190
Other current liabilities 5.7 1,788 1,935 1,530
Operating taxes and levies payables 9.1.2 1,322 1,262 1,241
Current tax payables 9.2.3 755 596 338
Deferred income 4.5 58 76 84
Total current liabilities 30,296 29,057 25,928
Liabilities related to assets held for sale - - -
Total equity and liabilities 96,592 95,349 95,411
(1) The effects of IFRS 9 and IFRS 15 application are described in Note 2.

Consolidated financial statements 2018 8
Consolidated statements of changes in shareholders' equity
(in millions of euros) Note
Attributable to owners of the parent company Attributable to non-controlling interests
Total equity
Number of issued shares
Share capital
Share premiums
and statutory reserve
Subor-dinated
notes
Reserves Other compre- hensive income
Total Reserves Other compre- hensive income
Total
Balance at January 1, 2016 2,648,885,383 10,596 16,790 5,803 (3,144) 862 30,907 2,085 275 2,360 33,267
Effect of IFRS 15 application (1)
- - - - 674 - 674 141 - 141 815
Balance at January 1, 2016 after effect of IFRS 15 application 2,648,885,383 10,596 16,790 5,803 (2,470) 862 31,581 2,226 275 2,501 34,082
Consolidated comprehensive income
- - - - 2,813 (1,265) 1,548 309 (20) 289 1,837
Capital increase 11,171,216 44 69 - - - 113 - - - 113
Share-based compensation 6.3 - - - - 52 - 52 6 - 6 58
Purchase of treasury shares 13.2 - - - - 1 - 1 - - - 1
Dividends 13.3 - - - - (1,596) - (1,596) (259) - (259) (1,855)
Subordinated notes remuneration 13.4 - - - - (291) - (291) - - - (291)
Changes in ownership interests with no gain/loss of control 3.2 - - - - (94) - (94) 72 - 72 (22)
Changes in ownership interests with gain/loss of control 3.2 - - - - 70 - 70 (13) - (13) 57
Other movements - - - - (143) - (143) 8 - 8 (135)
Balance at December 31, 2016
(1) 2,660,056,599 10,640 16,859 5,803 (1,658) (403) 31,241 2,349 255 2,604 33,845
Consolidated comprehensive income
- - - - 1,843 (73) 1,770 197 (41) 156 1,926
Share-based compensation 6.3 - - - - 8 - 8 (3) - (3) 5
Purchase of treasury shares 13.2 - - - - (5) - (5) - - - (5)
Dividends 13.3 - - - - (1,729) - (1,729) (234) - (234) (1,963)
Subordinated notes remuneration 13.4 - - - - (282) - (282) - - - (282)
Changes in ownership interests with no gain/loss of control 3.2 - - - - (2) - (2) 2 - 2 -
Other movements - - - - (26) - (26) 12 - 12 (14)
Balance at December 31, 2017
(1) 2,660,056,599 10,640 16,859 5,803 (1,851) (476) 30,975 2,323 214 2,537 33,512
Effect of IFRS 9 application (1)
- - - - 20 (39) (19) (4) - (4) (23)
Balance at January 1, 2018 after effect of IFRS 9 application 2,660,056,599 10,640 16,859 5,803 (1,831) (515) 30,956 2,319 214 2,533 33,489
Consolidated comprehensive income - - - - 1,954 (56) 1,898 204 9 213 2,111
Share-based compensation 6.3 - - - - 46 - 46 4 - 4 50
Purchase of treasury shares 13.2 - - - - (98) - (98) - - - (98)
Dividends 13.3 - - - - (1,860) - (1,860) (246) - (246) (2,106)
Subordinated notes remuneration 13.4 - - - - (280) - (280) - - - (280)
Changes in ownership interests with no gain/loss of control 3.2 - - - - (3) - (3) (9) - (9) (12)
Changes in ownership interests with gain/loss of control 3.2 - - - - - - - 11 - 11 11
Other movements - - - - 10 - 10 74 - 74 84
Balance at December 31, 2018 2,660,056,599 10,640 16,859 5,803 (2,062) (571) 30,669 2,357 223 2,580 33,249
(1) The effects of IFRS 9 and IFRS 15 application are described in Note 2.

Consolidated financial statements 2018 9
Analysis of changes in shareholders' equity related to components of the other comprehensive income
(in millions of euros)
Attributable to owners of the parent company Attributable to non-controlling interests
Total other compre- hensive income
Assets available
for sale
Assets at fair value
Hedging instruments
Translation adjustment
Actuarial gains
and losses
Deferred tax
Other compre- hensive
income of associates
and joint ventures
(2)
Total Assets available
for sale
Assets at fair value
Hedging instruments
Translation adjustment
Actuarial gains
and losses
Deferred tax
Total
Balance at January 1, 2016 36 - 52 1,212 (480) 116 (74) 862 - - (2) 289 (13) 1 275 1,137
Effect of IFRS 15 application
(1) - - - - - - - - - - - - - - - -
Balance at January 1, 2016 after effect of IFRS 15 application 36 - 52 1,212 (480) 116 (74) 862 - - (2) 289 (13) 1 275 1,137
Variation (2) - (301) (1,048) (77) 120 43 (1,265) (2) - 2 (18) (3) 1 (20) (1,285)
Balance at December 31, 2016
(1) 34 - (249) 164 (557) 236 (31) (403) (2) - - 271 (16) 2 255 (148)
Variation 22 - 53 (137) 16 (18) (9) (73) 1 - (4) (39) - 1 (41) (114)
Balance at December 31, 2017
(1) 56 - (196) 27 (541) 218 (40) (476) (1) - (4) 232 (16) 3 214 (262)
Effect of IFRS 9 application
(1) (56) 17 - - - - - (39) 1 (1) - - - - - (39)
Balance at January 1, 2018 after effect of IFRS 9 application - 17 (196) 27 (541) 218 (40) (515) - (1) (4) 232 (16) 3 214 (301)
Variation - (27) (68) (12) 37 14 - (56) - (3) 1 5 8 (2) 9 (47)
Balance at December 31, 2018 - (10) (264) 15 (504) 232 (40) (571) - (4) (3) 237 (8) 1 223 (348)
(1) The effects of IFRS 9 and IFRS 15 application are described in Note 2.
(2) Amounts excluding translation adjustment.
Consolid
ate
d fin
ancia
l sta
tem
ents
2018
9

Consolidated financial statements 2018 10
Consolidated statement of cash flows
(in millions of euros) Note 2018 2017 2016
Operating activities
Consolidated net income 2,158 2,040 3,122
Non-monetary items and reclassified items for presentation
Operating taxes and levies 9.1 1,840 1,846 1,808
Gains (losses) on disposal of investment and activities 3.1 (17) 5 (59)
Gains (losses) on disposal of property, plant and equipment and intangible assets
4.2 (180) (88) (127)
Depreciation and amortization 8.1 7,047 6,846 6,728
Changes in provisions 4-5-6-8 (17) (80) (161)
Remeasurement to fair value of previously held equity interests 3.2 - 27 (97)
Reclassification of cumulative translation adjustment from liquidated entities (1) 8 (14)
Impairment of goodwill 7.1 56 20 814
Impairment of non-current assets 8.2 49 190 207
Share of profits (losses) of associates and joint ventures 10 (3) (6) 46
Net income after tax of discontinued operations (EE) 3.2 (0) (29) (2,253)
Operational net foreign exchange and derivatives 2 2 44
Finance costs, net 11.2 1,362 1,715 2,097
Income tax 9.2 1,309 1,052 951
Share-based compensation 6.3 50 5 61
Changes in working capital
Decrease (increase) in inventories, gross (152) (14) (62)
Decrease (increase) in trade receivables, gross (97) (262) 113
Increase (decrease) in trade payables 177 412 84
Changes in other customer contract assets and liabilities (1)
12 112 66
Changes in other assets and liabilities (2)
(176) 164 (707)
Other net cash out
Operating taxes and levies paid 9.1 (1,777) (1,934) (1,897)
Dividends received other than from EE 51 55 63
Dividends received from EE 3.2 - - 173
Interest paid and interest rates effects on derivatives, net (1,259) (1,329) (1,344)
Income tax paid 9.2.3 (928) (583) (906)
Net cash provided by operating activities (a) 9,506 10,174 8,750
o/w discontinued operations (EE) 3.2 - - 208
Investing activities
Purchases (sales) of property, plant and equipment and intangible assets
Purchases of property, plant and equipment and intangible assets (3)
8.3-8.4 (7,642) (7,527) (8,492)
Increase (decrease) in fixed assets payables (289) (69) 32
Investing donations received in advance 47 71 -
Proceeds from sales of property, plant and equipment and intangible assets 192 147 145
Cash paid for investment securities, net of cash acquired
Basefarm 3.2 (230) - -
Business & Decision 3.2 (36) - -
Liberia 3.2 (3) - (122)
Democratic Republic of the Congo 3.2 - - (178)
Burkina Faso 3.2 21 (10) (515)
Sierra Leone 3.2 19 - (305)
Others (55) (24) (69)
Investments in associates and joint ventures (6) - (17)
Other purchases of assets available for sale - (43) (12)
Purchases of equity securities measured at fair value (104) (7) (1)
Proceeds from sales of EE 3.2 - 50 4,481
Proceeds from sales of BT 11.7 53 433 -
Proceeds from sales of investment securities, net of cash transferred 3.2 57 32 107
Decrease (increase) in securities and other financial assets
Investments at fair value, excluding cash equivalents 55 (1,013) (501)
Other (4)
(631) 19 568
Net cash used in investing activities (b) (8,552) (7,941) (4,879)
o/w discontinued operations (EE) 3.2 - - 4,481

Consolidated financial statements 2018 11
(in millions of euros) Note 2018 2017 2016
Financing activities
Medium and long-term debt issuances 11.5-11.6 5,214 2,450 3,411
Medium and long-term debt redemptions and repayments (5)
11.5-11.6 (4,095) (2,728) (2,694)
Increase (decrease) of bank overdrafts and short-term borrowings (43) 949 134
Decrease (increase) of cash collateral deposits 208 (1,127) (884)
Exchange rates effects on derivatives, net 7 (66) 201
Coupon on subordinated notes 13.4 (280) (282) (291)
Purchases of treasury shares - Orange Vision 2020 free share award plan 13.2 (101) - -
Other proceeds (purchases) from treasury shares 13.2 3 (4) 2
Capital increase (decrease) - owners of the parent company 13.1 - - 113
Capital increase (decrease) - non-controlling interests 68 34 (4)
Changes in ownership interests with no gain / loss of control (6) 1 (16)
Dividends paid to owners of the parent company 13.3 (1,860) (1,729) (1,596)
Dividends paid to non-controlling interests 13.6 (246) (236) (259)
Net cash used in financing activities (c) (1,131) (2,738) (1,883)
o/w discontinued operations (EE) - - (220)
Net change in cash and cash equivalents (a) + (b) + (c) (177) (505) 1,988
Net change in cash and cash equivalents
Cash and cash equivalents in the opening balance 5,810 6,355 4,469
o/w continuing operations 5,810 6,355 4,469
o/w discontinued operations - - -
Cash change in cash and cash equivalents (177) (505) 1,988
Non-cash change in cash and cash equivalents 1 (40) (102)
Effect of exchange rates changes on cash and cash equivalents and other non-monetary effects 1 - -
Cash and cash equivalents in the closing balance 5,634 5,810 6,355
(1) The effects of IFRS 9 and IFRS 15 application are described in Note 2.
(2) Of which flows from operating activities related to Orange Bank and excluding operating tax receivables and payables. In 2016, the variance is mainly due to the payment of the fine for the Enterprise Market competition litigation for (350) million euros.
(3) Investments in property, plant, equipment and intangible assets financed through finance leases amounting to 136 million euros at December 31, 2018 (43 million euros at December 31, 2017 and 91 million euros at December 31, 2016) have no impact on the statement of cash flows at the time of acquisition.
(4) Of which escrowed amount of (346) million euros relating to the Digicel litigation (see Note 16.1).
(5) Of which TDIRA buy-backs (see Note 11.4)

Consolidated financial statements 2018 12
NOTE 1 Segment information
1.1 Segment revenue
France Spain
Europe
(1)
(in millions of euros)
December 31, 2018
Revenue (4)
18,211 5,349
5,687
Convergence services 4,458
2,143 467
Mobile services only 2,348
1,215 2,194
Fixed services only 4,168
496 697
IT & integration services -
1 158
Wholesale 5,342
810 1,150
Equipment sales 1,410
684 868
Other revenue 485
- 153
External 17,615
5,299 5,601
Inter-operating segments 596
50 86
December 31, 2017
Revenue (4)
18,046 5,231
5,578
Convergence services 4,045 2,078 305
Mobile services only 2,409
1,229 2,254
Fixed services only 4,344
501 757
IT & integration services -
- 129
Wholesale 5,388
754 1,133
Equipment sales 1,386
669 840
Other revenue 474
- 160
External 17,463
5,177 5,496
Inter-operating segments 583
54 82
December 31, 2016
Revenue (4)
17,896 4,909
5,482
Convergence services 3,598
1,855 193
Mobile services only 2,612
1,260 2,332
Fixed services only 4,567
475 803
IT & integration services -
- 107
Wholesale 5,294
676 1,079
Equipment sales 1,340
643 789
Other revenue 485
- 179
External 17,322
4,874 5,417
Inter-operating segments 574
35 65
(1) See Note 1.7
(2) Including, in 2018, revenue of 5 207 million euros in France, 21 million euros in Spain, 665 million euros in other European countries and 1,399 million euros in other countries. Including, in 2017, revenue of 5,235 million euros in France, 34 million euros in Spain, 654 million euros in other European countries and 1,328 million euros in other countries. Including, in 2016, revenue of 5,303 million euros in France, 37 million euros in Spain, 688 million euros in other European countries and 1,318 million euros in other countries.
(3) Including revenue of 1,412 million euros in France in 2018, 1,530 million euros in 2017 and 1,711 million euros in 2016.
(4) The description of product lines is presented in Note 4.1.

Consolidated financial statements 2018 13
Africa & Middle-East
Enterprise (2)
International Carriers &
Shared Services
(3)
Elimination telecom
activities
Total telecom activities
Orange Bank Eliminations
telecom activities /
bank
Orange consoli-
dated financial
statements
5,190 7,292 1,534
(1,879)
41,384
-
(3)
41,381
- - - - 7,068 -
-
7,068
3,809 743 - (37) 10,272 -
-
10,272
435 3,997 - (189) 9,604 -
-
9,604
21 2,312 - (141) 2,351 -
(2)
2,349
811 35 1,150 (1,367) 7,931 -
-
7,931
85 205 - (7) 3,245 -
-
3,245
29 - 384 (138) 913 -
(1)
912
4,980 6,914 972 - 41,381 -
-
41,381
210 378 562 (1,879) 3 -
(3)
-
5,030 7,251 1,651
(1,926)
40,861
-
(2)
40,859
- - - (1) 6,427 -
-
6,427
3,600 751 - (41) 10,202 -
-
10,202
431 4,152 - (191) 9,994 -
-
9,994
7 2,092 - (150) 2,078 -
(1)
2,077
894 32 1,275 (1,411) 8,065 -
-
8,065
66 224 - - 3,185 -
-
3,185
32 - 376 (132) 910 -
(1)
909
4,779 6,860 1,084 - 40,859 -
-
40,859
251 391 567 (1,926) 2 -
(2)
-
5,245 7,346 1,812
(1,982)
40,708
-
-
40,708
- - - - 5,646 -
-
5,646
3,686 775 - (51) 10,614 -
-
10,614
437 4,304 - (233) 10,353 -
-
10,353
7 2,067 - (131) 2,050 -
-
2,050
1,026 32 1,431 (1,435) 8,103 -
-
8,103
81 168 - (1) 3,020 -
-
3,020
8 - 381 (131) 922 -
-
922
4,971 6,926 1,198 - 40,708 -
-
40,708
274 420 614 (1,982) - -
-
-

Consolidated financial statements 2018 14
1.2 Segment revenue to segment reported EBITDA
(in millions of euros)
France Spain Europe Africa &
Middle-East Enterprise
December 31, 2018
Revenue 18,211
5,349
5,687
5,190
7,292
External purchases (7,167)
(3,204)
(3,412)
(2,521)
(3,696)
Other operating income 1,377
190
175
88
148
Other operating expenses (535)
(211)
(168)
(231)
(661)
Labor expenses (3,833)
(263)
(681)
(468)
(1,718)
Operating taxes and levies (977)
(161)
(93)
(391)
(120)
Gains (losses) on disposal -
-
-
-
-
Restructuring and integration costs -
-
-
-
-
Adjusted EBITDA (1)
7,076 1,700
1,508
1,667
1,245
Significant litigations -
(31)
-
-
-
Specific labour expenses (614) -
-
-
(68)
Investments and businesses portfolio review - -
-
-
-
Restructuring and integration costs (114) (9)
(6)
(12)
(24)
Reported EBITDA (1)
6,348 1,660
1,502
1,655
1,153
December 31, 2017
Revenue 18,046
5,231
5,578
5,030
7,251
External purchases (7,123)
(3,157)
(3,368)
(2,444)
(3,735)
Other operating income 1,460
110
173
79
169
Other operating expenses (553)
(202)
(149)
(209)
(652)
Labor expenses (3,987)
(255)
(690)
(426)
(1,588)
Operating taxes and levies (965)
(160)
(88)
(418)
(139)
Gains (losses) on disposal -
-
-
-
-
Restructuring and integration costs -
-
-
-
-
Adjusted EBITDA (1)
6,878 1,567
1,456
1,612
1,306
Significant litigations (115)
-
-
-
-
Specific labour expenses (307) -
1
-
(15)
Investments and businesses portfolio review - -
(1)
-
-
Restructuring and integration costs (12) (4)
(39)
(21)
(33)
Reported EBITDA (1)
6,444 1,563
1,417
1,591
1,258
December 31, 2016
Revenue 17,896
4,909
5,482
5,245
7,346
External purchases (7,023)
(3,049)
(3,200)
(2,575)
(3,748)
Other operating income 1,501
127
145
124
173
Other operating expenses (525)
(203)
(119)
(270)
(687)
Labor expenses (4,149)
(249)
(653)
(460)
(1,608)
Operating taxes and levies (971)
(184)
(97)
(406)
(140)
Gains (losses) on disposal -
-
-
-
-
Restructuring and integration costs -
-
-
-
-
Adjusted EBITDA (1)
6,729 1,351
1,558
1,658
1,336
Significant litigations -
-
-
-
-
Specific labour expenses (435) -
-
-
(17)
Investments and businesses portfolio review - -
-
16
47
Restructuring and integration costs (166) (127)
(15)
(36)
(74)
Other special items - -
-
-
-
Reported EBITDA (1)
6,128 1,224
1,543
1,638
1,292
(1) Report to Note 1.7 for EBITDA adjustments.
(2) Orange Bank's net banking income is recognized in other operating income and amounts to 43 million euros in 2018. The cost of risk is included in other operating expenses and amounts to (7) million euros in 2018. Orange Bank's net banking income is recognized in other operating income and amounts to 73 million euros in 2017. The cost of risk is included in other operating expenses and amounts to (6) million euros in 2017. Orange Bank's net banking income is recognized in other operating income and amounts to 21 million euros in 2016. The cost of risk is included in other operating expenses and amounts to (2) million euros in 2016.
(3) Presentation adjustments allow the reallocation of the lines of specific items identified in the segment information to the operating revenue and expense lines presented in the consolidated income statement.

Consolidated financial statements 2018 15
International Carriers &
Shared Services
Elimination telecom
activities
Total telecom activities
Orange Bank
(2)
Eliminations telecom
activities / bank
Total Presentation
adjustments (3)
Orange
consolidated financial
statements
1,534 (1,879) 41,384 -
(3)
41,381
-
41,381
(2,469) 3,990 (18,479) (87)
3
(18,563)
-
(18,563)
2,226 (3,468) 736 44
(20)
760
-
760
(35) 1,357 (484) (33)
21
(496)
(9)
(505)
(1,235) - (8,198) (70)
-
(8,268)
(806)
(9,074)
(66) - (1,808) (1)
-
(1,809)
(31)
(1,840)
- - - -
-
-
17
17
- - - -
-
-
(199)
(199)
(45) - 13,151 (147)
1
13,005
(1,028)
(2) - (33) -
-
(33)
33
-
(129) - (811) (1)
-
(812)
812
-
17 - 17 -
-
17
(17)
-
(35) - (200) -
-
(200)
200
-
(194) - 12,124 (148)
1
11,977
-
11,977
1,651 (1,926) 40,861 -
(2)
40,859
-
40,859
(2,771) 4,278 (18,320) (63)
2
(18,381)
-
(18,381)
2,366 (3,741) 616 78
(7)
687
14
701
(52) 1,389 (428) (14)
8
(434)
(290)
(724)
(1,192) - (8,138) (62)
-
(8,200)
(374)
(8,574)
(80) - (1,850) (1)
-
(1,851)
5
(1,846)
- - - -
-
-
(5)
(5)
- - - -
-
-
(167)
(167)
(78) - 12,741 (62)
1
12,680
(817)
(156) - (271) -
-
(271)
271
-
(53) - (374) -
-
(374)
374
-
(4) - (5) -
-
(5)
5
-
(58) - (167) -
-
(167)
167
-
(349) - 11,924 (62)
1
11,863
-
11,863
1,812 (1,982) 40,708 -
-
40,708
-
40,708
(2,943) 4,368 (18,170) (16)
-
(18,186)
-
(18,186)
2,444 (3,802) 712 20
-
732
7
739
(67) 1,416 (455) (2)
-
(457)
(89)
(546)
(1,207) - (8,326) (14)
-
(8,340)
(526)
(8,866)
(95) - (1,893) -
-
(1,893)
85
(1,808)
- - - -
-
-
59
59
- - - -
-
-
(499)
(499)
(56) - 12,576 (12)
-
12,564
(963)
10 - 10 -
-
10
(10)
-
(73) - (525) -
-
(525)
525
-
(4) - 59 -
-
59
(59)
-
(81) - (499) -
-
(499)
499
-
(8) - (8) -
-
(8)
8
-
(212) - 11,613 (12)
-
11,601
-
11,601

Consolidated financial statements 2018 16
1.3 Segment reported EBITDA to segment operating income and segment investments
France Spain Europe
(in millions of euros)
December 31, 2018
Reported EBITDA 6,348
1,660
1,502
Depreciation and amortization (3,148)
(1,105)
(1,164)
Reclassification of cumulative translation
adjustment from liquidated entities -
-
-
Impairment of goodwill -
-
-
Impairment of fixed assets (2)
-
1
Share of profits (losses) of associates and joint ventures -
-
-
Operating income 3,198
555
339
December 31, 2017
Reported EBITDA 6,444
1,563
1,417
Depreciation and amortization (3,073)
(1,008)
(1,157)
Effects resulting from business combinations -
-
-
Reclassification of cumulative translation
adjustment from liquidated entities -
-
-
Impairment of goodwill -
-
(19)
Impairment of fixed assets (3)
-
(1)
Share of profits (losses) of associates and joint ventures -
-
-
Operating income 3,368
555
240
December 31, 2016
Reported EBITDA 6,128
1,224
1,543
Depreciation and amortization (2,823)
(946)
(1,169)
Effects resulting from business combinations -
-
-
Reclassification of cumulative translation
adjustment from liquidated entities -
-
-
Impairment of goodwill -
-
(549)
Impairment of fixed assets (1)
-
-
Share of profits (losses) of associates and joint ventures -
-
6
Operating income 3,304
278
(169)
December 31, 2018
Investments in property, plant and equipment and intangible assets
Capex (3)
3,656 1,120 953
Telecommunications licenses (1)
149 10
Finance leases 1
70 32
Total investments (4)
3,656 1,339
995
December 31, 2017
Investments in property, plant and equipment and intangible assets
Capex (3)
3,451 1,115
897
Telecommunications licenses 11
10 -
Finance leases 1
4 11
Total investments (5)
3,463 1,129
908
December 31, 2016
Investments in property, plant and equipment and intangible assets
Capex (3)
3,421 1,086
874
Telecommunications licenses - 51
728
Finance leases - 4
3
Total investments (6)
3,421 1,141
1,605
(1) Including investments in tangible and intangible assets for 275 million euros in France in 2018, 285 million euros in 2017 and 248 million euros in 2016.
(2) Including investments in tangible and intangible assets for 312 million euros in France in 2018, 280 million euros in 2017 and 329 million euros in 2016.

Consolidated financial statements 2018 17
Africa & Middle-East
Enterprise(1)
International Carriers &
Shared Services
(2)
Elimination telecom
activities
Total telecom activities
Orange Bank Eliminations telecom
activities / bank
Orange consolidated
financial statements
1,655 1,153 (194) - 12,124 (148) 1 11,977
(906) (387) (316) - (7,026) (21) - (7,047)
- - 1 - 1 - - 1
(56) - - - (56) - - (56)
(46) - (2) - (49) - - (49)
12 (1) (8) - 3 - - 3
659 765 (519) - 4,997 (169) 1 4,829
1,591 1,258 (349) - 11,924 (62) 1 11,863
(902) (371) (331) - (6,842) (4) - (6,846)
- - - - - (27) - (27)
- - (8) - (8) - - (8)
(1) - - - (20) - - (20)
(180) 1 (7) - (190) - - (190)
14 1 (9) - 6 - - 6
522 889 (704) - 4,870 (93) 1 4,778
1,638 1,292 (212) - 11,613 (12) - 11,601
(1,056) (376) (358) - (6,728) - - (6,728)
- - - - - 97 - 97
- 1 13 - 14 - - 14
(265) - - - (814) - - (814)
(204) (1) (1) - (207) - - (207)
(45) - (7) - (46) - - (46)
68 916 (565) - 3,832 85 - 3,917
1,008 353 316 - 7,406 36 - 7,442
42 - - - 200 - - 200
2 31 - - 136 - - 136
1,052 384 316 - 7,742 36 - 7,778
1,021 382 282 - 7,148 61 - 7,209
297 - - - 318 - - 318
1 24 2 - 43 - - 43
1,319 406 284 - 7,509 61 - 7,570
962 336 277 - 6,956 15 - 6,971
742 - - - 1,521 - - 1,521
4 24 56 - 91 - - 91
1,708 360 333 - 8,568 15 - 8,583
(3) CAPEX related to tangible and intangible investments except telecommunications licenses and financial leases and they are used internally to allocate resources. CAPEX are not a financial aggregate defined by IFRS and may not be comparable to similarly titled indicators used by other companies.
(4) Including 1,895 million euros for other intangible assets and 5,883 million euros for tangible assets.
(5) Including 1,893 million euros for other intangible assets and 5,677 million euros for tangible assets.
(6) Including 3,007 million euros for other intangible assets and 5,567 million euros for tangible assets.

Consolidated financial statements 2018 18
1.4 Segment assets
France Spain Europe
(in millions of euros)
December 31, 2018
Goodwill 14,364 6,840 2,581
Other intangible assets 3,921 1,778 2,015
Property, plant and equipment 14,306 3,730 4,150
Interests in associates and joint ventures - 1 4
Non-current assets included in the calculation of net financial debt - - -
Other 11 17 15
Total non-current assets 32,602 12,366 8,765
Inventories 505 79 171
Trade receivables 1,506 699 1,227
Other customer contract assets 443 140 363
Prepaid expenses 68 241 35
Current assets included in the calculation of net financial debt - - -
Other 776 60 75
Total current assets 3,298 1,219 1,871
Assets held for sale - - -
Total assets 35,900 13,585 10,636
December 31, 2017
Goodwill 14,364 6,818 2,589
Other intangible assets 4,099 1,742 2,204
Property, plant and equipment 13,637 3,542 4,236
Interests in associates and joint ventures - 1 4
Non-current assets included in the calculation of net financial debt - - -
Other 4 17 16
Total non-current assets 32,104 12,120 9,049
Inventories 402 79 149
Trade receivables 1,590 686 1,143
Other customer contract assets 451 132 411
Prepaid expenses 76 152 37
Current assets included in the calculation of net financial debt - - -
Other 828 64 45
Total current assets 3,347 1,113 1,785
Assets held for sale - - -
Total assets 35,451 13,233 10,834
December 31, 2016
Goodwill 14,364 6,818 2,576
Other intangible assets 4,269 1,861 2,332
Property, plant and equipment 13,054 3,313 4,124
Interests in associates and joint ventures - 1 6
Non-current assets included in the calculation of net financial debt - - -
Other 4 16 15
Total non-current assets 31,691 12,009 9,053
Inventories 433 73 132
Trade receivables 1,515 729 911
Other customer contract assets 475 146 497
Prepaid expenses 70 92 41
Current assets included in the calculation of net financial debt - - -
Other 532 13 21
Total current assets 3,025 1,053 1,602
Assets held for sale - - -
Total assets 34,716 13,062 10,655 (1) Including in 2018 tangible and intangible assets for 632 million euros in France, 565 million euros in 2017 and 541 million euros in 2016.
(2) Including in 2018 tangible and intangible assets for 2,151 million euros in France, 2,144 million euros in 2017 and 2,203 million euros in 2016. Intangible assets also include the Orange brand for 3,133 million euros.

Consolidated financial statements 2018 19
Africa & Middle-East
Enterprise (1)
International Carriers &
Shared Services
(2)
Eliminations telecom
activities and unallocated
items
Total telecom activities
Orange Bank
Eliminations telecom
activities / bank
Orange consolidated
financial statements
1,542 1,830 17 - 27,174 - - 27,174
2,106 388 3,780 1 13,989 84 - 14,073
3,443 540 1,519 - 27,688 5 - 27,693
82 - 17 - 104 - - 104
- - - 816 816 - - 816
23 23 19 3,123 (3)
3,231 1,637 (4)
(27) 4,841
7,196 2,781 5,352 3,940 73,002 1,726 (27) 74,701
82 49 79 - 965 - - 965
761 821 946 (631) 5,329 - (34) 5,295
8 212 - - 1,166 - - 1,166
89 71 82 (17) 569 2 - 571
- - - 7,886 7,886 - - 7,886
811 174 374 51 2,321 3,687 (5)
- 6,008
1,751 1,327 1,481 7,289 18,236 3,689 (34) 21,891
- - - - - - - -
8,947 4,108 6,833 11,229 91,238 5,415 (61) 96,592
1,629 1,493 18 - 26,911 - - 26,911
2,160 342 3,720 1 14,268 71 - 14,339
3,193 479 1,575 - 26,662 3 - 26,665
70 1 1 - 77 - - 77
- - - 895 895 - - 895
13 22 18 3,166 (3)
3,256 1,496 (4)
(27) 4,725
7,065 2,337 5,332 4,062 72,069 1,570 (27) 73,612
78 45 74 - 827 - - 827
690 807 881 (613) 5,184 - (9) 5,175
- 210 - - 1,204 - - 1,204
67 48 93 (19) 454 1 - 455
- - - 8,014 8,014 - - 8,014
757 165 268 146 2,273 3,941 (5)
(152) 6,062
1,592 1,275 1,316 7,528 17,956 3,942 (161) 21,737
- - - - - - - -
8,657 3,612 6,648 11,590 90,025 5,512 (188) 95,349
1,709 1,497 15 - 26,979 - - 26,979
2,103 327 3,694 - 14,586 16 - 14,602
3,270 487 1,662 - 25,910 2 - 25,912
111 1 11 - 130 - - 130
- - - 980 980 - - 980
14 21 18 4,156 (3)
4,244 1,553 (4)
(27) 5,770
7,207 2,333 5,400 5,136 72,829 1,571 (27) 74,373
84 50 49 (2) 819 - - 819
701 784 864 (540) 4,964 - - 4,964
- 217 - - 1,335 - - 1,335
66 43 95 (14) 393 1 - 394
- - - 7,899 7,899 - - 7,899
638 151 384 437 2,176 3,451 (5)
- 5,627
1,489 1,245 1,392 7,780 17,586 3,452 - 21,038
- - - - - - - -
8,696 3,578 6,792 12,916 90,415 5,023 (27) 95,411
(3) Including in 2018, 659 million euros of BT shares, 814 million euros in 2017 and 1,709 million euros in 2016 (see Note 11.7).
(4) Including in 2018, 1,617 million euros of non-current financial assets related to Orange Bank activities, 1,464 million euros in 2017 and 1,523 million euros in 2016 (see Note 15.1.1).
(5) Including in 2018, 3,075 million euros of current financial assets related to Orange Bank activities, 3,275 million euros in 2017 and 3,336 million euros in 2016 (see Note 15.1.1).

Consolidated financial statements 2018 20
1.5 Segment equity and liabilities
France Spain Europe
(in millions of euros)
December 31, 2018
Equity - - -
Fixed assets payables 48 119 291
Non-current employee benefits 1,726 11 33
Non-current liabilities included in the calculation of net financial debt - - -
Other 635 126 243
Total non-current liabilities 2,409 256 567
Fixed assets payables 1,116 598 398
Trade payables 2,598 1,055 926
Customer contracts liabilities 1,091 66 322
Current employee benefits 1,307 38 102
Deferred income 2 - 3
Current liabilities included in the calculation of net financial debt - - -
Other 846 148 253
Total current liabilities 6,960 1,905 2,004
Liabilities related to assets held for sale - - -
Total equity and liabilities 9,369 2,161 2,571
December 31, 2017
Equity - - -
Fixed assets payables 75 - 327
Non-current employee benefits 1,601 5 33
Non-current liabilities included in the calculation of net financial debt - - -
Other 663 134 263
Total non-current liabilities 2,339 139 623
Fixed assets payables 1,438 532 392
Trade payables 2,487 985 843
Customer contracts liabilities 1,162 78 280
Current employee benefits 1,451 38 109
Deferred income 3 - 3
Current liabilities included in the calculation of net financial debt - - -
Other 699 126 467
Total current liabilities 7,240 1,759 2,094
Liabilities related to assets held for sale - - -
Total equity and liabilities 9,579 1,898 2,717
December 31, 2016
Equity - - -
Fixed assets payables 322 - 363
Non-current employee benefits 1,895 - 34
Non-current liabilities included in the calculation of net financial debt - - -
Other 695 151 194
Total non-current liabilities 2,912 151 591
Fixed assets payables 1,293 539 393
Trade payables 2,355 886 722
Customer contracts liabilities 1,188 76 275
Current employee benefits 1,369 36 98
Deferred income 5 - 3
Current liabilities included in the calculation of net financial debt - - -
Other 429 103 381
Total current liabilities 6,639 1,640 1,872
Liabilities related to assets held for sale - - -
Total equity and liabilities 9,551 1,791 2,463 (1) Including in 2018, 90 million euros of non-current financial liabilities, 100 million euros in 2017 and 95 million euros in 2016.
(2) Including in 2018, 4,835 million euros of current financial liabilities related to Orange Bank activities (see Note 15.1). Including in 2017, 4,941 million euros of current financial liabilities related to Orange Bank activities. Including in 2016, 4,507 million euros of current financial liabilities related to Orange Bank activities.

Consolidated financial statements 2018 21
Africa & Middle-East
Enterprise International Carriers &
Shared Services
Eliminations telecom
activities and unallocated
items
Total telecom activities
Orange Bank
Eliminations telecom
activities / bank
Orange consolidated
financial statements
- - - 33,151 33,151 98 - 33,249
154 - - - 612 - - 612
64 264 717 - 2,815 8 - 2,823
- - - 27,461 27,461 - - 27,461
59 46 180 791 2,080 98 (1)
(27) 2,151
277 310 897 28,252 32,968 106 (27) 33,047
528 58 138 (1) 2,835 - - 2,835
1,081 689 917 (631) 6,635 135 (34) 6,736
127 283 129 (16) 2,002 - - 2,002
68 398 471 - 2,384 8 - 2,392
44 2 7 - 58 - - 58
- - - 7,403 7,403 - - 7,403
1,069 273 833 381 3,803 5,067 (2)
- 8,870
2,917 1,703 2,495 7,136 25,120 5,210 (34) 30,296
- - - - - - - -
3,194 2,013 3,392 68,539 91,239 5,414 (61) 96,592
- - - 33,285 33,285 227 - 33,512
208 - - - 610 - - 610
77 259 693 - 2,668 6 - 2,674
- - - 27,221 27,221 - - 27,221
50 31 218 836 2,195 107 (1)
(27) 2,275
335 290 911 28,057 32,694 113 (27) 32,780
530 52 102 (1) 3,045 1 - 3,046
1,072 694 977 (614) 6,444 92 (9) 6,527
130 271 120 (20) 2,021 - - 2,021
69 348 426 - 2,441 7 - 2,448
87 - 5 (22) 76 - - 76
- - - 6,216 6,216 - - 6,216
905 252 897 457 3,803 5,072 (2)
(152) 8,723
2,793 1,617 2,527 6,016 24,046 5,172 (161) 29,057
- - - - - - - -
3,128 1,907 3,438 67,358 90,025 5,512 (188) 95,349
- - - 33,560 33,560 285 - 33,845
221 - - 1 907 - - 907
70 312 713 (1) 3,023 6 - 3,029
- - - 29,420 29,420 - - 29,420
56 33 177 901 2,207 102 (1)
(27) 2,282
347 345 890 30,321 35,557 108 (27) 35,638
418 46 104 1 2,794 6 - 2,800
1,073 665 1,008 (541) 6,168 46 - 6,214
142 293 110 (13) 2,071 - - 2,071
68 348 342 - 2,261 5 - 2,266
93 - 6 (23) 84 - - 84
- - - 4,666 4,666 - - 4,666
828 235 791 487 3,254 4,573 (2)
- 7,827
2,622 1,587 2,361 4,577 21,298 4,630 - 25,928
- - - - - - - -
2,969 1,932 3,251 68,458 90,415 5,023 (27) 95,411

Consolidated financial statements 2018 22
1.6 Simplified statement of cash flows on telecommunication and Orange Bank activities
2018
(in millions of euros)
Telecom activities
Orange Bank
Eliminations telecom
activities / Orange
Bank
Orange consoli-
dated financial
statement
Operating activities
Consolidated net income 2,326 (168) - 2,158
Non-monetary items and reclassified items for presentation 11,457 40 - 11,497
Changes in working capital
Decrease (increase) in inventories, gross (152) - - (152)
Decrease (increase) in trade receivables, gross (122) - 25 (97)
Increase (decrease) in trade payables 158 44 (25) 177
Changes in other customer contract assets and liabilities 12 - - 12
Changes in other assets and liabilities (95) (81) - (176)
Other net cash out
Operating taxes and levies paid (1,776) (1) - (1,777)
Dividends received 51 - - 51
Interest paid and interest rates effects on derivatives, net (1,259) - - (1,259)
Income tax paid (928) - - (928)
Net cash provided by operating activities (a) 9,672 (166) - 9,506
Investing activities
Purchases (sales) of property, plant and equipment and intangible assets (7,655) (37) - (7,692)
Cash paid for investment securities, net of cash acquired (284) - - (284)
Investments in associates and joint ventures (6) - - (6)
Others purchases of assets available for sale - - - -
Purchases of equity securities measured at fair value (90) (14) - (104)
Proceeds from sales of investment securities, net of cash transferred 110 - - 110
Decrease (increase) in securities and other financial assets (501) 77 (152) (576)
Net cash used in investing activities (b) (8,426) 26 (152) (8,552)
Financing activities
Cash flows from financing activities
Medium and long-term debt issuances 5,214 - - 5,214
Medium and long-term debt redemptions and repayments (4,095) - - (4,095)
Increase (decrease) of bank overdrafts and short-term borrowings (251) 56 152 (43)
Decrease (increase) of cash collateral deposits 203 5 - 208
Exchange rates effects on derivatives, net 7 - - 7
Other cash flows
Coupon on subordinated notes (280) - - (280)
Purchases of treasury shares - Orange Vision 2020 free share award plan (101) - - (101)
Other proceeds (purchases) from treasury shares 3 - - 3
Capital increase (decrease) - non-controlling interests (87) (1)
155 (1)
- 68
Changes in ownership interests with no gain / loss of control (6) - - (6)
Dividends paid to owners of the parent company (1,860) - - (1,860)
Dividends paid to non-controlling interests (246) - - (246)
Net cash used in financing activities (c) (1,499) 216 152 (1,131)
Cash and cash equivalents in the opening balance 5,333 477 - 5,810
Cash change in cash and cash equivalents (a) + (b) + (c) (253) 76 - (177)
Effect of exchange rates changes on cash and cash equivalents and other non-monetary effects 1 - - 1
Cash and cash equivalents in the closing balance 5,081 553 - 5,634
(1) Of which 101 million euros in Orange Bank share capital invested by Orange.

Consolidated financial statements 2018 23
2017
(in millions of euros)
Telecom activities
Orange Bank
Eliminations telecom
activities / Orange
Bank
Orange consoli-
dated financial
statement
Operating activities
Consolidated net income 2,134 (94) - 2,040
Non-monetary items and reclassified items for presentation 11,474 38 - 11,512
Changes in working capital
Decrease (increase) in inventories, gross (14) - - (14)
Decrease (increase) in trade receivables, gross (271) - 9 (262)
Increase (decrease) in trade payables 375 46 (9) 412
Changes in other customer contract assets and liabilities 112 - - 112
Changes in other assets and liabilities (120) 284 - 164
Other net cash out
Operating taxes and levies paid (1,931) (3) - (1,934)
Dividends received 55 - - 55
Interest paid and interest rates effects on derivatives, net (1,328) (0) - (1,328)
Income tax paid (584) 1 - (583)
Net cash provided by operating activities (a) 9,902 272 - 10,174
Investing activities
Purchases (sales) of property, plant and equipment and intangible assets (7,311) (67) - (7,378)
Cash paid for investment securities, net of cash acquired (34) - - (34)
Others purchases of assets available for sale (43) - - (43)
Purchases of equity securities measured at fair value (7) - - (7)
Proceeds from sales of investment securities, net of cash transferred 515 - - 515
Decrease (increase) in securities and other financial assets (1,082) (63) 151 (994)
Net cash used in investing activities (b) (7,962) (130) 151 (7,941)
Financing activities
Cash flows from financing activities
Medium and long-term debt issuances 2,450 - - 2,450
Medium and long-term debt redemptions and repayments (2,728) - - (2,728)
Increase (decrease) of bank overdrafts and short-term borrowings 964 136 (151) 949
Decrease (increase) of cash collateral deposits (1,138) 11 - (1,127)
Exchange rates effects on derivatives, net (66) - - (66)
Other cash flows
Coupon on subordinated notes (282) - - (282)
Other proceeds (purchases) from treasury shares (4) - - (4)
Capital increase (decrease) - non-controlling interests (66) (1)
100 (1)
- 34
Changes in ownership interests with no gain / loss of control 1 - - 1
Dividends paid to owners of the parent company (1,729) - - (1,729)
Dividends paid to non-controlling interests (236) - - (236)
Net cash used in financing activities (c) (2,834) 247 (151) (2,738)
Cash and cash equivalents in the opening balance 6,267 88 - 6,355
Cash change in cash and cash equivalents (a) + (b) + (c) (894) 389 - (505)
Effect of exchange rates changes on cash and cash equivalents and other non-monetary effects (40) - - (40)
Cash and cash equivalents in the closing balance 5,333 477 - 5,810
(1) Of which 65 million euros in Orange Bank share capital invested by Orange.

Consolidated financial statements 2018 24
2016
(in millions of euros)
Telecom activities
Orange Bank
Eliminations telecom
activities / Orange
Bank
Orange consoli-
dated financial
statement
Operating activities
Consolidated net income 3,036 86 - 3,122
Non-monetary items and reclassified items for presentation 10,144 (99) - 10,045
Changes in working capital
Decrease (increase) in inventories, gross (62) - - (62)
Decrease (increase) in trade receivables, gross 113 - - 113
Increase (decrease) in trade payables 82 2 - 84
Changes in other customer contract assets and liabilities 66 - - 66
Changes in other assets and liabilities (507) (200) - (707)
Other net cash out
Operating taxes and levies paid (1,896) (1) - (1,897)
Dividends received 236 - - 236
Interest paid and interest rates effects on derivatives, net (1,345) 1 - (1,344)
Income tax paid (906) (0) - (906)
Net cash provided by operating activities (a) 8,961 (211) - 8,750
Investing activities
Purchases (sales) of property, plant and equipment and intangible assets (8,306) (9) - (8,315)
Cash paid for investment securities, net of cash acquired (1,244) 55 (1)
- (1,189)
Investments in associates and joint ventures (17) - - (17)
Others purchases of assets available for sale (12) - - (12)
Purchases of equity securities measured at fair value (1) - - (1)
Proceeds from sales of investment securities, net of cash transferred 4,588 - - 4,588
Decrease (increase) in securities and other financial assets (65) 105 27 67
Net cash used in investing activities (b) (5,057) 151 27 (4,879)
Financing activities
Cash flows from financing activities
Medium and long-term debt issuances 3,411 27 (27) 3,411
Medium and long-term debt redemptions and repayments (2,667) (27) - (2,694)
Increase (decrease) of bank overdrafts and short-term borrowings 90 44 - 134
Decrease (increase) of cash collateral deposits (888) 4 - (884)
Exchange rates effects on derivatives, net 201 - - 201
Other cash flows
Coupon on subordinated notes (291) - - (291)
Other proceeds (purchases) from treasury shares 2 - - 2
Capital increase (decrease) - owners of the parent company 113 - - 113
Capital increase (decrease) - non-controlling interests (104)(2)
100(2)
- (4)
Changes in ownership interests with no gain / loss of control (16) - - (16)
Dividends paid to owners of the parent company (1,596) - - (1,596)
Dividends paid to non-controlling interests (259) - - (259)
Net cash used in financing activities (c) (2,004) 148 (27) (1,883)
Cash and cash equivalents in the opening balance 4,469 - - 4,469
Cash change in cash and cash equivalents (a) + (b) + (c) 1,900 88 - 1,988
Effect of exchange rates changes on cash and cash equivalents and other non-monetary effects (102) - - (102)
Cash and cash equivalents in the closing balance 6,267 88 - 6,355
(1) Related to Orange Bank cash acquired.
(2) Of which 65 million euros in Orange Bank share capital invested by Orange.

Consolidated financial statements 2018 25
1.7 Reconciliation from adjusted EBITDA to reported EBITDA.
The expenses relating to significant litigations correspond to the reassessment of the risk related to various disputes.
The specific labor expenses predominantly reflect the impact of changes in assumptions and experience adjustments of the
various “part-time for seniors plans” (TPS) in France. In 2018, these are mainly related to the effect of the three-year extension
of the 2015 French part-time for seniors plans (see Note 6.2).
The review of the investments and business portfolio in 2016 included the gains on disposal of Fime amounting to 49 million
euros.
The restructuring and integration costs are presented in Note 5.3.
The other specific items in 2016 included the costs of the non-completed Bouygues transaction.
Changes in the presentation of segment information
The new organization of the Executive Committee of Orange group, in place since May 2, 2018, has led the Group to re-
examine the presentation of its segment information without however modifying the definition of operating segments and Cash
Generating Units (CGUs).
The 2017 and 2016 segment data presented reflect these changes.
Decisions on the allocation of resources and the performance assessment of Orange component parts (hereinafter referred to
as “the Group”) are made by the Chairman and Chief Executive Officer (main operational decision-maker) at operating
segment level, mainly consisting of the geographical establishements. The operating segments are:
France (Enterprise excluded);
Spain;
Poland, Belgium and Luxembourg, and each Central European countries (the Europe aggregate combines the operating
segments of this area);
Sonatel subgroup (gathering Sonatel entities in Senegal, Orange Mali, Orange Bissau, Orange in Guinea and Orange in
Sierra Leone), the Côte d'Ivoire subgroup (including Orange Côte d'Ivoire entities, Orange in Burkina Faso and Orange in
Liberia) and each of the other countries in Africa and Middle-East (the Africa and Middle-East aggregate combines the
operating segments of this area);
Enterprise;
The activities of International Carriers and Shared Services (IC&SS), which contain certain resources, mainly in the areas of
networks and information systems, research and development and other shared Group activities, as well as the Orange
brand;
Orange Bank.
Accounting policies
Segment information
The use of shared resources, mainly provided by IC&SS, is taken into account in segment results based either on the terms of
contractual agreements between legal entities, or external benchmarks, or by allocating costs among all the segments. The
supply of shared resources is included in other revenues of the service provider, and the use of the resources is included in
expenses taken into account for the calculation of the service user’s EBITDA. The cost of shared resources may be affected by
changes in contractual relationships or organization and may therefore impact the segment results disclosed from one year to
another.
Adjusted EBITDA and reported EBITDA are operating performance indicators used by the Group:
to manage and assess its operating and segment results; and
to implement its investment and resource allocation strategy.
The Group’s management believes that the presentation of these indicators is relevant as it provides readers with the same
management indicators as those used internally.
Reported EBITDA corresponds to operating income before depreciation and amortization, effects associated with takeovers,
reversal of translation reserves of liquidated entities, impairment of goodwill and fixed assets and share of profits (losses) of
associates and joint ventures.
Adjusted EBITDA corresponds to reported EBITDA, adjusted for significant litigation, specific labor expenses, review of the
investments and business portfolio, restructuring and integration costs and, where appropriate, other specific elements.
This measurement indicator allows for the effects of certain specific factors to be isolated from reported EBITDA, irrespective of
their recurrence and the type of income or expense, when they are linked to:
significant litigation:
Associated procedures are based on third-party decisions (regulatory authority, court, etc.) and occurring over a different

Consolidated financial statements 2018 26
period to the activities at the source of the litigation. By their very nature, costs are difficult to predict in terms of their
source, amount and period.
specific labor expenses:
Independently of the departure plans included under restructuring costs, certain changes in the working hours of
employees may have a negative impact on the period during which they are agreed and implemented. This primarily
relates to the various “part-time for seniors plans” (TPS) in France.
review of the investments and business portfolio:
The Group regularly reviews its investments and business portfolio: as part of this review, decisions to dispose of assets
are implemented, which by their very nature have an impact on the period during which the disposal takes place. The
corresponding gains (losses) on disposal affect either reported EBITDA or the net income from discontinued operations.
restructuring and integration costs:
The adjustment of Group activities in line with changes in the business environment may also incur other types of
transformation costs. These actions may have a negative effect on the period during which they are announced or
implemented; for instance but not limited to, some of the transformation plans approved by the internal governance bodies.
where applicable, other specific elements that are systematically specified in relation to income and/or expenses.
Adjusted EBITDA and reported EBITDA are not financial aggregates as defined by IFRS and are not comparable to similarly
titled indicators used by other groups. They are provided as additional information only and should not be considered as a
substitute for operating income or cash flow provided by operating activities.
CAPEX relate to the acquisition of tangible and intangible assets excluding telecommunications licenses and investments
financed through finance leases and are used internally as an indicator to allocate resources. CAPEX are not a financial
aggregate defined by IFRS and may not be comparable to similarly-titled indicators used by other companies.
Inter-segment assets and liabilities are reported in each operating segment.
Non-allocated assets and liabilities for the telecommunications business, mainly include external financial debt, external cash
and cash equivalents, current and deferred tax assets and liabilities, as well as equity. Financial debt and investments between
these segments are presented as non-allocated elements.
For Orange Bank, the line “Other” includes the assets and liabilities listed above, as well as the loans and receivables and
debts related to the Bank’s activity.
The other accounting policies are presented within each note to which they refer.
Consolidated financial statements 2018 27
NOTE 2 Description of business and basis of preparation of the consolidated financial statements
2.1 Description of business
Orange provides consumers, businesses and other telecommunications operators with a wide range of services including fixed
telephony and mobile telecommunications, data transmission and other value-added services, mainly in Europe, Africa and
Middle East. The Group is also developing its activity in the mobile financial services.
Telecommunications operator activities are regulated and dependent upon the granting of licenses, just as mobile financial
service activities have their own regulations.
2.2 Basis of preparation of the 2018 consolidated financial statements
The consolidated financial statements were approved by the Board of Directors’ Meeting on February 20, 2019 and will be
submitted for approval at the Shareholders’ Meeting on May 21, 2019.
The 2018 consolidated annual financial statements have been prepared in accordance with the International Financial Reporting
Standards (IFRSs) as endorsed by the European Union. Comparative figures are presented for 2017 and 2016 using the same
basis of preparation.
For the reported periods, the accounting standards and interpretations endorsed by the European Union are similar to the
compulsory standards and interpretations published by the International Accounting Standards Board (IASB) with the exception
of the texts currently being endorsed, that have no effect on the Group accounts. Consequently, the Group financial statements
are prepared in accordance with the IFRS standards and interpretations, as published by the IASB.
The principles applied to prepare the 2018 financial data are based on:
all the standards and interpretations endorsed by the European Union compulsory as of December 31, 2018;
options taken relating to date and methods of first application (see 2.3 below);
the recognition and measurement alternatives allowed by the IFRSs:
Standard Alternative used
IAS 1
Accretion expense on operating liabilities (employee benefits, environmental liabilities) and licenses
Classification as financial expenses
IAS 2 Inventories Measurement of inventories determined by the weighted average unit cost method
IAS 7 Interest paid and received dividends
Classification as net operating cash flows
IAS 16 Property, Plant and Equipment Measurement at amortized historical cost
IAS 38 Intangible Assets Measurement at amortized historical cost
IFRS 3R Non-controlling interests At the acquisition date, measurement either at fair value or at the portion of the net identifiable asset of the acquired entity
accounting positions adopted by the Group in accordance with paragraphs 10 to 12 of IAS 8:
Topic Note
Presentation of consolidated financial statements Financial statements and segment information
Operating taxes and levies 9.1
Income taxes 9.2
Non-controlling interests
Change in ownership interest in a subsidiary
Transactions with owners
3 & 13.6
In the absence of any accounting standard or interpretation, management uses its judgment to define and apply an accounting
policy that will result in relevant and reliable information, such that the financial statements:
fairly present the Group’s financial position, financial performance and cash flows;
reflect the economic substance of transactions;
are neutral;
are prepared on a prudent basis; and
are complete in all material respects.

Consolidated financial statements 2018 28
2.3 New standards and interpretations applied from January 1, 2018
2.3.1 Initial application of IFRS 9 "Financial instruments"
The new standard IFRS 9 "Financial instruments" is of mandatory application since January 1, 2018. The Group has elected not
to restate the 2016 and 2017 comparative periods, as authorized by the standard.
This option led the Group to recognize the aggregate impact of restatements required by the standard in the Group opening
Equity as of January 1, 2018. The nature and the impacts of the main restatements are described below. Application of IFRS 9
led to a reduction in reserves of 23 million euros, recognized through a decrease in trade receivables of 22 million euros, a
decrease in current assets at amortized cost relating to Orange Bank transactions of 6 million euros and an increase in deferred
tax assets of 5 million euros.
IFRS 9 comprises three phases: classification and measurement of financial assets and liabilities, impairment of financial assets
and hedge accounting.
Classification and measurement of financial assets and liabilities
The new classification proposed by IFRS 9 determines the way assets are recognized and measured. The financial asset
classification depends on the combination of the following two criteria:
the Group’s business model for managing financial assets; and
the contractual cash flow characteristics of the financial asset (whether or not solely payments of principal and interest).
Based on the combined analysis of these two criteria, IFRS 9 identifies three business models:
financial assets measured at fair value through profit or loss;
financial assets measured at fair value through other comprehensive income that may be reclassified (or not) to profit or
loss;
financial assets measured at amortized cost.
Assets previously classified as available-for-sale assets and held-to-maturity investments under IAS 39 are now presented in
the following categories:
financial assets at fair value through profit or loss: it mainly concerns certain investment securities that are neither
consolidated nor equity-accounted, including shares in BT Group Plc (BT), and financial investments such as negotiable
debt securities, deposits and monetary UCITS, that comply with the Group’s liquidity risk management policy;
financial assets at fair value through other comprehensive income that will never be reclassified to profit or loss: it mainly
concerns investment securities that are neither consolidated nor equity accounted;
financial assets at fair value through other comprehensive income that may be reclassified to profit or loss: it mainly
concerns investments in debt securities;
financial assets at amortized cost: it mainly concerns loans and receivables and fixed-income securities.
The application of IFRS 9 has no impact on the Group's Accounting policy regarding financial liabilities.
Impairment of financial assets
Telecom activities:
IFRS 9 introduces a new expected loss model for impairment of financial assets. The new standard requires expected credit losses to be taken into account from the initial recognition of financial instruments. In addition to the existing provision system,
the Group has elected to apply a simplified approach of anticipated impairment upon asset recognition.
Banking activities:
An impairment or provision for expected credit losses is systematically recognized in respect of debt instruments classified in
financial assets at amortized cost or financial assets at fair value through other comprehensive income, lease receivables and
financing commitments and financial guarantees given. These impairments and provisions are recognized when the loans are
granted, on conclusion of commitments or on the acquisition of bond securities, without waiting for objective evidence of
impairment.
The relevant financial assets are allocated to three categories according to changes in credit risk observed since initial
recognition and an impairment is recognized on the outstandings of each category as follows:
performing outstandings: expected losses are calculated over a 12-month period and financial income (interest) is
calculated based on the gross amount of the instrument;
non-performing outstandings: if the credit risk has significantly worsened since the debt was recorded in the balance
sheet, losses expected over the loan term are recognized and the financial income is calculated based on the gross
amount of the instrument;
doubtful outstandings: the expected loss over the loan term is recognized. Financial income is calculated based on the
instrument amount net of impairment.

Consolidated financial statements 2018 29
Hedge accounting
The Group’s hedging policy is not affected by the application of IFRS 9.
The Group has elected to retrospectively account for the Foreign Currency Basis Spread of the Cross Currency Swaps
designated as Cash Flow Hedge as costs of hedging. This option allows the recognition of the Foreign Currency Basis Spread
in other comprehensive income and its amortization into profit or loss over the hedging term. This reclassification has no impact
on the Group opening Equity.
Impact on the consolidated financial statements
Impact on the consolidated statement of financial position:
(in millions of euros)
December 31, 2017 historical
data
December 31, 2017
IFRS 15 restated data
(1)
IFRS 9 impacts
classification of financial
assets
IFRS 9 impacts
impairment of financial
assets
Impact of IFRS 9 application
January 1, 2018 restated
data
Non-current financial assets related to Orange Bank activities
(2) 1,464 1,464 - - - 1,464
Assets available for sale 791 791 (791) - (791) -
Assets at fair value through profit or loss - - 71 - 71 71
Assets held to maturity 611 611 (611) - (611) -
Financial assets at amortized cost 62 62 549 - 549 611
Assets at fair value through other comprehensive income that may be reclassified to profit or loss - - 782 - 782 782
Non-current financial assets(2)
2,247 2,247 - - - 2,247
Assets available for sale 1,067 1,067 (1,067) - (1,067) -
Assets at fair value through profit or loss 146 146 1,554 - 1,554 1,700
Financial assets at amortized cost 1,034 1,034 (695) - (695) 339
Assets at fair value through other comprehensive income that will not be reclassified to profit or loss - - 208 - 208 208
Deferred tax assets 1,825 1,586 - 5 5 1,591
Total non-current assets 74,035 73,612 - 5 5 73,617
Trade receivables 5,175 5,175 - (22) (22) 5,153
Current financial assets related to Orange Bank activities
(2) 3,275 3,275 - (6) (6) 3,269
Assets available for sale 4 4 (4) - (4) -
Assets held to maturity 4 4 (4) - (4) -
Financial assets at amortized cost 3,096 3,096 4 (6) (2) 3,094
Assets at fair value through profit or loss 171 171 - - - 171
Assets at fair value through other comprehensive income that may be reclassified to profit or loss - - 4 - 4 4
Total current assets 20,679 21,737 - (28) (28) 21,709
Total assets 94,714 95,349 - (23) (23) 95,326
Total equity 32,942 33,512 - (23) (23) 33,489
Total non-current liabilities 32,736 32,780 - - - 32,780
Total current liabilities 29,036 29,057 - - - 29,057
Total liabilities 94,714 95,349 - (23) (23) 95,326
(1) The effects of IFRS 15 application are described in Note 2.3.2.
(2) Financial assets and liabilities related to Orange Bank activities are isolated from those of telecom activities and include loans and receivables of Orange Bank in assets and debts related to Orange Bank activities in liabilities. These reclassifications have been applied to all presented periods since 2018.

Consolidated financial statements 2018 30
Effects on the consolidated shareholders’ equity:
(in millions of euros)
December 31, 2017 historical
data
December 31, 2017
IFRS 15 restated data
(1)
IFRS 9 impacts
classification of financial
assets
IFRS 9 impacts
impairment of financial
assets
Impacts of IFRS 9
application
January 1, 2018 restated
data
Share capital 10,640 10,640 - - - 10,640
Share premiums and statutory reserve 16,859 16,859 - - - 16,859
Subordinated notes 5,803 5,803 - - - 5,803
Reserves (2,339) (1,851) 39 (19) 20 (1,831)
Other comprehensive income (475) (476) (39) - (39) (515)
o/w assets available for sale 56 56 (56) - (56) -
o/w assets at fair value - - 17 - 17 17
o/w other comprehensive income (531) (530) - - - (530)
Total equity attributable to the owners of the parent company 30,488 30,975 - (19) (19) 30,956
Reserves 2,242 2,323 - (4) (4) 2,319
Other comprehensive income 212 214 - - - 214
o/w assets at fair value (1) (1) 1 - 1 -
o/w assets at fair value - - (1) - (1) (1)
o/w other comprehensive income 213 215 - - - 215
Total equity attributable to non-controlling interests 2,454 2,537 - (4) (4) 2,533
Total equity 32,942 33,512 - (23) (23) 33,489
(1) The effects of IFRS 15 application are described in Note 2.3.2.
The following table reconciles the assets and liabilities for each of the two areas (intra-group transactions between telecom
activities and Orange Bank are not eliminated) with the consolidated statement of financial position as at January 1, 2018.
(in millions of euros)
Orange consolidation
financial statements
O/w telecom activities
O/w Orange Bank O/w eliminations telecom activities
/ bank
Non-current assets related to Orange Bank activities 1,464 - 1,464 -
Non-current financial assets 2,247 2,274 - (27) (1)
Non-current derivatives, assets 213 200 13 -
Current financial assets related to Orange Bank activities 3,269 - 3,421 (152)
(2)
Current financial assets 2,686 2,686 - -
Current derivatives, assets 34 34 - -
Cash and cash equivalents 5,810 5,333 477 -
Non-current liabilities related to Orange Bank activities - - 27 (27) (1)
Non-current financial liabilities 26,293 26,293 - -
Non-current derivatives, liabilities 1,002 929 73 -
Current financial liabilities related to Orange Bank activities 4,941 - 4,941 -
Current financial liabilities 6,030 6,182 - (152) (2)
Current derivatives, liabilities 34 34 - -
(1) Loan granted by Orange SA to Orange Bank.
(2) Loan granted by Orange Bank to Orange SA within the framework of the repurchase agreement of OATs securities between Orange SA and Orange Bank.
The information required as at December 31, 2018 on the financial assets and liabilities are presented in Notes 11 and 12 for
telecom activities and in Note 15 for banking activities.

Consolidated financial statements 2018 31
2.3.2 First application of IFRS 15 "Revenue from contracts with customers"
The Group applies IFRS 15 with effect from January 1, 2018. It elected for retrospective application, restating published figures
for the 2016 and 2017 comparative periods.
The Group adopted the following authorized practical expedients on initial application:
For all reporting periods presented before the date of initial application, the Group did not disclose the amount of the
transaction price allocated to the remaining performance obligations nor explained when it expects to recognize that amount
as revenue;
The Group did not restate contracts that began and ended before January 1, 2016 (first comparative reporting period).
Application of IFRS 15 to ongoing contracts as of January 1, 2016 resulted in an increase in consolidated reserves of 815
million euros, as of January 1, 2016, of which 674 million euros attributable to owners of the parent company and 141 million
euros attributable to non-controlling interests, in return mainly for the recognition of :
contract assets net of performance obligations liabilities for 1,003 million euros;
assets related to deferred acquisition costs for 294 million euros;
deferred taxes for a net impact of (339) million euros.
The recognition of these assets net of liabilities led the Group to reassess the net carrying value of the Cash Generating Units
(CGUs) and the results of the impairment tests as of January 1, 2016 and to reflect a goodwill impairment charge of (139) million
euros in certain operating segments, in exchange for consolidated reserves.
IFRS 15 introduces a revenue recognition approach focused on:
The identification of contracts, customers and contract amendments;
The identification of distinct performance obligations (promises made by the supplier), their reference price (individual sel ling
price) and the transfer to the customer of control of performance obligations continuously or at a point in time;
The determination of the transaction price (consideration promised by the customer), its fixed and variable components (and
related recognition restrictions) and its allocation to the performance obligations.
The main impacts of the new methodology introduced by IFRS 15 compared with the accounting policies previously applied are
as follows:
For bundled service and equipment offerings, prior to adoption of IFRS 15, revenue recognized on the sale of mobile phones
was restricted to a contractual amount not dependent on the supply of future services, which was generally the amount
received from the customer for the sale of the mobile phone. This amount corresponded conventionally to the amount paid at
the time of delivery, or for installments, to discounted amounts payable over 12 or 24 months. Under IFRS 15, the
transaction price is allocated between the mobile phone and the service based on individual selling prices and recognized in
revenue at the moment of the transfer of control of the equipment or service to the customer. This change primarily impacts
bundled offerings comprising the sale of a mobile phone at a reduced price combined with a fixed-term service contract.
Accordingly, for this type of offering, the effects on the Group’s accounts are as follows:
the overall revenue from the contract does not change, but the pace of recognition and the split between the sold mobile
phone and the service are modified (additional equipment revenue at the beginning of the contract, in return for a
reduction in revenue of services of the same amount afterwards);
accelerated recognition of revenue, at the time of the sale of the equipment is reflected in the consolidated statement of
financial position by the presentation of a contract asset which is transformed into a receivable as the provision of
communication services progresses.
IFRS 15 therefore increases the sensitivity of total revenue to equipment sales and to the effect of seasonality of these sales
between quarters. Depending on the position in each market, the impact of IFRS 15 on period-on-period total revenue trends
will differ from that previously presented under IAS 18, according to whether discounts on equipment levels are increasing or
decreasing. In recent years, the markets in which we operate have, excluding exceptions, recorded a decrease in discounted
equipment offerings. Compared with IAS 18, the implementation of IFRS 15 also requires new judgements and assumptions,
notably regarding the enforceable contract term and the expected total transaction price and the reference price of the
transaction components.
IFRS 15 changed the indicators used to determine whether an entity acts as a principal or an agent in a transaction. This did
not, however modify our previous judgements, particularly as regards agreements with our distributors for the supply of
mobile phones, under which Orange primarily acts as a principal in the sale of mobile phones to the end-customer. The
revenue recognized by Orange on the sale of a mobile phone combined with a fixed-term contract is therefore identical
irrespective of the distribution channel.
IFRS 15 also introduces criteria for identifying a financial component in a commercial transaction that must be recognized
separately, unless it has a negligible effect in each contract or concerns a contract of less than one year. A financial
component is likely to be identified in offerings combining the supply of a mobile phone and a fixed-term services contract
(except payments by installments models which, by nature, meet the definition of a financial receivable). On markets where
these offerings exist, the low level of interest rates has not led to the recognition of a separate financial component. This
assessment could however change if, for example, contractual terms or interest rates were to increase.

Consolidated financial statements 2018 32
For our services requiring non-standard equipment (and internet offerings including the provision of a Livebox®), IFRS 15
has not changed our historical analysis that this equipment is a component of the network controlled by Orange and is not
therefore a distinct performance obligation.
For our straight-forward service offerings for Mass market or Enterprise market, no changes in revenue recognition were
identified as a result of application of IFRS 15. Contract assets are not therefore recognized in addition to trade receivables
recognized under IAS 18 and IAS 11, or contract liabilities other than deferred income recognized under IAS 18 and IAS 11.
Integration and information technology services proposed to Enterprise market often involve complex contracts which require
the exercise of greater judgement and modified estimates under IFRS 15, compared with IAS 18 and IAS 11. This is notably
the case for the identification of distinct performance obligations or not (platform build and run phases) and the measurement
of contract factors impacting several accounting periods (notably fixed and variable transaction price components), as well
as contract amendments. The application of IFRS 15 did not, however, lead to significant changes in revenue recognition.
Wholesale activities (operator customers) also involve complex contracts requiring a similar exercise of judgement and
estimates under IFRS 15 as for the above Enterprise market activities. These activities also require the exercise of specific
judgement when classifying a transaction as a non-monetary exchange between entities in the same line of business to
facilitate sales to customers or potential customers; these transactions are excluded from IFRS 15’s revenue recognition
scope. Overall, the application of IFRS 15 has not led to significant changes in revenue recognition, with the exception of a
network sharing agreement in Spain. In the public initiative network sector, IFRIC 12 application "Service concession
arrangements" remains effective and revenue is recognized in accordance with the terms of IFRS 15.
In a substantial change from IAS 18, IFRS 15 requires the capitalization of certain costs of obtaining a contract and their
release to profit or loss on a time-apportioned basis over the expected duration of the contractual relationship. However, due
to the Group’s strategy in recent years of focusing on direct distribution and the development of internet sales, sales
commissions qualifying for deferral under IFRS 15 are generally decreasing. This new principle requires assumptions to be
made regarding the expected duration of contractual relationships. Finally, new costs of fulfilling a contract that must be
deferred under IFRS 15 were not identified.

Consolidated financial statements 2018 33
Effects on the consolidated financial statements
Effects on the consolidated income statement:
December 31, 2017 December 31, 2016
(in millions of euros, except for per share data)
Historical data
IFRS 15 application
effect
Restated data from
IFRS 15
Historical data
IFRS 15 application
effect
Restated data from
IFRS 15
Revenues 41,096 (237) 40,859 40,918 (210) 40,708
Increase / decrease linked to the timing difference of the services revenue recognition
(1) - (1,071) - - (1,180) -
Increase / decrease linked to the timing difference of the equipment sales revenue recognition
(2) - 958 - - 1,080 -
Other (3)
- (124) - - (110) -
External purchases (18,475) 94 (18,381) (18,281) 95 (18,186)
Increase / decrease linked to the capitalization ot the costs of obtaining a contract
(4) - (28) - - (17) -
Other impacts (3)
- 122 - - 112 -
Other operating income and expense (17,704) 4 (17,700) (18,560) (45) (18,605)
Operating income 4,917 (139) 4,778 4,077 (160) 3,917
Finance costs, net (1,715) - (1,715) (2,097) - (2,097)
Income tax (5)
(1,088) 36 (1,052) (970) 19 (951)
Consolidated net income of continuing operations 2,114 (103) 2,011 1,010 (141) 869
Consolidated net income of discontinued operations 29 - 29 2,253 - 2,253
Consolidated net income 2,143 (103) 2,040 3,263 (141) 3,122
Net income attributable to owners of the parent company 1,906 (63) 1,843 2,935 (122) 2,813
Non-controlling interests 237 (40) 197 328 (19) 309
Earnings per share (in euros) attributable to parent company
Net income of continuing operations
basic 0.61 (0.03) 0.58 0.15 (0.05) 0.10
diluted 0.61 (0.03) 0.58 0.15 (0.05) 0.10
Net income of discontinued operations
basic 0.01 - 0.01 0.85 - 0.85
diluted 0.01 - 0.01 0.85 - 0.85
Net income
basic 0.62 (0.03) 0.59 1.00 (0.05) 0.95
diluted 0.62 (0.03) 0.59 1.00 (0.05) 0.95
(1) For contracts combining a discounted sale of equipment and telecommunication services, revenue allocated to telecommunication services is lower due to the new revenue allocation method under IFRS 15 (i.e. allocation of revenue to all performance obligations in proportion to individual selling prices). The Group therefore recognized an adjustment to reflect this new revenue allocation
(2) For the same offerings and again due to the change in the revenue allocation method, equipment revenue is higher to reflect the value of the asset that the customers receive at the beginning of the contract.
(3) Mainly concerns the effects associated to a RAN sharing contract in Spain.
(4) The Group pays sales commission and agent costs to distributors as part of obtaining firm contracts with customers. Previously booked in expenses when incurred, these costs are now capitalized and amortized over the contract term.
(5) Effect on deferred tax recognition of the IFRS 15 impacts presented above and the adjustment of the recoverable amount of deferred tax assets.

Consolidated financial statements 2018 34
Effects on the consolidated statement of financial position:
(in millions of euros)
December 31, 2015
historical data
IFRS 15 application
effect
January 1, 2016
restated data from
IFRS 15
December 31, 2016
historical data
IFRS 15 application
effect
January 1, 2017
restated data from
IFRS 15
December 31, 2017
historical data
IFRS 15 application
effect
January 1, 2018
restated data from
IFRS 15
Assets
Goodwill (1)
27,071 (139) 26,932 27,156 (177) 26,979 27,095 (184) 26,911
Deferred tax assets 2,430 (293) 2,137 2,116 (269) 1,847 1,825 (239) 1,586
Total non-current assets 71,330 (432) 70,898 74,819 (446) 74,373 74,035 (423) 73,612
Other customer contract assets - 1,442 1,442 - 1,335 1,335 - 1,204 1,204
Customer contract assets
(2) - 1,027 1,027 - 916 916 - 815 815
Costs of obtaining a contract
(3) - 294 294 - 273 273 - 250 250
Costs to fulfill
a contract (4)
- 121 121 - 146 146 - 139 139
Other current assets 983 - 983 1,073 - 1,073 1,101 (7) 1,094
Prepaid expenses
(4) 495 (122) 373 540 (146) 394 594 (139) 455
Total current assets 14,312 1,320 15,632 19,849 1,189 21,038 20,679 1,058 21,737
Assets held for sale 5,788 - 5,788 - - - - - -
Total assets 91,430 888 92,318 94,668 743 95,411 94,714 635 95,349
Equity and liabilities
Total equity 33,267 815 34,082 33,174 671 33,845 32,942 570 33,512
Deferred tax liabilities 879 45 924 658 48 706 611 44 655
Total non-current liabilities 36,537 45 36,582 35,590 48 35,638 32,736 44 32,780
Trade payables 6,227 4 6,231 6,211 3 6,214 6,522 5 6,527
Customer contract liabilities
(5) - 2,121 2,121 - 2,071 2,071 - 2,021 2,021
Deferred income (5)
2,136 (2,097) 39 2,134 (2,050) 84 2,081 (2,005) 76
Total current liabilities 21,626 28 21,654 25,904 24 25,928 29,036 21 29,057
Total equity and liabilities 91,430 888 92,318 94,668 743 95,411 94,714 635 95,349
(1) The new standard generates a change in the composition of the net carrying amount of tested assets of cash generating uni ts. The net carrying amount of tested assets now includes the contract assets. This change led to the recognition of impairment losses on goodwill in Poland of (139) million euros as of January 1, 2016 and in Romania of (55) million euros in 2016.
(2) The accelerated recognition of revenue resulting from the new revenue allocation method is reflected in the balance sheet by a contract asset recognized on signature of the contract for an amount corresponding in part to the discount granted to the customer on the equipment. This contract asset decreases over the enforceable period of the contract, to the extent the discount granted on the equipment is recovered each month through invoicing of the service contract. An impairment reflects the risk of non-recovery of the contract asset and depending on the geographical area, instances of fraud or churn where termination costs are not billed. To assess this risk, the countries determine a contract asset impairment rate according to the nature of the event and the relevant customer segment, using a historical statistical approach.
(3) The Group pays sales commission and agent costs to distributors as part of obtaining firm contracts with customers. Previously booked in expenses when incurred, these costs are now capitalized and amortized over the contract term.
(4) Prior to application of IFRS 15, costs of fulfilling a contract were recognized in prepaid expenses. They are now included in other assets related to contracts with customers.
(5) As for prepaid expenses, deferred income relating to customer contracts was reclassified to liabilities related to contracts with customers. Residual deferred income are out of IFRS 15 scope.

Consolidated financial statements 2018 35
Effects on the consolidated statement of cash flows:
December 31, 2017 December 31, 2016
(in millions of euros)
Historical data
IFRS 15 application
effect
Restated data from
IFRS 15
Historical data
IFRS 15 application
effect
Restated data from
IFRS 15
Consolidated net income 2,143 (103) 2,040 3,263 (141) 3,122
Non-monetary items and reclassified items for presentation
Impairment of goodwill (20) - (20) 772 42 814
Change in provisions (73) (7) (80) (159) (2) (161)
Income tax 1,088 (36) 1,052 970 (19) 951
Changes in working capital
Increase (decrease) in trade payables 409 3 412 85 (1) 84
Changes in other customer contract assets and liabilities - 112 112 - 66 66
Changes in other assets and liabilities 132 31 163 (762) 55 (707)
Net cash provided by operating activities (a) 10,174 - 10,174 8,750 - 8,750
Net cash used in investing activities (b) (7,941) - (7,941) (4,879) - (4,879)
Net cash used in financing activities (c) (2,738) - (2,738) (1,883) - (1,883)
Net change in cash and cash equivalents (a) + (b) + (c) (505) - (505) 1,988 - 1,988
The information required as at December 31, 2018 on the net assets and liabilities from customer contracts are presented in
Note 4.4.
2.4 Main standards and interpretations compulsory after December 31, 2018 with no early application elected by the Group
2.4.1 IFRIC 23 "Uncertain fiscal positions"
The IFRIC 23 "Uncertain fiscal positions" text, the application of which is compulsory after December 31, 2018, will not have a
significant effect on the consolidated annual financial statements of the Orange group.
2.4.2 IFRS 16 "Leases"
IFRS 16 implementation has been subject to a dedicated project within the Group. After having finalized the analysis and
concluded on the scope of application (still subject to new interpretations), the Group started, in 2018, the implementation and
deployment of the tools dedicated to lease accounting. As at December 31, 2018, the Group is finalizing the inventory of
contracts, the tools deployment and the data collection in order to be able to present, as of 2019, financial statements in
compliance with IFRS 16.
In order to define the scope of application of this new standard, the Group has analyzed all of its leases (under IAS 17) and
service contracts in order to determine whether these contracts contain a lease component. The Group defines a contract as a
lease if it conveys to the lessee the right to control the use of an identified asset.
After this analysis phase the Group defined four main categories of leases contracts:
real estate: point of sales, offices buildings, technical buildings ;
mobile network: lands, certain contracts with Towercos;
fixed network: access to the local loop, colocation in technical building, certain dark fiber contracts;
general expenses: vehicles, technical cars, datacenter.
From January 1, 2019 onward, the Group (as lessee) will record all of its leases contracts using a unique model in which an
asset will be recognized on the balance sheet for the right of use of the assets leased against a liability for the corresponding
lease obligations.
The accounting measurement of these items on the balance sheet depend on the following:
the assessment of the term to be retained for each contract. This duration corresponds to the non-cancelable lease term,
plus the time periods in any extension option the lessee can be reasonably certain to exercise and any option to cancel

Consolidated financial statements 2018 36
which the lessee is certain will not be exercised. The definition of this contract term must also take into account laws and
practices in each jurisdiction or sector of activity regarding the duration of a firm commitment granted by lessors;
the combination of the fixed and variable components of contractual payments;
the determination of the incremental borrowing rate if the contract's implicit rate cannot easily be established.
The Group has also chosen to use the two exemptions proposed by the standard on leases contracts:
contracts with a duration of less than 12 months;
contracts for which the the underlying asset new value is around 5,000 euros.
In addition to the effect on the statement of financial position, the income statement (depreciation of rights of use assets and
interests expenses on lease liabilities instead of operating lease expenses, acceleration of the expense notably resulting from
the interest component) and the statement of cash flows (only interests expenses will continue to affect the operating cash
flows, investment cash flows will not be impacted, while financing cash flows will be impacted by the repayment of the debt) will
also be affected.
The Group will apply IFRS 16 from January 1, 2019 using the simplified retrospective method without restatement of
comparative periods. Whilst following current discussions under way at the IFRIC and IASB, the Group estimates the effect on
the opening balance sheet between 5.5 and 6.5 billion euros resulting from the recognition of the lease obligation and the right
of use associated with leases contracts. Furthermore, the Group will record deferred taxes during the initial recognition of the
right of use and the lease obligation from the transition.
The effect on equity at January 1, 2019 should not be material.
These impacts at transition date are not directly comparable to the off-balance sheet commitments as presented in Note 14.1
mentioning the operating leases commitments. The main differences concern the scopes of application and the valuation
methods of lease payments (see Note 14.1).

Consolidated financial statements 2018 37
2.5 Accounting policies, use of judgment and estimates
The accounting policies are presented within each note to which they refer. In summary:
Note Topic Accounting policies Judgments and
estimates (1)
1 Segment information X
3 Changes in the scope of consolidation, takeovers (business combinations), internal transfer of consolidated shares, assets held for sale
X X
4.1 Revenue X X
4.3 Trade receivables X
4.4 Customer contract net assets and liabilities, costs of obtaining a contract and costs to fulfill a contract, unfulfilled performance obligations
X
4.6 Submarine cable consortiums, Orange Money X
4.7 Related party transactions X
5.1 Advertising, promotion, sponsoring, communication and brand marketing costs
X
5.2 Litigation X X
5.3 Restructuring and integration costs X X
5.4 Equipment inventories and broadcasting rights X
5.6 Trade payables X X
6.2 Employee benefits X X
6.3 Employee share-based compensation X
7 Goodwill, impairment of goodwill X X
8.1 Depreciation and amortization X
8.2 Impairment of fixed assets X X
8.3 Other intangible assets X X
8.4 Property, plant and equipment X X
8.5 Fixed assets payables X X
8.6 Dismantling provision X X
9.1 Operating taxes and levies X
9.2 Income tax X X
10 Interests in associates and joint ventures X X
11.3 Net financial debt X X
11.3 Cash and cash equivalents, bonds, bank loans and loans from multilateral lending institutions
X
11.4 Perpetual bonds redeemable for shares (TDIRA) X X
11.7 Financial assets (excluding Orange Bank activities) X X
11.8 Derivatives instruments (excluding Orange Bank activities) X
12.8 Fair value of financial assets and liabilities (excluding Orange Bank activities)
X X
13.2 Treasury shares X
13.4 Subordinated notes, equity component of perpetual bonds redeemable for shares (TDIRA)
X X
13.5 Translation adjustment X
13.6 Non-controlling interests X
13.7 Earnings per share X
15.1 Financial assets and liabilities of Orange Bank X
15.1.1 Financial assets related to Orange Bank activities X X
15.2.2 Fair value of financial assets and liabilities of Orange Bank X
16 Litigation X
(1) see Notes 2.5.1 and 2.5.2

Consolidated financial statements 2018 38
2.5.1 Use of judgment
In addition to the alternatives or accounting positions mentioned above in 2.2, Management exercises judgment in order to
define the accounting policies for certain transactions:
Topic Nature of accounting judgment
Note 3 Control
Requiring judgment in certain circumstances with respect to the existence or not of the control Continuous control assessment which can affect the scope of consolidation, as for instance when a shareholders’ agreement is revised or terminated, or when protective rights turn into substantive rights
Note 4 Revenue Splitting transaction price between mobile and service Identification of distinct or non-distinct performance obligations
Notes 5, 9 and 16
Purchases and other expenses, tax and litigation
Litigation and tax: measurement of technical merits of the interpretations and legislative positions and qualification of the facts and circumstances Onerous supplier contracts: trigger event, nature of unavoidable costs
Notes 5 and 11
Purchases and other expenses, financial assets and liabilities, net finance costs
Reverse factoring: distinguishing operating debt and financial debt
Note 8 Fixed assets Qualifying network, sites or equipment sharing among operators as joint operations "TowerCos" arrangements: electing the unit of account (tower or used space) and analyzing the arrangements in order to determine whether they contain a lease
Notes 11 and 13
Financial assets and liabilities and net finance costs Equity
Distinguishing equity and debt: assessing specific contractual clauses
2.5.2 Use of estimates
In preparing the Group’s consolidated annual financial statements, Orange’s management makes estimates, insofar as many
elements included in the financial statements cannot be measured precisely. Management revises these estimates if the
underlying circumstances evolve or in light of new information or more experience. Consequently, the estimates made as at
December 31, 2018 may subsequently be changed.
Topic Key sources of estimates on future income and/or cash flows
Note 4 Revenue Deciding duration of legally binding rights and obligations
Notes 5, 9 and 15
Risk of resources outflow linked to claims and litigation and to tax legislation Onerous contracts
Underlying assumptions of the assessment of legal and fiscal positions Identifying and releasing of uncertain legal and tax positions Underlying assumptions of the assessment
Notes 7.3, 7.4, 8.2, 8.3, 8.4 and 10
Measurement of the recoverable values for the impairment tests (goodwill, tangible and intangible assets, investments accounted for under the equity method)
Sensitivity to discount rates, perpetual growth rate and business plans’ assumptions which affect the expected cash flows (revenues, reported EBITDA and investments) Assessing the competitive, economic and financial environment of the countries where the Group operates
Note 9.2 Measurement of the recoverable value of deferred tax assets
Assessing the deferred tax assets’ recovery timeline when a tax entity reverts to profitability or when the tax legislation limits the use of tax loss carryforward
Note 8 Fixed assets Assessing assets’ useful life according to the change in the technological, regulatory or economic environment (notably the migration from the copper local loop into fiber and other greater bandwidth technologies, radio technology migration) Provision for dismantling and restoring sites: dismantling timeframe, discount rate, expected cost
Note 6.2 Employee benefits Sensitivity to discount rates Sensitivity to sign-up rate senior plans
Notes 12 and 15
Fair value of financial assets and liabilities
Models, selection of parameters, fair value hierarchy, evaluation of non-performance risks
Furthermore, aside from the elements linked to the level of activity, income and future cash flows are sensitive to changes in
financial market risks, notably interest rate and foreign exchange risks.

Consolidated financial statements 2018 39
NOTE 3 Gains and losses on disposal and main changes in scope of consolidation
3.1 Gains (losses) on disposal of investments and activities
Gains (losses) on disposal of investments and activities in 2018 amount to 17 million euros, compared to (5) million euros in
2017 and 59 million euros in 2016 (mainly related to the disposal of Fime for 49 million euros).
The loss on disposal associated with BT securities in 2018 and in 2017 is presented under "Effects resulting from BT stake" and
detailed in Note 11.7.
The gain on disposal associated with EE securities in 2016 is presented under “Net income from discontinued operations (EE)”.
3.2 Main changes in the scope of consolidation
Changes in the scope of consolidation during 2018
Basefarm acquisition
On August 14, 2018, the Group acquired 100% of Basefarm for an amount of 234 million euros.
(in millions of euros) At acquisition date
Acquisition cost 234
Cash acquired net of transaction costs (4)
Cash paid for investment securities, net of cash acquired 230
In accordance with IFRS 3R – Business Combinations, the Group has one year from the acquisition date to measure the fair
value of identifiable assets and liabilities assumed. Work is not finalized yet. Amounts disclosed as at December 31, 2018 are
thus temporary and will be reviewed during first semester of 2019.
(in millions of euros) At acquisition date
Acquisition cost (a) 234
Net book value acquired before fair value measurement (b) (58)
Goodwill (a)-(b) 292
This acquisition has no significant impact on revenues in 2018.
Acquisition of Business & Decision
Following the acquisition of Business & Decision on June 5, 2018 and the purchase of additional securities as part of the friendly
tender offer finalized on July 19, 2018, the Group acquired a stake of 81.8% of the capital of Business & Decision at a price of
50 million euros. Furthermore, Orange signed an agreement to acquire 4.9% more of the capital.
(in millions of euros) At acquisition date
Acquisition cost 81.8 % 50
Cash acquired net of transaction costs (18)
Cash paid for investment securities, net of cash acquired 32
Goodwill was recognized in the amount of 29 million euros, after allocation of the purchase price to identifiable assets and
liabilities assumed:

Consolidated financial statements 2018 40
(in millions of euros) At acquisition date
Acquisition cost 81.8% 50
Fair value of non controlling interests 12
Acquisition cost (a) 62
Net book value acquired 7
Effects of fair value measurement:
Customer relationship (1)
18
Trademark (2)
8
Others intangibles (3)
4
Net deferred tax (4)
Net asset remeasured at fair value (b) 33
Goodwill (a)-(b) 29
(1) Depreciation over 10 years
(2) Depreciation over 7 years
(3) Specific technology depreciated over 9 years
The residual goodwill mainly corresponds to headcount.
The effect of the acquisition of Business & Decision on revenue in 2018 amounts to 108 million euros.
Since July 19, 2018, Orange acquired 6.4% of the capital of Business & Decision. As at December 31, 2018, Orange holds
88.2% of the capital of Business & Decision (93.1% including the shares under reciprocal promises).
Changes in the scope of consolidation during 2017
No significant change in consolidation scope occurred during 2017.
Changes in the scope of consolidation during 2016
Disposal of EE
On January 29, 2016, Orange sold its entire stake in EE to BT Group Plc (BT) in exchange for 3,438 million pounds sterling
(4,500 million euros) in cash and a 4% stake in the BT entity valued at 1,877 million pounds sterling (2,462 million euros) at the
opening share price of January 29, 2016. After final price adjustments, the proceeds, net of transaction costs, stand at
4,481 million euros.
The Group set up hedging policies to cover the foreign exchange risk to which it was exposed through its stake in EE,
denominated in pounds sterling (see Note 11.8). The net tax impact of this hedging was immaterial on the gain on disposal.
(in millions of euros)
EE's net disposal value (1)
(a) 7,138
EE's net book value (b) (5,725)
Other comprehensive income reclassified in profit or loss (2)
(c) 840
Consolidated net income after tax of discontinued operations in 2016 (a) + (b) + (c) 2,253
Indemnity received from BT (3)
29
Total Consolidated net income after tax of discontinued operations in 2016 and 2017 2,282
(1) Included transaction costs and 173 million euros of dividends paid by EE before the disposal in January 2016.
(2) Mainly included 836 million euros of cumulative translation adjustment reclassified in profit or loss.
(3) Mainly includes the indemnity received from BT for 50 million euros, offset by tax effect.
The warranties given to BT Group Plc within the context of the EE disposal are described in Note 14.2.
The evolution of the BT securities held as a result of this transaction is described in Note 11.7.
Entities acquired in Africa
The Group has acquired several mobile operators in various African countries:
on April 5, 2016, Cellcom Telecommunications Inc. in Liberia, controlled by Orange Côte d’Ivoire;
on April 20, 2016, Oasis SA in the Democratic Republic of the Congo (operator Tigo in the DRC) from the Millicom
Group;
on June 22, 2016, Airtel in Burkina Faso from the Bharti Group, controlled by Orange Côte d’Ivoire;
on July 19, 2016, Airtel in Sierra Leone from the Bharti Group, controlled by the Sonatel Group.

Consolidated financial statements 2018 41
(in millions of euros) Liberia DRC Burkina Faso Sierra Leone
Acquisition cost (1)
104 160 500 207
Loan reimbursement to former shareholders 16 - - 79
Cash acquired net of transaction costs 2 18 (6) -
Cash paid for investment securities, net of cash acquired 122 178 494 286
(1) The price paid for the acquisitions in Burkina Faso and Sierra Leone includes in 2018, earn out mainly related to net debt, working capital and capital expenditures in 2018.
In accordance with IFRS 3R – Business Combinations, the fair value measurement of identifiable assets acquired and liabilities
assumed, was finalized during the 2017 fiscal year. The adjustments recognized compared to the amounts published in 2016
were not significant and had no impact on the income of the period.
At acquisition date
(in millions of euros) Liberia DRC Burkina Faso Sierra Leone
Acquisition cost (a) 104 160 500 207
Net book value acquired 5 67 50 (16)
Effects of fair value measurement:
Customer base (1)
10 - 31 6
Trademark (2) (3)
6 1 1 0
Net deferred tax (4) (0) (9) (2)
Net asset remeasured at fair value (b) 17 68 73 (12)
Goodwill (a)-(b) 87 92 427 219
(1) Depreciation over 5 years in Liberia, 4 years in Burkina Faso and Sierra Leone.
(2) Depreciation over 15 years in Liberia.
(3) Depreciation over 1 year in DRC, Burkina Faso and Sierra Leone (rights of use granted by sellers for 1 year and rebranding expected in 2017 by the Group).
Fair value has been measured using the relief from royalty method for the brand and the excess earnings method for the
customer base.
Goodwill primarily corresponded to the launch of Orange in new African countries and also the expected synergies in the DRC
at the acquisition date between Orange RDC and Oasis SA (these two entities merged on September 30, 2016). The
reassessment of the business outlook in the DRC resulted in a goodwill impairment loss (see Note 7.1).
The impact on revenues related to the acquisition of these entities in 2016 amounted to 222 million euros.
Acquisition of Groupama Banque (renamed Orange Bank)
On October 4, 2016, the Group acquired a 65% stake in Groupama Banque. This take-over was carried out through a share
exchange between Orange and Groupama for a total amount of 170 million euros, with an impact on consolidated equity. The
Group received general and specific warranties.
The badwill, which resulted in a gain in income in 2016 of 97 million euros reflects the low return on equity, the level of which is
set by regulation at a high level to allow for this type of activity. On the acquisition date, no shortfall in the profitabil ity of
operations can give rise to the recognition of a liability in the purchase price allocation. This situation also reflects the current
characteristics of the banking market: recent acquisitions in the segment have generally been carried out at a price lower than
the carrying value of the target entity's equity.
Significant litigations concerning Orange Bank are disclosed in Note 16.5.
In 2017, following the completion of work to assess the fair value of identifiable assets acquired and liabilities assumed, the
goodwill fell by (27) million euros, implying the recognition of a loss in income for the period, presented under "Effects resulting
from business combinations".
The final allocation of the acquisition cost is as follows:

Consolidated financial statements 2018 42
(in millions of euros) At acquisition date
Acquisition cost (a) 170
Net book value acquired 214
Effects of fair value measurement (1)
:
Assets
Credit portfolio 37
Investment portfolio 70
Hedging instruments (15)
Other 4
Liabilities
Transactions with customers (66)
Debt securities (3)
Net deferred tax (1)
Net asset remeasured at fair value (b) 240
Badwill (a)-(b) (70)
(1) The effect of the bank's financial assets and liabilities remeasurement as of the acquisition date will be reversed over future years in profit or loss (net banking profit classified in "Other operating income") according to the maturity of underlying instruments.
The put option, relating to 20% of the share capital of Orange Bank, granted by Orange to Groupama and exercisable in 2023,
was recorded as a financial liability on the acquisition date and the call option granted by Groupama on its remaining stake
(15%) is an unrecognized contractual commitment (see Note 14.2).
Disposal of Telkom Kenya
In accordance with the agreement signed on November 6, 2015 with Helios Investment Partners, and after obtaining the
required authorizations, the Group sold its entire stake in Telkom Kenya on June 10, 2016. This disposal had no material impact
on income in 2016.
Accounting policies
Change of consolidation scope
Entities are fully consolidated if the Group has the following:
power over the investee; and
exposure, or rights, to variable returns from its involvement with the investee; and
the ability to use its power over the investee to affect the amount of the investor’s returns.
When assessing control, IFRS 10 requires judgment and continuous assessment.
Clarifications of when the ownership interest does not imply a de facto presumption are provided in Note 18 which lists the
main consolidated entities.
Joint ventures and companies over which the Group exercises significant influence (generally corresponding to an ownership
interest of 20% to 50%) are accounted for using the equity method.
When assessing the level of control or significant influence exercised over a subsidiary or associate, the existence and effect of
any exercisable or convertible potential voting rights at the closing date is taken into account.
Material intragroup transactions and balances are eliminated.
Takeovers (business combinations)
Business combinations are accounted for using the acquisition method:
the acquisition cost is measured at the fair value of the consideration transferred, including all contingent consideration, at
the acquisition date. Subsequent changes in the fair value of contingent consideration are accounted for either through
profit or loss or through other comprehensive income, in accordance with the applicable standards;
goodwill is the difference between the consideration transferred and the fair value of the identifiable assets and liabilities
assumed at the acquisition date, and is recognized as an asset in the statement of financial position. Considering the
Group’s activity, the fair values of the identifiable assets relate mainly to licenses, to customer bases and to brands (which
cannot be recognized as assets when internally developed), generating induced deferred taxes. The fair value of these
assets, which cannot be observed, is established using commonly adopted methods, such as those based on revenues or
costs (e.g.: the "Greenfield" method for the valuation of licenses, the "relief from royalty" method for the valuation of brands
and the "excess earnings" method for customer bases).
For each business combination with an ownership interest below 100%, non-controlling interest is measured:
either at its fair value: in which case, goodwill is recognized for the portion relating to non-controlling interests;

Consolidated financial statements 2018 43
or proportionate to its share of the acquiree's identifiable net assets: in which case, goodwill is only recognized for the share
acquired.
Acquisition-related costs are directly recognized in operating income in the period in which they are incurred.
When a business combination is achieved in stages, the previously held equity interest is re-measured at fair value at the
acquisition date through operating income. The related other comprehensive income, if any, is fully reclassified to profit or loss.
Internal transfer of consolidated shares
IFRS do not address the accounting treatment for the transfer of consolidated shares within the Group resulting in changes in
ownership interest. The Group applies the following accounting policy:
the transferred shares are carried at historical cost and the gain or loss on the transfer is fully eliminated in the acquirer’s
accounts;
the non-controlling interests are adjusted to reflect the change in their share in the equity against Group retained earnings,
with no impact on profit and loss and equity.
Assets held for sale
The Group qualifies an asset or group of assets as “held for sale” when:
the management is committed to a plan to sell;
the asset is available for immediate sale in its current state (subject to any conditions precedent that are usual in such
disposals); and
the sale is highly probable, within 12 months.
Thus, when the Group is committed to a plan to sell involving the loss of control or significant influence over one of its assets, it
classifies all assets and liabilities of the entities concerned under a separate line in the statement of financial
position: "Assets/Liabilities held for sale", at a value equal to the lower of the net carrying value and the fair value net of
disposal costs.
In addition, when the asset or group of assets held for sale represents a major line of business, its contribution to the income statement
is presented separately (below “consolidated net income of continuing operations”); its cash flow contribution is presented in the
statement of cash flows.
NOTE 4 Sales
4.1 Revenue
The presentation of revenue is disaggregated by category and segment in the Note “Segment information” (see Note 1.1). Since January 1, 2018 the breakdown of revenue by product line is as follows:
Mobile services only: mobile services revenue is generated by incoming and outgoing calls (voice, SMS and data), excluding
convergent services (see below);
Fixed services only: revenue from fixed services includes fixed broadband and narrowband services, excluding convergent
services (see below) and fixed network business solutions, including voice and data;
Convergence packages: these include revenue from convergence packages for the Mass market (Internet + Mobile
products).
Equipment sales: all equipment sales (mobile phones, broadband equipment, connected objects and accessories), excluding
sales of equipment related to integration and information technology services and sales of equipment to external distributors
and brokers, presented in “Other revenue”;
IT & integration services : IT & integration services revenue includes unified communication and collaboration services (LAN
and telephony, advising, integration, project management), hosting and infrastructure services (including Cloud Computing),
applications services (customer relations management and other applications services), security services, video
conferencing offers as well as sales of equipment related to the above products and services;
Wholesale: roaming revenue from customers of other networks (national and international), revenue from Mobile Virtual
Network Operators (MVNO) and from network sharing, among others;
Other revenue: equipment sales to external distributors and brokers.

Consolidated financial statements 2018 44
Accounting policies
Most revenue falls within the application scope of IFRS 15 "Revenue from contracts with customers". Orange's products and services are offered to customers under service contracts only and contracts combining the equipment used to access services and/or other service offers. Revenue is recognized net of VAT and other taxes collected on behalf of governments.
Standalone service offers (mobile services only, fixed services only, convergent service)
Orange proposes to Mass market and Corporate markets customers a range of fixed and mobile telephone services, fixed and
mobile Internet access services and content offers (TV, video, media, added-value audio service, etc.). Some contracts are for a
fixed term (generally 12 or 24 months), while others may be terminated at short notice (i.e. monthly arrangements or portions of
services).
Service revenue is recognized when the service is provided, based on use (e.g. minutes of traffic or bytes of data processed) or
the period (e.g. monthly service costs).
Under some content offers, Orange may act solely as an agent enabling the supply by a third-party of goods or services to the
customer and not as a principal in the supply of the content. In such cases, revenue is recognized net of amounts transferred to
the third-party.
Contracts with customers generally do not include a material right, as the price invoiced for contracts and the services
purchased and consumed by the customer beyond the specific scope (e.g. additional consumption, options, etc.) generally
reflect their standalone selling prices. We have no significant impact related to contract modification for this type of contract.
Service obligations transferred to the customer at the same pace are treated as a single obligation.
When contracts include contractual clauses covering commercial discounts (initial discount on signature of the contract or
conditional on attaining a consumption threshold) or free offers (e.g. three months of subscription free of charge), the Group
defers these discounts or free offers over the enforceable period of the contract (period during which the Group and the
customer have a firm commitment). Where applicable, the consideration payable to the customer is recognized as a deduction
from revenue in accordance with the specific terms and conditions of each contract.
If the performance obligations are not classified as distinct, the offer revenue is recognized on a straight-line over the contract
term. The initial service connection in the context of a service contract and communication offer, is a good example. It is not
generally separable from the service contract and communication offer and is therefore recognized in income over the average
term of the expected contractual relationship.
Separate equipment sales
Orange proposes to Mass market and Corporate market customers several ways to buy their equipment (primarily mobile
phones): equipment sales may be separate from or bundled with a service offer. When separate from a service offer, the
amount invoiced is recognized in revenue on delivery and receivable immediately or in instalments over a period of up to 24
months. Where payment is received in instalments, the offer comprises a financial component and interest is calculated and
deducted from the amount invoiced and recognized over the payment period in net finance costs. When the equipment sale is
combined with a service offer, the amount allocated to the equipment (bundled sale – see below) is recognized in revenue on
delivery and received over the service contract. In this case, Orange does not calculate interests based on the contractual
analysis of offers and the current level of interest rates. This judgement could subsequently be amended in the event of a
change in commercial offers or interest rates.
Where Orange purchases and sells equipment to indirect channels, the Group generally considers that Orange maintains
control until final resale to the end-customer (the distributor acts as an agent), even where ownership is transferred to the
distributor. Sales proceeds are therefore recognized when the end-customer takes possession of the equipment (on activation).
Bundled equipment and service offers
Orange proposes numerous offers to its Mass market and Corporate market customers comprising equipment (e.g. a mobile
terminal) and services (e.g. a communications contract).
Equipment revenue is recognized separately if the two components are distinct (i.e. if the customer can receive the services
separately). Where one of the components in the offer is not at its separate selling price, revenue is allocated to each
component in proportion to their individual selling prices. This is notably the case in offers combining the sale of a mobile phone
at a reduced price, where the individual selling price of the mobile phone is considered equal to its purchase cost and logistics
expenses plus a commercial margin based on market practice.
The provision of a Livebox® (Internet proprietary box) is neither a separate component of the Internet access service nor a
lease, as Orange maintains control of the box.
Services including a build and run phase
Some Corporate market contracts include two phases: a build phase followed by the management of the IT platforms. Revenue
recognition requires an analysis of the facts and circumstances of each contract in order to determine whether distinct
performance obligations exist. Depending on the contract, the Group recognizes build phase revenue at completion if this phase
is qualified as distinct. These contracts are generally multi-year, with scalable offers. On each contract modification, we assess
the scope modification or its impact on the contract price in order to determine whether the amendment must be treated as a
distinct contract, as if the existing contract were terminated and a new contract signed, or whether the amendment must be
considered as a change to the existing contract.

Consolidated financial statements 2018 45
Service offers to carriers (wholesale)
Three types of commercial agreements are entered into with Operator customers for domestic wholesale activities and
International carrier offers:
Pay-as-you-go model: contract generally applied to “legacy” regulated activities (bit stream call termination, local loop
access, roaming and certain data solution contracts), where contract services are not covered by a firm volume
commitment. Revenue is recognized as the services are provided (which corresponds to transfer of control) over the
contractual term;
Send-or-pay model: contract where the price, volume and term are defined. The customer has a commitment to pay the
amount indicated in the contract irrespective of actual traffic consumed over the commitment period. This contract
category notably includes certain MVNO, IDD and hubbing contracts. Related revenue is recognized progressively based
on actual traffic during the period, to reflect transfer of control to the customer. Revenue from certain contracts is
recognized gross or net of amounts transferred to the supplier based an analysis of the facts and circumstances of each
transaction. Accordingly, revenues are recognized net when the suppliers are responsible for providing the content to the
end-customer, set the price and bear the volume risk;
Mixed model: hybrid contract combining the “Pay-as-you-go “ and “Send-or-pay” models, comprising a fixed entry fee
providing access to preferential pricing conditions for a given volume (“Send or pay” component) and invoicing of traffic
consumption (“Pay-as-you-go” component). The entry fee invoiced under this type of commercial agreement is
recognized progressively in revenue based on actual traffic over the period.
Agreements between major transit carriers are not billed (free peering) and therefore not recognized in revenue.
Service level commitment clause
The Group’s commercial arrangements incorporate service level commitments (delivery time, service reinstatement time).
These service level agreements cover commitments provided by the Group under the order, delivery, and after sales services
process. If the Group fails to comply with one of these commitments, then it pays compensation to the end-customer, which is
usually a tariff reduction deducted from revenues. The expected amount of such penalties is deducted from revenue as soon as
it is probable that the commitment has not been or will not be met.
Public-private service concession arrangements
The Group rolls-out and/or operates certain networks under service concessions, such as the public initiative networks
implemented in France to roll-out optical fiber networks in less populated areas. Some contracts are analyzed in accordance
with IFRIC 12, Service concession arrangements. When the Group builds a network, revenue is recognized in exchange for a
right to receive consideration from either a public entity or users of the public service. This right is accounted for as:
an intangible asset, if the Group has a right to charge users of the public service. This asset is measured at the
infrastructure fair value and amortized over the agreement period;
a financial receivable, if the Group has an unconditional right to receive payments from the public entity. This asset is
measured at the infrastructure fair value and accounted for at amortized cost.
Leases
Orange lease revenue concerns either its regulatory obligation to lease technical sites to competitors, the supply of equipment
under certain contracts with Enterprise markets, or occasionally, one-off leases to third-parties of excess space in certain
buildings.
Lease revenues are recognized on a straight-line basis over the contract term, except for certain equipment leases to Enterprise
market customers classified as finance leases; in such cases the equipment is considered sold on credit.
4.2 Other operating income
(in millions of euros) 2018 2017 2016
Proceeds from the disposal of fixed assets 180 88 126
o/w transfer price 224 124 152
o/w net book value of assets sold (44) (36) (26)
Net banking income 56 76 21
Tax credits and subsidies 42 40 70
Income from universal service 14 8 10
Brand & management fees (1)
6 14 24
Other income 462 475 488
Total 760 701 739
(1) Invoiced to certain uncontrolled entities.

Consolidated financial statements 2018 46
Net banking income (NBI) represents the net balance between banking products (fees charged to customers, interest from
loans, banking activities retail commissions and other income from banking operations) and expenses from banking operations
(interest paid in respect of bank loans, commissions paid and other expenses from banking operations).
It is prepared in accordance with accounting practices that are commonly used in France in the banking sector.
Other income is predominantly comprised of income on impaired trade receivables, income relating to line damages.
4.3 Trade receivables
(in millions of euros) 2018 2017 (1)
2016 (1)
Net book value of trade receivables - in the opening balance 5,175 4,964 4,876
IFRS 9 transition impact (22) - -
Net book value of trade receivables - including IFRS 9 transition impact 5,153 4,964 4,876
Business related variations 65 267 (87)
Changes in the scope of consolidation 90 6 78
Translation adjustment (12) (33) (122)
Reclassifications and other items (2)
(1) (29) 219
Reclassification to assets held for sale - - -
Net book value of trade receivables - in the closing balance 5,295 5,175 4,964
(1) As authorized by IFRS 9 (see Note 2.3), the Group has chosen not to restate the comparative periods 2016 and 2017.
(2) In 2016, included receivables resulting from financial lease offers on firm's equipments proposed by Orange Lease, which have been reclassified in "trade receivables" to uniform the treatment of the offers resulting from deferred payment (see accounting policies).
In 2018, Orange SA established a program of non-recourse sales of its deferred payment receivables. Those receivables are
derecognized from the balance sheet. The trade receivables sold as at December 31, 2018 generated an early receipt of
approximately 110 million euros.
Following the commercialization to its clients of sales offers to buy mobile telephones with payment by installments over 24
months, Orange Espagne has implemented since 2015 a sale without recourse program for its receivables. Those receivables
are derecognized from the balance sheet. The receivables sold as at December 31, 2018 generated an early receipt of
approximately 40 million euros (approximately 84 million euros at December 31, 2017 and 185 million euros at December 31,
2016).
(in millions of euros) December 31, 2018 December 31, 2017 (1)
December 31, 2016 (1)
Trade receivables depreciated according to their age 1,050 1,078 905
Trade receivables depreciated according to other criteria 600 443 568
Net trade receivables past due 1,650 1,521 1,473
Not past due (2)
3,645 3,655 3,491
Net trade receivables 5,295 5,175 4,964
o/w short-term trade receivables 4,995 4,851 4,683
o/w long-term trade receivables (3)
300 324 281
o/w net trade receivables from telecoms activities 5,295 5,175 4,964
o/w net trade receivables from Orange Bank - - -
(1) As authorized by IFRS 9 (see Note 2.3), the Group has chosen not to restate the comparative periods 2016 and 2017.
(2) 2018 not past due receivables are presented net of IFRS 9 provision for (25) millions of euros.
(3) Includes receivables from sales of handset with payment on instalments that are payable in more than 12 months and receivables from financial lease offers on firm's equipment (see accounting policies).
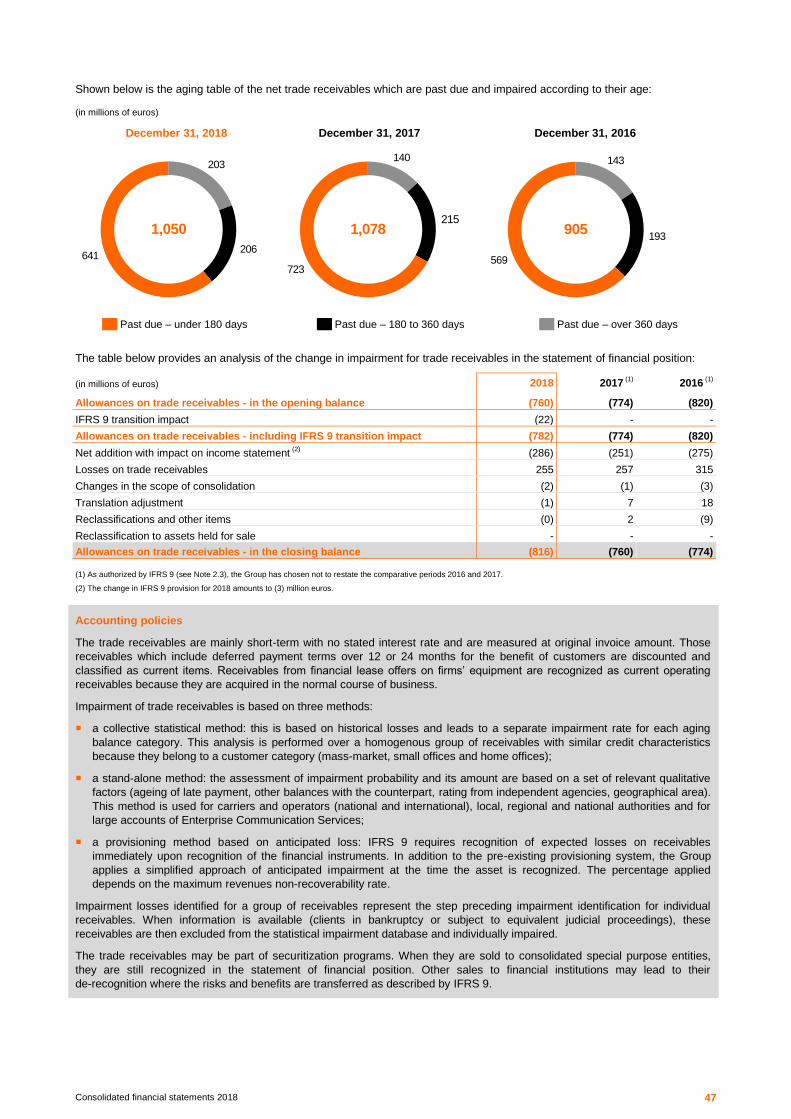
Consolidated financial statements 2018 47
Shown below is the aging table of the net trade receivables which are past due and impaired according to their age:
(in millions of euros)
December 31, 2018 December 31, 2017 December 31, 2016
Past due – under 180 days
Past due – 180 to 360 days
Past due – over 360 days
The table below provides an analysis of the change in impairment for trade receivables in the statement of financial position:
(in millions of euros) 2018 2017 (1)
2016 (1)
Allowances on trade receivables - in the opening balance (760) (774) (820)
IFRS 9 transition impact (22) - -
Allowances on trade receivables - including IFRS 9 transition impact (782) (774) (820)
Net addition with impact on income statement (2)
(286) (251) (275)
Losses on trade receivables 255 257 315
Changes in the scope of consolidation (2) (1) (3)
Translation adjustment (1) 7 18
Reclassifications and other items (0) 2 (9)
Reclassification to assets held for sale - - -
Allowances on trade receivables - in the closing balance (816) (760) (774)
(1) As authorized by IFRS 9 (see Note 2.3), the Group has chosen not to restate the comparative periods 2016 and 2017.
(2) The change in IFRS 9 provision for 2018 amounts to (3) million euros.
Accounting policies
The trade receivables are mainly short-term with no stated interest rate and are measured at original invoice amount. Those
receivables which include deferred payment terms over 12 or 24 months for the benefit of customers are discounted and
classified as current items. Receivables from financial lease offers on firms’ equipment are recognized as current operating
receivables because they are acquired in the normal course of business.
Impairment of trade receivables is based on three methods:
a collective statistical method: this is based on historical losses and leads to a separate impairment rate for each aging
balance category. This analysis is performed over a homogenous group of receivables with similar credit characteristics
because they belong to a customer category (mass-market, small offices and home offices);
a stand-alone method: the assessment of impairment probability and its amount are based on a set of relevant qualitative
factors (ageing of late payment, other balances with the counterpart, rating from independent agencies, geographical area).
This method is used for carriers and operators (national and international), local, regional and national authorities and for
large accounts of Enterprise Communication Services;
a provisioning method based on anticipated loss: IFRS 9 requires recognition of expected losses on receivables
immediately upon recognition of the financial instruments. In addition to the pre-existing provisioning system, the Group
applies a simplified approach of anticipated impairment at the time the asset is recognized. The percentage applied
depends on the maximum revenues non-recoverability rate.
Impairment losses identified for a group of receivables represent the step preceding impairment identification for individual
receivables. When information is available (clients in bankruptcy or subject to equivalent judicial proceedings), these
receivables are then excluded from the statistical impairment database and individually impaired.
The trade receivables may be part of securitization programs. When they are sold to consolidated special purpose entities,
they are still recognized in the statement of financial position. Other sales to financial institutions may lead to their
de-recognition where the risks and benefits are transferred as described by IFRS 9.
641
203
206
1,050
140
723
2151,078
143
193
569
905

Consolidated financial statements 2018 48
4.4 Customer contract net assets and liabilities
(in millions of euros)
December 31, 2018
December 31, 2017
December 31, 2016
Customer contract net assets (1)
784 815 916
Costs of obtaining a contract 233 250 274
Costs to fulfill a contract 149 139 145
Total customer contract net assets 1,166 1,204 1,335
Prepaid telephone cards (221) (241) (266)
Connection fees (706) (725) (710)
Loyalty programs (38) (43) (58)
Other deferred revenue (2)
(1,025) (1,002) (1,028)
Other customer contract liabilities (12) (10) (9)
Total deferred revenue related to customer contracts (2,002) (2,021) (2,071)
Total customer contract net assets and liabilities (836) (817) (736)
(1) Assets net of remaining performance obligations.
(2) Includes subscription fees.
The following tables give an analysis of the balances of customer contract net assets and the costs of acquiring and fulfilling
them in the financial statements.
(in millions of euros) 2018 2017 2016
Customer contract net assets - in the opening balance 815 916 1,027
Business related variations(1)
(36) (109) (105)
Changes in the scope of consolidation - - -
Translation adjustment (1) 7 (6)
Reclassifications and other items 6 1 -
Reclassification to assets held for sale - - -
Customer contract net assets - in the closing balance 784 815 916 (1) Mainly includes the new customer contract assets net of related liabilities, the transfer of the net contract assets directly to trade receivables and impairment of the period.
Below is presented the change in deferred income on customer contracts (prepaid telephone cards, service access fees, loyalty programs and other unearned income) in the statement of financial position.
(in millions of euros) 2018 2017 2016
Deferred revenue related to customer contracts - in the opening balance 2,021 2,071 2,120
Business related variations (18) (40) (31)
Changes in the scope of consolidation 7 - 11
Translation adjustment 2 (16) (39)
Reclassifications and other items (10) 6 10
Reclassification to assets held for sale - - -
Deferred revenue related to customer contracts - in the closing balance 2,002 2,021 2,071

Consolidated financial statements 2018 49
Accounting policies
Customer contract net assets and liabilities
The timing of revenue recognition may differ from customer invoicing.
Trade receivables presented in the consolidated statement of financial position represent an unconditional right to receive
consideration (primarily cash), i.e. the services and goods promised to the customer have been transferred.
By contrast, contract assets mainly refer to amounts allocated per IFRS 15 as compensation for goods or services provided to
customers for which the right to collect payment is subject to providing other services or goods under that same contract (or
group of contracts). This is the case in a bundled offer combining the sale of a mobile phone and mobile communication
services for a fixed-period, where the mobile phone is invoiced at a reduced price leading to the reallocation of a portion of
amounts invoiced for telephone communication services to the supply of the mobile phone. The excess of the amount allocated
to the mobile phone over the price invoiced is recognized as a contract asset and transferred to trade receivables as the service
is invoiced.
Contract assets, like trade receivables, are subject to impairment for credit risk. The recoverability of contract assets is also
verified, especially to cover the risk of impairment should the contract be interrupted. Recoverability may also be impacted by a
change in the legal environment governing offers.
Contract liabilities represent amounts paid by customers to Orange before receiving the goods and/or services promised in the
contract. This is typically the case for advances received from customers or amounts invoiced and paid for goods or services not
transferred yet, such as contracts payable in advance or prepaid packages (previously recognized in deferred income).
Customer contract assets and liabilities are presented, respectively, in current assets and current liabilities since they are a
normal part of the Group's operations.
(in millions of euros) 2018 2017 2016
Costs of obtaining a contract - in the opening balance 250 274 294
Business related variations (14) (30) (16)
Changes in the scope of consolidation - - -
Translation adjustment (3) 6 (4)
Reclassifications and other items 0 - -
Reclassification to assets held for sale - - -
Costs of obtaining a contract - in the closing balance 233 250 274
(in millions of euros) 2018 2017 2016
Costs to fulfill a contract - in the opening balance 140 145 121
Business related variations 22 (5) 24
Changes in the scope of consolidation - - -
Translation adjustment 3 - -
Reclassifications and other items (16) - -
Reclassification to assets held for sale - - -
Costs to fulfill a contract - in the closing balance 149 140 145
Accounting policies
Cost of obtaining a contract
Where a telecommunications service contract is signed via a third-party distributor, this distributor may receive business
provider remuneration, generally paid in the form of a commission for each contract or invoice-indexed commission. Where the
commission is incremental and would not have been paid in the absence of the contract, the commission cost is estimated and
capitalized in the balance sheet. It should be noted that the Group has adopted the simplification measure authorized by
IFRS 15 to recognize the costs of obtaining contracts as an expense when they are incurred if the amortization period of the
asset, it would have recognized in respect of them, would not have exceeded a year.
The costs of obtaining fixed-period mobile service contracts are capitalized and released to profit or loss on a straight-line over
the enforceable contract term, as these costs are generally incurred each time the customer renews the fixed-period. The costs
of obtaining fixed-period landline services for Mass market customers are expensed on a straight-line over the estimated period
of the customer relationship. The costs of obtaining business and operator solutions contracts are not material.
Costs to fulfill a contract
Costs to fulfill a contract consist of all the initial contractual costs necessary to fulfill one or more performance obligations of a
contract. These costs, when they qualify as non-distinct from the performance obligation, are capitalized and costs incurred are
recorded on a time-apportioned basis over the effective period of the contract.
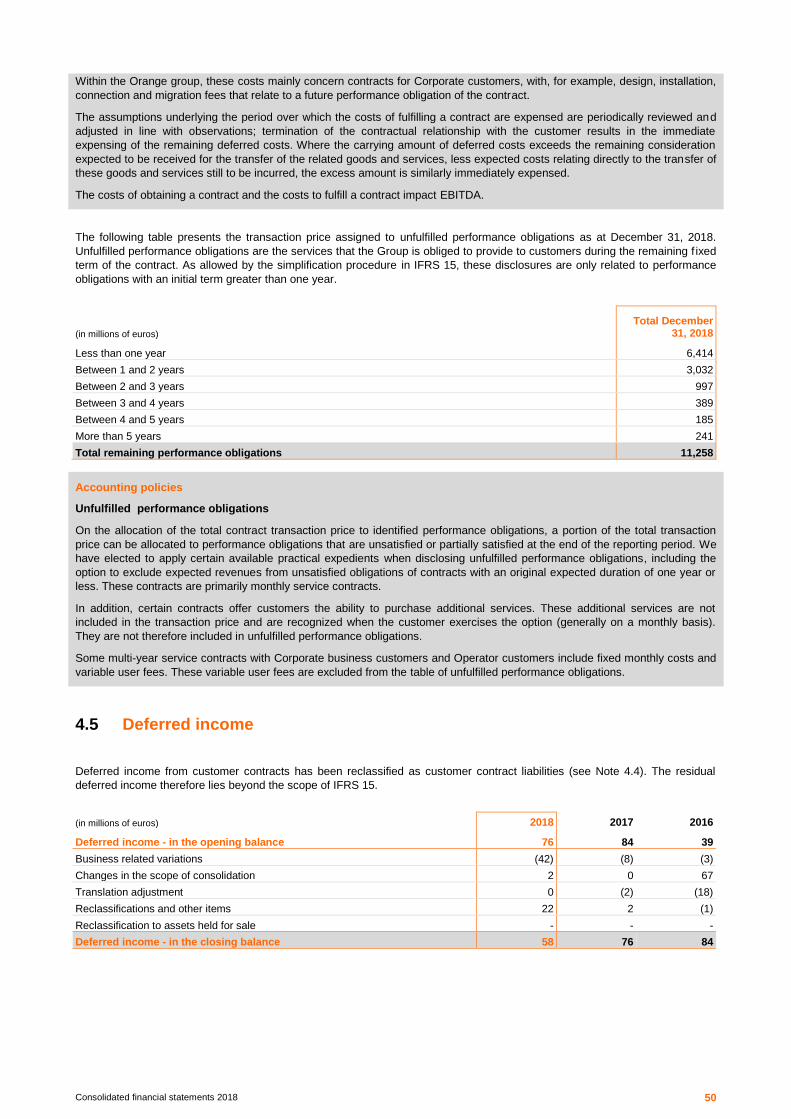
Consolidated financial statements 2018 50
Within the Orange group, these costs mainly concern contracts for Corporate customers, with, for example, design, installation,
connection and migration fees that relate to a future performance obligation of the contract.
The assumptions underlying the period over which the costs of fulfilling a contract are expensed are periodically reviewed and
adjusted in line with observations; termination of the contractual relationship with the customer results in the immediate
expensing of the remaining deferred costs. Where the carrying amount of deferred costs exceeds the remaining consideration
expected to be received for the transfer of the related goods and services, less expected costs relating directly to the transfer of
these goods and services still to be incurred, the excess amount is similarly immediately expensed.
The costs of obtaining a contract and the costs to fulfill a contract impact EBITDA.
The following table presents the transaction price assigned to unfulfilled performance obligations as at December 31, 2018.
Unfulfilled performance obligations are the services that the Group is obliged to provide to customers during the remaining f ixed
term of the contract. As allowed by the simplification procedure in IFRS 15, these disclosures are only related to performance
obligations with an initial term greater than one year.
(in millions of euros)
Total December 31, 2018
Less than one year 6,414
Between 1 and 2 years 3,032
Between 2 and 3 years 997
Between 3 and 4 years 389
Between 4 and 5 years 185
More than 5 years 241
Total remaining performance obligations 11,258
Accounting policies
Unfulfilled performance obligations
On the allocation of the total contract transaction price to identified performance obligations, a portion of the total transaction
price can be allocated to performance obligations that are unsatisfied or partially satisfied at the end of the reporting period. We
have elected to apply certain available practical expedients when disclosing unfulfilled performance obligations, including the
option to exclude expected revenues from unsatisfied obligations of contracts with an original expected duration of one year or
less. These contracts are primarily monthly service contracts.
In addition, certain contracts offer customers the ability to purchase additional services. These additional services are not
included in the transaction price and are recognized when the customer exercises the option (generally on a monthly basis).
They are not therefore included in unfulfilled performance obligations.
Some multi-year service contracts with Corporate business customers and Operator customers include fixed monthly costs and
variable user fees. These variable user fees are excluded from the table of unfulfilled performance obligations.
4.5 Deferred income
Deferred income from customer contracts has been reclassified as customer contract liabilities (see Note 4.4). The residual
deferred income therefore lies beyond the scope of IFRS 15.
(in millions of euros) 2018 2017 2016
Deferred income - in the opening balance 76 84 39
Business related variations (42) (8) (3)
Changes in the scope of consolidation 2 0 67
Translation adjustment 0 (2) (18)
Reclassifications and other items 22 2 (1)
Reclassification to assets held for sale - - -
Deferred income - in the closing balance 58 76 84

Consolidated financial statements 2018 51
4.6 Other assets
(in millions of euros) December 31, 2018 December 31, 2017 December 31, 2016
Advances and downpayments 84 92 99
Submarine cable consortiums (1)
130 157 235
Security deposits paid 97 79 78
Orange Money - restriction of electronic money (1)
497 408 319
Others 473 468 448
Total 1,281 1,204 1,179
(1) These receivables are offset by the liabilities of the same amount (see accounting policies and Note 5.7).
(in millions of euros) 2018 2017 2016
Other assets - in the opening balance 1,204 1,179 1,068
Business related variations 74 49 24
Changes in the scope of consolidation 7 (6) 98
Translation adjustment 1 (12) (16)
Reclassifications and other items (5) (6) 5
Reclassification to assets held for sale - - -
Other assets - in the closing balance 1,281 1,204 1,179
o/w other non-current assets 129 110 106
o/w other current assets 1,152 1,094 1,073
Accounting policies
Other assets relating to “Submarine cable consortiums” are receivables from submarine cable consortium members when
Orange is in charge of centralizing the payments to the equipment suppliers that build and manage these cables. These
receivables are offset by the liabilities of the same amount (see Note 5.7).
Orange Money is a money transfer, payment and financial services solution provided via an electronic money (“e-money”)
account linked to an Orange mobile number.
Since 2016, the Orange group has become an Electronic Money Issuer (“EMI”) in some of the countries in which it operates,
via dedicated, approved, internal subsidiaries. Regulations state that EMIs, as last-resort guarantors for the reimbursement of
e-money holders, are obliged to restrict the funds collected in exchange for the issue of e-money (obligation to protect holders).
The e-money distribution model relies on Orange’s subsidiaries and third-party distributors. EMIs issue e-money (or units of
value “UV”) at the request of these distributors in exchange for funds collected therefrom. The distributors then transfer the e-
money to end holders.
Within the Orange group, this restriction includes the protection of third-party holders (distributors and customers).
These transactions have no impact on the Group’s net financial debt and are listed under the following headings:
assets restricted to an amount equal to the e-money in circulation outside of the Orange group (or UV in circulation);
UV in circulation under liabilities, representing the obligation to reimburse the third-party holders (customers and third-party
distributors).
These two headings are presented under “other assets” and “other liabilities” and under operating activities as “change in
working capital requirement”.
4.7 Related party transactions
The French State, either directly or through Bpifrance Participations, is one of the main shareholders of Orange SA. The
communication services provided to the French State are done so as part of a competitive process held for each service
according to the nature of the service. They have no material impact on consolidated revenues.
Transactions with associates and joint ventures are presented in Note 10.
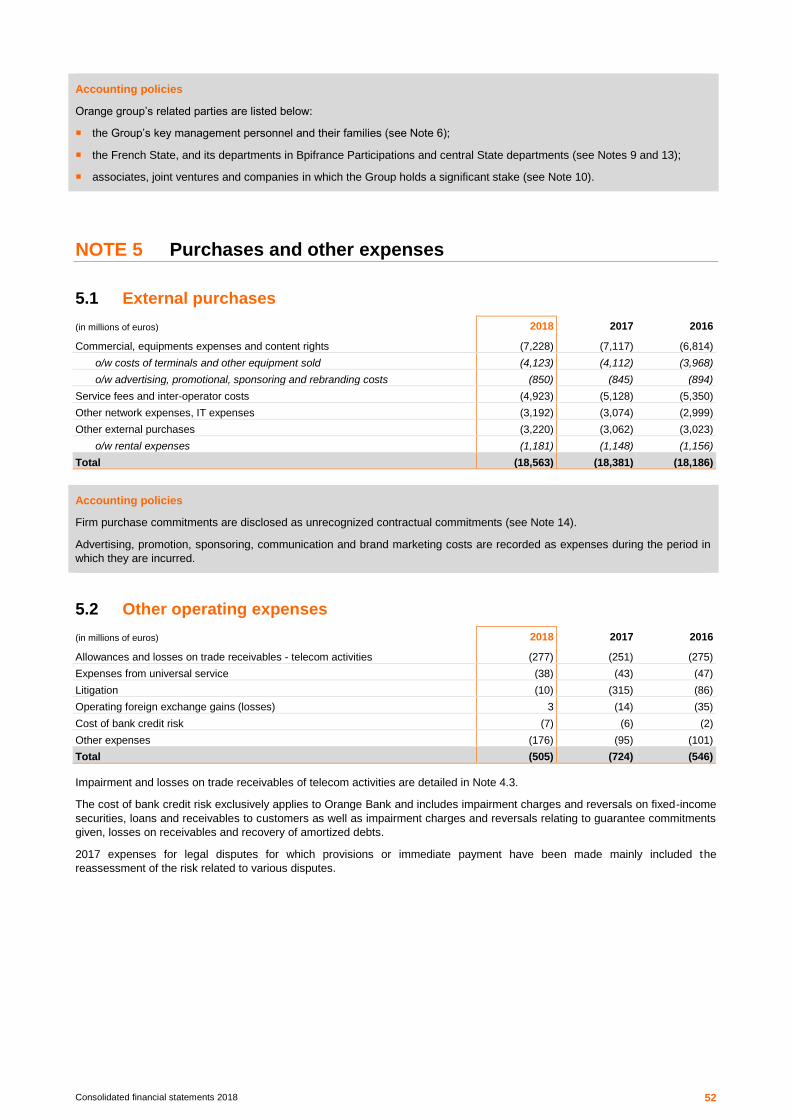
Consolidated financial statements 2018 52
Accounting policies
Orange group’s related parties are listed below:
the Group’s key management personnel and their families (see Note 6);
the French State, and its departments in Bpifrance Participations and central State departments (see Notes 9 and 13);
associates, joint ventures and companies in which the Group holds a significant stake (see Note 10).
NOTE 5 Purchases and other expenses
5.1 External purchases
(in millions of euros) 2018 2017 2016
Commercial, equipments expenses and content rights (7,228) (7,117) (6,814)
o/w costs of terminals and other equipment sold (4,123) (4,112) (3,968)
o/w advertising, promotional, sponsoring and rebranding costs (850) (845) (894)
Service fees and inter-operator costs (4,923) (5,128) (5,350)
Other network expenses, IT expenses (3,192) (3,074) (2,999)
Other external purchases (3,220) (3,062) (3,023)
o/w rental expenses (1,181) (1,148) (1,156)
Total (18,563) (18,381) (18,186)
Accounting policies
Firm purchase commitments are disclosed as unrecognized contractual commitments (see Note 14).
Advertising, promotion, sponsoring, communication and brand marketing costs are recorded as expenses during the period in
which they are incurred.
5.2 Other operating expenses
(in millions of euros) 2018 2017 2016
Allowances and losses on trade receivables - telecom activities (277) (251) (275)
Expenses from universal service (38) (43) (47)
Litigation (10) (315) (86)
Operating foreign exchange gains (losses) 3 (14) (35)
Cost of bank credit risk (7) (6) (2)
Other expenses (176) (95) (101)
Total (505) (724) (546)
Impairment and losses on trade receivables of telecom activities are detailed in Note 4.3.
The cost of bank credit risk exclusively applies to Orange Bank and includes impairment charges and reversals on fixed-income
securities, loans and receivables to customers as well as impairment charges and reversals relating to guarantee commitments
given, losses on receivables and recovery of amortized debts.
2017 expenses for legal disputes for which provisions or immediate payment have been made mainly included the
reassessment of the risk related to various disputes.

Consolidated financial statements 2018 53
(in millions of euros) 2018 2017 2016
Provision for litigation - in the opening balance 779 537 528
Additions with impact on income statement 35 354 24
Reversals with impact on income statement (25) (34) (7)
Discounting with impact on income statement 3 2 4
Utilizations without impact on income statement(1)
(221) (37) (13)
Changes in consolidation scope 1 - (6)
Translation adjustment 3 7 (5)
Reclassifications and other items (3) (50) 12
Reclassification to assets held for sale - - -
Provision for litigation - in the closing balance 572 779 537
o/w non-current provision 67 53 69
o/w current provision 505 726 468
(1) In 2018, mainly related to the payment of the fine in Poland for 152 million euros (see Note 16.3).
Payments related to some litigation are directly recorded in other operating expenses.
The Group’s significant litigations are described in Note 16.
Accounting policies
Litigation
In the ordinary course of business, the Group is involved in a number of legal and arbitration proceedings and administrative
actions described in Note 16.
The costs which may result from these proceedings are accrued at the reporting date if the Group has a present obligation
towards a third party resulting from a past event and it is probable that an outflow of resources embodying economic benefits
will be required to settle the obligation and the amount of that liability can be quantified or estimated within a reasonable range.
The amount of provision recorded is based on a case-by-case assessment of the risk level, and events arising during the
course of legal proceedings may require a reassessment of this risk. Where appropriate, litigation cases may be analyzed as
contingent liabilities, which correspond to:
probable obligations arising from past events that are not recognized because their existence will be confirmed only by the
occurrence or non-occurrence of one or more uncertain future events not wholly within the Company’s control; or
present obligations arising from past events that are not recognized because it is not probable that an outflow of resources
embodying economic benefits will be required to settle the obligation or because the amount of the obligation cannot be
measured with sufficient reliability.
5.3 Restructuring and integration costs
(in millions of euros) 2018 2017 2016
Restructuring costs (189) (164) (428)
Departure plans (1)
(30) (67) (128)
Lease property restructuring (2)
(28) (58) (74)
Distribution channels (3)
(11) (4) (181)
Other (120) (35) (45)
Integration costs (10) (3) (71)
Jazztel (4)
- - (43)
Acquisition costs of investments (10) (3) (23)
Other - - (5)
Total (199) (167) (499)
(1) Mainly voluntary departure plans of Orange Polska in 2017 (approximately 2,700 people) and Orange Spain in 2016 (approximately 500 people).
(2) Essentially related to vacant leases in France.
(3) Concerns the end of the relationship with some indirect distributors.
(4) In 2016, mainly related to termination of operational contracts as part of the integration of the activities of Jazztel (principally linked to IRUs and leased lines).
Some restructuring and integration costs are directly recorded in operating income and are not included in the following
movements of provisions:

Consolidated financial statements 2018 54
(in millions of euros) 2018 2017 2016
Restructuring and integration provision - in the opening balance 377 375 414
Additions with impact on income statement 162 150 234
Reversals releases with impact on income statement (15) (34) (19)
Utilizations without impact on income statement (143) (133) (205)
Translation adjustment (1) (1) (1)
Reclassifications and other items 9 20 (48)
Reclassification to assets held for sale - - -
Restructuring and integration provision - in the closing balance 389 377 375
o/w non-current provision 230 251 185
o/w current provision 159 126 190
Accounting policies
Restructuring costs
The adjustment of Group activities in line with changes in the business environment may also incur other types of
transformation costs. These actions may have a negative effect on the period during which they are announced or
implemented; for instance but not limited to, some of the transformation plans approved by the internal governance bodies.
Provisions are recognized only when the restructuring has been announced and the Group has drawn up or started to
implement a detailed formal plan prior to the end of the reporting period.
The types of costs approved by the Group as restructuring costs primarily consist of:
employee departure plans;
indemnities paid to suppliers to terminate a contract (distribution networks, content operations, etc.);
cost of vacant buildings;
transformation plans for communication network infrastructures.
Onerous contracts: during the course of a contract, when the economic circumstances that prevailed at inception change,
some commitments towards the suppliers may become onerous, i.e. the unavoidable costs of meeting the obligations under
the contract exceed the economic benefits expected to be received under it.
Integration costs
Integration costs are incurred at the time of acquisition of legal entities (costs linked to the acquisition of the entity, consultancy
fees, training costs for new staff, migration costs associated with customer offers, labor expenses associated with the
transition). They are incurred over a maximum period of 12 months following the acquisition date.
5.4 Broadcasting rights and equipment inventories
(in millions of euros) December 31, 2018 December 31, 2017 December 31, 2016
Handset inventories 678 583 594
Other products sold 41 32 29
Available broadcasting rights 73 68 45
Other supplies 242 198 205
Gross value 1,034 881 873
Depreciation (69) (54) (54)
Net book value 965 827 819
(in millions of euros) 2018 2017 2016
Inventories - in the opening balance 827 819 763
Business related variations 138 14 62
Changes in the scope of consolidation 2 0 3
Translation adjustment (1) (3) (9)
Reclassifications and other items (1) (4) (0)
Reclassification to assets held for sale - - -
Inventories - in the closing balance 965 827 819

Consolidated financial statements 2018 55
Accounting policies
Network maintenance equipment and equipment intended for sale to customers are measured at the lower of cost or likely
realizable value. The cost corresponds to the purchase or production cost determined by the weighted average cost method.
Handset inventories include inventories treated as consignment with distributors when these are qualified, for accounting
purposes, as agents in the sales of handsets bought from the Group (49 million euros in 2018, 55 million euros in 2017 and 48
million euros in 2016).
Film or sports broadcasting rights are recognized in the statement of financial position when they are available for exhibition
and expensed when broadcast.
5.5 Prepaid expenses
Before the adoption of IFRS 15, the cost of fulfilling contracts were presented in prepaid expenses. Such costs are now
presented within other customer contracts assets (see Note 4.4).
(in millions of euros) December 31, 2018 December 31, 2017 December 31, 2016
Prepaid rentals and external purchases 522 408 366
Other prepaid operating expenses 49 47 28
Total 571 455 394
(in millions of euros) 2018 2017 2016
Prepaid expenses - in the opening balance 455 394 373
Business related variations 93 78 11
Changes in the scope of consolidation 6 - 17
Translation adjustment 0 (17) (17)
Reclassifications and other items 17 0 10
Reclassification to assets held for sale - - -
Prepaid expenses - in the closing balance 571 455 394
5.6 Trade payables
(in millions of euros) 2018 2017 2016
Trade payables - in the opening balance 6,527 6,214 6,231
Business related variations 189 413 78
Changes in the scope of consolidation 18 (9) 134
Translation adjustment 1 (56) (116)
Reclassifications and other items 1 (35) (113)
Reclassification to assets held for sale - - -
Trade payables - in the closing balance 6,736 6,527 6,214
o/w trade payables from telecoms activities 6,635 6,445 6,168
o/w trade payables from Orange Bank 101 82 46
Supplier payment terms are mutually agreed between the suppliers and Orange in accordance with the rules in force. Certain
key suppliers and Orange have agreed to a flexible payment schedule which, for certain invoices, can be extended up to six
months.
Trade payables and fixed asset payables that were subject to a payment extension, and had an impact on the change in
working capital requirements at the end of the period, amounted to approximately 310 million euros at December 31, 2018,
approximately 300 million euros at the end of 2017 and approximately 320 million euros at the end of 2016.
Accounting policies
Trade payables resulting from trade transactions and settled in the normal operating cycle are classified as current items. They
include those that have been financed by the supplier (with or without notification of transfer to financial institutions) under
direct or reverse factoring, and those for which the supplier proposed an extended payment period to Orange and for which
Orange confirmed the payment arrangement under the agreed terms. Orange considers these financial liabilities to carry the
characteristics of trade payables, in particular due to the ongoing trade relationship, the payment schedules ultimately
consistent with the operational cycle of a telecommunications operator in particular for the purchase of primary infrastructures,

Consolidated financial statements 2018 56
the supplier’s autonomy in the anticipated relationship and a financial cost borne by Orange that corresponds to the
compensation of the supplier for the extended payment schedule agreed.
For payables without specified interest rates, they are measured at nominal value if the interest component is negligible. For
interest bearing payables, the measurement is at amortized cost.
5.7 Other liabilities
(in millions of euros) December 31, 2018 December 31, 2017 December 31, 2016
Provision for litigation (1)
572 779 537
Cable network access fees (IRU) (2)
152 194 240
Submarine cable consortium (3)
130 157 235
Security deposit received 160 182 198
Orange Money - units in circulation (3)
497 408 319
Other 739 738 610
Total 2,250 2,456 2,138
o/w other non-current liabilities 462 521 608
o/w other current liabilities 1,788 1,935 1,530
(1) See Note 5.2.
(2) See accounting policies Note 8.3.
(3) These liabilities are offset by the receivables of the same amount (see accounting policies and Note 4.6).
(in millions of euros) 2018 2017 2016
Other liabilities - in the opening balance 2,456 2,138 2,487
Business related variations (1)
(166) 267 (432)
Changes in the scope of consolidation 16 18 75
Translation adjustment (2) (7) (19)
Reclassifications and other items (54) 40 27
Reclassification to assets held for sale - - -
Other liabilities - in the closing balance 2,250 2,456 2,138
(1) 2018 variation is mainly related to fine payment in Poland for 152 million euros (refer to Note 16.3) and 2016 variation is mainly related to the payment of the fine for the Enterprise Market litigation for 350 million euros.
5.8 Related party transactions
Orange does not purchase goods or services from the French State (either directly or via Bpifrance Participations), except the
use of spectrum resources. These resources are allocated after a competitive process.

Consolidated financial statements 2018 57
NOTE 6 Employee benefits
6.1 Labor expenses
(in millions of euros) Note 2018 2017 2016
Average number of employees (full-time equivalents) (1)
135,943 138,038 141,257
Wages and employee benefit expenses (8,828) (8,402) (8,625)
o/w wages and salaries (6,017) (5,986) (6,074)
o/w social security charges (2)
(2,068) (2,121) (2,104)
o/w French part-time for seniors plans 6.2 (773) (310) (432)
o/w capitalized costs (3)
842 839 809
o/w other labor expenses (4)
(812) (824) (824)
Employee profit sharing (180) (183) (180)
Share-based compensation 6.3 (66) 11 (61)
Total in operating income (9,074) (8,574) (8,866)
Net interest on the net defined liability (16) (21) (28)
Actuarial (gains)/losses generated during the year 45 16 (80)
(1) Of whom 40% were Orange SA's French civil servants (45% at December 31, 2017 and 50% at December 31, 2016).
(2) Net of approximately 85 million euros for competitiveness and employment tax credit for 2018 in France (102 million euros as at December 31, 2017 and 98 million euros as at December 31, 2016).
(3) Capitalized costs correspond to labor expenses included in the cost of assets produced by the Group (see Notes 8.3 and 8.4).
(4) Other labor expenses comprise other short-term allowances and benefits, payroll taxes, post-employment benefits and other long term benefits (except French part-time for seniors plans).
6.2 Employee benefits
(in millions of euros) December 31, 2018 December 31, 2017 December 31, 2016
Post-employment benefits(1)
989 1,005 998
Other long-term benefits 2,434 2,313 2,616
o/w French part-time for seniors plans 1,784 1,644 1,956
Provision for employment termination benefits 3 4 7
Other employee-related payables and payroll taxes due 1,715 1,710 1,631
Provision for social risks and litigation 74 90 43
Total 5,215 5,122 5,295
o/w non-current employee benefits 2,823 2,674 3,029
o/w current employee benefits 2,392 2,448 2,266
(1) Does not include defined contribution plans.
The payments to be made in respect of post-employment benefits and other long-term benefits are presented below. These are
estimated based on Group headcounts as at December 31, 2018, including rights acquired and not acquired at December 31,
2018, but for which it is assumed the rights will be acquired by the year 2040 approximately:
Schedule of benefits to be paid, undiscounted
(in millions of euros) 2019 2020 2021 2022 2023 2024 and
beyond
Post-employment benefits 64 50 57 50 51 2,527
Other long-term benefits (1)
637 514 396 296 229 161
o/w French part-time for seniors plans 558 429 325 248 205 115
Total 701 564 453 346 280 2,688
(1) Provisions for time saving account and long-term leave and long-term sick leave not included.
6.2.1 Types of post-employment benefits and other long-term benefits
In accordance with the laws and practices in force in the countries where it operates, the Group has obligations in terms of
employee benefits:
with regard to retirement, the majority of employees are covered by defined contribution plans required by law or under
national agreements. In France, civil servants employed by Orange SA are covered by the French government sponsored
civil and military pension plan. Orange SA’s obligation under the plan is limited to the payment of annual contributions
(French law No. 96-660 dated July 26, 1996). Consequently, Orange SA has no further obligation to fund future deficits of

Consolidated financial statements 2018 58
the pension plans covering its own civil servant employees or any other civil service plans. Expenses recognized under the
terms of defined contribution pension plans amounted to 828 million euros in 2018 (924 million euros in 2017 and 863 million
euros in 2016);
the Group is committed to a limited number of annuity-based defined-benefit plans: notably the Equant plans in the United
Kingdom for 289 million euros and a plan for senior management staff in France for 207 million euros. Plan assets were
transferred to these plans in the United Kingdom and in France. A few years ago, these plans were closed to new
subscribers and also closed in the United Kingdom with regard to the acquisition of rights;
the Group is also committed to capital-based defined benefit plans where, in accordance with the law or contractual
agreements, employees are entitled to certain lump-sum payments or bonuses either on retirement or subsequent to
retirement, depending on their years of service and end of career salary; this essentially relates to bonuses due upon
retirement in France, particularly for employees under private-law contracts (673 million euros for Orange SA, equal to 81%
of the capital-based plans) and for civil servants (50 million euros, equal to 6% of capital-based plans);
other post-employment benefits are also granted to retired employees: these are benefits other than defined-benefit and
defined-contribution plans;
other long-term benefits may also be granted such as seniority awards, long-term compensated absences and French
part-time for seniors plans (TPS) detailed below.
French part-time for seniors plans
As at part of renegotiations of intergenerational plans, the 2015 part-time for seniors (TPS) plan was extended in 2018 for three
additional years. The number of future beneficiaries of this new part-time for seniors plan is about 6,000 employees.
The part-time for seniors plans are accessible to civil servants and employees under private contract from the French entities
who are eligible for full retirement benefits within 3 to 5 years and who have at least 15 years service within the Group. Eligible
employees are those who will retire no later than January 1, 2025.
These plans give employees the opportunity to work 50% or 60% of a full-time job whilst receiving:
a base salary between 65% and 80% of full-time employment;
the retirement entitlement benefits of full-time employment during the period in question (both the Company’s and the
employee’s contributions);
a minimum salary level.
These plans last for a period of at least 18 months and no longer than five years.
The beneficiaries may decide to invest part of their base compensation (5%, 10% or 15%) in a Time Savings Account (CET),
with an additional Group contribution. The CET allows for a reduction in the amount of time worked.
At December 31, 2018, 30,400 employees had signed up for TPS, 17,900 of whom have already passed through it. The number
of employees who are or will be participating in the French part-time for seniors plans and thus included in the provision, is
estimated approximately at 18,700 employees.
6.2.2 Key assumptions used to calculate the amount of obligations
The assessment of post-employment benefits and other long-term benefits is based on retirement age calculated in accordance
with the provisions applicable to each plan and the necessary conditions to ensure entitlement to a full pension, both of which
are often subject to legislative changes.
The valuation of the obligation of the French part-time for seniors plans is sensitive to estimates of the potentially eligible
population and to the sign-up rate for the plans (estimated at 70% on average), as well as the trade-offs that the beneficiaries
will ultimately make between the different plans proposed.
The discount rates used for the euro zone (which accounts for 90% of Orange’s pension and other long-term employee benefit
obligations) are as follows:
December 31, 2018 December 31, 2017 December 31, 2016
More than 10 years 1.70% à 1.85% 1.55% to 1.65% 1.45% to 1.85%
Less than 10 years -0.20% à 1.30%(1)
-0.25% to 1.65% -0.10% to 1.45%
(1) A -0.05% rate has been used to value the obligation regarding the French part-time for seniors plans (versus -0.25% as at December 31, 2017).
The discount rates used for the euro zone are based on corporate bonds rated AA, with a duration equivalent to the duration of
the obligations.
The increase in annuities of the Equant plans in the United Kingdom is based on inflation (3.35% used) up to 5%. In France, the
revaluation of the annuity-based plan for senior management is based on the INSEE consumer price index (2% used).
The main capital-based defined benefit plan (retirement bonuses for employees under private-law contracts in France) is
principally sensitive to employment policy assumptions (Orange has historically had high numbers of staff at retirement age).
The estimated increase in the capital of this plan is based on a long-term inflation assumption of 2% associated with the effect
of a higher “GVT” (acronym for Wage drift - Seniority - Job-skills). “Wage drift - Seniority - Job-skills” refers to annual change in

Consolidated financial statements 2018 59
total payroll costs independent of general or categorical increases in wages and salaries, due to in-grade promotions, out of
grade promotions and the aging of existing staff.
The impacts on pension benefit obligations of changes in key assumptions would be as follows:
(in millions of euros) Rate increase by 50 points Rate decrease by 50 points
Discount rates(1)
(104) 114 Rate decrease by 5 % Rate increase by 5 %
Sign-up rates for French part-time for seniors plans(2)
(54) 54
(1) Includes 19 million euros for the French part-time for seniors plans (short term duration).
(2) Sensitivity is performed on future entries in French part-time for seniors plans (TPS).
6.2.3 Commitments and plan assets
Post-employment benefits Long-term benefits 2018 2017 2016
(in millions of euros)
Annuity-based plans
Capital-based plans Other
French part-time
for seniors
plans (TPS) Other
Total benefit obligations in the opening balance
518 826 70 1,644 669 3,727 4,009 4,009
Service cost 2 48 1 687 (1)
48 786 154 173
Net interest on the defined benefit liability 8 16 1 (3) 1 23 29 37
Actuarial losses/(gains) arising from changes of assumptions
(16) (17) (1) - - (34) 67 190
o/w arising from change in discount rate (17) (17) (1) (3) - (38) 37 115
Actuarial losses/(gains) arising from experience
11 (20) - 86 1 78 212 292
Benefits paid (19) (26) (3) (630) (68) (746) (738) (640)
Translation adjustment and other (2) 6 0 - (1) 3 (6) (52)
Total benefit obligations in the closing balance (a)
502 833 68 1,784 650 3,837 3,727 4,009
o/w benefit obligations in respect of employee benefit plans that are wholly or partly funded
502 5 - - - 507 523 559
o/w benefit obligations in respect of employee benefit plans that are wholly unfunded
- 828 68 1,784 650 3,330 3,204 3,450
Weighted average duration of the plans (in years)
14 13 16 2 6 6 6 6
(1) Including 669 million of euros relating to 2018 TPS agreement.
Post-employment benefits Long-term benefits 2018 2017 2016
(in millions of euros)
Annuity-based plans
Capital-based plans Other
French part-time
for seniors
plans (TPS) Other
Fair value of plan assets in the opening balance
409 (0) - - - 409 395 380
Net interest on the defined benefit liability
7 (0) - - - 7 7 9
(Gains)/Losses arising from experience
2 (0) - - - 2 20 28
Employer contributions 16 - - - - 16 18 37
Benefits paid by the fund (17) - - - - (17) (22) (24)
Translation adjustment and other (3) - - - - (3) (9) (35)
Fair value of plan assets in the closing balance (b)
414 (0) - - - 414 409 395
Funded annuity-based plans represent 13 % of Group social commitments.

Consolidated financial statements 2018 60
The funded annuity-based plans are primarily located in the United Kingdom (61%) and France (38%) and their assets are
broken down as follows:
Debt securities
Equities
Money market assets
Other
Employee benefits in the statement of financial position correspond to commitments less plan assets. These have not been
subject to asset ceiling adjustment for the periods presented.
Post-employment benefits Long-term benefits 2018 2017 2016
(in millions of euros)
Annuity-based plans
Capital-based plans Other
French part-time
for seniors
plans (TPS) Other
Employee benefits in the opening balance
109 826 70 1,644 669 3,318 3,614 3,629
Net expense for the period 3 64 2 770 50 889 452 576
Employer contributions (16) - - - - (16) (18) (37)
Benefits directly paid by the employer (2) (26) (3) (630) (68) (729) (716) (616)
Actuarial (gains)/losses generated during the year
(7) (37) (1) - - (45) (16) 80
Translation adjustment and other 1 6 - - (1) 6 2 (18)
Employee benefits in the closing balance - Net unfunded status (a) - (b)
88 833 68 1,784 650 3,423 3,318 3,614
o/w non-current 67 793 65 1,226 571 2,722 2,600 2,933
o/w current 21 40 3 558 79 701 718 681
The following table discloses the net expense:
Post-employment benefits Long-term benefits 2018 2017 2016
(in millions of euros)
Annuity-based plans
Capital-based plans Other
French part-time
for seniors
plans (TPS) Other
Service cost (2) (48) (1) (687) (48) (786) (154) (173)
Net interest on the net defined benefit liability
(1) (16) (1) 3 (1) (16) (21) (28)
Actuarial gains/(losses) - - - (86) (1) (87) (277) (375)
Total (3) (64) (2) (770) (50) (889) (452) (576)
o/w expenses in operating income (2) (48) (1) (773) (49) (873) (431) (548)
o/w expenses in finance costs (1) (16) (1) 3 (1) (16) (21) (28)
Accounting policies
Post-employment benefits are granted through:
defined contribution plans: the contributions, paid to independent institutions which are in charge of the administrative and
financial management thereof, are recognized in the fiscal year during which the services are rendered ;
defined-benefit plans: the sum of future obligations under these plans are based on actuarial assumptions using the
4.2%
54.7%
4.5%
36.6%2 018
3.6% 4.6%
44.1%
47.7%2 017
2.7% 6.6%
49.8%
40.9%
2 016

Consolidated financial statements 2018 61
projected unit credit method:
their calculation is based on demographic (employee turnover, mortality, gender parity, etc.) and financial assumptions
(salary increases, rate of inflation, etc.) defined at the level of each entity concerned;
the discount rate is defined by country or geographical area and by reference to market yields on high quality corporate
bonds (or government bonds where no active market exists). Its computation is based on external indices commonly
used as reference for the Eurozone;
actuarial gains and losses on post-employment benefits are fully recorded in other comprehensive income;
the Group’s defined benefit plans are generally not financed. In the rare cases where they are, hedging plan assets are
set up by employer and employee contributions which are managed by separate legal entities whose investments are
subject to fluctuations in the financial markets. These entities are generally administrated by joint committees comprising
representatives of the Group and of the beneficiaries. Each committee adopts its own investment strategy which is
designed to strike the optimum strategies to match assets and liabilities, based on specific studies performed by
external experts. It is generally carried out by fund managers selected by the committees and depends on the market
opportunities. Assets are measured at fair value, determined by reference to quoted prices, since they are mostly
invested in listed securities (primarily shares and bonds) and the use of other asset categories is limited.
Other long-term benefits may be granted such as seniority awards, long-term compensated absences and French part-time
for seniors plan (TPS) agreements. The calculation of the related commitments is based on actuarial assumptions (including
demographic, financial and discounting assumptions) similar to those relating to post-employment benefits. The relevant
actuarial gains and losses are recognized in profit or loss when they arise.
Termination benefits are subject to provisions (up to the related obligation). For all commitments where termination of
employment contracts would trigger payment of an indemnity, actuarial gains and losses are recognized in profit or loss for the
period when modifications take place.
6.3 Share-based payment
Orange Vision 2020 free share award plan
2017-2019 free share award (FSA) plan
On October 25, 2017, the Board of Directors’ Meeting approved the implementation of a free share award plan reserved for
employees involving 9.2 million free shares units, of which a maximum estimated at 9.1 million would be issued in the form of
shares. This plan has been granted to approximately 144,000 employees working in 87 countries. In countries where regulatory,
tax or social conditions do not allow the free awarding of shares, beneficiaries of the plan will receive a cash amount based on
the exchange-traded price of Orange stock on March 31, 2020.
Vesting will occur at December 31, 2019 and the awarding of shares on March 31, 2020, the shares being subject to:
a condition of employment from September 1, 2017 to December 31, 2019; and
internal performance conditions, namely adjusted EBITDA including banking activities (50%) and the organic cash-flow
excluding banking activities (50%). Organic cash flow as defined in the plan means the cash generated by sales transactions
once all costs and investments (excluding disbursements due to the acquisitions of licenses or spectrum) necessary for the
business are paid.
Each of these indicators will be compared to the budget approved by the Board of Directors for each of the three years. If the
performance conditions are not met, each employee meeting the attendance condition will nonetheless be awarded half of
the shares initially planned.
Performance is assessed for the years 2017, 2018 and 2019 and in relation to the budget for each of these three years, as
approved in advance by the Board of Directors’ Meeting. As such, the satisfaction of each of the performance conditions is
recorded year on year and entitlement to final allocation is a percentage based on the sum of performances assessed over the
course of the vesting period. The definitive number of shares allocated will be announced on March 31, 2020, following the
confirmation by the Board of Directors of the achievement or non-achievement of the performance conditions of the last year.
Long Term Incentive Plan (LTIP) 2017 - 2019
In addition to the free share award plan, the Board of Directors’ Meeting on July 26, 2017 approved the implementation of a free
share award plan (Long Term Incentive Plan or LTIP) reserved for the Executive Committee, Corporate Officers, executives and
leaders involving 1.6 million free shares units. This plan was granted to approximately 1,200 employees. In countries where
regulatory, tax or social conditions do not allow the free awarding of shares, beneficiaries of the plan will receive a cash amount
based on the exchange-traded price of Orange stock on March 31, 2020.
Vesting will occur at December 31, 2019 and the awarding of shares on March 31, 2020, the shares being subject to:
a condition of attendance from January 1, 2017 for Directors and Officers and members of the Executive Committee, and
from July 15 for senior management, until December 31, 2019;

Consolidated financial statements 2018 62
performance conditions, internal and external respectively, namely the organic cash flow (50%) as defined in the plan,
assessed annually in comparison with the budget, and the total shareholder return (TSR) (50%). TSR performance is
assessed by comparing, between January 1, 2017 and December 31, 2019, the evolution of Orange's TSR based on its total
shareholder return performance over the three fiscal years, and the evolution of its TSR based on the average values of the
"Stoxx Europe 600 Telecommunications" index or any other similar index that may replace it during the lifetime of the Plan.
Valuation assumptions:
Free share award plan
Long Term Incentive Plan
Measurement date October 26, 2017 July 26, 2017
Vesting date December 31, 2019 December 31, 2019
Price of underlying instrument at measurement date 13.74 euros 14.33 euros
Price of underlying instrument at closing date 14.16 euros 14.16 euros
Expected dividends (% of the share price) 4.5% 4.5%
Risk free yield -0.45% -0.32%
Fair value per share of benefit granted to employees 12.45 euros 9.55 euros
o/w fair value of internal performance condition 12.45 euros 12.81 euros
o/w fair value of external performance condition - 6.29 euros
Accounting effect
For the portion of the free share award plan issued in the form of shares, fair value has been determined based on the market
price of Orange shares on the date of allocation and the expected dividends discounted until December 31, 2019. For the
portion of the LTIP plan issued in the form of shares, fair value also takes into account the likelihood of achievement of the
market performance conditions, determined using the Monte Carlo method. For the portion of the plans issued in cash, as at
December 31, 2018, fair value has been determined based on the market price of Orange shares on the closing date.
In 2017, the performance criteria based on adjusted EBITDA and organic cash flow were attained, and a charge of 14 million
euros (including social security contributions) was recorded for the period concerned (based on the dates of the Board of
Directors’ Meetings that approved the plans), with corresponding entries in equity of 11 million euros and in social debt of 3
million euros.
In 2018, not all criteria were met, a charge of 57 million euros (including social security contributions) was recorded, with
corresponding entries in equity of 42 million euros and social debt of 15 million euros.
The social security contributions for the French entities will be due upon delivery of the shares in 2020.
Long Term Incentive Plan (LTIP) 2018 - 2020
The Board of Directors’ Meeting on July 25, 2018 approved the implementation of a free share award plan (Long Term Incentive
Plan or LTIP) reserved for the Executive Committee, Corporate Officers, executives and leaders involving 1.7 million free shares
units. This plan was granted to approximately 1,200 employees. In countries where regulatory, tax or social conditions do not
allow the free awarding of shares, beneficiaries of the plan will receive a cash amount based on the exchange-traded price of
Orange stock on March 31, 2021.
Vesting will occur at December 31, 2020 and the awarding of shares on March 31, 2021, the shares being subject to:
a continued attendance from January 1, 2018 until December 31, 2020;
performance conditions, internal and external respectively, namely the organic cash flow (50%) as defined in the plan,
assessed annually in comparison with the budget, and the total shareholder return (TSR) (50%). TSR performance is
assessed by comparing, between January 1, 2018 and December 31, 2020, the evolution of Orange's TSR based on its total
shareholder return performance over the three fiscal years, and the evolution of its TSR based on the average values of the
"Stoxx Europe 600 Telecommunications" index or any other similar index that may replace it during the lifetime of the Plan.

Consolidated financial statements 2018 63
Valuation assumptions:
Long Term Incentive Plan
Measurement date July 25, 2018
Vesting date December 31, 2020
Price of underlying instrument at measurement date 13.98 euros
Price of underlying instrument at closing date 14.16 euros
Expected dividends (% of the share price) 5.0%
Risk free yield -0.33%
Fair value per share of benefit granted to employees 11.23 euros
o/w fair value of internal performance condition 11.94 euros
o/w fair value of external performance condition 10.51 euros
For the portion of the plan issued in the form of shares, fair value has been determined based on the market price of Orange
shares on the date of allocation and the expected dividends discounted until December 31, 2019. For the portion of the LTIP
plan issued in the form of shares, fair value also takes into account the likelihood of achievement of the market performance
conditions, determined using the Monte Carlo method. For the portion of the plan issued in cash, as at December 31, 2018, fair
value has been determined based on the market price of Orange shares on the closing date.
Accounting effect
In 2018, not all the criteria were met; and a charge of 3 million euros (including social security contributions) was recorded for
the period concerned (based on the dates of the Board of Directors’ Meetings that approved the plans), with corresponding
entries in equity of 2 million euros and in social debt of 1 million euros.
The social security contributions for the French entities will be due upon delivery of the shares in 2021.
Other plans
All stock option plans granted by the various Group entities reached maturity in 2017. No options had been exercised in 2017 or
2016.
Accounting policies
Employee share-based compensation: the fair value of stock options and bonus shares is determined by reference to the
exercise price, the life of the option, the current price of the underlying shares at the grant date, the expected share price
volatility, expected dividends, and the risk-free interest rate over the option’s life. Vesting conditions other than market
conditions are not part of the fair value assessment, but are part of the grant assumptions (employee turnover, probability of
achieving performance criteria).
The determined amount is recognized in labor expenses on a straight-line basis over the vesting period, with as counterparty:
employee benefit liabilities for cash-settled plans, re-measured against profit or loss at each year-end; and
equity for equity-settled plans.
6.4 Executive compensation
The following table shows the compensation booked by Orange SA and its controlled companies to persons who were members
of Orange SA’s Board of Directors or Executive Committee at any time during the year or at the end of the year.
(in millions of euros) December 31, 2018 December 31, 2017 December 31, 2016
Short-term benefits excluding employer social security contributions
(1) (14.7) (12.9) (10.7)
Short-term benefits: employer's social security contributions (4.6) (4.1) (3.4)
Post-employment benefits (2)
(0.4) (1.2) (1.2)
Share-based compensation (3)
(1.2) (0.4) (0.0)
(1) Includes all compensation : gross salaries including the variable component, bonuses, attendance fees and benefits in kind, incentive scheme and profit -sharing, cash settled Long Term Incentive Plan (LTIP).
(2) Service cost.
(3) Includes employee shareholding plans and shares settled Long Term Incentive Plan (LTIP).
The total amount of retirement benefits (contractual retirement bonuses and defined-benefit supplementary pension plan)
provided as at December 31, 2018, in respect of persons who were members of the Board of Directors or Executive Committee
at the end of the year was 5.7 million euros (19.6 million euros in 2017 and 19.7 million euros in 2016).

Consolidated financial statements 2018 64
Executive Committee members’ contracts include a clause providing for a contractual termination settlement not exceeding 15
months of their total gross annual compensation (including the contractual termination benefit). Stéphane Richard, Chairman
and Chief Executive Officer, has no employment contract, and the employment contracts of Deputy CEOs were suspended on
the date of their appointment as corporate officers. These employment contracts may be reinstated at the end of their terms of
office, with recovery of rights.
Orange has not acquired any other goods or services from persons who are or were at any time during the year or at the end of
the year, members of the Board of Directors or Executive Committee of Orange SA (or any parties related thereto).
NOTE 7 Impairment losses and goodwill
7.1 Impairment losses
(in millions of euros) 2018 2017 2016
Jordan (56) - -
Luxembourg - (19) -
Democratic Republic of the Congo - (1) (95)
Poland - - (494)
Cameroon - - (90)
Egypt - - (80)
Romania - - (55)
Total of impairment of goodwill (56) (20) (814)
The impairment tests on Cash Generating Units (CGUs) may result in impairment losses on goodwill and on the fixed assets (see Note 8.2).
Besides the effects of implementing IFRS 15 (see Note 2.3), recorded in reserves at January 1, 2016 in the amount of
(139) million euros and the impairment losses recorded in profit and loss are the following:
At December 31, 2018
In Jordan, the 56 million euro impairment of goodwill mostly reflects the effects of an uncertain political and economic climate
and heavy competitive pressure on the fixed and mobile data markets. The net carrying value of assets tested was brought
down to the value in use of long-term assets and working capital at 100% at December 31, 2018 (0.7 billion euros).
In Niger, the telecommunications market continued to fall in terms of value in a still-difficult business context. Because of its
economic and financial position, the Company remained prudent and recognized an impairment of property assets in the
amount of (43) million euros which should cover Orange's exposure as closely as we can estimate that now.
At December 31, 2017
In Niger, the impairment of fixed assets in the amount of 52 million euros reflected an uncertain political and economic climate
and the effects resulting from strong tax and regulatory pressure. The net carrying value of assets tested was brought down to
the value in use of long-term assets and working capital at 100% at December 31, 2017 (0.1 billion euros).
In Luxembourg, the goodwill impairment in the amount of 19 million euros primarily reflected strong competitive pressure. The
net carrying value of assets tested was brought down to the value in use of long-term assets and working capital at 100% at
December 31, 2017 (0.1 billion euros).
In the Democratic Republic of the Congo, the impairment in the amount of 120 million euros (of which 1 million euros for
goodwill and 119 million euros for fixed assets (see Note 8.2)), reflected an ongoing uncertain political and economic climate, a
proven decrease in purchasing power with its effects on the consumption of telecommunications products and services and a
continuous regulatory pressure. The net carrying value of assets tested was brought down to the value in use of long-term
assets and working capital at 100% at December 31, 2017 (0.1 billion euros).
At December 31, 2016
In the Democratic Republic of the Congo, the impairment in the amount of 109 million euros (of which 95 million euros for
goodwill and 14 million euros for fixed assets (see Note 8.2)), reflected an uncertain political and economic climate, a decrease
in purchasing power and its effects on the consumption of telecommunications products and services and added regulatory
pressure (relating in particular to the implementation of customer identification). The net carrying value of assets tested was
brought down to the value in use of long-term assets and working capital at 100% at December 31, 2016 (0.2 billion euros).
In Poland, the goodwill impairment of 494 million euros primarily reflected a decrease in competitiveness on the ADSL market, a
downward adjustment of the revenues estimates for the mobile market and an increase in the post-tax discount rate due to a

Consolidated financial statements 2018 65
decline in the country’s sovereign rating by the rating agencies. The net carrying value of assets tested was brought down to the
value in use of long-term assets and working capital at 100% at December 31, 2016 (3.8 billion euros).
In Cameroon, the goodwill impairment in the amount of 90 million euros reflected the fall in voice revenues associated with the
growth in messaging and voice over IP services of Over-The-Top (OTT) providers and with an increasingly competitive mobile
market. The net carrying value of assets tested was brought down to the value in use of long-term assets and working capital at
100% at December 31, 2016 (0.3 billion euros).
In Egypt, the impairment in the amount of 232 million euros (of which 80 million euros for goodwill and 152 million euros after
conversion for fixed assets (see Note 8.2)), reflected the impact of the financing terms of the 4G license granted in 2016, the
strong devaluation of the Egyptian Pound and an increasingly uncertain political and economic climate. The net carrying value
of assets tested was brought down to the value in use of long-term assets and working capital at 100% at December 31, 2016
(0.8 billion euros).
In Romania, following the application of IFRS 15 as of January 1, 2016 (see Note 2.3.2), the Group remeasured the net carrying
amount of the CGU and recognized a goodwill impairment of (55) million euros.
7.2 Goodwill
December 31, 2018 December 31,
2017 December 31,
2016
(in millions of euros) Gross value
Accumulated impairment
losses Net book
value Net book
value Net book
value
France 14,377 (13) 14,364 14,364 14,364
Spain 6,954 (114) 6,840 6,818 6,818
Europe 6,569 (3,989) 2,580 2,589 2,576
Poland 2,799 (2,688) 111 116 110
Belgium 1,011 (713) 298 298 293
Romania 1,806 (570) 1,236 1,236 1,236
Slovakia 806 - 806 806 806
Moldova 79 - 79 83 63
Luxembourg 68 (18) 50 50 68
Africa & Middle-East 2,551 (1,009) 1,542 1,629 1,709
Egypt 542 (542) - - -
Burkina Faso 428 - 428 448 439
Côte d'Ivoire 417 (42) 375 375 375
Jordan 274 (111) 163 210 239
Morocco 251 - 251 246 258
Sierra Leone 152 - 152 181 220
Democratic Republic of the Congo 195 (195) - - -
Cameroon 134 (90) 44 44 44
Other 158 (29) 129 125 134
Enterprise 2,480 (650) 1,830 1,493 1,497
International Carriers & Shared Services 18 - 18 18 15
Goodwill 32,949 (5,775) 27,174 26,911 26,979

Consolidated financial statements 2018 66
(in millions of euros) Note 2018 2017 2016
Gross Value in the opening balance 32,687 32,689 32,606
Acquisitions 3 353 38 904
Disposals (12) - (6)
Translation adjustment (39) (40) (815)
Reclassifications and other items 3 (40) - (0)
Reclassification to assets held for sale - - -
Gross Value in the closing balance 32,949 32,687 32,689
Accumulated impairment losses in the opening balance (5,776) (5,710) (5,535)
Impairment 7.1 (56) (20) (814)
Disposals 12 - -
Translation adjustment 45 (46) 778
Reclassifications and other items - - (139)
Reclassification to assets held for sale - - -
Accumulated impairment losses in the closing balance (5,775) (5,776) (5,710)
Net book value of goodwill 27,174 26,911 26,979
7.3 Key assumptions used to determine recoverable amounts
The key operational assumptions, described in the accounting policies, reflect past experience and expected trends: unforeseen
changes have in the past affected, and could continue to significantly affect, these expectations. In this respect, the review of
expectations could affect the margin of recoverable amounts over the carrying value tested (see Note 7.4) and results in
impairment losses on goodwill and fixed assets.
Discount rates and growth rates to perpetuity used to determine the values in use were revised as follows in 2018:
the discount rates, which may incorporate a specific premium reflecting increased risk in executing certain business plans
or in country risks, were raised, primarily in the Middle East and Africa, though they were reduced in certain other
regions. The continued reduction in the market risk premium contributed to this decline;
growth rates to perpetuity were maintained, on the whole, as in the assessment carried out at the end of 2018, the
economic situation is not expected to lead to any change in the long-term outlook of the industry of services offered by
the Group.
As at December 31, 2018, the specific random factors were as follows:
in Europe:
- changes in the political situations of various countries in the European Union following the Brexit vote in the United
Kingdom have been a factor in market volatility and economic activity, likely to have an effect on the future of
European businesses: interest rates in particular, and consequently discount rates, could be affected by market
reactions and by European Central Bank policy. Customer demand for telecommunication products and services
may also find itself affected by state and European policies for the recovery of fiscal balances;
- the tradeoffs to be made by regulatory and competition authorities between reducing prices to consumers and
stimulating business investment, or in terms of market concentration;
- the Group’s ability to adjust costs and capital expenditures to potential changes in revenues.
In the Middle East and Maghreb (Jordan, Egypt, Iraq, Tunisia) and some of the African countries (Mali, Niger, Democratic
Republic of the Congo, Central African Republic, Sierra Leone, Burkina Faso and Liberia):
- changes in political situation and security with their resulting negative economic impacts on the overall business
climate;
- the contribution of the telecommunications industries to the financing of national governments.
The parameters used for the determination of recoverable amount of the main consolidated operations are set forth below:

Consolidated financial statements 2018 67
December 31, 2018 France Spain Poland Belgium Romania Egypt Enterprise
Basis of recoverable amount Value in use
Source used Internal plan
Methodology Discounted cash flow
Perpetuity growth rate 0.8 % 1.5 % 1.0 % 0.5 % 2.3 % 4.0 % 0.3 %
Post-tax discount rate 6.0 %(1)
7.0 % 8.0 % 6.8 % 8.3 % 13.8 % 7.5 %
Pre-tax discount rate 7.8 % 8.8 % 9.5 % 8.6 % 9.3 % 16.1 % 10.2 %
December 31, 2017
Basis of recoverable amount Value in use
Source used Internal plan
Methodology Discounted cash flow
Perpetuity growth rate 0.8 % 1.5 % 1.0 % 0.5 % 2.3 % 4.0% 0.3 %
Post-tax discount rate 5.5 %(2)
8.6 % 8.3 % 6.8 % 8.8 % 17.0% - 13.50%
7.5 %
Pre-tax discount rate 7.4 % 10.8 % 9.7 % 9.0 % 9.9 % 19.5% -
16.0% 10.7 %
December 31, 2016
Basis of recoverable amount Value in use
Source used Internal plan
Methodology Discounted cash flow
Perpetuity growth rate 0.8 % 1.5 % 1.0 % 0.5 % 2.3 % 4.0% 0.3 %
Post-tax discount rate 6.3 % 7.8 % 9.3 % 6.8 % 9.3 % 16.5% -
13.0% 7.8 %
Pre-tax discount rate 9.1 % 9.7 % 10.3 % 9.6 % 10.5 % 18.3% -
14.8% 12.1 %
(1) The after-tax discount rate for France includes a corporate tax reduction of 25.82% by 2020.
(2) The after-tax discount rate for France includes a corporate tax reduction of 28.92% by 2020 but it does not include the corporate tax reduction of 25.82% by 2022 voted in the 2018 Finance law at the end of December 2017.
The Group’s listed subsidiaries are Orange Polska (Warsaw Stock Exchange), Orange Belgium (Brussels Stock Exchange),
Jordan Telecom (Amman Stock Exchange), Sonatel (Regional Stock Exchange (BRVM)) and Business & Decision (Euronext).
The aggregated share of these subsidiaries, which publish their own regulated information, is less than or equal to 20% of the
consolidated revenues, operating income and net income.
7.4 Sensitivity of recoverable amounts
Because of the correlation between operating cash flow and investment capacity, sensitivity of net cash flow is used. Cash flow
for the terminal year forming a significant part of the recoverable amount, of which a change of plus or minus 10% is presented
in the sensitivity analysis.
France
10.411.4
2016 20182017
7.07.9
4.1
5.5 5.1
9.110.0
100% margin of the
recoverable amount
over the carrying
value tested
15.7 27.1 24.6
(in billions of euros)
Effect at 100% on the recoverable amount of:
a variation of 10% in cash flows of terminal year
1% decrease in the perpetuity growth rate
1% increase in post-tax discount rate

Consolidated financial statements 2018 68
Spain Poland
Belgium Romania
Egypt Enterprise
Cash flow is cash provided by operating activities (excluding interest expense and including tax at a standard rate), net of
acquisitions of property, plant and equipment and intangible assets.
2017
0.4
2016
0.6
2018
0.40.5
0.3
0.60.5
0.7 0.7
0.0 1.0 1.6
1.3
2018
1.9
2017
2.1
2016
2.2
1.2 1.2
1.6
2.0
2.5
100% margin of the
recoverable amount
over the carrying
value tested
3.7 3.7 3.3
0.2
2016 2017
0.3
2018
0.20.3
0.20.3
0.20.3
0.4
0.0 0.1 0.3
0.30.3
2016
0.3
2017 2018
0.20.3
0.20.3
0.20.3
100% margin of the
recoverable amount
over the carrying
value tested
0.7 0.7 0.7
20172016
0.3
2018
0.40.5
0.6
0.8
1.0
0.6
0.8
1.0
3.5 5.5 5.4
0.10.1
2018
0.1
2016 2017
0.10.1 0.10.1 0.1 0.1
100% margin of the
recoverable amount
over the carrying
value tested
0.0 0.1 0.3
Consolidated financial statements 2018 69
The level of sensitivity presented allows readers of the financial statements to estimate the impact in their own assessment.
Variations higher than the levels presented have been observed in the past on cash flow, perpetuity growth rates and discount
rates.
The other entities not listed above, with the exception of the Orange brand presented in Note 8.2, each account for a less than
3% share of the aggregated recoverable amount of the consolidated entities.
Accounting policies
Goodwill recognized as an asset in the statement of financial position comprises the excess calculated:
either on the basis of the equity interest acquired (and for business combinations after January 1, 2010, no subsequent
changes for any additional purchases of non-controlling interests); or
on a 100% basis, leading to the recognition of goodwill relating to the non-controlling.
Goodwill is not amortized. It is tested for impairment at least annually and more frequently when there is an indication that it
may be impaired. Thus, the evolution of general economic and financial trends, the different levels of resilience of the
telecommunication operators with respect to the decline of local economic environments, the changes in the market
capitalization values of telecommunication companies, as well as actual economic performance compared to market
expectations represent external indicators that are analyzed by the Group, together with internal performance indicators, in
order to assess whether an impairment test should be performed more than once a year.
These tests are performed at the level of each Cash Generating Unit (CGU) (or group of CGUs). These generally correspond
to operating segments or to each country in Africa and the Middle East. This is reviewed if the Group changes the level at
which it monitors return on investment for goodwill testing purposes.
To determine whether an impairment loss should be recognized, the carrying value of the assets and liabilities of the CGUs or
groups of CGUs is compared to recoverable amount, for which Orange uses mostly the value in use.
Value in use is the present value of the future expected cash flows. Cash flow projections are based on economic and
regulatory assumptions, license renewal assumptions and forecast trading and investment activity drawn up by the Group’s
management, as follows:
cash flow projections are based on three to five-year business plans and include a tax cash flow calculated as EBIT
(operating income) multiplied by the statutory tax rate (excluding deferred tax and unrecognized tax loss carry forward
impacts at the date of valuation); In the case of recent acquisitions, longer term business plans may be used;
post-tax cash flow projections beyond that timeframe may be extrapolated by applying a declining or flat growth rate for the
next year, and then by a growth rate to perpetuity reflecting the expected long-term growth in the market;
post-tax cash flows are subject to a post-tax discount rate, using rates which incorporate a relevant premium reflecting a
risk assessment for the implementation of certain business plans or country risks. The value in use derived from these
calculations is identical to the one that would derive from discounting pre-tax cash flows at pre-tax discount rates.
The key operating assumptions used to determine the value in use are common across Group’s business segments. These
assumptions include:
key revenue assumptions, which reflect market level, penetration rate of the offerings and market share, positioning of the
competition’s offerings and their potential impact on market price levels and their transposition to the Group’s offerings
bases, regulatory authority decisions on pricing of services to customers and on access and pricing of inter-operator
services, technology migration of networks (e.g. extinction of copper local loops), decisions of competition authorities in
terms of concentration or regulation of adjacent sectors such as cable;
key cost assumptions, on the level of marketing expenses required to renew product lines and keep up with competition,
the ability to adjust costs to potential changes in revenues or the effects of natural attrition and committed employee
departure plans;
key assumptions on the level of capital expenditure, which may be affected by the roll-out of new technologies, by decisions
of regulatory authorities relating to licenses and spectrum allocation, deployment of fiber networks, mobile network
coverage, sharing of network elements or obligations to open up networks to competitors.
Tested net carrying values include goodwill, land, and assets with finite useful life (property, plant and equipment, intangible
assets and net working capital requirements including intragroup balances). The Orange brand, an asset with an indefinite
useful life, is subject to a specific test, see Note 8.2.
If an entity partially owned by the Group includes goodwill attributable to non-controlling interests, the impairment loss is
allocated between the shareholders of Orange SA and the non-controlling interests on the same basis as that on which profit or
loss is allocated (i.e. ownership interest).
Impairment loss for goodwill is recorded definitively in operating income.

Consolidated financial statements 2018 70
NOTE 8 Fixed assets
8.1 Depreciation and amortization
(in millions of euros)
The increase in depreciation and amortization by 201 million euros in 2018 and by 118 million euros in 2017 is mainly due to the
effect of the increase in investments on very high-speed broadband networks (4G and optical fiber) in France, Spain and
Poland.
Depreciation and amortization of intangible assets
(in millions of euros)
Software
Telecommunications licenses
Customer bases
Brands
Other intangible assets
Depreciation and amortization of property, plan and equipment
(in millions of euros)
Networks and terminals
IT equipment
Land and buildings
Other property, plant and equipment
(4,533)
(2,195)(2,256)
(4,708)
(2,138)
(4,791)
2018 2017 2016
(6,728)(7,047) (6,846)
2018 2017 2016
(142)
(1,447)
(8)(127)
(532)
(1,340)
(169)
(126)(13)
(490)
(189)(40)
(126)
(522)(1,318)
(274)(132)
(290)
(4,095)
2018 2017 2016
(121) (306)
(300)
(3,981)
(98) (323)
(307)
(3,805)
Depreciation and amortization of property, plant and equipment
Depreciation and amortization of intangible assets
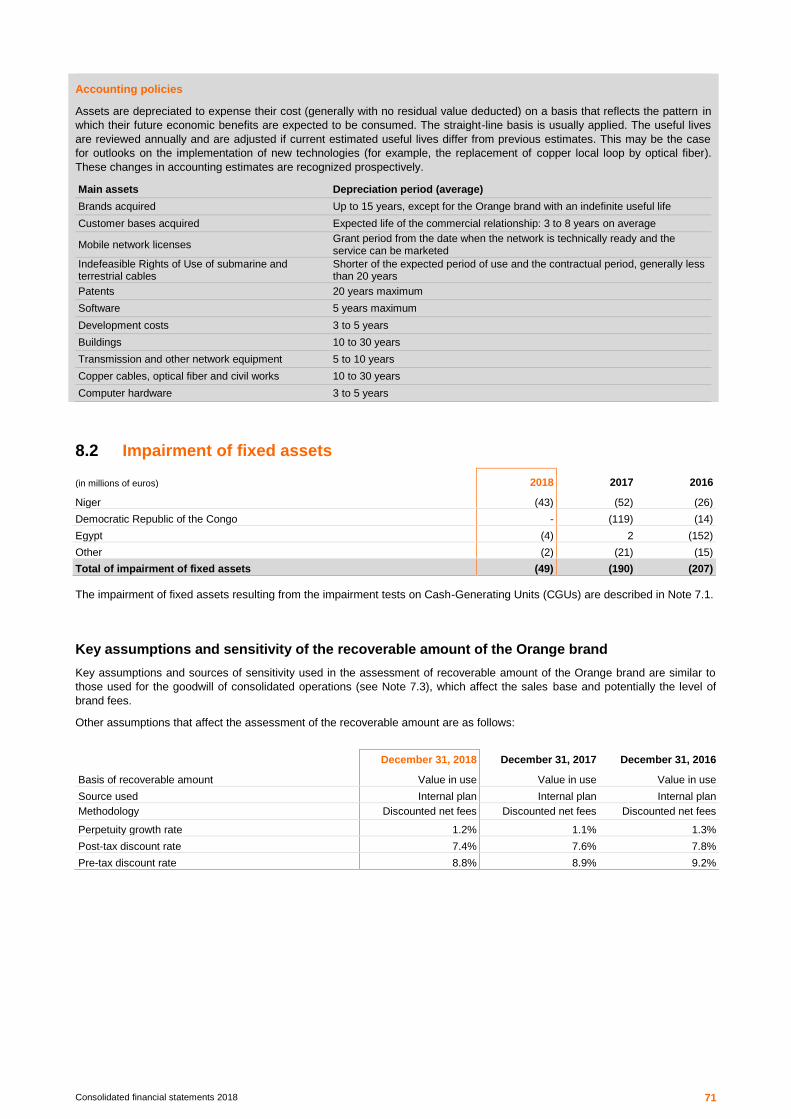
Consolidated financial statements 2018 71
Accounting policies
Assets are depreciated to expense their cost (generally with no residual value deducted) on a basis that reflects the pattern in
which their future economic benefits are expected to be consumed. The straight-line basis is usually applied. The useful lives
are reviewed annually and are adjusted if current estimated useful lives differ from previous estimates. This may be the case
for outlooks on the implementation of new technologies (for example, the replacement of copper local loop by optical fiber).
These changes in accounting estimates are recognized prospectively.
Main assets Depreciation period (average)
Brands acquired Up to 15 years, except for the Orange brand with an indefinite useful life
Customer bases acquired Expected life of the commercial relationship: 3 to 8 years on average
Mobile network licenses Grant period from the date when the network is technically ready and the service can be marketed
Indefeasible Rights of Use of submarine and terrestrial cables
Shorter of the expected period of use and the contractual period, generally less than 20 years
Patents 20 years maximum
Software 5 years maximum
Development costs 3 to 5 years
Buildings 10 to 30 years
Transmission and other network equipment 5 to 10 years
Copper cables, optical fiber and civil works 10 to 30 years
Computer hardware 3 to 5 years
8.2 Impairment of fixed assets
(in millions of euros) 2018 2017 2016
Niger (43) (52) (26)
Democratic Republic of the Congo - (119) (14)
Egypt (4) 2 (152)
Other (2) (21) (15)
Total of impairment of fixed assets (49) (190) (207)
The impairment of fixed assets resulting from the impairment tests on Cash-Generating Units (CGUs) are described in Note 7.1.
Key assumptions and sensitivity of the recoverable amount of the Orange brand
Key assumptions and sources of sensitivity used in the assessment of recoverable amount of the Orange brand are similar to
those used for the goodwill of consolidated operations (see Note 7.3), which affect the sales base and potentially the level of
brand fees.
Other assumptions that affect the assessment of the recoverable amount are as follows:
December 31, 2018 December 31, 2017 December 31, 2016
Basis of recoverable amount Value in use Value in use Value in use
Source used Internal plan Internal plan Internal plan
Methodology Discounted net fees Discounted net fees Discounted net fees
Perpetuity growth rate 1.2% 1.1% 1.3%
Post-tax discount rate 7.4% 7.6% 7.8%
Pre-tax discount rate 8.8% 8.9% 9.2%

Consolidated financial statements 2018 72
Accounting policies
Given the nature of its assets and businesses, most of the Group’s individual assets do not generate cash flow independent of
the cash flows generated by Cash-Generating Units. The recoverable amount is therefore determined on the level of CGU (or
CGU group) to which belong the assets, according to a method similar to the one for goodwill.
The Orange brand has an indefinite useful life and is not amortized but is tested for impairment at least annually. Its
recoverable amount is assessed based on the expected contractual royalties (and included in the business plan) discounted in
perpetuity, less the costs attributable to the brand’s owner.
8.3 Other intangible assets
December 31, 2018 December 31,
2017 December 31,
2016
(in millions of euros) Gross value
Accumulated depreciation
and amortization
Accumulated impairment
Net book value
Net book value
Net book value
Telecommunications licenses 10,783 (4,702) (164) 5,917 6,233 6,440
Software 12,283 (8,204) (33) 4,046 3,946 3,781
Orange brand 3,133 - - 3,133 3,133 3,133
Other brands 1,100 (102) (909) 89 88 102
Customer bases 5,004 (4,543) (12) 449 555 703
Other intangible assets 1,933 (1,303) (191) 439 384 443
Total 34,236 (18,854) (1,309) 14,073 14,339 14,602
(in millions of euros) 2018 2017 2016
Net book value of other intangible assets - in the opening balance 14,339 14,602 14,327
Acquisitions of other intangible assets 1,895 1,893 3,007
o/w telecommunications licenses (1)
200 318 1,521
Impact of changes in the scope of consolidation 69 (13) 144
Disposals (0) (7) (3)
Depreciation and amortization (2,256) (2,138) (2,195)
Impairment losses (2)
(10) (55) (183)
Translation adjustment 7 (74) (363)
Reclassifications and other items 29 131 (132)
Reclassifications to assets held for sale - - -
Net book value of other intangible assets - in the closing balance 14,073 14,339 14,602
(1) Relates in 2018 to the acquisition of the 5G license for 142 million euros in Spain. In 2017, related to the acquisition of licenses for 152 million euros in Mali. In 2016, related to the acquisitions of licenses for 719 million euros in Poland, for 377 million euros in Egypt, for 146 million euros in Côte d'Ivoire and for 142 million euros in Jordan.
(2) Includes impairment detailed in Note 7.1.
2016
0.8
2017 2018
0.4
0.6
0.4
0.70.7
0.4
0.60.7
100% margin of the
recoverable amount
over the carrying
value tested
2.1 2.2 2.6
(in billions of euros)
Effect at 100% on the recoverable amount of:
a variation of 10% in cash flows of terminal year
1% decrease in the perpetuity growth rate
1% increase in post-tax discount rate

Consolidated financial statements 2018 73
Information on telecommunications licenses at December 31, 2018
Orange’s principal commitments under licenses awarded are disclosed in Note 14.
(in millions of euros) Gross value Net book value Residual useful life (1)
LTE (4 licenses) (2)
2,182 1,816 12.8 to 17.9
UMTS (2 licenses) 914 260 2.7 and 11.4
GSM 266 36 2.5
France 3,362 2,112
5G 142 141 19.8
LTE (3 licenses) 541 405 11.0 to 12.4
UMTS 639 9 1.3
GSM (2 licenses) 336 200 4.7 and 12.0
Spain 1,658 755
LTE (3 licenses) 789 630 9.0 and 12.1
UMTS (2 licenses) 387 95 2.0 and 4.0
GSM (2 licenses) 139 59 8.6 and 10.5
Poland 1,315 784
LTE 387 352 13.0
UMTS 134 52 13.0
GSM (2 licenses) 376 43 13.0
Egypt 897 447
LTE 41 33 16.2
UMTS 28 13 13.5
GSM 739 200 12.3
Morocco 808 246
LTE 184 126 10.3
UMTS 61 27 10.3
GSM 292 149 10.3
Romania 537 302
LTE 88 67 11.4
UMTS (3 licenses) 141 97 6.2 to 14.3
GSM 189 115 10.0
Jordan 418 279
LTE (2 licenses) 140 106 8.4 and 14.9
UMTS 149 21 2.3
GSM 76 31 2.2
Belgium 365 158
Other 1,423 834
10,783 5,917
(1) In number of years, at December 31, 2018.
(2) Comprises the 700 MHz license of which the spectrum is technologically neutral.
Internal costs capitalized as intangible assets
(in millions of euros) 2018 2017 2016
Labor expenses 382 373 392
Total 382 373 392
Accounting policies
Intangible assets consist mainly of acquired brands, acquired customer bases, telecommunications licenses and software, as
well as operating rights granted under certain concession agreement and rights of use of transmission cables.
Intangible assets are initially recognized at acquisition or production cost. The payments indexed to revenue, especially for
some telecommunications licenses, are expensed in the relevant periods.
Indefeasible Rights of Use (IRUs) acquired by the Group correspond to the rights to use transmission cable or capacity (mainly
submarine cables) granted for a fixed period. IRUs are recognized as assets when the Group has the right to use identified
optical fiber or dedicated wavelength bandwidth, and the right duration represents a major part of the economic life of the
underlying asset.

Consolidated financial statements 2018 74
The operating rights granted under certain concession arrangements give right to charge users of the public service (see Note
4.1).
8.4 Property, plant and equipment
December 31, 2018 December 31,
2017 December 31,
2016
(in millions of euros) Gross value
Accumulated depreciation
and amortization
Accumulated impairment
Net book value
Net book value
Net book value
Networks and terminals 86,448 (62,162) (324) 23,962 22,880 21,984
Land and buildings 7,841 (5,116) (246) 2,479 2,535 2,661
IT equipment 3,943 (3,112) (14) 817 802 784
Other property, plant and equipment
1,667 (1,221) (11) 435 448 483
Total 99,899 (71,611) (595) 27,693 26,665 25,912
(in millions of euros) 2018 2017 2016
Net book value of property, plant and equipment - in the opening balance 26,665 25,912 25,123
Acquisitions of property, plant and equipment 5,883 5,677 5,576
o/w finance leases 136 43 91
Changes in the scope of consolidation (1)
63 0 242
Disposals and retirements (44) (35) (25)
Depreciation and amortization (4,791) (4,708) (4,533)
Impairment losses (2)
(39) (135) (48)
Translation adjustment (27) (44) (607)
Reclassifications and other items (17) (2) 184
Reclassifications to assets held for sale - - -
Net book value of property, plant and equipment - in the closing balance 27,693 26,665 25,912
(1) Mainly related in 2018 to the acquisition of Basefarm entities. In 2016, mainly related to the acquisitions of entities in Africa (Liberia, Congo (DRC), Burkina Faso and Sierra Leone).
(2) Includes impairment detailed in Note 7.1.
Accounting policies
Property, plant and equipment mainly comprise network facilities and equipment.
The gross value of property, plants and equipment is made up of their acquisition or production cost, which includes study and
construction fees as well as enhancement costs that increase the capacity of equipment and facilities. Maintenance and repair
costs are expensed as incurred, except where they serve to increase the asset’s productivity or prolong its useful life.
The cost of property, plant and equipment also includes the estimated cost of dismantling, removing and restoring the site
occupied due to the obligation incurred by the Group.
The roll-out of assets by stage, especially for network assets, in the Group’s assessment, does not generally require a
substantial period of preparation for the Group. As a consequence, the Group does not generally capitalize the interest
expense incurred during the construction and acquisition phase for its property, plant and equipment and intangible assets.
The assets acquired in form of finance lease do not affect the cash flow on acquisition. However, the subsequent rental
payments during the leasing period represent interest payments (cash flow on operating activities) and capital repayments
(cash flow on financing activities).
The majority of the assets held under finance lease are network buildings. The land and buildings hosting radio sites may
belong to the Group, or be held through a finance lease, or be available under an operating lease or be simply made available.
The lease agreements of office buildings and points of sale are generally qualified as operating leases and the future lease
payments are disclosed as unrecognized contractual commitments in Note 14.
Simultaneously the equipment, very often generic, of which the risks and rewards of ownership have been transferred from the
Group to third parties via a lease, is considered as sold.
In France, the regulatory framework governing the optical fiber network roll-out (Fiber To The Home – FTTH) organizes the
access by commercial operators to the last mile of networks rolled-out by another operator on a co-funding basis (ab initio or a
posteriori) or through a line access. The sharing of rights and obligations between the various operators co-financing the
terminal section of networks is classified as a joint operation in accordance with IFRS 11 "Partnerships": Orange only

Consolidated financial statements 2018 75
recognizes as an asset its share of the network assets self-built or purchased to other co-financing operators.
The Group has entered into network sharing arrangements with other mobile operators on a reciprocal basis, which may cover
passive infrastructure, active equipment or even spectrum. Accordingly, in Poland, the arrangements with Deutsche Telekom
have been qualified as a joint operation: the infrastructure and equipment of the access networks recognized as fixed assets
are equivalent to the proportionate share of the Group in the assets installed by the Group or Deutsche Telekom, each in their
geographical zone.
In some African countries, the Group has also entered into sharing arrangements with TowerCos (companies operating
telecom towers). These TowerCos enable mobile operators, including Orange, to share sites, passive infrastructure and related
services (by managing the mobile operators’ sites and/or acquiring or building sites). The unit of account and the specific
features of each arrangement lead the Group to generally qualify these transactions as a service. The long-term commitments
resulting from these arrangements are presented as unrecognized contractual commitments (see Note 14).
Property, plant and equipment held under finance leases
December 31,
2018 December 31,
2017 December 31,
2016
(in millions of euros)
Net book value
Net book value
Net book value
Land and buildings 423 454 484
Networks and terminals 115 53 47
IT Equipment and other 36 21 21
Total 574 528 552
Internal costs capitalized as property, plant and equipment
(in millions of euros) 2018 2017 2016
Labor expenses 460 466 417
Total 460 466 417
8.5 Fixed assets payables
(in millions of euros) 2018 2017 2016
Fixed assets payables - in the opening balance 3,656 3,707 3,732
Business related variations (230) 55 (20)
Changes in the scope of consolidation 0 0 17
Translation adjustment 8 (32) (90)
Reclassifications and other items 13 (74) 68
Reclassification to assets held for sale - - -
Fixed assets payables - in the closing balance 3,447 3,656 3,707
o/w non-current fixed assets payables 612 610 907
o/w current fixed assets payables 2,835 3,046 2,800
Accounting policies
These payables are generated from trading activities. The payment terms can be over several years in the case of
infrastructure roll-out and license acquisition. The payables due in more than 12 months are presented in non-current items.
For payables without specified interest rates, they are measured at nominal value if the interest component is immaterial. For
interest bearing payables, the measurement is at amortized cost.
Trade payables also include those that the supplier may have sold with or without notifying financial institutions in a direct or
reverse factoring arrangement (see Note 5.6).
Firm purchase commitments are disclosed as unrecognized contractual commitments (see Note 14), net of any prepayment,
which are recognized as prepayment on fixed assets.
8.6 Dismantling provision
The asset dismantling obligations mainly relate to restoration of mobile telephony antenna sites, dismantling of telephone poles,
treatment of electrical and electronic equipment waste and dismantling of telephone booths.

Consolidated financial statements 2018 76
(in millions of euros) 2018 2017 2016
Dismantling provision - in the opening balance 789 737 733
Provision reversal with impact on income statement - (0) -
Discounting with impact on income statement 13 11 10
Utilizations without impact on income statement (15) (20) (23)
Changes in provision with impact on assets (1)
(19) 57 19
Changes in the scope of consolidation - - -
Translation adjustment (3) 4 (2)
Reclassifications and other items 11 - -
Reclassification to assets held for sale - - -
Dismantling provision - in the closing balance 776 789 737
o/w non-current provision 765 774 716
o/w current provision 11 15 21
(1) Including in 2018 extinctions of obligations for (66) million euros.
Accounting policies
The Group is required to dismantle technical equipment and restore technical sites.
When the obligation arises, a dismantlement asset is recognized in compensation for the dismantling provision.
The provision is based on dismantling costs (on a per-unit basis for telephone poles, terminals and telephone booths, and on a
per-site basis for mobile antennas) incurred by the Group to meet its environmental commitments over the asset dismantling
and site restoration planning. The provision is assessed on the basis of the identified costs for the current fiscal year,
extrapolated for future years using the best estimate of the commitment settlement. This estimate is revised annually and
adjusted where appropriate against the asset to which it relates. The provision is present-discounted at a rate set by
geographical area and equal to the average rate of risk-free investments in 15-year State bonds.
In case of extinguishment of the obligation, the provision is reversed in compensation for the net carrying value of the
dismantlement asset and of the net carrying value of the underlying assets if the dismantling asset is less than the reversal of
the provision.
NOTE 9 Taxes
9.1 Operating taxes and levies
9.1.1 Operating taxes and levies recognized in the income statement
(in millions of euros) 2018 2017 2016
Territorial Economic Contribution, IFER and similar taxes (820) (817) (729)
Spectrum fees (309) (304) (294)
Levies on telecommunication services (286) (296) (319)
Other operating taxes and levies (425) (429) (466)
Total (1,840) (1,846) (1,808)
Although comprising a directly identifiable counterpart, the periodic spectrum fees are presented within the operating taxes and
levies as they are set by and paid to the States and Local Authorities.
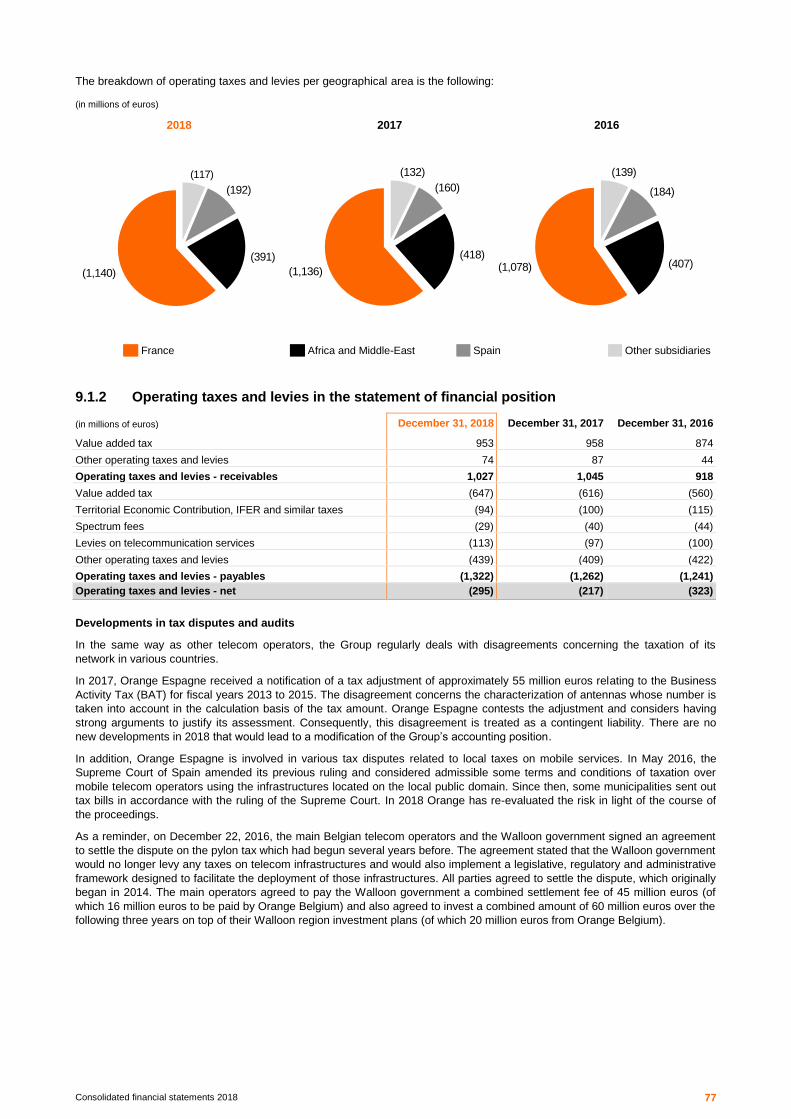
Consolidated financial statements 2018 77
The breakdown of operating taxes and levies per geographical area is the following:
(in millions of euros)
2018 2017 2016
France
Africa and Middle-East
Spain
Other subsidiaries
9.1.2 Operating taxes and levies in the statement of financial position
(in millions of euros) December 31, 2018 December 31, 2017 December 31, 2016
Value added tax 953 958 874
Other operating taxes and levies 74 87 44
Operating taxes and levies - receivables 1,027 1,045 918
Value added tax (647) (616) (560)
Territorial Economic Contribution, IFER and similar taxes (94) (100) (115)
Spectrum fees (29) (40) (44)
Levies on telecommunication services (113) (97) (100)
Other operating taxes and levies (439) (409) (422)
Operating taxes and levies - payables (1,322) (1,262) (1,241)
Operating taxes and levies - net (295) (217) (323)
Developments in tax disputes and audits
In the same way as other telecom operators, the Group regularly deals with disagreements concerning the taxation of its
network in various countries.
In 2017, Orange Espagne received a notification of a tax adjustment of approximately 55 million euros relating to the Business
Activity Tax (BAT) for fiscal years 2013 to 2015. The disagreement concerns the characterization of antennas whose number is
taken into account in the calculation basis of the tax amount. Orange Espagne contests the adjustment and considers having
strong arguments to justify its assessment. Consequently, this disagreement is treated as a contingent liability. There are no
new developments in 2018 that would lead to a modification of the Group’s accounting position.
In addition, Orange Espagne is involved in various tax disputes related to local taxes on mobile services. In May 2016, the
Supreme Court of Spain amended its previous ruling and considered admissible some terms and conditions of taxation over
mobile telecom operators using the infrastructures located on the local public domain. Since then, some municipalities sent out
tax bills in accordance with the ruling of the Supreme Court. In 2018 Orange has re-evaluated the risk in light of the course of
the proceedings.
As a reminder, on December 22, 2016, the main Belgian telecom operators and the Walloon government signed an agreement
to settle the dispute on the pylon tax which had begun several years before. The agreement stated that the Walloon government
would no longer levy any taxes on telecom infrastructures and would also implement a legislative, regulatory and administrative
framework designed to facilitate the deployment of those infrastructures. All parties agreed to settle the dispute, which originally
began in 2014. The main operators agreed to pay the Walloon government a combined settlement fee of 45 million euros (of
which 16 million euros to be paid by Orange Belgium) and also agreed to invest a combined amount of 60 million euros over the
following three years on top of their Walloon region investment plans (of which 20 million euros from Orange Belgium).
(192)
(117)
(1,140)
(391)
(132)
(160)
(418)
(1,136)
(139)
(184)
(407)(1,078)

Consolidated financial statements 2018 78
Changes in operating taxes and levies
(in millions of euros) 2018 2017 2016
Net operating taxes and levies (payables) in the opening balance (217) (323) (425)
Operating taxes and levies recognized in profit or loss (1,840) (1,846) (1,808)
Operating taxes and levies paid 1,777 1,934 1,897
Changes in the scope of consolidation (13) - (68)
Translation adjustment (3) 21 78
Reclassifications and other items 1 (3) 3
Reclassifications to assets held for sale - - -
Net operating taxes and levies (payables) in the closing balance (295) (217) (323)
Accounting policies
VAT (Value Added Tax) receivables and payables correspond to the VAT collected or deductible from the various states.
Collections and repayments to states have no impact on the income statement.
In the normal course of business, the Group regularly deals with differences of interpretation of tax law with the tax authorities,
which can lead to tax reassessments or tax disputes.
Operating taxes and levies are measured by the Group at the amount expected to be paid or recovered from the tax authorities
of each country, based on its interpretation with regard to the application of tax legislation. The Group calculates the tax assets,
liabilities and accruals recognized in the statement of financial position based on the technical merits of the positions it defends
versus that of the tax authorities.
9.2 Income tax
9.2.1 Income tax
(in millions of euros) 2018 2017 2016
Orange SA tax group (702) (564) (434)
• Current tax (595) (391) (318)
• Deferred tax (107) (173) (116)
Spanish tax group (164) (55) (304)
• Current tax (65) (46) (23)
• Deferred tax (99) (9) (281)
Africa & Middle-East (255) (256) (173)
• Current tax (258) (255) (241)
• Deferred tax 3 (1) 68
United Kingdom (66) (57) (20)
• Current tax (66) (57) (44)
• Deferred tax (0) 0 24
Other subsidiaries (122) (120) (20)
• Current tax (128) (110) (118)
• Deferred tax 6 (10) 98
Total Income tax (1,309) (1,052) (951)
• Current tax (1,112) (859) (744)
• Deferred tax (197) (193) (207)

Consolidated financial statements 2018 79
The breakdown of current tax by geographical area or by tax group is the following:
(in millions of euros)
2018 2017 2016
Orange SA tax group
Africa & Middle-East
United Kingdom
Spanish tax group
Other subsidiaries
Orange SA tax group
The corporate tax rate applicable for the 2018 fiscal year is 34.43%.
In 2017, the corporate tax rate was 44.43%, following the establishment of an exceptional surtax applicable only to this fiscal
year, which led to an additional tax expense of (78) million euros.
In 2016, the corporate tax rate was 34.43%.
Current tax expense
In 2018, the current tax expense reflects the requirement to pay income tax calculated on the basis of 100% of taxable income
due to the depletion of tax loss carry forwards on this year.
In 2017 and 2016, the current tax expense reflected the requirement to pay a minimum level of income tax calculated on the
basis of 50% of taxable income due to the restriction on the utilization of available tax loss carry forwards.
Deferred tax expense
Deferred taxes are recorded at the tax rate expected at the time of their reversal.
Until 2017, the deferred tax expense mainly arose from the use of tax loss carry forwards.
The 2018 French Finance Act, that passed in late December 2017, reinforced the gradual reduction in the corporate tax rate
with an expected tax rate of 25.82% as of 2022 for the tax group.
In 2017, this gradual rate reduction resulted in a (75) million euros decrease in net deferred tax assets recorded on the balance
sheet for entities of the Orange SA tax group (of which (44) million euros recorded in income statement and (31) million euros in
other comprehensive income).
Developments in tax disputes and audits in France
Tax audits
Orange SA underwent tax audits of fiscal years 2010 to 2014, for which the outcome had no material impact on the Group’s
financial statements.
Orange SA is currently undergoing tax audits of fiscal years 2015 to 2016.
Dispute over the 3% tax on dividends
The Constitutional Court, in its decision of October 6, 2017, recognized as unconstitutional the 3% tax on dividends, confirming
the CJEU decision rendered on May 17, 2017. In December 2017, all claims made by Orange SA had been reimbursed by the
French tax authority, resulting in a tax income of 304 million euros for the year (of which 270 million euros in principal and
34 million euros in late interests).
Dispute over share of expenses and charges
Orange had filed appeals as to the assigned share of expenses and charges of 5% on dividends received from at least
95%-owned EU companies for fiscal years 2008 to 2014.
In 2016, the favorable rulings from the Court of Montreuil relating to fiscal years 2008 to 2014 led to the recognition of a tax
income of 190 million euros.
All of the proceedings related to this dispute have been closed.
(128)
(595)
(65)
(66)
(258)
(46)
(110)
(57)
(255)
(391)
(118)
(23)
(44)
(241)
(318)
Consolidated financial statements 2018 80
Disputes in progress concerning fiscal years 2000-2006
In the context of the absorption of Cogecom by Orange SA and pursuant to an adverse ruling by the Court of Montreuil on
July 4, 2013 which triggered the payment of the amounts claimed by the Tax authority, Orange SA had to pay in 2013 the
remaining balance on principal and late payment interest claimed for a total amount of 2.1 billion euros.
Over the last few years, the main developments in terms of legal proceedings brought before the Versailles Administrative Court
of Appeal were the following:
concerning fiscal year 2000-2004:
in a ruling given on July 24, 2018, the Administrative Court of Appeal of Versailles upheld the request from Orange. As
the Tax administration did not appeal in cassation, this litigation is now closed. The accounting consequences have been
taken into account in the consolidated financial statements.
concerning fiscal years 2005-2006:
in a ruling of February 18, 2016, the Administrative Court of Appeal of Versailles upheld the judgment of July 4, 2013,
despite the contrary conclusions of the appointed Rapporteur. The Group then appealed to the Conseil d’État on
April 18, 2016 to rule on the substance of the case,
in a ruling dated December 5, 2016, the Conseil d’État annulled the February 18, 2016 ruling by the Administrative Court
of Appeal of Versailles and remanded the dispute to the same Court, on the grounds argued by the Group, i.e., the
principle of intangibility of the opening balance sheet of the earliest fiscal year still subject to audit.
in a ruling dated July 24, 2018, the Administrative Court of Appeal of Versailles made an adverse decision against
Orange, despite the contrary conclusions of the appointed Rapporteur. The Group appealed in cassation to the Conseil
d’État which will render the final decision.
A favorable outcome to this dispute would result in a current tax income of 2.1 billion euros, before late interests. While awaiting
the new decision from the Conseil d'Etat, this amount is treated as a contingent asset.
Spanish tax group
Current tax expense
The corporate tax rate applicable is 25% and the current income tax expense mainly represents the obligation to pay a minimum level of tax calculated on the basis of 75% of taxable income due to the 25% restriction on the utilization of tax loss carry forwards.
Deferred tax expense
In 2018, a deferred tax charge of 86 million euros has been recorded in order to reflect the negative effect on the recoverable
value of deferred tax assets of a strong competitive pressure.
A deferred tax charge of 269 million euros was recognized in 2016 to reflect the impact on the recoverable amount of deferred
tax assets recognized through the continuation of the limitation of tax loss carry forwards utilization at 25% for financial years
beginning in 2016, unlike the previously approved measures which had set the restriction of tax loss carry forwards utilization at
70% of taxable income from 2017.
Africa & Middle-East
The main contributors to the income tax charge are Mali, Senegal, Guinea and Côte d'Ivoire.
In Mali, the corporate tax rate is 30% and the current income tax charge stands at 56 million euros. In Senegal, the corporate
tax rate is 30% and the current income tax charge stands at 54 million euros. In Guinea, the corporate tax rate is 35% and the
current income tax charge stands at 38 million euros. In Côte d'Ivoire, the corporate tax rate is 30% and the current income tax
charge stands at 36 million euros.
United Kingdom
Current tax expense
The current income tax charge primarily reflects the taxation of activities related to Orange’s brand activities. The corporate tax
rate sets to 19% since April 1, 2017, and to 20% before.
Deferred tax expense
The 2016 Finance Act adopted on September 15, 2016, included a reduction in the tax rate to 17% starting April 1, 2020. In
2016, deferred tax income of 31 million euros was therefore recognized in order to adjust the deferred tax liability on the Orange
brand.

Consolidated financial statements 2018 81
Group tax proof
(in millions of euros) Note 2018 2017 2016
Profit before tax of continuing operations 3,467 3,063 1,820
Statutory tax rate in France 34.43% 34.43% 34.43%
Theoretical income tax (1,194) (1,055) (627)
Reconciling items :
Exceptional surtax (1)
- (78) -
Impairment of goodwill (2)
7.1 (19) (7) (280)
Impairment of BT shares 11.7 (30) (156) (256)
Share of profits (losses) of associates and joint ventures 1 2 (16)
Adjustment of prior-year taxes 23 37 23
Recognition / (derecognition) of deferred tax assets (151) (27) (104)
Difference in tax rates (3)
189 92 105
Change in applicable tax rates (4)
(84) (50) 43
Other reconciling items (5)
(44) 190 161
Effective income tax on continuing operations (1,309) (1,052) (951)
Effective tax rate 37.75% 34.35% 52.28%
(1) Effect of the exceptional surtax of 30% put in place in France in 2017 which increased the corporate tax rate from 34.43% to 44.43%.
(2) Reconciliation item calculated based on the tax rate applicable to the parent company of the Group. The difference between the tax rate of the parent company and the local tax rate of subsidiaries is presented below in "Difference in tax rates".
(3) The Group is present in jurisdictions in which tax rates are different from the French tax rate. This mainly includes the United Kingdom (tax rate of 19% in 2018 and 2017, 20% in 2016), Spain (tax rate of 25%) and Poland (tax rate of 19%).
(4) Takes into account the remeasurement of the deferred tax due to change of tax rate in tax legislation. It also takes into account the impact of the fact that some deferred tax are booked with a different tax rate than the on-going one.
(5) Notably includes the non-deductible interests in France, respectively an income tax expense of 78, 80 and 97 million euros in 2018, 2017 and 2016. Includes the tax income of 304 million euros resulting from the dispute over the 3% tax on dividends in 2017. Includes the tax income of 190 million euros resulting from the dispute over the 5% share of expenses and charges on dividends in 2016.
9.2.2 Income tax on other comprehensive income
2018 2017 2016
(in millions of euros)
Gross amount
Deferred tax
Gross amount
Deferred tax
Gross amount
Deferred tax
Actuarial gains and losses on post-employment benefits
(1) 45 (6) 16 (23) (80) 20
Assets available for sale - - 23 - (4) -
Assets at fair value (30) - - - - -
Cash flow hedges (67) 18 49 (20) (364) 123
Net investment hedges - - - - 65 (22)
Translation adjustment (7) - (176) 26 (1,066) -
Other comprehensive income of associates and joint ventures - - (9) - 43 -
Total presented in other comprehensive income (59) 12 (97) (17) (1,406) 121
(1) In 2017, the deferred tax includes the remeasurement of the deferred tax in France.

Consolidated financial statements 2018 82
9.2.3 Tax position in the statement of financial position
December 31, 2018 December 31, 2017 December 31, 2016
(in millions of euros) Assets Liabi-lities Net Assets
Liabi-lities Net Assets
Liabi-lities Net
Orange SA tax group
• Current tax - 438 (438) - 288 (288) 21 - 21
• Deferred tax (1)
977 - 977 1,059 - 1,059 1,290 - 1,290
Spanish tax group
• Current tax - 4 (4) 53 - 53 56 - 56
• Deferred tax (2)
50 - 50 149 - 149 157 - 157
Africa & Middle-East
• Current tax 32 182 (150) 25 189 (164) 42 197 (155)
• Deferred tax 84 42 42 99 54 45 102 95 7
United Kingdom
• Current tax - 34 (34) - 22 (22) - 22 (22)
• Deferred tax (3)
- 531 (531) - 531 (531) - 531 (531)
Other subsidiaries
• Current tax 87 97 (10) 54 97 (43) 51 119 (68)
• Deferred tax 255 58 197 279 70 209 298 80 218
Total
• Current tax 119 755 (636) 132 596 (464) 170 338 (168)
• Deferred tax 1,366 631 735 1,586 655 931 1,847 706 1,141
(1) Mainly include deferred tax assets on employee benefits.
(2) The recognized deferred tax assets are partially offset by the deferred tax liabilities on the goodwill which is tax deductible.
(3) Mainly deferred tax liabilities on the Orange brand.
Change in net current tax
(in millions of euros) 2018 2017 2016
Net current tax assets / (liabilities) - in the opening balance (464) (168) (271)
Cash tax payments (1)
928 583 906
Change in income statement (2)
(1,116) (859) (772)
Change in other comprehensive income - - -
Change in retained earnings (3)
0 (11) (38)
Changes in the scope of consolidation 19 (0) -
Translation adjustment (3) 5 6
Reclassification and other items (0) (14) 1
Reclassification to assets held for sale - - -
Net current tax assets / (liabilities) - in the closing balance (636) (464) (168)
(1) Included in 2017 the reimbursement of 304 million euros due to the dispute of the 3% tax on dividends.
(2) Of which (4) million euros in consolidated net income of discontinued operations in 2018 (0 million euros in 2017 and (28) million euros in 2016).
(3) Mainly correspond to the tax effect relating to the remeasurement of the portion of subordinated notes denominated in foreign currency.
Change in net deferred tax
(in millions of euros) 2018 2017 2016
Net deferred tax assets - in the opening balance 931 1,141 1,213
Change in income statement (1)
(197) (210) (213)
Change in other comprehensive income 12 (17) 121
Change in retained earnings (2)
- (8) (38)
Change in the scope of consolidation (10) 0 (18)
Translation adjustment (7) 11 75
Reclassification and other items 6 14 1
Reclassification to assets held for sale - - -
Net deferred tax assets - in the closing balance 735 931 1,141
(1) Of which 0 million euros in consolidated net income of discontinued operations in 2018 ((17) million euros in 2017 and (6) million euros in 2016).
(2) Mainly correspond to the tax effect relating to the remeasurement of the portion of subordinated notes denominated in foreign currency.

Consolidated financial statements 2018 83
Deferred tax assets and liabilities by type
December 31, 2018 December 31, 2017 December 31, 2016
(in millions of euros) Assets Liabilities
Income state-ment Assets Liabilities
Income state-ment Assets Liabilities
Income state-ment
Provisions for employee benefit obligations 833 - (25) 842 - (132) 995 - (69)
Fixed assets 721 1,123 (26) 790 1,139 (38) 821 1,157 95
Tax losses carryforward 3,914 - (105) 4,011 - (456) 4,436 - (231)
Other temporary differences 1,245 1,146 (42) 1,538 1,407 (34) 1,600 1,410 54
Deferred tax 6,713 2,269 (198) 7,181 2,546 (660) 7,852 2,567 (151)
Depreciation of deferred tax assets (3,709) - 1 (3,704) - 450 (4,144) - (62)
Netting (1,638) (1,638) - (1,891) (1,891) - (1,861) (1,861) -
Total 1,366 631 (197) 1,586 655 (210) 1,847 706 (213)
As at December 31, 2018, the tax loss carry forwards mainly relate to Spain and Belgium, all of the tax loss carry forwards in
France were used over 2018.
As at December 31, 2018, the unrecognized deferred tax assets mainly relate to Spain for 2.0 billion euros and Belgium
(Belgian subsidiaries other than Orange Belgium) for 0.7 billion euros, and mostly include tax losses that can be carried forward
indefinitely. In Spain, tax loss carry forwards for which a deferred tax asset has been recognized are expected to be fully utilized
by 2023, unless affected by changes in tax rules and changes in business projections. The deferred tax assets recognized for
Spain arise to 0.4 billion euros on December 31, 2018.
Most of the other tax loss carry forwards for which no deferred tax assets were recognized will expire beyond 2023.
Accounting policies
Current income tax and deferred tax are measured by the Group at the amount expected to be paid or recovered from the tax
authorities of each country, based on its interpretation with regard to the application of tax legislation. The Group calculates the
tax assets and liabilities recognized in the statement of financial position based on the technical merits of the positions it
defends versus that of the tax authorities.
Deferred taxes are recognized for all temporary differences between the carrying values of assets and liabilities and their tax
basis, as well as for unused tax losses, using the liability method. Deferred tax assets are recognized only when their recovery
is considered probable.
A deferred tax liability is recognized for all taxable temporary differences associated with investments in subsidiaries, interests
in joint ventures and associates, except to the extent that both of the following conditions are satisfied:
the Group is able to control the timing of the reversal of the temporary difference (e.g. the payment of dividends); and
it is probable that the temporary difference will not reverse in the foreseeable future.
Accordingly, for fully consolidated companies, a deferred tax liability is only recognized in the amount of the taxes payable on
planned dividend distributions by the Group.
Deferred tax assets and liabilities are not discounted.
At each period end, the Group reviews the recoverable amount of the deferred tax assets carried by certain tax entities with
significant tax loss carry forwards. The recoverability of the deferred tax assets is assessed in the light of the business plans
used for impairment testing. This plan may be adjusted for any tax specificities.
Deferred tax assets arising on these tax losses are not recognized under certain circumstances specific to each company/tax
consolidation group concerned, and particularly where:
entities cannot assess the probability of the tax loss carry forwards being set off against future taxable profits, due to the
horizon for forecasts based on business plans used for impairment testing and uncertainties as to the economic
environment;
entities have not yet begun to use the tax loss carry forwards;
entities do not expect to use the losses within the timeframe allowed by tax regulations;
it is estimated that tax losses are uncertain to be used due to risks of differing interpretations with regard to the application
of tax legislation.

Consolidated financial statements 2018 84
NOTE 10 Interests in associates and joint ventures
The interests in associates and joint ventures included the activities of Orange as an operator in various African and Middle
Eastern countries, including in particular Tunisia and Mauritius.
(in millions of euros) 2018 2017 2016
Interests in associates - in the opening balance 77 130 162
Dividends (3) - -
Share of profits (losses) 3 6 20
Impairment - - (66)
Change in components of other comprehensive income - (9) (0)
Changes in the scope of consolidation (1) (3) (2)
Translation adjustment 5 (2) 3
Reclassifications and other items 23 (45) 13
Reclassification as held for sale - - -
Interests in associates - in the closing balance 104 77 130
Changes in other comprehensive income of associates and joint ventures (excluding "assets held-for-sale") are presented
below:
(in millions of euros) 2018 2017 2016
Profit (loss) recognized in other comprehensive income during the period - (9) -
Reclassification to net income for the period - - -
Other comprehensive income of associates and joint venture - continuing operations - (9) -
The unrecognized contractual commitments entered into by the Group relating to the interests in associates and joint ventures
are described in Note 14.
The operations performed between the Group and the interests in associates and joint ventures are reflected as follow in
Orange's consolidated financial statements:
(in millions of euros) December 31, 2018 December 31, 2017 December 31, 2016
Assets
Non-current financial assets (0)
2 -
Trade receivables 31
30 55
Current financial assets (1) (2) (1)
Other current assets 0
0 -
Liabilities
Current liabilities 7 4 7
Trade payables 9
8 15
Other current liabilities 0 - 1
Deferred income - - 45
Income statement
Revenue 13
15 19
Other operating income 8 18 35
External purchases and other operating expenses (66)
(57) (67)
Finance cost, net 0 0 1
Accounting policies
The carrying amount accounted for under the equity method corresponds to the initial acquisition cost increased to recognize
the share of the profit or loss in the period. If an associate incurs losses and the carrying amount of the investment is reduced
to zero, the Group ceases to recognize the additional share of losses since it has no commitment beyond its investment.
An impairment test is performed at least annually and when there is objective evidence of impairment, for instance a decrease
in the quoted price when the investee is listed, significant financial difficulty of the entity, observable data indicating that there is
a measurable decrease in the estimated future cash flows, or information about significant changes having an adverse effect
on the entity.

Consolidated financial statements 2018 85
An impairment loss is recorded when the recoverable amount is lower than the carrying amount, the recoverable amount being the
higher of the value in use and the fair value less costs to sell. The unit of account is the whole investment. Any impairment is
recognized as “Share of profits (losses) of associates and joint ventures”. Impairment losses shall be reversed once the recoverable
amount exceeds the carrying amount.
NOTE 11 Financial assets, liabilities and financial results (excluding Orange Bank)
11.1 Financial assets and liabilities of telecom activities
In order to improve the readiness of financial statements and to be able to distinguish the performance of telecom activities from
the performance of Orange Bank, the notes related to financial assets and liabilities as well as financial income or expenses are
split to respect these two business areas.
Note 11 presents the financial assets, liabilities and related gains and losses specific to telecom activities and Note 15 concerns
the activities of Orange Bank with regard to its assets and liabilities, with net financial income being not material.
The following table reconciles (i) the assets and liabilities for each of these two areas (intra-group transactions between telecom
activities and Orange Bank are not eliminated) with (ii) the consolidated statement of financial position at December 31, 2018.
(in millions of euros)
Orange consolidated
financial statements
O/w telecom activities Note
O/w Orange Bank Note
O/w eliminations telecom activities
/ bank
Non-current financial assets related to Orange Bank activities 1,617 - 1,617 15.1.1 -
Non-current financial assets 2,282 2,309 11.7 - (27) (1)
Non-current derivatives assets 263 263 11.8 - 15.1.3 -
Current financial assets related to Orange Bank activities 3,075 - 3,075 15.1.1 -
Current financial assets 2,748 2,748 11.7 - -
Current derivatives assets 139 122 11.8 17 15.1.3 -
Cash and cash equivalents 5,634 5,081 553 -
Non-current financial liabilities related to Orange Bank activities 0 - 27 15.1.2 (27)
(1)
Non-current financial liabilities 26,749 26,749 11.3 - -
Non-current derivatives liabilities 775 712 11.8 63 15.1.3 -
Current financial liabilities related to Orange Bank liabilities 4,835 - 4,835 15.1.2 -
Current financial liabilities 7,270 7,270 11.3 - -
Current derivatives liabilities 133 133 11.8 - 15.1.3 -
(1) Loan granted by Orange SA to Orange Bank.
11.2 Profits and losses related to financial assets and liabilities
The cost of net financial debt consists of profits and losses related to the components of net financial debt (described in
Note 11.3) during the period.
Foreign exchange gains and losses related to the components of net financial debt correspond mainly to the revaluation in
euros of bonds denominated in foreign currencies (Note 11.5) as well as to the symmetrical revaluation of related hedges.
The net foreign exchange financial loss mostly reflects the effect of revaluation of the economic hedges of foreign exchange risk
on notional amounts of subordinated notes denominated in pounds sterling and recognized in equity at their historical value (see
Note 13.4).
Other financial expenses mainly reflect the impact of the Group’s investment in BT shares for (51) million euros corresponding
to the impairment loss, net of the foreign exchange hedge and of the 2018 income related to BT dividends, compared to
(372) million euros in 2017 and (533) million euros in 2016 (see Note 11.7).
Finally, other comprehensive income includes the revaluation of financial assets at fair value through other comprehensive
income (Note 11.7) and cash flow hedges (Note 11.8.2).

Consolidated financial statements 2018 86
Other gains and losses related to financial assets and liabilities are recognized in the operating income (foreign exchange gains
and losses on trade receivables, trade payables and the associated hedging derivatives) for 3 million euros in 2018, versus
(13) million euros in 2017 and (35) million euros in 2016.
Finance costs, net
Other compre-hensive income
(in millions of euros) Cost of gross financial debt
Gains (losses) on
assets contributing
to net financial debt
Cost of net financial debt
Foreign exchange
gains (losses)
Other net financial
expenses (1)
Finance
costs, net Reserves
2018
Financial assets - 9 9 (17) 16 (22)
Financial liabilities (1,395) - (1,395) (353) - -
Derivatives 54 - 54 366 - (67)
Discounting expense - - - - (42) -
Total (1,341) 9 (1,332) (4) (26) (1,362) (89)
2017
Financial assets - 11 11 (54) (346) 20
Financial liabilities (1,357) - (1,357) 1,217 - -
Derivatives 83 - 83 (1,226) - 49
Discounting expense - - - - (43) -
Total (1,274) 11 (1,263) (63) (389) (1,715) 69
2016
Financial assets - 23 23 (334) (509) (4)
Financial liabilities (1,468) - (1,468) 130 - 61(2)
Derivatives 61 - 61 55 - (361)
Discounting expense - - - - (55) -
Total (1,407) 23 (1,384) (149) (564) (2,097) (304)
(1) Include effects related to the investment in BT for (51) million euros in 2018, (372) million euros in 2017 and (533) mil lion euros in 2016.
(2) Bonds designated as net investment hedge.
11.3 Net financial debt
Net financial debt is one of the indicators of financial position used by the Group. This aggregate, not defined by IFRS, may not
be comparable to similarly entitled indicators used by other companies. It is provided as additional information only and should
not be considered as a substitute to an analysis of all the Group’s assets and liabilities.
Net financial debt as defined and used by Orange does not include Orange Bank activities, for which this concept is not
relevant.
It consists of (a) financial liabilities excluding operating payables (translated into euros at the year-end closing rate) including
derivative instruments (assets and liabilities), less (b) cash collateral paid, cash, cash equivalents and financial assets at fair
value.
Furthermore, financial instruments designated as cash flow hedges included in net financial debt are set up to hedge (among
other) items that are not included in it, such as future cash flows. Effects of these hedges are carried in other comprehensive
income. As a consequence, the portion of these components related to unmatured hedging instruments is added to gross
financial debt to offset this temporary difference.

Consolidated financial statements 2018 87
(in millions of euros) Note December 31,
2018 December 31,
2017 December 31,
2016
TDIRA 11.4 822 1,234 1,212
Bonds 11.5 27,070 25,703 27,370
Bank loans and from development organizations and multilateral lending institutions
11.6 3,664 2,961 2,710
Finance lease liabilities 584 571 622
Cash collateral received 12.5 82 21 541
NEU Commercial Papers (1)
1,116 1,358 542
Bank overdrafts 318 193 278
Other financial liabilities 363 434 250
Current and non-current financial liabilities (excluding derivatives) included in the calculation of net financial debt
34,019 32,475 33,525
Current and non-current Derivatives (liabilities) 11.1 845 963 561
Current and non-current Derivatives (assets) 11.1 (385) (234) (960)
Other comprehensive income components related to unmatured hedging instruments
(721) (686) (763)
Gross financial debt after derivatives (a) 33,758 32,518 32,363
Cash collateral paid (2)
11.7 (553) (695) (77)
Investments at fair value (3)
11.7 (2,683) (2,647) (1,576)
Cash equivalents 11.1 (2,523) (3,166) (3,942)
Cash 11.1 (2,558) (2,167)(4)
(2,324)
Assets included in the calculation of net financial debt (b) (8,317) (8,675) (7,919)
Net financial debt (a) + (b) 25,441 23,843 24,444
(1) Negotiable European Commercial Papers (formerly called "commercial papers").
(2) Only cash collateral paid, included in non-current financial assets of the consolidated statement of financial position, are deducted from gross financial debt.
(3) Only investments at fair value, included in current financial assets of the consolidated statement of financial position, are deducted from gross financial debt (Note 11.7)
(4) As at December 31, 2017, the amount does not take into account the effect of the escrowed amount of approximatively 346 million euros in February 2018 related to the Digicel litigation (see Note 16.1).
Debt maturity schedules are presented in Note 12.3.
Changes in financial assets or financial liabilities whose cash flows are disclosed in financing activities in the cash-flow
statement are the following (see Note 1.6):
December 31, 2017
Cash flows
Other changes with no impact on cash flows from financing activities
December 31, 2018 (in millions of euros)
Changes in the scope of
consolidation
Foreign exchange
movement Other
TDIRA 1,234 (443) - - 31 822
Bonds 25,703 1,136 5 321 (95) (1)
27,070
Bank loans and from development organizations and multilateral lending institutions 2,961 613 14 20 56 3,664
Finance lease liabilities 571 (123) 2 (1) 135 584
Cash collateral received 21 61 - - - 82
NEU Commercial Papers 1,358 (243) - (0) 1 1,116
Bank overdrafts 193 82 38 5 - 318
Other financial liabilities 434 (153) 135 8 (61) 363
Current and non-current financial liabilities (excluding derivatives) included in the calculation of net financial debt 32,475 930 194 353 67 34,019
Net derivatives 729 8 - (339) 62 460
Cash collateral paid (695) 140 - - - (555)
Cash flows from financing activities 1,078
(1) Mainly accrued interests.

Consolidated financial statements 2018 88
December 31, 2016
Cash flows
Other changes with no impact on cash flow from financing activities
December 31, 2017 (in millions of euros)
Changes in the scope of
consolidation
Foreign exchange
movement Other
TDIRA 1,212 - - - 22 1,234
Bonds 27,370 (460) - (1,104) (103) (1)
25,703
Bank loans and from development organizations and multilateral lending institutions 2,710 294 - (54) 11 2,961
Finance lease liabilities 622 (96) - - 45 571
Cash collateral received 541 (520) - - - 21
NEU Commercial Papers 542 818 - (2) - 1,358
Bank overdrafts 278 (66) - (19) - 193
Other financial liabilities 250 196 - (21) 9 434
Current and non-current financial liabilities (excluding derivatives) included in the calculation of net financial debt 33,525 166 - (1,200) (16) 32,475
Net derivatives (399) (66) - 1,183 11 729
Cash collateral paid (77) (618) - - - (695)
Cash flows from financing activities (518)
(1) Mainly accrued interests.
Net financial debt by currency
The net financial debt by currency is presented in the table below, after foreign exchange effects of hedging derivatives
(excluding instruments set up to hedge operational items).
(equivalent value in millions of euros at year-end closing rate) EUR USD GBP PLN EGP JOD MAD Other Total
Gross financial debt after derivatives 21,204 7,550 2,748 55 269 87 508 1,337 33,758
Financial assets included in the calculation of net financial debt (7,149) (77) (3) (118) (6) (44) (105) (815) (8,317)
Net debt by currency before effect of foreign exchange derivatives
(1) 14,055 7,473 2,745 (63) 263 43 403 522 25,441
Effect of foreign exchange derivatives 9,892 (7,656) (3,645) 1,657 - - - (248) -
Net financial debt by currency after effect of foreign exchange derivatives 23,947 (183) (900) 1,594 263 43 403 274 25,441
(1) Including the market value of derivatives in local currency.
Analysis of external net financial debt by entity
(in millions of euros) December 31, 2018 December 31, 2017 December 31, 2016
Orange SA 23,896 22,501 23,154
FT Immo H 404 482 536
Médi Telecom 403 390 423
Orange Egypt 188 107 309
Orange Espagne 136 113 169
Other 414 250 (147)
Net financial debt 25,441 23,843 24,444
Accounting policies
Cash and cash equivalents
The Group classifies investments as cash equivalent in the statement of financial position and statement of cash flows when
they comply with the conditions of IAS 7 (see cash management detailed in Notes 12.3 and 12.5):
held in order to face short-term cash commitments; and
short term and highly liquid assets at acquisition date, readily convertible into known amount of cash and not exposed to
any material risk of change in value.

Consolidated financial statements 2018 89
Bonds, bank loans and loans from multilateral lending institutions
Among financial liabilities, only the bond of 25 million euros maturing in 2020 and any commitments to redeem non-controlling
interests are recognized at fair value in profit or loss.
Borrowings are recognized upon origination at the discounted value of the sums to be paid and subsequently measured at
amortized cost using the effective interest rate method. Transaction costs that are directly attributable to the acquisition or
issue of the financial liability are deducted from the liability’s carrying value. The costs are subsequently amortized over the life
of the debt, using the effective interest rate method.
Some financial liabilities at amortized cost, mainly borrowings, are subject to hedging. This relates mostly to borrowings
hedged against the exposure of their future cash flows to foreign exchange risk (cash flow hedge).
11.4 TDIRA
The perpetual bonds redeemable for shares (TDIRAs) with a par value of 14,100 euros are listed on Euronext Paris. Their issue
was described in a securities note approved by the Commission des Opérations de Bourse (French Securities Regulator,
renamed Autorité des Marchés Financiers (French Financial Markets Authority)) on February 24, 2003. Taking into account
redemptions made since their issue, including redemption of 31,417 securities in December 2018 for a nominal amount of
443 million euros, only 57,981 TDIRA remain in circulation for an overall nominal amount of 818 million euros.
The TDIRAs are redeemable in new Orange SA shares, at any time at the holders’ request or, under certain conditions as
described in the appropriate prospectus, at Orange SA’s initiative based on a ratio of 582.5561 shares to one TDIRA (i.e.,
conversion price of 24.204 euros), as the initial ratio of 300 shares to one TDIRA has been adjusted several times to protect
bondholders’ rights, and may be further adjusted under the terms and conditions set out in the information memorandum.
Since January 1, 2010, the interest rate on the TDIRAs has been the three-month Euribor +2.5%.
The TDIRA are subject to split accounting between equity and liabilities. For the securities outstanding on December 31, 2018,
the "equity" component before deferred tax stood at 196 million euros.
The amounts recognized for the TDIRA in the financial statements are as follows:
(in millions of euros) December 31, 2018 December 31, 2017 December 31, 2016
Number of securities 57,981 89,398 89,398
Equity component before deferred taxes 196 303 303
Debt component 822 1,234 1,212
o/w accrued interests not yet due 4 7 7
Paid interest 27 27 30
Accounting policies
Some Group financial instruments include both a liability component and an equity component. This relates to perpetual bonds
redeemable for shares (TDIRA). On initial recognition, the liability component is measured at its market value, corresponding to
the value of the contractually determined future cash flows discounted at the market rate applied at the date of issue to
comparable instruments providing substantially the same conditions, but without the option to convert or redeem in shares.
This liability component is subsequently recognized at amortized cost.
The carrying amount of the equity component is determined at inception by deducting the fair value of the financial liability from
the notional value of the instrument. This does not change throughout the life of the instrument.

Consolidated financial statements 2018 90
11.5 Bonds
Unmatured bonds at December 31, 2018 were all issued by Orange SA, with the exception of one commitment (in two tranches,
one with fixed-rate coupon and the other with variable) denominated in Moroccan dirhams and held by Médi Telecom.
As at December 31, 2018 bonds issued by the Group were redeemable at maturity, and no specific guarantee has been given in
relation to their issuance. Some bonds may be redeemed in advance, at the request of the issuer.
Bonds or new tranches issued during fiscal year 2018 are shown in bold.
Oustanding amount (in millions of euros)
Notional currency
Initial nominal amount (in millions of currency
units) Maturity Interest rate (%) December 31,
2018 December 31,
2017 December 31,
2016
Bonds matured before December 31, 2018 3,131 5,457
EUR 750 January 23, 2019 4.125 750 750 750
JPY 7,500 January 24, 2019 1.41625 60 56 61
USD 750 February 6, 2019 2.75 655 625 712
USD 1,250 July 8, 2019 5.375 1,092 1,042 1,186
EUR 750 October 2, 2019 1.875 750 750 750
USD 1,250 November 3, 2019 1.625 1,092 1,042 1,186
EUR 25 February 10, 2020 4.2 25 25 25
EUR(1)
25 February 10, 2020 10Y CMS + 0.80 25 25 25
EUR 1,000 April 9, 2020 3.875 1,000 1,000 1,000
GBP 450 November 10, 2020 7.25 266 268 278
EUR 1,250 January 14, 2021 3.875 1,250 1,250 1,250
GBP(2)
517 June 27, 2021 0.375 578 583 -
USD 1,000 September 14, 2021 4.125 873 834 949
EUR 255 October 13, 2021 10Y CMS + 0.69 255 255 255
EUR 272 December 21, 2021 10Y TEC + 0.50 272 272 272
EUR 1,000 June 15, 2022 3.000 1,000 1,000 1,000
EUR 500 September 16, 2022 3.375 500 500 500
EUR 500 March 1, 2023 2.5 500 500 500
EUR 750 September 11, 2023 0.75 750 750 -
HKD 700 October 6, 2023 3.23 78 75 86
HKD 410 December 22, 2023 3.55 46 44 50
EUR 650 January 9, 2024 3.125 650 650 650
EUR 750 May 12, 2025 1.000 750 750 750
EUR 800 September 12, 2025 1.000 800 - -
NOK 500 September 17, 2025 3.35 50 51 55
GBP 350 December 5, 2025 5.25 293 296 306
MAD(3)
1,090 December 18, 2025 3.97 100 - -
MAD(3)
720 December 18, 2025 1Y BDT + 1.00(4)
66 - -
EUR 75 November 30, 2026 4.125 75 75 75
EUR 750 February 3, 2027 0.875 750 750 750
EUR 500 September 9, 2027 1.5 500 500 -
EUR 1,000 March 20, 2028 1.375 1,000 - -
EUR 50 April 11, 2028 3.22 50 50 50
NOK 800 July 24, 2028 2.955 80 - -
GBP 500 November 20, 2028 8.125 559 564 584
EUR 150 April 11, 2029 3.3 150 150 150
EUR 1,000 January 16, 2030 1.375 1,000 - -
EUR 1,200 September 12, 2030 1.875 1,200 - -
EUR 105 September 17, 2030 2.6 105 105 105
(1) Bond measured at fair value through profit or loss.
(2) Exchangeable bonds in BT shares (see below).
(3) Bonds issued by Médi Telecom.
(4) Bonds bearing interests at 52 weeks Moroccan treasury bonds rate + 100 basis points (3.45 % until november 2019).

Consolidated financial statements 2018 91
Oustanding amount (in millions of euros)
Notional currency
Initial nominal amount (in millions of currency
units) Maturity Interest rate (%) December 31,
2018 December 31,
2017 December 31,
2016
EUR 100 November 6, 2030 1.628(5)
100 100 100
USD 2,500 March 1, 2031 9.000(6)
2,150 2,052 2,335
EUR 50 December 5, 2031 4.300 (zero coupon) 67 64 61
EUR 50 December 8, 2031 4.350 (zero coupon) 67 65 62
EUR 50 January 5, 2032 4.450 (zero coupon) 65 62 59
EUR 1,500 January 28, 2033 8.125 1,500 1,500 1,500
EUR 55 September 30, 2033 3.75 55 55 55
GBP 500 January 23, 2034 5.625 559 564 584
EUR 50 April 16, 2038 3.5 50 50 50
USD 900 January 13, 2042 5.375 786 750 855
USD 850 February 6, 2044 5.5 742 709 807
GBP 500 November 22, 2050 5.375 559 564 585
Oustanding amount of bonds 26,695 25,253 26,820
Accrued interest 527 550 640
Amortized cost (152) (100) (90)
Total 27,070 25,703 27,370
(5) Bond bearing interests at a fixe rate of 2% until 2017 and then at CMS 10 years x 166% (1.628% until November 2018). The variable rate is floored at 0% and capped at 4% until 2023 and at 5% beyond.
(6) Bond with a step-up clause (clause that triggers a change in interest payments of Orange's credit rating from the rating agencies changes). See Note 12.3.
As a reminder, on June 27, 2017 the Group issued bonds exchangeable into BT shares for a notional amount of 517 million
pounds sterling (585 million euros at the ECB daily reference rate), bearing a coupon of 0.375% and having an underlying
133 million of BT shares based on a reference price of 2.88 pounds sterling per share. The Bonds mature in June 2021 and
have been redeemable on demand by investors since August 7, 2017 in cash, in BT stock or in a combination of the two, at the
choice of Orange. The amount redeemed will equal the par value plus any improvement in BT stock beyond 3.89 pounds
sterling per share (or 135% of the reference price).
11.6 Loans from development organizations and multilateral lending institutions
(in millions of euros) December 31, 2018 December 31, 2017 December 31, 2016
Sonatel 343 289 176
Médi Telecom 335 385 177
Orange Côte d'Ivoire 225 275 118
Orange Egypt 210 183 302
Orange Mali 200 64 19
Orange Cameroon 105 101 112
Other 156 176 143
Bank loans 1,574 1,473 1,047
Orange SA 2,023(1)
1,388 1,530
Orange Espagne 67 100 133
Loans from development organizations and multilateral lending institutions
(2) 2,090 1,488 1,663
Total 3,664 2,961 2,710
(1) Orange SA negotiated in June 2018 two loans with the European Investment bank for a total notional of 650 million euros maturing in 2025.
(2) Primarily the European Investment Bank.

Consolidated financial statements 2018 92
11.7 Financial assets
After application of IFRS 9 on January 1st, 2018, the financial assets break down as follows:
December 31, 2018 January 1,
2018 (1)
(in millions of euros) Non-current Current Total Total
Financial assets at fair value through other comprehensive income that will not be reclassified to profit or loss 254 - 254 208
Investments securities 254 - 254 208
Financial assets at fair value through profit or loss 1,358 2,683 4,041 4,347
Investments at fair value - 2,683 2,683 2,647
o/w negotiable debt securities (2)
- 2,679 2,679 2,498
o/w other - 4 4 149 (3)
Investments securities 805 - 805 1,005
Cash collateral paid (4)
553 - 553 695
Financial assets at amortized cost 697 65 762 405
Receivables related to investments 41(5)
14 55 46
Other 656(6)
51 707 359
Total financial assets 2,309 2,748 5,057 4,960
(1) Figures have been adjusted after IFRS 9 application (see Note 2.3).
(2) NEU Commercial Papers only.
(3) OAT bonds (repurchase agreement with Orange Bank).
(4) See Note 12.5.
(5) Including loan from Orange SA to Orange Bank for 27 million euros.
(6) Including the escrowed amount of 346 million euros related to the Digicel litigation (see Note 16.1).
For the periods 2017 and 2016, for which the IFRS 9 standard was not applied as authorized by the standard, the financial
assets broke down as follows:
(in millions of euros) December 31, 2017 December 31, 2016
Assets available for sale
Equity securities 1,067 1,878
Financial assets at fair value
Investments at fair value 2,647 1,576
o/w negotiable debt securities 2,498 1,576
o/w others 149 (1)
-
Equity securities measured at fair value 146 80
Cash collateral paid 695 77
Other financial assets
Receivables related to investments 46 (2)
47
Other 359 344
Total 4,960 4,002
(1) OAT bonds (repurchase agreement with Orange Bank)
(2) Including loan from Orange SA to Orange Bank for 27 million euros.

Consolidated financial statements 2018 93
Investment securities
Investment securities measured at fair value through other comprehensive income that may not be reclassified to profit or loss
(in millions of euros) 2018
Investment securities measured at fair value through other comprehensive income that may not be reclassified to profit or loss - in the opening balance 208
Acquisitions 75
Changes in fair value (22)
Sales (7)
Investment securities measured at fair value through other comprehensive income that may not be reclassified to profit or loss - in the closing balance 254
At the end of December 2018, investment securities measured at fair value through other comprehensive income that may not be reclassified to profit or loss included numerous shares in companies held by investment funds.
Investment securities measured at fair value through profit or loss
(in millions of euros) 2018
Investment securities measured at fair value through profit or loss - in the opening balance 1,005
Changes in fair value (101)
Sale of BT shares (53)
Other movements (46)
Investment securities measured at fair value through profit or loss - in the closing balance 805
At the end of December 2018, investment securities measured at fair value through profit or loss mainly concerns BT securities.
For the periods 2017 and 2016, for which IFRS 9 was not applied as authorized, the change in investment securities broke
down as follows:
(in millions of euros) 2017 2016
Investment securities - in the opening balance 1,878 144
BT shares received as remuneration for the disposal of EE - 2,462
Sale of one third of BT shares (570) -
Impairment of BT shares maintained excluding effect of FX risk hedge (1)
(325) (753)
Changes in fair value 20 1
Other movements 64 24
Investment securities - in the closing balance 1,067 1,878
(1) As at December 31, 2017, the Group maintained 266 million of BT shares, whose fair value amounts to 814 million euros against 1,139 million euros at December 31, 2016. The fair value of the total of BT shares held amounted to 1,709 million euros at December 31, 2016.
BT shares
On January 29, 2016, following the disposal of EE, Orange received 4% of the equity in BT Group Plc (BT), or about 399 million
shares for the equivalent of 2,462 million euros (converted at the ECB fixing of pound sterling against euro on January 28,
therefore 0.76228).
In 2017, the Orange Group sold a third of its investment or 133 million shares for a net amount of 433 million euros (converted
at the ECB reference rate of June 22, 2017, the settlement/delivery date, of 0.88168). At December 31, 2016, the fair value of
these shares amounted to 570 million euros. The related effect of these shares on profit and loss was (126) million euros,
including 11 million euros from the foreign exchange hedge.
In 2018, the Orange Group sold 18 million shares for a net amount of 53 million euros. As at December 31, 2017, the fair value
of these shares amounted to 55 million euros. The effect in profit or loss in 2018 related to securities sold stood at (2) million
euros. These securities were not subject to exchange-rate hedging.
As at December 31, 2018, Orange maintains 2.49% of the share capital of BT, whose fair value amounts to 659 million euros
(last quoted price on December 31, 2018 or 2.381 pounds per share converted at the ECB daily reference rate of 0.89453), as
compared to 759 million euros at the end of 2017. The change in fair value of the BT securities represents a loss of (93) million
euros, after a foreign exchange hedging effect of 6 million euros.
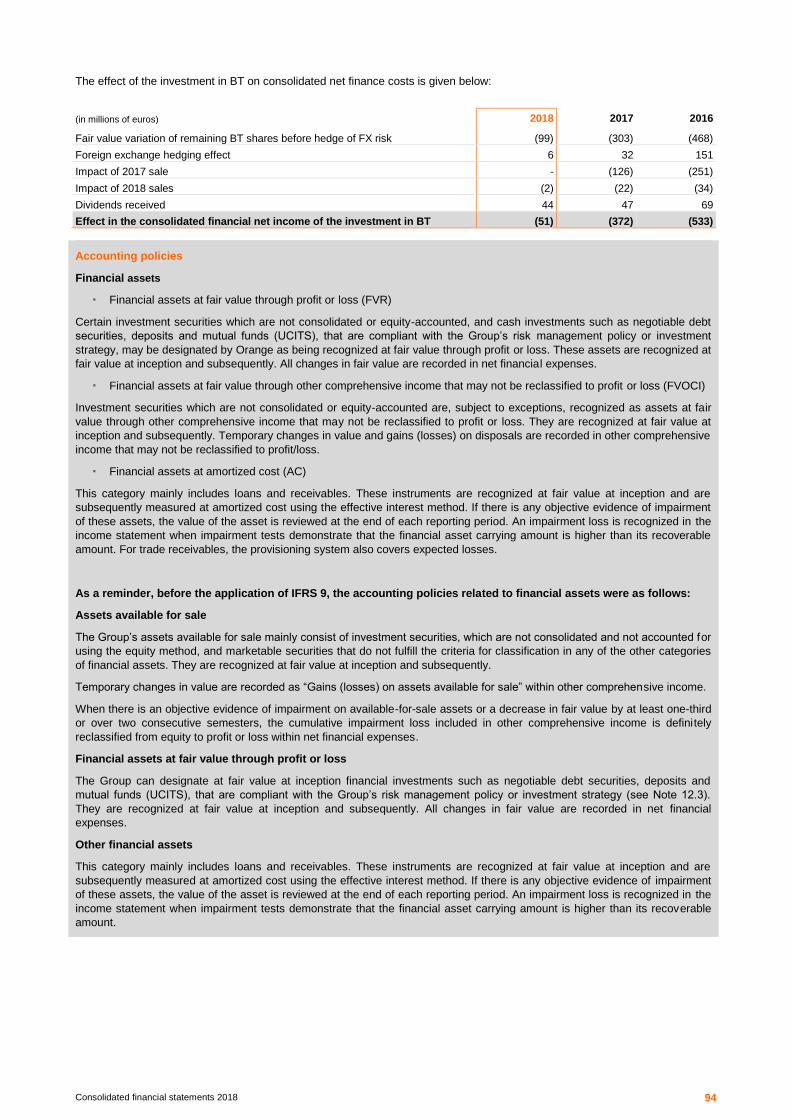
Consolidated financial statements 2018 94
The effect of the investment in BT on consolidated net finance costs is given below:
(in millions of euros) 2018 2017 2016
Fair value variation of remaining BT shares before hedge of FX risk (99) (303) (468)
Foreign exchange hedging effect 6 32 151
Impact of 2017 sale - (126) (251)
Impact of 2018 sales (2) (22) (34)
Dividends received 44 47 69
Effect in the consolidated financial net income of the investment in BT (51) (372) (533)
Accounting policies
Financial assets
Financial assets at fair value through profit or loss (FVR)
Certain investment securities which are not consolidated or equity-accounted, and cash investments such as negotiable debt
securities, deposits and mutual funds (UCITS), that are compliant with the Group’s risk management policy or investment
strategy, may be designated by Orange as being recognized at fair value through profit or loss. These assets are recognized at
fair value at inception and subsequently. All changes in fair value are recorded in net financial expenses.
Financial assets at fair value through other comprehensive income that may not be reclassified to profit or loss (FVOCI)
Investment securities which are not consolidated or equity-accounted are, subject to exceptions, recognized as assets at fair
value through other comprehensive income that may not be reclassified to profit or loss. They are recognized at fair value at
inception and subsequently. Temporary changes in value and gains (losses) on disposals are recorded in other comprehensive
income that may not be reclassified to profit/loss.
Financial assets at amortized cost (AC)
This category mainly includes loans and receivables. These instruments are recognized at fair value at inception and are
subsequently measured at amortized cost using the effective interest method. If there is any objective evidence of impairment
of these assets, the value of the asset is reviewed at the end of each reporting period. An impairment loss is recognized in the
income statement when impairment tests demonstrate that the financial asset carrying amount is higher than its recoverable
amount. For trade receivables, the provisioning system also covers expected losses.
As a reminder, before the application of IFRS 9, the accounting policies related to financial assets were as follows:
Assets available for sale
The Group’s assets available for sale mainly consist of investment securities, which are not consolidated and not accounted for
using the equity method, and marketable securities that do not fulfill the criteria for classification in any of the other categories
of financial assets. They are recognized at fair value at inception and subsequently.
Temporary changes in value are recorded as “Gains (losses) on assets available for sale” within other comprehensive income.
When there is an objective evidence of impairment on available-for-sale assets or a decrease in fair value by at least one-third
or over two consecutive semesters, the cumulative impairment loss included in other comprehensive income is definitely
reclassified from equity to profit or loss within net financial expenses.
Financial assets at fair value through profit or loss
The Group can designate at fair value at inception financial investments such as negotiable debt securities, deposits and
mutual funds (UCITS), that are compliant with the Group’s risk management policy or investment strategy (see Note 12.3).
They are recognized at fair value at inception and subsequently. All changes in fair value are recorded in net financial
expenses.
Other financial assets
This category mainly includes loans and receivables. These instruments are recognized at fair value at inception and are
subsequently measured at amortized cost using the effective interest method. If there is any objective evidence of impairment
of these assets, the value of the asset is reviewed at the end of each reporting period. An impairment loss is recognized in the
income statement when impairment tests demonstrate that the financial asset carrying amount is higher than its recoverable
amount.
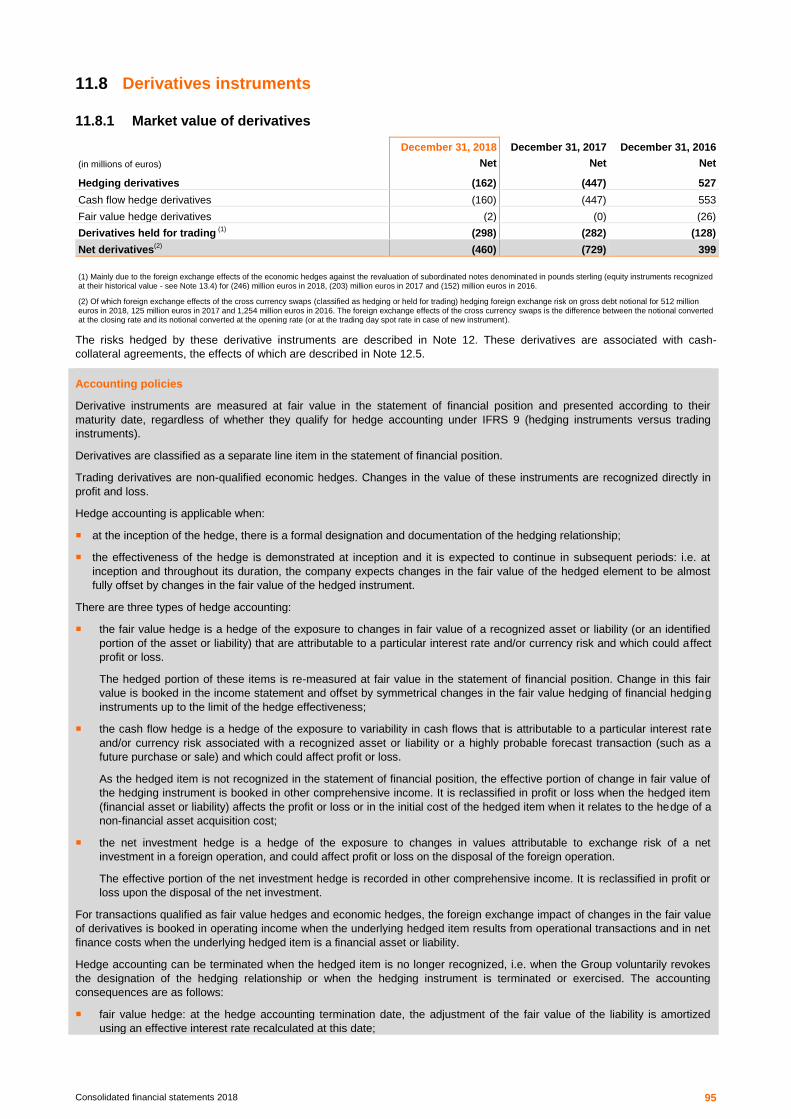
Consolidated financial statements 2018 95
11.8 Derivatives instruments
11.8.1 Market value of derivatives
December 31, 2018 December 31, 2017 December 31, 2016
(in millions of euros) Net Net Net
Hedging derivatives (162) (447) 527
Cash flow hedge derivatives (160) (447) 553
Fair value hedge derivatives (2) (0) (26)
Derivatives held for trading (1)
(298) (282) (128)
Net derivatives(2)
(460) (729) 399
(1) Mainly due to the foreign exchange effects of the economic hedges against the revaluation of subordinated notes denominated in pounds sterling (equity instruments recognized at their historical value - see Note 13.4) for (246) million euros in 2018, (203) million euros in 2017 and (152) million euros in 2016.
(2) Of which foreign exchange effects of the cross currency swaps (classified as hedging or held for trading) hedging foreign exchange risk on gross debt notional for 512 million euros in 2018, 125 million euros in 2017 and 1,254 million euros in 2016. The foreign exchange effects of the cross currency swaps is the difference between the notional converted at the closing rate and its notional converted at the opening rate (or at the trading day spot rate in case of new instrument).
The risks hedged by these derivative instruments are described in Note 12. These derivatives are associated with cash-
collateral agreements, the effects of which are described in Note 12.5.
Accounting policies
Derivative instruments are measured at fair value in the statement of financial position and presented according to their
maturity date, regardless of whether they qualify for hedge accounting under IFRS 9 (hedging instruments versus trading
instruments).
Derivatives are classified as a separate line item in the statement of financial position.
Trading derivatives are non-qualified economic hedges. Changes in the value of these instruments are recognized directly in
profit and loss.
Hedge accounting is applicable when:
at the inception of the hedge, there is a formal designation and documentation of the hedging relationship;
the effectiveness of the hedge is demonstrated at inception and it is expected to continue in subsequent periods: i.e. at
inception and throughout its duration, the company expects changes in the fair value of the hedged element to be almost
fully offset by changes in the fair value of the hedged instrument.
There are three types of hedge accounting:
the fair value hedge is a hedge of the exposure to changes in fair value of a recognized asset or liability (or an identified
portion of the asset or liability) that are attributable to a particular interest rate and/or currency risk and which could affect
profit or loss.
The hedged portion of these items is re-measured at fair value in the statement of financial position. Change in this fair
value is booked in the income statement and offset by symmetrical changes in the fair value hedging of financial hedging
instruments up to the limit of the hedge effectiveness;
the cash flow hedge is a hedge of the exposure to variability in cash flows that is attributable to a particular interest rate
and/or currency risk associated with a recognized asset or liability or a highly probable forecast transaction (such as a
future purchase or sale) and which could affect profit or loss.
As the hedged item is not recognized in the statement of financial position, the effective portion of change in fair value of
the hedging instrument is booked in other comprehensive income. It is reclassified in profit or loss when the hedged item
(financial asset or liability) affects the profit or loss or in the initial cost of the hedged item when it relates to the hedge of a
non-financial asset acquisition cost;
the net investment hedge is a hedge of the exposure to changes in values attributable to exchange risk of a net
investment in a foreign operation, and could affect profit or loss on the disposal of the foreign operation.
The effective portion of the net investment hedge is recorded in other comprehensive income. It is reclassified in profit or
loss upon the disposal of the net investment.
For transactions qualified as fair value hedges and economic hedges, the foreign exchange impact of changes in the fair value
of derivatives is booked in operating income when the underlying hedged item results from operational transactions and in net
finance costs when the underlying hedged item is a financial asset or liability.
Hedge accounting can be terminated when the hedged item is no longer recognized, i.e. when the Group voluntarily revokes
the designation of the hedging relationship or when the hedging instrument is terminated or exercised. The accounting
consequences are as follows:
fair value hedge: at the hedge accounting termination date, the adjustment of the fair value of the liability is amortized
using an effective interest rate recalculated at this date;

Consolidated financial statements 2018 96
cash flow hedge: amounts recorded in other comprehensive income are immediately reclassified in profit or loss when the
hedged item is no longer recognized. In all other cases, amounts are reclassified in profit or loss, on a straight basis,
throughout the remaining life of the original hedging relationship.
In both cases, subsequent changes in the value of the hedging instrument are recorded in profit or loss.
Concerning the effects of the Foreign Currency Basis Spread, cross-currency swaps designated as cash flow hedges, the
Group has chosen to designate them as costs of hedge. This option enables recognizing these effects in comprehensive
income and amortizing the cost of the Basis Spread to profit/loss over the period of the hedge.
11.8.2 Cash flow hedges
The Group’s cash flow hedges main goal is to neutralize foreign exchange risk on future cash flows (notional, coupons) or
switch floating-rate debt to fixed-rate debt.
The main hedges unmatured at December 31, 2018, as well as their effects on the financial statements, are detailed in the table
below.
Hedged risk
(in millions of euros) Total Exchange and interest
rate risk Exchange risk Interest rate risk
Hedging instruments (160) Cross Currency Swap Forward FX swap
Option Interest rate swap
Carrying amount - asset 353 351 2 -
Carrying amount - liability (513) (479) (0) (34)
Change in cash flow hedge reserve (67) (83) (7) 23
Gain (loss) recognized in other comprehensive income
(53) (45) (15) 7
Reclassification in financial result (22) (38) - 16
Reclassification in operating income (1) - (1) -
Reclassification in initial carrying amount of hedged item
9 - 9 -
Cash flow hedge reserve (267) (245) 3 (25)
o/w related to unmatured hedging instruments
(721) (696) 3 (28)
o/w related to discontinued hedges 454 451 0 3
Hedged item Bonds and credit line Purchases of handsets
and equipment Bonds and Leasing
Balance sheet item Current and non current
financial liabilities Property, plant and
equipment Current and non current
financial liabilities
The ineffective portion of cash flow hedges recognized in net income is not significant during the periods presented.
The change in the cash flow hedge reserve in 2017 and 2016 was analyzed as follows:
(in millions of euros) 2017 2016
Gain (loss) recognized in other comprehensive income during the period (1)
51 (288)
Reclassification in financial result for the period (10) (79)
Reclassification in operating income for the period (3) (1)
Reclassification in initial carrying amount of hedged item 11 4
Other comprehensive income 49 (364)
(1) Mainly includes hedges of future interests on debts denominated in foreign currencies using cross currency swaps.
In 2017 and 2016, the cash flow hedge reserve broke down as follows:

Consolidated financial statements 2018 97
(in millions of euros) December 31, 2017 December 31, 2016
Other comprehensive income related to unmatured hedging instruments (686) (763)
O/w Orange SA (666) (738)
O/w other entities (20) (25)
Reserve to be amortized for discontinued hedges 486 514
Other comprehensive income related to hedging instruments (200) (249)
The nominal amounts of the main cash flow hedges are presented below:
Notional amounts of hedging instruments per maturity
(in millions of hedged currency units)
2019 2020 2021 2022 2023 and beyond
Orange SA
Cross currency swaps
GBP - 238 517 - 1,362 (1)
HKD - - - - 1,110 (2)
JPY 7,500 - - - -
NOK - - - - 1,300 (3)
USD 3,250 47 1,000 - 4,200 (4)
Interest rate swaps
EUR - - 255 - 100 (5)
FT Immo H
Interest rate swaps
EUR - 38 75 71 45
(1) 262 MGBP with a maturity 2025, 500 MGBP with a maturity 2028, 250 MGBP with a maturity 2034 and 350 MGBP with a maturity 2050.
(2) 1,110 MHKD with a maturity 2023.
(3) 500 MNOK with a maturity 2025 and 800 MNOK with a maturity 2028.
(4) 2,450 MUSD with a maturity 2031, 900 MUSD with a maturity 2042 and 850 MUSD with a maturity 2044.
(5) 100 MEUR with a maturity 2030.
11.8.3 Fair value hedges
As a reminder, on January 29, 2016, in the context of the disposal of EE, the Group received 4% of the equity in BT and was
only holding 2.67% at the end of 2017, following the disposal in June 2017 of a third of its equity investment. At December 31,
2017, these shares denominated in pounds sterling were hedged against foreign exchange risk by currency swaps.
Pursuant to the application of IFRS 9 as of January 1, 2018, the Group decided to no longer qualilfy these as hedges.
Therefore, on December 31, 2018, the hedges put in place are presented as trading derivatives (not eligible for hedge
accounting). This change in designation had no effect on net financial expenses.
NOTE 12 Information on market risk and fair value of financial assets and liabilities (excluding Orange Bank)
The Group uses financial position or performance indicators that are not specifically defined by IFRS, such as adjusted EBITDA
(see Note 1.7) and net financial debt (see Note 11.3).
Market risks are monitored by Orange’s Treasury and Financing Committee, which reports to the Executive Committee. The
Committee is chaired by the Group’s Executive Committee Member in charge of Finance and Performance and meets on a
quarterly basis.
It sets the guidelines for managing the Group’s debt, especially in respect of its interest rate, foreign exchange, liquidity and
counterparty risk exposure for the coming months, and reviews past management (transactions realized, financial results).
12.1 Interest rate risk management
Management of fixed-rate/variable-rate debt
Orange seeks to manage its fixed-rate/variable-rate exposure in euros in order to minimize interest costs by using firm and
conditional interest rate derivatives such as swaps, futures, caps and floors.

Consolidated financial statements 2018 98
The fixed-rate component of gross financial debt, excluding cash collateral received and agreements to buy back non-controlling
interests, was estimated at 87% at December 31, 2018, 83% in 2017 and 84% in 2016.
Sensitivity analysis of the Group’s position to changes in interest rates
The sensitivity of the Group’s financial assets and liabilities to interest rate risk is only analyzed for the components of net
financial debt that are interest-bearing and therefore exposed to interest rate risk.
Sensitivity of financial expenses
Based on a constant amount of debt and a constant management policy, a 1% rise in interest rates would result in a 75 million
euros decrease in the annual gross financial debt and a 1% fall in interest rates would result in a 92 million euros increase.
Sensitivity of cash flow hedge reserves
A 1% rise in euro interest rates would increase the market value of derivatives designated as cash flow hedges and the
associated cash flow hedge reserves by approximately 1,039 million euros. A 1% fall in euro interest rates would lead to a
decrease in their market value and in the cash flow hedge reserves of approximately 1,019 million euros.
12.2 Foreign exchange risk management
Operational foreign exchange risk
The Group’s foreign operations are carried out by entities that operate in their own country and mainly in their own currency .
Their operational exposure to foreign exchange risk is therefore limited to certain types of flows: purchases of equipment or
network capacity, purchases of terminals and equipment sold or leased to customers, purchases from or sales to international
operators.
Whenever possible, the entities of the Orange group have put in place policies to hedge this exposure (see Note 11.8).
Financial foreign exchange risk
Financial foreign exchange risk mainly relates to:
dividends paid to the parent company: usually, the Group’s policy is to economically hedge this risk as from the date of the
relevant subsidiary’s Shareholders’ Meeting;
financing of the subsidiaries: except in special cases, the subsidiaries are required to cover their funding needs in their
functional currency;
Group financing: most of the Group’s bonds, after derivatives, are denominated in euros. From time to time, Orange SA
issues bonds in markets other than euro markets (primarily the US dollar, pound sterling, Canadian dollar, Swiss franc and
yen). If Orange SA does not have assets in these currencies, in most cases, the issues are translated into euros through
cross currency swaps. The debt allocation by currency also depends on the level of interest rates and particularly on the
interest rate differential relative to the euro.
Lastly, the Group economically hedges foreign exchange risk on its subordinated notes denominated in pound sterling that are
recorded in equity at their historical value (see Note 13.4), with cross currency swaps, for a notional amount of 1,250 million
pounds sterling.
The table below shows the main exposures to foreign exchange fluctuations of the net financial debt in foreign currencies of
Orange SA, excluding the hedging effects of the subordinated notes described above and also shows the sensitivity of the entity
to a 10% change in the foreign exchange rates of the currencies to which it is exposed. Orange SA is the entity bearing the
major foreign exchange risk, including internal operations which generate a net foreign exchange gain or loss in the
consolidated annual financial statements.
Exposure in currency units (1)
Sensitivity analysis
(in millions of currency units) USD GBP PLN CHF
Total translated
10% gain in euro 10% loss in euro
Orange SA 1 0 2 (12) (9) 1 (1)
Total (euros) 1 0 1 (11) (9)
(1) Excluding FX hedge of subordinated notes denominated in pound sterling.
Foreign exchange risk to assets
Due to its international presence, the Orange group’s statement of financial position is exposed to foreign exchange fluctuat ions,
as these affect the translation of subsidiaries’ assets and equity interests denominated in foreign currencies. The currencies

Consolidated financial statements 2018 99
concerned are mainly the pound sterling, the zloty, the Egyptian pound, the US dollar, the Jordanian dinar and the Moroccan
dirham.
To hedge its largest foreign asset exposures, Orange has issued debt in the relevant currencies.
The amounts presented below take into account the activities of Orange Bank (activities only in euros).
Contribution to consolidated net assets Sensitivity analysis
(in millions of euros) EUR USD GBP PLN EGP JOD MAD
Other currenci
es
Total 10% gain in euro
10% loss in euro
Net assets excluding net debt (a)
(1) 49,174 130 (240)
(2) 3,649 859 544 955 3,619 58,690 (865) 1,057
Net debt by currency including derivatives (b)
(3)
(23,947) 183 900 (4)
(1,594) (263) (43) (403) (274) (25,441) 136 (166)
Net assets by currency (a) + (b) 25,227 313 660 2,055 (5)
596 501 552 3,345 33,249 (729) 891
(1) Excluding net debt by currency do not include components of net financial debt.
(2) Of which BT shares for 659 million euros.
(3) The net financial debt as defined by Orange group does not include Orange Bank activities for which this concept is not relevant (see Note 11.3).
(4) Of which economic hedge of subordinated note denominated in pounds sterling for 1,250 million pounds sterling (equivalent 1,397 million euros).
(5) Share of net assets attributable to owners of the parent company in zlotys amounts to 1,041 million euros.
Due to its international presence, the Orange group income statement is also exposed to risk arising from changes in foreign
exchange rates due to the conversion, in the consolidated financial statements, of its foreign subsidiaries’ financial statements.
Contribution to consolidated financial income statement Sensitivity analysis
(in millions of euros) EUR USD GBP PLN EGP JOD MAD
Other currenci
es Total 10% gain in
euro 10% loss in
euro
Revenues 31,949 1,125 176 2,574 654 384 533 3,986 41,381 (858) 1,048
Reported EBITDA 9,138 4 42 677 211 137 198 1,570 11,977 (258) 316
Operating income 3,684 (45) 39 81 75 (0) 66 929 4,829 (104) 127
12.3 Liquidity risk management
Diversification of sources of funding
Orange has diversified sources of funding:
regular issues in the bonds markets;
occasional financing through loans from multilateral or development lending institutions;
issues in the short-term securities markets under the NEU Commercial Paper program (Negotiable European Commercial
papers);
on December 21, 2016, Orange entered into a 6 billion euros syndicated loan with 24 international banks in order to
refinance the previous syndicated loan maturing in January 2018. The new loan, with initial maturity in December 2021,
includes two options to extend for one more year each, exercisable by Orange and subject to the banks’ approval. Orange
exercised both of its options, the first one in 2017 and the second in 2018, allowing it, after agreement of the lenders, to
extend the initial maturity first until December 2022 and then December 2023.
Liquidity of investments
Orange invests its cash surplus in near-cash or in short-term fair value investments (negotiable debt securities, mutual funds or
UCITS and term deposits). These investments give priority to minimizing the risk of loss on capital over performance.
Cash and cash equivalents were held mainly in France and other countries of the European Union that are not subject to
restrictions on convertibility or exchange control.
Smoothing debt maturities
The policy followed by Orange is to apportion the maturities of debt evenly over the years to come.
The following table shows undiscounted future cash flows for each financial liability shown on the statement of financial position.
The key assumptions used in this schedule are:
amounts in foreign currencies are translated into euro at the year-end closing rate;
future variable-rate interest is based on the last fixed coupon, unless a better estimate is available;

Consolidated financial statements 2018 100
TDIRA being necessarily redeemable in new shares, no redemption is taken into account in the maturity analysis. In
addition, interest payable on the bonds is due over an undetermined period of time (see Note 11.4) therefore, only interest
payable for the first period is included (including interest payments for the other periods would not provide relevant
information);
the maturity dates of revolving credit facilities are the contractual maturity dates;
the “Other items” (undated and non-cash items) reconcile, for financial liabilities not accounted for at fair value, the future
cash flows and the balance in the statement of financial position.
(in millions of euros) Note December
31, 2018 2019 2020 2021 2022 2023
2024 and
beyond Other
items (1)
TDIRA 11.4 822 4 - - - - - 818
Bonds 11.5 27,070 4,948 1,340 3,252 1,524 1,398 14,760 (152)
Bank loans and from development organizations and multilateral lending institutions 11.6 3,664 625 726 421 201 902 800 (11)
Finance lease liabilities 11.3 584 158 134 110 60 34 88 -
Cash collateral received 11.3 82 82 - - - - - -
NEU commercial papers (2)
11.3 1,116 1,116 - - - - - -
Bank overdrafts 11.3 318 318 - - - - - -
Other financial liabilities 11.3 363 104 23 2 2 230 2 -
Derivatives (liabilities) 11.3 845 (105) (11) (17) (253) - (75) -
Derivatives (assets) 11.3 (385) (129) (3) (189) (12) - (290) -
Other Comprehensive Income related to unmatured hedging instruments 11.3 (721) - - - - - - -
Gross financial debt after derivatives 33,758 7,121 2,209 3,579 1,522 2,564 15,285 655
Trade payables 10,082 9,468 199 58 53 33 271 -
Total financial liabilities (including derivatives assets) 43,840 16,589
(3) 2,408 3,637 1,575 2,597 15,556 655
Future interests on financial liabilities
(4) 2,334 1,118 919 1,375 715 5,968 -
(1) Undated items: TDIRA notional. Non-cash items: amortized cost on TDIRA, bonds and bank loans, and discounting effect on long term trade payables.
(2) Negotiable European Commercial Papers (formerly called "commercial papers").
(3) Amounts presented for 2019 correspond to notionals and accrued interests for 543 million euros.
(4) Mainly future interests on bonds for 11,536 million euros, on bank loans for 969 million euros and on derivatives instruments for (2,068) million euros.
The liquidity position is one of the indicators of financial position used by the Group. This aggregate, not defined by IFRS, may
not be comparable to similarly entitled indicators used by other groups.
At December 31, 2018, the liquidity position of Orange’s telecom activities amounts to 13,964 million euros and exceeds the
repayment obligations of its gross financial debt in 2019. It breaks down as follows:
Liquidity position
(in millions of euros)
At December 31, 2018, Orange telecom activities had access to credit facilities in the form of bilateral credit lines and
syndicated credit lines. Most of these lines bear interest at floating rates.
Available undrawn amount of credit facilities amounts to 6,200 million euros (including 6,000 million euros for Orange SA).
Any specific contingent commitments in respect of compliance with financial ratios are presented in Note 12.4.
2,523
2,558
6,200
2,683
13,964
Available undrawn amount of credit facilities
Investments at fair value
Cash
Cash equivalents

Consolidated financial statements 2018 101
Orange’s credit ratings
Orange’s credit rating is an additional performance indicator used to assess the Group’s financial policy and risk management
policy and, in particular, its solvency and liquidity risk, and is not a substitute for an analysis carried out by investors. Rating
agencies revise the ratings they assign on a regular basis. Any change in the rating could produce an impact on the cost of
future financing or restrict access to liquidity.
In addition, a change in Orange’s credit rating will, for certain outstanding financing, affect the compensation paid to investors:
one Orange SA bond (see Note 11.5) with an outstanding amount of 2.5 billion dollars maturing in 2031 (equivalent to
2.1 billion euros at December 31, 2018) is subject to a Step-up clause in the event that Orange’s rating changes. This clause
was triggered in 2013 and early 2014: the coupon due in March 2014 was thus computed on the basis of an interest rate of
8.75% and since then, the bond bears interest at the rate of 9%;
the margin of the syndicated credit line of 6 billion euros signed on December 21, 2016 might be modified in light of changes
to Orange’s credit rating, upwards or downwards. As at December 31, 2018, the credit facility was not drawn.
Regarding the changes in Orange’s credit ratings in 2018, Japan Credit Rating improved its rating on long-term debt from A- to
A on June 27, 2018, and at the same time, revised the Outlook from Positive to Stable.
Orange’s credit rating at December 31, 2018 is as follows:
Standard & Poor’s Moody's Fitch Ratings Japan Credit Rating
Long-term debt BBB+ Baa1 BBB+ A
Outlook Stable Stable Stable Stable
Short-term debt A2 P2 F2 Not applicable
12.4 Financial ratios
Main commitments with regard to financial ratios
Orange SA does not have any credit line or loan subject to specific covenant with regard to financial ratios.
Certain subsidiaries of Orange SA are committed to comply with certain financial ratios related to indicators defined in the
contracts with the banks. The breach of these ratios constitutes an event of default that can lead to early repayment of the line
of credit or loan concerned.
The main obligations are as follows:
Orange Egypt: in respect of 2018 bank financing contracts, of which the total nominal amount as at December 31, 2018 is
4,300 million Egyptian pounds (191 million euros), Orange Egypt must comply with a “net senior debt to EBITDA” ratio;
Médi Telecom: in respect of its 2012, 2014 and 2015 bank financing contracts, of which the total nominal amount as at
December 31, 2018 is 3,679 million Moroccan Dirhams (336 million euros), Médi Telecom must comply with the covenants
relating to its “net financial debt” and “net equity”;
Orange Côte d’Ivoire: in respect of its bank financing contracts signed in 2016 and 2017, of which the total notional amount
at December 31, 2018 was 103 billion CFA francs and 67 million euros (for a total of 224 million euros), Orange Côte d’Ivoire
must comply with a “net senior debt to EBITDA” ratio;
These ratios were complied with at December 31, 2018.
Clauses related to instances of default or material adverse changes
Most of Orange’s financing agreements, including in particular the 6 billion euros syndicated credit facility set up on
December 21, 2016, as well as bond issues, are not subject to early redemption obligations in the event of a material adverse
change, or cross default provisions. Most of these contracts include cross acceleration provisions. Thus, the mere occurrence of
events of default in other financing agreements would not automatically trigger an accelerated repayment under such contracts.
12.5 Credit risk and counterparty risk management
Financial instruments that could potentially expose Orange to concentration of counterparty risk consist primarily of trade
receivables, cash and cash equivalents, investments and derivative financial instruments.
Orange considers that it has limited concentration in credit risk with respect to trade receivables due to its large and diverse
customer base (residential, professional and large business customers) operating in numerous industries and located in many
French regions and foreign countries. In addition, the maximum value of the counterparty risk on these financial assets is equal
to their recognized net carrying value. An analysis of net trade receivables past due is provided in Note 4.3. For loans and other
receivables, amounts past due but not provisioned are not material.

Consolidated financial statements 2018 102
Orange SA is exposed to bank counterparty risk through its investments and derivatives. Therefore, it performs a strict selection
based on the credit rating of public, financial or industrial institutions in which it invests or with which it enters into derivatives
agreements:
for each non banking counterparty selected for investments, limits are based on ratings and maturities;
for each counterparty bank selected for investments and derivatives, limits are based on equity, rating, CDS (Credit Default
Swap, an accurate indicator of potential default risk) as well as on periodic analyses carried out by the Treasury Department;
theoretical limits and consumption limits are monitored and reported on a daily basis to the Group treasurer and the head of
the trading room. These limits are adjusted regularly depending on credit events.
For derivatives, master agreements relating to financial instruments (French Banking Federation) are signed with all
counterparties and provide for a net settlement of debts and receivables, in case of failure of one of the parties, as well as the
calculation of a final balance to be received or paid. These agreements include a CSA (Credit Support Annex) cash collateral
clause that can lead to either a deposit (collateral paid) or collection (collateral received), on a daily basis (or on a monthly basis
for certain counterparties). These payment amounts correspond to the change in market value of all derivative instruments.
As a rule, investments are negotiated with high-grade banks. Exceptionally, subsidiaries occasionally deal with counterparties
with the highest ratings available locally.
Effect of mechanisms to offset exposure to credit risk and counterparty risk of the derivatives
(in millions of euros) December 31, 2018 December 31, 2017 December 31, 2016
Fair value of derivatives assets 385 234 960
Fair value of derivatives liabilities (845) (963) (561)
Netting via Master Agreements (a) (460) (729) 399
Amount of cash collateral paid 553 695 77
Amount of cash collateral received (82) (21) (541)
Netting via Cash collateral (b) 471 674 (464)
Residual exposure to counterparty risk (a) + (b) 11 (55) (65)
Changes in net cash collateral between 2017 and 2018 stem mainly from the strengthening of the US dollar against the euro.
The residual exposure to counterparty risk is mainly due to a time difference between the valuation of derivatives at the closing
date and the date on which the cash collateral exchanges were made.
Sensitivity analysis of cash collateral deposits to changes in market interest rates and exchange rates
A change in market rates (mainly euro) of +/-1% would affect the fair value of interest rate hedging derivatives as follows:
(in millions of euros) Rate decrease of 1% Rate increase of 1%
Change of fair value of derivatives (1,136) 1,138 Rate decrease of 1% Rate increase of 1%
Amount of cash collateral received (paid) 1,136 (1,138)
A change in the euro exchange rate of 10% against currencies of hedged financing (mainly the pound sterling and the US
dollar) would impact the fair value of foreign exchange derivatives as follows:
(in millions of euros)
Change of fair value of derivatives
10% loss in euro 10% gain in euro
1,800 (1,473) 10% loss in euro 10% gain in euro
Amount of cash collateral received (paid) (1,800) 1,473
12.6 Equity market risk
Orange SA had no options to purchase its own shares, no forward purchase of shares and at December 31, 2018 held
7,214,100 treasury shares. Orange SA owns subsidiaries listed on equity markets whose share value may be affected by
general trends in these markets. In particular, the market value of these listed subsidiaries’ shares is one of the measurement
variables used in impairment testing.
The mutual funds (UCITS) in which Orange invests for cash management purposes contain no equities.
Orange is also exposed to equity risk through certain retirement plan assets (see Note 6.2).

Consolidated financial statements 2018 103
As at December 31, 2018, the Group’s only other material exposure to market risk on stock in publicly traded companies
involved its ownership of 2.49% of the equity in BT (see Note 11.7).
12.7 Capital management
Orange SA and its non-financial subsidiaries are not subject to regulatory requirements related to equity (other than the usual
standards applicable to any commercial company).
Its financial subsidiaries (like electronic money institutions) are subject to regulatory equity requirements specific to their sector
and jurisdiction.
Like any company, Orange manages its financial resources (both equity and net financial debt) as part of a balanced financial
policy, aiming to ensure flexible access to capital markets, including for the purpose of selectively investing in development
projects, and to provide a return to shareholders.
In terms of net financial debt (see Note 11.3), this policy translates into liquidity management as described in Note 12.3 and a
specific attention to credit ratings assigned by rating agencies.
This policy is also reflected, in some markets, by the presence of minority shareholders in the capital of subsidiaries controlled
by Orange. This serves to limit the Group’s debt while providing a benefit from the presence of local shareholders.
12.8 Fair value of financial assets and liabilities
December 31, 2018
(in millions of euros) Note
Classification under IFRS 9
(1) Book value
Estimated fair value
Level 1 and cash Level 2 Level 3
Trade receivables AC 5,329 5,329 - 5,329 -
Financial assets 11.7 5,057 5,057 692 4,144 221
Equity securities FVOCI 254 254 33 - 221
Equity securities FVR 805 805 659 146 -
Investments at fair value FVR 2,683 2,683 - 2,683 -
Cash collateral paid FVR 553 553 - 553 -
Financial assets at amortized cost AC 762 762 - 762 -
Cash and Cash equivalents 11.3 5,081 5,081 5,081 - -
Cash AC 2,558 2,558 2,558 - -
Cash equivalents FVR 2,523 2,523 2,523 - -
Trade payables AC (10,082) (10,082) - (10,082) -
Financial liabilities 11.3 (34,019) (37,292) (29,012) (7,988) (292)
Financial debts AC (33,721) (36,994) (29,012) (7,961) (21)
Bonds at fair value FVR (27) (27) - (27) -
Other FVR (271) (271) - - (271)
Derivatives (net amount) (2)
11.8 (460) (460) - (460) -
(1) AC" stands for "amortized cost", "FVR " stands for "fair value through profit or loss", "FVOCI" stands for "fair value through other comprehensive income that will not be reclassified to profit or loss".
(2) IFRS 9 classification for derivatives instruments depends on their hedging qualification.
The market value of the net financial debt carried by Orange was estimated at 28.7 billion euros as at December 31, 2018, for a
carrying amount of 25.4 billion euros.
The table below provides an analysis of the change in level 3 market values for financial assets and liabilities measured at fair
value in the statement of financial position.

Consolidated financial statements 2018 104
(in millions of euros) Equity securities
Financial liabilities at fair
value through profit or loss,
excluding derivatives
Level 3 fair values at January 1, 2018 202 (136)
Gains (losses) taken to profit or loss - (135)
Gains (losses) taken to other comprehensive income 1 -
Acquisition (sale) of securities 16 -
Other 2 (21)
Level 3 fair values at December 31, 2018 221 (292)
The table below is presented according to IAS 39.
December 31, 2017
(in millions of euros) Note
Classifi- cation under
IAS 39 Book value Estimated fair value
Level 1 and cash Level 2 Level 3
Trade receivables L&R 5,184 5,184 - 5,184 -
Financial assets 11.7 4,960 4,960 1,014 3,744 202
Assets available for sale AFS 1,067 1,067 865 - 202
Equity securities measured at fair value FVR 146 146 - 146 -
Cash collateral paid L&R 695 695 - 695 -
Investments at fair value FVR 2,647 2,647 149 2,498 -
Other L&R 405 405 - 405 -
Cash and cash equivalents 11.3 5,333 5,333 5,333 - -
Cash equivalents FVR 3,166 3,166 3,166 - -
Cash L&R 2,167 2,167 2,167 - -
Trade payables LAC (10,099) (10,132) - (10,132) -
Financial liabilities 11.3 (32,475) (37,327) (28,332) (8,859) (136)
Financial debt LAC (32,311) (37,163) (28,332) (8,831) -
Bonds at fair value through profit or loss FVR (28) (28) - (28) -
Other FVR (136) (136) - - (136)
Derivatives, net amount 11.8 (729) (729) - (729) -
The market value of the net financial debt carried by Orange was estimated at 28.7 billion euros as at December 31, 2017, for a
carrying amount of 23.8 billion euros.
December 31, 2016
(in millions of euros) Note
Classifi- cation under
IAS 39 Book value Estimated fair value
Level 1 and cash Level 2 Level 3
Trade receivables L&R 4,964 4,964 - 4,964 -
Financial assets 11.7 4,002 4,002 1,748 2,149 105
Assets available for sale AFS 1,878 1,878 1,748 25 105
Equity securities measured at fair value FVR 80 80 - 80 -
Cash collateral paid L&R 77 77 - 77 -
Investments at fair value FVR 1,576 1,576 - 1,576 -
Other L&R 391 391 - 391 -
Cash and cash equivalents 11.3 6,266 6,266 6,266 - -
Cash equivalents FVR 3,942 3,942 3,942 - -
Cash L&R 2,324 2,324 2,324 - -
Trade payables LAC (9,869) (9,889) - (9,889) -
Financial liabilities 11.3 (33,525) (38,501) (30,283) (8,092) (126)
Financial debt (33,370) (38,346) (30,283) (8,063) -
Bonds at fair value through profit or loss FVR (29) (29) - (29) -
Other FVR (126) (126) - - (126)
Derivatives, net amount 11.8 399 399 - 399 -

Consolidated financial statements 2018 105
The market value of the net financial debt carried by Orange was estimated at 29.4 billion euros as at December 31, 2016, for a
carrying amount of 24.4 billion euros.
Accounting policies
The financial assets and liabilities measured at fair value in the statement of financial position have been classified based on
the three hierarchy levels:
level 1: quoted prices (unadjusted) in active markets for identical assets or liabilities that the entity can access at the
measurement date;
level 2: inputs that are observable for the asset or liability, either directly or indirectly;
level 3: unobservable inputs for the asset or liability.
The fair value of the financial assets at fair value through other comprehensive income is the quoted price at year-end for
listed securities and, for non-listed securities, uses a valuation technique determined according to the most appropriate
financial criteria in each case (comparable transactions, multiples for comparable companies, shareholders’ agreement,
discounted present value of future cash flows).
For financial assets at amortized cost, the Group considers that the carrying amount of cash, trade receivables and various
deposits provide a reasonable approximation of fair value, due to the high liquidity of these elements.
Among financial assets at fair value through profit or loss, with respect to very short-term investments such as deposits,
certificates of deposit, commercial paper or negotiable debt securities, the Group considers that the nominal value of the
investment and any related accrued interest represent a reasonable approximation of fair value.
The fair value of mutual funds (UCITS) is the latest net asset value.
The fair value of investment securities is the quoted price at year-end for listed securities and, for non-listed securities, uses a
valuation technique determined according to the most appropriate financial criteria in each case (comparable transactions,
multiples for comparable companies, shareholders’ agreement, discounted present value of future cash flows).
For financial liabilities at amortized cost, the fair value of financial liabilities is determined using:
the quoted price for listed instruments (a detailed analysis is performed in the case of a material decrease in liquidity to
evidence whether the observed price corresponds to the fair value; otherwise the quoted price is adjusted);
the present value of estimated future cash flows, discounted using rates observed by the Group at the end of the period for
other instruments. The results calculated using the internal valuation model are systematically benchmarked with the values
provided by Bloomberg.
The Group considers the carrying value of trade payables and deposits received from customers to be a reasonable
approximation of fair value, due to the high liquidity of these elements.
The fair value of long-term trade payables is the value of future cash flows discounted at the interest rates observed by the
Group at the end of the period.
Financial liabilities at fair value through profit or loss mainly concern firm or contingent commitments to purchase non-
controlling interests. Their fair value is measured in accordance with the provisions of the contractual agreements. When the
commitment is based on a fixed price, a discounted value is retained.
The fair value of derivatives, mostly traded over-the-counter, is determined using the present value of estimated future cash
flows, discounted using the interest rates observed by the Group at the end of the period. The results calculated using the
internal valuation model are consistently benchmarked with the values provided by bank counterparties and Bloomberg.
When there are no reliable market data which identify the probability of default, the CVA (Credit Value Adjustment) and the
DVA (Debit Value Adjustment) are measured based on historical default charts and CDS (Credit Default Swap) trends.
Counterparty credit risk and the Group’s own specific default risk are also continuously monitored based on the monitoring of
debt security credit spreads on the secondary market and other market information. Given the implementation of
collateralization, and based on counterparty policies and the management of indebtedness and liquidity risk described in Note
12, CVA and DVA estimates are not material compared to the measurement of the related financial instruments.
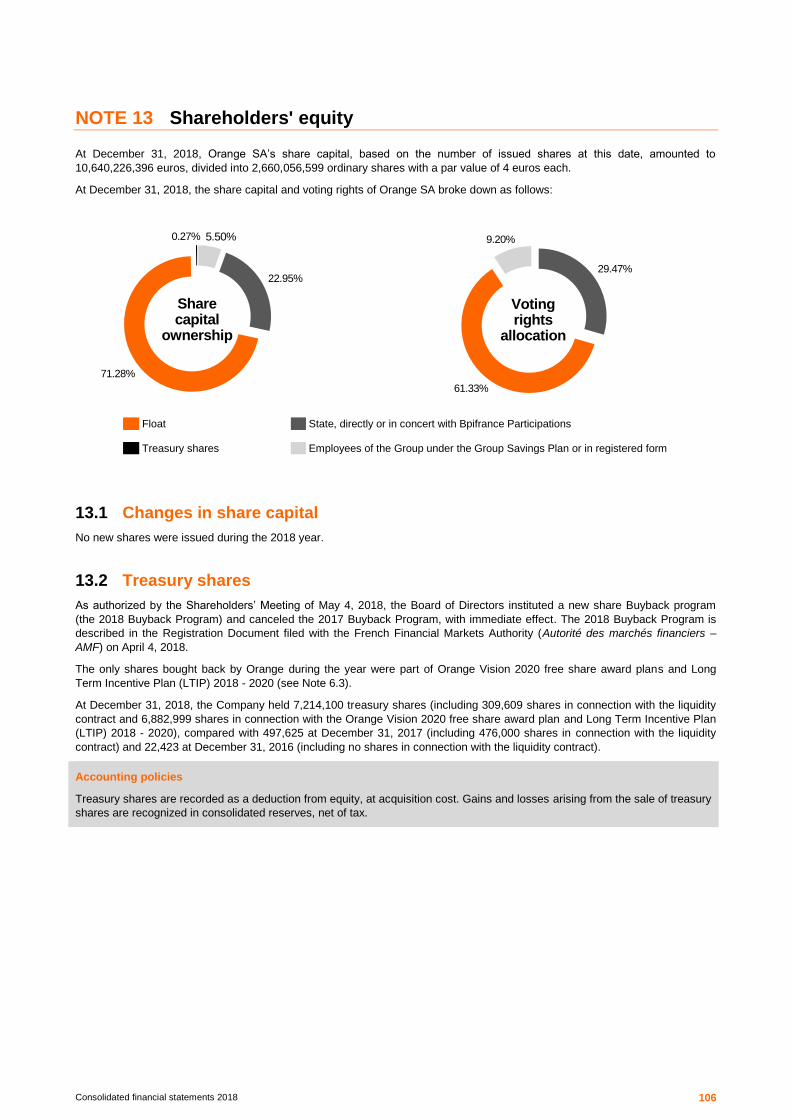
Consolidated financial statements 2018 106
NOTE 13 Shareholders' equity
At December 31, 2018, Orange SA’s share capital, based on the number of issued shares at this date, amounted to
10,640,226,396 euros, divided into 2,660,056,599 ordinary shares with a par value of 4 euros each.
At December 31, 2018, the share capital and voting rights of Orange SA broke down as follows:
Float State, directly or in concert with Bpifrance Participations Treasury shares Employees of the Group under the Group Savings Plan or in registered form
13.1 Changes in share capital
No new shares were issued during the 2018 year.
13.2 Treasury shares
As authorized by the Shareholders’ Meeting of May 4, 2018, the Board of Directors instituted a new share Buyback program
(the 2018 Buyback Program) and canceled the 2017 Buyback Program, with immediate effect. The 2018 Buyback Program is
described in the Registration Document filed with the French Financial Markets Authority (Autorité des marchés financiers –
AMF) on April 4, 2018.
The only shares bought back by Orange during the year were part of Orange Vision 2020 free share award plans and Long
Term Incentive Plan (LTIP) 2018 - 2020 (see Note 6.3).
At December 31, 2018, the Company held 7,214,100 treasury shares (including 309,609 shares in connection with the liquidity
contract and 6,882,999 shares in connection with the Orange Vision 2020 free share award plan and Long Term Incentive Plan
(LTIP) 2018 - 2020), compared with 497,625 at December 31, 2017 (including 476,000 shares in connection with the liquidity
contract) and 22,423 at December 31, 2016 (including no shares in connection with the liquidity contract).
Accounting policies
Treasury shares are recorded as a deduction from equity, at acquisition cost. Gains and losses arising from the sale of treasury
shares are recognized in consolidated reserves, net of tax.
5.50%0.27%
22.95%
71.28%
Share capital
ownership
29.47%
61.33%
9.20%
Votingrights
allocation

Consolidated financial statements 2018 107
13.3 Dividends
Full Year Approved by Description Dividend per share
(in euro) Payout date How paid
Total (in
millions of euros)
2018
Board of Directors Meeting on July 25, 2018
2018 interim dividend
0.30 December 6, 2018 Cash 796
Shareholders' Meeting on May 4, 2018 Balance for 2017
0.40 June 7, 2018 Cash 1,064
Total dividends paid in 2018 1,860
2017
Board of Directors Meeting on July 26, 2017
2017 interim dividend
0.25 December 7, 2017 Cash 665
Shareholders' Meeting on June 1, 2017 Balance for 2016
0.40 June 14, 2017 Cash 1,064
Total dividends paid in 2017 1,729
2016
Board of Directors Meeting on July 25, 2016
2016 interim dividend
0.20 December 7, 2016 Cash 532
Shareholders' Meeting on June 7, 2016 Balance for 2015
0.40 June 23, 2016 Cash 1,064
Total dividends paid in 2016 1,596
2015
Board of Directors Meeting on July 27, 2015
2015 interim dividend
0.20 December 9, 2015 Cash 530
Shareholders' Meeting on May 27, 2015 Balance for 2014
0.40 June 10, 2015 Cash 1,059
Total dividends paid in 2015 1,589
The amount available to provide a return to shareholders in the form of dividends, is calculated on the basis of the total net
income and retained earnings, under French GAAP, of the entity Orange SA, the parent company.
13.4 Subordinated notes
On February 7, 2014, as part of its EMTN program, Orange SA issued the equivalent of 2.8 billion euros of deeply subordinated
notes denominated in euros and pounds sterling in three tranches: 1 billion euros with a fixed-rate coupon of 4.25%, 1 billion
euros with a fixed-rate coupon of 5.25% and 650 million pounds with a fixed-rate coupon of 5.875%. A reset of interest rates at
market conditions is provided for contractually on each call option exercise date.
Orange has a call option on each of these tranches respectively after February 7, 2020, February 7, 2024, and February 7, 2022
and upon the occurrence of certain contractually defined events.
Step-up clauses involve coupon adjustments of 0.25% in 2025 and an additional 0.75% in 2040 for the first tranche; 0.25% in
2024 and an additional 0.75% in 2044 for the second tranche and 0.25% in 2027 and an additional 0.75% in 2042 for the third
tranche.
On October 1, 2014, under its EMTN program, Orange SA issued the equivalent of 3 billion euros of deeply subordinated notes
denominated in euros and pounds sterling in three tranches: 1 billion euros with a fixed-rate coupon of 4%, 1.25 billion euros
with a fixed-rate coupon of 5% and 600 million pounds with a fixed-rate coupon of 5.75%. A reset of interest rates at market
conditions is provided for contractually on each call option exercise date.
Both issuances were the subject of a prospectus certified by the AMF under visas no. 14-036 and 14-525.
Orange has a call option on each of these tranches respectively after October 1, 2021, October 1, 2026, and April 1, 2023 and
upon the occurrence of certain contractually defined events.
Step-up clauses involve coupon adjustments of 0.25% in 2026 and an additional 0.75% in 2041 for the first tranche; 0.25% in
2026 and an additional 0.75% in 2046 for the second tranche and 0.25% in 2028 and an additional 0.75% in 2043 for the third
tranche.
These notes, listed on Euronext Paris, are lowest ranking subordinated notes (senior compared to ordinary shares): the holders
will only be remunerated (whether for the nominal, interest or any other amount) after all other creditors, including holders of
participating loans and securities, simply subordinated or not, representing a claim on Orange.
At each interest payment date, settlement may be either paid or deferred, at the option of the issuer. Deferred coupons are
capitalized and become due and payable in full under certain circumstances defined contractually and under the control of
Orange.
Under the Group understanding, some rating agencies assign an “equity” component from 0 to 50% to these instruments.
Under IFRS, these instruments are recognized at their historical value. The tranches denominated in pounds sterling were
recognized at the ECB fix rate on the issue date (0.8314 for the issue of February 7, 2014 and 0.7782 for the issue of October 1,
2014) and will not be re-measured through the life of the note. Coupons impact equity five working days before the annual date
of payment (February 7 for the three tranches of the first issue, October 1 for the two euro tranches of the second issue and
April 1 for the pound sterling tranche of the second issue), unless Orange exercises its right to defer their payment.
Since their issuance, Orange has not exercised its right to defer the coupons related to the subordinated notes.

Consolidated financial statements 2018 108
The note holders received the payments shown in the following table:
Paid coupons
(in millions of currency) Paid coupons
(in millions of euros)
1,000 MEUR issued as of February 1, 2014 with a fixed-rate coupon of 4.25% 42 42
1,000 MEUR issued as of February 1, 2014 with a fixed-rate coupon of 5.25% 52 52
650 MGBP issued as of February 1, 2014 with a fixed-rate coupon of 5.875% 38 44
1,000 MEUR issued as of October 1, 2014 with a fixed-rate coupon of 4% 40 40
1,250 MEUR issued as of October 1, 2014 with a fixed-rate coupon of 5% 63 63
600 MGBP issued as of October 1, 2014 with a fixed-rate coupon of 5.75% (1)
35 39
Total coupons paid to the holders in 2018 280
1,000 MEUR issued as of February 1, 2014 with a fixed-rate coupon of 4.25% 42 42
1,000 MEUR issued as of February 1, 2014 with a fixed-rate coupon of 5.25% 52 52
650 MGBP issued as of February 1, 2014 with a fixed-rate coupon of 5.875% 38 45
1,000 MEUR issued as of October 1, 2014 with a fixed-rate coupon of 4% 40 40
1,250 MEUR issued as of October 1, 2014 with a fixed-rate coupon of 5% 63 63
600 MGBP issued as of October 1, 2014 with a fixed-rate coupon of 5.75% (1)
35 40
Total coupons paid to the holders in 2017 282
1,000 MEUR issued as of February 1, 2014 with a fixed-rate coupon of 4.25% 42 42
1,000 MEUR issued as of February 1, 2014 with a fixed-rate coupon of 5.25% 52 52
650 MGBP issued as of February 1, 2014 with a fixed-rate coupon of 5.875% 38 50
1,000 MEUR issued as of October 1, 2014 with a fixed-rate coupon of 4% 40 40
1,250 MEUR issued as of October 1, 2014 with a fixed-rate coupon of 5% 63 63
600 MGBP issued as of October 1, 2014 with a fixed-rate coupon of 5.75% (1)
35 44
Total coupons paid to the holders in 2016 291
(1) Coupons payment date as of April 1.
The tax effect of the conversion of subordinated notes whose face value is denominated in pounds sterling was (4) million euros
for the period. This effect is shown at “Other movements” in the consolidated statements changes in shareholders’ equity.
13.5 Translation adjustment
(in millions of euros) 2018 2017 2016
Gain (loss) recognized in other comprehensive income during the period (6) (184) (217)
Reclassification to net income for the period (1) 8 (13)
Total transaction adjustments for continuing operations (7) (176) (230)
Reclassification to the net income for the period (1)
- - (836)
Total translation adjustments for discontinued operations - - (836)
(1) Related to EE (see Note 3).
Accounting policies
Subordinated notes
The Group issued subordinated notes in several tranches.
These instruments have no maturity and the coupon’s settlement could be deferred at the option of the issuer. They are
booked in equity.
As equity instruments are recognized at historical value, the tranche denominated in foreign currency is never re-measured.
Where appropriate, a translation adjustment impact will be booked in equity at the exercise date of any purchase option.
The holders’ payment is directly booked in equity at the date of the decision to pay the coupons.
The tax effect relating to the payment is accounted for as net income and the one relating to the remeasurement of the foreign
exchange portion is accounted for as equity.
Equity component of perpetual bonds redeemable for shares (TDIRA) (see Note 11.4)
The equity component is determined as the difference between the fair value of the instrument taken as a whole and the fair
value of the debt component. Thus, the equity component determined and recognized at inception is not subsequently re-
measured and remains in equity, even when the instrument is extinguished.

Consolidated financial statements 2018 109
(in millions of euros)
December 31, 2018
December 31, 2017
December 31, 2016
Polish zloty 785 845 733
Egyptian pound (532) (545) (509)
Slovak koruna 220 220 220
Sierra leonean leone (95) (78) (39)
Moldovan leu (63) (70) (76)
Jordanian dinar 58 33 108
Pound sterling 14 15 9
Other (135) (161) (11)
Total translation adjustements 252 259 435
o/w share attributable to the owners of the parent company 15 27 164
o/w share attributable to non-controlling interests 237 232 271
Accounting policies
The functional currency of foreign operations located outside the euro area is usually the local currency, unless the major cash
flows are made with reference to another currency (such as the Orange entities in Romania - euros and in the Democratic
Republic of the Congo - US dollars).
The financial statements of foreign operations whose functional currency is neither the euro nor the currency of a hyper-
inflationary economy are translated into euros (the Group’s presentation currency) as follows:
assets and liabilities are translated at the year-end rate;
items in the income statement are translated at the average rate for the year;
the translation adjustment resulting from the use of these different rates is included in other comprehensive income.
The translation adjustments are reclassified to profit or loss when the entity disposes or partially disposes (loss of control, loss
of joint control, loss of significant influence) of its interest in a foreign operation through the sale, liquidation, repayment of
capital or abandon of all, or part of, that activity. The reduction in the carrying amount of a foreign operation, either because of
its own losses or because of the recognition of an impairment loss, does not lead to a reclassification to profit or loss of the
accumulated translation adjustment.
Recycling of translation adjustment is presented in the consolidated income statement within:
consolidated net income of discontinued operations, when a line of business or major geographical area is disposed of;
gains (losses) on disposal of investments and activities, when other businesses are disposed of;
reclassification of translation adjustment from liquidated entities, in the event of the liquidation or abandonment of an act ivity
without disposal.

Consolidated financial statements 2018 110
13.6 Non-controlling interests
(in millions of euros) 2018 2017 2016
Credit part of net income attributable to non-controlling interests (a) 271 278 326
o/ w Sonatel group 188 203 217
o/ w Orange Belgium group 15 18 37
o/ w Côte d'Ivoire subgroup 25 28 20
o/ w Jordan Telecom group 12 15 9
o/ w Orange Bank - - 30
Debit part of net income attributable to non-controlling interests (b) (67) (81) (17)
o/ w Orange Bank (59) (33) -
o/ w Orange Polska group (2) (43) (9)
Total part of net income attributable to non-controlling interests (a) + (b) 204 197 309
Credit part of comprehensive income attributable to non-controlling interests (a) 297 229 321
o/ w Sonatel group 195 180 200
o/ w Orange Belgium group 15 18 37
o/ w Côte d'Ivoire subgroup 26 25 22
o/ w Orange Bank - - 28
o/ w Jordan Telecom group 20 - 14
Debit part of comprehensive income attributable to non-controlling interests (b) (84) (73) (32)
o/ w Orange Bank (62) (32) -
o/ w Jordan Telecom group - (7) -
o/ w Orange Polska group (17) (17) (27)
Total part of comprehensive income attributable to non-controlling interests (a) + (b)
213 156 289
(in millions of euros) 2018 2017 2016
Dividends paid to minority shareholders 246 234 259
o/ w Sonatel group 190 185 186
o/ w Médi Telecom 20 16 15
o/ w Orange Belgium group 14 14 -
o/ w Orange Polska group - - 37
o/ w Jordan Telecom group 14 11 10
(in millions of euros)
December 31, 2018
December 31, 2017
December 31, 2016
Credit part of equity attributable to non-controlling interests (a) 2,594 2,542 2,609
o/ w Orange Polska group 973 988 1,005
o/ w Sonatel group 744 731 735
o/ w Orange Belgium group 273 268 265
o/ w Jordan Telecom group 164 156 175
o/ w Médi Telecom 153 143 158
Debit part of equity attributable to non-controlling interests (b) (14) (5) (5)
Total equity attributable to non-controlling interests (a) + (b) 2,580 2,537 2,604
Accounting policies
Commitments to purchase non-controlling interests (put options)
When the Group grants firm or contingent commitments to purchase non-controlling interests, the carrying amount of non-
controlling interests is reclassified to financial debt.
When the amount of the commitment exceeds the amount of the non-controlling interests, the difference is recorded as a
reduction in equity attributable to the owners of the parent company. Financial debt is re-measured at the end of each reporting
period in accordance with the contractual arrangement (at fair value or at present value if fixed price) and, in the absence of
any guidance provided by IFRS, against finance income or expense.
Non-controlling interests that are debtors
Total comprehensive income of a subsidiary is attributed to the owners of the parent company and to the non-controlling

Consolidated financial statements 2018 111
interests. In accordance with IFRS 10, this can result in the non-controlling interests having a deficit balance.
Transactions with owners
Each transaction with non-controlling interests of an entity controlled by the Group, when not resulting in a loss of control, is
accounted for as an equity transaction with no effect on the total comprehensive income.
13.7 Earnings per share
Net income
Net income, Group share, used for calculating basic and diluted earnings per share is determined according to the following
method:
(in millions of euros) 2018 2017 2016
Net income of continuing operations 1,954 1,843 2,813
Effect of subordinated notes (293) (267) (287)
Net income attribuable to the owners of the parent company - basic (adjusted) 1,661 1,576 2,526
o/w net income of continuing operations 1,661 1,547 273
o/w net income of discontinued operations 0 29 2,253
Impact of dilutive instruments:
TDIRA - 33 -
Net income attribuable to the owners of the parent company - diluted 1,661 1,609 2,526
o/w net income of continuing operations 1,661 1,580 273
o/w net income of discontinued operations 0 29 2,253
Number of shares
The weighted average number of shares used for calculating the basic and diluted earnings per share is presented below:
(number of shares)
December 31, 2018
December 31, 2017
December 31, 2016
Weighted average number of ordinary shares outstanding 2,656,683,856 2,659,421,767 2,654,045,007
Impact of dilutive instruments on number of ordinary shares:
TDIRA - 52,079,350 -
Free share award plan 1,419,415 435,150 -
Weighted average number of shares outstanding - diluted 2,658,103,271 2,711,936,267 2,654,045,007
The average market price of the Orange share in 2018 and 2017 is greater than the fair value adopted under the Orange Vision
2020 free share award plans and LTIP 2018 - 2020 (see Note 6.3). The number of shares corresponding to this difference is
dilutive at December 31, 2018 and December 31, 2017.
The TDIRA are not included in the calculation of diluted net earnings per share at December 31, 2018 and December 31, 2016,
since they are not dilutive.
The stock option plans granted to employees are expired at December 31, 2017 (see Note 6.3). At December 31, 2016 stock
options were not included in the calculation of diluted earnings per share, as they were out of the money.
Earnings per share
(in euros) 2018 2017 2016
Earning per share - basic 0.63 0.59 0.95
o/w earning per share of continuing operations 0.63 0.58 0.10
o/w earning per share of discontinued operations 0.00 0.01 0.85
Earning per share - diluted 0.62 0.59 0.95
o/w earning per share of continuing operations 0.62 0.58 0.10
o/w earning per share of discontinued operations 0.00 0.01 0.85

Consolidated financial statements 2018 112
Accounting policies
Earnings per share
The Group discloses both basic earnings per share and diluted earnings per share for continuing operations and discontinued
operations:
basic earnings per share are calculated by dividing net income for the year attributable to the equity holders of the Group,
after deduction of the interests of subordinated notes net of tax, by the weighted average number of ordinary shares
outstanding during the period;
diluted earnings per share are calculated based on the same net income, adjusted for the finance cost of dilutive debt
instruments, net of the related tax effect. The number of shares used to calculate diluted earnings per share takes into
account the conversion into ordinary shares of potentially dilutive instruments outstanding during the period. These
instruments are considered to be dilutive when they have the effect of reducing earnings per share of continuing operations.
When basic earnings per share are negative, diluted earnings per share are identical to basic earnings per share. In the event
of an issuance of shares at a price lower than the market price, and in order to ensure comparability of the reporting period
shown, the weighted average numbers of shares outstanding from current and previous periods are adjusted. Treasury shares
owned, which deducted from the consolidated equity, do not enter into the calculation of earnings per share.
NOTE 14 Unrecognized contractual commitments (excluding Orange Bank)
At December 31, 2018, Orange is not aware of having entered into any commitment involving entities controlled by the Group,
that may have a material effect on its current or future financial position, other than the commitments described in this Note.
14.1 Operating activities commitments
(in millions of euros) Total Less than one
year From one to five
years More than five
years
Operating activities commitments 20,078 5,914 7,929 6,234
Operating leases commitments 5,778 995 2,689 2,094
Handsets purchase commitments 1,837 1,837 - -
Transmission capacity purchase commitments 384 178 193 13
Other goods and services purchase commitments 3,439 1,133 1,679 627
Investment commitments 3,103 817 1,227 1,059
Public initiative networks commitments 4,333 797 1,984 1,552
Guarantees granted to third parties in the ordinary course of business
1,204 157 157 890
Operating leases commitments
Operating lease commitments mainly include property lease commitments. The other leases are leases relating to general
expenses (equipment, vehicles and other assets). Future finance lease payments are shown in Note 12.3.
(in millions of euros) Discounted value of future lease payments Minimum future lease payments
Property lease commitments 5,186 5,649
o/w technical activities 3,203 3,458
o/w shops/offices activities 1,983 2,191
Maturities are set forth below:

Consolidated financial statements 2018 113
(in millions of euros)
Minimum future lease
payments Less than
one year 1-2 years 2-3 years 3-4 years 4-5 years More than five years
Property lease commitments 5,649 939 816 710 584 507 2,092
The Group may choose whether or not to renew these leases upon expiration or replace them by other leases with renegotiated
terms and conditions. For some of them, a provision for onerous contracts has been booked (see Note 5.3).
The operating lease commitments correspond to the outstanding minimum future lease payments until the normal date of
renewal of the leases or the earliest possible notice date. After periodic revaluation of the leases, these amounts are
discounted. The rate used corresponds to the marginal cost of debt.
The information relative to operating leases is provided in accordance with the currently-applicable standards and
interpretations. The first application of IFRS 16 as of January 1, 2019 will cause the Group to provide different information,
mainly due to:
different application scopes: the Group will designate a contract as a leasing contract when it gives the lessee the right to
control the use of a given asset, including when a service contract includes a lease component (excluding off-balance-sheet
commitments for operating leases). The Group has also chosen to use the two exemptions authorized under IFRS 16,
namely contracts with a duration of less than 12 months and those for which the new value of the underlying asset is less
than 5,000 euros (see Note 2.4.2);
assessment of rents: the off-balance-sheet commitments use a minimum duration without factoring in extension options that
the lessee has the reasonable certainty of exercising, including a periodic revaluation of the rents and the rent-free periods
based on minimum future payments.
The property lease commitments in France and Spain represent respectively 59% and 10% of the total property lease
commitments.
Transmission capacity purchase commitments
Transmission capacity purchase commitments as at December 31, 2018 represented 384 million euros. These include 277
million euros for the provision of satellite transmission capacity (comprising contracts with different commitment maturities up to
2023).
Other goods and services purchase commitments
The Group’s other goods and services purchase commitments are primarily related to the network and the purchase of content.
At December 31, 2018, these commitments include:
the purchase of broadcasting rights for an amount of 798 million euros;
“Tower Co” (site management) contracts in Africa: these commitments amounted to 522 million euros. On January 1, 2019,
the lease contracts for the sites will lead to supplying different information on the valuation of these commitments;
the network maintenance for 215 million euros;
the maintenance of submarine cables for which Orange has joint ownership or user rights, for an overall amount of 159
million euros.
Investment commitments
At the end of December 2018, investment commitments amounted to 3,103 million euros.
In addition to these commitments, which are expressed in monetary terms, the Group made certain commitments to the national
regulatory authorities such as ensuring certain coverage of the population concerning by fixed or mobile networks, particular ly in
in the context of assignment of licenses and quality of service. These commitments will require investment expenditure in future
years to roll out and enhance the networks. They are not shown in the table above if they have not been expressed in monetary
terms, which is usually the case. The Group has accordingly agreed to meet the following conditions:
In France:
in the context of the provisions of article L. 33-13 of the French Postal and Electronic Communications Code, which specifies
that the electronic communications ministry may accept commitments made by operators likely to contribute to the
development and coverage of low-density areas by electronic communication networks and promote access by operators to
these networks, Orange proposed to undertake to deploy FttH within its deployment scope in the AMII areas and unless
refusal by third parties:
by the end of 2020, 100% of housing units and professional premises will be open to the marketing of FttH offers
(including a maximum of 8% of premises connectable upon request);

Consolidated financial statements 2018 114
by the end of 2022, 100% of housing units and professional premises will be made connectable. After the opinion of the
Arcep dated June 12, 2018, the proposals for the undertakings of Orange were accepted by the government on July 26,
2018.
on January 14, 2018, the Orange Group and the other French mobile operators signed an agreement (the "New Deal") to
ensure better mobile coverage of French territory, particularly rural areas. This agreement includes enhanced coverage
obligations, which are included for the period 2018-2021 in our licenses in force in the bands 900 MHz, 1,800 MHz and
2,100 MHz, and for the post 2021 period, in the new licenses for 900 MHz, 1,800 MHz and 2,100 MHz assigned on
November 15, 2018:
targeted programs for the improvement of coverage, with the coverage of 5,000 areas by operators by 2029;
the generalization of 4G by the end of 2020 on almost all existing mobile sites;
the acceleration of the coverage of the transport routes, ensuring that the main road and rail routes have 4G coverage;
the supply of a fixed 4G service and the extension of the service to 500 additional sites upon request from the
government by 2020;
the widespread use of telephone coverage inside buildings, proposing voice over Wi-Fi and SMS over Wi-Fi offers and
offers involving the indoor coverage of buildings upon request;
the improvement of reception quality throughout the country, particularly in rural areas, with good coverage (according to
the Arcep decision No. 2016-1678 relative to publications giving information on mobile coverage) by 2024/2027.
in order to cope with the exceptional deterioration that affected its network in 2018 (storms, theft of cables, deterioration due
to the recent protest movements, etc.), and be sure to fulfil its commitments in terms of universel service provision, Orange
put a plan involving a 17% increase in the maintenance budget compared to 2017 and hired 200 additional technicians.
in 2015, in France, when the frequencies in the 700 MHz band were allocated:
coverage obligations in “priority deployment areas” (40% of the country within 5 years, 92% within 12 years and 97.7%
within 15 years) and in “white area” not yet covered by a broadband network (100% within 12 years), at the level of
priority road routes (100% within 15 years) and at the level of the national rail network (60% within 7 years, 80% within 12
years and 90% within 15 years).
in 2011, in France, when the frequencies in the 2.6 GHz and 800 MHz bands were allocated:
an optional commitment to host mobile virtual network operators (MVNOs) on certain technical and pricing terms under
Full MVNO schemes;
an obligation to provide mobile coverage with theoretical maximum download speeds of at least 60 Mbps per user (25%
of the country within 4 years and 75% within 12 years for the 2.6 GHz band, 98% of the country within 12 years and
99.6% within 15 years for the 800 MHz band) which can be met by using both the allocated frequencies and other
frequencies;
for the 800 MHz band, specifically: a coverage obligation in priority areas (40% of the country within 5 years, 90% within
10 years) with no obligation to provide roaming services, a coverage obligation in each department (90% within 12 years,
95% within 15 years) and an obligation to pool resources in communities covered by the “dead zone” program.
In Romania:
in 2012, in Romania, when the frequencies in the bands from 800 MHz to 2.6 GHz were allocated:
an obligation to provide mobile coverage of at least 95% of the population within 225 of 732 localities with mobile
communication services in UMTS or LTE technologies, for the 800 MHz and 900 MHz bands;
an obligation to provide voice services coverage of at least 98% of the population of lightly inhabited areas, for 900 MHz
and 1.8 GHz bands;
an obligation to provide IP service coverage in at least 60% of lightly inhabited areas;
an obligation to provide mobile IP access coverage to 30% of the population by April 5, 2019, for 1.8 GHz and 2.6 GHz
bands.
In Africa & Middle-East:
in 2016, in Senegal, when the 4G license was awarded and the license for mobile 2G and 3G was renewed:
a coverage obligation of 90% of the population in 3 years;
an obligation to cover in 5 years all territory in the inhabited border areas of Senegal whose number of inhabitants is
equal to or greater than 200;
a coverage obligation on national roads and highways in 2 years.
in 2016, in Egypt, when the 4G license was granted:
an obligation to provide 4G coverage of 11% of the population in one year, 42.5% in four years, 69.5% in six years and
70% within ten years.

Consolidated financial statements 2018 115
Non-compliance with these obligations could result in fines and other sanctions ultimately including the withdrawal of licenses
awarded. Management believes that the Group has the ability to fulfill these commitments towards government authorities.
Commitments related to Public Initiative Networks
As part of the deployment of the High and Very High Speed network in France, the Group entered into contracts via Public
Initiative Networks (mainly public service delegation and public-private partnerships contracts). The commitments under these
network construction, concession and operation contracts amounted to 4,333 million euros at December 31, 2018 In addition to
the guarantees given by Orange on behalf of the Public Initiative Networks, the commitments will result in the recognition of
3,619 million euros of intangible assets and 376 million euros of financial receivables. The expirations are staggered out to
2043.
Guarantees granted to third parties in the ordinary course of business
Commitments made by the Group to third parties in the ordinary course of business represented 1,203 million euros as at
December 31, 2018. They included performance guarantees amounting to 485 million euros granted to certain Enterprise
customers, in particular as part of the securing of networks and remote access.
The amount of guarantees granted by the Group to third parties (financial institutions, partners, customers and government
agencies) to cover the performance of the contractual obligations of non-consolidated entities is not significant. Guarantees
granted by the Group to cover the performance of the contractual obligations of the consolidated subsidiaries are not considered
as unrecognized contractual commitments, as they would not increase the Group’s commitments in comparison to the
underlying obligations of the consolidated subsidiaries.
14.2 Consolidation scope commitments
Asset and liability warranties granted in relation to disposals
Under the terms of agreements between certain Group companies and the acquirers of certain assets, the Group is subject to
warranty clauses relating to assets and liabilities. Nearly all material sale agreements provide for ceilings on these warranties.
At December 31, 2018, the main warranties in effect were the following:
the uncapped warranties granted to the EE joint venture when contributing the operations in the United Kingdom, concerning
the restructuring of equity investments and assets done prior to the contribution expiring in 2022;
a warranty given to BT as part of the EE sale, backed 50/50 by Orange Group and Deutsche Telekom as tax and operating
warranties, except for events ascribable solely to one or the other, and capped at the contractually fixed sale price of 5.1
billion pounds sterling (5.7 billion euros converted at the exchange rate on December 31, 2018) as Orange’s share, which
will expire in 2023. Information on the final terms of EE’s disposal is presented in Note 3.2;
tax-related warranties, capped at 400 million euros, granted to Deutsche Telekom as part of the disposal of the Group’s
mobile and Internet operations in the Netherlands in 2007. These warranties will expire at the end of the statutory limitation
period, in 2019;
standard warranties granted to Vivendi as part of the disposal of its 90% stake in Dailymotion in 2015 and the remaining
10% in 2017. These warranties will expire at the end of the statutory limitation period;
miscellaneous standard warranties granted to buyers of real estate sold by the Group.
Orange believes that the risk of these warranties being enforced is remote and that the potential consequences of their being
called are not material with respect to the Group’s results and financial position.
Commitments relating to securities
Under the terms of agreements with third parties, Orange can make or receive commitments to purchase or to sell securities.
The on-going commitments at December 31, 2018 are not likely to have material impacts on the Group’s financial position.
Orange Tunisie
Under the terms of the shareholders’ agreement with Investec dated May 20, 2009, Orange has a call option giving it the right to
purchase at market value 1% of the share capital of Orange Tunisie plus one share, subject to regulatory authorizations. If this
option was exercised, Orange would take control of Orange Tunisie. Investec would then have the right to sell to Orange 15% of
the share capital of Orange Tunisie at market value.
Korek Telecom
Several shareholder disputes exist between the joint venture formed between Agility and Orange and its Iraqi co-shareholder in
the capital of the Iraqi operator Korek Telecom. These disputes, which relate notably to the exercise of the call option on 7% of

Consolidated financial statements 2018 116
Korek Telecom, are the subject of preliminary procedures and arbitrational and judicial litigation. Also, following the decision by
the Iraqi regulatory authority (CMC) of 2014 to cancel the partnership of March 2011 between Korek and Orange/Agility, the
Baghdad administrative high court of appeal confirmed, on January 18, 2018, the decision of the administrative tribunal which
had rejected the appeal of Korek Telecom against the decision of the CMC. Orange has undertaken actions in order to enforce
its rights.
Orange Bank
In accordance with the shareholders’ agreement signed on October 4, 2016:
Orange gave a put option to Groupama on 20% of the equity in Orange Bank, recognized as a financial liability and
exercisable at fair value within three months of October 4, 2023 and thereafter in three-month periods every two years;
Groupama gave a call option to Orange on the remainder of its equity interest in Orange Bank, exercisable at fair value after
the exercise of its put option;
Orange and Groupama committed over a period of 6 years, namely until 2022, to participate, within the limit of the
percentage of interest held, in the capital increases of Holdco necessary to financing working capital requirements (CET1
ratio).
14.3 Financing commitments
The Group’s main commitments related to borrowings are set out in Note 12.
Orange has pledged certain investment securities and other assets to financial institutions or used them as collateral to cover
bank borrowings and credit lines.
Guarantees granted to some lending institutions to finance consolidated subsidiaries are not set out below.
Assets covered by commitments
The items presented below do not include the impact of the regulation on the transferability of the assets or the possibility of
contractual restrictions in network asset sharing agreements.
At December 31, 2018 Orange has no material pledge on its subsidiaries’ securities.
(in millions of euros) December 31, 2018 December 31, 2017 December 31, 2016
Assets held under finance leases 574 528 552
Non-current pledged, mortgaged or receivership assets (1)
453 107 121
Collateralized current assets 21 19 27
Total 1,048 654 700
(1) Non-current pledged, mortgaged or receivership assets are shown excluding cash collateral deposits, which are presented in Note 11.7.
Non-current pledged or mortgaged assets comprise the following assets given as guarantees:
December 31, 2018 Total in statement of financial position
(a)
Amount of asset pledged, mortgaged
or receivership (b) Percentage
(b)/(a) (in millions of euros)
Intangible assets, net (excluding goodwill) 14,073 107 1 %
Property, plant and equipment, net 27,693 - -
Non-current financial assets 3,899 346 9 %
Other (1)
29,037 - -
Total 74,702 453- 1%
(1) This item mainly includes net goodwill, interests in associates, net deferred tax assets and non-current derivatives assets.
NOTE 15 Activities of Orange Bank
15.1 Financial assets and liabilities of Orange Bank
The financial statements of Orange Bank were put into the format of Orange group’s consolidated annual financial statements
and differ from a presentation that complies with the banking format.
In order to improve the readiness of financial statements and to be able to distinguish the performance of telecom activities from
the performance of Orange Bank, the notes related to financial assets and liabilities as well as financial income or expenses are
split to respect these two business areas.

Consolidated financial statements 2018 117
Note 11 presents the assets, liabilities and related gains and losses specific to telecom activities and Note 15 concerns the
activities of Orange Bank with regard to its assets and liabilities, with net financial income being not material.
The following table reconciles (i) the assets and liabilities for each of these two areas (intra-group transactions between telecom
activities and Orange Bank are not eliminated) with (ii) the consolidated statement of financial position at December 31, 2018.
(in millions of euros)
Orange consolidated
financial statements
O/w telecom activities Note
O/w Orange Bank Note
O/w eliminations telecom activities
/ bank
Non current loans and receivables of Orange Bank 1,617 - 1,617 15.1.1 -
Non-current financial assets 2,282 2,309 11.7 - (27) (1)
Non-current derivatives assets 263 263 11.8 - 15.1.3 -
Current financial assets related to Orange Bank activities 3,075 - 3,075 15.1.1 -
Current financial assets 2,748 2,748 11.7 - -
Current derivatives assets 139 122 11.8 17 15.1.3 -
Cash and cash equivalents 5,634 5,081 553 -
Non current debts related to Orange Bank operations 0 - 27 15.1.2 (27)
(1)
Non-current financial liabilities 26,749 26,749 11.3 - -
Non-current derivatives liabilities 775 712 11.8 63 15.1.3 -
Current financial liabilities related to Orange Bank liabilities 4,835 - 4,835 15.1.2 -
Current financial liabilities 7,270 7,270 11.3 - -
Current derivatives liabilities 133 133 11.8 - 15.1.3 -
(1) Loan granted by Orange SA to Orange Bank.
Accounting policies
Classification of the bank’s balance sheet items as current and non-current was done to match the Group’s financial
statements in 2016.
Since the concept of current or non-current is non-existent in bank accounting, financial assets and liabilities related to loans
and borrowings to customers or credit institutions (the ordinary activities of a bank) are all classified since 2017 as current for
all periods presented.
With regard to other financial assets and liabilities, classification as current and non-current was made in light of both the
original intention of management and the nature of the assets and liabilities in question. For instance, with regard to Orange
Bank’s other financial assets, since investments are managed by portfolio, only the transaction portfolios (Financial assets at
fair value through profit or loss) were recognized in current financial assets.
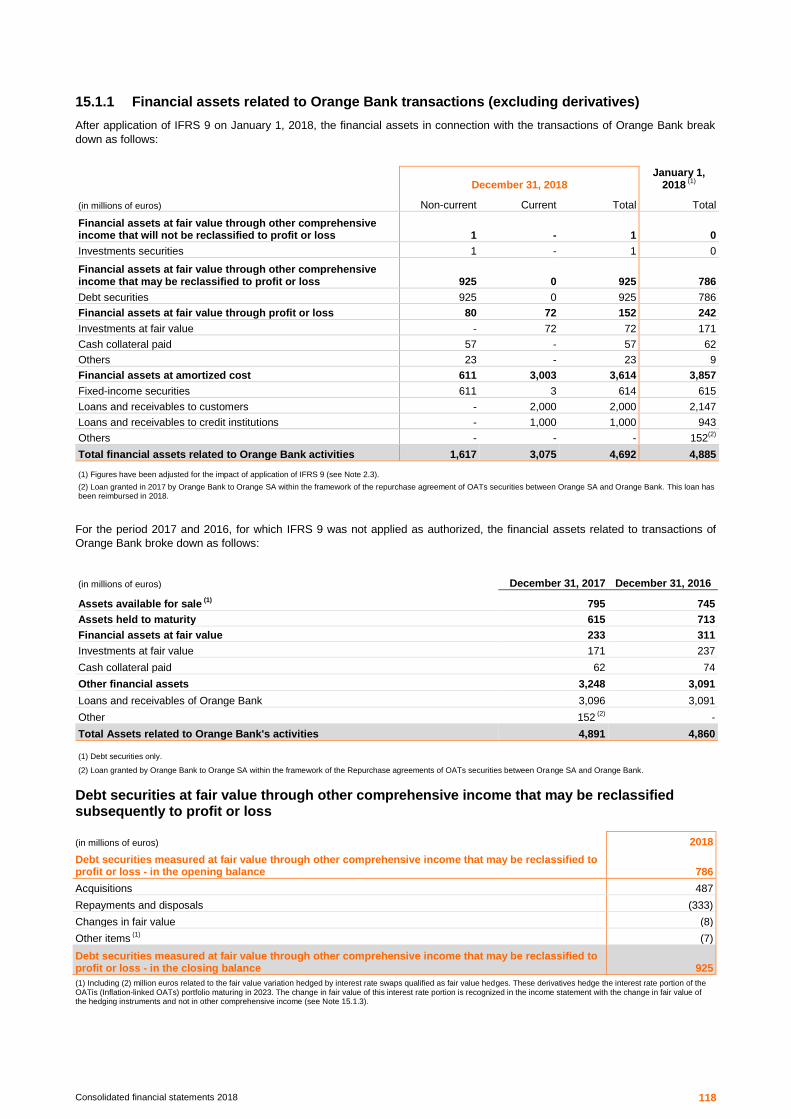
Consolidated financial statements 2018 118
15.1.1 Financial assets related to Orange Bank transactions (excluding derivatives)
After application of IFRS 9 on January 1, 2018, the financial assets in connection with the transactions of Orange Bank break
down as follows:
December 31, 2018 January 1,
2018 (1)
(in millions of euros) Non-current Current Total Total
Financial assets at fair value through other comprehensive income that will not be reclassified to profit or loss 1 - 1 0
Investments securities 1 - 1 0
Financial assets at fair value through other comprehensive income that may be reclassified to profit or loss 925 0 925 786
Debt securities 925 0 925 786
Financial assets at fair value through profit or loss 80 72 152 242
Investments at fair value - 72 72 171
Cash collateral paid 57 - 57 62
Others 23 - 23 9
Financial assets at amortized cost 611 3,003 3,614 3,857
Fixed-income securities 611 3 614 615
Loans and receivables to customers - 2,000 2,000 2,147
Loans and receivables to credit institutions - 1,000 1,000 943
Others - - - 152(2)
Total financial assets related to Orange Bank activities 1,617 3,075 4,692 4,885
(1) Figures have been adjusted for the impact of application of IFRS 9 (see Note 2.3).
(2) Loan granted in 2017 by Orange Bank to Orange SA within the framework of the repurchase agreement of OATs securities between Orange SA and Orange Bank. This loan has been reimbursed in 2018.
For the period 2017 and 2016, for which IFRS 9 was not applied as authorized, the financial assets related to transactions of
Orange Bank broke down as follows:
(in millions of euros) December 31, 2017 December 31, 2016
Assets available for sale (1)
795 745
Assets held to maturity 615 713
Financial assets at fair value 233 311
Investments at fair value 171 237
Cash collateral paid 62 74
Other financial assets 3,248 3,091
Loans and receivables of Orange Bank 3,096 3,091
Other 152 (2)
-
Total Assets related to Orange Bank's activities 4,891 4,860
(1) Debt securities only.
(2) Loan granted by Orange Bank to Orange SA within the framework of the Repurchase agreements of OATs securities between Orange SA and Orange Bank.
Debt securities at fair value through other comprehensive income that may be reclassified subsequently to profit or loss
(in millions of euros) 2018
Debt securities measured at fair value through other comprehensive income that may be reclassified to profit or loss - in the opening balance 786
Acquisitions 487
Repayments and disposals (333)
Changes in fair value (8)
Other items (1)
(7)
Debt securities measured at fair value through other comprehensive income that may be reclassified to profit or loss - in the closing balance 925
(1) Including (2) million euros related to the fair value variation hedged by interest rate swaps qualified as fair value hedges. These derivatives hedge the interest rate portion of the OATis (Inflation-linked OATs) portfolio maturing in 2023. The change in fair value of this interest rate portion is recognized in the income statement with the change in fair value of the hedging instruments and not in other comprehensive income (see Note 15.1.3).

Consolidated financial statements 2018 119
(in millions of euros) 2018
Profit (loss) recognized in other comprehensive income during the period (8)
Reclassification in net income during the period -
Other comprehensive income related to Orange Bank (8)
The data below is presented according to IAS 39 (formerly "Assets available for sale").
(in millions of euros) 2017 2016
Assets available for sale - in the opening balance 745 -
First integration of Orange Bank 15 1,018
Acquisitions 325 -
Repayments and disposals (301) (268)
Change in fair value recognized in other comprehensive income during the period 3 (5)
Reclassifications and other items 8 -
Assets available for sale - in the closing balance 795 745
(in millions of euros) 2017 2016
Profit (loss) recognized in other comprehensive income during the period 3 (5)
Reclassification in net income during the period - -
Other comprehensive income related to Orange Bank 3 (5)
Current loans and receivables of Orange Bank
Loans and receivables of Orange Bank are composed of loans and receivables to customers and credit institutions.
In the context of adapting the bank’s accounts into the Group’s financial statements, the following have been considered as loan
and advances to customers: clearing accounts and other amounts due, as well as amounts related to securities transactions on
behalf of customers.
(in millions of euros)
December 31, 2018
January 1st 2018
(1)
December 31, 2017
December 31, 2016
Overdrafts 910 1,000 1,000 1,084
Housing loans 824 765 765 719
Investment loans 206 246 246 264
Current accounts 21 31 31 70
Other 39 105 111 80
Total loans and receivables to customers 2,000 2,147 2,153 2,217
Overnight deposits and loans 850 830 830 790
Loans and receivables 85 55 55 53
Other 65 58 58 31
Total loans and receivables to credit institutions 1,000 943 943 874 (1) Figures have been adjusted for the impact of application of IFRS 9 (see Note 2.3).
Accounting policies
Financial assets
Financial assets at fair value through profit/loss (FVR)
Certain investment securities which are not consolidated or equity-accounted, and cash investments such as negotiable debt
securities, deposits and mutual funds (UCITS), that are compliant with the Group’s risk management policy or investment
strategy, may be designated by Orange Bank as being recognized at fair value through profit or loss. These assets are
recognized at fair value at inception and subsequently. All changes in fair value are recorded in profit or loss.
Financial assets at fair value through other comprehensive income that may not be reclassified to profit or /loss (FVOCI)
Investment securities which are not consolidated or equity-accounted are, subject to exceptions, recognized as assets at fair
value through other comprehensive income that may not be reclassified to profit or loss. They are recognized at fair value at
inception and subsequently. Temporary changes in value and gains (losses) on disposals are recorded in other comprehensive
income that may not be reclassified to profit or loss.
Financial assets at fair value through other comprehensive income that are or may be reclassified subsequently to profit

Consolidated financial statements 2018 120
or loss (FVOCIR)
Assets at fair value through other comprehensive income that are or may be reclassified subsequently to profit or loss mainly
include investments in debt securities. They are recognized at fair value at inception and subsequently. Temporary changes in
value are recorded in other comprehensive income that are or may be reclassified subsequently to profit or loss. In case of
disposal, the cumulative profit (or loss) recognized in other comprehensive income is reclassified to profit or loss.
Financial assets at amortized cost (AC)
This category mainly includes miscellaneous loans and receivables and fixed income securities. These instruments are
recognized at fair value at inception and are subsequently measured at amortized cost using the effective interest method.
Impairment and provisions are recorded as soon as loans are granted or commitments are concluded, without waiting for the
appearance of an objective indication of impairment. Impairment and provisions are updated as the credit risk evolves (see
below "Impairment of financial assets").
Impairment of financial assets
In accordance with IFRS 9, debt instruments classified as financial assets at amortized cost or as financial assets at fair value
through other comprehensive income, rental receivables, financing commitments and financial guarantees given are
systematically subject to impairment or a provision for expected credit loss. These impairments and provisions are recorded as
soon as loans are granted, commitments are concluded or bond securities are acquired, without waiting for the appearance of
an objective indication of impairment.
To do this, the financial assets concerned are split into three categories according to the change in credit risk observed since
their initial accounting and a depreciation is recorded on the amount outstanding of each of these categories as follows:
performing loans: the calculation of losses expected is made on a 12-months basis, and the financial income (interest) is
calculated on the basis of the instrument's gross amount;
impaired loans: if the credit risk has significantly worsened since the debt was booked to the balance sheet, the expected
losses, estimated over the duration of the loan, are recognized and the financial income (interest) is calculated based on
the gross amount of the instrument;
Doubtful loans: the expected loss, estimated over the duration of the loan, is depreciated. The financial income is calculated
on the basis of the amount of the instrument net of the depreciation.
As a reminder, before the application of IFRS 9, the accounting policies relative to financial assets of banking
activities were as follows:
Current loans and receivables of Orange Bank
Assets related to Orange bank activities are classified in the IAS 39 category of “loans and receivables”. They are initially
recorded at fair value or its equivalent, which is, as a general rule, the net amount originally issued, and which should include
the origination costs directly related to the transaction as well as the commissions received or paid, analyzed as an adjustment
to the effective return on the loan.
The loans and receivables are subsequently valued at amortized cost, and interests, as well as transactions costs and
commissions included in the initial value of the credits contribute to the net income for these transactions over the term of the
credit, calculated on the basis of effective interest rate.
In accordance with IAS 39, loans and receivables are impaired when one or more evidences of depreciation have occurred
after the recognition of these receivables. The receivables thus identified are then impaired on an individual basis or on a
collective basis. Expected losses are accounted for as impairments, equal to the difference between the carrying amount of the
loans (amortized cost) and the total of estimated future cash flows, discounted with the initial effective interest rate, or in the
form of discounts for restructured loans due to default from customers.
Impairment is measured as the difference between the carrying value prior to impairment and the discounted value, at the
initial rate of the receivable, of the components deemed to be recoverable (principal, interest, guarantees, etc.). The changes in
the value of the loans impaired are recorded in the income statement under “Cost of risk” included in other operating expenses.
When these changes in value are positive, reflecting a subsequent improvement, they are reversed in the income statement,
within the same account.
The “Cost of risk” account dedicated to Orange Bank and part of the “other operating expenses”, corresponds to provisions and
reversals related to banking risks (in particular, counterparty risks and operational risks).
Assets available for sale
The assets available for sale include fixed income securities or variable income securities that do not fall within the definition of
other categories of financial assets. They are recognized at fair value at inception and subsequently.
Temporary changes in value are recorded as “Gains (losses) on assets available for sale” within other comprehensive income.
The long term impairments associated with the assets available for sale are recorded under “Cost of risk” (within other
operating expenses) when the assets are fixed rate securities, but they are recorded in “Net Gains (losses) on financial asse ts
available for sale” when the assets are floating-rate securities.
Investments held to maturity

Consolidated financial statements 2018 121
This category includes fixed-rate securities that the bank intends to hold until their maturity. They must not be disposed of prior
to maturity and they are accounted for at amortized cost.
Impairment is recognized on these securities as soon as there is an objective evidence of the existence of an event
subsequent to the acquisition of the security that is likely to generate a measurable loss as a result of counterparty risk.
Impairment is measured as the difference between the carrying value prior to impairment and the discounted value, with the
initial rate, of the components deemed to be recoverable (principal, interest, guarantees, etc.). The changes in value thus
impaired are recorded in the income statement, under the “Cost of risk” account (within other operating expenses). When these
changes in value are positive, reflecting a subsequent improvement, they are reversed in the income statement under “Cost of
risk” within other operating expenses.
15.1.2 Financial liabilities related to Orange Bank transactions (excluding derivatives)
(in millions of euros) December 31, 2018 December 31, 2017 December 31, 2016
Payables to customers 3,396 3,685 3,910
Debts with financial institutions 1,103 975 454
Deposit certificate 335 281 143
Other 28 27 27
Total Financial liabilites related to Orange Bank's activities(1)
4,862 4,968 4,534
(1) O/w 27 million of euros of non current financial liabilities in 2018, 2017 and 2016.
Debts related to Orange Bank operations are composed of payables to customers and debts with financial institutions.
(in millions of euros) December 31, 2018 December 31, 2017 December 31, 2016
Current accounts 2,538 2,800 3,087
Passbooks and special savings accounts 776 716 672
Other 82 169 151
Customers borrowings and deposits 3,396 3,685 3,910
Term borrowings and advances 467 466 454
Securities delivered under repurchase agreements 636 509 -
Total debts with financial institution 1,103 975 454
15.1.3 Derivatives of Orange Bank
Derivatives qualified as fair value hedges
The main unmatured fair value hedges at the end of 2018 and put in place by Orange Bank concern the following interest rate
swaps:
337 million euros notional (of which 80 million euros maturing in 2019, 177 million euros maturing between 1 and 5 years
and 80 million euros at more than 5 years) hedging a portion of housing loans portfolio. The fair value of these derivatives as
at December 31, 2018 is (2) million euros;
210 million euros of notional hedging a portfolio of inflation-indexed fungible Treasury bonds (Obligation Assimilable du
Trésor or OATi), with the same amount and the same maturity in 2023. The fair value of these swaps as at December 31,
2018 is (55) million euros;
14 million euros notional hedging the securities portfolio, whose fair value as at December 31, 2018 was nearly zero.
The ineffective portion related to those hedging strategies recognized in 2018 income statement is not material.
Trading Derivatives
Orange Bank put into place a swap with a notional amount of 39 million euros maturing in 2019 to naturally hedge the
issuance of a fixed-rate medium term negotiable bond (Bon à Moyen Terme Négociable, or BMTN). The hedging derivative
reproduces the performance of the BMTN with a credit institution remunerated at a floating rate. The fair value of this
derivative instrument at the end of 2018 is 17 million euros. The net effects of this hedging strategy on the 2017 income
statement are not material.
Orange Bank put into place interest rate swaps, as economic hedges (not designated as hedges under IFRS) of fungible
Treasury bonds (Obligation Assimilable du Trésor or OAT) for a total notional total amount of 143 million euros, maturing
from 2019 to 2023 and with a total fair value as at December 31, 2018 of (6) million euros. The net effects of this hedging
strategy on the income statement are not material.
Orange Bank put into place futures with a notional amount of 2,025 million euros. The notional amount of these derivatives is
only gives an indication of the volume of outstanding contracts on the financial instrument market and does not reflect the
market risks associated with such instruments or the nominal amount of the hedged instruments.

Consolidated financial statements 2018 122
15.2 Information on market risk management with respect to Orange Bank activities
“Orange Bank” operating segment has its own risk management system, in accordance with the French banking regulation. In
terms of banking regulation, Orange Bank is under the supervision of the French Prudential Supervision and Resolution
Authority (Autorité de contrôle prudentiel et de résolution, or ACPR) and must at all times comply with capital requirements in
order to withstand the risks associated with its activities.
Orange Bank’s activities expose it to all of the risks defined by the order of November 3, 2014, relating to the internal control of
companies in the sectors of banking, payment services and investment services subject to the control of the ACPR:
credit risk: risk of loss incurred in the event of default of a counterparty or counterparties considered as the same beneficiary;
market risk: risk of loss due to movements in market prices;
operational risk: risk resulting from an inadequacy or a failure due to procedures, staff, IT systems or to outside events,
including events that are unlikely to occur but that would imply a risk of material loss. Operational risk includes risks of
internal and external fraud;
interest rate risk: risk related to changes in interest rates on the on-balance sheet and off-balance sheet transactions,
excluding, as applicable, transactions exposed to market risks;
liquidity risk: risk that the company would not be able to meet its commitments or not be able to unwind or offset a position
due to the market situation;
inter-mediation risk on investment service providers: risk of default by a customer or counterparty in the context of a financial
instrument transaction in which the company provides a performance guarantee.
The size of the bank and its moderate risk profile led to a choice of standard methods regarding the application of Regulation
No. 575/2013 of the European Parliament and Council on June 26, 2013.
Orange Bank does not intervene on complex products. For market operations, the strategy defines, on one hand, the limits
implemented and controlled and, on the other hand, the quality of the authorized signatories. In addition, the Bank has defined
and regularly tests its business continuity system. The Bank has also undertaken, as completely as possible, the identification
and assessment of its operational risks, for which it also follows occurrences.
With regard to regulations, and in particular Titles IV and V of the Order of November 3, 2014, the Bank’s Executive Committee
has set, upon recommendation of the Risk Management Division, a risk policy in particular regarding customers and risks,
modalities and rules for offering credits and for delegations of authority.
In addition, the Risk Management Department analyzes and monitors risks, carries out the necessary controls and produces
reports in several committees: the Credit Committee (management of counterparty risk), Risks and Audit Committee
(management of operational risks), ALM Committee (management of market risk and liquidity risk) and the Executive
Committee.
15.2.1 Remaining term to maturity
The following table details the remaining term of Orange Bank’s financial assets and liabilities, calculated on the base of the
contractual maturity dates:
maturity-by-maturity for amortizable transactions;
for roll-over loans, since renewals cannot be presumed, the renewal dates are taken to be the final maturity date;
since derivatives are interest rate swaps, they are not subject to any exchange of notional and therefore are not distributed by
maturity.

Consolidated financial statements 2018 123
(in millions of euros) Note December 31,
2018 2019 2020 to 2023 2024 and
beyond
Investments securities 15.1.1 1 - 1 -
Debt securities 15.1.1 925 222 657 46
Investments at fair value 15.1.1 72 22 50 -
Fixed-income securities 15.1.1 614 104 378 132
Loans and receivables to customers 15.1.1 2,000 471 924 605
Loans and receivables to credit institutions 15.1.1 1,000 914 86 -
Other financial assets and derivatives 97(1)
97 - -
Total financial assets 4,709 1,830 2,096 783
Payable to customers 15.1.2 3,396 3,386 5 5
Debts with financial institutions 15.1.2 1,103 657 443 3
Deposit certificate 15.1.2 335 153 182 -
Other financial liabilities and derivatives 91(2)
91 - -
Total financial liabilities 4,925 4,287 630 8
(1) Including the bank cash collateral paid for 57 million euros and derivatives assets for 17 million euros.
(2) Including derivatives liabilities for 63 million euros and loan from Orange SA to Orange Bank for 27 million euros.
15.2.2 Fair value of financial assets and liabilities of Orange Bank
December 31, 2018
(in millions of euros)
Classification under IFRS
9(1)
Book value Estimated fair value
Level 1 and cash Level 2 Level 3
Loans and receivables 15.1.1 AC 3,000 3,000 - 3,000 -
Financial assets at amortized cost 15.1.1 AC 614 641 605 36 -
Financial assets at fair value through profit or loss 15.1.1 FVR 152 152 152 - -
Debt securities 15.1.1 FVOCIR 925 925 862 63 -
Equity securities 15.1.1 FVOCI 1 1 1 - -
Cash and cash equivalent(2)
15.1.1 AC 553 553 553 - -
Financial liabilites related to Orange Bank's activities 15.1.2 AC (4,862) (4,862) - (4,862) -
Derivatives, net amount(3)
15.1.3 (46) (46) - (29) (17)
(1) "AC" stands for "amortized cost", "FVR " stands for "fair value through profit or loss", "FVOCI" stands for "fair value through other comprehensive income that will not be reclassified to profit or loss", "FVOCIR" stands for "fair value through other comprehensive income that may be reclassified to profit or loss".
(2) Includes only cash.
(3) The classification for derivatives instruments depends on their hedging qualification.

Consolidated financial statements 2018 124
December 31, 2017
(in millions of euros) Classification under IAS 39 Book value
Estimated fair value
Level 1 and cash Level 2 Level 3
Loans and receivables 15.1.1 L&R 3,096 3,096 - 3,096 -
Financial assets, excluding derivatives 15.1.1 1,795 1,785 1,482 303 -
Assets held to maturity HTM 615 605 581 24 -
Assets available for sale AFS 795 795 730 65 -
Investments at fair value FVR 171 171 171 - -
Other L&R 214 214 - 214 -
Cash and cash equivalent 477 477 477 - -
Trade payables LAC (93) (93) - (93) -
Debts related to Orange Bank operations 15.1.2 LAC (4,660) (4,660) - (4,660) -
Financial liabilities, excluding derivatives LAC (308) (308) - (252) (56)
Derivatives, net amount 15.1.3 (60) (60) - (73) 13
(1) "HTM" stands for "held to maturity", "AFS " stands for "available for sale", "L&R" stands for "loans and receivables", "FVR" stands for "fair value through P&L", "LAC" stands for "liabilities at amortized costs".
(2) IAS 39 classification for derivatives instruments depends on their hedging qualification.
December 31, 2016
(in millions of euros) Classification under IAS 39 Book value
Estimated fair value
Level 1 and cash Level 2 Level 3
Loans and receivables 15.1.1 L&R 3,091 3,091 - 3,091 -
Financial assets, excluding derivatives 15.1.1 1,769 1,714 1,251 389 74
Assets held to maturity HTM 713 658 592 66 -
Assets available for sale AFS 745 745 659 86 -
Investments at fair value FVR 237 237 - 237 -
Other L&R 74 74 - - 74
Cash and cash equivalent 89 89 89 - -
Trade payables LAC (52) (52) - (52) -
Debts related to Orange Bank operations 15.1.2 LAC (4,364) (4,364) - (4,364) -
Financial liabilities, excluding derivatives LAC (170) (170) - (170) -
Derivatives, net amount 15.1.3 (55) (55) - - (55)
(1) "HTM" stands for "held to maturity", "AFS " stands for "available for sale", "L&R" stands for "loans and receivables", "FVR" stands for "fair value through P&L", "LAC" stands for "liabilities at amortized costs".
(2) IAS 39 classification for derivatives instruments depends on their hedging qualification.
15.3 Orange Bank’s unrecognized contractual commitments
As at December 31, 2018, Orange Bank is not aware of having entered into any commitment that may have a material effect on
its current or future financial position, other than the commitments mentioned below.
Commitments given
(in millions of euros) December 31, 2018 December 31, 2017 December 31, 2016
Financing commitments (1)
444 465 562
Guarantee commitments (2)
12 17 21
On behalf of banks 8 9 11
On behalf of customers 4 8 10
Property lease commitments 37 31 35
Total 493 513 618
(1) Includes 117 million euros of documentary credits and 327 million euros of confirmed credit lines.
(2) Given to credit institutions and customers

Consolidated financial statements 2018 125
Commitments received
(in millions of euros) December 31, 2018 December 31, 2017 December 31, 2016
Guarantee commitments 834 778 744
Received from banks (1)
681 577 533
Received from customers 153 201 211
Total 834 778 744
(1) Relates to guarantees received in order to counter-guarantee the distributed loans.
Assets covered by commitments
(in millions of euros) December 31, 2018 December 31, 2017 December 31, 2016
Assets pledged as security to lending financial institutions as guarantees for bank loans 715 838 1,365
Total 715 838 1,365
NOTE 16 Litigation
This note presents all of the significant disputes in which the Group is involved with the exception of liabilities relating to
disputes between Orange and the tax or social administrations in relation to operational or income taxes or social contributions.
These disputes are described, respectively, in Notes 9 and 6.2.
As at December 31, 2018, the provisions for risks recorded by the Group for all the disputes (except those presented in Notes 9
and 6.2) amounted to 572 million euros (versus 779 million euros at December 31, 2017 and 537 million euros at December 31,
2016). Orange believes that any disclosure on a case-by-case basis could seriously harm the Group’s position, but provides
details of the provisions recorded by category of litigation as reflected below. The balance and overall movements on provisions
are presented in Note 5.2.
(in millions of euros) Note December 31, 2018 December 31, 2017 December 31, 2016
France Litigations (1)
16.1 505 555 302
Spain Litigations 16.2 21 26 34
Europe Litigations 16.3 34 185 183
Other entities Litigations 12 13 18
Total 572 779 537
(1) Includes provisions affecting France, Enterprise and International Carriers & Shared Services.
A number of claims have been made against Orange by competitors for alleged anti-competitive behavior, for which the
claimants generally seek a cease order and a sanction. If the claims are upheld, Orange may also be ordered to pay fines that
in theory can reach up to 10% of the Group’s revenues. Competitors may also claim damages in civil or commercial
proceedings for the harm they consider they have suffered because of these practices.
16.1 Litigation in France
Litigations related to competition law
Mobile services
In parallel with the judicial inquiry for which on December 17, 2015 a final verdict was reached by the French Competition
Authority fining Orange 350 million euros for employing four anti-competitive practices in the Enterprise segment of market
and imposing injunctions to immediately restore competition in the market, SFR brought an action on June 18, 2015, for
damages suffered because of Orange’s practices. After having first provisionally estimated its damages at 512 million euros,
SFR raised its claim in September 2018 to 2.8 billion euros. Given the decision of December 17, 2015, the Group believes
this claim represents a risk, insofar as any right for SFR to be indemnified remains subject to SFR proving that it suffered
actual damage as a result of the sanctioned practices. In the wake of this decision, Verizon, BT Group, Nerim, Céleste and
Adista also brought actions against Orange before the Paris Commercial Court for damages. The parties mutually withdrew
in the Nerim and Verizon cases. To date, the claims of BT, Celeste and Adista represent a total of 222 million euros. These
cases are being examined by the judge before trial. The level of these claims is not motivated with regard to the actual
activity of these companies on French territory. Orange has re-evaluated the risk in light of the course of the proceedings.
On May 19, 2016, the Paris Court of Appeal upheld the scope of the practices addressed by the December 13, 2012
decision by the French Competition Authority, which had imposed a fine of 117 million euros against Orange SA and
66 million euros against SFR for having implemented, as part of their abundance offers launched in 2005, excessive price
discrimination between calls made within their own networks and calls made to competitor networks, but reduced the fines

Consolidated financial statements 2018 126
by 20% on the grounds that the practice had never been previously identified by the Authority. The French Competition
Authority reimbursed Orange 23 million euros in June 2016. Since the parameters sanctioning the practice were not
challenged, Orange filed an appeal, which was dismissed. The dispute is now closed.
Following the decision of the French Competition Authority in connection with this case, in June 2013 Oméa Telecom (Virgin
Mobile and Tele2 Mobile), Euro-Information Telecom (NRJ Mobile) and Outremer Telecom each brought an action against
Orange before the Commercial Court of Paris for losses allegedly suffered because of the sanctioned practices. On
November 3, 2016 the Commercial Court officially acknowledged the withdrawal of Oméa Telecom. Euro-Information
Telecom and Outremer Telecom now provisionally claim 40 million euros in total. At this stage, Orange has re-evaluated the
risk in light of the course of the proceedings
Concurrently to their complaints filed with the French Competition Authority, regarding practices of Orange in the mobile and
fixed-to-mobile markets in the French Caribbean and in French Guyana, for which Orange was definitively ordered to pay a
fine of 60 million euros, Digicel and Outremer Telecom initiated before the Paris Commercial Court respectively in March
2009 and October 2010, legal actions for alleged damages stemming from these practices, in an amount which Digicel
assessed at 494 million euros and Outremer Telecom at 75 million euros. On March 16, 2015, the Paris Commercial Court
ordered Orange to pay 8 million euros to Outremer Telecom. Orange paid this amount and appealed the decision. On May
10, 2017, the Court of Appeal of Paris reduced to 3 million euros the amount of the penalty, noting inter alia that the
damages should be discounted at the statutory rate of interest. On December 18, 2017 the Commercial Court of Paris
ordered Orange to pay to Digicel the sum of 180 million euros, discounted from March 2009 until the date of payment at a
rate of interest higher than that adopted by the Paris Court of Appeal in the Outremer Telecom litigation, or a total of
approximately 346 million euros. Orange filed an appeal and, at the same time, obtained from the Paris Court of Appeal on
February 6, 2018, the right to escrow the amount of the penalty until the court ruled on the merits of the case. Orange has
re-evaluated the risk in light of the course of the proceedings. On April 17, 2018, Digicel petitioned the Paris Court of Appeal
to dispute the amount of the escrow made by Orange in application of the judgment of the Commercial Court of Paris. The
Court confirmed the amount of the escrow by a ruling dated October 10, 2018.
Fixed-line services
In 2010, the Numericable group initiated proceedings before the Commercial Court of Paris and before the Court of
Arbitration of the International Chamber of Commerce of Paris (ICC), aimed at compensating damage that would to amount
to nearly 3.1 billion euros, caused by an alleged de facto termination of the agreements signed with Orange at the time of the
sale of its cable networks. On February 25, 2013, the ICC definitively rejected all claims amounting to 542 million euros with
respect to the 2004 use agreements; and on June 2014, the Paris Court of Appeal upheld the judgment dismissing all
Numericable’s claims amounting to 2,583 million euros with respect to the 1999 and 2001 use agreements. Furthermore, the
Court of Appeal acknowledged the abusive nature of Numericable’s action. However, on February 2, 2016, the French
Supreme Court canceled the Court of Appeal’s decision for having considered that the ICC’s award in favor of Orange could
be invoked against Numericable when the case submitted to the Court of Appeal involved separate agreements.
Numericable has filed an appeal before the Paris Court of Appeal. In a judgment of June 16, 2017, the Paris Court of Appeal
confirmed its rejection of Numericable’s claims. Numericable has brought its case to the French Supreme Court.
On February 3, 2010, SFR, then, on November 10, 2010, Verizon, summoned Orange SA to appear before the Paris
Commercial Court demanding the reimbursement of alleged overpayments on interconnection services provided by Orange,
the price of which allegedly did not reflect their cost. On June 18 and 25, 2013, the Paris Commercial Court dismissed their
claims but ordered Orange to pay Verizon 0.5 million euros with respect to services provided in 2008. Orange paid this
amount in 2013. SFR and Verizon filed appeals against these decisions and claim respectively 49 million euros for
interconnection services in 2006 and 2007 and 41 million euros for wholesale access or interconnection services from 2006
to 2008. On December 4, 2015, the Paris Court of Appeal dismissed all of SFR’s claims and confirmed the first instance
court’s decision and on September 27, 2017 the French Supreme Court rejected SFR’s appeal. In addition, on April 28,
2017, the Paris Court of Appeal dismissed Verizon completely and reversed the compensation of 0.5 million euros for
services provided in 2008. Verizon lodged an appeal before the French Supreme Court.
On April 24, 2012, SFR brought an action against Orange SA before the Paris Commercial Court denouncing its retail offers
for the secondary residences market and claiming 257 million euros for the loss allegedly suffered. On February 12, 2014,
the Court held that Orange had abused its dominant position and ordered it to pay 51 million euros in damages to SFR. On
October 8, 2014 the Paris Court of Appeal nullified this decision, ruling inter alia that SFR had not established the existence
of a relevant market limited to secondary residences; but in a ruling of April 12, 2016 the French Supreme Court reversed
the ruling of the Court of Appeal, on the grounds that the court had not sufficiently defined the markets. Following that
decision, Orange had to pay 53 million euros to SFR pursuant to the trial court’s judgment. On June 8, 2018, the Court of
Appeal sentenced Orange to pay 54 million euros. Orange paid the balance following the cancellation of the previous ruling
from the Court of Appeal and appealed to the French Supreme Court.
Other proceedings
Lectiel has for many years demanded recognition of a damage to it which would have resulted from the refusal of Orange to
put at its disposal free of charge its directories database and its daily update of same. Before the Paris Court of Appeal,
Lectiel increased its claim to 4.7 billion euros. On May 27, 2015, the Court ruled that Orange’s practices justi fied
compensation and appointed an expert with the limited mission of assessing the amount of damages possibly suffered by
Lectiel solely on the direct marketing segment of the market and only during the period from 1991 to 1998. The Supreme
Court dismissed Orange’s appeal of this decision. On June 7, 2017, the expert submitted his report and assessed the

Consolidated financial statements 2018 127
damages to Lectiel at 6 million euros. On April 11, 2018, the Paris Court of Appeal sentenced Orange to pay 3 million euros
of damages to Lectiel due to the harm suffered by it because of the refusal of Orange to put at its disposal free of charge its
directories database and daily update. Orange executed the ruling and the matter is now closed.
In June 2018, Free brought summary proceedings against Orange before the presiding judge of the Paris Commercial Court,
aiming to prohibit some of its mobile phone offers proposing mobile handsets at attractive prices accompanied by a
subscription package, on the grounds that they constituted consumer credit offers. The case is currently being investigated
by the judges deciding on the merits of the case.
16.2 Litigation in Spain
On December 20, 2012, following the conclusion of a sanction procedure against Telefónica, Vodafone and Orange
Espagne, the Spanish Market and Competition Commission (CNMC) ordered the three operators to pay a fine of 120 million
euros, including 30 million euros for Orange Espagne, for abuse of their dominant position in the call origination and
termination market between 2000 and 2009 by setting abnormally high rates for text messaging. On May 24, 2013 Orange
obtained a stay of this decision. On September 1, 2017 the Madrid Court of Appeal voided the fines imposed on the
operators. The Spanish Competition Commission (CNMC) filed an action before the Spanish Supreme Court, which was
dismissed on December 21, 2018. As no further appeal is possible, the fine is therefore definitively canceled.
On March 11, 2014, at the conclusion of the judicial investigation of the complaint brought by BT Group against the practices
of Orange, Telefónica and Vodafone in the wholesale markets of the Spanish mobile phone segment, the CNMC considered
that the MVNOs were able to replicate the retail offers of these operators and rejected the complaint. The BT Group lodged
an appeal against the decision. The Spanish Supreme Court definitively rejected the appeal from BT Group in October 2018.
16.3 Litigation in Europe
Poland
On December 17, 2015, the General Court of the European Union upheld in its entirety the decision of the European
Commission of June 22, 2011 that imposed a fine of 128 million euros on Orange Polska for abusing its dominant position in
the wholesale market for broadband Internet access in Poland by employing practices intended to prevent effective access
to the market by alternative operators. Orange Polska filed an appeal with the European Court of Justice, which was
dismissed on July 25, 2018.
In 2011, the Polish Competition Authority (UOKiK) sanctioned the four major Polish mobile operators, including Orange
Polska, for collusion to delay the development of new services in the mobile television market. This sanction was nullified in
2015 by the Court for the protection of competition and consumers. In 2017, the Court of Appeal dismissed the appeal of the
UOKiK, who appealed to the Supreme Court. On November 26, 2016, the company Magna Polonia brought suit jointly and
severally against the operators in the Warsaw Commercial Court and claimed 618 million zlotys (148 million euros) for the
damages it allegedly sustained due to these practices.
In 2013, the UOKiK opened an investigation on the country’s three main mobile operators, including Orange Polska, for
abuse of a dominant position in relation with the retail rates imposed by these three operators on the calls made to the
network of P4. On January 2, 2018, UOKiK suspended the proceeding against the three operators as there were no longer
anti-competitive grounds. In addition, in 2015 P4 issued two claims for damages for a total amount of 574 million zlotys (137
million euros) against the three operators jointly, with the aim of indemnifying the loss allegedly suffered in relation to the
contested pricing practices.
Romania
On February 15, 2011, the Romanian Competition Council imposed a fine of 35 million euros on Orange Romania for abuse
of a dominant position in refusing to conclude an interconnection agreement with Netmaster. In compliance with local rules,
30% of the amount of the fine was deposited into an escrow account. On June 11, 2013, the Bucharest Court of Appeal
upheld Orange Romania’s claims and canceled the fine. However, on June 3, 2014, the Romanian High Court of Justice
reversed the Court of Appeal’s decision for not having conducted a proper analysis of the facts characterizing an abuse of a
dominant position. The case was referred to the Court of Appeal of Bucharest, which ruled that the arguments of Orange
Romania were not valid and dismissed the case. Orange Romania has appealed to the Supreme Court. On March 30, 2018
and after seven years of appeals, the Supreme Court definitively confirmed the condemnation of the practices of Orange
Romania concerning international interconnection, but partially canceled the decision of the Council concerning the
limitations of traffic to the detriment of Netmaster in November 2004. As a result, the fine was reduced to 24 million euros.
On March 29, 2016, investigators from the Romanian Competition Council made an investigation at the headquarters of
Orange Romania, concerning possible discriminatory practices in the mobile payment and advertising markets. Following the
investigation, the Competition Council sentenced Orange Romania, on December 18, 2018 to a fine of 65 million leu
(approximately 14 million euros). This decision will be communicated to Orange Romania within 120 days following the
decision, namely no later than April 17, 2019. From reception of the decision, Orange Romania will have a deadline of 30
days to lodge an appeal.

Consolidated financial statements 2018 128
16.4 Litigation in other entities
Middle East and Africa
In September 2008 and December 2009, the Egyptian National Telecommunications Regulatory Authority (NTRA), following
a complaint filed by Telecom Egypt (TE), issued two decrees imposing interconnection rates different from those set in the
bilateral agreements between TE and Orange Egypt. In June 2010, the administrative courts granted Orange Egypt a stay of
execution of these decrees until the issuance of a decision on the merits of the case. However, on June 21, 2016, the
Administrative Court of Cairo ruled that the decrees from NTRA were valid. In August 2016, Orange Egypt filed an appeal
with the Administrative Court of the Egyptian State Council. This appeal is not suspensive. The Supreme Administrative
Court has not yet handed down a decision. The next hearing date is March 9, 2019.
The partnership between Korek Telecom and Orange/Agility is the subject of several disputes described in Note 14.2.
16.5 Litigation related to banking activities
Orange Bank is the object of two historic lawsuits whereby the plaintiffs claim in total about 480 million euros in financial
damages that they allege to have suffered. As Orange Bank believes these claims to be without merit and is contesting them
strongly, the Group has recognized no financial liability.
16.6 Other Group litigation
Other than proceedings that may be initiated in respect of tax audits (see Note 9), there are no other administrative, legal or
arbitration proceedings, including any proceedings that are pending, suspended or threatened, of which Orange is aware of,
which may have or have had in the last 12 months a material impact on the Company’s and/or Group’s financial position or
profitability.
NOTE 17 Subsequent events
Bond issue
On January 15, 2019, Orange issued:
650 million euros maturing in January 2022 bearing interest of 0.5%;
1,250 million euros maturing July 2024, bearing interest of 1.125%;
1,250 million euros maturing in January 2029 bearing interest of 2%;
750 million pounds sterling maturing in January 2032 bearing interest of 3.25%.
Acquisition of SecureData
On February 1, 2019, Orange announced the acquisition of 100% of the capital of the SecureData Group and its subsidiary
SensePost. SecureData is the largest independent supplier of cyber security services in the United Kingdom, the biggest market
in Europe.
NOTE 18 Main consolidated entities
At December 31, 2018, the scope of consolidation consisted of 423 entities.
The main changes in the scope of consolidation in 2018 are set out in Note 3.
As regards subsidiaries with minority interests:
financial statements for Orange Polska Group, Sonatel Group, Jordan Telecom Group, Orange Belgium Group and
Business & Decision Group are respectively published to the Warsaw Stock Exchange, the Regional Stock Exchange
(BRVM), the Amman Stock Exchange, the Brussels Stock Exchange and the Paris Stock Exchange, those companies being
quoted;
the others subsidiaries are not significant compared to Orange’s financial data. Consequently, financial information is not
presented for these subsidiaries in the notes to Orange’s consolidated financial statements.
Pursuant to ANC Regulation No. 2016-09 of December 2, 2016, the complete list of the companies included in the scope of
consolidation, the companies left out of the scope of consolidation and the non-consolidated equity investments, is available on
the Group's website (https://www.orange.com/en/Investors/Regulated-information).
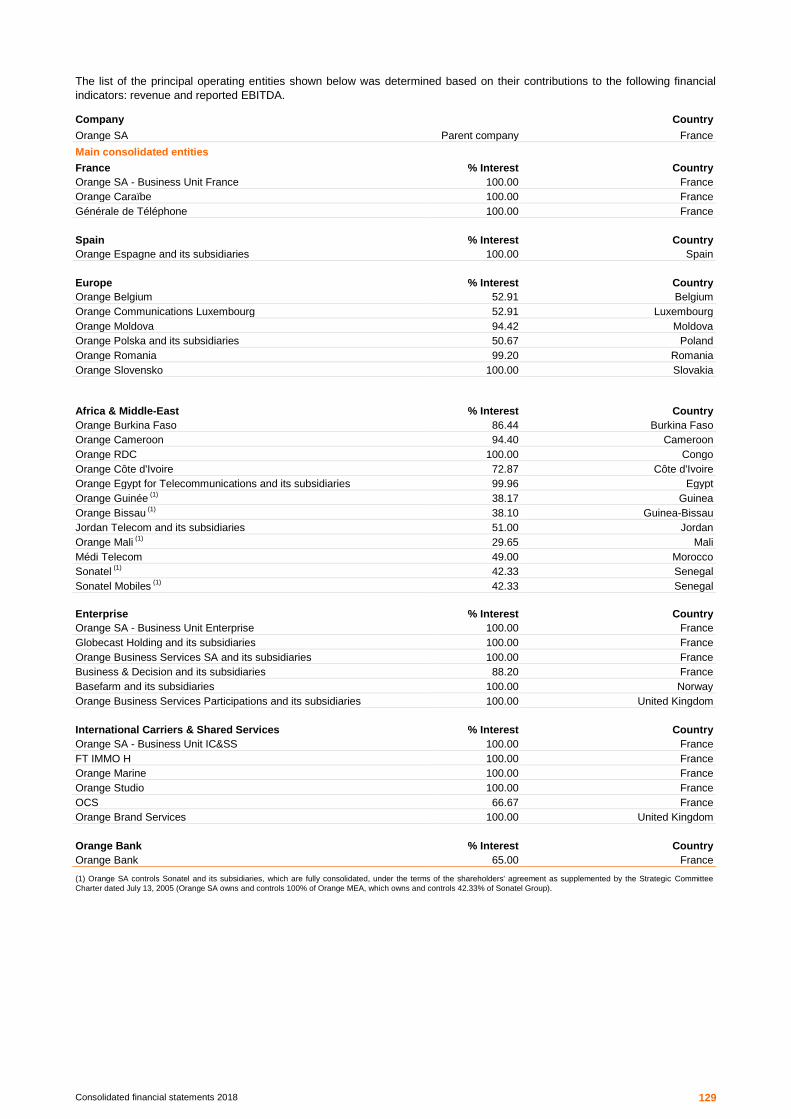
Consolidated financial statements 2018 129
The list of the principal operating entities shown below was determined based on their contributions to the following financial
indicators: revenue and reported EBITDA.
Company Country
Orange SA Parent company France
Main consolidated entities
France % Interest Country
Orange SA - Business Unit France 100.00 France
Orange Caraïbe 100.00 France
Générale de Téléphone 100.00 France
Spain % Interest Country
Orange Espagne and its subsidiaries 100.00 Spain
Europe % Interest Country
Orange Belgium 52.91 Belgium
Orange Communications Luxembourg 52.91 Luxembourg
Orange Moldova 94.42 Moldova
Orange Polska and its subsidiaries 50.67 Poland
Orange Romania 99.20 Romania
Orange Slovensko 100.00 Slovakia
Africa & Middle-East % Interest Country
Orange Burkina Faso 86.44 Burkina Faso
Orange Cameroon 94.40 Cameroon
Orange RDC 100.00 Congo
Orange Côte d'Ivoire 72.87 Côte d'Ivoire
Orange Egypt for Telecommunications and its subsidiaries 99.96 Egypt
Orange Guinée (1)
38.17 Guinea
Orange Bissau (1)
38.10 Guinea-Bissau
Jordan Telecom and its subsidiaries 51.00 Jordan
Orange Mali (1)
29.65 Mali
Médi Telecom 49.00 Morocco
Sonatel (1)
42.33 Senegal
Sonatel Mobiles (1)
42.33 Senegal
Enterprise % Interest Country
Orange SA - Business Unit Enterprise 100.00 France
Globecast Holding and its subsidiaries 100.00 France
Orange Business Services SA and its subsidiaries 100.00 France
Business & Decision and its subsidiaries 88.20 France
Basefarm and its subsidiaries 100.00 Norway
Orange Business Services Participations and its subsidiaries 100.00 United Kingdom
International Carriers & Shared Services % Interest Country
Orange SA - Business Unit IC&SS 100.00 France
FT IMMO H 100.00 France
Orange Marine 100.00 France
Orange Studio 100.00 France
OCS 66.67 France
Orange Brand Services 100.00 United Kingdom
Orange Bank % Interest Country
Orange Bank 65.00 France
(1) Orange SA controls Sonatel and its subsidiaries, which are fully consolidated, under the terms of the shareholders' agreement as supplemented by the Strategic Committee
Charter dated July 13, 2005 (Orange SA owns and controls 100% of Orange MEA, which owns and controls 42.33% of Sonatel Group).

Consolidated financial statements 2018 130
NOTE 19 Auditors’ fees
As required by Decree no. 2008-1487 of December 30, 2008, the following table shows the amount of fees of the auditors of the
parent company and their partner firms in respect of the fully consolidated subsidiaries.
Audit and related services Other services rendered by
auditors' networks to
fully-consolidated subsidiaries
Total
Statutory audit fees, certification, auditing of the
accounts Services required by the law
Sub-total
(in millions of euros) o/w issuer o/w issuer
EY
2018 10.6 5.4 0.3 - 10.8 0.4 11.3
% 94 % 48 % 2 % - 96 % 4 % 100 %
2017 11.6 7.1 0.0 0.0 11.6 0.6 12.2
% 95 % 58 % 0 % 0 % 95 % 5 % 100 %
2016 9.2 4.9 0.1 0.0 9.3 0.6 9.9
% 93 % 49 % 1 % 0 % 94 % 6 % 100 %
KPMG
2018 10.9 6.3 0.5 0.3 11.4 0.1 11.5
% 95 % 55 % 4 % 2 % 99 % 1 % 100 %
2017 11.4 6.9 0.3 0.2 11.7 0.1 11.8
% 97 % 58 % 3 % 2 % 99 % 1 % 100 %
2016 9.2 5.4 0.5 0.2 9.7 0.1 9.8
% 94 % 55 % 5 % 2 % 99 % 1 % 100 %
The services provided by the statutory auditors were authorized pursuant to the rules adopted by the Audit Committee and
updated each year since October 2016. No tax services were rendered to the Group by the networks of the statutory auditors of
the parent company.

Consolidated financial statements 2018 131
Statutory auditors’ report on the consolidated financial statements
This is a translation into English of the auditors’ report on the financial statements of the Company issued in French and it is
provided solely for the convenience of English speaking users.
This auditors’ report includes information required by European regulation and French law, such as information about the
appointment of the statutory auditors or verification of the management report and other documents provided to shareholders.
This report should be read in conjunction with, and construed in accordance with, French law and professional auditing
standards applicable in France.
Year ended December 31, 2018
To the Annual General Meeting of Orange S.A.
Opinion
In compliance with the engagement entrusted to us by your Annual General Meeting, we have audited the accompanying
consolidated financial statements of Orange S.A. (hereinafter “the Company”) for the year ended December 31, 2018.
In our opinion, the consolidated financial statements give a true and fair view of the assets and liabilities and the financial
position of the Group as at December 31, 2018 and of the results of its operations for the year then ended, in accordance with
International Financial Reporting Standards, as adopted by the European Union.
The opinion expressed above is consistent with the contents of our report to the Audit Committee.
Basis for opinion
Accounting Framework
We conducted our audit in accordance with professional standards applicable in France. We believe that the audit evidence we
have obtained is sufficient and appropriate to provide a basis for our opinion.
Our responsibilities under those standards are further described in the section “Statutory Auditors’ Responsibilities for the Audit
of the Consolidated Financial Statements” section of this report.
Independence
We conducted our audit engagement in compliance with independence rules applicable to us, for the period from January 1,
2018 to the date of our report, and we did not provide any prohibited non-audit services referred to in Article 5(1) of Regulation
(EU) No 537/2014 or in the French Code of Ethics (Code de déontologie) for statutory auditors.
Observation
Without qualifying our opinion, we draw your attention to accounting method changes outlined in Note 2.3 to the consolidated
financial statements, “New standards and interpretations applied as of January 1, 2018”. The note discusses the first-time
adoption of IFRS 9, “Financial instruments”, and IFRS 15, “Revenue from contracts with customers”.
Justification of Assessments: Key Audit Matters
In accordance with the requirements of Article L. 823-9 of the French Commercial Code (Code de commerce) relating to the
justification of our assessments, we draw your attention to the key audit matters relating to risks of material misstatement that, in
our professional judgment, were of most significance for the audit of the consolidated financial statements for the year, as well
as the response that we have provided for these risks.
These matters were addressed in the context of our audit of the consolidated financial statements as a whole and were used to
form the opinion we expressed above. We do not provide a separate opinion on specific items of the consolidated financial
statements.
Key Audit Matters Audit Response
Revenue recognition for telecommunications activities and
significant agreements with third-party operators
(Notes 2.3.2, 4.1 and 4.4 of the notes to the consolidated financial
statements)
The Company’s telecommunications business involves a wide range
of frequently changing services and large volumes of data
processing. This requires various revenue recognition methods
according to the type of product or service sold, and complex IT
systems both to recognize revenue and ensure it is recognized in
For the telecommunications business, we gained insight into the
accounting processes used to recognize various revenue
streams, from contract signature and initial communication to
invoicing and receiving payment.
We took into account the high level of integration of the various
IT systems involved in revenue recognition by including IT
specialists in our audit team and testing the design,
implementation and effectiveness of automated system controls
affecting revenue recognition.

Consolidated financial statements 2018 132
the appropriate financial year.
In addition, significant agreements may be entered into with third-
party operators. Procedures for applying accounting standards to
these agreements may be complex and require judgments and
estimates.
Revenue recognition principles are presented in Note 4.1 of the
notes to the consolidated financial statements.
Revenue recognition of telecommunications business and significant
agreements with third-party operators is a key audit matter due to
the complexity of the associated IT systems, and the judgments and
estimates required to determine revenue.
Additionally, as pointed out in Note 2.3.2 on the first-time adoption of
IFRS 15, “Revenue from contracts with customers”, as of January 1,
2018, the Group applied IFRS 15 retrospectively, restating published
data from the 2016 and 2017 financial years on a like-for-like basis.
The main impacts of this new standard, in term of revenue
recognition relate to bundled service and equipment offerings and
the capitalization of certain costs of obtaining a contract.
Applying the new standard to contracts that were in effect on
January 1, 2016 (the first like-for-like reporting period presented)
increased consolidated reserves to €815 million at that date.
As part of our work, we:
Assessed the compliance of main judgments and estimates
used for revenue recognition with accounting principles,
specifically in relation to the first-time adoption of IFRS 15.
We examined the accounting treatments used, particularly
for the contract execution term and the contract purchase
price allocation between communication services and mobile
telephones in bundled offerings;
Identified the main controls set up by Orange that are
relevant to our audit, then tested their operational
effectiveness by sampling, particularly in relation to IFRS 15
adoption;
Tested the functions of business and commercial
applications used to prepare accounting and financial
information, and the configuration of accounting systems,
including new systems set up for IFRS 15 adoption;
Performed analytical procedures by comparing our revenue
estimates with revenue recorded;
Critically assessed a selection of manually recorded
accounting entries at year end by comparing them with our
calculations and estimates, and obtaining supporting
evidence for them.
We examined the accounting treatment applied for significant
agreements with third-party operators. We also assessed key
judgments and estimates made by the Company after obtaining
and analyzing all contract documentation and analyses
performed by Company Management.
We have also assessed the appropriateness of the information
presented in Notes 2.3.2, 4.1 and 4.4 of the notes to the
consolidated financial statements.
Valuation of goodwill, intangible assets and property, plant and
equipment
(Notes 7 and 8 of the notes to the consolidated financial statements)
As at December 31, 2018, goodwill, property, plant and equipment
and intangible assets on the balance sheet totaled €27,174 million,
€14,073 million and €27,693 million respectively. Impairment on
goodwill, property plant and equipment, and intangible assets
recognized on the statement of profit or loss totaled €105 million for
2018.
As stated in Note 7.1, Orange tests for impairment whenever there is
an indication of impairment, and at least once a year . These tests
are performed on each cash-generating unit (CGU) or group of
CGUs, usually an operating segment. Impairment is recognized if
the recoverable value drops below the carrying amount. Orange
most often determines recoverable value as value in use, which is
the estimated current value of expected future cash flows.
To estimate value in use, Orange employs various estimates and
judgments as described in Note 7, particularly: the assessment of
the competitive, economic and financial landscape in the countries
where Orange does business; its ability to generate operating cash
flows as a result of strategic plans; planned capital expenditure; and
the discount rate and perpetual growth rate used to calculate
recoverable values.
We believe that the measurement of these assets is a key audit
matter, given their sensitivity to assumptions made by management
and the material amount of goodwill, other intangible assets and
property, plant and equipment in the consolidated financial
statements.
We gained insight into the procedure set up by Orange to
perform impairment testing, particularly the audit of cash flows
used to calculate recoverable value.
We assessed the method used by Orange to calculate
recoverable values.
To assess the reliability of data from the business plan that is
used to calculate recoverable value, we:
analyzed the procedure for devising and approving the
business plans on which cash flow projections are based;
compared the 2018 business plan projections with business
plans of prior financial years;
compared the business plans of prior financial years with
actual results of the years in question;
interviewed operational and finance managers at Orange to
gain insight into the key assumptions used in business plans
and assess assumptions based on the explanations
obtained;
compared the main assumptions made by Orange relating to
revenue, EBITDA and capital expenditure with external data
when available (such as market research and analysts’
memos);
studied the sensitivity analyses performed by Orange and
performed our own sensitivity analyses on key assumptions
to assess the potential effect of a change in these
assumptions on the conclusions of impairment tests;
reconciled data used with data presented to the Board of
Directors.
To simulate the models used to calculate recoverable value, we

Consolidated financial statements 2018 133
called on our valuation specialists to:
test the mathematical reliability of the models and
recalculate value in use determined by Orange group;
assess the methods used to determine discount rates and
perpetual growth rates, compare these rates to market data
and recalculate rates with our own data sources.
We have also assessed the appropriateness of the information
presented in Notes 7 and 8 of the notes to the annual financial
statements.
Recognition of deferred tax assets for tax loss carryforwards
(Notes 9.2.1 and 9.2.3 of the notes to the consolidated financial
statements)
At December 31, 2018, €1,366 million was recognized in the
consolidated financial statements for deferred tax assets. At that
date unrecognized deferred tax assets amounted to €3,709 billion
and mainly comprised tax losses that can be carried forward
indefinitely.
As stated in Note 9.2, deferred tax assets are only recognized when
it is probable that the tax entity will have sufficient future taxable
profit to recover them. The recoverability of deferred tax assets is
assessed based on the business plan used for impairment testing,
which may be adjusted for tax specificities.
We believe that the recognition of deferred tax assets for tax loss
carryforwards is a key audit matter, given their sensitivity to
assumptions made by the Group, particularly in terms of the Group’s
capacity to achieve the performance forecast in the business plan.
Our work entailed assessing the probability for Group entities of
being able to use tax loss carryforwards recognized at
December 31, 2018 in the future, and in particular:
determining whether the tax loss carryforwards could be
used before they expire to offset deferred tax liabilities in the
same tax jurisdiction; and
determining the capacity of each entity to generate future
taxable profit enabling the utilization of tax loss
carryforwards.
We assessed the method used by the Group to identify tax loss
carryforwards to be used in the future.
To assess future taxable profit, we analyzed the reliability of the
processes used to prepare the business plan to assess the
probability of each entity recovering its deferred tax assets by:
analyzing the procedure used to develop and approve the
latest business plan on which estimates were based;
comparing forecast performance from previous years with
actual results for the years concerned;
examining the consistency of assumptions made to assess
deferred tax with those used for asset impairment testing;
performing a critical analysis of the tax assumptions used for
taxable profit forecasts.
We also assessed the appropriateness of the information
presented in Notes 9.2.1 and 9.2.3 of the notes to the
consolidated financial statements.
Measuring provisions for competition and regulatory disputes
(Notes 5.2, 5.7 and 16 of the notes to the consolidated financial
statements)
Orange is involved in a number of legal disputes in France and
abroad relating to competition issues, and national and European
Commission regulations.
As stated in Note 5.2 of the notes to the consolidated financial
statements, expenses arising from these proceedings are recorded
when the Group has a present obligation towards a third party
arising from a past event, and it is probable that an outflow of
resources embodying economic benefits will be required to settle the
obligation, which can be quantified or estimated on a reasonable
basis.
A provision of €572 million was recognized to account for ongoing
disputes involving the Group at December 31, 2018 (not including
provisions for employee benefits and tax disputes or audits).
Given the Company’s exposure to competition issues in the
telecommunications sector and the high level of judgment required
by Management to estimate risks relating to legal disputes, we have
identified the subject as a key audit matter.
To assess the extent of risk of estimates used to record
provisions for competition and regulatory disputes, our work
included:
gaining insight into procedures implemented by
Management to identify and map risk, and where
appropriate, record provisions;
testing key controls set up by Management, which we
believe to be the most relevant to our audit;
understanding the risk analyses performed by Management;
interviewing the Legal Department and Corporate Secretary
of your Group and analyzing the documentation available
(specifically the minutes of court hearings) to assess the
merit of the assumptions used to determine any provisions
for legal disputes;
examining the responses to our requests for information:
legal opinions of external counsel, the information available
on ongoing proceedings and the probable financial
consequences;
assessing whether any events subsequent to the reporting
date for the year ended December 31, 2018 have been
taken into account to estimate provisions and in the
information provided in the financial statements.

Consolidated financial statements 2018 134
We also assessed the appropriateness of the information
presented in Notes 5.2, 5.7 and 16 of the notes to the
consolidated financial statements.
Specific Verifications
We have also performed, in accordance with professional standards applicable in France, the specific verifications required by
French law on the information pertaining to the Group presented in the Management Report prepared by the Board of Directors.
We have no matters to report as to the fair presentation and the consistency of the information with the consolidated financial
statements.
We hereby attest that the consolidated statement of non-financial performance required under Article L.225-102-1 of the French
Commercial Code is included in the Group management report. However pursuant to Article L.823-10 of the same code, we
point out that we did not verify that this statement gives a true and fair view or matches the consolidated financial statements.
The information in the statement requires a report from an independent third party.
Report on Other Legal and Regulatory Requirements
Appointment of the Statutory Auditors
We were appointed statutory auditors of Orange S.A. by the Shareholders’ Meeting held on May 27, 2015 for KPMG and by the
inter-ministerial decree of September 18, 1991 for Ernst & Young Audit.
As at December 31, 2018, KPMG were in the fourth year of their total uninterrupted engagement and Ernst & Young Audit were
in their twenty-eighth year, which is the fourth year and twenty-second year respectively since the Company’s securities were
admitted to trading on a regulated market.
Responsibilities of Management and Those Charged with Governance for the Consolidated Financial Statements
Management is responsible for the preparation and fair presentation of the consolidated financial statements in accordance with
International Financial Reporting Standards (IFRS) as adopted by the European Union. Management is also responsible for
such internal control that it determines is necessary to enable the preparation of consolidated financial statements that are free
from material misstatement, whether due to fraud or error.
In preparing the consolidated financial statements, management is responsible for assessing the company’s ability to continue
as a going concern, disclosing, as applicable, matters related to going concern and using the going concern basis of accounting
unless it is expected to liquidate the company or to cease operations.
The Audit Committee is responsible for monitoring the financial reporting process and the effectiveness of internal control and
risk management systems and where applicable, internal audit, regarding the accounting and financial reporting procedures.
The consolidated financial statements have been approved by the Board of Directors.
Statutory Auditors’ Responsibilities for the Audit of the Consolidated Financial Statements
Objectives and audit approach
Our role is to issue a report on the consolidated financial statements. Our objective is to obtain reasonable assurance about
whether the consolidated financial statements as a whole are free from material misstatement. Reasonable assurance is a high
level of assurance, but is not a guarantee that an audit conducted in accordance with professional standards will always detect
a material misstatement when it exists. Misstatements can arise from fraud or error and are considered material if, individually or
in the aggregate, they could reasonably be expected to influence the economic decisions of users taken on the basis of these
financial statements.
As specified in Article L.823-10-1 of the French Commercial Code (Code de commerce), our statutory audit does not include
assurance on the viability of the Company or the quality of management of the affairs of the Company.
As part of an audit conducted in accordance with professional standards applicable in France, the statutory auditor exercises
professional judgment throughout the audit and furthermore:
Identifies and assesses the risk of material misstatement of the consolidated financial statements, whether due to fraud or
error, designs and performs audit procedures responsive to those risks, and obtains audit evidence considered to be
sufficient and appropriate to provide a basis for the audit opinion. The risk of not detecting a material misstatement result ing
from fraud is higher than for one resulting from error, as fraud may involve collusion, forgery, intentional omissions,
misrepresentations, or the override of internal control;
Obtains an understanding of internal control relevant to the audit in order to design audit procedures that are appropriate in
the circumstances, but not for the purpose of expressing an opinion on the effectiveness of the internal control.
Evaluates the appropriateness of accounting policies used and the reasonableness of accounting estimates and related
disclosures made by management in the consolidated financial statements;

Consolidated financial statements 2018 135
Assesses the appropriateness of management’s use of the going concern basis of accounting and, based on the audit
evidence obtained, whether a material uncertainty exists related to events or conditions that may cast significant doubt on
the Company’s ability to continue as a going concern. This assessment is based on the audit evidence obtained up to the
date of his audit report. However, future events or conditions may cause the company to cease to continue as a going
concern. If the statutory auditor concludes that a material uncertainty exists, there is a requirement to draw attention in the
audit report to the related disclosures in the financial statements or, if such disclosures are not provided or inadequate, to
modify the opinion expressed therein;
Evaluates the overall presentation of the consolidated financial statements and assesses whether the financial statements
represent the underlying transactions and events in a manner that achieves fair presentation;
With regard to the financial information on persons or entities included in the consolidation scope, the statutory auditor
obtains audit evidence considered to be sufficient and appropriate to provide a basis for the audit opinion. The statutory
auditor is responsible for managing, supervising and performing the audit of the consolidated financial statements as well as
the opinion on the financial statements.
Report to the Audit Committee
We submit a report to the Audit Committee, which includes a description of the scope of the audit and the audit program
implemented, as well as the results of our audit. We also report any significant deficiencies in internal control regarding the
accounting and financial reporting procedures that we have identified.
Our report to the Audit Committee includes the risks of material misstatement that, in our professional judgment, were of most
significance in the audit of the financial statements of the current period and which are therefore key audit matters we have the
duty to describe in this report.
We also provide the Audit Committee with the declaration provided for in Article 6 of Regulation (EU) N° 537/2014, confirming
our independence within the meaning of the rules applicable in France such as they are set out by Articles L.822-10 to L.822-14
of the French Commercial Code (Code de commerce) and in the French Code of Ethics (Code de déontologie) for statutory
auditors. Where appropriate, we discuss with the Audit Committee the risks that may reasonably be thought to bear on our
independence, and the related safeguards.
Paris La Défense, February 21, 2019
KPMG Audit
Département de KPMG S.A
Ernst & Young Audit
Division of KPMG S.A.
Marie Guillemot Charles-Emmanuel Chosson
Partner Partner