consolidated financial statements - nintendo · pdf fileconsolidated financial statements may...
TRANSCRIPT
CONSOLIDATED FINANCIAL STATEMENTS
May 7, 2014Nintendo Co., Ltd. 11-1 Hokotate-cho, Kamitoba,
Minami-ku, Kyoto 601-8501Japan
Consolidated Results for the Years Ended March 31, 2013 and 2014
(Amounts below one million are rounded down)(1) Consolidated operating results
Net sales Operating income Ordinary income Net income
million yen % million yen % million yen % million yen % Year ended March 31, 2014
Year ended March 31, 2013
[Note] Percentages for net sales, operating income etc. show increase (decrease) from the last fiscal year.
Net income per share Return on equity
yen % % % Year ended March 31, 2014
Year ended March 31, 2013
(2) Consolidated financial positions
Total assets Net assetsCapital adequacy
ratioNet assets per
share% yen
As of March 31, 2014
As of March 31, 2013
(3) Consolidated cash flowsCash and cash
equivalents - ending
Year ended March 31, 2014
Year ended March 31, 2013
Dividends
Year-end Annual
yen yen yen % %Year ended Mar. 2013
Year ended Mar. 2014
Year ending Mar. 2015(forecast)
[Notes]
The end of 2nd quarter (interim) dividend per share for the fiscal year ending March 31, 2015, which is determined based on the policy listed on page 5,
is undecided because the financial forecast for the six months ending September, 2014 won't be prepared.
The year-end dividend per share is calculated by subtracting the 2nd quarter dividend per share from the annual dividend.
180.1 1.1
341,266
71.0
1.1 -
(2.0)0.6
(46,425) (41.9)-(36,410)
6,08610,482
--
(23,222)7,099
--
1,306,410million yen million yen
1,118,438
Dividends in total(annual)
Dividend payout ratio(consolidated basis)
Dividends on net assets(consolidated basis)
million yen million yen
469,395
Ordinary incomeon total assets
84.8
0.40.7
(127,163)(12,873)
9,598.22
Operating incometo net sales
(8.1)(5.7)
Cash flows fromfinancing activities
9,447.0085.6
0.00 0.00
End of 2nd quarter
Dividend per share
100.00 100.00 100.00
100.00
(10.0)571,726(1.9)635,422
(183.59)55.52
- 120.00 -
million yen
11,83712,787
1,227,520
(40,390)
million yen million yen
Cash flows frominvesting activities
89,104
Cash flows fromoperating activities
(23,114) (20,084)
1,447,878
Nintendo Co., Ltd.
- 1 -
Consolidated Financial Forecast for the Fiscal Year Ending March 31, 2015
% % % % yenYear ending Mar. 2015
[Notes] Percentages for net sales, operating income etc. show increase (decrease) from previous period.
With respect to this forecast, please refer to pages 3-4 for the forward-looking conditions and other related matters.
Others
(1) Changes for important subsidiaries during the fiscal year ended March 31, 2014 : Not applicable
(2) Changes in accounting procedures:
1) Related to accounting standard revisions etc. : Applicable2) Other changes : Not applicable3) Changes in accounting estimates : Not applicable4) Modified restatements : Not applicable
[Notes] Detailed information is listed on page 13.
(3) Outstanding shares (common shares)
① Number of shares outstanding (including treasury stock)As of March 31, 2014 : 141,669,000 shares As of March 31, 2013 : 141,669,000 shares
② Number of treasury stockAs of March 31, 2014 : 23,294,719 shares As of March 31, 2013 : 13,792,295 shares
③ Average number of sharesYear ended March 31, 2014 : 126,496,060 shares Year ended March 31, 2013 : 127,877,217 shares
(Reference) Non-consolidated Results
Non-consolidated Results for the Years Ended March 31, 2013 and 2014(1) Non-consolidated operating results
Net sales Operating income Ordinary income Net income
million yen % million yen % million yen % million yen % Year ended March 31, 2014
Year ended March 31, 2013
[Note] Percentages for net sales, operating income etc. show increase (decrease) from the last fiscal year.
Net income per share
yen Year ended March 31, 2014
Year ended March 31, 2013
(2) Non-consolidated financial positions
Total assets Net assetsCapital adequacy
ratioNet assets per
share% yen
As of March 31, 2014
As of March 31, 2013
23,03823,333
168.96million yen
14,02859.8
-
-
Net income
million yen
Net incomeper share
million yen million yen
(26.3)14.3
--(35,859)
(14,776)
7,420.207,180.3986.3
84.7 985,250
1,120,462849,973948,870
Operating income
million yen million yen40,000
Ordinary incomeNet sales
3.2 475.0
109.70184.46
607,696
590,000
448,175
-
66.3-
35,000 20,000
36,822
[Notes]1. This earnings release report is not subject to audit procedures based on the Financial Instruments and Exchange Act. At the time of disclosure of this report,the audit procedures for the financial statements are in progress.2. Forecasts announced by the Company (Nintendo Co., Ltd.) referred to above were prepared based on management's assumptions with information available atthis time and therefore involve known and unknown risks and uncertainties. Please note such risks and uncertainties may cause the actual results to be materiallydifferent from the forecasts (earnings forecast, dividend forecast, and other forecasts).
Nintendo Co., Ltd.
- 2 -
Operating Results
1. Analysis of Operations
(1) Fiscal year ended March 31, 2014Nintendo Co., Ltd. (“the Company”) and its consolidated subsidiaries (together with the Company,“Nintendo”) continues to pursue its basic strategy of “Gaming Population Expansion” by offering compellingproducts that anyone can enjoy, regardless of age, gender or gaming experience.During the fiscal year ended March 31, 2014, for “Nintendo 3DS (3DS, 3DS XL and 2DS),” “PokémonX/Pokémon Y,” simultaneously released globally in October last year, marked 12.26 million units in sales,while “Animal Crossing: New Leaf,” released in Japan in the previous fiscal year and in June last year in theUnited States and Europe, marked 3.80 million units (7.66 million units on a cumulative basis) in sales. Inaddition, key first-party titles such as “Luigi’s Mansion: Dark Moon,” “The Legend of Zelda: A Link BetweenWorlds” and “Mario & Luigi: Dream Team” showed steady sales, with each title selling more than two millionunits. Moreover, there have also been hit titles from third-party publishers. As a result, the global sales of the“Nintendo 3DS” hardware and software reached 12.24 million and 67.89 million units respectively.With respect to “Wii U,” while five key first-party titles, such as “Super Mario 3D World,” “New Super Mario
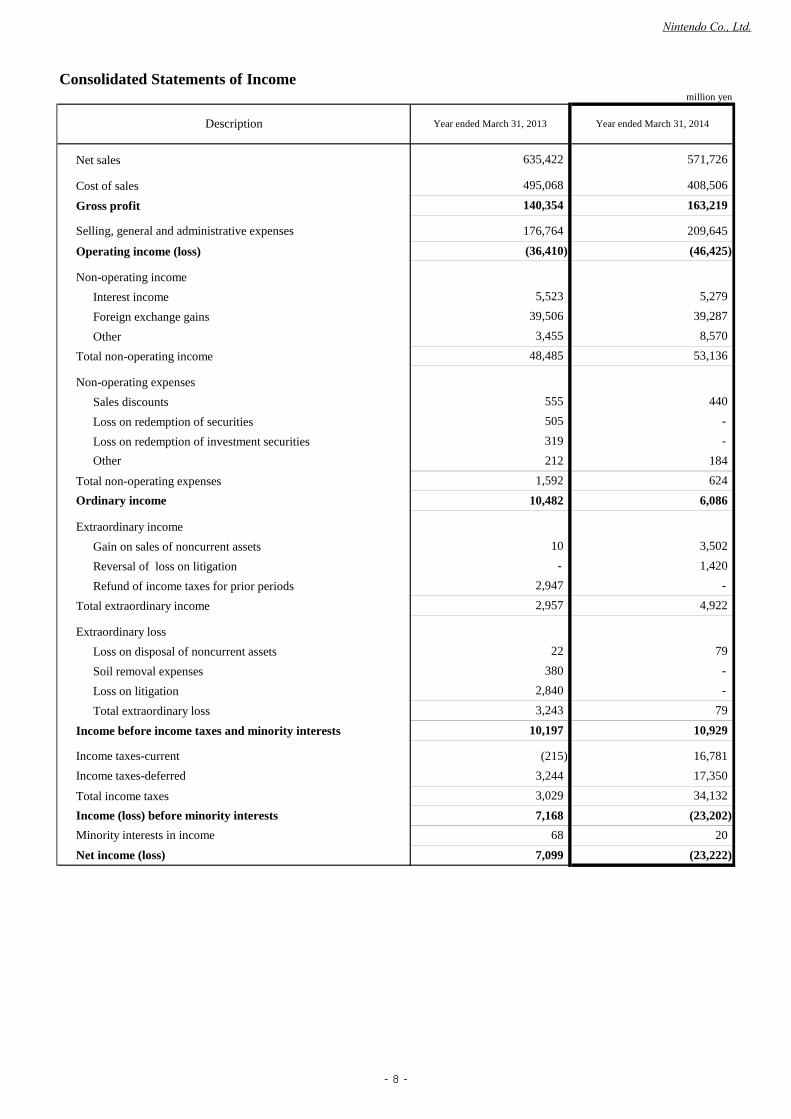
Bros. U” and “New Super Luigi U” became million-seller titles, the “Wii U” business as a whole showed slowgrowth. The global sales of the “Wii U” hardware and software reached only 2.72 million and 18.86 millionunits respectively.Regarding “Nintendo DS (DS, DS Lite, DSi and DSi XL),” the global sales of its hardware and software were0.13 million and 10.29 million units respectively. Also, the sales of the “Wii” hardware and software were 1.22million and 26.16 million units respectively.Net sales as a result were 571.7 billion yen (of which overseas sales were 394.7 billion yen or 69.0% of thetotal sales). The “Wii U” hardware still has a negative impact on Nintendo’s profits owing mainly to itsmarkdown in the United States and Europe, and unit sales of software, which has high profit margins, did notgrow sufficiently, leading to a gross profit of 163.2 billion yen. Total selling, general and administrativeexpenses exceeded gross profit, resulting in an operating loss of 46.4 billion yen. Also, due to depreciation ofthe yen at the end of this period compared with the one at the end of the last fiscal year, exchange gains totaled39.2 billion yen, leading to an ordinary income of 6.0 billion yen. On the other hand, mainly due to the balanceof deferred tax assets reduced in relation to the losses carried over in the United States, there is a net loss of23.2 billion yen.
(2) Outlook for fiscal year ending March 31, 2015For “Nintendo 3DS,” its consolidated global hardware sales reached 43 million units, which represent asufficient installed base upon which to expand software sales. In terms of software, “Mario Golf: World Tour”was released in May globally. Also, “Tomodachi Life,” a title that sold 1.85 million units on a cumulativebasis in the Japanese market, in which players can enjoy watching over the carefree daily lives of the virtualcharacters (Miis) of themselves and those close to them, will be released in the United States and Europe inJune. Also, “Super Smash Bros. for Nintendo 3DS” will be released globally in the upcoming summer. Bycontinuing to provide key titles throughout the next fiscal year, too, Nintendo will strive to generate robustprofits from the “Nintendo 3DS” platform business.Regarding “Wii U,” which still faces a challenging sales situation, Nintendo will focus on efforts that seek tostimulate the platform. By providing software that takes advantage of the “Wii U GamePad,” utilizing itsbuilt-in functionality as an NFC reader/writer, and adding “Nintendo DS” Virtual Console titles to the “WiiU” software lineup, Nintendo will seek to enrich the value of the “Wii U GamePad,” the most importantdifferentiator of “Wii U,” and as a result expand the sales of the “Wii U” platform. In terms of compatiblesoftware, by positioning “Mario Kart 8,” scheduled to be released globally in May, and “Super Smash Bros.for Wii U,” scheduled to be released this winter, as two main drivers, both of which are titles that a wide rangeof consumers can enjoy either alone or with other players, Nintendo will seek to supply high quality games ona continuous basis. Moreover, Nintendo will also strive to proactively pursue its digital distribution businessthrough the “Nintendo eShop.”Based on these efforts, we project for the fiscal year ending March 31, 2015 net sales of 590.0 billion yen, anoperating income of 40.0 billion yen, an ordinary income of 35.0 billion yen and a net income of 20.0 billionyen. Unit sales of the major products used for the forecast are listed on page 15 under the heading of “(5)Consolidated sales units, number of new titles, and sales units forecast” in the “Others” section. Exchange rateassumptions for the major currencies used for the forecasts are 100 yen per U.S. dollar and 140 yen per euro.
Nintendo Co., Ltd.
- 3 -
2. Financial Positions
Net cash provided by (used in) operating activities:
Net cash provided by (used in) investing activities:
Net cash provided by (used in) financing activities:
Cash flow index trend
% % % % %
[Notes] Capital adequacy ratio: The sum of total "Shareholders' equity" and total "Accumulated other comprehensive income" divided by total assets
Capital adequacy ratio at market value: Total market value of stocks divided by total assets
*Percentage figures are calculated on a consolidated basis.
*Total market value of stocks is calculated by multiplying closing price by the number of shares outstanding (excluding treasury stock) at the end of the period.
As ofMarch 31, 2014
Capital adequacy ratio at market value
Capital adequacy ratio 75.9
227.3
As ofMarch 31, 2010
As ofMarch 31, 2011
As ofMarch 31, 2012
As ofMarch 31, 2013
116.3
87.0
175.8
78.4
111.1
85.6
89.3
84.8
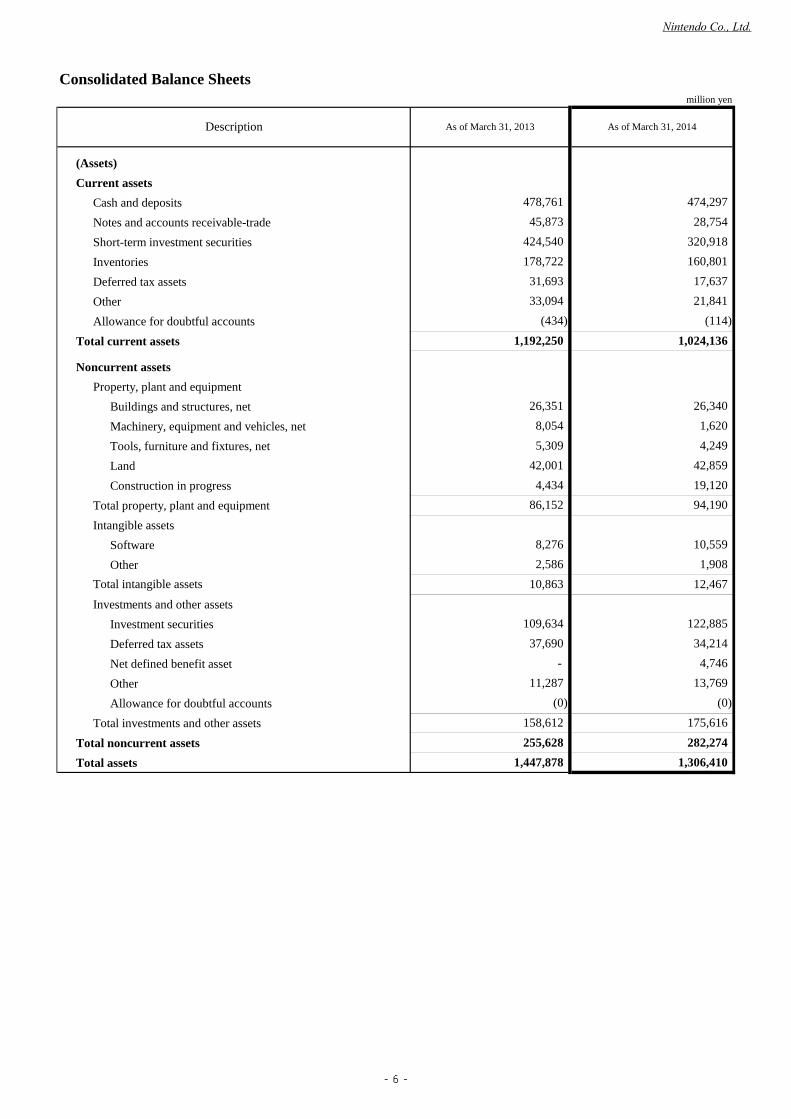
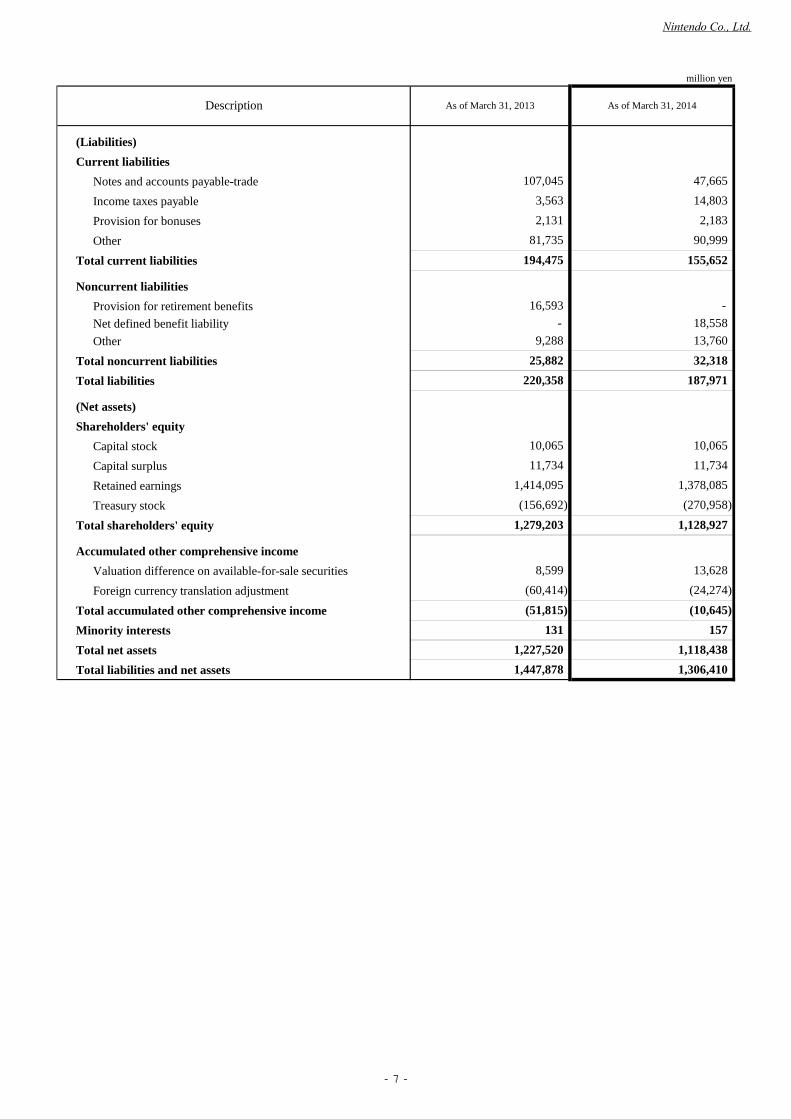
(1) Situation of assets, liabilities, and net assetsTotal assets decreased overall by 141.4 billion yen compared with the previous fiscal year-end to 1,306.4billion yen mainly due to a decrease in short-term investment securities and inventories. Total liabilitiesdecreased by 32.3 billion yen compared to the previous fiscal year-end to 187.9 billion yen mainly due to adecrease in notes and accounts payable-trade. Net assets decreased by 109.0 billion yen compared to theprevious fiscal year-end to 1,118.4 billion yen mainly from the acquisition of treasury stock.
(2) Situation of cash flowThe ending balance of “Cash and cash equivalents” (collectively, “Cash”) as of March 31, 2014 was 341.2billion yen, with a decrease of 128.1 billion yen during the fiscal year. During the previous fiscal year, therewas an increase of 62.2 billion yen. Net increase (decrease) of Cash and contributing factors during the fiscalyear ended March 31, 2014 are as follows:
While there were increasing factors from settlements of notes and accounts receivable-trade, due to adecrease of notes and accounts payable-trade, net cash resulted in a decrease of 23.1 billion yen compared toa decrease of 40.3 billion yen last year.
Net cash from investing activities decreased by 20.0 billion yen compared to an increase of 89.1 billion yenlast year mainly due to purchases of property, plant and equipment as well as intangible assets pertaining tothe construction of the Development Center.
Net cash from financing activities decreased by 127.1 billion yen compared to a decrease of 12.8 billionyen last year mainly due to the acquisition of treasury stock.
[Note] Forecasts announced by the Company referred to above were prepared based on management’sassumptions with information available at this time and therefore involve known and unknown risks anduncertainties. Please note such risks and uncertainties may cause the actual results to be materially differentfrom the forecasts (earnings forecast, dividend forecast and other forecasts).
Nintendo Co., Ltd.
- 4 -
3. Basic Policy of Profit Distribution and Dividends
4. Management Policy
It is the Company’s basic policy to internally provide the capital necessary to fund future growth, includingcapital investments, and to maintain a strong and liquid financial position in preparation for changes in thebusiness environment and intensified competition. As for direct profit returns to our shareholders, dividends arepaid based on profit levels achieved in each fiscal period.The annual dividend per share will be established at the higher of the amount calculated by dividing 33% ofconsolidated operating income by the total number of outstanding shares, excluding treasury stock, as of the endof the fiscal year rounded up to the 10 yen digit, and the amount calculated based on the 50% consolidated netincome standard rounded up to the 10 yen digit.The end of 2nd quarter (interim) dividend per share is calculated by dividing 33% of consolidated operatingincome by the total number of outstanding shares, excluding treasury stock, as of the end of the six-monthperiod rounded up to the 10 yen digit.According to this policy, there would be no annual dividend per share this fiscal year. However, on the basis ofour dividends paid in the last two years, the annual dividend per share is 100 yen (no interim dividends, and anannual dividend of 100 yen per share).If the actual consolidated financial results for the fiscal year ending March 31, 2015 are as projected in ourforecasts, the annual dividend per share will be 120 yen. The end of 2nd quarter dividends are yet to bedetermined as there are no interim financial forecasts, but there are no changes to our dividend policy.Retained earnings are maintained for effective use in research of new technology and development of newproducts, capital investments and securing materials, enhancement of selling power including advertisements,and common stock buyback whenever deemed appropriate.
(1) Basic management policyIn the field of home entertainment, Nintendo strives to create new and unique forms of entertainment whilemaintaining a robust business structure.Nintendo places the highest emphasis on providing consumers with innovative entertainment that has neverbeen experienced.
(3) Medium and long-term management strategy and challengesIn the belief that the true value of entertainment lies in individuality, Nintendo continues to provide uniqueproducts and services by positioning as its core management strategy the dedicated video game platformbusiness of hardware and software integration, in which Nintendo can best leverage its strengths. In addition,by introducing Nintendo Network IDs and taking advantage of smart devices, for example, Nintendo strives tostrengthen its efforts to build a long-term relationship with its consumers and expand the market of its ownplatforms.Moreover, by redefining entertainment as something that improves people’s QOL (Quality of Life) inenjoyable ways, Nintendo aims to deploy a new platform business that improves people’s QOL in enjoyableways in a new field that is different from that of dedicated video game systems. The first theme will be health,and Nintendo plans to capitalize on being an entertainment company in devising a unique approach of its own.In addition, Nintendo strives to utilize its abundance of character IP more actively, providing its IP with moreexposure in places other than video games, while achieving a certain level of profit from its licensing businessat the same time.With its mission to pleasantly surprise consumers and put smiles on the faces of everyone it touches, Nintendo
will continue to offer new and unique propositions and contribute to the development of the homeentertainment industry.
(2) Targeted management indexIn the home entertainment industry, it is essential to provide new and entertaining products consistently.
Upon accomplishing this, Nintendo aims to improve its corporate value by sustaining robust growth andincreasing profit. Because Nintendo deals with entertainment products, which by nature hold manyuncertainties in terms of their product development, and operates in a market which involves intensecompetition, flexible business decisions are made without being constrained by any specific managementindex.
Nintendo Co., Ltd.
- 5 -
Consolidated Balance Sheetsmillion yen
(Assets)
Current assets
Cash and deposits
Notes and accounts receivable-trade
Short-term investment securities
Inventories
Deferred tax assets
Other
Allowance for doubtful accounts
Total current assets
Noncurrent assets
Property, plant and equipment
Buildings and structures, net
Machinery, equipment and vehicles, net
Tools, furniture and fixtures, net
Land
Construction in progress
Total property, plant and equipment
Intangible assets
Software
Other
Investments and other assets
Investment securities
Deferred tax assets
Net defined benefit asset
Other
Allowance for doubtful accounts
Total investments and other assets
Total noncurrent assets
Total assets 1,447,878 1,306,410
255,628
(0) (0)
282,274
4,746
34,214
11,287 13,769
-
37,690
8,276 10,559
2,586 1,908
109,634 122,885
86,152 94,190
26,351 26,340
8,054 1,620
1,192,250 1,024,136
33,094 21,841
(434) (114)
478,761 474,297
160,801
424,540
Description
45,873
As of March 31, 2013
Total intangible assets
158,612 175,616
10,863
As of March 31, 2014
28,754
31,693 17,637
178,722
320,918
12,467
5,309 4,249
42,001 42,859
4,434 19,120
Nintendo Co., Ltd.
- 6 -
million yen
(Liabilities)
Current liabilities
Notes and accounts payable-trade
Income taxes payable
Provision for bonuses
Other
Total current liabilities
Noncurrent liabilities
Provision for retirement benefits
Net defined benefit liability
Other
Total noncurrent liabilities
Total liabilities
(Net assets)
Shareholders' equity
Capital stock
Capital surplus
Retained earnings
Treasury stock
Total shareholders' equity
Accumulated other comprehensive income
Valuation difference on available-for-sale securities
Foreign currency translation adjustment
Total accumulated other comprehensive income
Minority interests
Total net assets
Total liabilities and net assets 1,447,878 1,306,410
157
1,227,520 1,118,438
131
(24,274)
(51,815) (10,645)
(60,414)
1,128,927
8,599 13,628
1,279,203
1,378,085
(156,692) (270,958)
1,414,095
10,065
11,734 11,734
10,065
32,318
220,358 187,971
25,882
- 18,558
16,593 -
194,475
81,735 90,999
155,652
3,563 14,803
2,131 2,183
Description As of March 31, 2013
107,045 47,665
9,288 13,760
As of March 31, 2014
Nintendo Co., Ltd.
- 7 -
Consolidated Statements of Incomemillion yen
Net sales
Cost of sales
Gross profit
Operating income (loss)
Non-operating income
Interest income
Foreign exchange gains
Other
Total non-operating income
Non-operating expenses
Sales discounts
Loss on redemption of securities
Loss on redemption of investment securities
Total non-operating expenses
Extraordinary income
Gain on sales of noncurrent assets
Reversal of loss on litigation
Refund of income taxes for prior periods
Total extraordinary income
Extraordinary loss
Loss on disposal of noncurrent assets
Soil removal expenses
Loss on litigation
Total extraordinary loss
Income before income taxes and minority interests
Total income taxes
(23,222)
Minority interests in income 68
Net income (loss) 7,099
17,350
3,029 34,132
Income (loss) before minority interests 7,168 (23,202)
Income taxes-current (215)
20
16,781
Income taxes-deferred 3,244
10,197 10,929
3,243 79
22 79
380 -
2,840 -
2,957 4,922
10 3,502
- 1,420
Other 212 184
1,592 624
Ordinary income 10,482
555 440
505 -
3,455 8,570
48,485 53,136
5,523 5,279
39,506 39,287
(36,410) (46,425)
140,354
495,068 408,506
163,219
Selling, general and administrative expenses 176,764 209,645
Description
635,422 571,726
2,947 -
6,086
319 -
Year ended March 31, 2014Year ended March 31, 2013
Nintendo Co., Ltd.
- 8 -
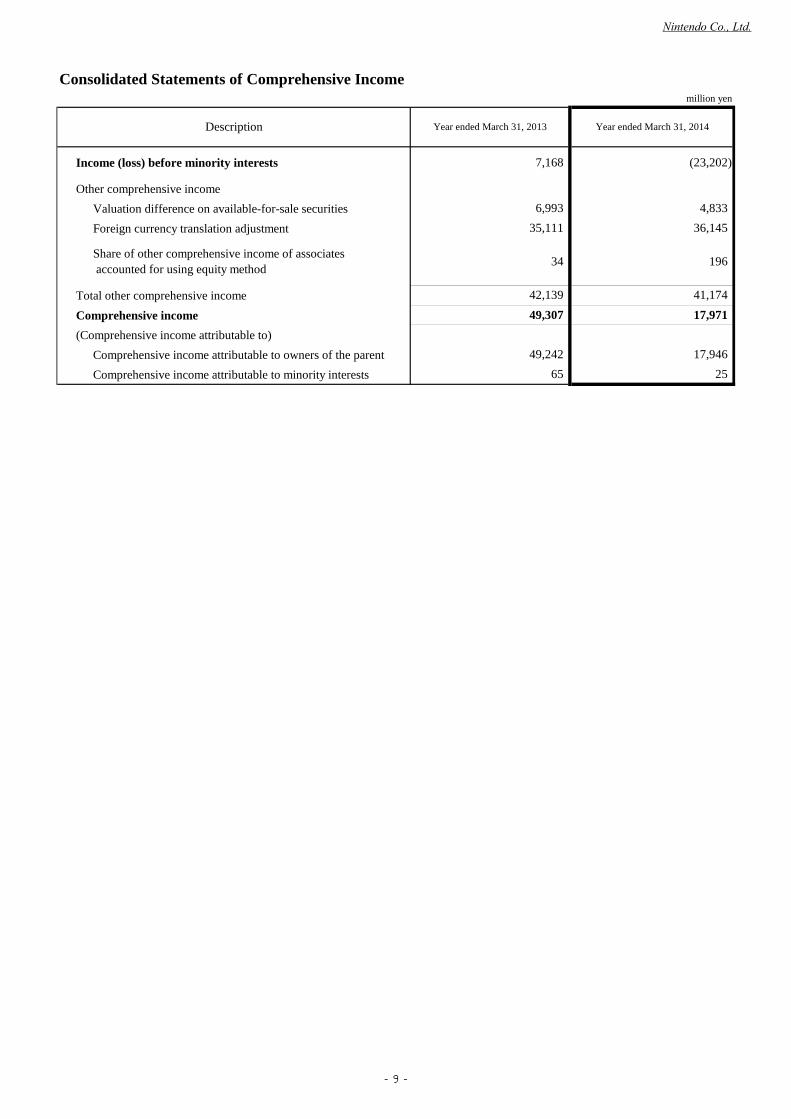
Consolidated Statements of Comprehensive Incomemillion yen
Other comprehensive income
Valuation difference on available-for-sale securities
Foreign currency translation adjustment
Total other comprehensive income
Comprehensive income
(Comprehensive income attributable to)
Comprehensive income attributable to owners of the parent
Comprehensive income attributable to minority interests 65 25
42,139
49,242 17,946
196
35,111
41,174
49,307 17,971
4,833
36,145
Share of other comprehensive income of associates accounted for using equity method
34
Description
Income (loss) before minority interests 7,168
6,993
(23,202)
Year ended March 31, 2013 Year ended March 31, 2014
Nintendo Co., Ltd.
- 9 -
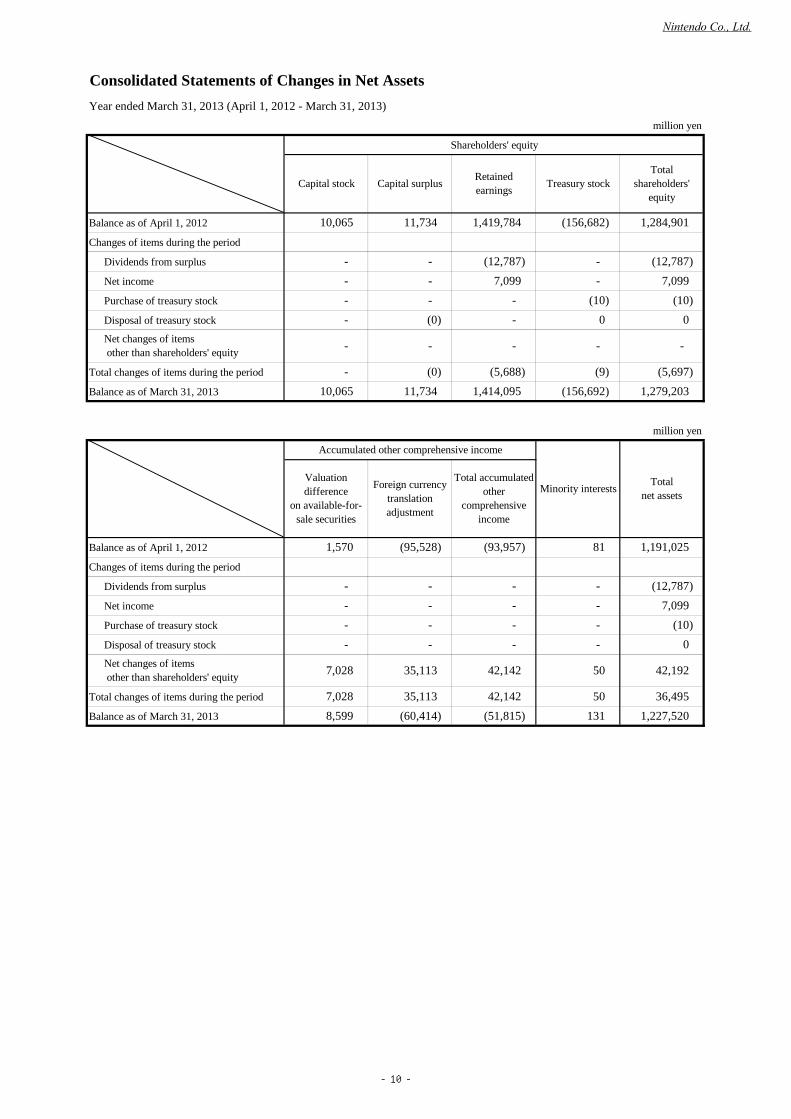
Consolidated Statements of Changes in Net Assets
Year ended March 31, 2013 (April 1, 2012 - March 31, 2013)
million yen
Shareholders' equity
Balance as of April 1, 2012
Changes of items during the period
Dividends from surplus
Net income
Purchase of treasury stock
Disposal of treasury stock
Total changes of items during the period
Balance as of March 31, 2013
million yen
Balance as of April 1, 2012
Changes of items during the period
Dividends from surplus
Net income
Purchase of treasury stock
Disposal of treasury stock
Total changes of items during the period
Balance as of March 31, 2013
(12,787)
7,099
(10)
0
42,142 36,49550
-
-
1,227,520131(51,815)
1,279,203(156,692)
50
81
-
Totalnet assets
42,192
1,191,025
-
(10)
0
(9)
- -
(5,697)
(10)
0
Net changes of items other than shareholders' equity
Minority interests
Net changes of items other than shareholders' equity
- -
- (0)
11,734
-
35,113
-
-
42,1427,028
-
-
-
-
-
-
-
-
10,065
- -
(0)
Total accumulatedother
comprehensiveincome
(93,957)
Accumulated other comprehensive income
-
-
-
(5,688)
1,414,095
10,065 11,734
(12,787)
-
-
-
(12,787) -
7,099 7,099
Totalshareholders'
equity
1,419,784 (156,682) 1,284,901
Retainedearnings
- -
Treasury stockCapital stock Capital surplus
8,599
Valuationdifference
on available-for-sale securities
Foreign currencytranslationadjustment
7,028
1,570 (95,528)
35,113
(60,414)
-
-
Nintendo Co., Ltd.
- 10 -
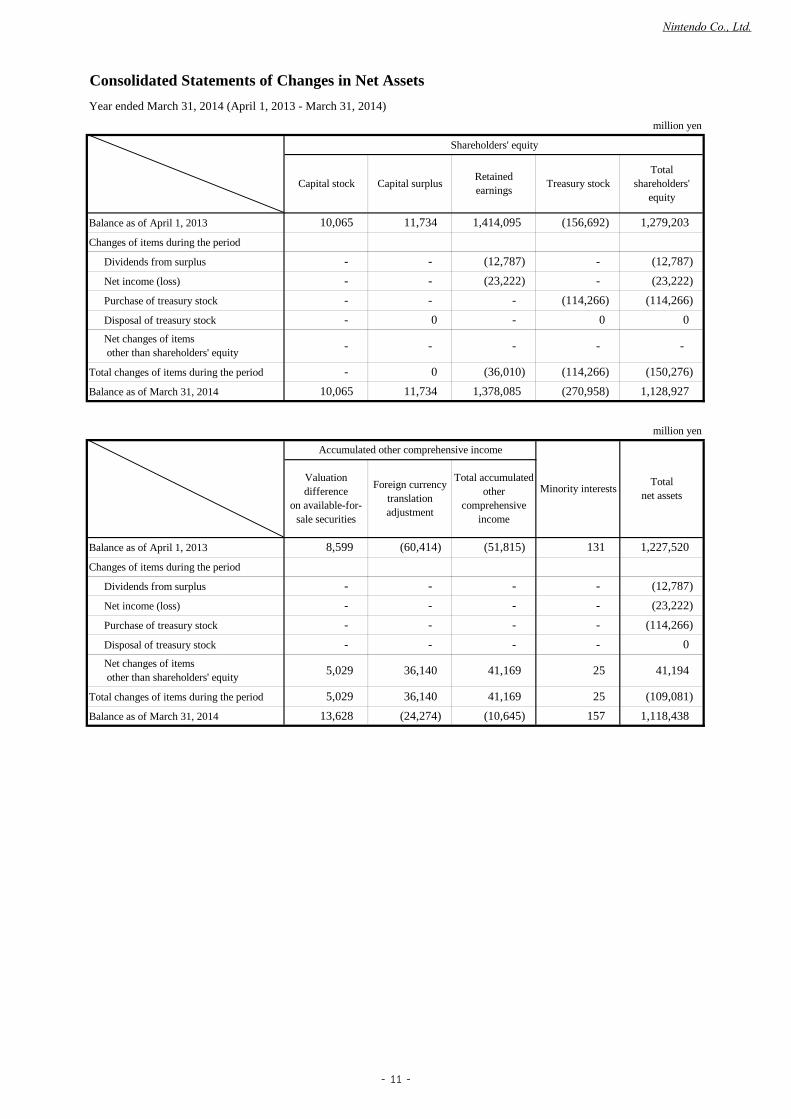
Consolidated Statements of Changes in Net Assets
Year ended March 31, 2014 (April 1, 2013 - March 31, 2014)
million yen
Shareholders' equity
Balance as of April 1, 2013
Changes of items during the period
Dividends from surplus
Net income (loss)
Purchase of treasury stock
Disposal of treasury stock
Total changes of items during the period
Balance as of March 31, 2014
million yen
Balance as of April 1, 2013
Changes of items during the period
Dividends from surplus
Net income (loss)
Purchase of treasury stock
Disposal of treasury stock
Total changes of items during the period
Balance as of March 31, 2014
(12,787)
(23,222)
(114,266)
0
41,169 (109,081)25
-
-
1,118,438157(10,645)
1,128,927(270,958)
25
131
-
Totalnet assets
41,194
1,227,520
-
(114,266)
0
(114,266)
- -
(150,276)
(114,266)
0
Net changes of items other than shareholders' equity
Minority interests
Net changes of items other than shareholders' equity
- -
- 0
11,734
-
36,140
-
-
41,1695,029
-
-
-
-
-
-
-
-
10,065
- -
0
Total accumulatedother
comprehensiveincome
(51,815)
Accumulated other comprehensive income
-
-
-
(36,010)
1,378,085
10,065 11,734
(12,787)
-
-
-
(12,787) -
(23,222) (23,222)
Totalshareholders'
equity
1,414,095 (156,692) 1,279,203
Retainedearnings
- -
Treasury stockCapital stock Capital surplus
13,628
Valuationdifference
on available-for-sale securities
Foreign currencytranslationadjustment
5,029
8,599 (60,414)
36,140
(24,274)
-
-
Nintendo Co., Ltd.
- 11 -
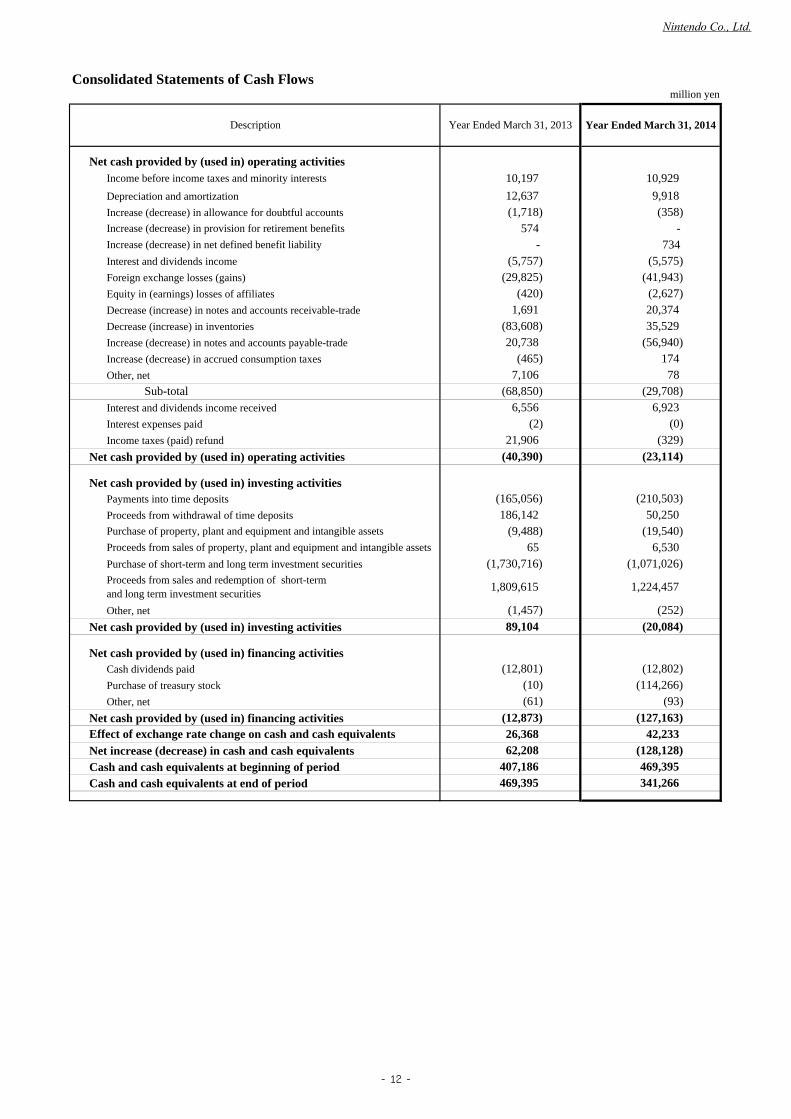
Consolidated Statements of Cash Flowsmillion yen
Net cash provided by (used in) operating activities
Depreciation and amortization
Increase (decrease) in allowance for doubtful accounts
Interest and dividends income
Foreign exchange losses (gains)
Equity in (earnings) losses of affiliates
Decrease (increase) in notes and accounts receivable-trade
Decrease (increase) in inventories
Increase (decrease) in notes and accounts payable-trade
Increase (decrease) in accrued consumption taxes
Other, net
Interest and dividends income received
Interest expenses paid
Income taxes (paid) refund
Net cash provided by (used in) operating activities
Net cash provided by (used in) investing activitiesPayments into time deposits
Proceeds from withdrawal of time deposits
Purchase of short-term and long term investment securities
Other, net
Net cash provided by (used in) investing activities
Net cash provided by (used in) financing activitiesCash dividends paid
Purchase of treasury stock
Other, net
Net cash provided by (used in) financing activities
Net increase (decrease) in cash and cash equivalentsCash and cash equivalents at beginning of periodCash and cash equivalents at end of period
734
Purchase of property, plant and equipment and intangible assets
Proceeds from sales of property, plant and equipment and intangible assets
(10) (114,266)
(5,575)
20,738(465)
- (358)
6,530
(329)(0)
17478
(29,708)
50,250
35,529(56,940)
20,374
Effect of exchange rate change on cash and cash equivalents
469,395
Income before income taxes and minority interests 10,197
12,637
(420)1,691
574Increase (decrease) in net defined benefit liability
(9,488)
(1,730,716)
21,906(2)
(12,873)
(210,503)
(19,540)
407,18662,208
7,106
1,809,615
186,142
(40,390)
1,224,457
(1,071,026)
(93)
(12,802)
(1,457)
469,395
26,368
(23,114)
(61)
(12,801)
(165,056)
65
(20,084)
6,556
42,233(127,163)
89,104
6,923
341,266
(128,128)
Proceeds from sales and redemption of short-termand long term investment securities
(29,825) (41,943)
(68,850)
(2,627)
Sub-total
(252)
Year Ended March 31, 2013 Year Ended March 31, 2014
(83,608)
Increase (decrease) in provision for retirement benefits
(1,718)
Description
(5,757)-
10,929
9,918
Nintendo Co., Ltd.
- 12 -
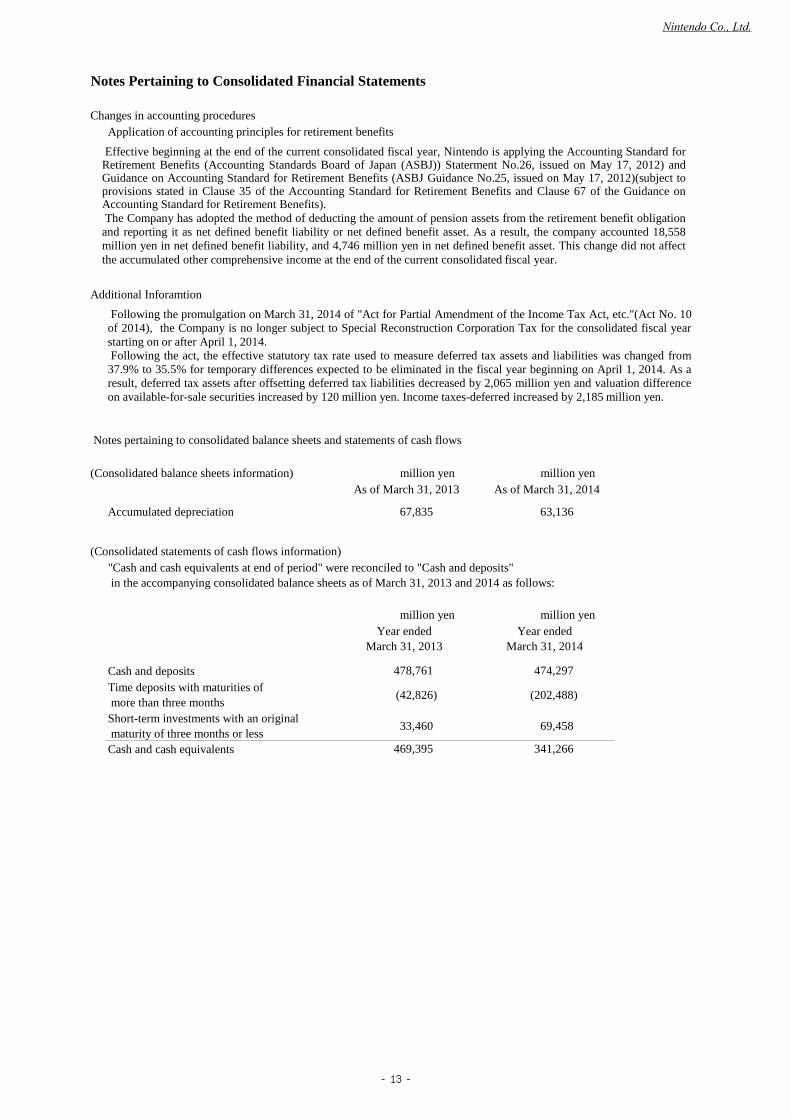
Notes Pertaining to Consolidated Financial Statements
Changes in accounting proceduresApplication of accounting principles for retirement benefits
Additional Inforamtion
(Consolidated balance sheets information) million yen million yenAs of March 31, 2013 As of March 31, 2014
(Consolidated statements of cash flows information)
million yen million yen
Cash and deposits
Cash and cash equivalents
(42,826)
33,460
(202,488)
69,458
Year endedMarch 31, 2013
Year endedMarch 31, 2014
478,761 474,297
469,395 341,266
Short-term investments with an original maturity of three months or less
Notes pertaining to consolidated balance sheets and statements of cash flows
Accumulated depreciation
"Cash and cash equivalents at end of period" were reconciled to "Cash and deposits" in the accompanying consolidated balance sheets as of March 31, 2013 and 2014 as follows:
Time deposits with maturities of more than three months
63,13667,835
Effective beginning at the end of the current consolidated fiscal year, Nintendo is applying the Accounting Standard forRetirement Benefits (Accounting Standards Board of Japan (ASBJ)) Staterment No.26, issued on May 17, 2012) andGuidance on Accounting Standard for Retirement Benefits (ASBJ Guidance No.25, issued on May 17, 2012)(subject toprovisions stated in Clause 35 of the Accounting Standard for Retirement Benefits and Clause 67 of the Guidance onAccounting Standard for Retirement Benefits).The Company has adopted the method of deducting the amount of pension assets from the retirement benefit obligation
and reporting it as net defined benefit liability or net defined benefit asset. As a result, the company accounted 18,558million yen in net defined benefit liability, and 4,746 million yen in net defined benefit asset. This change did not affectthe accumulated other comprehensive income at the end of the current consolidated fiscal year.
Following the promulgation on March 31, 2014 of "Act for Partial Amendment of the Income Tax Act, etc."(Act No. 10of 2014), the Company is no longer subject to Special Reconstruction Corporation Tax for the consolidated fiscal yearstarting on or after April 1, 2014.Following the act, the effective statutory tax rate used to measure deferred tax assets and liabilities was changed from
37.9% to 35.5% for temporary differences expected to be eliminated in the fiscal year beginning on April 1, 2014. As aresult, deferred tax assets after offsetting deferred tax liabilities decreased by 2,065 million yen and valuation differenceon available-for-sale securities increased by 120 million yen. Income taxes-deferred increased by 2,185 million yen.
Nintendo Co., Ltd.
- 13 -
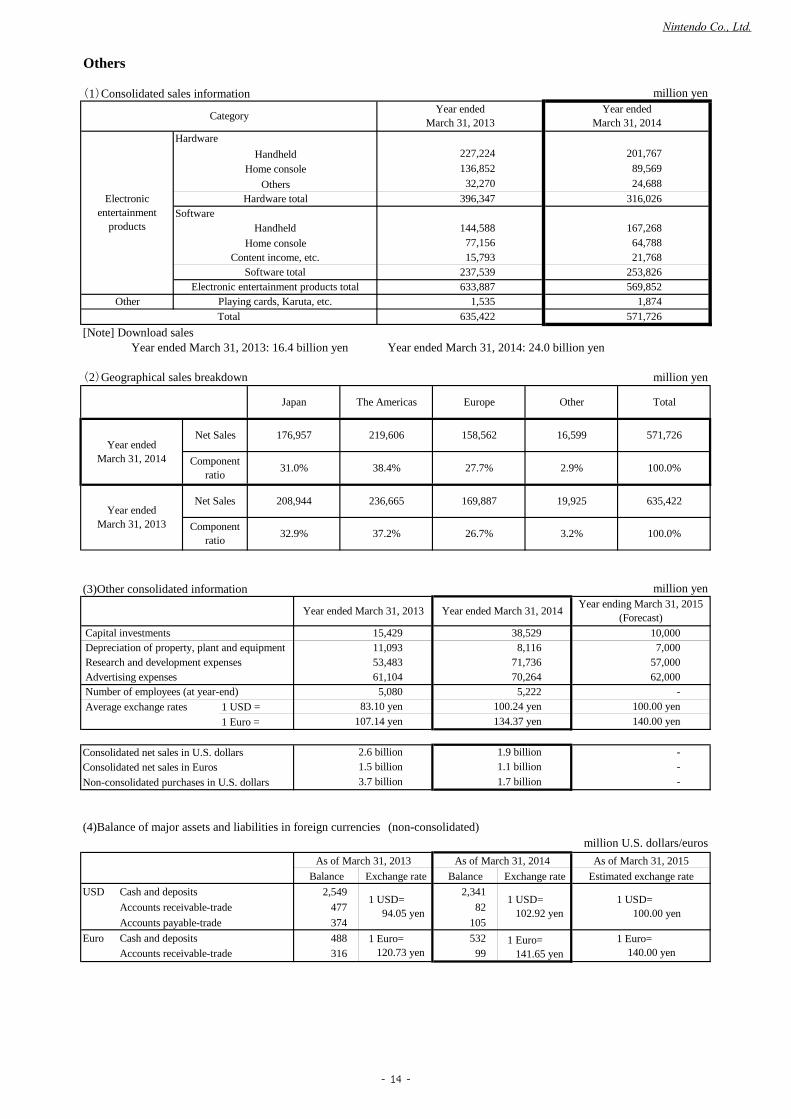
Others
(1)Consolidated sales information
[Note] Download sales Year ended March 31, 2013: 16.4 billion yen Year ended March 31, 2014: 24.0 billion yen
(2)Geographical sales breakdown
(3)Other consolidated information
Average exchange rates 1 USD =
1 Euro =
Consolidated net sales in U.S. dollarsConsolidated net sales in Euros
Non-consolidated purchases in U.S. dollars
USD
Accounts receivable-trade
Accounts payable-trade
Euro
Accounts receivable-trade
176,957 219,606 158,562
27.7%38.4%
OtherTotal
Japan The Americas
Estimated exchange rate
Year endedMarch 31, 2014
Year endedMarch 31, 2013 Component
ratio
Componentratio
Cash and deposits
100.0%31.0%
Net Sales 208,944
Cash and deposits
53,48361,1045,080
Balance Exchange rate
3.7 billion
(4)Balance of major assets and liabilities in foreign currencies (non-consolidated)
71,736
32.9%
236,665
37.2%
169,887
Capital investments
Net Sales
15,793
Year ended March 31, 2014
Playing cards, Karuta, etc.
Number of employees (at year-end) Advertising expenses
Depreciation of property, plant and equipment Research and development expenses
38,5298,116
237,539
1,535
5,222
million yen
16,599
2.9%
Europe
Year ending March 31, 2015(Forecast)
1,874571,726
million yen
253,826569,852
571,726
26.7%
19,925
3.2%
635,422
100.0%
635,422
Other Total
201,767
89,56924,688
316,026
633,887
167,26864,78821,768
Electronicentertainment
products
Others
144,58877,156
227,224
136,85232,270
396,347
Software totalElectronic entertainment products total
140.00 yen
70,264
7,00057,00062,000
Year endedMarch 31, 2013
Year endedMarch 31, 2014
million yen
15,429
HandheldHome console
Year ended March 31, 2013
10,000
Category
-100.00 yen
As of March 31, 2015
million U.S. dollars/euros
---
1.1 billion
477
As of March 31, 2013 As of March 31, 2014
Balance Exchange rate
2,341
82
374
488
1.7 billion
83.10 yen 100.24 yen134.37 yen
2.6 billion1.5 billion
2,549
1.9 billion
316
Hardware
SoftwareHandheld
Home consoleContent income, etc.
11,093
107.14 yen
Hardware total
1 USD= 100.00 yen
1 Euro= 140.00 yen
1 USD= 94.05 yen
1 Euro= 120.73 yen
1 Euro= 141.65 yen
1 USD= 102.92 yen
532
99
105
Nintendo Co., Ltd.
- 14 -
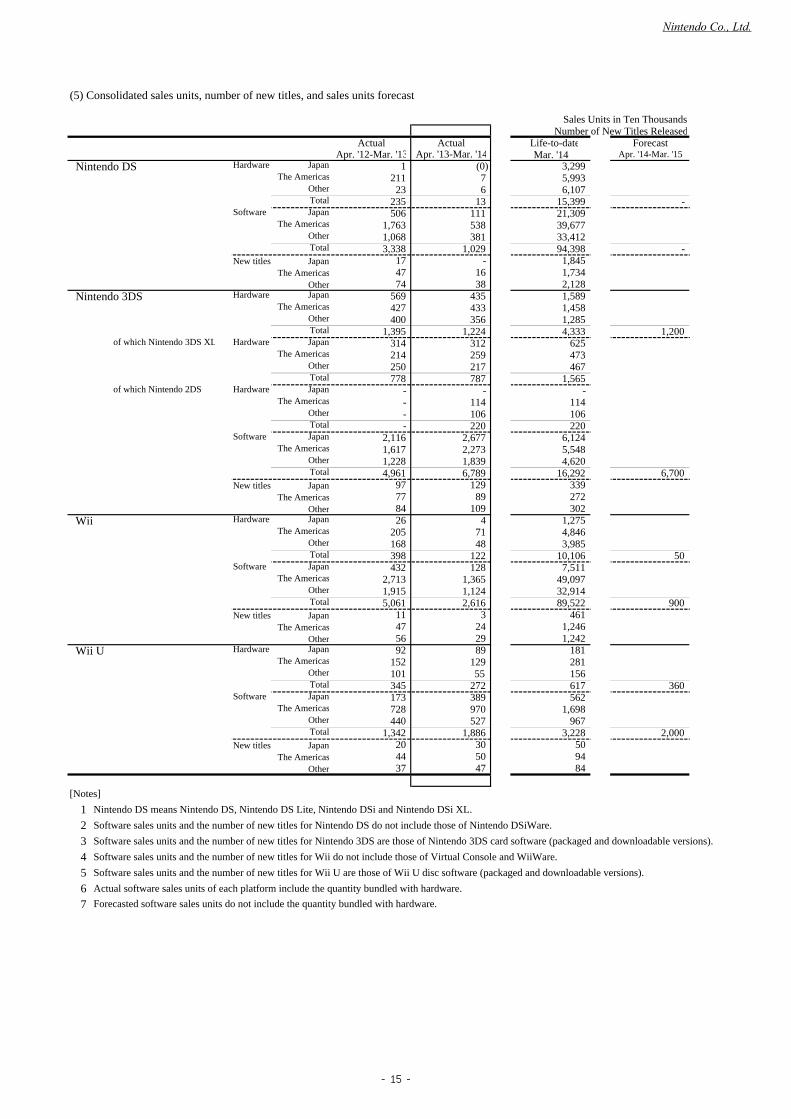
(5) Consolidated sales units, number of new titles, and sales units forecast
Sales Units in Ten ThousandsNumber of New Titles Released
Actual Actual Life-to-date ForecastMar. '14
Nintendo DS Hardware JapanThe Americas
OtherTotal
Software JapanThe Americas
OtherTotal
New titles JapanThe Americas
Other Nintendo 3DS Hardware Japan
The AmericasOtherTotal
of which Nintendo 3DS XL Hardware JapanThe Americas
OtherTotal
of which Nintendo 2DS Hardware JapanThe Americas
OtherTotal
Software JapanThe Americas
OtherTotal
New titles JapanThe Americas
Other Wii Hardware Japan
The AmericasOtherTotal
Software JapanThe Americas
OtherTotal
New titles JapanThe Americas
Other Wii U Hardware Japan
The AmericasOtherTotal
Software JapanThe Americas
OtherTotal
New titles JapanThe Americas
Other
[Notes]
1 Nintendo DS means Nintendo DS, Nintendo DS Lite, Nintendo DSi and Nintendo DSi XL.
2 Software sales units and the number of new titles for Nintendo DS do not include those of Nintendo DSiWare.
3 4 Software sales units and the number of new titles for Wii do not include those of Virtual Console and WiiWare.
5 Software sales units and the number of new titles for Wii U are those of Wii U disc software (packaged and downloadable versions).
6 Actual software sales units of each platform include the quantity bundled with hardware.
7
Software sales units and the number of new titles for Nintendo 3DS are those of Nintendo 3DS card software (packaged and downloadable versions).
Forecasted software sales units do not include the quantity bundled with hardware.
37 47 84
20 30 50 44 50 94
440 527 967 1,342 1,886 3,228 2,000
173 389 562 728 970 1,698
101 55 156 345 272 617 360
92 89 181 152 129 281
47 24 1,246 56 29 1,242
5,061 2,616 89,522 900 11 3 461
2,713 1,365 49,097 1,915 1,124 32,914
398 122 10,106 50 432 128 7,511
205 71 4,846 168 48 3,985
84 109 302 26 4 1,275
97 129 339 77 89 272
1,228 1,839 4,620 4,961 6,789 16,292 6,700
2,116 2,677 6,124 1,617 2,273 5,548
- 106 106 - 220 220
- - - - 114 114
250 217 467 778 787 1,565
314 312 625 214 259 473
400 356 1,285 1,395 1,224 4,333 1,200
569 435 1,589 427 433 1,458
74 38 2,128
17 - 1,845 47 16 1,734
1,068 381 33,412 3,338 1,029 94,398 -
506 111 21,309 1,763 538 39,677
- 23 6 6,107
235 13 15,399
1 (0) 3,299 211 7 5,993
Apr. '12-Mar. '13 Apr. '13-Mar. '14 Apr. '14-Mar. '15
Nintendo Co., Ltd.
- 15 -
Notice Regarding Changes of Officers
(1) Anticipated New Director
Director Naoki Mizutani(Current: Outside Auditor)(Current: Director, Mizutani Law and Patent Office)(Current: Visiting Professor, Graduate School of the Tokyo Institute of Technology)
* Mr. Naoki Mizutani is a candidate for Outside Director.* To be effective after receiving approval at the 74th Annual General Meeting of Shareholders that the company is planning to hold on June 27, 2014. If approved, Mr. Naoki Mizutani shall resign from the office of Auditor as of the adjournment of the General Meeting of Shareholders.
(2) Retiring Director
Kaoru Takemura, Director(Current: General Manager of Personnel Division)
* To be effective upon expiration of his term of office on June 27, 2014.
Nintendo Co., Ltd.
- 16 -