consolidated financial statements - rbc
TRANSCRIPT

110 Royal Bank of Canada: Annual Report 2007Consolidated Financial Statements
Reports
111 Management’s responsibility for financial reporting
111 Report of Independent Registered Chartered Accountants
112 Management’s report on internal control over financial reporting112 Report of Independent Registered Chartered Accountants
Consolidated Financial Statements
113 Consolidated Balance Sheets114 Consolidated Statements of Income115 Consolidated Statements of
Comprehensive Income 115 Consolidated Statements of Changes in
Shareholders’ Equity116 Consolidated Statements of Cash Flows
Notes to the Consolidated Financial Statements 117 Note 1 Significant accounting policies
and estimates124 Note 2 Fair value of financial instruments127 Note 3 Securities129 Note 4 Loans130 Note 5 Securitizations132 Note 6 Variable interest entities (VIEs)133 Note 7 Derivative financial instruments and hedging activities137 Note 8 Premises and equipment137 Note 9 RBC Dexia Investor Services joint venture138 Note 10 Goodwill and other intangibles139 Note 11 Significant acquisitions and
dispositions140 Note 12 Other assets141 Note 13 Deposits142 Note 14 Insurance 142 Note 15 Other liabilities143 Note 16 Subordinated debentures144 Note 17 Trust capital securities145 Note 18 Preferred share liabilities and
share capital147 Note 19 Non-controlling interest in
subsidiaries
148 Note 20 Pensions and other post-employment benefits
150 Note 21 Stock-based compensation153 Note 22 Trading revenue153 Note 23 Business realignment charges154 Note 24 Income taxes 155 Note 25 Earnings per share156 Note 26 Concentrations of credit risk156 Note 27 Guarantees, commitments
and contingencies159 Note 28 Contractual repricing and
maturity schedule160 Note 29 Related party transactions161 Note 30 Results by business and
geographic segment163 Note 31 Reconciliation of the application
of Canadian and United States generally accepted accounting principles
175 Note 32 Parent company information
110 Royal Bank of Canada: Annual Report 2007Consolidated Financial Statements
ConsolidatedFinancial Statements

Royal Bank of Canada: Annual Report 2007Consolidated Financial Statements
111
The accompanying consolidated financial statements of Royal Bank of Canada (RBC) were prepared by management, which is responsible for the integrity and fairness of the information presented, including the many amounts that must of necessity be based on estimates and judgments. These consolidated financial statements were prepared in accordance with Canadian generally accepted accounting principles (GAAP) pursuant to Subsection 308 of the Bank Act (Canada), which states that, except as otherwise specified by the Superintendent of Financial Institutions Canada, the financial statements are to be prepared in accordance with Canadian GAAP. Financial information appearing throughout our management’s discussion and analysis is consistent with these consolidated financial statements.
In discharging our responsibility for the integrity and fairness of the consolidated financial statements and for the accounting systems from which they are derived, we maintain the necessary system of internal controls designed to ensure that transactions are authorized, assets are safeguarded and proper records are maintained. These controls include quality standards in hiring and training of employees, policies and procedures manuals, a corporate code of conduct and accountability for performance within appropriate and well-defined areas of responsibility.
The system of internal controls is further supported by a compliance function, which is designed to ensure that we and our employees comply with securities legislation and conflict of interest rules, and by an internal audit staff, which conducts periodic audits of all aspects of our operations.
The Board of Directors oversees management’s responsibilities for financial reporting through an Audit Committee, which is composed entirely of directors who are neither officers nor employees of RBC.
This Committee reviews our consolidated financial statements and recommends them to the Board for approval. Other key responsibilities of the Audit Committee include reviewing our existing internal control procedures and planned revisions to those procedures, and advising the directors on auditing matters and financial reporting issues. Our Compliance Officer and Chief Internal Auditor have full and unrestricted access to the Audit Committee.
The Office of the Superintendent of Financial Institutions, Canada (OSFI) examines and inquires into the business and affairs of RBC as deemed necessary to determine whether the provisions of the Bank Act are being complied with, and that RBC is in sound financial condition. In carrying out its mandate, OSFI strives to protect the rights and interests of depositors and creditors of RBC.
Deloitte & Touche LLP, Independent Registered Chartered Accountants appointed by the shareholders of RBC upon the recom-mendation of the Audit Committee and Board, have performed an independent audit of the consolidated financial statements and their report follows. The auditors have full and unrestricted access to the Audit Committee to discuss their audit and related findings.
Gordon M. NixonPresident and Chief Executive Officer
Janice R. FukakusaChief Financial Officer
Toronto, November 29, 2007
To the Shareholders of Royal Bank of Canada
We have audited the consolidated balance sheets of Royal Bank of Canada (the “Bank”) as at October 31, 2007 and 2006 and the con-solidated statements of income, comprehensive income, changes in shareholders’ equity and cash flows for each of the three years in the period ended October 31, 2007. These financial statements are the responsibility of the Bank’s management. Our responsibility is to express an opinion on these financial statements based on our audits.
With respect to the consolidated financial statements as at and for the years ended October 31, 2007 and 2006, we conducted our audits in accordance with Canadian generally accepted auditing stan-dards and the standards of the Public Company Accounting Oversight Board (United States). With respect to the consolidated financial state-ments as at and for the year ended October 31, 2005, we conducted our audit in accordance with Canadian generally accepted auditing standards. These standards require that we plan and perform an audit to obtain reasonable assurance whether the financial statements are free of material misstatement. An audit includes examining, on a test basis, evidence supporting the amounts and disclosures in the financial statements. An audit also includes assessing the accounting principles used and significant estimates made by management, as well as evaluating the overall financial statement presentation. We believe that our audits provide a reasonable basis for our opinion.
In our opinion, these consolidated financial statements present fairly, in all material respects, the financial position of the Bank as at October 31, 2007 and 2006 and the results of its operations and its cash flows for each of the three years in the period ended October 31, 2007 in accordance with Canadian generally accepted accounting principles.
We have also audited, in accordance with the standards of the Public Company Accounting Oversight Board (United States), the Bank’s internal control over financial reporting as of October 31, 2007 based on criteria established in Internal Control – Integrated Framework issued by the Committee of Sponsoring Organizations of the Treadway Commission and our report dated November 29, 2007 expressed an unqualified opinion on the Bank’s internal control over financial reporting.
Deloitte & Touche LLP
Independent Registered Chartered AccountantsLicensed Public AccountantsToronto, CanadaNovember 29, 2007
Management’s responsibility for financial reporting
Report of Independent Registered Chartered Accountants
112 Royal Bank of Canada: Annual Report 2007Consolidated Financial Statements
To the Shareholders of Royal Bank of Canada
We have audited the internal control over financial reporting of Royal Bank of Canada (the “Bank”) as of October 31, 2007 based on criteria established in Internal Control – Integrated Framework issued by the Committee of Sponsoring Organizations of the Treadway Commission. The Bank’s management is responsible for maintaining effective internal control over financial reporting and for its assessment of the effectiveness of internal control over financial reporting, included in the accompanying Management’s Report on Internal Control over Financial Reporting. Our responsibility is to express an opinion on the Bank’s internal control over financial reporting based on our audit.
We conducted our audit in accordance with the standards of the Public Company Accounting Oversight Board (United States). Those standards require that we plan and perform the audit to obtain reason-able assurance about whether effective internal control over financial reporting was maintained in all material respects. Our audit included obtaining an understanding of internal control over financial reporting, assessing the risk that a material weakness exists, testing and evalu-ating the design and operating effectiveness of internal control based on the assessed risk, and performing such other procedures as we considered necessary in the circumstances. We believe that our audit provides a reasonable basis for our opinion.
A company’s internal control over financial reporting is a process designed by, or under the supervision of, the company’s principal executive and principal financial officers, or persons performing similar functions, and effected by the company’s board of directors, manage-ment, and other personnel to provide reasonable assurance regarding the reliability of financial reporting and the preparation of financial statements for external purposes in accordance with generally accepted accounting principles. A company’s internal control over financial reporting includes those policies and procedures that (1) pertain to the maintenance of records that, in reasonable detail, accurately and fairly reflect the transactions and dispositions of the assets of the company; (2) provide reasonable assurance that transactions are recorded as
necessary to permit preparation of financial statements in accordance with generally accepted accounting principles and that receipts and expenditures of the company are being made only in accordance with authorizations of management and directors of the company; and (3) provide reasonable assurance regarding prevention or timely detec-tion of unauthorized acquisition, use or disposition of the company’s assets that could have a material effect on the financial statements.
Because of the inherent limitations of internal control over financial reporting, including the possibility of collusion or improper manage-ment override of controls, material misstatements due to error or fraud may not be prevented or detected on a timely basis. Also, projections of any evaluation of the effectiveness of the internal control over finan-cial reporting to future periods are subject to the risk that the controls may become inadequate because of changes in conditions, or that the degree of compliance with the policies or procedures may deteriorate.
In our opinion, the Bank maintained, in all material respects, effective internal control over financial reporting as of October 31, 2007 based on the criteria established in Internal Control – Integrated Framework issued by the Committee of Sponsoring Organizations of the Treadway Commission.
We have also audited, in accordance with Canadian generally accepted auditing standards and the standards of the Public Company Accounting Oversight Board (United States), the consolidated financial statements as at and for the year ended October 31, 2007 of the Bank and our report dated November 29, 2007 expressed an unqualified opinion on those consolidated financial statements.
Deloitte & Touche LLPIndependent Registered Chartered AccountantsLicensed Public AccountantsToronto, CanadaNovember 29, 2007
Report of Independent Registered Chartered Accountants
Management of Royal Bank of Canada (RBC) is responsible for establish-ing and maintaining adequate internal control over financial reporting. Internal control over financial reporting is a process designed by, or under the supervision of, the President and Chief Executive Officer and the Chief Financial Officer and effected by the Board of Directors, man-agement and other personnel to provide reasonable assurance regarding the reliability of financial reporting and the preparation of financial statements for external purposes in accordance with generally accepted accounting principles. It includes those policies and procedures that:• pertain to the maintenance of records that accurately and fairly
reflect, in reasonable detail, the transactions related to and dispositions of RBC’s assets
• provide reasonable assurance that transactions are recorded as necessary to permit preparation of financial statements in accordance with generally accepted accounting principles, and RBC receipts and expenditures are made only in accordance with authorizations of management and RBC’s directors
• provide reasonable assurance regarding prevention or timely detec-tion of unauthorized acquisition, use, or disposition of RBC assets that could have a material effect on RBC’s financial statements.
Due to its inherent limitations, internal control over financial reporting may not prevent or detect misstatements on a timely basis. Also, pro-jections of any evaluation of the effectiveness of internal control over financial reporting to future periods are subject to the risk that the controls may become inadequate because of changes in conditions, or that the degree of compliance with the policies or procedures may deteriorate.
Management assessed the effectiveness of RBC’s internal control over financial reporting as of October 31, 2007, based on the criteria set forth in Internal Control – Integrated Framework issued by the Committee of Sponsoring Organizations of the Treadway Commission. Based on this assessment, management concluded that, as of October 31, 2007, RBC’s internal control over financial reporting is effective. Also, management determined that there were no material weaknesses in RBC’s internal control over financial reporting as of October 31, 2007.
RBC’s internal control over financial reporting as of October 31, 2007 has been audited by Deloitte & Touche LLP, Independent Registered Chartered Accountants, who also audited RBC’s Consoli-dated Financial Statements for the year ended October 31, 2007, as stated in the Report of Independent Registered Chartered Accountants, which report expressed an unqualified opinion on the effectiveness of RBC’s internal control over financial reporting.
Gordon M. NixonPresident and Chief Executive Officer
Janice R. FukakusaChief Financial Officer
Toronto, November 29, 2007
Management’s report on internal control over financial reporting

Royal Bank of Canada: Annual Report 2007Consolidated Financial Statements
113
Consolidated Balance Sheets
As at October 31 (C$ millions) 2007 2006
Assets Cash and due from banks $ 4,226 $ 4,401
Interest-bearing deposits with banks 11,881 10,502
Securities (Note 3) Trading 148,246 147,237 Available-for-sale 30,009 – Investments – 37,632
178,255 184,869
Assets purchased under reverse repurchase agreements and securities borrowed 64,313 59,378
Loans (Notes 4 and 5) Retail 169,462 151,050 Wholesale 69,967 58,889
239,429 209,939 Allowance for loan losses (1,493) (1,409)
237,936 208,530
Other Customers’ liability under acceptances 11,786 9,108 Derivatives (Note 7) 66,585 37,729 Premises and equipment, net (Note 8) 2,131 1,818 Goodwill (Note 10) 4,752 4,304 Other intangibles (Note 10) 628 642 Assets of operations held for sale – 82 Other assets (Note 12) 17,853 15,417
103,735 69,100
$ 600,346 $ 536,780
Liabilities and shareholders’ equity Deposits (Note 13) Personal $ 116,557 $ 114,040 Business and government 219,886 189,140 Bank 28,762 40,343
365,205 343,523
Other Acceptances 11,786 9,108 Obligations related to securities sold short 44,689 38,252 Obligations related to assets sold under repurchase agreements and securities loaned 37,033 41,103 Derivatives (Note 7) 72,010 42,094 Insurance claims and policy benefit liabilities (Note 14) 7,283 7,337 Liabilities of operations held for sale – 32 Other liabilities (Note 15) 28,483 22,649
201,284 160,575
Subordinated debentures (Note 16) 6,235 7,103
Trust capital securities (Note 17) 1,400 1,383
Preferred share liabilities (Note 18) 300 298
Non-controlling interest in subsidiaries (Note 19) 1,483 1,775
Shareholders’ equity (Note 18) Preferred shares 2,050 1,050 Common shares (shares issued – 1,276,260,033 and 1,280,889,745) 7,300 7,196 Contributed surplus 235 292 Treasury shares – preferred (shares held – 248,800 and 93,700) (6) (2) – common (shares held – 2,444,320 and 5,486,072) (101) (180) Retained earnings 18,167 15,771 Accumulated other comprehensive income (loss) (3,206) (2,004)
24,439 22,123
$ 600,346 $ 536,780
Gordon M. Nixon Robert B. PetersonPresident and Chief Executive Officer Director

114 Royal Bank of Canada: Annual Report 2007Consolidated Financial Statements
Consolidated Statements of Income
For the year ended October 31 (C$ millions) 2007 2006 2005
Interest income Loans $ 14,724 $ 12,708 $ 10,790 Securities 7,665 6,189 4,606 Assets purchased under reverse repurchase agreements and securities borrowed 3,450 2,827 1,354 Deposits with banks 538 480 231
26,377 22,204 16,981
Interest expense Deposits 13,770 10,708 6,946 Other liabilities 4,737 4,281 2,800 Subordinated debentures 338 419 442
18,845 15,408 10,188
Net interest income 7,532 6,796 6,793
Non-interest income Insurance premiums, investment and fee income 3,152 3,348 3,270 Trading revenue 2,261 2,574 1,594 Investment management and custodial fees 1,579 1,301 1,232 Mutual fund revenue 1,473 1,242 962 Securities brokerage commissions 1,353 1,243 1,163 Service charges 1,303 1,216 1,153 Underwriting and other advisory fees 1,217 1,024 1,026 Foreign exchange revenue, other than trading 533 438 407 Card service revenue 491 496 579 Credit fees 293 241 187 Securitization revenue (Note 5) 261 257 285 Net gain on sale of available-for-sale securities (Note 3) 63 – – Net gain on sale of investment securities – 88 85 Other 951 373 448
Non-interest income 14,930 13,841 12,391
Total revenue 22,462 20,637 19,184
Provision for credit losses (Note 4) 791 429 455
Insurance policyholder benefits, claims and acquisition expense 2,173 2,509 2,625
Non-interest expense Human resources (Notes 20 and 21) 7,860 7,268 6,682 Equipment 1,009 957 960 Occupancy 839 792 749 Communications 723 687 632 Professional fees 530 546 500 Outsourced item processing 308 298 296 Amortization of other intangibles (Note 10) 96 76 50 Other 1,108 871 1,488
12,473 11,495 11,357
Business realignment charges (Note 23) – – 45
Income from continuing operations before income taxes 7,025 6,204 4,702 Income taxes (Note 24) 1,392 1,403 1,278
Net income before non-controlling interest 5,633 4,801 3,424 Non-controlling interest in net income of subsidiaries 141 44 (13)
Net income from continuing operations 5,492 4,757 3,437 Net loss from discontinued operations – (29) (50)
Net income $ 5,492 $ 4,728 $ 3,387
Preferred dividends (Note 18) (88) (60) (42) Net gain on redemption of preferred shares – – 4
Net income available to common shareholders $ 5,404 $ 4,668 $ 3,349
Average number of common shares (in thousands) (Note 25) 1,273,185 1,279,956 1,283,433Basic earnings per share (in dollars) $ 4.24 $ 3.65 $ 2.61 Basic earnings per share from continuing operations (in dollars) $ 4.24 $ 3.67 $ 2.65 Basic earnings (loss) per share from discontinued operations (in dollars) $ – $ (.02) $ (.04)
Average number of diluted common shares (in thousands) (Note 25) 1,289,314 1,299,785 1,304,680Diluted earnings per share (in dollars) $ 4.19 $ 3.59 $ 2.57Diluted earnings per share from continuing operations (in dollars) $ 4.19 $ 3.61 $ 2.61Diluted earnings (loss) per share from discontinued operations (in dollars) $ – $ (.02) $ (.04)
Dividends per share (in dollars) $ 1.82 $ 1.44 $ 1.18

Royal Bank of Canada: Annual Report 2007Consolidated Financial Statements
115
Consolidated Statements of Comprehensive Income
For the year ended October 31 (C$ millions) 2007 2006 2005
Net income $ 5,492 $ 4,728 $ 3,387 Other comprehensive income, net of taxes Net unrealized gains (losses) on available-for-sale securities (93) – – Reclassification of (gains) losses on available-for-sale securities to income 28 – –
(65) – –
Unrealized foreign currency translation gains (losses) (2,965) (501) (624) Reclassification of (gains) losses on foreign currency translation to income (42) 2 5 Net foreign currency translation gains (losses) from hedging activities 1,804 269 401
(1,203) (230) (218)
Net gains (losses) on derivatives designated as cash flow hedges 80 – – Reclassification to income of (gains) losses on derivatives designated as cash flow hedges 31 – –
111 – –
Other comprehensive income (loss) (1,157) (230) (218)
Total comprehensive income $ 4,335 $ 4,498 $ 3,169
Consolidated Statements of Changes in Shareholders’ Equity
For the year ended October 31 (C$ millions) 2007 2006 2005
Preferred shares (Note 18) Balance at beginning of year $ 1,050 $ 700 $ 532 Issued 1,150 600 300 Redeemed for cancellation (150) (250) (132)
Balance at end of year 2,050 1,050 700
Common shares (Note 18) Balance at beginning of year 7,196 7,170 6,988 Issued 170 127 214 Purchased for cancellation (66) (101) (32)
Balance at end of year 7,300 7,196 7,170
Contributed surplus Balance at beginning of year 292 265 169 Renounced stock appreciation rights (6) (2) (6) Stock-based compensation awards (46) (18) 26 Gain on redemption of preferred shares – – 7 Initial adoption of AcG-15, Consolidation of Variable Interest Entities – – 54 Other (5) 47 15
Balance at end of year 235 292 265
Treasury shares – preferred (Note 18) Balance at beginning of year (2) (2) – Sales 33 51 – Purchases (37) (51) (2)
Balance at end of year (6) (2) (2)
Treasury shares – common (Note 18) Balance at beginning of year (180) (216) (294) Sales 175 193 179 Purchases (96) (157) (47) Initial adoption of AcG-15, Consolidation of Variable Interest Entities – – (54)
Balance at end of year (101) (180) (216)
Retained earnings Balance at beginning of year 15,771 13,704 12,065 Transition adjustment – Financial instruments (1) (86) – – Net income 5,492 4,728 3,387 Preferred share dividends (Note 18) (88) (60) (42) Common share dividends (Note 18) (2,321) (1,847) (1,512) Premium paid on common shares purchased for cancellation (580) (743) (194) Issuance costs and other (21) (11) –
Balance at end of year 18,167 15,771 13,704
Accumulated other comprehensive income (loss) Transition adjustment – Financial instruments (1) (45) – – Unrealized gains and losses on available-for-sale securities (65) – – Unrealized foreign currency translation gains and losses, net of hedging activities (3,207) (2004) (1,774) Gains and losses on derivatives designated as cash flow hedges 111 – –
Balance at end of year (3,206) (2,004) (1,774)
Retained earnings and Accumulated other comprehensive income 14,961 13,767 11,930
Shareholders’ equity at end of year $ 24,439 $ 22,123 $ 19,847
(1) The transition adjustment relates to the implementation of the new financial instruments accounting standards. Refer to Note 1.

116 Royal Bank of Canada: Annual Report 2007Consolidated Financial Statements
Consolidated Statements of Cash Flows
For the year ended October 31 (C$ millions) 2007 2006 2005
Cash flows from operating activities Net income from continuing operations $ 5,492 $ 4,757 $ 3,437 Adjustments to determine net cash from (used in) operating activities Provision for credit losses 791 429 455 Depreciation 434 405 414 Business realignment payments (38) (74) (94) Future income taxes (147) 144 (482) Amortization of other intangibles 96 76 50 (Gain) loss on sale of premises and equipment (16) (16) (21) (Gain) loss on loan securitizations (41) (16) (101) (Gain) loss on sale of available-for-sale securities (63) – – (Gain) loss on sale of investment securities – (88) (85) Changes in operating assets and liabilities Insurance claims and policy benefit liabilities (54) 220 629 Net change in accrued interest receivable and payable (28) 217 (5) Current income taxes 1,034 (203) (9) Derivative assets (28,856) 1,105 63 Derivative liabilities 29,916 (498) 391 Trading securities 9,623 (21,477) (36,438) Net change in brokers and dealers receivable and payable (317) (1,017) 1,334 Other 1,647 1,036 840
Net cash from (used in) operating activities from continuing operations 19,473 (15,000) (29,622)Net cash from (used in) operating activities from discontinued operations – 4 95
Net cash from (used in) operating activities 19,473 (14,996) (29,527)
Cash flows from investing activities Change in interest-bearing deposits with banks (1,379) (5,265) 1,030 Change in loans, net of loan securitizations (39,569) (33,534) (27,670) Proceeds from loan securitizations 8,020 8,139 5,607 Proceeds from sale of available-for-sale securities 7,565 – – Proceeds from sale of investment securities – 14,709 25,628 Proceeds from maturity of available-for-sale securities 18,784 – – Proceeds from maturity of investment securities – 28,222 18,431 Purchases of available-for-sale securities (24,097) – – Purchases of investment securities – (38,474) (36,373) Net acquisitions of premises and equipment (706) (511) (383) Change in assets purchased under reverse repurchase agreements and securities borrowed (4,935) (16,405) 3,976 Net cash from (used in) acquisitions (373) (256) –
Net cash from (used in) investing activities from continuing operations (36,690) (43,375) (9,754)Net cash from (used in) investing activities from discontinued operations – 140 2,027
Net cash from (used in) investing activities (36,690) (43,235) (7,727)
Cash flows from financing activities Change in deposits 17,831 36,663 35,001 Issue of RBC Trust Capital Securities – – 1,200 Issue of subordinated debentures 87 – 800 Repayment of subordinated debentures (989) (953) (786) Issue of preferred shares 1,150 600 300 Redemption of preferred shares for cancellation (150) (250) (132) Issuance costs (23) (6) (3) Issue of common shares 155 116 198 Purchase of common shares for cancellation (646) (844) (226) Sales of treasury shares 208 244 179 Purchase of treasury shares (133) (208) (49) Dividends paid (2,278) (1,807) (1,469) Dividends/distributions paid by subsidiaries to non-controlling interests (59) (47) (13) Change in obligations related to assets sold under repurchase agreements and securities loaned (4,070) 17,722 (3,092) Change in obligations related to securities sold short 6,436 5,861 7,386 Change in short-term borrowings of subsidiaries (145) 620 (628)
Net cash from (used in) financing activities from continuing operations 17,374 57,711 38,666
Net cash from (used in) financing activities 17,374 57,711 38,666
Effect of exchange rate changes on cash and due from banks (332) (80) (122)
Net change in cash and due from banks (175) (600) 1,290 Cash and due from banks at beginning of year 4,401 5,001 3,711
Cash and due from banks at end of year $ 4,226 $ 4,401 $ 5,001 Supplemental disclosure of cash flow information Amount of interest paid in year $ 18,494 $ 14,678 $ 10,109 Amount of income taxes paid in year $ 1,352 $ 1,682 $ 1,987

Royal Bank of Canada: Annual Report 2007Consolidated Financial Statements
117
Consolidated Financial Statements (all tabular amounts are in millions of Canadian dollars, except per share amounts)
The accompanying Consolidated Financial Statements have been prepared in accordance with Subsection 308 of the Bank Act (Canada) (the Act), which states that, except as otherwise specified by the Office of the Superintendent of Financial Institutions Canada (OSFI), our Consolidated Financial Statements are to be prepared in accor-dance with Canadian generally accepted accounting principles (GAAP). The significant accounting policies used in the preparation of these financial statements, including the accounting requirements of the OSFI, are summarized below. These accounting policies conform, in all material respects, to Canadian GAAP.
Basis of consolidation Our Consolidated Financial Statements include the assets and liabilities and results of operations of all subsidiaries and variable interest entities (VIEs) where we are the Primary Beneficiary after elimination of intercompany transactions and balances. The equity method is used to account for investments in associated corporations and limited partnerships in which we have significant influence. These invest-ments are reported in Other assets. Our share of earnings, gains and losses realized on dispositions and writedowns to reflect other-than-temporary impairment in the value of these investments are included in Non-interest income. The proportionate consolidation method is used to account for investments in joint ventures in which we exercise joint control, whereby our pro rata share of assets, liabilities, income and expenses is consolidated.
Significant accounting changes Financial InstrumentsOn November 1, 2006, we adopted three new financial instruments accounting standards that were issued by the Canadian Institute of Chartered Accountants (CICA): Handbook Section 1530, Comprehen sive Income (Section 1530), Handbook Section 3855, Financial Instruments – Recognition and Measurement (Section 3855), and Handbook Section 3865, Hedges (Section 3865). Comparative amounts for prior periods have not been restated.
Comprehensive Income Section 1530 introduces Comprehensive Income, which consists of Net income and Other comprehensive income (OCI). OCI represents changes in Shareholders’ equity during a period arising from trans-actions and other events with non-owner sources and includes unrealized gains and losses on financial assets classified as available-for-sale, unrealized foreign currency translation gains or losses arising from self-sustaining foreign operations, net of hedging activities, and changes in the fair value of the effective portion of cash flow hedging instruments. We have included in our Consolidated Financial Statements a Consolidated Statement of Comprehensive Income for the changes in these items, net of taxes, since November 1, 2006, while the cumulative changes in OCI are included in Accumulated other comprehensive income (loss) (AOCI), which is presented as a new cat-egory of Shareholders’ equity on our Consolidated Balance Sheets.
Financial Instruments – Recognition and Measurement Section 3855 establishes standards for recognizing and measuring financial assets, financial liabilities and non-financial derivatives. It requires that financial assets and financial liabilities, including deriva-tives, be recognized on our Consolidated Balance Sheets when we become a party to the contractual provisions of a financial instrument or non-financial derivative contract. Under this standard, all financial instruments are required to be measured at fair value on initial recog-nition except for certain related party transactions. Measurement in subsequent periods depends on whether the financial instrument has been classified as held-for-trading, available-for-sale, held-to-maturity,
loans and receivables, or other financial liabilities. Transaction costs are expensed as incurred for financial instruments classified or desig-nated as held-for-trading. For other financial instruments, transaction costs are capitalized on initial recognition.
Financial assets and financial liabilities held-for-trading are measured at fair value with changes in those fair values recognized in Non-interest income. Financial assets held-to-maturity, loans and receivables, and other financial liabilities are measured at amortized cost using the effective interest method. Available-for-sale financial assets, which include loan substitute securities, are measured at fair value with unrealized gains and losses, including changes in foreign exchange rates, being recognized in OCI. Investments in equity instru-ments classified as available-for-sale that do not have a quoted market price in an active market are measured at cost.
Derivative instruments are recorded on our Consolidated Balance Sheets at fair value, including those derivatives that are embedded in financial or non-financial contracts that are not closely related to the host contracts. Changes in the fair values of derivative instruments are recognized in Net income except for derivatives designated as effec-tive cash flow hedges or hedges of foreign currency exposure of a net investment in a self-sustaining foreign operation, the changes in fair value of which are recognized in OCI.
Section 3855 also provides an entity the option to designate a financial instrument as held-for-trading (the fair value option) on its initial recognition or upon adoption of the standard, even if the financial instrument was not acquired or incurred principally for the purpose of selling or repurchasing it in the near term. An instrument that is classified as held-for-trading by way of this fair value option must have a reliable fair value and satisfy one of the following criteria established by the OSFI: (i) when doing so eliminates or significantly reduces a measurement or recognition inconsistency that would other-wise arise from measuring assets or liabilities, or recognizing gains and losses on them on a different basis; (ii) it belongs to a group of financial assets or financial liabilities or both that are managed and evaluated on a fair value basis in accordance with our risk manage-ment or investment strategy, and are reported to senior management, on that basis; or (iii) it is an embedded derivative in a financial or non-financial host contract and the derivative is not closely related to the host contract.
The principal categories of our financial assets that we designated as held-for-trading using the fair value option include (i) investments supporting the policy benefit liabilities on life and health insurance contracts issued by our insurance operations; (ii) investments used to offset exposures under derivative contracts in relation to our sales and trading activities; (iii) certain loans to cus-tomers whose related hedging derivatives are measured at fair value; and (iv) assets purchased under reverse repurchase agreements that form part of our trading portfolio which is managed and evaluated on a fair value basis. Financial liabilities designated as held-for-trading include (i) deposits and structured notes with embedded derivatives that are not closely related to the host contracts; (ii) assets sold under repurchase agreements that form part of our trading portfolio which is managed and evaluated on a fair value basis; and (iii) certain deposits to offset the impact of related hedging derivatives measured at fair value. Fair value designation for these financial assets and financial liabilities significantly reduces the measurement inconsistencies.
Other significant accounting implications arising upon the adop-tion of Section 3855 include the use of the effective interest method for any transaction costs or fees, premiums or discounts earned on financial instruments measured at amortized cost, and the recogni-tion of the inception fair value of the obligation undertaken in issuing a guarantee that meets the definition of a guarantee pursuant to CICA Accounting Guideline 14, Disclosure of Guarantees (AcG-14).
Note 1 Significant accounting policies and estimates

118 Royal Bank of Canada: Annual Report 2007Consolidated Financial Statements
Note 1 Significant accounting policies and estimates (continued)
Subsequent remeasurement at fair value is not required unless the financial guarantee also meets the definition of a derivative. These guarantees are remeasured at fair value at each balance sheet date and reported as a derivative in Other assets or Other liabilities, as appropriate.
Hedges Section 3865 specifies the criteria that must be satisfied in order for hedge accounting to be applied and the accounting for each of the permitted hedging strategies. We use derivatives and non-derivative financial instruments in our hedging strategies to manage our exposures to interest, currency, credit and other market risks. When derivatives are used to manage our own exposures, we determine for each derivative whether hedge accounting can be applied. Where hedge accounting can be applied, a hedging relationship is designated as a fair value hedge, a cash flow hedge or a hedge of foreign currency exposure of a net investment in a self-sustaining foreign operation. For our detailed accounting policy on hedge accounting refer to the Derivatives section below in Note 1.
Impact upon adoption of Sections 1530, 3855 and 3865 The transition adjustments attributable to the remeasurement of financial assets and financial liabilities at fair value, other than financial assets classified as available-for-sale and hedging instruments desig-nated as cash flow hedges or hedges of foreign currency exposure of net investment in self-sustaining foreign operations, were recognized in opening Retained earnings as at November 1, 2006. Adjustments arising from remeasuring financial assets classified as available-for-sale at fair value were recognized in opening AOCI as at that date.
For hedging relationships existing prior to adopting Section 3865 that continue to qualify for hedge accounting under the new standard, the transition accounting is as follows: (i) Fair value hedges – any gain or loss on the hedging instrument was recognized in opening Retained earnings and the carrying amount of the hedged item was adjusted by the cumulative change in fair value attributable to the designated hedged risk and was also included in opening Retained earnings; (ii) Cash flow hedges and hedges of net investments in self-sustaining foreign operations – the effective portion of any gain or loss on the hedging instrument was recognized in AOCI and the cumulative inef-fective portion was included in opening Retained earnings.
We recorded the following transition adjustments in our Consolidated Financial Statements: (i) a reduction of $86 million, net of taxes, to our opening Retained earnings, representing changes made to the value of certain financial instruments and the ineffective portion of qualifying hedges, in compliance with the measurement basis under the new standards including those related to the use of fair value option; and (ii) recognition in AOCI of $45 million, net of taxes, related to the net losses for available-for-sale financial assets and cumulative losses on the effective portion of our cash flow hedges that are now required to be recognized under Sections 3855 and 3865. In addition, we have reclassified to AOCI $2,004 million of net unreal-ized foreign currency losses on net investments in self-sustaining foreign operations that were previously presented as a separate item in Shareholders’ equity.
Variable Interest EntitiesOn February 1, 2007, we adopted CICA Emerging Issues Committee Abstract No. 163, Determining the Variability to be Considered in Applying AcG15 (EIC-163). EIC-163 provides additional clarification on how to analyze and consolidate VIEs. The implementation of EIC-163 resulted in the deconsolidation of certain investment funds; however, the impact was not material to our consolidated financial position or results of operations.
Convertible and Other Debt Instruments with Embedded DerivativesOn August 1, 2007, we adopted CICA Emerging Issues Committee Abstract No. 164, Convertible and Other Debt Instruments with Embedded Derivatives (EIC-164). EIC-164 provides clarification regard-ing the accounting treatment for certain types of convertible debt instruments, their classification as liabilities or equity, and the implica-tions on earnings per share. It also provides guidance on whether these instruments contain any embedded derivatives that are required to be accounted for separately. The adoption of EIC-164 was not material to our consolidated financial position or results of operations.
Accounting Policy Choice for Transaction CostsOn June 1, 2007, CICA Emerging Issues Committee issued Abstract No. 166, Accounting Policy Choice for Transaction Costs (EIC-166). This EIC addresses the accounting policy choice of expensing or add-ing transaction costs related to the acquisition of financial assets and financial liabilities that are classified as other than held-for-trading. Specifically, it requires the same accounting policy choice be applied to all similar financial instruments classified as other than held-for-trading, but permits a different policy choice for financial instruments that are not similar. EIC-166 became effective for us on September 30, 2007 and requires retroactive application to all transaction costs accounted for in accordance with Section 3855. Our current recogni-tion policy for transaction costs, which was adopted on November 1, 2006, is consistent with this guidance.
The accounting policies described below have been updated to reflect the requirements under the new financial instruments accounting standards, and where applicable, include a discussion on the policies used in the prior periods for comparative purposes.
Translation of foreign currencies Monetary assets and liabilities denominated in foreign currencies are translated into Canadian dollars at rates prevailing at the balance sheet date. Non-monetary assets and liabilities are translated into Canadian dollars at historical rates. Income and expenses denomi-nated in foreign currencies are translated at average rates of exchange for the year.
Assets and liabilities of our self-sustaining operations with func-tional currencies other than the Canadian dollar are translated into Canadian dollars at rates prevailing at the balance sheet date, and income and expenses of these foreign operations are translated at average rates of exchange for the year.
Unrealized gains or losses arising as a result of the translation of our foreign self-sustaining operations along with the effective portion of related hedges are reported as a component of OCI on an after-tax basis. Prior to November 1, 2006, these amounts were included in Shareholders’ equity. Upon disposal or dilution of our interest in such investments, an appropriate portion of the accumulated net transla-tion gains or losses is included in Non-interest income.
Other foreign currency translation gains and losses are included in Non-interest income.
SecuritiesSecurities are classified, based on management’s intentions, as held-for-trading, available-for-sale or held-to-maturity.
Held-for-trading securities include securities purchased for sale in the near term and securities designated as held-for-trading under the fair value option are reported at fair value. Obligations to deliver Trading securities sold but not yet purchased are recorded as liabilities and carried at fair value. Realized and unrealized gains and losses on these securities are recorded as Trading revenue in Non-interest income. Dividend and interest income accruing on Trading securities is recorded in Interest income. Interest and dividends accrued on interest- bearing and equity securities sold short are recorded in Interest expense.

Royal Bank of Canada: Annual Report 2007Consolidated Financial Statements
119
Available-for-sale securities include (i) securities which may be sold in response to or in anticipation of changes in interest rates and resulting prepayment risk, changes in foreign currency risk, changes in funding sources or terms, or to meet liquidity needs; and (ii) loan sub-stitute securities which are client financings that have been structured as after-tax investments rather than conventional loans in order to provide the clients with a borrowing rate advantage. Available-for-sale securities are measured at fair value with unrealized gains and losses, including changes in foreign exchange rates, recognized in OCI net of tax. Purchase premiums or discounts on available-for-sale securities are amortized over the life of the security using the effective interest method and are recognized in Net interest income. Investments in equity instruments classified as Available-for-sale that do not have a quoted market price in an active market are measured at cost.
Held-to-maturity securities are debt securities where we have the intention and ability to hold the investment until its maturity date. These securities are carried at amortized cost using the effective inter-est method. Dividends, interest income and amortization of premiums and discounts on debt securities are recorded in Net interest income. We hold a nominal amount of held-to-maturity securities in our normal course of business. All held-to-maturity securities have been included with Available-for-sale securities on our Consolidated Balance Sheets.
Gains and losses realized on disposal of available-for-sale securi-ties are included in Gain on sale of securities in Non-interest income. Both available-for-sale and held-to-maturity securities are subject to periodic impairment review.
Prior to November 1, 2006, all investment securities, other than Trading securities, were recorded on our Consolidated Balance Sheets as Investment securities at amortized cost, and loan substitute securi-ties were accorded the accounting treatment applicable to loans and, where required, reduced by an allowance for credit losses.
We account for all our securities using settlement date accounting except that changes in fair value between the trade date and settle-ment date are reflected in income for securities classified or designated as held-for-trading while changes in the fair value of available-for-sale securities between the trade and settlement dates are recorded in OCI.
Assets purchased under reverse repurchase agreements and sold under repurchase agreements We purchase securities under agreements to resell (reverse repur-chase agreements) and take possession of these securities. Reverse repurchase agreements are treated as collateralized lending transac-tions whereby we monitor the market value of the securities purchased and additional collateral is obtained when appropriate. We also have the right to liquidate the collateral held in the event of counterparty default. We also sell securities under agreements to repurchase (repurchase agreements), which are treated as collateralized borrowing transactions.
Reverse repurchase agreements and repurchase agreements are carried on our Consolidated Balance Sheets at the amounts at which the securities were initially acquired or sold plus accrued inter-est, respectively, except when they are designated using the fair value option as held-for-trading and are recorded at fair value. Interest earned on reverse repurchase agreements is included in Interest income in our Consolidated Statements of Income, and interest incurred on repur-chase agreements is included in Interest expenses in our Consolidated Statements of Income. Changes in fair value for reverse repurchase agreements and repurchase agreements carried at fair value under the fair value option are included in Trading revenue in Non-interest income.
Prior to November 1, 2006, all reverse repurchase agreements and repurchase agreements were carried on our Consolidated Balance Sheets at the amounts at which the securities were initially acquired or sold, respectively, plus accrued interest on interest-bearing securities. Interest earned on reverse repurchase agreements was included in Interest income, and interest incurred on repurchase agreements was included in Interest expense, in our Consolidated Statements of Income.
Loans Loans are recorded at amortized cost unless they have been desig-nated as held-for-trading using the fair value option. Loans recorded at amortized cost are net of an Allowance for loan losses and unearned income which comprises unearned interest and unamortized loan fees. Loans designated as held-for-trading are carried at fair value. Prior to November 1, 2006, all loans were presented at amortized cost net of an Allowance for loan losses and unearned income.
Loans stated at amortized cost are subject to periodic impairment review and are classified as impaired when, in management’s opinion, there is no longer reasonable assurance of the timely collection of the full amount of principal or interest. Whenever a payment is 90 days past due, loans other than credit card balances and loans guaranteed or insured by a Canadian government (federal or provincial) or a Canadian government agency (collectively “Canadian government”) are classified as impaired unless they are fully secured and collection efforts are reasonably expected to result in repayment of debt within 180 days past due. Credit card balances are written off when a pay-ment is 180 days in arrears. Loans guaranteed by a Canadian government are classified as impaired when the loan is contractually 365 days in arrears. When a loan is identified as impaired, the accrual of interest is discontinued and any previously accrued but unpaid inter-est on the loan is charged to the Provision for credit losses. Interest received on impaired loans is credited to the Provision for credit losses. Impaired loans are returned to performing status when all past due amounts, including interest, have been collected, loan impairment charges have been reversed, and the credit quality has improved such that timely collection of principal and interest is reasonably assured.
When an impaired loan is identified, the carrying amount of the loan is reduced to its estimated realizable amount, measured by dis-counting the expected future cash flows at the effective interest rate inherent in the loan. In subsequent periods, recoveries of amounts previously written off and any increase in the carrying value of the loan are credited to the Allowance for credit losses on our Consolidated Balance Sheets. Where a portion of a loan is written off and the remaining balance is restructured, the new loan is carried on an accrual basis when there is no longer any reasonable doubt regarding the collectibility of principal or interest, and payments are not 90 days past due.
Assets acquired in respect of problem loans are recorded at their fair value less costs of disposition. Fair value is determined based on either current market value where available or discounted cash flows. Any excess of the carrying value of the loan over the recorded fair value of the assets acquired is recognized by a charge to the Provision for credit losses.
Fees that relate to activities such as originating, restructuring or renegotiating loans are deferred and recognized as Interest income over the expected term of such loans using the effective interest method. Where there is reasonable expectation that a loan will result, commit-ment and standby fees are also recognized as Interest income over the expected term of the resulting loan using the effective interest method. Otherwise, such fees are recorded as Other liabilities and amortized to Non-interest income over the commitment or standby period.
Allowance for credit losses The Allowance for credit losses is maintained at levels that manage-ment considers appropriate to cover estimated identified credit related losses in the portfolio as well as losses that have been incurred, but are not yet identifiable as at the balance sheet date. The allowance relates to on-balance sheet exposures, such as loans and acceptances, and off-balance sheet items such as letters of credit, guarantees and unfunded commitments.
The allowance is increased by a charge to the Provision for credit losses and decreased by the amount of write-offs, net of recoveries. The Allowance for credit losses for on-balance sheet items is included as a reduction to assets, and the allowance relating to off-balance sheet items is included in Other liabilities.

120 Royal Bank of Canada: Annual Report 2007Consolidated Financial Statements
Note 1 Significant accounting policies and estimates (continued)
The allowance is determined based on management’s identifica-tion and evaluation of problem accounts on estimated losses that exist on the remaining portfolio, and on other factors including the com-position and credit quality of the portfolio, and changes in economic and business conditions. The Allowance for credit losses consists of Specific allowances and the General allowance.
Specific allowances Specific allowances are recorded to recognize estimated losses on both retail and wholesale loans that have become impaired. The losses relating to wholesale borrowers including small business loans individ-ually managed are estimated using management’s judgment relating to the timing of future cash flow amounts that can be reasonably expected from the borrowers, financially responsible guarantors and the realization of collateral. The amounts expected to be recovered are reduced by estimated collection costs and discounted at the effective interest rate of the obligation. The losses relating to retail portfolios, including residential mortgages, and personal and small business loans managed on a pooled basis are based on net write-off experi-ence. For credit cards, no specific allowance is maintained as balances are written off when a payment is 180 days in arrears. Personal loans are generally written off at 150 days past due. Write-offs for other loans are generally recorded when there is no realistic prospect of full recovery.
General allowance A general allowance is established to cover estimated credit losses incurred in the lending portfolio that have not yet been specifically identified as impaired. For heterogeneous loans (wholesale loans including small business loans individually managed), the determina-tion of the general allowance is based on the application of estimated probability of default, gross exposure at default and loss factors, which are determined by historical loss experience and delineated by loan type and rating. For homogeneous portfolios (retail loans) includ-ing residential mortgages, credit cards, as well as personal and small business loans that are managed on a pooled basis, the determination of the general allowance is based on the application of historical loss rates. In determining the general allowance level, management also considers the current portfolio credit quality trends, business and economic conditions, the impact of policy and process changes, and other supporting factors. In addition, the general allowance includes a component for the model limitations and imprecision inherent in the allowance methodologies.
Acceptances Acceptances are short-term negotiable instruments issued by our clients to third parties which we guarantee. The potential liability under acceptances is reported in Liabilities – Other on our Consolidated Balance Sheets. The recourse against our clients in the case of a call on these commitments is reported as a corresponding asset of the same amount in Assets – Other. Fees earned are reported in Non-interest income.
Derivatives Derivatives are primarily used in sales and trading activities. Derivatives are also used to manage our exposures to interest, currency, credit and other market risks. The most frequently used derivative products are interest rate swaps, interest rate futures, forward rate agreements, interest rate options, foreign exchange forward contracts, currency swaps, foreign currency futures, foreign currency options and credit derivatives. All derivative instruments are recorded on our Consolidated Balance Sheets at fair value, including those derivatives that are embedded in financial or non-financial contracts that are not closely related to the host contracts.
When derivatives are used in sales and trading activities, the real-ized and unrealized gains and losses on derivatives are recognized in Non-interest income – Trading revenue. Derivatives with a positive fair value are reported as Derivative assets and derivatives with a neg-ative fair value are reported as Derivative liabilities. Where we have both the legal right and intent to settle derivative assets and liabilities simultaneously with a counterparty, the net fair value of the derivative positions is reported as an asset or liability, as appropriate. Margin requirements and premiums paid are also included in Derivative assets, while premiums received are shown in Derivative liabilities.
When derivatives are used to manage our own exposures, we determine for each derivative whether hedge accounting can be applied, as discussed below.
Hedge accounting We use derivatives and non-derivatives in our hedging strategies to manage our exposure to interest, currency, credit and other market risks. Where hedge accounting can be applied, a hedge relationship is designated and documented at inception to detail the particular risk management objective and the strategy for undertaking the hedge transaction. The documentation identifies the specific asset, liability or anticipated cash flows being hedged, the risk that is being hedged, the type of hedging instrument used and how effectiveness will be assessed. The hedging instrument must be highly effective in accom-plishing the objective of offsetting either changes in the fair value or anticipated cash flows attributable to the risk being hedged both at inception and throughout the life of the hedge. Hedge accounting is discontinued prospectively when it is determined that the hedging instrument is no longer effective as a hedge, the hedging instrument is terminated or sold, or upon the sale or early termination of the hedged item. Refer to Note 2 for the fair value of the derivatives and non-derivative financial instruments categorized by their hedging relationships, as well as derivatives that are not designated in hedging relationships.
Fair value hedges In a fair value hedging relationship, the carrying value of the hedged item is adjusted for changes in fair value attributable to the hedged risk and recognized in Non-interest income. Changes in the fair value of the hedged item, to the extent that the hedging relationship is effective, are offset by changes in the fair value of the hedging deriva-tive, which are also recognized in Non-interest income. When hedge accounting is discontinued, the carrying value of the hedged item is no longer adjusted and the cumulative fair value adjustments to the car-rying value of the hedged items are amortized to Net income over the remaining term of the original hedging relationship.
We predominantly use interest rate swaps to hedge our exposure to the changes in a fixed interest rate instrument’s fair value caused by changes in interest rates. We also use, in limited circumstances, certain cash instruments to hedge our exposure to the changes in fair value of monetary assets attributable to changes in foreign currency exchange rates.
Cash flow hedgesIn a cash flow hedging relationship, the effective portion of the change in the fair value of the hedging derivative, net of taxes, is recognized in OCI while the ineffective portion is recognized in Non-interest income. When hedge accounting is discontinued, the amounts previ-ously recognized in AOCI are reclassified to Net interest income during the periods when the variability in the cash flows of the hedged item affects Net interest income. Gains and losses on derivatives are reclas-sified immediately to Net income when the hedged item is sold or terminated early. We predominantly use interest rate swaps to hedge the variability in cash flows related to a variable rate asset or liability.

Royal Bank of Canada: Annual Report 2007Consolidated Financial Statements
121
Prior to November 1, 2006, when a derivative was designated and qualified as an effective hedging instrument in a fair value or cash flow hedge, the income or expense of that derivative was recognized as an adjustment to Interest income or Interest expense of the hedged item in the same period. When hedge accounting was discontinued pro-spectively, the fair value of the derivative was recognized in Derivative assets or liabilities at that time and the gain or loss was deferred and recognized in Net interest income in the periods in which the hedged item affects income. When hedge accounting was discontinued due to the sale or early termination of the hedged item, the fair value of the derivative was recognized in Derivative assets or liabilities at that time and the unrealized gain or loss is recognized in Non-interest income.
Net investment hedges In hedging a foreign currency exposure of a net investment in a self-sustaining foreign operation, the effective portion of foreign exchange gains and losses on the hedging instruments, net of applicable taxes, is recognized in OCI and the ineffective portion is recognized in Non-interest income. The amounts previously recognized in AOCI are recognized in Net income when there is a reduction in the hedged net investment as a result of a dilution or sale of the net investment, or reduction in equity of the foreign operation as a result of dividend distributions.
We use foreign exchange contracts and foreign currency- denominated liabilities to manage our foreign currency exposures to net investments in self-sustaining foreign operations having a functional currency other than the Canadian dollar.
Prior to November 1, 2006, foreign exchange gains and losses on these hedging instruments, net of tax, were recorded in Net foreign currency translation adjustments in our Consolidated Statements of Changes in Shareholders’ Equity.
Premises and equipment Premises and equipment are stated at cost less accumulated deprecia-tion. Depreciation is recorded principally on a straight-line basis over the estimated useful lives of the assets, which are 25 to 50 years for buildings, 3 to 10 years for computer equipment, and 7 to 10 years for furniture, fixtures and other equipment. The amortization period for leasehold improvements is the lesser of the useful life of the leasehold improvements or the lease term plus the first renewal period, if reasonably assured of renewal, up to a maximum of 10 years. Gains and losses on disposal are recorded in Non-interest income.
Business combinations, goodwill and other intangiblesAll business combinations are accounted for using the purchase method. Identifiable intangible assets are recognized separately from Goodwill and included in Other intangibles. Goodwill represents the excess of the price paid for the business acquired over the fair value of the net identifiable assets acquired, and is assigned to reporting units of a business segment. A reporting unit comprises business operations with similar economic characteristics and strategies, and is defined by GAAP as the level of reporting at which goodwill is tested for impairment and is either a business segment or one level below. Upon disposal of a portion of a reporting unit, goodwill is allocated to the disposed portion based on the fair value of that portion relative to the total reporting unit.
Goodwill is evaluated for impairment annually as at August 1 or more often if events or circumstances indicate there may be an impair-ment. If the carrying value of a reporting unit, including the allocated goodwill, exceeds its fair value, goodwill impairment is measured as the excess of the carrying amount of the reporting unit’s allocated goodwill over the implied fair value of the goodwill, based on the fair value of the assets and liabilities of the reporting unit. Any goodwill impairment is charged to income in the period in which the impairment is identified. Subsequent reversals of impairment are prohibited.
Other intangibles with a finite life are amortized on a straight-line basis over their estimated useful lives, generally not exceeding 20 years, and are also tested for impairment when conditions exist
which may indicate that the estimated future net cash flows from the asset will be insufficient to recover its carrying amount.
Income taxes We use the asset and liability method whereby income taxes reflect the expected future tax consequences of temporary differences between the carrying amounts of assets or liabilities for accounting purposes compared with tax purposes. A future income tax asset or liability is determined for each temporary difference based on the tax rates that are expected to be in effect when the underlying items of income and expense are expected to be realized, except for earnings related to our foreign operations where repatriation of such amounts is not contemplated in the foreseeable future. Income taxes reported in our Consolidated Statements of Income include the current and future portions of the expense. Income taxes applicable to items charged or credited to Shareholders’ equity are netted with such items. Changes in future income taxes related to a change in tax rates are recognized in the period when the tax rate change is substantively enacted.
Net future income taxes accumulated as a result of temporary differences are included in Other assets. A valuation allowance is established to reduce future income tax assets to the amount more likely than not to be realized. In addition, our Consolidated Statements of Income contain items that are non-taxable or non-deductible for income tax purposes and, accordingly, cause the income tax provision to be different from what it would be if based on statutory rates.
Pensions and other post-employment benefits We offer a number of benefit plans, which provide pension and other benefits to eligible employees (as described in Note 20). These plans include registered defined benefit pension plans, supplemental pen-sion plans, defined contribution plans and health, dental, disability and life insurance plans.
Investments held by the pension funds primarily comprise equity and fixed income securities. Pension fund assets are valued at fair value. For the principal defined benefit plans, the expected return on plan assets, which is reflected in the pension benefit expense, is calculated using a market-related value approach. Under this approach, assets are valued at an adjusted market value, whereby realized and unrealized capital gains and losses are amortized over three years on a straight-line basis. For the majority of the non-principal and supple-mental defined benefit pension plans, the expected return on plan assets is calculated based on fair value of assets.
Actuarial valuations for the defined benefit plans are performed on a regular basis to determine the present value of the accrued pension and other post-employment benefits, based on projections of employees’ compensation levels to the time of retirement and the costs of health, dental, disability and life insurance.
Our defined benefit pension expense, which is included in Non-interest expenses – Human resources, consists of the cost of employee pension benefits for the current year’s service, interest cost on the liability, expected investment return on the market-related value or market value of plan assets and the amortization of prior service costs, net actuarial gains or losses and transitional assets or obligations. For some of our defined benefit plans, including the prin-cipal defined benefit plans, actuarial gains or losses are determined each year and amortized over the expected average remaining service life of employee groups covered by the plan. For the remaining defined benefit plans, net actuarial gains or losses in excess of the greater of 10% of the plan assets or the benefit obligation at the beginning of the year are amortized over the expected average remaining service life of employee groups covered by the plan.
Gains and losses on settlements of defined benefit plans are recognized in income when settlement occurs. Curtailment gains and losses are recognized in the period when the curtailment becomes probable and the impact can be reasonably estimated.
Our defined contribution plan expense is included in Non-interest expense – Human resources for services rendered by employees during the period.

122 Royal Bank of Canada: Annual Report 2007Consolidated Financial Statements
The cumulative excess of pension fund contributions over the amounts recorded as expenses is reported as a Prepaid pension benefit cost in Other assets. The cumulative excess of expense over fund contributions is reported as Accrued pension and other post-employment benefit expense in Other liabilities.
Stock-based compensationWe offer stock-based compensation plans to certain key employees and to our non-employee directors as described in Note 21.
We use the fair value method to account for stock options granted to employees whereby compensation expense is recognized over the applicable vesting period with a corresponding increase in Contributed surplus. When the options are exercised, the exercise price proceeds together with the amount initially recorded in Contributed surplus are credited to Common shares. Stock options granted prior to November 1, 2002, were accounted for using the intrinsic value method, and accordingly no expense was recognized for these options since the exercise price for such grants was equal to the closing price on the day before the stock options were granted. These awards fully vested during 2006. When these stock options are exercised, the proceeds will be recorded as Common shares.
Options granted between November 29, 1999, and June 5, 2001, were accompanied by tandem stock appreciation rights (SARs), which gave participants the option to receive cash payments equal to the excess of the current market price of our shares over the options’ exercise price. SARs obligations are now fully vested and give rise to compensation expense as a result of changes in the market price of our common shares. These expenses, net of related hedges, are recorded as Non-interest expense – Human resources in our Consolidated Statements of Income with a corresponding increase in Other liabilities on our Consolidated Balance Sheets.
Our other compensation plans include performance deferred share plans and deferred share unit plans for key employees (the Plans). The deferred share plans are settled in our common shares or cash, and the deferred share unit plans are settled in cash. The obligations for the Plans are accrued over their vesting period. For share-settled awards, our accrued obligations are based on the market price of our common shares at the date of grant. For cash-settled awards, our accrued obligations are periodically adjusted for fluctuations in the market price of our common shares and dividends accrued. Changes in our obligations under the Plans, net of related hedges, are recorded as Non-interest expense – Human resources in our Consolidated Statements of Income with a corresponding increase in Other liabilities or Contributed surplus on our Consolidated Balance Sheets.
The compensation cost attributable to options and awards, granted to employees who are eligible to retire or will become eligible to retire during the vesting period, is recognized immediately if the employee is eligible to retire on the grant date or over the period between the grant date and the date the employee becomes eligible to retire.
Our contributions to the employee savings and share ownership plans are expensed as incurred.
Loan securitization We periodically securitize loans by selling loans or packaged loans in the form of mortgage-backed securities (MBS) to independent special purpose entities (SPEs) or trusts that issue securities to investors. These transactions are accounted for as sales and the transferred assets are removed from our Consolidated Balance Sheets when we are deemed to have surrendered control over such assets and have received consideration other than beneficial interests in these trans-ferred loans. For control to be surrendered, all of the following must
occur: (i) the transferred loans must be isolated from the seller, even in bankruptcy or other receivership; (ii) the purchaser must have the legal right to sell or pledge the transferred loans or, if the purchaser is a Qualifying Special Purpose Entity (QSPE) as described in the CICA Accounting Guideline 12, Transfers of Receivables (AcG-12), its inves-tors have the right to sell or pledge their ownership interest in the entity; and (iii) the seller must not continue to control the transferred loans through an agreement to repurchase them or have a right to cause the loans to be returned. If any one of these conditions is not met, the transfer is considered to be a secured borrowing, the loans remain on our Consolidated Balance Sheets, and the proceeds are recognized as a liability.
When MBS are created, we reclassify the loans at their carrying costs into MBS and retained interests on our Consolidated Balance Sheets. The retained interest represents the excess spread of loan interest over the MBS rate of return. The initial carrying value of the MBS and the related retained interests are determined based on their relative fair value on the date of securitization. MBS are classified as trading account securities or available-for-sale securities, based on management’s intent. Retained interests are classified as available-for-sale. Both MBS and the retained interests are subject to periodic impairment review.
Prior to November 1, 2006, retained interests in securitizations that could be contractually prepaid or otherwise settled in such a way that we would not recover substantially all of our recorded investment were classified as Investment account securities at amortized cost.
Gains on the sale of loans or MBS are recognized in Non-interest income and are dependent on the previous carrying amount of the loans or MBS involved in the transfer. To obtain fair values, quoted market prices are used, if available. When quotes are not available for retained interests, we generally determine fair value based on the present value of expected future cash flows using management’s best estimates of key assumptions such as payment rates, weighted aver-age life of the prepayable receivables, excess spread, expected credit losses and discount rates commensurate with the risks involved.
For each securitization transaction where we have retained the servicing rights, we assess whether the benefits of servicing represent adequate compensation. When the benefits of servicing are more than adequate, a servicing asset is recognized in Other assets. When the benefits of servicing are not expected to be adequate, we recognize a servicing liability in Other liabilities. Neither an asset nor a liability is recognized when we have received adequate compensation. A servicing asset or liability is amortized in proportion to and over the period of estimated net servicing income.
Insurance Premiums from long-duration contracts, primarily life insurance, are recognized when due in Non-interest income – Insurance premiums, investment and fee income. Premiums from short-duration contracts, primarily property and casualty, and fees for administrative services are recognized in Insurance premiums, investment and fee income over the related contract period. Unearned premiums of the short-duration contracts, representing the unexpired portion of premiums, are reported in Other liabilities. Investments made by our insurance operations are classified as available-for-sale or loans and receivables, except for investments supporting the policy benefit liabilities on life and health insurance contracts which are designated as held-for-trading under the fair value option with changes in fair value reported in Insurance premiums, investment and fee income.
Insurance claims and policy benefit liabilities represent current claims and estimates for future insurance policy benefits. Liabilities for life insurance contracts are determined using the Canadian Asset Liability Method (CALM), which incorporates assumptions for mortality,
Note 1 Significant accounting policies and estimates (continued)

Royal Bank of Canada: Annual Report 2007Consolidated Financial Statements
123
morbidity, policy lapses and surrenders, investment yields, policy divi-dends, operating and policy maintenance expenses, and provisions for adverse deviation. These assumptions are reviewed at least annually and updated in response to actual experience and market conditions. Liabilities for property and casualty insurance represent estimated provisions for reported and unreported claims. Liabilities for life and property and casualty insurance are included in Insurance claims and policy benefit liabilities.
Acquisition costs for new insurance business consist of commis-sions, premium taxes, certain underwriting costs and other costs that vary with the acquisition of new business. Deferred acquisition costs for life insurance products are implicitly recognized in Insurance claims and policy benefit liabilities by CALM. For property and casualty insurance, these costs are classified as Other assets and amortized over the policy term.
Segregated funds are lines of business in which we issue a con-tract where the benefit amount is directly linked to the market value of the investments held in the underlying fund. The contractual arrange-ment is such that the underlying assets are registered in our name but the segregated fund policyholders bear the risk and rewards of the fund’s investment performance. We provide minimum death benefit and maturity value guarantees on segregated funds. The liability associ-ated with these minimum guarantees is recorded in Insurance claims and policy benefit liabilities. Segregated funds are not included in our Consolidated Financial Statements. We derive only fee income from segregated funds, which is reflected in Insurance premiums, invest-ment and fee income. Fee income includes management fees, mortality, policy, administration and surrender charges.
Prior to November 1, 2006, investments made by our insurance operations were included in Investment account securities. Realized gains and losses on disposal of fixed income investments that support life insurance liabilities were deferred and amortized to Insurance premi-ums, investment and fee income over the remaining term to maturity of the investments sold, up to a maximum period of 20 years. For equities that were held to support non-universal life insurance products, the realized gains and losses were deferred and amortized into Insurance premiums, investment and fee income at the quarterly rate of 5% of unamortized deferred gains and losses. The differences between the market value and adjusted carrying cost of these equities were reduced quarterly by 5%. Equities held to support universal life insurance prod-ucts were carried at market value. Realized and unrealized gains or losses on these equities were included in Insurance premiums, invest-ment and fee income. Specific investments were written down to market value or the net realizable value if it was determined that any impair-ment in value was other-than-temporary. The write down was recorded against Insurance premiums, investment and fee income in the period the impairment is recognized.
Liabilities and equityFinancial instruments that will be settled by a variable number of our common shares upon their conversion by the holders as well as the related accrued distributions are classified as liabilities on our Consolidated Balance Sheets. Dividends and yield distributions on these instruments are classified as Interest expense in our Consolidated Statements of Income.
Earnings per share Earnings per share is computed by dividing Net income available to com-mon shareholders by the weighted average number of common shares outstanding for the period, net of Treasury shares. Net income avail-able to common shareholders is determined after deducting dividend entitlements of preferred shareholders and any gain (loss) on redemp-tion of preferred shares net of related income taxes. Diluted earnings per share reflects the potential dilution that could occur if additional common shares are assumed to be issued under securities or contracts that entitle their holders to obtain common shares in the future, to the
extent such entitlement is not subject to unresolved contingencies. The number of additional shares for inclusion in diluted earnings per share calculations is determined using the treasury stock method. Under this method, stock options whose exercise price is less than the average market price of our common shares are assumed to be exercised and the proceeds are used to repurchase common shares at the average market price for the period. The incremental number of common shares issued under stock options and repurchased from proceeds is included in the calculation of diluted earnings per share.
Use of estimates and assumptions In preparing our Consolidated Financial Statements in conformity with GAAP, management is required to make estimates and assumptions that affect the reported amounts of assets, liabilities, net income and related disclosures. Certain estimates, including the allowance for credit losses, the fair value of financial instruments, accounting for securitizations, litigation provisions, variable interest entities, insurance claims and policy benefit liabilities, pensions and other post-employment benefits, the carrying value of goodwill, credit card customer loyalty reward program liability and income taxes, require management to make subjective or complex judgments. Accordingly, actual results could differ from these and other estimates thereby impacting our Consolidated Financial Statements.
Change in accounting estimateDuring the year, we adjusted the liability associated with our credit card customer loyalty reward program by $121 million in order to reflect higher program costs. This change in estimate is reflected as an increase in Other – Other liabilities on our Consolidated Balance Sheets and as a decrease in Non-interest income – Card service revenue in our Consolidated Statements of Income.
Change in financial statement presentationOn November 1, 2007, we implemented the International Convergence of Capital Measurement and Capital Standards: A Revised Framework, known as Basel II. In preparation for this implementation, we reclassified our loans and credit quality information as either Retail or Wholesale. During the year, we revisited our presentation of certain assets, liabilities, revenues and expenses for previous periods to bet-ter reflect the nature of these items. Accordingly, certain comparative amounts have been reclassified to conform with the current year’s presentation. These reclassifications did not materially impact our consolidated financial position or results of operations.
Future accounting changes Capital Disclosures and Financial Instruments – Disclosures and PresentationOn December 1, 2006, the CICA issued three new accounting standards: Handbook Section 1535, Capital Disclosures (Section 1535), Handbook Section 3862, Financial Instruments – Disclosures (Section 3862), and Handbook Section 3863, Financial Instruments – Presentation (Section 3863). These new standards became effective for us on November 1, 2007.
Section 1535 specifies the disclosure of (i) an entity’s objectives, policies and processes for managing capital; (ii) quantitative data about what the entity regards as capital; (iii) whether the entity has complied with any capital requirements; and (iv) if it has not complied, the conse-quences of such non-compliance.
Sections 3862 and 3863 replace Handbook Section 3861, Financial Instruments – Disclosure and Presentation, revising and enhancing its disclosure requirements, and carrying forward unchanged its presenta-tion requirements. These new sections place increased emphasis on disclosures about the nature and extent of risks arising from financial instruments and how the entity manages those risks.

124 Royal Bank of Canada: Annual Report 2007Consolidated Financial Statements
The fair value of a financial instrument is the amount at which the financial instrument could be exchanged in an arm’s-length transac-tion between knowledgeable and willing parties under no compulsion to act. Fair values are determined by reference to quoted bid or ask prices, as appropriate, in the most advantageous active market for that instrument to which we have immediate access. Where bid and ask prices are unavailable, we use the closing price of the most recent transaction of that instrument subject to the liquidation adjustments referred to below. In the absence of an active market, we determine fair values based on prevailing market rates (bid and ask prices, as appropriate) for instruments with similar characteristics and risk pro-files or internal or external valuation models, such as option pricing models and discounted cash flow analysis, using observable market-based inputs.
Fair values determined using valuation models require the use of assumptions concerning the amount and timing of estimated future cash flows and discount rates. In determining those assumptions, we look primarily to external readily observable market inputs including factors such as interest rate yield curves, currency rates, and price and rate volatilities, as applicable. In limited circumstances, we use input parameters that are not based on observable market data with an adjustment to reflect the uncertainty and to ensure that financial instruments are reported at fair values. Based on our assessment we believe that using possible alternative assumptions to fair value such financial instruments will not result in significantly different fair values.
Liquidity adjustments are calculated when market prices are not observable due to insufficient trading volume or a lack of recent trades in a less active or inactive market. Liquidity adjustments are also cal-culated to reflect the cost of unwinding a larger than normal market size risk position.
All of our derivatives transactions are accounted for on a fair value basis. We record valuation adjustments that represent the fair value of the credit risk of our derivative portfolios. These adjustments take into account the creditworthiness of our counterparties, the cur-rent and potential future mark-to-market of the transactions, and the effects of credit mitigants such as master netting agreements and collateral agreements. Credit valuation adjustments are recalculated regularly for all of our derivative portfolios. Changes to credit valua-tion adjustments are recorded in current period income.
We have documented internal policies that detail our processes for determining fair value, including the methodologies used in establishing our valuation adjustments. These methodologies are consistently applied and periodically reviewed by our Risk Management group.
Carrying value and fair value of selected financial instrumentsAs a result of adopting the new financial instruments accounting standards, certain financial instruments are now measured at fair value which were previously reported at cost or amortized cost. This is primarily due to the reclassification of certain securities as Trading securities, which includes securities designated as held-for-trading using the fair value option. The following table provides a comparison of carrying and fair values as at October 31, 2007 and October 31, 2006, for selected financial instruments:
Note 2 Fair value of financial instruments
October 31, October 31, 2007 2006
Carrying Carrying value and fair value of value Fair value
Financial instruments Financial Available- Loans and Loans and Available- required to instruments for-sale receivables receivables for-sale be classified designated instruments and and instruments Total Total Total as held- as held- measured non-trading non-trading measured carrying fair fair for-trading for-trading at fair value liabilities liabilities at cost amount value value
Financial assetsSecurities Trading $ 129,408 $ 18,838 $ – $ – $ – $ – $ 148,246 $ 148,246 Available-for-sale (1) – – 28,811 – – 1,198 30,009 30,009
Total securities $ 129,408 $ 18,838 $ 28,811 $ – $ – $ 1,198 $ 178,255 $ 178,255 $ 185,239
Assets purchased under reverse repurchase agreements and securities borrowed $ – $ 25,522 $ – $ 38,791 $ 38,791 $ – $ 64,313 $ 64,313 $ 59,378
Loans Retail $ – $ – $ – $ 168,782 $ 168,375 $ – $ 168,782 $ 168,375 Wholesale – 3,235 – 65,919 65,910 – 69,154 69,145
Total loans $ – $ 3,235 $ – $ 234,701 $ 234,285 $ – $ 237,936 $ 237,520 $ 208,638
Other Derivatives $ 66,585 $ – $ – $ – $ – $ – $ 66,585 $ 66,585 $ 37,682 Other assets – 164 – 24,653 24,653 – 24,817 24,817 22,660
Financial liabilities Deposits Personal $ – $ 851 $ – $ 115,706 $ 115,609 $ – $ 116,557 $ 116,460 Business and government 1,639 56,751 – 161,496 161,217 – 219,886 219,607 Bank – 5,668 – 23,094 23,095 – 28,762 28,763
Total deposits $ 1,639 $ 63,270 $ – $ 300,296 $ 299,921 $ – $ 365,205 $ 364,830 $ 343,312
Other Obligations related to securities sold short $ 44,689 $ – $ – $ – $ – $ – $ 44,689 $ 44,689 $ 38,252 Obligations related to assets sold under repurchase agreements and securities loaned – 24,086 – 12,947 12,947 – 37,033 37,033 41,103 Derivatives 72,010 – – – – – 72,010 72,010 42,108 Other liabilities – – – 36,232 36,262 – 36,232 36,262 28,736Subordinated debentures – 77 – 6,158 6,427 – 6,235 6,504 7,384Trust capital securities – – – 1,400 1,476 – 1,400 1,476 1,532Preferred share liabilities – – – 300 300 – 300 300 304
(1) Available-for-sale securities, including loan substitutes, are carried at fair value and held-to-maturity securities are carried at amortized cost. Prior to November 1, 2006, both available-for-sale and held-to-maturity securities were classified as Investment securities and were carried at amortized cost. The prior period comparative amounts have not been restated.

Royal Bank of Canada: Annual Report 2007Consolidated Financial Statements
125
During the year, the fair value of our net financial assets classified as held-for-trading increased by $2,115 million. The fair value of our net financial assets designated as held-for-trading increased by $80 mil-lion; substantially all of this increase was economically hedged. The fair value of financial liabilities that we designated as held-for-trading decreased by $88 million due to changes in our own credit risk.
The following table presents the carrying values of the deriva-tive and non-derivative financial instruments designated as hedging instruments categorized by their hedging relationships, as well as derivatives that are not designated in hedging relationships.
As at October 31, 2007
Designated as hedging instruments in hedging relationships
Not designated Cash flow Fair value Net investment in a hedgingDerivatives and non-derivative financial instruments hedges hedges hedges relationship
Financial assets Derivative financial instruments (1) $ 390 $ 268 $ 856 $ 65,071
Financial liabilities Derivative financial instruments (1) $ 206 $ 166 $ 5 $ 71,633 Non-derivative financial instruments (2) – 472 4,307 n.a.
(1) All derivative instruments are carried at fair value.(2) Non-derivative financial instruments are carried at amortized cost.n.a. not applicable
October 31, 2006
Carrying value
Required to be Classified classified Designated as as held-for- as held-for- available- trading trading for-sale
Financial assetsSecurities Trading $ 139,491 $ 18,412 $ – Investments (1) – – 26,966
Total securities $ 139,491 $ 18,412 $ 26,966
Assets purchased under reverse repurchase agreements and securities borrowed $ – $ 40,535 $ –Loans – 2,686 –Other Derivatives 37,733 – – Other assets – 527 –
Financial liabilities Deposits $ 1,651 $ 60,859 $ –Other Obligations related to securities sold short 38,252 – – Obligations related to assets sold under repurchase agreements and securities loaned – 27,494 – Derivatives 42,340 – –
(1) Includes the value of loan substitutes, which is nominal.
The purpose of the table below is to present the carrying value of those financial instruments that were classified upon adoption as held-for-trading or available-for-sale or designated as held-for-trading using the fair value option.
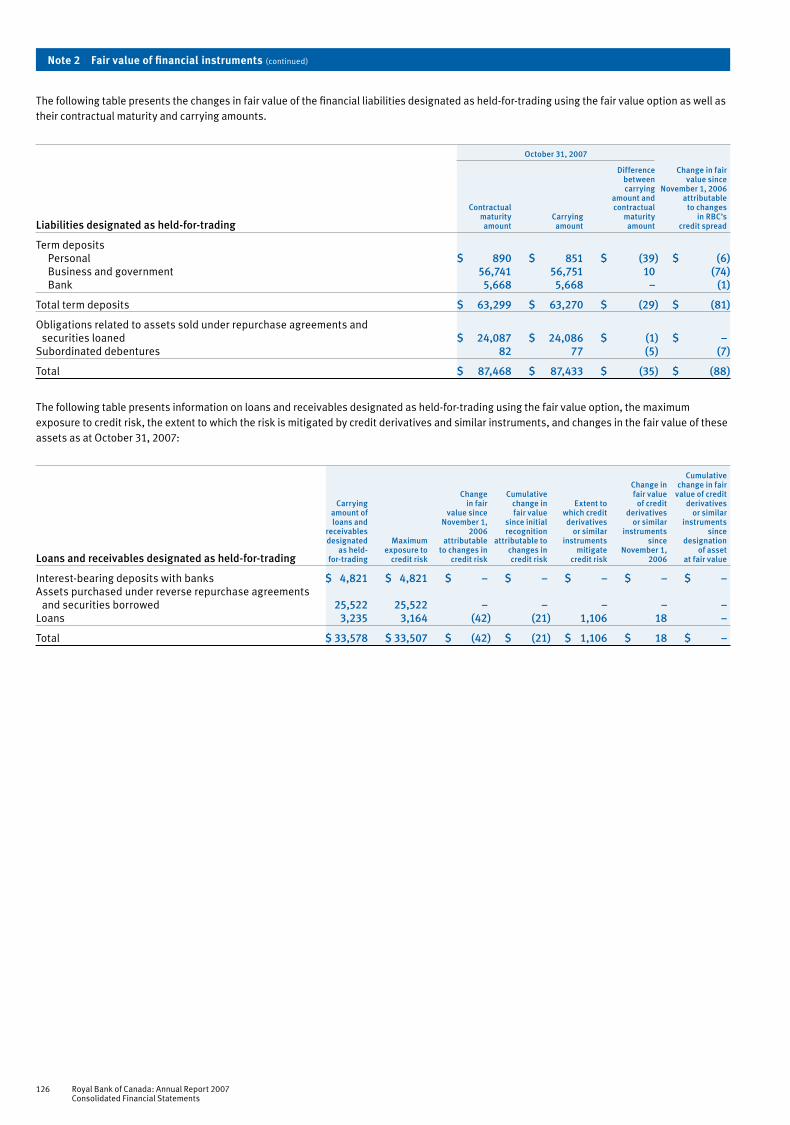
126 Royal Bank of Canada: Annual Report 2007Consolidated Financial Statements
October 31, 2007
Difference Change in fair between value since carrying November 1, 2006 amount and attributable Contractual contractual to changes maturity Carrying maturity in RBC’sLiabilities designated as held-for-trading amount amount amount credit spread
Term deposits Personal $ 890 $ 851 $ (39) $ (6) Business and government 56,741 56,751 10 (74) Bank 5,668 5,668 – (1)
Total term deposits $ 63,299 $ 63,270 $ (29) $ (81)
Obligations related to assets sold under repurchase agreements and securities loaned $ 24,087 $ 24,086 $ (1) $ –Subordinated debentures 82 77 (5) (7)
Total $ 87,468 $ 87,433 $ (35) $ (88)
The following table presents the changes in fair value of the financial liabilities designated as held-for-trading using the fair value option as well as their contractual maturity and carrying amounts.
The following table presents information on loans and receivables designated as held-for-trading using the fair value option, the maximum exposure to credit risk, the extent to which the risk is mitigated by credit derivatives and similar instruments, and changes in the fair value of these assets as at October 31, 2007:
Cumulative Change in change in fair Change Cumulative fair value value of credit Carrying in fair change in Extent to of credit derivatives amount of value since fair value which credit derivatives or similar loans and November 1, since initial derivatives or similar instruments receivables 2006 recognition or similar instruments since designated Maximum attributable attributable to instruments since designation as held- exposure to to changes in changes in mitigate November 1, of assetLoans and receivables designated as held-for-trading for-trading credit risk credit risk credit risk credit risk 2006 at fair value
Interest-bearing deposits with banks $ 4,821 $ 4,821 $ – $ – $ – $ – $ –Assets purchased under reverse repurchase agreements and securities borrowed 25,522 25,522 – – – – –Loans 3,235 3,164 (42) (21) 1,106 18 –
Total $ 33,578 $ 33,507 $ (42) $ (21) $ 1,106 $ 18 $ –
Note 2 Fair value of financial instruments (continued)

Royal Bank of Canada: Annual Report 2007Consolidated Financial Statements
127
Term to maturity (2)
With no 2007 2006 2005 Within 3 3 months 1 to 5 Over 5 years Over specific months to 1 year years to 10 years 10 years maturity Total Total Total
Trading account Canadian government debt $ 1,683 $ 3,046 $ 5,106 $ 1,383 $ 2,853 $ – $ 14,071 $ 13,900 $ 11,814 U.S. government debt 384 1,066 2,084 377 5,106 – 9,017 7,793 7,281 Other OECD government debt (3) – 1,429 2,699 26 82 – 4,236 4,658 6,476 Mortgage-backed securities 110 59 1,200 1,176 3,099 – 5,644 3,841 2,281 Asset-backed securities 231 47 6,612 53 691 – 7,634 9,064 8,781 Corporate debt and other debt Bankers’ acceptances 373 1 – – – – 374 766 998 Certificates of deposit 704 3,525 344 125 14 – 4,712 5,245 8,705 Other 5,189 4,011 24,468 2,220 4,986 1,564 42,438 44,139 33,714 Equities – – – – – 60,120 60,120 57,831 45,710
8,674 13,184 42,513 5,360 16,831 61,684 148,246 147,237 125,760
Available-for-sale securities (1) Canadian government debt Federal Amortized cost 195 57 2,031 382 – – 2,665 3,649 6,214 Fair value 195 57 2,040 384 – – 2,676 3,677 6,205 Yield (4) 3.5% 4.7% 4.4% 4.5% – – 4.4% 4.2% 3.6% Provincial and municipal Amortized cost – – 201 78 – – 279 1,687 2,035 Fair value – – 201 77 – – 278 1,935 2,229 Yield (4) – – 4.0% 4.5% – – 4.2% 5.4% 4.9% U.S. government debt Federal Amortized cost – – – – – – – 536 633 Fair value – – – – – – – 508 628 Yield (4) – – – – – – – 4.5% 2.2% State, municipal and agencies Amortized cost 307 517 1,194 21 – – 2,039 1,678 2,199 Fair value 307 518 1,155 21 – – 2,001 1,648 2,139 Yield (4) 5.3% 5.1% 5.0% 5.6% – – 5.1% 3.6% 2.5% Other OECD government debt (3) Amortized cost 1 622 107 84 5 – 819 758 1,595 Fair value 1 622 107 83 5 – 818 761 1,599 Yield (4) 3.6% .5% 4.2% 4.6% 4.9% – 1.4% 2.6% 1.9% Mortgage-backed securities Amortized cost 80 90 4,854 405 3,573 – 9,002 11,805 8,254 Fair value 80 90 4,872 408 3,522 – 8,972 11,692 8,183 Yield (4) 5.2% 4.7% 4.6% 5.2% 5.0% – 4.8% 4.5% 4.4% Asset-backed securities Amortized cost 399 5 245 357 998 – 2,004 3,164 1,442 Fair value 399 5 239 357 939 – 1,939 3,171 1,445 Yield (4) 6.0% 4.2% 4.7% 5.2% 5.3% – 5.4% 5.0% 4.2% Corporate debt and other debt Amortized cost 2,563 2,779 3,229 774 505 – 9,850 11,162 10,676 Fair value 2,554 2,850 3,135 760 495 – 9,794 11,360 10,839 Yield (4) 4.8% 5.2% 4.5% 5.2% 4.4% – 4.8% 4.8% 3.7% Equities (5) Cost – – – – – 2,715 2,715 2,537 1,012 Fair value – – – – – 2,874 2,874 2,592 974 Loan substitute Cost – – – – 400 256 656 656 675 Fair value – – – – 400 252 652 658 683 Yield (4) – – – – 4.6% 5.3% 4.9% 4.8% 3.7%
Amortized cost 3,545 4,070 11,861 2,101 5,481 2,971 30,029 37,632 34,735 Fair value 3,536 4,142 11,749 2,090 5,361 3,126 30,004 38,002 34,924
Held-to-maturity securities (1) Amortized cost – 3 – – 2 – 5 – – Fair value – 3 – – 2 – 5 – –
Total carrying value of securities (1) $ 12,210 $ 17,329 $ 54,262 $ 7,450 $ 22,194 $ 64,810 $ 178,255 $184,869 $ 160,495
(1) Available-for-sale securities, including loan substitutes, are carried at fair value and held-to-maturity securities are carried at amortized cost. Prior to November 1, 2006, both available-for-sale and held-to-maturity securities were classified as Investment securities and were carried at amortized cost. The prior period comparative amounts have not been restated.
(2) Actual maturities may differ from contractual maturities shown above, since borrowers may have the right to prepay obligations with or without prepayment penalties. (3) OECD stands for Organisation for Economic Co-operation and Development.(4) The weighted average yield is based on the carrying value at the end of the year for the respective securities. (5) Includes the value of the shares received upon the restructuring of Visa Inc. Refer to Note 30.
Note 3 Securities (1)

128 Royal Bank of Canada: Annual Report 2007Consolidated Financial Statements
Realized gains and losses on sale of Available-for-sale securities (1)
2007 2006 2005
Realized gains $ 187 $ 177 $ 141 Realized losses and writedowns (124) (89) (56)
Net gain on sale of Available-for-sale securities $ 63 $ 88 $ 85
(1) Available-for-sale securities, including loan substitutes, are carried at fair value and held-to-maturity securities are carried at amortized cost. Prior to November 1, 2006, both available-for-sale and held-to-maturity securities were classified as Investment securities and were carried at amortized cost. The prior period comparative amounts have not been restated.
Unrealized gains and losses on Available-for-sale securities (1), (2)
2007 2006 Gross Gross Gross Gross Amortized unrealized unrealized Fair Amortized unrealized unrealized Fair cost gains losses value cost gains losses value
Canadian government debt Federal $ 2,665 $ 12 $ (1) $ 2,676 $ 3,649 $ 29 $ (1) $ 3,677 Provincial and municipal 279 – (1) 278 1,687 248 – 1,935 U.S. government debt Federal – – – – 536 – (28) 508 State, municipal and agencies 2,039 10 (48) 2,001 1,678 5 (35) 1,648 Other OECD government debt 819 1 (2) 818 758 4 (1) 761 Mortgage-backed securities 9,002 30 (60) 8,972 11,805 17 (130) 11,692 Asset-backed securities 2,004 2 (67) 1,939 3,164 11 (4) 3,171 Corporate debt and other debt 9,855 45 (101) 9,799 11,162 238 (40) 11,360 Equities 2,715 191 (32) 2,874 2,537 110 (55) 2,592 Loan substitute securities 656 – (4) 652 656 2 – 658
$ 30,034 $ 291 $ (316) $ 30,009 $ 37,632 $ 664 $ (294) $ 38,002
(1) Available-for-sale securities, including loan substitutes, are carried at fair value and held-to-maturity securities are carried at amortized cost. Prior to November 1, 2006, both available-for-sale and held-to-maturity securities were classified as Investment securities and were carried at amortized cost. The prior period comparative amounts have not been restated.
(2) Includes $5 million held-to-maturity securities..
Fair value and unrealized losses position for Available-for-sale securities as at October 31, 2007 Less than 12 months 12 months or more Total
Fair value Unrealized losses Fair value Unrealized losses Fair value Unrealized losses
Canadian government debt Federal $ 1,231 $ 1 $ – $ – $ 1,231 $ 1 Provincial and municipal 210 1 – – 210 1U.S. government debt Federal – – – – – – State, municipal and agencies – – 265 48 265 48Other OECD government debt 47 2 – – 47 2Mortgage-backed securities 941 14 994 46 1,935 60Asset-backed securities 853 5 501 62 1,354 67Corporate debt and other debt 2,162 57 434 48 2,596 105Equities 432 30 3 2 435 32
Total temporarily impaired securities $ 5,876 $ 110 $ 2,197 $ 206 $ 8,073 $ 316
The unrealized losses for Canadian government debt and U.S. govern-ment debt were caused by increases in interest rates and appreciation of the Canadian dollar against the U.S. dollar. The contractual terms of some of these investments either do not permit the issuer to settle the securities at a price less than the amortized cost of the investment, or permit prepayment of contractual amounts owing only with prepay-ment penalties assessed to recover interest foregone. As a result, it is not expected that these investments would be settled at a price less than the amortized cost. Further, a substantial amount of the U.S. dollar-denominated debt is hedged against the foreign currency risk and, accordingly, the unrealized losses are not considered to be other-than-temporarily impaired as at October 31, 2007.
Unrealized losses for mortgage-backed securities, asset-backed securities, corporate debt and other debt were due to interest rate changes and widening credit spreads caused by the recent disruption in the financial markets, the weakening of the U.S. housing market,
credit rating downgrades of certain securities in the marketplace, and appreciation of the Canadian dollar against the U.S. dollar. However, given that a substantial portion of these securities are investment-grade securities and we have the ability and intent to hold these investments until there is a recovery of fair value, which may be at maturity, we believe it is probable that we will be able to collect the principal amount of these securities according to the contractual terms of the investments. Accordingly, we do not consider these investments to be other-than-temporarily impaired as at October 31, 2007.
Unrealized losses on equity securities are primarily due to the timing of the market prices, foreign exchange movements, or the early years in the business cycle of the investees for certain investments. We do not consider these investments to be other-than-temporarily impaired as at October 31, 2007, as we have the ability and intent to hold them for a reasonable period of time until they recover their fair value.
Note 3 Securities (continued)

Royal Bank of Canada: Annual Report 2007Consolidated Financial Statements
129
Impaired loans (1), (2)
2007 2006 Specific Gross allowances Net Net
Retail Residential mortgages $ 210 $ (23) $ 187 $ 152 Personal 189 (96) 93 104 Small business (3) 19 (9) 10 4
$ 418 $ (128) $ 290 $ 260
Wholesale Business (4) $ 722 $ (223) $ 499 $ 311 Bank – – – – Sovereign (5) – – – –
$ 722 $ (223) $ 499 $ 311
Total $ 1,140 $ (351) $ 789 $ 571
(1) There are $353 million (2006 – $305 million) of loans that are contractually 90 days past due but are not considered impaired. (2) Average balance of gross impaired loans was $959 million (2006 – $805 million). (3) Includes small business exposure managed on a pooled basis.(4) Includes small business exposure managed on an individual client basis.(5) Sovereign refers to all central governments and agencies, central banks, as well as other qualifying public sector entities and multilateral development banks.
2007 2006 Other Other Canada United States International Total Canada United States International Total
Retail (1) Residential mortgages $ 107,453 $ 1,402 $ 890 $ 109,745 $ 94,272 $ 1,518 $ 885 $ 96,675 Personal 42,506 5,283 954 48,743 37,946 6,011 945 44,902 Credit cards 8,142 119 61 8,322 6,966 123 66 7,155 Small business (2) 2,652 – – 2,652 2,318 – – 2,318
160,753 6,804 1,905 169,462 141,502 7,652 1,896 151,050
Wholesale (1) Business (3), (4) 39,877 17,741 6,239 63,857 35,245 13,611 5,894 54,750 Bank 3,114 686 1,547 5,347 2,031 236 985 3,252 Sovereign (5) 416 – 347 763 553 – 334 887
43,407 18,427 8,133 69,967 37,829 13,847 7,213 58,889
Total loans (6) 204,160 25,231 10,038 239,429 179,331 21,499 9,109 209,939 Allowance for loan losses (1,101) (321) (71) (1,493) (1,086) (266) (57) (1,409)
Total loans net of allowance for loan losses $ 203,059 $ 24,910 $ 9,967 $ 237,936 $ 178,245 $ 21,233 $ 9,052 $ 208,530
(1) Geographic information is based on residence of borrower.(2) Includes small business exposure managed on a pooled basis.(3) Includes small business exposure managed on an individual client basis.(4) Included under Canada for 2007 are loans totalling $1,202 million to a variable interest entity administered by us.(5) Sovereign refers to all central governments and agencies, central banks, as well as other qualifying public sector entities and multilateral development banks.(6) Loans are net of unearned income of $113 million (2006 – $62 million).
Loan maturities and rate sensitivity Maturity term (1) Rate sensitivity
Under 1 to 5 Over 5 Fixed Non-rate- As at October 31, 2007 1 year years years (2) Total Floating rate sensitive Total
Retail $ 63,737 $ 92,337 $ 13,388 $ 169,462 $ 66,256 $ 101,496 $ 1,710 $ 169,462Wholesale 39,908 22,269 7,790 69,967 48,625 21,342 – 69,967
Total loans $ 103,645 $ 114,606 $ 21,178 $ 239,429 $ 114,881 $ 122,838 $ 1,710 $ 239,429Allowance for loan losses – – – (1,493) – – – (1,493)
Total loans net of allowance for loan losses $ 103,645 $ 114,606 $ 21,178 $ 237,936 $ 114,881 $ 122,838 $ 1,710 $ 237,936
(1) Based on the earlier of contractual repricing or maturity date.(2) Included in Wholesale are loans totalling $1,202 million to a variable interest entity administered by us, with maturity terms exceeding five years.
Note 4 Loans
Interest and dividends on Available-for-sale and Held-to-maturity securities (1)
2007 2006 2005
Taxable interest income $ 968 $ 1,087 $ 862 Non-taxable interest income 2 2 2Dividends 74 44 31
$ 1,044 $ 1,133 $ 895
(1) Available-for-sale securities, including loan substitutes, are carried at fair value and held-to-maturity securities are carried at amortized cost. Prior to November 1, 2006, both available-for-sale and held-to-maturity securities were classified as Investment securities and were carried at amortized cost. The prior period comparative amounts have not been restated.
The following table presents interest and dividends on Available-for-sale and Held-to-maturity securities:

130 Royal Bank of Canada: Annual Report 2007Consolidated Financial Statements
2007 (1) 2006 2005 Canadian Canadian Canadian residential Commercial Credit residential Commercial Credit residential Commercial mortgage mortgage card mortgage mortgage card mortgage mortgage loans (2), (3) loans (4) loans (5) loans (2), (3) loans loans (5) loans (2), (3) loans
Securitized and sold $ 6,188 $ 1,937 $ 1,200 $ 6,329 $ 718 $ 1,200 $ 3,752 $ 655 Net cash proceeds received 6,097 1,876 400 6,210 729 600 3,739 667Asset-backed securities purchased – 47 794 – – 596 – –Retained rights to future excess interest 146 – 9 121 – 8 100 – Pre-tax gain (loss) on sale 55 (14) 3 2 11 4 87 12
(1) We did not securitize any credit card loans during the year.(2) All Canadian residential mortgage loans securitized are insured. (3) Canadian insured residential mortgage loans securitized during the year through the creation of mortgage-backed securities and retained as at October 31, 2007 were $3,110 million
(2006 – $4,869 million, 2005 – $1,050 million). These securities are carried at fair value; prior to November 1, 2006, these securities were carried at amortized cost.(4) The net cash proceeds received represent gross proceeds of $1,923 million less funds used to purchase notes of $47 million (principal value of $48 million). We did not purchase any
notes as part of our securitization activities in 2006 or 2005.(5) The net cash proceeds received represent gross proceeds of $1,200 million in 2006 (2005 – $1,200 million) less funds used to purchase notes issued by Golden Credit Card Trust with a
principal value of $800 million in 2006 (2005 – $600 million).
The following table summarizes our securitization activities for 2007, 2006 and 2005:
Allowance for loan losses 2007 2006 Balance at Provision Balance Balance beginning for credit Other at end at end of year Write-offs Recoveries losses adjustments (1) of year of year
Retail Residential mortgages $ 13 $ (5) $ 1 $ 13 $ 1 $ 23 $ 13 Personal 101 (444) 74 364 1 96 101 Credit cards – (268) 46 223 (1) – – Small business (2) 9 (42) 7 34 1 9 9
123 (759) 128 634 2 128 $ 123
Wholesale Business (3) $ 140 $ (109) $ 42 $ 148 $ 2 $ 223 $ 140 Bank – – – – – – – Sovereign (4) – – – – – – –
Specific allowances $ 263 $ (868) $ 170 $ 782 $ 4 $ 351 $ 263 General allowance (5) 1,223 – – 9 (11) 1,221 1,223
Total allowance for credit losses $ 1,486 $ (868) $ 170 $ 791 $ (7) $ 1,572 $ 1,486 Allowance for off-balance sheet and other items (6) (77) – – (2) – (79) –
Total allowance for loan losses $ 1,409 $ (868) $ 170 $ 789 $ (7) $ 1,493 $ 1,486
(1) Primarily represent the translation impact of foreign currency-denominated allowance for loan losses.(2) Includes small business exposure managed on a pooled basis.(3) Includes small business exposure managed on an individual client basis.(4) Sovereign refers to all central governments and agencies, central banks, as well as other qualifying public sector entities and multilateral development banks. (5) Includes $79 million (2006 – $77 million) related to off-balance sheet and other items.(6) The allowance for off-balance sheet and other items is reported separately under Other liabilities.
Net interest income after provision for credit losses 2007 2006 2005
Net interest income $ 7,532 $ 6,796 $ 6,793Provision for credit losses 791 429 455
Net interest income after provision for credit losses $ 6,741 $ 6,367 $ 6,338
Note 5 Securitizations
In addition to the above securitization transactions, we sold $815 million of residential mortgage loans in 2006, resulting in a pre-tax loss of $3 million. None were sold in 2007.
Note 4 Loans (continued)
During the year ended October 31, 2007, assets acquired in respect of problem loans amounted to $36 million (2006 – $9 million).

Royal Bank of Canada: Annual Report 2007Consolidated Financial Statements
131
Cash flows from securitizations (1)
2007 2006 2005
Credit Canadian residential
Credit Canadian residential
Credit Canadian residential
card
mortgage loans card
mortgage loans card
mortgage loans loans Variable rate Fixed rate loans Variable rate Fixed rate loans Variable rate Fixed rate
Proceeds reinvested in revolving securitizations $ 15,684 $ 1,043 $ 3,559 $ 17,107 $ 466 $ 2,251 $ 12,076 $ 419 $ 1,520 Cash flows from excess spread (2) 256 66 168 263 11 134 242 3 100
(1) This analysis is not applicable for commercial mortgage loans securitizations as we have not retained rights to future excess spread in these transactions.(2) Includes servicing fees received.
Loans managed 2007 2006 Loan principal Past due (1) Net write-offs Loan principal Past due (1) Net write-offs
Retail $ 192,633 $ 754 $ 718 $ 172,118 $ 654 $ 597 Wholesale 69,967 739 66 58,889 485 (4)
Total loans managed (2) 262,600 1,493 784 231,007 1,139 593 Less: Loans securitized and managed Credit card loans 3,650 – 86 3,650 – 85 Canadian residential mortgage-backed securities created and sold 14,239 – – 12,186 – – Canadian residential mortgage-backed securities created and retained 5,282 – – 5,232 – –
Total loans reported on the Consolidated Balance Sheets $ 239,429 $ 1,493 $ 698 $ 209,939 $ 1,139 $ 508
(1) Includes impaired loans as well as loans that are contractually 90 days past due but are not considered impaired.(2) Excludes any assets we have temporarily acquired with the intent at acquisition to sell to SPEs.
Static pool credit losses include actual incurred and projected credit losses divided by the original balance of the loans securitized. The expected static pool credit loss ratio for securitized credit card loans at October 31, 2007 was .52%. Static credit pool losses are not applicable to residential mortgages as substantially all the mortgages are govern-
ment guaranteed.The following table summarizes the loan principal, past due and
net write-offs for total loans reported on our Consolidated Balance Sheets and securitized loans that we manage as at October 31, 2007 and 2006:
The key assumptions used to value the retained interests at the date of the securitization activities are as follows:
Key assumptions (1), (2)
2007 (3) 2006 2005 Canadian residential
Credit Canadian residential
Credit Canadian residential
mortgage loans card
mortgage loans card
mortgage loans Variable rate Fixed rate loans Variable rate Fixed rate loans Variable rate Fixed rate
Expected weighted average life of prepayable receivables (in years) 2.63 3.69 .16 2.61 3.60 .15 3.48 3.59Payment rate 29.20% 14.38% 40.02% 30.00% 15.39% 40.06% 13.52% 13.36%Excess spread, net of credit losses .88 .83 5.13 1.18 .99 6.88 .20 1.06 Expected credit losses – – 2.15 – – 1.75 – – Discount rate 4.71% 4.80% 10.00 4.32 4.36 10.00 3.64 3.59
(1) All rates are annualized except the payment rate for credit card loans which is monthly.(2) This analysis is not applicable for commercial mortgage loans securitizations as we have not retained rights to future excess spread in these transactions.(3) We did not securitize any credit card loans during the year.
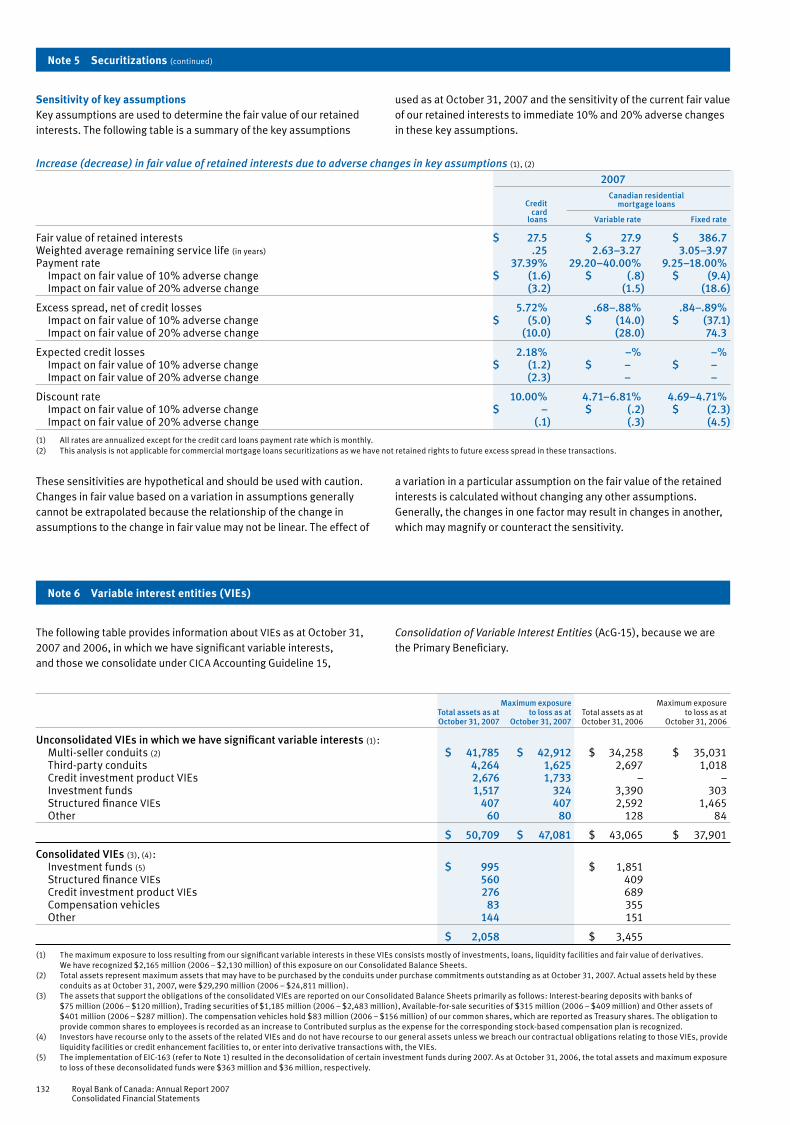
132 Royal Bank of Canada: Annual Report 2007Consolidated Financial Statements
Increase (decrease) in fair value of retained interests due to adverse changes in key assumptions (1), (2)
2007
Credit Canadian residential
card
mortgage loans
loans Variable rate Fixed rate
Fair value of retained interests $ 27.5 $ 27.9 $ 386.7 Weighted average remaining service life (in years) .25 2.63–3.27 3.05–3.97Payment rate 37.39% 29.20–40.00% 9.25–18.00% Impact on fair value of 10% adverse change $ (1.6) $ (.8) $ (9.4) Impact on fair value of 20% adverse change (3.2) (1.5) (18.6)
Excess spread, net of credit losses 5.72% .68–.88% .84–.89% Impact on fair value of 10% adverse change $ (5.0) $ (14.0) $ (37.1) Impact on fair value of 20% adverse change (10.0) (28.0) 74.3
Expected credit losses 2.18% –% –% Impact on fair value of 10% adverse change $ (1.2) $ – $ – Impact on fair value of 20% adverse change (2.3) – –
Discount rate 10.00% 4.71–6.81% 4.69–4.71% Impact on fair value of 10% adverse change $ – $ (.2) $ (2.3) Impact on fair value of 20% adverse change (.1) (.3) (4.5)
(1) All rates are annualized except for the credit card loans payment rate which is monthly.(2) This analysis is not applicable for commercial mortgage loans securitizations as we have not retained rights to future excess spread in these transactions.
Maximum exposure Maximum exposure Total assets as at to loss as at Total assets as at to loss as at October 31, 2007 October 31, 2007 October 31, 2006 October 31, 2006
Unconsolidated VIEs in which we have significant variable interests (1): Multi-seller conduits (2) $ 41,785 $ 42,912 $ 34,258 $ 35,031 Third-party conduits 4,264 1,625 2,697 1,018 Credit investment product VIEs 2,676 1,733 – – Investment funds 1,517 324 3,390 303 Structured finance VIEs 407 407 2,592 1,465 Other 60 80 128 84
$ 50,709 $ 47,081 $ 43,065 $ 37,901
Consolidated VIEs (3), (4): Investment funds (5) $ 995 $ 1,851 Structured finance VIEs 560 409 Credit investment product VIEs 276 689 Compensation vehicles 83 355 Other 144 151
$ 2,058 $ 3,455
(1) The maximum exposure to loss resulting from our significant variable interests in these VIEs consists mostly of investments, loans, liquidity facilities and fair value of derivatives. We have recognized $2,165 million (2006 – $2,130 million) of this exposure on our Consolidated Balance Sheets.
(2) Total assets represent maximum assets that may have to be purchased by the conduits under purchase commitments outstanding as at October 31, 2007. Actual assets held by these conduits as at October 31, 2007, were $29,290 million (2006 – $24,811 million).
(3) The assets that support the obligations of the consolidated VIEs are reported on our Consolidated Balance Sheets primarily as follows: Interest-bearing deposits with banks of $75 million (2006 – $120 million), Trading securities of $1,185 million (2006 – $2,483 million), Available-for-sale securities of $315 million (2006 – $409 million) and Other assets of $401 million (2006 – $287 million). The compensation vehicles hold $83 million (2006 – $156 million) of our common shares, which are reported as Treasury shares. The obligation to provide common shares to employees is recorded as an increase to Contributed surplus as the expense for the corresponding stock-based compensation plan is recognized.
(4) Investors have recourse only to the assets of the related VIEs and do not have recourse to our general assets unless we breach our contractual obligations relating to those VIEs, provide liquidity facilities or credit enhancement facilities to, or enter into derivative transactions with, the VIEs.
(5) The implementation of EIC-163 (refer to Note 1) resulted in the deconsolidation of certain investment funds during 2007. As at October 31, 2006, the total assets and maximum exposure to loss of these deconsolidated funds were $363 million and $36 million, respectively.
The following table provides information about VIEs as at October 31, 2007 and 2006, in which we have significant variable interests, and those we consolidate under CICA Accounting Guideline 15,
Consolidation of Variable Interest Entities (AcG-15), because we are the Primary Beneficiary.
Note 6 Variable interest entities (VIEs)
Note 5 Securitizations (continued)
These sensitivities are hypothetical and should be used with caution. Changes in fair value based on a variation in assumptions generally cannot be extrapolated because the relationship of the change in assumptions to the change in fair value may not be linear. The effect of
a variation in a particular assumption on the fair value of the retained interests is calculated without changing any other assumptions. Generally, the changes in one factor may result in changes in another, which may magnify or counteract the sensitivity.
Sensitivity of key assumptionsKey assumptions are used to determine the fair value of our retained interests. The following table is a summary of the key assumptions
used as at October 31, 2007 and the sensitivity of the current fair value of our retained interests to immediate 10% and 20% adverse changes in these key assumptions.

Royal Bank of Canada: Annual Report 2007Consolidated Financial Statements
133
Multi-seller and third-party conduitsWe administer seven multi-seller asset-backed commercial paper conduit programs (multi-seller conduits). These conduits primarily purchase financial assets from clients and finance those purchases by issuing asset-backed commercial paper. Our clients primarily utilize multi-seller conduits to diversify their financing sources and to reduce funding costs.
The multi-seller conduits also finance assets that are either in the form of securities including collateralized debt obligations or instru-ments that closely resemble securities such as credit-linked notes. In these situations, the multi-seller conduit is often one of many inves-tors in the securities or security-like instruments.
An unrelated third party (expected loss investor) absorbs credit losses, up to a maximum contractual amount, that may occur in the future on the assets in the multi-seller conduits (multi-seller conduit first-loss position) before the multi-seller conduits’ debt holders and us. In return for assuming this multi-seller conduit first-loss position, each multi-seller conduit pays the expected loss investor a return com-mensurate with its risk position. The expected loss investor absorbs a majority of each multi-seller conduit’s expected losses, when com-pared to us; therefore, we are not the Primary Beneficiary and do not consolidate these conduits under AcG-15. However, we continue to hold a significant variable interest in these multi-seller conduits result-ing from our provision of backstop liquidity facilities, partial credit enhancement and entitlement to residual fees.
We hold significant variable interests in third-party asset-backed security conduits primarily through providing liquidity support and credit enhancement facilities. However we are not the Primary Beneficiary and do not consolidate these conduits under AcG-15.
The liquidity and credit enhancement facilities are included and described in our disclosure on guarantees in Note 27.
Investment funds We enter into derivatives with third parties including mutual funds, unit investment trusts and other investment funds to provide their investors with the desired exposure and hedge our exposure from these derivatives by investing in other funds. We are the Primary Beneficiary when our participation in the derivative or our invest-ment in other funds exposes us to a majority of the respective expected losses.
Structured finance VIEs We finance VIEs that are part of transactions structured to achieve a desired outcome such as limiting exposure to specific assets or
risks, obtaining indirect exposure to financial assets, supporting an enhanced yield, funding specific assets and meeting client require-ments. We consolidate structured finance VIEs in which our interests expose us to a majority of the expected losses.
Creation of credit investment productsWe use VIEs to generally transform credit derivatives into cash instruments, to distribute credit risk and to create customized credit products to meet investors’ specific requirements. We enter into derivative contracts with these entities in order to convert various risk factors such as yield, currency or credit risk of underlying assets to meet the needs of the investors. We transfer assets to these VIEs as collateral for notes issued but the transfer of assets does not meet sale recognition criteria under AcG-12. In certain instances, we invest in the notes issued by these VIEs, which requires us to consolidate them when we are the Primary Beneficiary.
Compensation vehiclesWe use compensation trusts, which primarily hold our own common shares, to economically hedge our obligation to certain employees under some of our stock-based compensation programs. We consoli-date the trusts in which we are the Primary Beneficiary.
Capital trustsRBC Subordinated Notes Trust (Trust III) was created in 2007 to issue $1 billion of innovative subordinated debentures and RBC Capital Trust II (Trust II) was created in 2003 to issue $900 million of innova-tive capital instruments. We issued senior deposit notes of the same amounts to Trust II, and a senior deposit note of $999.8 million to Trust III. Although we own the common equity and voting control of these trusts, we are not the Primary Beneficiary since we are not exposed to the majority of the expected losses, and we do not have a significant interest in these trusts. For details on our innovative capital instruments, refer to Note 17.
Securitization of our financial assetsWe employ SPEs in the process of securitizing our assets, none of which are consolidated under AcG-15. One entity is a QSPE under AcG-12, which is specifically exempt from consolidation under AcG-15, and our level of participation in each of the remaining SPEs relative to others does not expose us to a majority of the expected losses. We also do not have significant interests in these SPEs. For details on our securitization activities, refer to Note 5.
Derivative financial instruments are financial contracts whose value is derived from an underlying interest rate, foreign exchange rate, equity or commodity instrument or index.
Types of derivativesForwards and futuresForward contracts are effectively tailor-made agreements that are transacted between counterparties in the over-the-counter market, whereas futures are standardized contracts with respect to amounts and settlement dates, and are traded on regular future exchanges. Examples of forwards and futures are described below:
Interest rate forwards (forward rate agreements) and futures are contractual obligations to buy or sell an interest-rate sensitive financial instrument on a predetermined future date at a specified price.
Foreign exchange forwards and futures are contractual obligations to exchange one currency for another at a specified price for settle-ment at a predetermined future date.
Equity forwards and futures are contractual obligations to buy or sell at a fixed value (the contracted price) of an equity index, a basket of stocks or a single stock at a predetermined future date.
SwapsSwaps are over-the-counter contracts in which two counterparties exchange a series of cash flows based on agreed upon rates to a notional amount. The various swap agreements that we enter into are as follows:
Interest rate swaps are agreements where two counterparties exchange a series of payments based on different interest rates applied to a notional amount in a single currency. Cross currency swaps involve the exchange of fixed payments in one currency for the receipt of fixed payments in another currency. Cross currency interest rate swaps involve the exchange of both interest and principal amounts in two different currencies.
Equity swaps are contracts in which one counterparty agrees to pay or receive from the other cash flows based on changes in the value of an equity index, a basket of stocks or a single stock.
Note 7 Derivative financial instruments and hedging activities

134 Royal Bank of Canada: Annual Report 2007Consolidated Financial Statements
OptionsOptions are contractual agreements under which the seller (writer) grants the purchaser the right, but not the obligation, either to buy (call option) or sell (put option), a security, exchange rate, interest rate, or other financial instrument or commodity at a predetermined price, at or by a specified future date. The seller (writer) of an option can also settle the contract by paying the cash settlement value of the purchaser’s right. The seller (writer) receives a premium from the purchaser for this right. The various option agreements that we enter into include interest rate options, foreign currency options and equity options.
Credit derivativesCredit derivatives are over-the-counter contracts that transfer credit risk related to an underlying financial instrument (referenced asset) from one counterparty to another. Examples of credit derivatives include credit default swaps, credit default baskets and total return swaps.
Credit default swaps provide protection against the decline in value of the referenced asset as a result of specified credit events such as default or bankruptcy. It is similar in structure to an option whereby the purchaser pays a premium to the seller of the credit default swap in return for payment related to the deterioration in the value of the referenced asset. Credit default baskets are similar to credit default swaps except that the underlying referenced financial instrument is a group of assets instead of a single asset.
Total return swaps are contracts where one counterparty agrees to pay or receive from the other cash flows based on changes in the value of the referenced asset.
Other derivative productsWe also transact in other derivative products including precious metal and commodity derivative contracts in both the over-the-counter and exchange markets. Certain warrants and loan commitments that meet the definition of derivative are also included as derivative instruments.
Derivatives issued for trading purposesMost of our derivative transactions relate to sales and trading activities. Sales activities include the structuring and marketing of derivative products to clients to enable them to transfer, modify or reduce current or expected risks. Trading involves market-making, positioning and arbitrage activities. Market-making involves quoting bid and offer prices to other market participants with the intention of generating revenue based on spread and volume. Positioning involves managing market risk positions with the expectation of profiting from favourable movements in prices, rates or indices. Arbitrage activities involve iden-tifying and profiting from price differentials between markets and products.
Derivatives issued for other than trading purposesWe also use derivatives for purposes other than trading, primarily for hedging, in conjunction with the management of interest rate, credit and foreign exchange risk related to our own asset/liability manage-ment, funding and investment activities.
Interest rate swaps are used to adjust exposure to interest rate risk by modifying the repricing or maturity characteristics of existing and/or anticipated assets and liabilities, including funding and invest-ment activities. Purchased interest rate options are used to hedge redeemable deposits and other options embedded in consumer products. We manage our exposure to foreign currency risk with cross currency swaps and foreign exchange forward contracts. We use credit derivatives to manage our credit exposures and for risk diversification in our lending portfolio.
Certain derivatives and cash instruments are specifically desig-nated and qualify for hedge accounting. We apply hedge accounting to minimize significant unplanned fluctuations in earnings caused by changes in interest rates or foreign exchange rates. Interest rate and currency fluctuations will either cause assets and liabilities to appreci-ate or depreciate in market value or cause variability in anticipated cash flows. When a hedging instrument functions effectively, gains, losses, revenue and expenses of the hedging instrument will offset the gains, losses, revenue and expenses of the hedged item. When derivatives are designated as the hedging instrument, all components of each derivative’s change in fair value are included in the assessment and measurement of hedge effectiveness. When cash instruments are designated for hedges of currency risks, only changes in their value due to currency risk are included in the assessment and measurement of hedge effectiveness.
We did not apply hedge accounting to any anticipated transac-tions or firm commitments during the year. As at October 31, 2007, after-tax net unrealized gains of $24 million were recognized in AOCI, representing the cumulative effective portions of our cash flow hedges. The net amount of gains and losses reported in AOCI that is expected to be reclassified to Net interest income within the next 12 months is not estimated to be material.
From time to time, we also enter into derivative transactions to economically hedge certain business strategies that do not otherwise qualify for hedge accounting, or where hedge accounting is not con-sidered economically feasible to implement. In such circumstances, changes in fair value are reflected in Non-interest income.
Note 7 Derivative financial instruments and hedging activities (continued)
Hedge activities 2007 After-tax Net gains (losses) Net gains (losses) unrealized included in included in gains (losses) Non-interest income Net interest income included in OCI
Fair value hedges Ineffective portion $ (14) $ n.a. $ n.a.Cash flow hedges Ineffective portion (9) n.a. n.a. Effective portion n.a. n.a. 80 Reclassified to income during the year (1) n.a. (47) n.a.Net investment hedges Foreign currency losses n.a. n.a. (2,965) Gains from hedges n.a. n.a. 1,804
(1) An after-tax equivalent amount of $31 million was reclassified from AOCI.n.a. not applicable

Royal Bank of Canada: Annual Report 2007Consolidated Financial Statements
135
Notional amount of derivatives by term to maturity Term to maturity 2007 2006 Within 1 to Over 5 Other than Other than 1 year 5 years years (1) Total Trading trading Trading trading
Over-the-counter contracts Interest rate contracts Forward rate agreements $ 197,733 $ 4,120 $ – $ 201,853 $ 201,853 $ – $ 315,378 $ – Swaps 896,816 907,875 449,855 2,254,546 2,096,153 158,393 1,874,206 140,232 Options purchased 22,986 35,405 32,197 90,588 89,585 1,003 99,172 86 Options written 38,403 39,854 71,485 149,742 149,169 573 73,566 – Foreign exchange contracts Forward contracts 706,342 21,149 14,285 741,776 710,961 30,815 626,484 33,033 Cross currency swaps 2,648 7,978 7,521 18,147 17,748 399 18,553 1,072 Cross currency interest rate swaps 53,818 141,584 82,936 278,338 242,319 36,019 228,090 20,707 Options purchased 28,961 7,472 330 36,763 36,756 7 65,572 71 Options written 30,500 7,559 296 38,355 38,355 – 68,337 51 Credit derivatives (2) 18,548 183,650 197,026 399,224 393,247 5,977 219,054 2,722 Other contracts (3) 22,614 20,129 31,203 73,946 73,804 142 86,548 573 Exchange-traded contracts Interest rate contracts Futures – long positions 68,553 8,806 5 77,364 77,086 278 146,886 524 Futures – short positions 112,912 19,278 2 132,192 132,008 184 211,131 901 Options purchased 14,945 19 – 14,964 14,964 – 71,926 – Options written 4,656 – – 4,656 4,656 – 119,194 – Foreign exchange contracts Futures – long positions 100 227 – 327 327 – 6,070 – Futures – short positions 9,521 168 – 9,689 9,689 – 26,088 – Other contracts (3) 252,784 1,396 26 254,206 254,206 – 257,154 –
$ 2,482,840 $ 1,406,669 $ 887,167 $ 4,776,676 $ 4,542,886 $ 233,790 $ 4,513,409 $ 199,972
(1) Includes contracts maturing in over 10 years with a notional value of $205,976 million (2006 – $135,951 million). The related gross positive replacement cost is $10,910 million (2006 – $3,857 million).
(2) Comprises credit default swaps, total return swaps and credit default baskets, including credit derivatives given guarantee treatment for the OSFI regulatory reporting purposes. Credit derivatives with a notional value of $5,530 million (2006 – $2,116 million) are economic hedges.
(3) Comprises precious metal, commodity and equity-linked derivative contracts other than embedded equity-linked contracts.
Fair value of derivative instruments 2007 2006 Average fair value Year-end Average fair value Year-end for year ended (1) fair value for year ended (1) fair value
Positive Negative Positive Negative Positive Negative Positive Negative
Held or issued for trading purposes Interest rate contracts Forward rate agreements $ 44 $ 49 $ 72 $ 25 $ 52 $ 50 $ 44 $ 60 Swaps 13,938 14,241 14,250 14,446 12,150 12,003 12,258 11,969 Options purchased 621 – 488 – 795 – 602 – Options written – 786 – 625 – 888 – 698
14,603 15,076 14,810 15,096 12,997 12,941 12,904 12,727
Foreign exchange contracts Forward contracts 8,342 8,508 14,503 14,410 6,740 6,969 5,493 5,758 Cross currency swaps 2,231 1,522 3,066 2,141 2,041 1,522 2,151 1,522 Cross currency interest rate swaps 8,987 9,419 13,634 14,250 7,010 8,275 6,703 8,319 Options purchased 1,044 – 1,221 – 1,571 – 1,055 – Options written – 1,028 – 1,302 – 1,582 – 994
20,604 20,477 32,424 32,103 17,362 18,348 15,402 16,593
Credit derivatives (2) 3,964 3,508 10,416 9,375 1,139 975 1,795 1,580 Other contracts (3) 6,096 9,537 4,925 10,317 5,623 8,803 5,798 9,221
$ 45,267 $ 48,598 $ 62,575 $ 66,891 $ 37,121 $ 41,067 $ 35,899 $ 40,121
Held or issued for other than trading purposes Interest rate contracts Swaps $ 1,110 $ 760 $ 1,100 $ 940 Options purchased 6 – – – Options written – 25 – –
1,116 785 1,100 940
Foreign exchange contracts Forward contracts 921 503 102 236 Cross currency swaps 2 9 5 5 Cross currency interest rate swaps 1,371 3,635 607 631 Options purchased – – 1 – Options written – – – 1
2,294 4,147 715 873
Credit derivatives (2) 36 30 20 30 Other contracts (3) 20 42 85 281
3,466 5,004 1,920 2,124
Total gross fair values before netting (4) 66,041 71,895 37,819 42,245 Impact of master netting agreements With intent to settle net or simultaneously (5) (473) (473) (137) (137) Without intent to settle net or simultaneously (6) (38,256) (38,256) (18,952) (18,952)
Total $ 27,312 $ 33,166 $ 18,730 $ 23,156
(1) Average fair value amounts are calculated based on monthly balances.(2) Comprises credit default swaps, total return swaps and credit default baskets, including credit derivatives given guarantee treatment for the OSFI regulatory reporting purposes.(3) Comprises precious metal, commodity and equity-linked derivative contracts. Certain warrants and loan commitments that meet the definition of derivatives are also included.(4) The positive year-end fair value excludes margin requirements of $1,017 million (2006 – $721 million) and the negative year-end fair value excludes market and credit valuation
adjustments of $588 million (2006 – $366 million).(5) Impact of offsetting credit exposures on contracts where we have both a legally enforceable master netting agreement in place and we intend to settle the contracts on either a net basis
or simultaneously. (6) Additional impact of offsetting credit exposures on contracts where we have a legally enforceable master netting agreement in place but do not intend to settle the contracts on a net
basis or simultaneously.
The following table provides the fair value of our derivative financial instruments:

136 Royal Bank of Canada: Annual Report 2007Consolidated Financial Statements
Derivative-related credit riskCredit risk from derivative transactions is generated by the potential for the counterparty to default on its contractual obligations when one or more transactions have a positive market value to us. Therefore, derivative-related credit risk is represented by the positive fair value of the instrument and is normally a small fraction of the contract’s notional amount.
We subject our derivative-related credit risk to the same credit approval, limit and monitoring standards that we use for managing other transactions that create credit exposure. This includes evaluat-ing the creditworthiness of counterparties, and managing the size, diversification and maturity structure of the portfolio. Credit utilization for all products is compared with established limits on a continual basis and is subject to a standard exception reporting process. We utilize a single internal rating system for all credit risk exposure. In most cases, these internal ratings approximate the external risk ratings of public rating agencies.
Netting is a technique that can reduce credit exposure from derivatives and is generally facilitated through the use of master net-ting agreements. The master netting agreement provides for a single net settlement of all financial instruments covered by the agreement in the event of default. However, credit risk is reduced only to the extent that our financial obligations to the same counterparty can be set off against obligations of the counterparty to us. The two main categories of netting are close-out netting and settlement netting. Under the close-out netting provision, if the counterparty defaults, we have the right to terminate all transactions covered by the master netting agreement at the then-prevailing market values and to sum the resulting market values, offsetting negative against positive values, to arrive at a single net amount owed by either the counterparty or us. Under the settlement netting provision, all payments and receipts in the same currency and due on the same day between specified branches are netted, generating a single payment in each currency, due either by us or the counterparty. We maximize the use of master
netting agreements to reduce derivative-related credit exposure. Our overall exposure to credit risk that is reduced through master netting agreements may change substantially following the reporting date as the exposure is affected by each transaction subject to the agreement as well as by changes in underlying market rates. Measurement of our credit exposure arising out of derivative transactions is reduced to reflect the effects of netting in cases where the enforceability of that netting is supported by appropriate legal analysis as documented in our trading credit risk policies.
The use of collateral is another significant credit mitigation technique for managing derivative-related counterparty credit risk. Marked-to-market provisions in our agreements with some counter-parties, typically in the form of a Credit Support Annex, provide RBC with the right to request that the counter party pay down or collateral-ize the current market value of its derivatives positions when the value passes a specified threshold amount.
During 2007, 2006 and 2005, neither our actual credit losses aris-ing from derivative transactions nor the level of impaired derivative contracts were significant. The tables below show replacement cost, credit equivalent and risk-adjusted amounts of our derivatives both before and after the impact of netting.
Replacement cost represents the total fair value of all outstanding contracts in a gain position, before factoring in the master netting agreements. The amounts in the table below exclude fair value of $955 million (2006 – $734 million) relating to exchange-traded instru-ments as they are subject to daily margining and are deemed to have no credit risk.
The credit equivalent amount is defined as the sum of the replace-ment cost plus an add-on amount for potential future credit exposure as defined by the OSFI.
The risk-adjusted amount is determined by applying the standard OSFI-defined measures of counterparty risk to the credit equivalent amount.
Derivative-related credit risk 2007 2006 Replacement Credit equivalent Risk-adjusted Replacement Credit equivalent Risk-adjusted cost amount balance cost amount balance
Interest rate contracts Forward rate agreements $ 72 $ 92 $ 22 $ 44 $ 109 $ 22 Swaps 15,360 23,484 5,213 13,358 21,031 4,452 Options purchased 364 1,032 248 591 1,164 260
15,796 24,608 5,483 13,993 22,304 4,734
Foreign exchange contracts Forward contracts 15,424 22,222 5,674 5,595 12,413 3,310 Swaps 18,073 32,901 6,138 9,466 22,697 4,305 Options purchased 1,221 1,832 466 1,056 2,244 502
34,718 56,955 12,278 16,117 37,354 8,117
Credit derivatives (1) 10,416 35,026 8,465 1,795 6,975 2,009 Other contracts (2) 4,120 6,723 2,251 5,160 8,696 2,760
Derivatives before master netting agreements $ 65,050 $ 123,312 $ 28,477 $ 37,065 $ 75,329 $ 17,620 Impact of master netting agreements (38,729) (65,339) (14,020) (19,089) (31,831) (7,188)
Total derivatives after master netting agreement (3) $ 26,321 $ 57,973 $ 14,457 $ 17,976 $ 43,498 $ 10,432
(1) Comprises credit default swaps, total return swaps and credit default baskets. The above excludes credit derivatives issued for other than trading purposes related to bought and sold protection with a replacement cost of $36 million (2006 – $20 million). Credit derivatives issued for other than trading purposes related to sold protection with a replacement cost of $.4 million (2006 – $20 million) had a credit equivalent amount of $447 million (2006 – $283 million) and risk-adjusted asset amount of $447 million (2006 – $283 million) which were given guarantee treatment per the OSFI guidance.
(2) Comprises precious metal, commodity and equity-linked derivative contracts. (3) The total credit equivalent amount after netting includes collateral applied of $2,228 million (2006 – $1,310 million).
Note 7 Derivative financial instruments and hedging activities (continued)
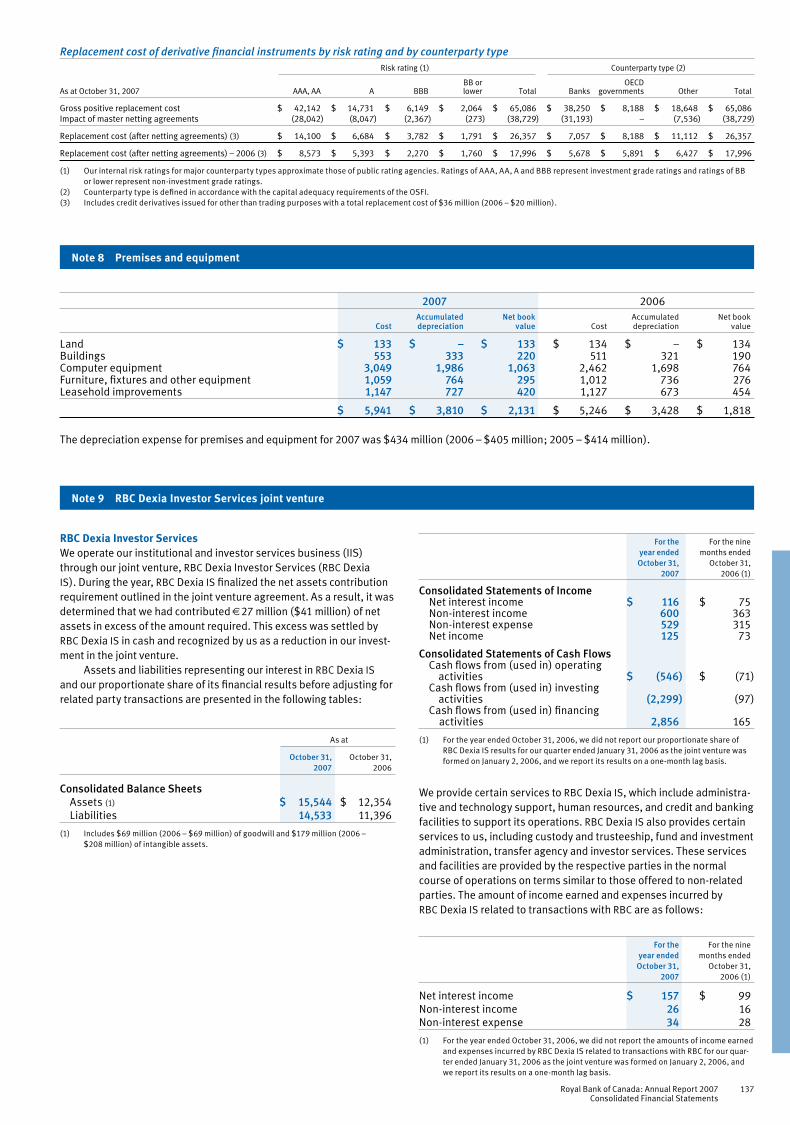
Royal Bank of Canada: Annual Report 2007Consolidated Financial Statements
137
Replacement cost of derivative financial instruments by risk rating and by counterparty type Risk rating (1) Counterparty type (2)
BB or OECD As at October 31, 2007 AAA, AA A BBB lower Total Banks governments Other Total
Gross positive replacement cost $ 42,142 $ 14,731 $ 6,149 $ 2,064 $ 65,086 $ 38,250 $ 8,188 $ 18,648 $ 65,086 Impact of master netting agreements (28,042) (8,047) (2,367) (273) (38,729) (31,193) – (7,536) (38,729)
Replacement cost (after netting agreements) (3) $ 14,100 $ 6,684 $ 3,782 $ 1,791 $ 26,357 $ 7,057 $ 8,188 $ 11,112 $ 26,357
Replacement cost (after netting agreements) – 2006 (3) $ 8,573 $ 5,393 $ 2,270 $ 1,760 $ 17,996 $ 5,678 $ 5,891 $ 6,427 $ 17,996
(1) Our internal risk ratings for major counterparty types approximate those of public rating agencies. Ratings of AAA, AA, A and BBB represent investment grade ratings and ratings of BB or lower represent non-investment grade ratings.
(2) Counterparty type is defined in accordance with the capital adequacy requirements of the OSFI.(3) Includes credit derivatives issued for other than trading purposes with a total replacement cost of $36 million (2006 – $20 million).
2007 2006 Accumulated Net book Accumulated Net book Cost depreciation value Cost depreciation value
Land $ 133 $ – $ 133 $ 134 $ – $ 134 Buildings 553 333 220 511 321 190 Computer equipment 3,049 1,986 1,063 2,462 1,698 764 Furniture, fixtures and other equipment 1,059 764 295 1,012 736 276 Leasehold improvements 1,147 727 420 1,127 673 454
$ 5,941 $ 3,810 $ 2,131 $ 5,246 $ 3,428 $ 1,818
Note 8 Premises and equipment
The depreciation expense for premises and equipment for 2007 was $434 million (2006 – $405 million; 2005 – $414 million).
RBC Dexia Investor ServicesWe operate our institutional and investor services business (IIS) through our joint venture, RBC Dexia Investor Services (RBC Dexia IS). During the year, RBC Dexia IS finalized the net assets contribution requirement outlined in the joint venture agreement. As a result, it was determined that we had contributed €27 million ($41 million) of net assets in excess of the amount required. This excess was settled by RBC Dexia IS in cash and recognized by us as a reduction in our invest-ment in the joint venture.
Assets and liabilities representing our interest in RBC Dexia IS and our proportionate share of its financial results before adjusting for related party transactions are presented in the following tables:
We provide certain services to RBC Dexia IS, which include administra-tive and technology support, human resources, and credit and banking facilities to support its operations. RBC Dexia IS also provides certain services to us, including custody and trusteeship, fund and investment administration, transfer agency and investor services. These services and facilities are provided by the respective parties in the normal course of operations on terms similar to those offered to non-related parties. The amount of income earned and expenses incurred by RBC Dexia IS related to transactions with RBC are as follows:
Note 9 RBC Dexia Investor Services joint venture
For the For the nine year ended months ended October 31, October 31, 2007 2006 (1)
Consolidated Statements of Income Net interest income $ 116 $ 75 Non-interest income 600 363 Non-interest expense 529 315 Net income 125 73
Consolidated Statements of Cash Flows Cash flows from (used in) operating activities $ (546) $ (71) Cash flows from (used in) investing activities (2,299) (97) Cash flows from (used in) financing activities 2,856 165
(1) For the year ended October 31, 2006, we did not report our proportionate share of RBC Dexia IS results for our quarter ended January 31, 2006 as the joint venture was formed on January 2, 2006, and we report its results on a one-month lag basis.
For the For the nine year ended months ended October 31, October 31, 2007 2006 (1)
Net interest income $ 157 $ 99Non-interest income 26 16 Non-interest expense 34 28
(1) For the year ended October 31, 2006, we did not report the amounts of income earned and expenses incurred by RBC Dexia IS related to transactions with RBC for our quar-ter ended January 31, 2006 as the joint venture was formed on January 2, 2006, and we report its results on a one-month lag basis.
As at
October 31, October 31, 2007 2006
Consolidated Balance Sheets Assets (1) $ 15,544 $ 12,354 Liabilities 14,533 11,396
(1) Includes $69 million (2006 – $69 million) of goodwill and $179 million (2006 – $208 million) of intangible assets.

138 Royal Bank of Canada: Annual Report 2007Consolidated Financial Statements
Other intangibles 2007 2006 Gross carrying Accumulated Net carrying Gross carrying Accumulated Net carrying amount amortization (1) amount amount amortization (1) amount
Core deposit intangibles $ 376 $ (170) $ 206 $ 324 $ (163) $ 161 Customer lists and relationships 605 (200) 405 625 (156) 469 Mortgage servicing rights 47 (30) 17 44 (32) 12
$ 1,028 $ (400) $ 628 $ 993 $ (351) $ 642
(1) Total amortization expense for 2007 was $96 million (2006 – $76 million; 2005 – $50 million).
The projected amortization of Other intangibles for each of the years ending October 31, 2008 to October 31, 2012 is approximately $86 million. There were no writedowns of intangible assets due to impairment for the year ended October 31, 2007 (2006 – nil; 2005 – nil).
Effective February 7, 2007, as discussed in Note 30, our previous three business segments were reorganized into four business segments. This reorganization resulted in the realignment of certain reporting units. Accordingly, we have reallocated our goodwill to the new
reporting units using the relative fair value approach. The following table discloses the changes in goodwill during 2006 and 2007, includ-ing the reallocation of goodwill to the new reporting units:
Goodwill RBC RBC U.S. and Canadian International RBC Personal and Personal and Capital Business Business Markets Total
Balance at October 31, 2005 $ 2,419 $ 831 $ 953 $ 4,203Goodwill acquired during the year – 86 – 86Other adjustments (1), (2) 72 (17) (40) 15
Balance at October 31, 2006 $ 2,491 $ 900 $ 913 $ 4,304
Goodwill acquired between November 1, 2006 and January 31, 2007 – 406 121 527Other adjustments (3) 9 58 34 101
Balance at January 31, 2007 $ 2,500 $ 1,364 $ 1,068 $ 4,932
(1) Other adjustments in 2006 primarily include the impact of foreign exchange translations on foreign currency-denominated goodwill, changes in goodwill related to our IIS business with RBC Dexia IS (refer to Note 9), and the transfer of $6 million of housing tax credit syndication business goodwill from RBC U.S. and International Personal and Business to RBC Capital Markets. Refer to Note 30.
(2) During 2006, we adjusted the foreign exchange translation of certain foreign currency-denominated goodwill of RBC Canadian Personal and Business to better align with the nature of the net assets supporting the segment. This resulted in an increase of $182 million of goodwill for RBC Canadian Personal and Business. A corresponding increase was made to Unrealized foreign currency translation adjustments on our Consolidated Statements of Changes in Shareholders’ Equity.
(3) Other adjustments in the first quarter of 2007 primarily include the impact of foreign exchange translations on foreign currency-denominated goodwill.
Note 10 Goodwill and other intangibles
As a result of the application of the relative fair value approach for the business reorganization, goodwill as at January 31, 2007 has been reallocated as follows:
Reallocation of goodwill Goodwill Goodwill balance before U.S. & balance after business Canadian Wealth International Capital business reorganization Banking Management Banking Markets reorganization
RBC Canadian Personal and Business $ 2,500 $ 2,069 $ 431 $ – $ – $ 2,500RBC U.S. and International Personal and Business 1,364 – 583 781 – 1,364RBC Capital Markets 1,068 – – 109 959 1,068
Balance at January 31, 2007 $ 4,932 $ 2,069 $ 1,014 $ 890 $ 959 $ 4,932
Goodwill acquired between February 1 and October 31, 2007 372 – 31 323 18 372Other adjustments (1) (552) (19) (163) (217) (153) (552)
Balance at October 31, 2007 $ 4,752 $ 2,050 $ 882 $ 996 $ 824 $ 4,752
(1) Other adjustments in the last three quarters of 2007 primarily include the impact of foreign exchange translations on foreign currency-denominated goodwill.
We have also completed the annual assessment for goodwill impairment in all reporting units and have determined that there was no goodwill impair-ment for the year ended October 31, 2007 (2006 – nil; 2005 – nil).

Royal Bank of Canada: Annual Report 2007Consolidated Financial Statements
139
2007In December 2006, we completed the acquisition of Atlanta, Georgia-based Flag Financial Corporation (Flag) and its subsidiary, Flag Bank,
and in March 2007, we completed the acquisition of 39 branches of AmSouth Bank in Alabama (AmSouth branches). Details of these acquisitions are as follows:
Note 11 Significant acquisitions and dispositions
Flag AmSouth branches (1)
Acquisition date December 8, 2006 March 9, 2007
Business segment U.S. & International Banking U.S. & International Banking
Percentage of shares acquired 100% n.a.
Purchase consideration in the currency of the transaction Cash payment of US$435 Cash payment of US$343
Purchase consideration in Canadian dollar equivalent $ 498 $ 405
Fair value of tangible assets acquired $ 1,912 $ 2,368Fair value of liabilities assumed (1,870) (2,369)
Fair value of identifiable net assets acquired (net liabilities assumed) 42 (1)Core deposit intangibles and other intangibles (2), (3) 50 83Goodwill 406 323
Total purchase consideration $ 498 $ 405
(1) The purchase price allocation for the AmSouth branches is preliminary; it will be finalized once the valuations of certain assets and liabilities are completed. (2) Core deposit intangibles are amortized on a straight-line basis over an estimated average useful life of seven years. (3) Included in the acquisition of Flag was $7 million of Other intangibles ($nil for AmSouth branches) which relates to non-compete agreements and are amortized over the term of the
agreements for a maximum of three years. n.a. not applicable
Other acquisitionsCapital MarketsDuring 2007, we completed three acquisitions for a total cost of US$150 million (C$170 million), which were paid in cash: (i) Ohio-based Seasongood & Mayer, LLC, a public finance firm and leading underwriter of municipal debt, and its wholly owned subsidiary, Seasongood Asset Management, an investment advisor to public funds clients, (ii) the broker-dealer business and certain other assets of the Carlin Financial Group, a New York-based broker-dealer, and (iii) Colorado-based Daniels & Associates, L.P., an M&A advisory firm specializing in the communications, media and entertainment, and technology sectors. These acquisitions are not material to Capital Markets and resulted in goodwill of $160 million.
Wealth ManagementOn May 18, 2007, we completed the acquisition of New Jersey-based J.B. Hanauer & Co., a privately held financial services firm which specializes in retail fixed income and wealth management services, for US$42 million (C$45 million) in cash. The acquisition is not material to Wealth Management and resulted in goodwill of $18 million.
Pending acquisitionsU.S. & International BankingOn April 17, 2007, we announced our intention to acquire a 50% inter-est in Fidelity Merchant Bank & Trust Limited, the Bahamas-based wholly owned subsidiary of Fidelity Bank & Trust International Limited to form a joint venture to be called Royal Fidelity Merchant Bank & Trust Limited which will provide certain corporate finance and advi-sory, investment management, stock brokerage, share registrar and transfer agency, pension and mutual fund administration services. This transaction is expected to close in the first quarter of 2008.
On September 6, 2007, RBC Centura Banks, Inc. announced the signing of a definitive merger agreement pursuant to which RBC Centura Banks, Inc. agreed to acquire Birmingham-based Alabama National BanCorporation (ANB), parent of 10 subsidiary banks and other affiliated businesses in Alabama, Florida and Georgia. Under the agreement, shareholders of ANB will receive US$80 per share payable in cash, RBC common shares or a combination of each, valuing the deal at approximately US$1.6 billion (C$1.5 billion as at October 31, 2007), with the total transaction consideration consisting of one-half cash and one-half RBC common shares. The acquisition is subject to customary closing conditions, including approval by U.S. and Canadian regulators and by ANB shareholders. The transaction is expected to close in early calendar year 2008.
On October 2, 2007, we and the RBTT Financial Group (RBTT) announced an agreement to combine our Caribbean retail banking operations with RBTT’s through the acquisition of RBTT for a total purchase price of TT$13.8 billion (C$2 billion as at October 31, 2007). RBTT is a Caribbean-owned banking and financial services group which offers a complete range of banking and financial intermed iate services to customers in Trinidad and Tobago and the Caribbean. Under the agreement, RBTT shareholders will receive per share con-sideration of TT$40 payable 60% in cash and 40% in RBC common shares. The number of RBC common shares to be received by RBTT shareholders is subject to a plus/minus 10% “collar” based on our share price of US$54.42. The acquisition is subject to customary clos-ing conditions, including approval by the Trinidad and Tobago and Canadian and other regulators and RBTT shareholders. This transac-tion is expected to close by the middle of calendar year 2008.

140 Royal Bank of Canada: Annual Report 2007Consolidated Financial Statements
Abacus AG&T
Acquisition date November 30, 2005 October 3, 2006
Business segment Wealth Management (1) Wealth Management (1)
Percentage of shares acquired 100% 100%
Purchase consideration in the currency of the transaction Cash payment of £$105 (2) Cash payment of US$12.5
Purchase consideration in Canadian dollar equivalent $ 213 $ 14
Fair value of tangible assets acquired $ 43 $ 3Fair value of liabilities assumed (23) –
Fair value of identifiable net tangible assets acquired 20 3Customer lists and relationships (3) 116 2Goodwill 77 9
Total purchase consideration $ 213 $ 14
(1) These acquisitions, which were previously included in the operations of RBC U.S. and International Personal and Business segment, are included in the Wealth Management business segment effective February 2, 2007 upon reorganization of our business segments. Refer to Note 30.
(2) Includes £20 million placed in an escrow account for future payments of claims as agreed to in the purchase agreement. Amounts remaining in the escrow account will be released to the vendors over a three-year period after completion of the acquisition.
(3) Customer lists and relationships are amortized on a straight-line basis over an estimated average useful life of 15 years.
2007 2006
Receivable from brokers, dealers and clients $ 4,048 $ 3,172 Accrued interest receivable 2,608 2,229 Investment in associated corporations and limited partnerships 1,420 1,614 Insurance-related assets (1) 827 702 Net future income tax asset (refer to Note 24) 1,251 1,104 Prepaid pension benefit cost (2) (refer to Note 20) 590 761 Cheques and other items in transit – 489 Other 7,109 5,346
$ 17,853 $ 15,417
(1) Insurance-related assets include policy loan balances, premiums outstanding, amounts due from other insurers in respect of reinsurance contracts and pooling arrangements, and deferred acquisition costs.
(2) Prepaid pension benefit cost represents the cumulative excess of pension fund contributions over pension benefit expense.
Note 12 Other assets
2006 Acquisitions Wealth ManagementIn November 2005, we completed the acquisition of operations of Abacus Financial Services Group Limited (Abacus) in London, Jersey, Guernsey, Edinburgh and Cheltenham. Abacus is based in Jersey, Channel Islands, and provides wealth management and fiduciary
services to private and corporate clients primarily in the British Isles and Continental Europe.
In October 2006, we completed the acquisition of American Guaranty & Trust (AG&T) which is based in Wilmington, Delaware, and offers complete personal trust and custody services through a unique strategic partnership with professional advisors.
The details of these acquisitions are as follows:
Dispositions On September 2, 2005, we completed the sale of RBC Mortgage Company (RBC Mortgage) to New Century Mortgage Corporation and Home123 Corporation (Home123), pursuant to which Home123 acquired certain assets of RBC Mortgage including its branches, and hired substantially all of its employees. RBC Mortgage disposed of substantially all of its remaining assets and obligations by the end of
2006 and the residual balances of RBC Mortgage in 2007 are immate-rial. These residual balances are no longer recorded separately in our Consolidated Financial Statements for 2007 and changes in the amounts are now reported in Corporate Support. Prior to 2007, the results of RBC Mortgage are presented separately as discontinued operations.
Note 11 Significant acquisitions and dispositions (continued)

Royal Bank of Canada: Annual Report 2007Consolidated Financial Statements
141
The following table details our deposit liabilities:
2007 2006 Demand (1) Notice (2) Term (3) Total Total
Personal $ 14,022 $ 36,537 $ 65,998 $ 116,557 $ 114,040Business and government (4), (5) 64,934 16,930 138,022 219,886 189,140 Bank 4,135 221 24,406 28,762 40,343
$ 83,091 $ 53,688 $ 228,426 $ 365,205 $ 343,523
Non-interest-bearing Canada $ 28,254 $ 19,088 United States 2,285 2,293 Other International 1,693 1,241 Interest-bearing Canada (4), (5) 155,190 174,170 United States 41,514 50,123 Other International 136,269 96,608
$ 365,205 $ 343,523
(1) Deposits payable on demand include all deposits for which we do not have the right to notice of withdrawal. These deposits are primarily chequing accounts.(2) Deposits payable after notice include all deposits for which we can legally require notice of withdrawal. These deposits are primarily savings accounts.(3) Term deposits include deposits payable on a fixed date. These deposits include term deposits, guaranteed investment certificates and similar instruments. At October 31, 2007, the bal-
ance of term deposits also includes senior deposit notes we have issued to provide long-term funding of $51.5 billion (2006 – $33.4 billion).(4) The senior deposit note of $900 million issued to Trust II (refer to Note 17) is included in Business and government deposits. This senior deposit note bears interest at an annual rate of
5.812% and will mature on December 31, 2053. The note is redeemable at our option, in whole or in part, on and after December 31, 2008, subject to the approval of the OSFI. It may be redeemed earlier, at our option in certain specified circumstances, subject to the approval of the OSFI. Each $1,000 of the note principal is convertible at any time into 40 of our Non-cumulative redeemable First Preferred Shares Series U at the option of Trust II. Trust II will exercise this conversion right in circumstances in which holders of RBC Trust Capital Securities Series 2013 (RBC TruCS 2013) exercise their holder exchange right. Refer to Note 17 for more information on RBC TruCS 2013.
(5) Business and government deposits also include a senior deposit note of $999.8 million issued to RBC Subordinated Notes Trust (Trust III) (refer to Note 17). This senior deposit note bears interest at an annual rate of 4.72% and will mature on April 30, 2017. Subject to the OSFI’s approval, the note is redeemable at our option, in whole or in part, on or after April 30, 2012, at the Redemption Price and may also be redeemed earlier at our option at the Early Redemption Price. The Redemption Price is an amount equal to $1,000 plus the unpaid distri-butions to the redemption date. The Early Redemption Price is an amount equal to the greater of (i) the Redemption Price, and (ii) the price calculated to provide an annual yield, equal to the yield on Government of Canada bonds from the redemption date to April 30, 2012, plus 11 basis points.
The following table presents the average deposit balances and average rates of interest paid during 2007 and 2006:
Average deposit balances and rates Average balances Average rates
2007 2006 2007 2006
Canada $ 190,754 $ 183,085 2.97% 2.74%United States 54,812 48,272 4.68 4.18Other International 122,910 91,942 4.50 3.99
$ 368,476 $ 323,299 3.74% 3.31%
Note 13 Deposits
Term deposits (1)
2007
Within 1 year $ 171,929 1 to 2 years 17,484 2 to 3 years 15,290 3 to 4 years 9,501 4 to 5 years 8,552 Over 5 years 5,670
Total $ 228,426
(1) The aggregate amount of term deposits in denominations of $100,000 or more as at October 31, 2007 was $186 billion.
The contractual maturities of the term deposits are as follows:

142 Royal Bank of Canada: Annual Report 2007Consolidated Financial Statements
2007 2006
Short-term borrowings of subsidiaries $ 3,784 $ 3,929 Payable to brokers, dealers and clients 3,941 3,382 Accrued interest payable 2,908 2,556 Accrued pension and other post-employment benefit expense (1) (refer to Note 20) 1,266 1,250 Insurance-related liabilities 408 491 Dividends payable 661 526 Payroll and related compensation 3,960 3,551 Trade payables and related accounts 1,854 709 Taxes payable 1,078 78 Other 8,623 6,177
$ 28,483 $ 22,649
(1) Accrued pension and other post-employment benefit expense represents the cumulative excess of pension and other post-employment benefit expense over pension and other post-employment fund contributions.
The net decrease in Insurance claims and policy benefit liabilities over the prior year comprised: (i) the favourable impact of the stronger Canadian dollar on U.S. dollar-denominated liabilities, (ii) a net decrease in reinsurance liabilities reflecting claim payments related to hurricanes Katrina, Rita and Wilma, and (iii) the net increase in life and health and property and casualty liabilities attributable to business growth and market movements on assets backing life and health liabilities.
Furthermore, the review of various actuarial assumptions and com-pletion of certain actuarial experience studies resulted in a net decrease of $57 million life and $32 million health insurance liabilities. This was predominantly driven by the impact of ongoing experience studies, refinements to cash flow models and methods, investment portfolio changes and updated interest rate assumptions, and includes a cumula-tive valuation adjustment of $92 million relating to prior periods.
The changes in the insurance claims and policy benefit liabilities are included in the Insurance policyholder benefits, claims and acquisi-tion expense in our Consolidated Statement of Income in the period in which the estimates changed.
ReinsuranceIn the ordinary course of business, our insurance operations reinsure risks to other insurance and reinsurance companies in order to provide greater diversification, limit loss exposure to large risks, and provide additional capacity for future growth. These ceding reinsurance arrangements do not relieve our insurance subsidiaries from their direct obligation to the insureds. We evaluate the financial condition of the reinsurers and monitor our concentrations of credit risks to minimize our exposure to losses from reinsurer insolvency.
Reinsurance recoverables related to property and casualty insur-ance business, which are included in Other assets, include amounts related to paid benefits and unpaid claims. Reinsurance recoverables related to life insurance business are included in Insurance claims and policy benefit liabilities to offset the related liabilities.
Reinsurance amounts (ceded premiums) included in Non-interest income for the years ended October 31 are shown in the table below:
Net premiums 2007 2006 2005
Gross premiums $ 3,445 $ 3,405 $ 3,329 Ceded premiums (852) (810) (765)
$ 2,593 $ 2,595 $ 2,564
Insurance claims and policy benefit liabilities 2007 2006
Life and health $ 6,664 $ 6,655Property and casualty 417 386Reinsurance 202 296
Total $ 7,283 $ 7,337
Future policy benefit liabilities $ 6,610 $ 6,605Claims liabilities 673 732
Total $ 7,283 $ 7,337
Note 14 Insurance
Note 15 Other liabilities

Royal Bank of Canada: Annual Report 2007Consolidated Financial Statements
143
The debentures are unsecured obligations and are subordinated in right of payment to the claims of depositors and certain other credi-tors. All redemptions, cancellations and exchanges of subordinated debentures are subject to the consent and approval of the OSFI. All subordinated debentures are redeemable at our option. As a result of adopting the new financial instruments accounting standards effective
November 1, 2006, Subordinated debentures are now presented on our Consolidated Balance Sheets net of deferred financing costs. Prior to November 1, 2006, deferred financing costs were recognized in Other assets. The prior period comparative amounts have not been restated. The amounts presented below are net of our holdings in these securities which have not been cancelled and are still outstanding.
Interest Denominated in Maturity Earliest par value redemption date rate foreign currency 2007 2006
March 15, 2009 6.50% US$125 $ 118 $ 140November 8, 2011 November 8, 2006 (1) US$400 – 449 June 4, 2012 June 4, 2007 (1) 6.75% – 483 January 22, 2013 January 22, 2008 (2) 6.10% (3) 483 497 January 27, 2014 January 27, 2009 (4) 3.96% (3) 495 493 June 1, 2014 June 1, 2009 (5) 4.18% (3) 976 997 November 14, 2014 10.00% 257 200 January 25, 2015 January 25, 2010 (6) 7.10% (3) 515 495 June 24, 2015 June 24, 2010 (4) 3.70% (3) 775 791April 12, 2016 April 12, 2011 (7) 6.30% (3) 389 400 November 4, 2018 November 4, 2013 (8) 5.45% (3) 1,021 985 June 8, 2023 9.30% 110 110June 26, 2037 June 26, 2017 (9) 2.86% (10) JPY 10,000 77 –October 1, 2083 (11) (12) 224 224June 6, 2085 (11) (13) US$189 179 239 June 18, 2103 June 18, 2009 (14) 5.95% (15) 622 600
$ 6,241 $ 7,103Deferred financing costs (6) –
$ 6,235 $ 7,103
Maturity scheduleThe aggregate maturities of subordinated debentures, based on the maturity dates under the terms of issue, are as follows:
At October 31, 2007 Total
Within 1 year $ – 1 to 5 years 118 5 to 10 years 3,890 Thereafter 2,233
$ 6,241
The terms and conditions of the debentures are as follows:(1) Redeemed on the earliest par value redemption date at par value.(2) Redeemable at any time prior to the earliest par value redemption
date at the greater of (i) the fair value of the subordinated debentures based on the yield on Government of Canada bonds plus 18 basis points and (ii) par value, and thereafter at any time at par value.
(3) Interest at stated interest rate until earliest par value redemption date, and thereafter at a rate of 1.00% above the 90-day Bankers’ Acceptance rate.
(4) Redeemable at any time prior to the earliest par value redemption date at the greater of (i) the fair value of the subordinated debentures based on the yield on Government of Canada bonds plus 8 basis points and (ii) par value, and thereafter at any time at par value.
(5) Redeemable at any time prior to the earliest par value redemption date at the greater of (i) the fair value of the subordinated debentures based on the yield on Government of Canada bonds plus 9 basis points and (ii) par value, and thereafter at any time at par value.
(6) Redeemable at any time prior to the earliest par value redemption date at the greater of (i) the fair value of the subordinated debentures based on the yield on Government of Canada bonds plus 12.5 basis points and (ii) par value, and thereafter at any time at par value.
(7) Redeemable at any time prior to the earliest par value redemption date at the greater of (i) the fair value of the subordinated debentures based on the yield on Government of Canada bonds plus 22 basis points and (ii) par value, and thereafter at any time at par value.
(8) Redeemable at any time prior to the earliest par value redemption date at the greater of (i) the fair value of the subordinated debentures based on the yield on Government of Canada bonds plus 14 basis points and (ii) par value, and thereafter at any time at par value.
(9) Redeemable on or after June 26, 2017, at par value.(10) Fixed interest rate at 2.86% per annum, payable semi-annually.(11) Redeemable on any interest payment date at par value.(12) Interest at a rate of 40 basis points above the 30-day Bankers’
Acceptance rate.(13) Interest at a rate of 25 basis points above the U.S. dollar 3-month
LIMEAN. In the event of a reduction of the annual dividend we declare on our common shares, the interest payable on the deben-tures is reduced pro rata to the dividend reduction and the interest reduction is payable with the proceeds from the sale of newly issued common shares.
(14) Redeemable on June 18, 2009, or every fifth anniversary of such date at par value. Redeemable on any other date at the greater of par and the yield on a non-callable Government of Canada bond plus 21 basis points if redeemed prior to June 18, 2014, or 43 basis points if redeemed at any time after June 18, 2014.
(15) Interest at a rate of 5.95% until earliest par value redemption date and every 5 years thereafter at the 5-year Government of Canada yield plus 172 basis points.
Note 16 Subordinated debentures

144 Royal Bank of Canada: Annual Report 2007Consolidated Financial Statements
Redemption date Conversion date 2007
2006
Annual At the option of At the option Principal PrincipalIssuer Issuance date Distribution dates yield the issuer of the holder amount amount
RBCCapitalTrust (1), (2), (3), (4), (5), (6), (7) Included in Trust capital securities 650,000 Trust Capital Securities – Series 2010 July 24, 2000 June 30, December 31 7.288% December 31, 2005 December 31, 2010 $ 650 $ 650 750,000 Trust Capital Securities – Series 2011 December 6, 2000 June 30, December 31 7.183% December 31, 2005 December 31, 2011 $ 750 $ 750
$ 1,400 $ 1,400Included in Non-controlling interest in subsidiaries 1,200,000 Trust Capital Securities – October 28, 2005 June 30, December 31 4.87% (8) December 31, 2010 Holder does not have $ 1,200 $ 1,200 Series 2015 conversion option
$ 2,600 $ 2,600
RBCCapitalTrustII (2), (3), (4), (6), (7), (9) 900,000 Trust Capital Securities – Series 2013 July 23, 2003 June 30, December 31 5.812% December 31, 2008 Any time $ 900 $ 900
RBCSubordinatedNotesTrust (3), (4), (6), (7), (10), (11) $1 billion 4.58% Trust Subordinated Notes – April 30, 2007 April 30, October 30 4.584% Any time Holder does not have $ 1,000 $ – Series A conversion option
We issue innovative capital instruments, RBC Trust Capital Securities (TruCS) and RBC Trust Subordinated Notes (TSNs), through three SPEs: RBC Capital Trust (Trust), RBC Capital Trust II (Trust II) and RBC Subordinated Notes Trust (Trust III).
On April 30, 2007, we issued $1 billion innovative subordinated debentures, TSNs – Series A, through Trust III. Trust III is a closed-end trust established under the laws of the Province of Ontario. The issue was priced at $99.982 with a yield to April 30, 2012 of 4.584%. The proceeds were used to purchase a senior deposit note from us. Trust III is a VIE under AcG-15. We do not consolidate Trust III as we are not its Primary Beneficiary (refer to Note 6); therefore, the TSNs – Series A issued by Trust III are not reported on our Consolidated Balance Sheet but the senior deposit note issued by us to Trust III is reported as a Business and government deposit liability (refer to Note 13).
In prior years, we issued non-voting RBC Trust Capital Securities Series 2010, 2011 and 2015 (RBC TruCS 2010, 2011 and 2015) through our consolidated subsidiary RBC Capital Trust, a closed-end trust established under the laws of the Province of Ontario. RBC TruCS 2010 and 2011 are classified as Trust capital securities. The proceeds of the RBC TruCS 2010 and 2011 were used to fund the Trust’s acquisition of trust assets. Holders of RBC TruCS 2010 and 2011 are eligible to receive semi-annual non-cumulative fixed cash distributions.
Unlike the RBC TruCS 2010 and 2011, the holders of RBC TruCS 2015 do not have any conversion rights or any other redemption rights.
As a result, upon consolidation of the Trust, RBC TruCS 2015 are classified as Non-controlling interest in subsidiaries (refer to Note 19). Holders of RBC TruCS 2015 are eligible to receive semi-annual non-cumulative fixed cash distributions until December 31, 2015 and a floating-rate cash distribution thereafter.
Trust II, an open-end trust, has issued non-voting RBC TruCS 2013, the proceeds of which were used to purchase a senior deposit note from us. Trust II is a VIE under AcG-15 (refer to Note 6). We do not consolidate Trust II as we are not the Primary Beneficiary; there-fore, the RBC TruCS 2013 issued by Trust II are not reported on our Consolidated Balance Sheets, but the senior deposit note is reported in Deposits (refer to Note 13). Holders of RBC TruCS 2013 are eligible to receive semi-annual non-cumulative fixed cash distributions.
No cash distributions will be payable by the trusts on TruCS if we fail to declare regular dividends (i) on our preferred shares, or (ii) on our common shares if no preferred shares are then outstanding. In this case, the net distributable funds of the trusts will be distributed to us as holders of residual interest in the trusts. Should the trusts fail to pay the semi-annual distributions in full, we will not declare dividends of any kind on any of our preferred or common shares for a specified period of time.
The table below presents the significant terms and conditions of TruCS and TSNs as at October 31, 2007 and 2006:
The significant terms and conditions of the TruCS and TSNs are as follows:(1) Subject to the approval of the OSFI, the Trust may, in whole (but not in
part), on the Redemption date specified above, and on any Distribution date thereafter, redeem the RBC TruCS 2010, 2011 and 2015, without the consent of the holders.
(2) Subject to the approval of the OSFI, upon occurrence of a special event as defined, prior to the Redemption date specified above, the trusts may redeem all, but not part of, RBC TruCS 2010, 2011, 2013 or 2015 without the consent of the holders.
(3) Issuer Redemption Price: The RBC TruCS 2010 and 2011 may be redeemed for cash equivalent to (i) the Early Redemption Price if the redemption occurs earlier than six months prior to the conversion date specified above or (ii) the Redemption Price if the redemption occurs on or after the date that is six months prior to the conversion date as indicated above. The RBC TruCS 2013 and 2015 may be redeemed for cash equivalent to (i) the Early Redemption Price if the redemption occurs prior to December 31, 2013 and 2015, respectively, or (ii) the Redemption Price if the redemption occurs on or after December 31, 2013 and 2015, respectively. The TSNs – Series A may be redeemed, in whole or in part, subject to the approval of the OSFI, for cash equivalent to (i) the Early Redemption Price if the notes are redeemed prior to April 30, 2012, or (ii) the Redemption Price if the notes are redeemed on or after April 30, 2012. Redemption Price refers to an amount equal to $1,000 plus the unpaid distributions to the Redemption date. Early Redemption Price refers to an amount equal to the greater of (i) the Redemption Price and (ii) the price calculated to pro-vide an annual yield, equal to the yield on a Government of Canada bond issued on the Redemption date with a maturity date of June 30, 2010 and 2011, plus 33 basis points and 40 basis points, for RBC TruCS 2010 and 2011, respectively, and a maturity date of December 31, 2013 and 2015, plus 23 basis points and 19.5 basis points, for RBC TruCS 2013 and 2015,
respectively; and a maturity date of April 30, 2012, plus 11 basis points for TSNs – Series A.
(4) Automatic Exchange Event: Without the consent of the holders, each RBC TruCS 2010, 2011, 2013 and 2015 will be exchanged automatically for 40 of our non-cumulative redeemable First Preferred Shares Series Q, R, T and Z, respectively, and each TSN – Series A will be exchanged automati-cally for an equal principal amount of Bank Series 10 Subordinated Notes upon occurrence of any one of the following events: (i) proceedings are commenced for our winding-up; (ii) the OSFI takes control of us; (iii) we have Tier 1 capital ratio of less than 5% or Total capital ratio of less than 8%; or (iv) the OSFI has directed us to increase our capital or provide additional liquidity and we elect such automatic exchange or we fail to comply with such direction. The First Preferred Shares Series T and Z pay semi-annual non-cumulative cash dividends and Series T is convertible at the option of the holder into a variable number of common shares.
(5) From time to time, we purchase some of the innovative capital instru-ments and hold them on a temporary basis. As at October 31, 2007, we held $nil of RBC TruCS 2011 (2006 – $17 million) and $6 million of RBC TruCS 2015 (2006 – $12 million) as treasury holdings which were deducted from regulatory capital.
(6) Regulatory capital: According to the OSFI guidelines, innovative capital instruments can comprise up to 15% of net Tier 1 capital with an additional 5% eligible for Tier 2B capital. Any amount in excess of the 20% limitation is not recognized for regulatory capital purposes. TSN – Series A qualifies as Tier 2B capital. As at October 31, 2007, $3,494 million (2006 – $3,222 million) represents Tier 1 capital, $1,027 million (2006 – $249 million) represents Tier 2B capital and $6 million (2006 – $29 million) of our treasury holdings of innovative capital is deducted for regulatory capital purposes. As at October 31, 2007, none of our innovative capital instruments exceeds the OSFI’s limit of 20% (2006 – nil ).
Note 17 Trust capital securities

Royal Bank of Canada: Annual Report 2007Consolidated Financial Statements
145
Authorized share capital Preferred – An unlimited number of First Preferred Shares and Second Preferred Shares without nominal or par value, issuable in series; the aggregate consideration for which all the First Preferred Shares and all the Second Preferred Shares that may be issued may not exceed $20 billion and $5 billion, respectively.
Common – An unlimited number of shares without nominal or par value may be issued.
Issuedandoutstandingshares 2007 2006 2005 Number Dividends Number Dividends Number Dividends ofshares declared of shares declared of shares declared (000s) Amount pershare (000s) Amount per share (000s) Amount per share
Preferredshareliabilities Firstpreferred Non-cumulative Series N 11,916 $ 298 $ 1.18 12,000 $ 300 $ 1.18 12,000 $ 300 $ 1.18 Treasury shares – sales 152 4 – – – – Treasury shares – purchases (68) (2) (84) (2) – –
Preferredshareliabilities,netoftreasuryholdings 12,000 $ 300 11,916 $ 298 12,000 $ 300
Preferredshares Firstpreferred Non-cumulative Series O (1) – $ – $ – 6,000 $ 150 $ 1.38 6,000 $ 150 $ 1.38 Non-cumulative Series S (2) – – – – – 1.33 10,000 250 1.53 Non-cumulative Series W (3) 12,000 300 1.23 12,000 300 1.23 12,000 300 .99 Non-cumulative Series AA (4) 12,000 300 1.11 12,000 300 .71 – – – Non-cumulative Series AB (5) 12,000 300 1.18 12,000 300 .41 – – – Non-cumulative Series AC (6) 8,000 200 1.22 – – – – – – Non-cumulative Series AD (7) 10,000 250 1.06 – – – – – – Non-cumulative Series AE (8) 10,000 250 .95 – – – – – – Non-cumulative Series AF (9) 8,000 200 .77 – – – – – – Non-cumulative Series AG (10) 10,000 250 .65 – – – – – –
$ 2,050 $ 1,050 $ 700
Commonshares Balance at beginning of year 1,280,890 $ 7,196 1,293,502 $ 7,170 1,289,496 $ 6,988 Issued under the stock option plan (11) 7,215 170 5,617 127 9,917 214 Purchased for cancellation (11,845) (66) (18,229) (101) (5,911) (32)
Balance at end of year 1,276,260 $ 7,300 $ 1.82 1,280,890 $ 7,196 $ 1.44 1,293,502 $ 7,170 $ 1.18
Treasuryshares–Preferredshares Balance at beginning of year (94) $ (2) (91) $ (2) – $ – Sales 1,345 33 2,082 51 – – Purchases (1,500) (37) (2,085) (51) (91) (2)
Balance at end of year (249) $ (6) (94) $ (2) (91) $ (2)
Treasuryshares–Commonshares Balance at beginning of year (5,486) $ (180) (7,053) $ (216) (9,726) $ (294) Sales 4,756 175 5,097 193 5,904 179 Purchases (1,714) (96) (3,530) (157) (1,326) (47) Initial adoption of AcG-15 – – – – (1,905) (54)
Balance at end of year (2,444) $ (101) (5,486) $ (180) (7,053) $ (216)
(1) On November 24, 2006, we redeemed Non-cumulative First Preferred Shares Series O. The excess of the redemption price over carrying value of $3 million was charged to retained earnings in preferred share dividends.
(2) On October 6, 2006, we redeemed Non-cumulative First Preferred Shares Series S. The excess of the redemption price over carrying value of $10 million was charged to retained earnings in preferred share dividends.
(3) On January 31, 2005, we issued 12 million Non-cumulative First Preferred Shares Series W at $25 per share.(4) On April 4, 2006, we issued 12 million Non-cumulative First Preferred Shares Series AA at $25 per share. (5) On July 20, 2006, we issued 12 million Non-cumulative First Preferred Shares Series AB at $25 per share. (6) On November 1, 2006, we issued 8 million Non-cumulative First Preferred Shares Series AC at $25 per share.(7) On December 13, 2006, we issued 10 million Non-cumulative First Preferred Shares Series AD at $25 per share.(8) On January 19, 2007, we issued 10 million Non-cumulative First Preferred Shares Series AE at $25 per share.(9) On March 14, 2007, we issued 8 million Non-cumulative First Preferred Shares Series AF at $25 per share.(10) On April 26, 2007, we issued 10 million Non-cumulative First Preferred Shares Series AG at $25 per share.(11) Includes the exercise of stock options from tandem stock appreciation rights (SARs) awards, resulting in a reversal of the accrued liability, net of related income taxes, of $10 million
(2006 – $8 million), and from renounced tandem SARs, net of related income taxes, of $6 million (2006 – $2 million).
Note 18 Preferred share liabilities and share capital
(7) Holder Exchange Right: Holders of RBC TruCS 2010 and 2011 may exchange, on any Distribution date on or after the conversion date speci-fied above, RBC TruCS 2010 and 2011 for 40 non-cumulative redeemable Bank First Preferred Shares, Series Q and Series R, respectively. Holders of RBC TruCS 2013 may, at any time, exchange all or part of their holdings for 40 non-cumulative redeemable First Preferred Shares Series U, for each RBC TruCS 2013 held. The First Preferred Shares Series Q, R and U pay semi-annual non-cumulative cash dividends as and when declared by our Board of Directors and are convertible at the option of the holder into a variable number of common shares. Holders of RBC TruCS 2015 and TSNs – Series A do not have similar exchange rights.
(8) The non-cumulative cash distribution on the RBC TruCS 2015 will be 4.87% paid semi-annually until December 31, 2015, and at one half of the sum of 180-day Bankers’ Acceptance rate plus 1.5%, thereafter.
(9) Subject to the approval of the OSFI, Trust II may, in whole or in part, on the Redemption date specified above, and on any Distribution date there-after, redeem any outstanding RBC TruCS 2013, without the consent of the holders.
(10) The cash distribution on the TSNs – Series A will be 4.58% paid semi- annually until April 30, 2012, and at 90-day Bankers’ Acceptance rate plus 1% thereafter paid quarterly until their maturity on April 30, 2017.
(11) We will guarantee the payment of principal, interest, the redemption price, if any, and any other amounts of the TSNs – Series A when they become due and payable, whether at stated maturity, call for redemp-tion, Automatic Exchange or otherwise according to the terms of the Bank Subordinated Guarantee and the Trust Indenture.

146 Royal Bank of Canada: Annual Report 2007Consolidated Financial Statements
Restrictions on the payment of dividendsWe are prohibited by the Act from declaring any dividends on our preferred or common shares when we are, or would be placed as a result of the declaration, in contravention of the capital adequacy and liquidity regulations or any regulatory directives issued under the Act. We may not pay dividends on our common shares at any time unless all dividends to which preferred shareholders are then entitled have been declared and paid or set apart for payment.
In addition, we may not declare or pay a dividend without the approval of the OSFI if, on the day the dividend is declared, the total of all dividends in that year would exceed the aggregate of our net income up to that day and of our retained net income for the preceding two years.
We have agreed that if RBC Capital Trust or RBC Capital Trust II fail to pay any required distribution on the trust capital securities in full, we will not declare dividends of any kind on any of our preferred or common shares. Refer to Note 17.
Currently, these limitations do not restrict the payment of dividends on our preferred or common shares.
We have also agreed that if, on any day we report financial results for a quarter, (i) we report a cumulative consolidated net loss for the
immediately preceding four quarters; and (ii) during the immediately preceding quarter we fail to declare any cash dividends on all of our outstanding preferred and common shares, we may defer pay-ments of interest on the Series 2014-1 Reset Subordinated Notes (matures on June 18, 2103). During any period while interest is being deferred, (i) interest will accrue on these notes but will not compound; (ii) we may not declare or pay dividends (except by way of stock divi-dend) on, or redeem or repurchase, any of our preferred or common shares; and (iii) we may not make any payment of interest, principal or premium on any debt securities or indebtedness for borrowed money issued or incurred by us that rank subordinate to these notes.
Regulatory capitalWe are subject to the regulatory capital requirements defined by the OSFI. Two measures of capital strength established by the OSFI, based on standards issued by the Bank for International Settlements, are risk-adjusted capital ratios and the assets-to-capital multiple.
The OSFI requires Canadian banks to maintain a minimum Tier 1 and Total capital ratio of 4% and 8%, respectively. However, the OSFI has also formally established risk-based capital targets for deposit-taking institutions in Canada. These targets are a Tier 1 capital ratio of
Termsofpreferredshareliabilitiesandpreferredshares Conversion date
Dividend Redemption Redemption At the option of At the option of per share (1) date (2) price (2), (3) the bank (2), (4) the holder (5)
Preferredshareliabilities Firstpreferred Non-cumulative Series N $ .293750 August 24, 2003 $ 25.00 August 24, 2003 August 24, 2008
Preferredshares Firstpreferred Non-cumulative Series W $ .306250 February 24, 2010 $ 26.00 February 24, 2010 Not convertible Non-cumulative Series AA .278125 May 24, 2011 26.00 Not convertible Not convertible Non-cumulative Series AB .293750 August 24, 2011 26.00 Not convertible Not convertible Non-cumulative Series AC .287500 November 24, 2011 26.00 Not convertible Not convertible Non-cumulative Series AD .281250 February 24, 2012 26.00 Not convertible Not convertible Non-cumulative Series AE .281250 February 24, 2012 26.00 Not convertible Not convertible Non-cumulative Series AF .278125 May 24, 2012 26.00 Not convertible Not convertible Non-cumulative Series AG .281250 May 24, 2012 26.00 Not convertible Not convertible
(1) Non-cumulative preferential dividends on Series N, W, AA, AB, AC, AD, AE, AF and AG are payable quarterly, as and when declared by the Board of Directors, on or about the 24th day of February, May, August and November.
(2) The redemption price represents the price as at October 31, 2007 or the contractual redemption price, whichever is applicable. Subject to the consent of the OSFI and the requirements of the Act, we may, on or after the dates specified above, redeem First Preferred Shares. These may be redeemed for cash, in the case of Series N at a price per share of $26, if redeemed during the 12 months commencing August 24, 2003, and decreasing by $.25 each 12-month period thereafter to a price per share of $25 if redeemed on or after August 24, 2007; and in the case of Series W, at a price per share of $26, if redeemed during the 12 months commencing February 24, 2010, and decreasing by $.25 each 12-month period thereafter to a price per share of $25 if redeemed on or after February 24, 2014; and in the case of Series AA, at a price per share of $26, if redeemed during the 12 months commencing May 24, 2011, and decreasing by $.25 each 12-month period thereafter to a price per share of $25 if redeemed on or after May 24, 2015; and in the case of Series AB, at a price per share of $26, if redeemed during the 12 months commenc-ing August 24, 2011, and decreasing by $.25 each 12-month period thereafter to a price per share of $25 if redeemed on or after August 24, 2015; and in the case of Series AC, at a price per share of $26, if redeemed during the 12 months commencing November 24, 2011, and decreasing by $.25 each 12-month period thereafter to a price per share of $25 if redeemed on or after November 24, 2015; and in the case of Series AD, at a price per share of $26, if redeemed during the 12 months commencing February 24, 2012, and decreasing by $.25 each 12-month period thereafter to a price per share of $25 if redeemed on or after February 24, 2016; and in the case of Series AE, at a price per share of $26, if redeemed during the 12 months
commencing February 24, 2012, and decreasing by $.25 each 12-month period thereafter to a price per share of $25 if redeemed on or after February 24, 2016; and in the case of Series AF, at a price per share of $26, if redeemed during the 12 months commencing May 24, 2012, and decreasing by $.25 each 12-month period thereaf-ter to a price per share of $25 if redeemed on or after May 24, 2016; and in the case of Series AG, at a price per share of $26, if redeemed during the 12 months commencing May 24, 2012, and decreasing by $.25 each 12-month period thereafter to a price per share of $25 if redeemed on or after May 24, 2016.
(3) Subject to the consent of the OSFI and the requirements of the Act, we may purchase the First Preferred Shares Series N, W, AA, AB, AC, AD, AE, AF and AG for cancellation at the lowest price or prices at which, in the opinion of the Board of Directors, such shares are obtainable.
(4) Subject to the approval of the Toronto Stock Exchange, we may, on or after the dates specified above, convert First Preferred Shares Series N and W into our common shares. First Preferred Shares may be converted into that number of common shares determined by dividing the then-applicable redemption price by the greater of $2.50 and 95% of the weighted average trading price of common shares at such time.
(5) Subject to our right to redeem or to find substitute purchasers, the holder may, on or after the dates specified above, convert First Preferred Shares into our common shares. Series N may be con-verted, quarterly, into that number of common shares determined by dividing the then-applicable redemption price by the greater of $2.50 and 95% of the weighted average trading price of common shares at such time.
Note 18 Preferred share liabilities and share capital (continued)

Royal Bank of Canada: Annual Report 2007Consolidated Financial Statements
147
2007 Numberof Numberof shareseligible shares Average forrepurchase repurchased costNCIB period (000s) (000s) pershare Amount
November 1, 2006 – October 31, 2007 40,000 11,845 $ 54.59 $ 646
2006 Pre-stock dividend Post-stock dividend Total
Number of Number of Number of shares eligible shares Average shares Average for repurchase repurchased cost repurchased cost NCIB period (000s) (000s) per share Amount (000s) per share Amount
June 26, 2006 – October 31, 2006 7,000 – $ – $ – 6,595 $ 47.12 $ 311 $ 311June 24, 2005 – June 23, 2006 10,000 4,387 90.48 397 2,859 47.52 136 533
4,387 $ 90.48 $ 397 9,454 $ 47.24 $ 447 $ 844
2005 (1)
Number of Number of shares eligible shares Average for repurchase repurchased cost NCIB period (000s) (000s) per share Amount
June 24, 2005 – June 23, 2006 10,000 1,950 $ 83.50 $ 163 June 24, 2004 – June 23, 2005 25,000 1,005 63.24 63
2,955 $ 76.61 $ 226
(1) The 2005 number of shares and average cost per share are pre-stock dividend.
7% and a Total capital ratio of 10%. At October 31, 2007, our Tier 1 and Total capital ratios were 9.4% and 11.5%, respectively (2006 – 9.6% and 11.9%, respectively).
As at October 31, 2007, our assets-to-capital multiple was 19.9 (2006 – 19.7), which remains below the maximum ratio of 23 permitted by the OSFI.
Dividend reinvestment planOur dividend reinvestment plan (plan), which was announced on August 27, 2004, provides registered common shareholders with a means to automatically reinvest the cash dividends paid on their com-mon shares in the purchase of additional common shares. The plan is only open to registered shareholders residing in Canada or the United States.
Management has the flexibility to fund the plan through open market share purchases or treasury issuances.
Shares available for future issuances As at October 31, 2007, 36.6 million common shares are available for future issue relating to our plan and potential exercise of stock options outstanding.
Normal Course Issuer BidDetails of common shares repurchased under Normal Course Issuer Bids (NCIB) during 2007, 2006 and 2005 are given below.
2007 2006
RBC Trust Capital Securities (TruCS) Series 2015 $ 1,214 $ 1,207 Consolidated VIEs 188 506 Others 81 62
$ 1,483 $ 1,775
We consolidate VIEs in which we are the Primary Beneficiary. These VIEs include structured finance VIEs, investment funds, credit invest-ment product VIEs and compensation vehicles as described in Note 6.
We issued RBC TruCS 2015 in 2005 which are reported as Non-controlling interest in subsidiaries upon consolidation as discussed in Note 17. As at October 31, 2007, $20 million (2006 – $19 million) of accrued interest net of $6 million (2006 – $12 million) of treasury hold-ings was included in RBC Trust Capital Securities Series 2015.
Note 19 Non-controlling interest in subsidiaries

148 Royal Bank of Canada: Annual Report 2007Consolidated Financial Statements
We offer a number of defined benefit and defined contribution plans, which provide pension and post-employment benefits to eligible employees. Our defined benefit pension plans provide benefits based on years of service, contributions and average earnings at retirement. Our other post-employment benefit plans include health, dental, disability and life insurance coverage.
During 2006, we changed our post-retirement benefit program in Canada. The changes reduced our benefit obligations by $505 million.
We fund our registered defined benefit pension plans in accordance with actuarially determined amounts required to satisfy employee benefit obligations under current pension regulations. For our principal pension plans, the most recent actuarial valuation per-formed for funding purposes was completed on January 1, 2007. The
next actuarial valuation for funding purposes will be completed on January 1, 2008.
For 2007, total contributions to our pension and other post- employment benefit plans were $208 million and $57 million (2006 – $594 million and $58 million), respectively. For 2008, total contribu-tions to defined benefit pension plans and other post-employment benefit plans are expected to be approximately $128 million and $55 million, respectively.
For financial reporting purposes, we measure our benefit obliga-tions and pension plan assets as at September 30 each year.
The following tables present financial information related to all of our material pension and other post-employment plans worldwide, including executive retirement arrangements:
Note 20 Pensions and other post-employment benefits
Planassets,benefitobligationandfundedstatus Pension plans (1) Other post-employment plans (2)
2007 2006 2007 2006Changeinfairvalueofplanassets Openingfairvalueofplanassets $ 6,407 $ 5,719 $ 41 $ 29 Actual return on plan assets 638 445 4 3 Company contributions 146 518 56 59 Plan participant contributions 25 24 5 6 Benefits paid (333) (323) (54) (56) Business acquisitions – 21 – – Other (34) 2 – – Change in foreign currency exchange rate (65) 1 – –
Closingfairvalueofplanassets $ 6,784 $ 6,407 $ 52 $ 41
Changeinbenefitobligation Openingbenefitobligation $ 6,838 $ 6,524 $ 1,468 $ 1,891 Service cost 178 173 19 26 Interest cost 362 345 75 77 Plan participant contributions 25 24 5 6 Actuarial (gain) loss (115) 38 3 38 Benefits paid (333) (323) (54) (56) Plan amendments and curtailments (9) 24 – (515) Business acquisitions 5 31 – 5 Other (27) 5 – – Change in foreign currency exchange rate (78) (3) (12) (4)
Closingbenefitobligation $ 6,846 $ 6,838 $ 1,504 $ 1,468
Fundedstatus Excess of benefit obligation over plan assets $ (62) $ (431) $ (1,452) $ (1,427) Unrecognized net actuarial loss 488 963 564 598 Unrecognized transitional (asset) obligation (10) (12) 1 1 Unrecognized prior service cost 95 131 (307) (330) Contributions between September 30 and October 31 2 14 5 4
Prepaidasset(accruedliability)asatOctober31 $ 513 $ 665 $ (1,189) $ (1,154)
AmountsrecognizedinourConsolidatedBalanceSheetsconsistof: Other assets $ 590 $ 761 $ – $ – Other liabilities (77) (96) (1,189) (1,154)
NetamountrecognizedasatOctober31 $ 513 $ 665 $ (1,189) $ (1,154)
Weightedaverageassumptionstocalculatebenefitobligation Discount rate 5.60% 5.25% 5.62% 5.26% Rate of increase in future compensation (3) 3.30% 3.30% 3.30% 3.30%
(1) For pension plans with funding deficits, the benefit obligations and fair values of plan assets totalled $5,850 million (2006 – $6,156 million) and $5,687 million (2006 – $5,665 million), respectively.
(2) For our other post-employment plans, the assumed health care cost trend rates for the next year used to measure the expected cost of benefits covered by the post-employment health and life plans were 7.2% for medical decreasing to an ultimate rate of 5.0% in 2016 and 4.5% for dental.
(3) The actual assumption for rate of increase in future compensation is an age-related scale. Although the underlying assumption has not been changed, we have revised our presentation of the disclosed equivalent single rate to be more consistent with the methodology used by other Canadian financial institutions.
The following table presents our estimates of the benefit payments for defined benefit pension and other post-employment plans:
Benefitspaymentprojection Other post-employment Pensionplans plans
2008 $ 318 $ 612009 349 69 2010 357 74 2011 365 77 2012 373 81 2013–2017 2,086 458

Royal Bank of Canada: Annual Report 2007Consolidated Financial Statements
149
Otherpost-employmentbenefitexpense 2007 2006 2005
Service cost $ 19 $ 26 $ 49 Interest cost 75 77 101 Expected return on plan assets (3) (2) (2) Amortization of transitional obligation – 3 17 Amortization of actuarial loss (gain) 36 31 30 Amortization of prior service cost (23) (20) 1 Curtailment gain – (8) (1)
Other post-employment benefit expense $ 104 $ 107 $ 195
Weightedaverageassumptionstocalculateotherpost-employmentbenefitexpenseDiscount rate 5.26% 5.41% 6.35% Rate of increase in future compensation (1) 3.30% 3.30% 3.30%
(1) The actual assumption for rate of increase in future compensation is an age-related scale. Although the underlying assumption has not changed, we have revised our presentation of the disclosed equivalent single rate to be more consistent with the methodology used by other Canadian financial institutions.
Investment policy and strategiesPension plan assets are invested prudently over the long term in order to meet pension obligations at a reasonable cost. The asset mix policy takes into consideration a number of factors including the following:(i) investment characteristics including expected returns, volatilities
and correlations between plan assets and plan liabilities;
(ii) the plan’s tolerance for risk, which dictates the trade-off between increased short-term volatility and enhanced long-term expected returns;
(iii) diversification of plan assets to minimize the risk of large losses;(iv) the liquidity of the portfolio relative to the anticipated cash flow
requirements of the plan; and (v) actuarial factors such as membership demographics and future
salary growth rates.
Composition of defined benefit pension plan assetsThe defined benefit pension plan assets are primarily composed of equity and fixed income securities. The equity securities include 1.5 million (2006 – 1.9 million) of our common shares having a fair value of $84 million (2006 – $94 million). Dividends amounting to
$2.6 million (2006 – $2.5 million) were received on our common shares held in the plan assets during the year.
The following table presents the allocation of the plan assets by securities category:
Assetcategory Actual
2007 2006
Equity securities 60% 60%Debt securities 40% 40%
Total 100% 100%
Pension and other post-employment benefit expenseThe following tables present the composition of our pension benefit and other post-employment benefit expense:
Pensionbenefitexpense 2007 2006 2005
Service cost $ 178 $ 173 $ 138 Interest cost 362 345 344 Expected return on plan assets (411) (364) (328) Amortization of transitional asset (2) (2) (2) Amortization of prior service cost 29 32 32 Amortization of actuarial loss (gain) 129 138 90 Other 7 3 3
Defined benefit pension expense $ 292 $ 325 $ 277 Defined contribution pension expense 74 65 63
Pension benefit expense $ 366 $ 390 $ 340
WeightedaverageassumptionstocalculatepensionbenefitexpenseDiscount rate 5.25% 5.25% 6.25% Assumed long-term rate of return on plan assets 7.00% 7.00% 7.00% Rate of increase in future compensation 3.30% 3.30% 3.30%
Significant assumptionsOur methodologies to determine significant assumptions used in calculating the defined benefit pension and other post-employment expense are as follows:
Overallexpectedlong-termrateofreturnonassetsThe assumed expected rate of return on assets is determined by considering long-term expected returns on government bonds and a reasonable assumption for an equity risk premium. The expected long-term return for each asset class is then weighted based on the target asset allocation to develop the expected long-term rate of return on assets assumption for the portfolio. This resulted in the selection of an assumed expected rate of return of 7% for 2008 (7% for 2004 to 2007).
DiscountrateFor the Canadian and U.S. pension and other post-employment plans, all future expected benefit payment cash flows at each measurement date are discounted at spot rates developed from a yield curve of AA corporate debt securities. It is assumed that spot rates beyond 30 years are equivalent to the 30-year spot rate. The discount rate is selected as the equivalent level rate that would produce the same discounted value as that determined by using the applicable spot rates. This methodology does not rely on assumptions regarding reinvestment rates.

150 Royal Bank of Canada: Annual Report 2007Consolidated Financial Statements
Definedbenefitpensionexpenseincurred 2007 2006 2005
Defined benefit pension expense recognized $ 292 $ 325 $ 277 Difference between expected and actual return on plan assets (227) (81) (423) Difference between actuarial losses (gains) amortized and actuarial losses (gains) arising (246) (100) 708 Difference between prior service costs amortized and prior service costs arising (38) (2) (31) Amortization of transitional asset 2 2 2
Defined benefit pension expense incurred $ (217) $ 144 $ 533
Otherpost-employmentbenefitexpenseincurred 2007 2006 2005
Other post-employment benefit expense recognized $ 104 $ 107 $ 195 Difference between expected and actual return on plan assets (1) (1) (2) Difference between actuarial losses (gains) amortized and actuarial losses (gains) arising (33) 7 150 Difference between prior service costs amortized and prior service costs arising 23 (485) (1) Amortization of transitional obligation – (3) (17)
Other post-employment benefit expense incurred $ 93 $ (375) $ 325
We offer stock-based compensation to certain key employees and to our non-employee directors. We use derivatives and compensation trusts to manage our economic exposure to volatility in the price of our common shares under many of these plans. The stock-based compen-sation amounts recorded in Non-interest expense – Human resources in our Consolidated Statements of Income are net of the impact of these derivatives.
Stock option plansWe have stock option plans for certain key employees and for non-employee directors. On November 19, 2002, the Board of Directors discontinued all further grants of options under the non-employee directors plan. Under the employee stock option plan, options are periodically granted to purchase common shares. The exercise price for each grant is determined as the higher of the volume-weighted average of the trading prices per board lot (100 shares) of our common shares on the Toronto Stock Exchange (i) on the day preceding the day of grant; and (ii) the five consecutive trading days immediately preced-
ing the day of grant. Stock options are normally granted at the end of the year, with the exercise price determined at least five business days after the release of the year-end financial results. The options vest over a four-year period for employees and are exercisable for a period not exceeding 10 years from the grant date.
For options issued prior to November 1, 2002, that were not accompanied by tandem stock appreciation rights (SARs), no compen-sation expense was recognized as the option’s exercise price was not less than the market price of the underlying stock on the day of grant. When the options are exercised, the proceeds received are credited to common shares.
Between November 29, 1999 and June 5, 2001, grants of options under the employee stock option plan were accompanied by tandem SARs. With tandem SARs, participants could choose to exercise a SAR instead of the corresponding option. In such cases, the participants received a cash payment equal to the difference between the closing price of common shares on the day immediately preceding the day of exercise and the exercise price of the option. During the last quarter of
Note 21 Stock-based compensation
SensitivityanalysisThe following table presents the sensitivity analysis of certain key assumptions on defined benefit pension and post-employment obligation and expense:
2007SensitivityofkeyassumptionsPension Changeinobligation Changeinexpense
Impact of .25% change in discount rate assumption $ 229 $ 29Impact of .25% change in rate of increase in future compensation assumption 23 6Impact of .25% change in the long-term rate of return on plan assets assumption – 15
Otherpost-employment Changeinobligation Changeinexpense
Impact of .25% change in discount rate assumption $ 55 $ 10Impact of .25% change in rate of increase in future compensation assumption – –Impact of 1.00% increase in health care cost trend rates 157 9Impact of 1.00% decrease in health care cost trend rates (129) (7)
Reconciliation of defined benefit expense recognized with defined benefit expense incurredThe cost of pension and other post-employment benefits earned by employees is actuarially determined using the projected benefit method pro-rated on services. The cost is computed using the dis-count rate determined in accordance with the methodology described in significant assumptions, and is based on management’s best esti-mate of expected plan investment performance, salary escalation, retirement ages of employees and costs of health, dental, disability and life insurance.
Actuarial gains or losses arise over time due to differences in actual experience compared to actuarial assumptions. Prior service costs arise as a result of plan amendments. Adoption of CICA Handbook Section 3461, EmployeeFutureBenefits, resulted in recognition of a transitional asset and obligation at the date of adoption.
The actuarial gains or losses, prior service costs and transitional asset or obligation are amortized over the expected average remaining service lifetime of active members expected to receive benefits under the plan. The following tables show the impact on our annual benefit expense if we had recognized all costs and expenses as they arose.
Note 20 Pensions and other post-employment benefits (continued)

Royal Bank of Canada: Annual Report 2007Consolidated Financial Statements
151
Asummaryofourstockoptionactivityandrelatedinformation 2007 2006 2005 Number Weighted Number Weighted Number Weighted ofoptions average of options average of options average (000s) exerciseprice (000s) exercise price (000s) exercise price
Outstanding at beginning of year 32,243 $ 24.66 36,481 $ 23.15 44,744 $ 22.02 Granted 1,835 55.06 1,756 44.13 2,054 31.70Exercised – Common shares (1), (2) (7,215) 21.10 (5,617) 20.40 (9,917) 19.85 – SARs (204) 21.50 (143) 21.60 (320) 21.01Cancelled (36) 36.42 (234) 24.36 (80) 30.44
Outstanding at end of year 26,623 $ 27.71 32,243 $ 24.66 36,481 $ 23.15
Exercisable at end of year 21,924 $ 24.17 26,918 $ 22.57 28,863 $ 21.56 Available for grant 21,527 23,121 24,500
(1) Cash received for options exercised during the year was $152 million (2006 – $115 million; 2005 – $197 million). (2) New shares were issued for all options exercised in 2007, 2006 and 2005. Refer to Note 18.
Fair value methodCICA 3870 requires recognition of an expense for option awards using the fair value method of accounting. Under this method, the fair value of an award at the grant date is amortized over the applicable vesting period and recognized as compensation expense. We adopted the fair value method of accounting prospectively for new awards granted after November 1, 2002. The fair value compensation expense recorded for the year ended October 31, 2007, in respect of these plans was $13 million (2006 – $13 million; 2005 – $14 million). The compensation expenses related to non-vested awards were $14 million at October 31,
2007 (2006 – $13 million; 2005 – $16 million), to be recognized over the weighted average period of 2.2 years (2006 – 2.0 years; 2005 – 1.7 years).
CICA 3870 permits the use of other recognition methods, includ-ing the intrinsic value method, provided pro forma disclosures of net income and earnings per share calculated in accordance with the fair value method are presented. For awards granted before November 1, 2002, pro forma net income and earnings per share are presented in the following table.
As reported Pro forma (1), (2)
2007 2006 2005 2005
Net income from continuing operations $ 5,492 $ 4,757 $ 3,437 $ 3,424 Net loss from discontinued operations (3) – (29) (50) (50)
Net income $ 5,492 $ 4,728 $ 3,387 $ 3,374
Basic earnings (loss) per share From continuing operations $ 4.24 $ 3.67 $ 2.65 $ 2.64 From discontinued operations – (.02) (.04) (.04)
Total $ 4.24 $ 3.65 $ 2.61 $ 2.60
Diluted earnings (loss) per share From continuing operations $ 4.19 $ 3.61 $ 2.61 $ 2.60 From discontinued operations – (.02) (.04) (.04)
Total $ 4.19 $ 3.59 $ 2.57 $ 2.56
(1) Compensation expense under the fair value method is recognized over the vesting period of the related stock options. Accordingly, the pro forma results of applying this method may not be indicative of future amounts.
(2) During the first quarter of 2006, all awards granted prior to adopting the fair value method of accounting were fully vested and their fair values at the grant dates had been fully amortized; therefore, there are no pro forma results to disclose for the year ended October 31, 2007 and 2006.
(3) Refer to Note 11.
OptionsoutstandingandoptionsexercisableasatOctober31,2007byrangeofexerciseprice Optionsoutstanding Optionsexercisable
Weighted Number Weighted average Number Weighted outstanding average remaining exercisable average (000s) exerciseprice contractuallife (000s) exerciseprice
$8.47 – $8.91 (1) 393 $ 8.76 2.0 393 $ 8.76$15.00 – $19.82 6,071 17.75 1.5 6,071 17.75$21.79 – $25.00 9,533 24.58 3.4 9,533 24.58 $26.10 – $31.70 7,062 30.42 5.6 5,501 30.09 $44.13 – $57.90 3,564 49.75 8.6 426 44.13
Total 26,623 $ 27.71 4.2 21,924 $ 24.17
(1) The weighted average exercise prices have been revised to reflect the conversion of foreign currency-denominated options at the exchange rate as at our Consolidated Balance Sheet date.
2002 and first quarter of 2003, certain executive participants volun-tarily renounced their SARs while retaining the corresponding options. SARs obligations are now fully vested and give rise to compensation expense as a result of changes in the market price of our common
shares. The compensation expense for these grants, which are accompanied by tandem SARs, was $19 million for the year ended October 31, 2007 (2006 – $27 million; 2005 – $42 million).

152 Royal Bank of Canada: Annual Report 2007Consolidated Financial Statements
The weighted average fair value of options granted during 2007 was estimated at $7.84 (2006 – $6.80; 2005 – $4.66) using an option pricing model on the date of grant. The following assumptions were used:
Employee savings and share ownership plansWe offer many employees an opportunity to own our shares through savings and share ownership plans. Under these plans, the employees can generally contribute between 1% and 10% of their annual salary or benefit base for commissioned employees. For each contribution between 1% and 6%, we will match 50% of the employee contributions in our common shares. For the RBC Dominion Securities Savings Plan our maximum annual contribution is $4,500 per employee. For the RBC U.K. Share Incentive Plan our maximum annual contribution is £1,500 per employee. In 2007, we contributed $64 million (2006 – $60 million; 2005 – $56 million), under the terms of these plans, towards the purchase of our common shares. As at October 31, 2007, an aggregate of 34.4 million common shares were held under these plans.
Deferred share and other plansWe offer deferred share unit plans to executives, non-employee directors and to certain key employees. Under these plans, the execu-tives or directors may choose to receive all or a percentage of their annual variable short-term incentive bonus or directors’ fee in the form of deferred share units (DSUs). The executives or directors must elect to participate in the plan prior to the beginning of the year. DSUs earn dividend equivalents in the form of additional DSUs at the same rate as dividends on common shares. The participant is not allowed to convert the DSUs until retirement, permanent disability or termination of employment/directorship. The cash value of the DSUs is equivalent to the market value of common shares when conversion takes place. The value of the DSUs liability as at October 31, 2007, was $285 million (2006 – $232 million; 2005 – $172 million). The share price fluctua-tions and dividend equivalents compensation expense recorded for the year ended October 31, 2007, in respect of these plans was $37 million (2006 – $45 million; 2005 – $42 million).
We have a deferred bonus plan for certain key employees within Capital Markets. Under this plan, a percentage of each employee’s annual incentive bonus is deferred and accumulates dividend equiva-lents at the same rate as dividends on common shares. The employee will receive the deferred bonus in equal amounts paid within 90 days of the three following year-end dates. The value of the deferred bonus paid will be equivalent to the original deferred bonus adjusted for dividends and changes in the market value of common shares at the time the bonus is paid. The value of the deferred bonus liability as at October 31, 2007, was $490 million (2006 – $401 million; 2005 – $320 million). The share price fluctuations and dividend equivalents compensation expense for the year ended October 31, 2007, in respect of this plan was $62 million (2006 – $51 million; 2005 – $57 million).
We offer performance deferred share award plans to certain key employees, all of which vest at the end of three years. Awards under the plans are deferred in the form of common shares which are held in trust until they fully vest or in the form of DSUs. A portion of the award under some plans can be increased or decreased up to 50%, depend-ing on our total shareholder return compared to a defined peer group of North American financial institutions. The value of the award paid will be equivalent to the original award adjusted for dividends and changes in the market value of common shares at the time the award vests. The number of our common shares held in trust as at October 31, 2007, was 2.3 million (2006 – 5.3 million; 2005 – 7.3 million). The value of the DSUs liability as at October 31, 2007 was $250 million (2006 – $153 million; 2005 – $38 million). The compensation expense recorded for the year ended October 31, 2007, in respect of these plans was $168 million (2006 – $148 million; 2005 – $109 million).
We maintain a non-qualified deferred compensation plan for key employees in the United States under an arrangement called the RBC U.S. Wealth Accumulation Plan. This plan allows eligible employ-ees to make deferrals of a portion of their annual income and allocate the deferrals among various fund choices, which include a share unit fund that tracks the value of our common shares. Certain deferrals may also be eligible for matching contributions, all of which are allo-cated to the RBC share unit fund. Our liability for the RBC share units held under the plan as at October 31, 2007, was $285 million (2006 – $289 million; 2005 – $236 million). The compensation expense recorded for the year ended October 31, 2007, was $157 million (2006 – $110 million; 2005 – $90 million).
For other stock-based plans, compensation expense of $9 million was recognized for the year ended October 31, 2007 (2006 – $10 million; 2005 – $8 million). The liability for the share units held under these plans as at October 31, 2007, was $21 million (2006 – $4 million; 2005 – $19 million). The number of our common shares held under these plans was .3 million (2006 – .3 million; 2005 – .3 million).
For the year ended October 31 2007 2006 2005
WeightedaverageassumptionsRisk-free interest rate 3.82% 3.98% 3.75%Expected dividend yield 3.06% 3.16% 3.25% Expected share price volatility 16% 17% 17%Expected life of option 6years 6 years 6 years
Note 21 Stock-based compensation (continued)

Royal Bank of Canada: Annual Report 2007Consolidated Financial Statements
153
The following table sets out the changes in our business realignment charges since November 1, 2004. These charges are recorded in Other liabilities and include the income-protection payments for the 2,015 employees who have been terminated as of October 31, 2007. Although the majority of the initiatives were substantially completed during 2006, the associated income-protection payments to
severed employees and certain lease obligations continue. Prior to 2007, the charges pertaining to RBC Mortgage were recorded in Liabilities of operations held for sale. These charges include the remaining lease obligations in connection with its former Chicago headquarters and 40 of its branches which we vacated but remain the lessee.
Businessrealignmentcharges 2007 2006 2005
Continuingoperations Balance at beginning of year $ 43 $ 118 $ 177 Employee-related charges – (3) 40 Premises-related charges – 3 – Other adjustments including foreign exchange – (1) (5) Cash payments (35) (74) (94)
Balance at end of year $ 8 $ 43 $ 118
Discontinuedoperations Balance at beginning of year $ 14 $ 13 $ 15 Employee-related charges – – 1 Premises-related charges (4) 6 12 Cash payments (3) (5) (15)
Balance at end of year $ 7 $ 14 $ 13
Employee-related $ 7Premises-related 8
Total $ 15
Note 23 Business realignment charges
Tradingrevenue 2007 2006 2005
Net interest income $ (390) $ (539) $ 21 Non-interest income 2,261 2,574 1,594
Total $ 1,871 $ 2,035 $ 1,615
By product line Interest rate and credit $ 693 $ 1,174 $ 1,025 Equities 823 561 355 Foreign exchange and commodities (1) 355 300 235
Total $ 1,871 $ 2,035 $ 1,615
(1) Includes precious metals.
Note 22 Trading revenue
Total trading revenue includes both trading-related Net interest income and trading revenue reported in Non-interest income. Net interest income arises from interest and dividends related to trading assets and liabilities and amortization of premiums and discounts
arising on their acquisition or issuance. Non-interest income includes realized and unrealized gains and losses on trading securities and trading derivative financial instruments.

154 Royal Bank of Canada: Annual Report 2007Consolidated Financial Statements
2007 2006 2005
IncometaxesinConsolidatedStatementsofIncome Continuing operations Current Canada – Federal $ 696 $ 506 $ 739 – Provincial 416 331 431 International 322 435 478
1,434 1,272 1,648
Future Canada – Federal 14 104 (206) – Provincial 3 31 (96) International (59) (4) (68)
(42) 131 (370)
Subtotal 1,392 1,403 1,278
Discontinued operations Current International – (20) (35)Future International – 2 3
Subtotal 1,392 1,385 1,246
Incometaxes(recoveries)inConsolidatedStatementsofComprehensiveIncomeand ChangesinShareholders’EquityContinuing operations Other comprehensive income (1) Net unrealized gains (losses) on available-for-sale securities (26) n.a. n.a. Reclassification of (gains) losses on available-for-sale securities to income 15 n.a. n.a. Net foreign currency translation gains (losses), net of hedging activities 911 130 204 Net unrealized gains (losses) on derivatives designated as cash flow hedges 43 n.a. n.a. Reclassification to income of (gains) losses on derivatives designated as cash flow hedges 16 n.a. n.a. Issuance costs (12) (4) 2 Stock appreciation rights 5 4 5 Wealth accumulation plan gains – – 7 Other (6) 6 2
Subtotal 946 136 220
Totalincometaxes $ 2,338 $ 1,521 $ 1,466
(1) Other comprehensive income was introduced under GAAP upon the adoption of Section 1530 on November 1, 2006 (refer to Note 1). Accordingly, there are no comparative figures for prior periods, other than the figures related to foreign currency translation gains (losses), which are now included as part of OCI.
n.a. not applicable
Sourcesoffutureincometaxes 2007 2006
Futureincometaxasset Allowance for credit losses $ 460 $ 439 Deferred compensation 642 616 Pension related 188 101 Business realignment charges 10 27 Tax loss carryforwards 91 68 Deferred income 115 151 Enron litigation provision 204 253 Other (1) 460 335
2,170 1,990
Valuation allowance (10) (10)
2,160 1,980
Futureincometaxliability Premises and equipment (245) (214) Deferred expense (138) (225) Other (1) (526) (437)
(909) (876)
Netfutureincometaxasset $ 1,251 $ 1,104
(1) Includes deferred taxes from the transition adjustment and other comprehensive income as a result of the adoption of the new financial instruments accounting standards on November 1, 2006.
Note 24 Income taxes

Royal Bank of Canada: Annual Report 2007Consolidated Financial Statements
155
Net future income tax assets are included in Other assets (refer to Note 12) and result from temporary differences between the tax basis of assets and liabilities and their carrying amounts on our Consolidated Balance Sheets. Included in the tax loss carryforwards amount is $91 million of future income tax assets related to losses in our Canadian, U.K. and U.S. operations (2006 – $31 million) which expire starting in 2008. There is no tax asset related to capital losses in 2007 (2006 – $27 million).
We believe that, based on all available evidence, it is more likely than not that all of the future income tax assets, net of the valuation allowance, will be realized through a combination of future reversals of temporary differences and taxable income.
International earnings of certain subsidiaries would be taxed only upon their repatriation to Canada. We have not recognized a future income tax liability for these undistributed earnings as we do not currently expect them to be repatriated. Taxes that would be payable
if all foreign subsidiaries’ accumulated unremitted earnings were repatriated are estimated at $843 million as at October 31, 2007 (2006 – $822 million; 2005 – $745 million).
Reconciliationtostatutorytaxrate 2007 2006 2005
Income taxes at Canadian statutory tax rate $ 2,431 34.6% $ 2,152 34.7% $ 1,632 34.7%(Decrease) increase in income taxes resulting from Lower average tax rate applicable to subsidiaries (734) (10.4) (599) (9.6) (251) (5.3) Tax-exempt income from securities (272) (3.9) (184) (3.0) (85) (1.8) Tax rate change 30 .4 13 .2 – – Other (63) (.9) 21 .3 (18) (.4)
Income taxes reported in Consolidated Statements of Income before discontinued operations and effective tax rate $ 1,392 19.8% $ 1,403 22.6% $ 1,278 27.2%
2007 2006 2005
Basicearningspershare Net income from continuing operations $ 5,492 $ 4,757 $ 3,437 Net loss from discontinued operations (1) – (29) (50)
Net income 5,492 4,728 3,387
Preferred share dividends (88) (60) (42) Net gain on redemption of preferred shares – – 4
Net income available to common shareholders $ 5,404 $ 4,668 $ 3,349
Average number of common shares (in thousands) 1,273,185 1,279,956 1,283,433 Basic earnings (loss) per share Continuing operations $ 4.24 $ 3.67 $ 2.65 Discontinued operations – (.02) (.04)
Total $ 4.24 $ 3.65 $ 2.61
Dilutedearningspershare Net income available to common shareholders $ 5,404 $ 4,668 $ 3,349
Average number of common shares (in thousands) 1,273,185 1,279,956 1,283,433 Stock options (2) 13,254 14,573 13,686 Issuable under other stock-based compensation plans 2,875 5,256 7,561
Average number of diluted common shares (in thousands) 1,289,314 1,299,785 1,304,680 Diluted earnings (loss) per share Continuing operations $ 4.19 $ 3.61 $ 2.61 Discontinued operations – (.02) (.04)
Total $ 4.19 $ 3.59 $ 2.57
(1) Refer to Note 11. (2) The dilutive effect of stock options was calculated using the treasury stock method. For 2007, we excluded from the calculation of diluted earnings per share 16,224 average options out-
standing with an exercise price of $57.90 as the exercise price of these options was greater than the average market price of our common shares. During 2006 and 2005, no option was outstanding with an exercise price exceeding the average market price of our common shares.
Note 25 Earnings per share
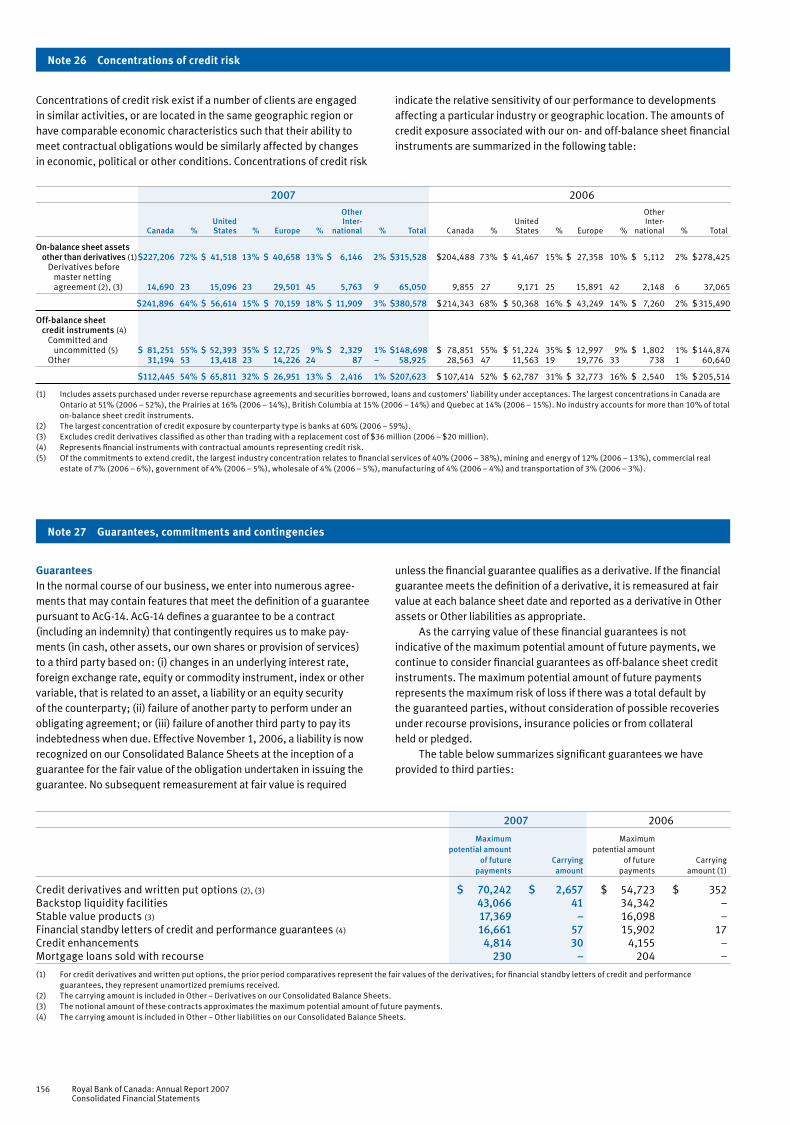
156 Royal Bank of Canada: Annual Report 2007Consolidated Financial Statements
GuaranteesIn the normal course of our business, we enter into numerous agree-ments that may contain features that meet the definition of a guarantee pursuant to AcG-14. AcG-14 defines a guarantee to be a contract (including an indemnity) that contingently requires us to make pay-ments (in cash, other assets, our own shares or provision of services) to a third party based on: (i) changes in an underlying interest rate, foreign exchange rate, equity or commodity instrument, index or other variable, that is related to an asset, a liability or an equity security of the counterparty; (ii) failure of another party to perform under an obligating agreement; or (iii) failure of another third party to pay its indebtedness when due. Effective November 1, 2006, a liability is now recognized on our Consolidated Balance Sheets at the inception of a guarantee for the fair value of the obligation undertaken in issuing the guarantee. No subsequent remeasurement at fair value is required
unless the financial guarantee qualifies as a derivative. If the financial guarantee meets the definition of a derivative, it is remeasured at fair value at each balance sheet date and reported as a derivative in Other assets or Other liabilities as appropriate.
As the carrying value of these financial guarantees is not indicative of the maximum potential amount of future payments, we continue to consider financial guarantees as off-balance sheet credit instruments. The maximum potential amount of future payments represents the maximum risk of loss if there was a total default by the guaranteed parties, without consideration of possible recoveries under recourse provisions, insurance policies or from collateral held or pledged.
The table below summarizes significant guarantees we have provided to third parties:
Concentrations of credit risk exist if a number of clients are engaged in similar activities, or are located in the same geographic region or have comparable economic characteristics such that their ability to meet contractual obligations would be similarly affected by changes in economic, political or other conditions. Concentrations of credit risk
indicate the relative sensitivity of our performance to developments affecting a particular industry or geographic location. The amounts of credit exposure associated with our on- and off-balance sheet financial instruments are summarized in the following table:
2007 2006 Other Other United Inter- United Inter- Canada % States % Europe % national % Total Canada % States % Europe % national % Total
On-balancesheetassets otherthanderivatives (1) $227,206 72% $ 41,518 13% $ 40,658 13% $ 6,146 2% $315,528 $ 204,488 73% $ 41,467 15% $ 27,358 10% $ 5,112 2% $ 278,425 Derivatives before master netting agreement (2), (3) 14,690 23 15,096 23 29,501 45 5,763 9 65,050 9,855 27 9,171 25 15,891 42 2,148 6 37,065
$241,896 64% $ 56,614 15% $ 70,159 18% $ 11,909 3% $ 380,578 $ 214,343 68% $ 50,368 16% $ 43,249 14% $ 7,260 2% $ 315,490
Off-balancesheet creditinstruments (4) Committed and uncommitted (5) $ 81,251 55% $ 52,393 35% $ 12,725 9% $ 2,329 1% $148,698 $ 78,851 55% $ 51,224 35% $ 12,997 9% $ 1,802 1% $ 144,874 Other 31,194 53 13,418 23 14,226 24 87 – 58,925 28,563 47 11,563 19 19,776 33 738 1 60,640
$112,445 54% $ 65,811 32% $ 26,951 13% $ 2,416 1% $207,623 $ 107,414 52% $ 62,787 31% $ 32,773 16% $ 2,540 1% $ 205,514
(1) Includes assets purchased under reverse repurchase agreements and securities borrowed, loans and customers’ liability under acceptances. The largest concentrations in Canada are Ontario at 51% (2006 – 52%), the Prairies at 16% (2006 – 14%), British Columbia at 15% (2006 – 14%) and Quebec at 14% (2006 – 15%). No industry accounts for more than 10% of total on-balance sheet credit instruments.
(2) The largest concentration of credit exposure by counterparty type is banks at 60% (2006 – 59%).(3) Excludes credit derivatives classified as other than trading with a replacement cost of $36 million (2006 – $20 million).(4) Represents financial instruments with contractual amounts representing credit risk.(5) Of the commitments to extend credit, the largest industry concentration relates to financial services of 40% (2006 – 38%), mining and energy of 12% (2006 – 13%), commercial real
estate of 7% (2006 – 6%), government of 4% (2006 – 5%), wholesale of 4% (2006 – 5%), manufacturing of 4% (2006 – 4%) and transportation of 3% (2006 – 3%).
Note 26 Concentrations of credit risk
Note 27 Guarantees, commitments and contingencies
2007 2006
Maximum Maximum potentialamount potential amount offuture Carrying of future Carrying payments amount payments amount (1)
Credit derivatives and written put options (2), (3) $ 70,242 $ 2,657 $ 54,723 $ 352 Backstop liquidity facilities 43,066 41 34,342 – Stable value products (3) 17,369 – 16,098 – Financial standby letters of credit and performance guarantees (4) 16,661 57 15,902 17 Credit enhancements 4,814 30 4,155 – Mortgage loans sold with recourse 230 – 204 –
(1) For credit derivatives and written put options, the prior period comparatives represent the fair values of the derivatives; for financial standby letters of credit and performance guarantees, they represent unamortized premiums received.
(2) The carrying amount is included in Other – Derivatives on our Consolidated Balance Sheets. (3) The notional amount of these contracts approximates the maximum potential amount of future payments.(4) The carrying amount is included in Other – Other liabilities on our Consolidated Balance Sheets.

Royal Bank of Canada: Annual Report 2007Consolidated Financial Statements
157
In addition to the above guarantees, we transact substantially all of our securities lending activities in which we act as an agent for the owners of securities through our joint venture, RBC Dexia IS. As at October 31, 2007, RBC Dexia IS securities lending indemnifications totalled $63,462 million (2006 – $45,614 million); we are exposed to 50% of this amount.
CreditderivativesandwrittenputoptionsOur clients may enter into credit derivatives or written put options for speculative or hedging purposes. AcG-14 defines a guarantee to include derivative contracts that contingently require us to make pay-ments to a guaranteed party based on changes in an underlying that is related to an asset, a liability or an equity security of a guaranteed party. We have only disclosed amounts for transactions where it would be probable, based on the information available to us, that the client would use the credit derivative or written put option to protect against changes in an underlying that is related to an asset, a liability or an equity security held by the client.
We enter into written credit derivatives that are over-the-counter contractual agreements to compensate another party for its financial loss following the occurrence of a credit event in relation to a specified reference obligation, such as a bond or loan. The terms of these credit derivatives vary based on the contract and can range up to 15 years.
We enter into written put options that are contractual agreements under which we grant the purchaser the right, but not the obligation to sell, by or at a set date, a specified amount of a financial instrument at a predetermined price. Written put options that typically qualify as guarantees include foreign exchange contracts, equity-based contracts and certain commodity-based contracts. The term of these options varies based on the contract and can range up to five years.
Collateral we hold for credit derivatives and written put options is managed on a portfolio basis and may include cash, government T-bills and bonds.
BackstopliquidityfacilitiesBackstop liquidity facilities are provided to asset-backed commercial paper conduit programs (programs) administered by us and third parties, as an alternative source of financing in the event that such programs are unable to access commercial paper markets, or in lim-ited circumstances, when predetermined performance measures of the financial assets owned by these programs are not met. We gener-ally provide liquidity facilities for a term of one year.
Backstop liquidity facilities are also provided to non-asset-backed programs such as variable rate demand notes issued by third parties. These standby facilities provide liquidity support to the issuer to buy the notes if the issuer is unable to remarket the notes, as long as the instrument and/or the issuer maintains the investment grade rating.
The terms of the backstop liquidity facilities do not require us to advance money to these programs in the event of bankruptcy or to purchase non-performing or defaulted assets. None of the backstop liquidity facilities that we have provided have been drawn upon.
StablevalueproductsWe sell stable value products that offer book value protection primarily to plan sponsors of EmployeeRetirementIncomeSecurityActof1974 (ERISA)-governed pension plans such as 401(k) plans and 457 plans. The book value protection is provided on portfolios of intermediate/short-term investment-grade fixed income securities and is intended to cover any shortfall in the event that plan partici-pants withdraw funds when market value is below book value. We retain the option to exit the contract at any time. For stable value products, collateral we hold is managed on a portfolio basis and may include cash, government T-bills and bonds.
FinancialstandbylettersofcreditandperformanceguaranteesFinancial standby letters of credit and performance guarantees repre-sent irrevocable assurances that we will make payments in the event that a client cannot meet its obligations to third parties. The term of
these guarantees can range up to eight years. Our policy for requiring collateral security with respect to these instruments and the types of collateral security held is generally the same as for loans. When collateral security is taken, it is determined on an account by account basis according to the risk of the borrower and the specifics of the transaction. Collateral security may include cash, securities and other assets pledged.
CreditenhancementsWe provide partial credit enhancement to multi-seller programs administered by us to protect commercial paper investors in the event that the collection on the underlying assets, the transaction specific credit enhancement or the liquidity proves to be insufficient to pay for maturing commercial paper. Each of the asset pools is structured to achieve a high investment-grade credit profile through credit enhancement related to each transaction. The term of these credit facilities is between one and four years.
MortgageloanssoldwithrecourseThrough our various agreements with investors, we may be required to repurchase U.S. originated mortgage loans sold to an investor if the loans are uninsured for greater than one year, or refund any premium received where mortgage loans are prepaid or in default within 120 days. The mortgage loans are fully collateralized by resi-dential properties.
SecuritieslendingindemnificationsWe generally transact securities lending transactions through our joint venture, RBC Dexia IS. In these transactions, RBC Dexia IS acts as an agent for the owner of a security, who agrees to lend the security to a borrower for a fee, under the terms of a pre-arranged contract. The borrower must fully collateralize the security loaned at all times. As part of this custodial business, an indemnification may be provided to securities lending customers to ensure that the fair value of securities loaned will be returned in the event that the borrower fails to return the borrowed securities and the collateral held is insufficient to cover the fair value of those securities. These indemnifications normally terminate without being drawn upon. The term of these indemnifications varies, as the securities loaned are recallable on demand. Collateral held for our securities lending transactions typically includes cash or securities that are issued or guaranteed by the Canadian government, U.S. government or other OECD countries.
IndemnificationsIn the normal course of our operations, we provide indemnifications which are often standard contractual terms to counterparties in trans-actions such as purchase and sale contracts, service agreements, director/officer contracts and leasing transactions. These indemnifi-cation agreements may require us to compensate the counterparties for costs incurred as a result of changes in laws and regulations (including tax legislation) or as a result of litigation claims or statutory sanctions that may be suffered by the counterparty as a consequence of the transaction. The terms of these indemnification agreements will vary based on the contract. The nature of the indem-nification agreements prevents us from making a reasonable estimate of the maximum potential amount we could be required to pay to counterparties. Historically, we have not made any significant pay-ments under such indemnifications.
Other off-balance sheet credit instrumentsIn addition to financial guarantees, we utilize other off-balance sheet credit instruments to meet the financing needs of our clients. The con-tractual amounts of these credit instruments represent the maximum possible credit risk without taking into account the fair value of any collateral, in the event other parties fail to perform their obligations under these instruments. Our credit review process, our policy for requiring collateral security and the types of collateral security held

158 Royal Bank of Canada: Annual Report 2007Consolidated Financial Statements
Otheroff-balancesheetcreditinstruments 2007 2006
Commitments to extend credit (1) Original term to maturity of 1 year or less $ 55,281 $ 57,154 Original term to maturity of more than 1 year 46,307 42,222 Securities lending 36,187 38,185 Uncommitted amounts (2) 47,110 45,498 Documentary and commercial letters of credit 501 713 Note issuances and revolving underwriting facilities – 8
$ 185,386 $ 183,780
(1) Includes liquidity facilities.(2) Includes uncommitted liquidity loan facilities of $42.2 billion (2006 – $34.6 billion) provided to RBC-administered multi-seller conduits. As at October 31, 2007, $758 million (2006 – $nil)
was drawn upon on these facilities and is included in Loans.
Pledged assetsIn the ordinary course of business, we pledge assets recorded on our Consolidated Balance Sheets. Details of assets pledged against liabilities are shown in the following tables:
The following table summarizes the contractual amounts of our other off-balance sheet credit instruments:
2007 2006
Assets pledged to: Foreign governments and central banks $ 1,981 $ 1,794 Clearing systems, payment systems and depositories 1,772 2,309 Assets pledged in relation to: Securities borrowing and lending 34,881 38,118 Obligations related to securities sold under repurchase agreements 48,479 44,651 Derivative transactions 8,502 6,547 Other 3,391 3,113
$ 99,006 $ 96,532
Pledgedassets 2007 2006
Cash and due from banks $ 305 $ 100 Interest-bearing deposits with banks 3,443 1,936 Loans 1,733 187 Securities 51,695 56,580 Assets purchased under reverse repurchase agreements 40,698 36,788 Other assets 1,132 941
$ 99,006 $ 96,532
Note 27 Guarantees, commitments and contingencies (continued)
are generally the same as for loans. Many of these instruments expire without being drawn upon. As a result, the contractual amounts may not necessarily represent our actual future credit risk exposure or cash flow requirements.
Commitments to extend credit represent unused portions of authorizations to extend credit in the form of loans, bankers’ accep-tances or letters of credit.
In securities lending transactions, we lend our own or our clients’ securities to a borrower for a fee under the terms of a pre-arranged contract. The borrower must fully collateralize the security loaned at all times.
Uncommitted amounts represent an amount for which we retain the option to extend credit to a borrower.
Documentary and commercial letters of credit, which are written undertakings by us on behalf of a client authorizing a third party to draw drafts on us up to a stipulated amount under specific terms and conditions, are collateralized by the underlying shipment of goods to which they relate.
A note issuance facility represents an underwriting agreement that enables a borrower to issue short-term debt securities. A revolv-ing underwriting facility represents a renewable note issuance facility that can be accessed for a specified period of time.

Royal Bank of Canada: Annual Report 2007Consolidated Financial Statements
159
Lease commitmentsMinimum future rental commitments for premises and equipment under long-term non-cancellable operating and capital leases for the next five years and thereafter are as follows:
CollateralAs at October 31, 2007, the approximate market value of collateral accepted that may be sold or repledged by us was $122.4 billion (2006 – $109.1 billion). This collateral was received in connection with reverse repurchase agreements, securities borrowings and loans, and derivative transactions. Of this amount, $56.5 billion (2006 – $48.0 billion) has been sold or repledged, generally as collateral under repurchase agreements or to cover short sales.
Leasecommitments (1)
2008 $ 4942009 453 2010 382 2011 329 2012 279Thereafter 1,224
$ 3,161
(1) Substantially all of our lease commitments are related to operating leases.
LitigationEnronCorp.(Enron)litigationA purported class of purchasers of Enron who publicly traded equity and debt securities between January 9, 1999, and November 27, 2001, has named Royal Bank of Canada and certain related entities as defen-dants in an action entitled RegentsoftheUniversityofCalifornia v. RoyalBankofCanada in the United States District Court, Southern
The following table details our exposure to interest rate risk as defined and prescribed by CICA Handbook Section 3861, FinancialInstruments–DisclosureandPresentation. On- and off-balance sheet financial instruments are reported based on the earlier of their con-tractual repricing date or maturity date. Effective interest rates have been disclosed where applicable. The effective rates shown represent historical rates for fixed-rate instruments carried at amortized cost and current market rates for floating-rate instruments or instruments carried at fair value. The following table does not incorporate
management’s expectation of future events where expected repricing or maturity dates differ significantly from the contractual dates. We incorporate these assumptions in the management of interest rate risk exposure. These assumptions include expected repricing of trad-ing instruments and certain loans and deposits. Taking into account these assumptions on the consolidated contractual repricing and maturity schedule at October 31, 2007, would result in a change in the under-one-year gap from $(74.4) billion to $(53.3) billion (2006 – $(79.8) billion to $(40.2) billion).
Note 28 Contractual repricing and maturity schedule
District of Texas (Houston Division). In addition, Royal Bank of Canada and certain related entities have been named as defendants in several other Enron-related cases, which are filed in various courts in the U.S., asserting similar claims filed by purchasers of Enron securities. Royal Bank of Canada is also a third-party defendant in cases in which Enron’s accountants, Arthur Andersen LLP, filed third-party claims against a number of parties, seeking contribution if Arthur Andersen LLP is found liable to plaintiffs in these actions.
We review the status of these matters on an ongoing basis and will exercise our judgment in resolving them in such a manner as we believe to be in our best interests. As with any litigation, there are significant uncertainties surrounding the timing and outcome. Uncertainty is exacerbated as a result of the large number of cases, the multiple defendants in many of them, the novel issues presented, and the current difficult litigation environment. Although it is not pos-sible to predict the ultimate outcome of these lawsuits, the timing of their resolution or our exposure, during the fourth quarter of 2005, we established a litigation provision of $591 million (US$500 million) or $326 million after-tax (US$276 million). We believe the ultimate resolution of these lawsuits and other proceedings, while not likely to have a material adverse effect on our consolidated financial position, may be material to our operating results for the particular period in which the resolution occurs, notwithstanding the provision established in the fourth quarter of 2005. We will continue to vigorously defend our-selves in these cases.
OtherVarious other legal proceedings are pending that challenge certain of our practices or actions. We consider that the aggregate liability result-ing from these other proceedings will not be material to our financial position or results of operations.

160 Royal Bank of Canada: Annual Report 2007Consolidated Financial Statements
Carrying amount by earlier of contractual repricing or maturity date Immediately interest Under 3 3 to 6 Over 6 to Over 1 to Over 5 Non-rate- rate-sensitive months months 12 months 5 years years sensitive Total
Assets Cash and deposits with banks $ – $ 14,317 $ – $ – $ – $ – $ 1,790 $ 16,107 Effective interest rate – 4.71% – – – – – Securities Trading – 27,559 4,856 5,208 22,790 26,149 61,684 148,246 Effective interest rate – 4.66% 4.74% 4.63% 4.71% 4.97% – Available-for-sale – 8,263 1,958 2,096 12,240 2,326 3,126 30,009 Effective interest rate – 4.68% 4.84% 4.77% 4.78% 4.92% – Assets purchased under reverse repurchase agreements and securities borrowed – 62,393 1,920 – – – – 64,313 Effective interest rate – 4.81% 4.67% – – – – Loans (net of allowance for loan losses) (1) 101,692 25,664 8,079 14,071 80,795 7,418 217 237,936 Effective interest rate – 5.46% 5.54% 5.31% 5.38% 6.04% – Derivatives 28,591 2,480 – – 6 – 35,508 66,585 Effective interest rate – 4.79% – – 4.62% – – Other assets – – – – – – 37,150 37,150
$$ 130,283 $ 140,676 $ 16,813 $ 21,375 $ 115,831 $ 35,893 $ 139,475 $ 600,346
Liabilities Deposits $$ 148,072 $ 112,388 $ 23,461 $ 24,779 $ 49,219 $ 5,915 $ 1,371 $ 365,205 Effective interest rate – 4.45% 4.42% 4.36% 4.18% 4.81% – Obligations related to assets sold under repurchase agreements and securities loaned – 34,748 1,838 396 – – 51 37,033 Effective interest rate – 4.77% 4.76% 4.79% – – – Obligations related to securities sold short – 1,402 316 596 10,892 11,097 20,386 44,689 Effective interest rate – 4.72% 4.71% 4.59% 4.54% 4.87% – Derivatives 29,346 4,404 – – 4 13 38,243 72,010 Effective interest rate – 4.80% – – 4.60% 4.96% – Other liabilities – 250 106 273 649 214 46,060 47,552 Effective interest rate – 4.82% 4.85% 4.64% 4.65% 5.10% – Subordinated debentures – 886 – – 3,892 1,465 (8) 6,235 Effective interest rate – 5.64% – – 5.01% 6.40% – Trust capital securities – – – – 1,400 – – 1,400 Effective interest rate – – – – 7.23% – – Preferred share liabilities – – – 300 – – – 300 Effective interest rate – – – 4.72% – – – Non-controlling interest in subsidiaries – – – – 1,200 – 283 1,483 Effective interest rate – – – – 4.87% – – Shareholders’ equity – – – – – 2,050 22,389 24,439 Effective interest rate – – – – – 4.14% –
$$ 177,418 $ 154,078 $ 25,721 $ 26,344 $ 67,256 $ 20,754 $ 128,775 $ 600,346
Totalgapbasedoncontractualrepricing $$ (47,135) $ (13,402) $ (8,908) $ (4,969) $ 48,575 $ 15,139 $ 10,700 $ –
Canadian dollar (23,067) 9,417 11,450 (6,183) 22,680 (6,296) (8,000) 1 Foreign currency (24,068) (22,819) (20,358) 1,214 25,895 21,435 18,700 (1)
Totalgap $$ (47,135) $ (13,402) $ (8,908) $ (4,969) $ 48,575 $ 15,139 $ 10,700 $ –
Canadian dollar – 2006 $ (26,367) $ (24,559) $ 5,204 $ (1,764) $ 52,937 $ 11,628 $ (17,083) $ (4)Foreign currency – 2006 (18,902) 8,856 (19,898) (2,372) 14,282 21,917 (3,879) 4
Total gap – 2006 $$ (45,269) $ (15,703) $ (14,694) $ (4,136) $ 67,219 $ 33,545 $ (20,962) $ –
(1) Includes loans totalling $1,202 million to a variable interest entity administered by us, with maturity terms exceeding five years.
In the ordinary course of business, we provide normal banking services and operational services, and enter into other transactions with associ-ated and other related corporations, including our joint venture entities, on terms similar to those offered to non-related parties. Refer to Note 9 for more information regarding our joint venture, RBC Dexia IS.
We grant loans to directors, officers and other employees at rates normally accorded to preferred clients. As at October 31, 2007, the aggregate indebtedness, excluding routine indebtedness, to RBC or its subsidiaries of current directors and executive officers was approximately $3.2 million. Routine indebtedness includes (i) loans made on terms no more favourable than loans to employees generally,
but not exceeding $50,000 to any director or executive officer; (ii) loans to employees, fully secured against their residence and not exceeding their annual salary; (iii) loans, other than to employees, on substantially the same terms available to other customers with comparable credit ratings and involving no more than the usual risk of collectibility; and (iv) loans for purchases on usual trade terms, or for ordinary travel or expense advances, with usual commercial repayment arrangements. We also offer deferred share and other plans to non-employee directors, executives and certain other key employees. Refer to Note 21.
Note29Relatedpartytransactions
Note28Contractualrepricingandmaturityschedule(continued)

Royal Bank of Canada: Annual Report 2007Consolidated Financial Statements
161
U.S.& Canadian Wealth International Capital Corporate Other2007 Banking Management Banking Markets(1) Support(1) Total Canada UnitedStates International
Net interest income $ 6,353 $ 427 $ 1,031 $ 453 $ (732) $ 7,532 $ 6,435 $ 412 $ 685 Non-interest income 6,168 3,565 884 3,936 377 14,930 8,605 4,322 2,003
Total revenue 12,521 3,992 1,915 4,389 (355) 22,462 15,040 4,734 2,688 Provision for (recovery of) credit losses 788 1 109 (22) (85) 791 696 90 5 Insurance policyholder benefits, claims and acquisition expense 2,173 – – – – 2,173 1,230 474 469 Non-interest expense 5,285 2,902 1,481 2,769 36 12,473 7,409 3,405 1,659
Net income (loss) before income taxes 4,275 1,089 325 1,642 (306) 7,025 5,705 765 555 Income taxes 1,288 327 74 278 (575) 1,392 1,705 (62) (251) Non-controlling interest – – 9 72 60 141 83 49 9
Netincome $ 2,987 $ 762 $ 242 $ 1,292 $ 209 $ 5,492 $ 3,917 $ 778 $ 797 Less: Preferred dividends 34 9 14 20 11 88 56 24 8
Net income (loss) available to common shareholders $ 2,953 $ 753 $ 228 $ 1,272 $ 198 $ 5,404 $ 3,861 $ 754 $ 789
Average assets(2) $ 220,000 $ 16,600 $ 39,700 $ 311,200 $ (6,500) $ 581,000 $ 317,900 $ 135,100 $ 128,000
Totalaverageassets $ 220,000 $ 16,600 $ 39,700 $ 311,200 $ (6,500) $ 581,000 $ 317,900 $ 135,100 $ 128,000
U.S. & Canadian Wealth International Capital Corporate Other 2006 Banking Management Banking Markets (1) Support (1) Total Canada United States International
Net interest income $ 5,816 $ 397 $ 940 $ 131 $ (488) $ 6,796 $ 6,045 $ 108 $ 643 Non-interest income 5,880 3,090 688 4,005 178 13,841 7,518 4,397 1.926
Total revenue 11,696 3,487 1,628 4,136 (310) 20,637 13,563 4,505 2,569 Provision for (recovery of) credit losses 604 1 25 (115) (86) 429 456 (28) 1 Insurance policyholder benefits, claims and acquisition expense 2,509 – – – – 2,509 1,379 683 447 Non-interest expense 5,027 2,613 1,216 2,603 36 11,495 7,056 3,038 1,401 Business realignment charges – 1 – (1) – – – – –
Net income (loss) before income taxes 3,556 872 387 1,649 (260) 6,204 4,672 812 720 Income taxes 1,130 268 117 317 (429) 1,403 1,458 14 (69) Non-controlling interest – – 9 (23) 58 44 37 (1) 8
Net income (loss) from continuing operations $ 2,426 $ 604 $ 261 $ 1,355 $ 111 $ 4,757 $ 3,177 $ 799 $ 781Net loss from discontinued operations – – (29) – – (29) – (29) –
Netincome 2,426 604 232 1,355 111 4,728 3,177 770 781 Less: Preferred dividends 24 6 7 13 10 60 40 15 5
Net income (loss) available to common shareholders $ 2,402 $ 598 $ 225 $ 1,342 $ 101 $ 4,668 $ 3,137 $ 755 $ 776
Average assets from continuing operations(2) $ 199,200 $ 15,100 $ 32,600 $ 260,600 $ (5,400) $ 502,100 $ 287,200 $ 113,300 $ 101,600Average assets from discontinued operations(2) – – 200 – – 200 – 200 –
Totalaverageassets $ 199,200 $ 15,100 $ 32,800 $ 260,600 $ (5,400) $ 502,300 $ 287,200 $ 113,500 $ 101,600
U.S. & Canadian Wealth International Capital Corporate Other 2005 Banking Management Banking Markets (1) Support (1) Total Canada United States International
Net interest income $ 5,233 $ 374 $ 923 $ 557 $ (294) $ 6,793 $ 5,628 $ 608 $ 557Non-interest income 5,765 2,777 654 3,005 190 12,391 6,878 3,955 1,558
Total revenue 10,998 3,151 1,577 3,562 (104) 19,184 12,506 4,563 2,115 Provision for (recovery of) credit losses 542 2 49 (91) (47) 455 433 23 (1) Insurance policyholder benefits, claims and acquisition expense 2,625 – – – – 2,625 1,270 809 546 Non-interest expense 4,830 2,440 1,136 2,890 61 11,357 6,685 3,595 1,077 Business realignment charges 7 1 (3) 1 39 45 45 – –
Net income (loss) before income taxes 2,994 708 395 762 (157) 4,702 4,073 136 493 Income taxes 987 206 133 95 (143) 1,278 1,329 (76) 25 Non-controlling interest – – 6 (19) – (13) (30) 12 5
Net income (loss) from continuing operations 2,007 502 256 686 (14) 3,437 2,774 200 463Net loss from discontinued operations – – (50) – – (50) – (50) –
Netincome(loss) $ 2,007 $ 502 $ 206 $ 686 $ (14) $ 3,387 $ 2,774 $ 150 $ 463 Less: Preferred dividends 15 4 5 8 6 38 25 10 3
Net income (loss) available to common shareholders $ 1,992 $ 498 $ 201 $ 678 $ (20) $ 3,349 $ 2,749 $ 140 $ 460
Average assets from continuing operations (2) $ 181,100 $ 13,200 $ 25,900 $ 229,100 $ (4,000) $ 445,300 $ 263,200 $ 92,400 $ 89,700Average assets from discontinued operations (2) – – 1,800 – – 1,800 – 1,800 –
Totalaverageassets $ 181,100 $ 13,200 $ 27,700 $ 229,100 $ (4,000) $ 447,100 $ 263,200 $ 94,200 $ 89,700
(1) Taxable equivalent basis. (2) Calculated using methods intended to approximate the average of the daily balances for the period.
Note 30 Results by business and geographic segment

162 Royal Bank of Canada: Annual Report 2007Consolidated Financial Statements
Changes in 2007 CompositionofbusinesssegmentsEffective February 7, 2007, our previous three business segments (RBC Canadian Personal and Business, RBC U.S. and International Personal and Business, and RBC Capital Markets) were reorganized into the following four business segments:
Canadian Banking comprises our domestic, personal and busi-ness banking operations, certain retail investment businesses and our global insurance operations.
Wealth Management comprises businesses that directly serve the growing wealth management needs of affluent and high net worth clients in Canada, the U.S. and outside North America, and businesses that provide asset management and trust products through RBC and external partners.
U.S. & International Banking comprises our banking businesses outside Canada, including our banking operations in the U.S. and the Caribbean. In addition, this segment includes our 50% ownership in RBC Dexia IS.
Capital Markets comprises our global wholesale banking business segment, which provides a wide range of corporate and investment banking, sales and trading, research and related products and services to corporate, public sector and institutional clients in North America, and specialized products and services in select global markets.
The comparative results have been revised to conform to our new basis of segment presentation.
All other enterprise level activities that are not allocated to these four business segments, such as enterprise funding securitization, net funding associated with unattributed capital, and consolidation adjust-ments, including the elimination of the taxable equivalent basis (teb) gross-up amounts, are included in Corporate Support. Teb adjustments gross up Net interest income from certain tax-advantaged sources (Canadian taxable corporate dividends) to their effective tax equiva-lent value with the corresponding offset recorded in the provision for income taxes. Management believes that these adjustments are neces-sary for Capital Markets to reflect how it is managed. The use of the teb adjustments enhances the comparability of revenue across our taxable and tax-advantaged sources. The use of teb adjustments and measures may not be comparable to similar GAAP measures or similarly adjusted amounts at other financial institutions. The teb adjustment for 2007 was $332 million (2006 – $213 million, 2005 – $109 million).
During 2007, we also reclassified the following balances in report-ing our business segments: (i) certain amounts reported in Capital Markets from Interest income to Interest expense with no impact on Net interest income; (ii) certain amounts related to interest settlements on swaps in fair value hedge relationships from Non-interest income to Net interest income which had no impact on the prior years’ results; (iii) certain deposits in Capital Markets and U.S. & International Banking related to RBC Dexia IS in accordance with the business realignment that occurred in the second quarter of 2007; (iv) expenses related to internally developed software from Non-interest expense – Other to the more specific Non-interest expense lines. Only Corporate Support was impacted by this reclassification and there was no impact on total
Non-interest expense; and (v) certain amounts related to trustee services within Canadian Banking have been reclassified from Non-interest income – Investment management and custodial fees to Net interest income to reflect their nature. All comparative amounts have been revised to reflect these reclassifications.
VisarestructuringIn connection with the restructuring of Visa Inc., which was completed on October 3, 2007, RBC’s membership interest in Visa Canada Association was exchanged for shares of Visa Inc., resulting in a gain of $326 million ($269 million net of taxes). The gain, which is based on an independent valuation of RBC’s shares in Visa Inc., is included in Canadian Banking’s Total revenue and recorded in Non-interest income – Other in our Consolidated Statement of Income. The shares of Visa Inc. are classified as Available-for-sale securities. Refer to Note 3.
Management reporting frameworkOur management reporting framework is intended to measure the per-formance of each business segment as if it was a stand-alone business and reflect the way that business segment is managed. This approach ensures our business segments’ results reflect all relevant revenue and expenses associated with the conduct of their business and depicts how management views those results. These items do not impact our consolidated results.
The expenses in each business segment may include costs or services directly incurred or provided on their behalf at the enterprise level. For other costs not directly attributable to one of our business segments, we use a management reporting framework that uses assumptions, estimates and methodologies for allocating overhead costs and indirect expenses to our business segments and that assists in the attribution of capital and the transfer pricing of funds to our business segments in a manner that fairly and consistently measures and aligns the economic costs with the underlying benefits and risks of that specific business segment. Activities and business conducted between our business segments are generally at market rates. All other enterprise level activities that are not allocated to our four business segments are reported under Corporate Support.
Our assumptions and methodologies used in our management reporting framework are periodically reviewed by management to ensure they remain valid. The capital attribution methodologies involve a number of assumptions and estimates that are revised periodically.
Geographic segmentsFor geographic reporting, our segments are grouped into Canada, United States and Other International. Transactions are primarily recorded in the location that best reflects the risk due to negative changes in economic conditions, and prospects for growth due to posi-tive economic changes. This location frequently corresponds with the location of the legal entity through which the business is conducted and the location of our clients. Transactions are recorded in the local currency and are subject to foreign exchange rate fluctuations with respect to the movement in the Canadian dollar.
Revenuebybusinessline 2007 2006 2005
Banking(1) $ 10,485 $ 9,418 $ 8,761Wealth management 3,992 3,487 3,151Global insurance 3,192 3,348 3,311Global markets (2) 2,455 2,579 2,256Global investment banking and equity markets (2), (3) 1,675 1,382 1,098RBC Dexia IS (4) 759 558 500Other (5) (96) (135) 104
Total $ 22,462 $ 20,637 $ 19,184
(1) Includes cards and payment solutions.(2) Taxable equivalent basis.(3) Includes our National Clients business, which was transferred from our Other line of business in the second quarter of 2007.(4) The amount for 2006 includes two months of revenue from IIS and our 50% proportionate share of nine months of revenue from RBC Dexia IS for the year ended October 31, 2006.
Comparative amounts for 2005 only represent revenue from IIS.(5) Consists of Global Credit and Research business, and includes the tax equivalent basis adjustment which is discussed below.
Note 30 Results by business and geographic segment (continued)
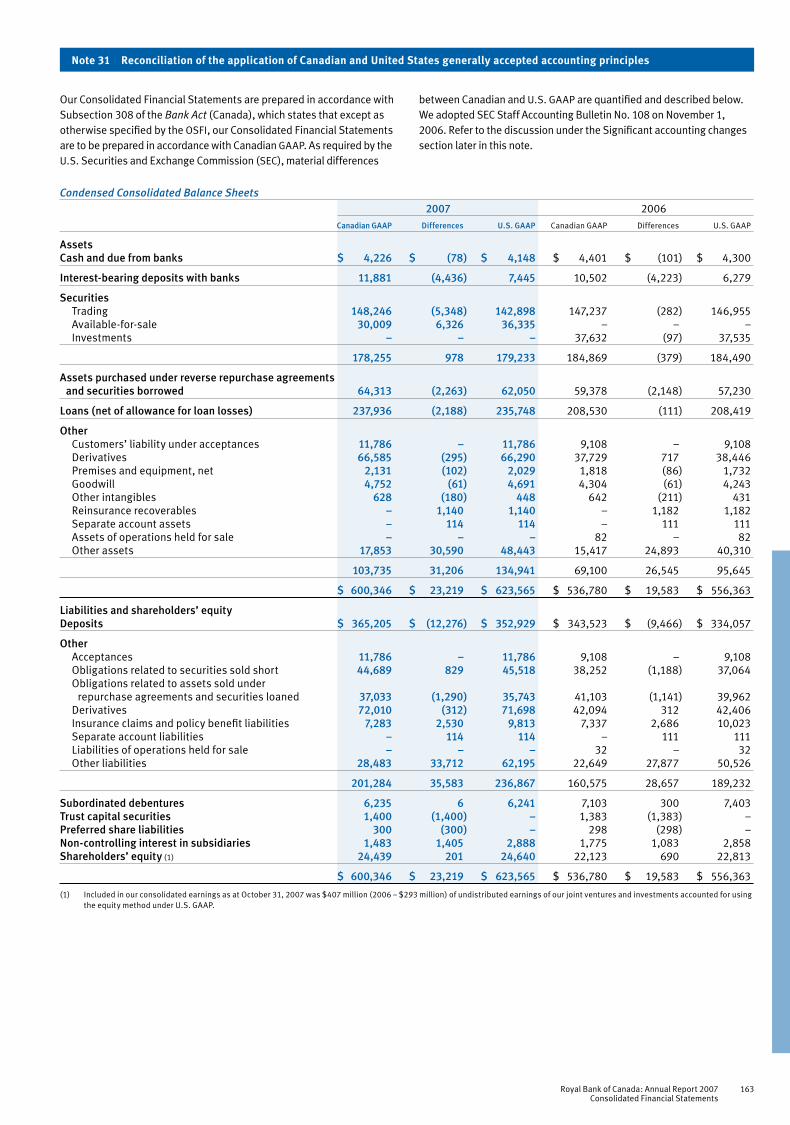
Royal Bank of Canada: Annual Report 2007Consolidated Financial Statements
163
Our Consolidated Financial Statements are prepared in accordance with Subsection 308 of the BankAct(Canada), which states that except as otherwise specified by the OSFI, our Consolidated Financial Statements are to be prepared in accordance with Canadian GAAP. As required by the U.S. Securities and Exchange Commission (SEC), material differences
between Canadian and U.S. GAAP are quantified and described below. We adopted SEC Staff Accounting Bulletin No. 108 on November 1, 2006. Refer to the discussion under the Significant accounting changes section later in this note.
CondensedConsolidatedBalanceSheets 2007 2006 CanadianGAAP Differences U.S.GAAP Canadian GAAP Differences U.S. GAAP
Assets Cashandduefrombanks $ 4,226 $ (78) $ 4,148 $ 4,401 $ (101) $ 4,300
Interest-bearingdepositswithbanks 11,881 (4,436) 7,445 10,502 (4,223) 6,279
Securities Trading 148,246 (5,348) 142,898 147,237 (282) 146,955 Available-for-sale 30,009 6,326 36,335 – – – Investments – – – 37,632 (97) 37,535
178,255 978 179,233 184,869 (379) 184,490
Assetspurchasedunderreverserepurchaseagreements andsecuritiesborrowed 64,313 (2,263) 62,050 59,378 (2,148) 57,230
Loans(netofallowanceforloanlosses) 237,936 (2,188) 235,748 208,530 (111) 208,419
Other Customers’ liability under acceptances 11,786 – 11,786 9,108 – 9,108 Derivatives 66,585 (295) 66,290 37,729 717 38,446 Premises and equipment, net 2,131 (102) 2,029 1,818 (86) 1,732 Goodwill 4,752 (61) 4,691 4,304 (61) 4,243 Other intangibles 628 (180) 448 642 (211) 431 Reinsurance recoverables – 1,140 1,140 – 1,182 1,182 Separate account assets – 114 114 – 111 111 Assets of operations held for sale – – – 82 – 82 Other assets 17,853 30,590 48,443 15,417 24,893 40,310
103,735 31,206 134,941 69,100 26,545 95,645
$ 600,346 $ 23,219 $ 623,565 $ 536,780 $ 19,583 $ 556,363
Liabilitiesandshareholders’equity Deposits $ 365,205 $ (12,276) $ 352,929 $ 343,523 $ (9,466) $ 334,057
Other Acceptances 11,786 – 11,786 9,108 – 9,108 Obligations related to securities sold short 44,689 829 45,518 38,252 (1,188) 37,064 Obligations related to assets sold under repurchase agreements and securities loaned 37,033 (1,290) 35,743 41,103 (1,141) 39,962 Derivatives 72,010 (312) 71,698 42,094 312 42,406 Insurance claims and policy benefit liabilities 7,283 2,530 9,813 7,337 2,686 10,023 Separate account liabilities – 114 114 – 111 111 Liabilities of operations held for sale – – – 32 – 32 Other liabilities 28,483 33,712 62,195 22,649 27,877 50,526
201,284 35,583 236,867 160,575 28,657 189,232
Subordinateddebentures 6,235 6 6,241 7,103 300 7,403 Trustcapitalsecurities 1,400 (1,400) – 1,383 (1,383) – Preferredshareliabilities 300 (300) – 298 (298) – Non-controllinginterestinsubsidiaries 1,483 1,405 2,888 1,775 1,083 2,858 Shareholders’equity (1) 24,439 201 24,640 22,123 690 22,813
$ 600,346 $ 23,219 $ 623,565 $ 536,780 $ 19,583 $ 556,363
(1) Included in our consolidated earnings as at October 31, 2007 was $407 million (2006 – $293 million) of undistributed earnings of our joint ventures and investments accounted for using the equity method under U.S. GAAP.
Note 31 Reconciliation of the application of Canadian and United States generally accepted accounting principles

164 Royal Bank of Canada: Annual Report 2007Consolidated Financial Statements
Note 31 Reconciliation of the application of Canadian and United States generally accepted accounting principles (continued)
CondensedConsolidatedStatementsofIncome 2007 2006 2005
Net income from continuing operations, Canadian GAAP $ 5,492 $ 4,757 $ 3,437 Differences: Net interest income Derivative instruments and hedging activities (17) (22) 36 Joint ventures (115) (75) – Liabilities and equity 115 115 115 Non-interest income Insurance accounting (202) (544) (606) Derivative instruments and hedging activities 56 (31) 11 Reclassification of financial instruments (1) 9 14 27 Variable interest entities 4 (10) – Limited partnerships 60 (3) (9) Joint ventures (650) (458) (171) Reclassification of foreign currency translation (41) (4) – Other (31) (29) (4) Provision for (recovery of) credit losses Joint ventures 4 2 18 Other (8) – – Insurance policyholder benefits, claims and acquisition expense Insurance accounting 137 471 584 Non-interest expense Stock appreciation rights 11 16 25 Insurance accounting 69 75 72 Joint ventures 653 440 118 Variable interest entities 2 2 – Other 31 29 – Income taxes and net difference in income taxes due to the above items 66 95 (13) Non-controlling interest in net income of subsidiaries Variable interest entities (6) 8 – Joint ventures 3 3 – Liabilities and equity (101) (101) (101)
Net income from continuing operations, U.S. GAAP $ 5,541 $ 4,750 $ 3,539
Net loss from discontinued operations, Canadian GAAP (2) $ – $ (29) $ (50) Difference – Other – – 5
Net loss from discontinued operations, U.S. GAAP (2) $ – $ (29) $ (45)
Net income, U.S. GAAP $ 5,541 $ 4,721 $ 3,494
Basic earnings per share (3) Canadian GAAP $ 4.24 $ 3.65 $ 2.61 U.S. GAAP $ 4.26 $ 3.62 $ 2.67 Basic earnings per share from continuing operations Canadian GAAP $ 4.24 $ 3.67 $ 2.65 U.S. GAAP $ 4.26 $ 3.64 $ 2.71 Basic earnings (loss) per share from discontinued operations (2) Canadian GAAP $ – $ (.02) $ (.04) U.S. GAAP $ – $ (.02) $ (.04) Diluted earnings per share (3) Canadian GAAP $ 4.19 $ 3.59 $ 2.57 U.S. GAAP $ 4.21 $ 3.57 $ 2.63 Diluted earnings per share from continuing operations Canadian GAAP $ 4.19 $ 3.61 $ 2.61 U.S. GAAP $ 4.21 $ 3.59 $ 2.67 Diluted earnings (loss) per share from discontinued operations (2) Canadian GAAP $ – $ (.02) $ (.04) U.S. GAAP $ – $ (.02) $ (.04)
(1) Reclassification of financial instruments reflects differences in classification arising from the use of the fair value option and reclassification of securities. Prior to the adoption of the new financial instruments accounting standards on November 1, 2006, this item reflected the reclassification of securities only. Please refer to material differences between Canadian and U.S. GAAP for details of this reclassification of securities.
(2) Refer to Note 11.(3) The impact of calculating earnings per share using the two-class method reduced U.S. GAAP basic and diluted earnings per share for all periods presented by less than one cent. Please
refer to material differences between Canadian and U.S. GAAP for details of this two-class method.

Royal Bank of Canada: Annual Report 2007Consolidated Financial Statements
165
CondensedConsolidatedStatementsofCashFlows(1)
2007 2006 2005
Cashflowsfrom(usedin)operatingactivities,CanadianGAAP $ 19,473 $ (14,996) $ (29,527)U.S. GAAP adjustment for net income 49 (8) 102 Adjustments to determine net cash from (used in) operating activities Provision for credit losses 4 (2) (18) Depreciation (24) (20) (4) Future income taxes (416) 271 (135) Amortization of other intangibles (26) (20) – Net gain on sale of investment securities – – 3 Changes in operating assets and liabilities Insurance claims and policy benefit liabilities (156) 43 (438) Net change in accrued interest receivable and payable 293 (120) (1) Current income taxes 64 – – Derivative assets 1,012 440 41 Derivative liabilities (624) (267) (90) Trading securities (5,546) (695) (710) Reinsurance recoverable (42) (8) (511) Net change in brokers and dealers receivable and payable 344 3,872 (2,504) Other (437) 2,446 2,099
Netcashfrom(usedin)operatingactivities,U.S.GAAP 13,968 (9,064) (31,693)
Cashflowsfrom(usedin)investingactivities,CanadianGAAP (36,690) (43,235) (7,727) Change in interest-bearing deposits with banks 213 4,191 48 Change in loans, net of loan securitizations 2,084 1,050 28 Proceeds from sale of investment securities (7,565) (14,709) (25,628) Proceeds from maturity of investment securities (18,784) (28,203) (18,405) Purchases of investment securities 24,097 38,474 36,373 Proceeds from sale of available-for-sale securities 7,565 14,727 25,651 Proceeds from maturity of available-for-sale securities 18,784 28,185 18,379 Purchases of available-for-sale securities (19,964) (38,383) (36,130) Net acquisitions of premises and equipment 40 73 12 Change in assets purchased under reverse repurchase agreements and securities borrowed 115 2,148 –
Netcashfrom(usedin)investingactivities,U.S.GAAP 30,105 (35,682) (7,399)
Cashflowsfromfinancingactivities,CanadianGAAP 17,374 57,711 38,666 Change in deposits (17,831) (36,663) (35,001) Change in deposits – Canada (2,792) (299) 15,522 Change in deposits – International 17,813 27,468 19,791 Issue of RBC Trust Capital Securities – – (1,200) Issue of preferred shares (16) (7) – Redemption of preferred shares for cancellation 5 – – Issuance costs 11 7 3 Issue of common shares (1) 1 (1) Sales of treasury shares 3 – – Purchase of treasury shares (1) (2) 7 Dividends paid (15) (13) (14) Change in obligations related to assets sold under repurchase agreements and securities loaned (149) (1,141) – Dividends/distributions paid by subsidiaries to non-controlling interests (101) (102) (102) Change in obligations related to securities sold short 2,017 (2,835) 2,837 Change in short-term borrowings of subsidiaries – – (4)
Netcashfromfinancingactivities,U.S.GAAP $ 16,317 $ 44,125 $ 40,504
Effect of exchange rate changes on cash and due from banks $ (332) $ (80) $ (122)
Netchangeincashandduefrombanks (152) (701) 1,290 Cash and due from banks at beginning of year $ 4,300 $ 5,001 $ 3,711
Cashandduefrombanksatendofyear,U.S.GAAP $ 4,148 $ 4,300 $ 5,001
(1) We did not have any discontinued operations during 2007.
Accumulatedothercomprehensive(loss),netoftaxes(1)
2007 CanadianGAAP Differences U.S.GAAP 2006 (1) 2005 (1)
Transition adjustment $ (45) $ 45 $ – $ – $ –Unrealized (losses) gains on available-for-sale securities (65) 133 68 191 83Unrealized foreign currency translation gains (losses), net of hedging activities (3,207) (4) (3,211) (2,000) (1,768)Gains (losses) on derivatives designated as cash flow hedges 111 (91) 20 (52) (165)Additional pension obligation – (541) (541) (62) (313)
Accumulated other comprehensive income (loss), net of income taxes $ (3,206) $ (458) $ (3,664) $ (1,923) $ (2,163)
(1) The concept of AOCI was introduced under Canadian GAAP upon the adoption of Section 1530 on November 1, 2006 (refer to Note 1). Accordingly, there is no reconciliation for the prior periods presented.

166 Royal Bank of Canada: Annual Report 2007Consolidated Financial Statements
Note 31 Reconciliation of the application of Canadian and United States generally accepted accounting principles (continued)
MaterialbalancesheetreconcilingitemsThe following tables present the increases or (decreases) in assets, liabilities and shareholders’ equity by material differences between Canadian and U.S. GAAP:
ConsolidatedStatementsofComprehensiveIncome 2007 CanadianGAAP Differences U.S.GAAP 2006 (1) 2005 (1)
Net income $ 5,492 $ 49 $ 5,541 $ 4,721 $ 3,494 Other comprehensive income, net of taxes Net unrealized (losses) gains on available-for-sale securities, net of reclassification adjustments (65) (58) (123) 108 (95) Unrealized foreign currency translation gains (losses) (2,965) (49) (3,014) (507) (623) Reclassification of (gains) losses on foreign currency translation to income (42) 41 (1) 6 5 Net foreign currency translation gains (losses) from hedging activities 1,804 – 1,804 269 401 Net gains (losses) on derivatives designated as cash flow hedges 80 1 81 (35) (97) Reclassification to income of (gains) losses on derivatives designated as cash flow hedges 31 (5) 26 148 124 Additional pension obligation – 50 50 251 (246)
Total comprehensive income $ 4,335 $ 29 $ 4,364 $ 4,961 $ 2,963
Income taxes (recovery) deducted from the above items: Net unrealized gains (losses) on available-for-sale securities $ (11) $ (37) $ (48) $ 57 $ (55) Net foreign currency translation gains (losses), net of hedging activities 911 – 911 130 204 Net unrealized gains (losses) on derivatives designated as cash flow hedges 43 – 43 (15) (51) Reclassification to income of (gains) losses on derivatives designated as cash flow hedges 16 (3) 13 75 66 Additional pension obligation – 27 27 134 (132)
Total income taxes (recovery) $ 959 $ (13) $ 946 $ 381 $ 32
(1) A new Consolidated Statement of Comprehensive Income was introduced under Canadian GAAP upon adoption of Section 1530 on November 1, 2006 (refer to Note 1). Accordingly, there is no reconciliation for the prior periods presented.
As at October 31, 2007
AssetsCash and due from banks $ – – (78) – – – – – – – – – – $ (78)Interest-bearing deposits with banks $ – – (4,436) – – – – – – – – – – $(4,436)Securities $ – – (375) – (875) (195) – – – 2,422 – – 1 $ 978Assets purchased under reverse repurchase agreements and securities borrowed $ – – (2,262) – (1) – – – – – – – – $(2,263) Loans $ – – (2,931) – (18) – – – – – – 717 44 $(2,188)Other assets $ (2) – (4,818) 2,967 873 220 (23) – (202) 13,995 18,106 – 90 $31,206Liabilitiesandshareholders’equityDeposits $ (8) – (12,277) – 13 – – – – – – – (4) $(12,276)Other liabilities $ 2 – (2,594) 2,728 (14) – (60) (34) 339 16,417 18,106 717 (24) $35,583Subordinated debentures $ – – – – 6 – – – – – – – – $ 6Trust capital securities $ – – – – – – – (1,400) – – – – – $(1,400)Preferred share liabilities $ – – – – – – – (300) – – – – – $ (300)Non-controlling interest in subsidiaries $ – – (29) – – – – 1,434 – – – – – $ 1,405Shareholders’ equity $ 4 – – 239 (26) 25 37 300 (541) – – – 163 $ 201
(1) Reclassification of financial instruments reflects differences in classification arising from the use of the fair value option and reclassification of securities. Prior to the adoption of the new financial instruments accounting standards on November 1, 2006, this column reflected the reclassification of securities only. Refer to the material differences between Canadian and U.S. GAAP for details of this reclassification of securities.
(2) Other minor differences include cumulative translation adjustment of $41 million (2006 – $4 million) and $8 million ($nil for 2006) related to loans held for sale which are recorded at the lower of cost or market under U.S. GAAP and recorded at amortized cost under Canadian GAAP.
Der
ivat
ives
and
he
dgin
gac
tivi
ties
Vari
able
inte
rest
en
titie
s
Join
tven
ture
s
Insu
ranc
e
acco
untin
g
Recl
assi
ficat
ion
of
fina
ncia
lin
stru
men
ts (1
)
Lim
ited
pa
rtne
rshi
ps
Stoc
k
appr
ecia
tion
ri
ghts
Liab
ilitie
s
and
equi
ty
Addi
tion
al
pens
ion
oblig
atio
n
Trad
eda
te
acco
untin
g
Non
-cas
h
colla
tera
l
Righ
tofo
ffse
t
Gua
rant
ees,
loan
co
mm
itm
ents
and
ot
herm
inor
item
s(2
)
Tota
l
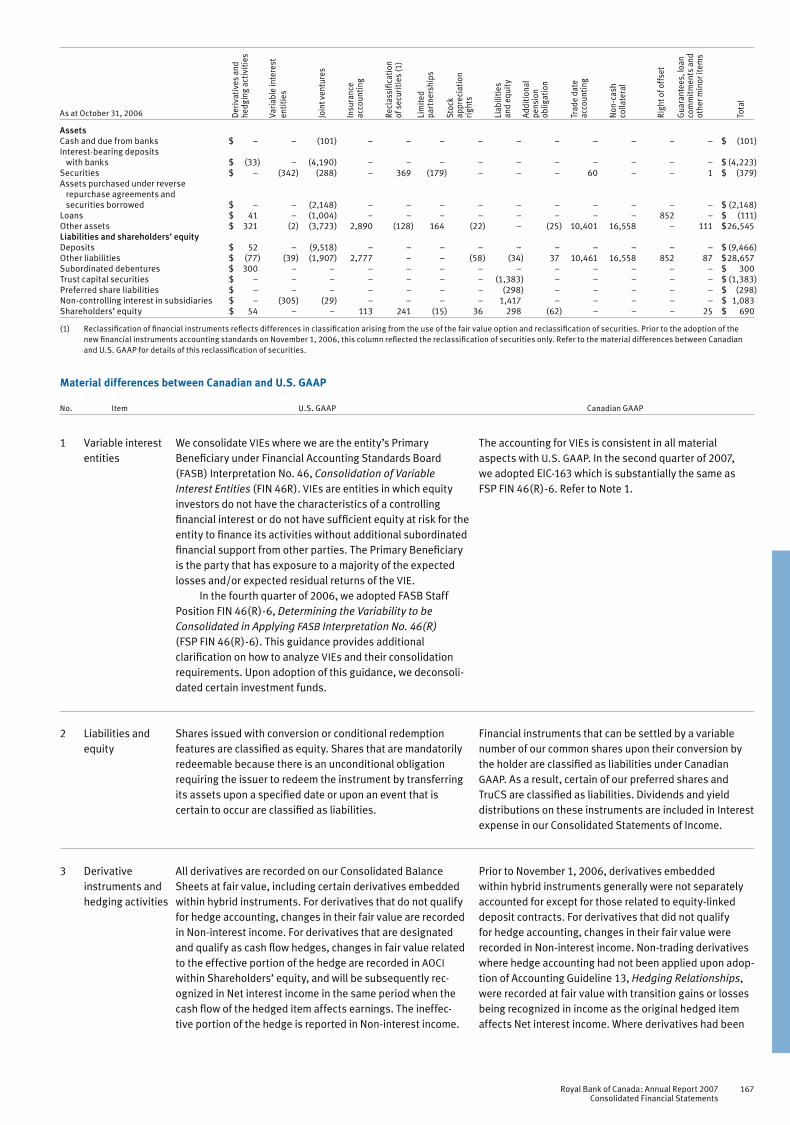
Royal Bank of Canada: Annual Report 2007Consolidated Financial Statements
167
As at October 31, 2006
AssetsCash and due from banks $ – – (101) – – – – – – – – – – $ (101)Interest-bearing deposits with banks $ (33) – (4,190) – – – – – – – – – – $ (4,223)Securities $ – (342) (288) – 369 (179) – – – 60 – – 1 $ (379)Assets purchased under reverse repurchase agreements and securities borrowed $ – – (2,148) – – – – – – – – – – $ (2,148) Loans $ 41 – (1,004) – – – – – – – – 852 – $ (111)Other assets $ 321 (2) (3,723) 2,890 (128) 164 (22) – (25) 10,401 16,558 – 111 $ 26,545Liabilitiesandshareholders’equityDeposits $ 52 – (9,518) – – – – – – – – – – $ (9,466)Other liabilities $ (77) (39) (1,907) 2,777 – – (58) (34) 37 10,461 16,558 852 87 $ 28,657Subordinated debentures $ 300 – – – – – – – – – – – – $ 300Trust capital securities $ – – – – – – – (1,383) – – – – – $ (1,383)Preferred share liabilities $ – – – – – – – (298) – – – – – $ (298)Non-controlling interest in subsidiaries $ – (305) (29) – – – – 1,417 – – – – – $ 1,083Shareholders’ equity $ 54 – – 113 241 (15) 36 298 (62) – – – 25 $ 690
(1) Reclassification of financial instruments reflects differences in classification arising from the use of the fair value option and reclassification of securities. Prior to the adoption of the new financial instruments accounting standards on November 1, 2006, this column reflected the reclassification of securities only. Refer to the material differences between Canadian and U.S. GAAP for details of this reclassification of securities.
Der
ivat
ives
and
he
dgin
g ac
tivi
ties
Vari
able
inte
rest
entit
ies
Join
t ven
ture
s
Insu
ranc
e
acco
untin
g
Recl
assi
ficat
ion
of
sec
uriti
es (1
)
Lim
ited
pa
rtne
rshi
ps
Stoc
k
appr
ecia
tion
ri
ghts
Liab
ilitie
s
and
equi
ty
Addi
tiona
l pe
nsio
n ob
ligat
ion
Trad
e da
te
acco
untin
g
Non
-cas
h
colla
tera
l
Righ
t of o
ffse
t
Gua
rant
ees,
loan
co
mm
itm
ents
and
ot
her m
inor
item
s
Tota
l
Material differences between Canadian and U.S. GAAP
No. Item U.S. GAAP Canadian GAAP
We consolidate VIEs where we are the entity’s Primary Beneficiary under Financial Accounting Standards Board (FASB) Interpretation No. 46, ConsolidationofVariableInterestEntities (FIN 46R). VIEs are entities in which equity investors do not have the characteristics of a controlling financial interest or do not have sufficient equity at risk for the entity to finance its activities without additional subordinated financial support from other parties. The Primary Beneficiary is the party that has exposure to a majority of the expected losses and/or expected residual returns of the VIE.
In the fourth quarter of 2006, we adopted FASB Staff Position FIN 46(R)-6, DeterminingtheVariabilitytobeConsolidatedinApplyingFASBInterpretationNo.46(R) (FSP FIN 46(R)-6). This guidance provides additional clarification on how to analyze VIEs and their consolidation requirements. Upon adoption of this guidance, we deconsoli-dated certain investment funds.
Shares issued with conversion or conditional redemption features are classified as equity. Shares that are mandatorily redeemable because there is an unconditional obligation requiring the issuer to redeem the instrument by transferring its assets upon a specified date or upon an event that is certain to occur are classified as liabilities.
All derivatives are recorded on our Consolidated Balance Sheets at fair value, including certain derivatives embedded within hybrid instruments. For derivatives that do not qualify for hedge accounting, changes in their fair value are recorded in Non-interest income. For derivatives that are designated and qualify as cash flow hedges, changes in fair value related to the effective portion of the hedge are recorded in AOCI within Shareholders’ equity, and will be subsequently rec-ognized in Net interest income in the same period when the cash flow of the hedged item affects earnings. The ineffec-tive portion of the hedge is reported in Non-interest income.
The accounting for VIEs is consistent in all material aspects with U.S. GAAP. In the second quarter of 2007, we adopted EIC-163 which is substantially the same as FSP FIN 46(R)-6. Refer to Note 1.
Financial instruments that can be settled by a variable number of our common shares upon their conversion by the holder are classified as liabilities under Canadian GAAP. As a result, certain of our preferred shares and TruCS are classified as liabilities. Dividends and yield distributions on these instruments are included in Interest expense in our Consolidated Statements of Income.
Prior to November 1, 2006, derivatives embedded within hybrid instruments generally were not separately accounted for except for those related to equity-linked deposit contracts. For derivatives that did not qualify for hedge accounting, changes in their fair value were recorded in Non-interest income. Non-trading derivatives where hedge accounting had not been applied upon adop-tion of Accounting Guideline 13, HedgingRelationships, were recorded at fair value with transition gains or losses being recognized in income as the original hedged item affects Net interest income. Where derivatives had been
1 Variable interest entities
2 Liabilities and equity
3 Derivative
instruments and hedging activities

168 Royal Bank of Canada: Annual Report 2007Consolidated Financial Statements
Note 31 Reconciliation of the application of Canadian and United States generally accepted accounting principles (continued)
Material differences between Canadian and U.S. GAAP(continued)
No. Item U.S. GAAP Canadian GAAP
For derivatives that are designated and qualify as fair value hedges, the carrying amount of the hedged item is adjusted by gains or losses attributable to the hedged risk and recorded in Non-interest income. This change in fair value of the hedged item is generally offset by changes in the fair value of the derivative.
Investments in joint ventures other than VIEs are accounted for using the equity method.
Fixed income and equity investments are included in Available-for-sale securities and are carried at estimated fair value. Unrealized gains and losses, net of income taxes, are reported in AOCI within Shareholders’ equity. Realized gains and losses are included in Non-interest income when realized.
Insuranceclaimsandpolicybenefitliabilities: Liabilities for life insurance contracts, except universal life and investment-type contracts, are determined using the net level premium method, which includes assumptions for mortality, morbidity, policy lapses, surrenders, investment yields, policy divi-dends and direct operating expenses. These assumptions are not revised unless it is determined that existing deferred acquisition costs cannot be recovered. For universal life and investment-type contracts, liabilities represent policyholder account balances and include a net level premium reserve for some contracts. The account balances represent an accumu-lation of gross deposits received plus credited interest less withdrawals, expenses and mortality charges. Underlying reserve assumptions of these contracts are subject to review at least annually. Property and casualty claim liabilities rep-resent the estimated amounts required to settle all unpaid claims, and are recorded on an undiscounted basis.
designated and qualified as effective hedges, they were accounted for on an accrual basis with gains or losses deferred and recognized over the life of the hedged assets or liabilities as adjustments to Net interest income. The ineffective portion of the hedge was not required to be recognized.
Upon the adoption of Section 3855 and Section 3865 on November 1, 2006, Canadian GAAP is substantially har-monized with U.S. GAAP. Refer to Note 1.
Investments in joint ventures other than VIEs are propor-tionately consolidated.
Prior to November 1, 2006, fixed income and equity invest-ments were classified as Investment account securities. Fixed income investments were carried at amortized cost, and equity investments at cost except for those that sup-port life insurance liabilities whose carrying values were adjusted quarterly by 5% of the difference between market value and previously adjusted carrying cost. Realized gains and losses on disposal of fixed income investments that support life insurance liabilities were deferred and amor-tized to Non-interest income over the remaining term to maturity of the investments sold to a maximum period of 20 years. Realized gains and losses on disposal of equity investments were deferred and recognized as Non-interest income at the quarterly rate of 5% of unamortized deferred gains and losses.
Upon adoption of Section 3855 on November 1, 2006, fixed income and equity securities are classified as available-for-sale securities except for those supporting the policy benefit liabilities of life and health insurance contracts which are designated as held-for-trading using the fair value option, as described in Note 1.
Insuranceclaimsandpolicybenefitliabilities: Liabilities for life insurance contracts are determined using the Canadian Asset Liability Method, which incorporates assumptions for mortality, morbidity, policy lapses, surrenders, investment yields, policy dividends and main-tenance expenses. To recognize the uncertainty in the assumptions underlying the calculation of the liabilities, a margin (provision for adverse deviations) is added to each assumption. These assumptions are reviewed at least annually and updated in response to actual experience and market conditions. Property and casualty claim liabili-ties represent the estimated amounts required to settle all unpaid claims, and are recorded on a discounted basis.
3 Derivative instruments and hedging activities
(continued)
4 Joint ventures
5 Insurance accounting

Royal Bank of Canada: Annual Report 2007Consolidated Financial Statements
169
Insurancerevenue: Amounts received for universal life and other investment-type contracts are not included as rev-enue, but are reported as deposits to policyholders’ account balances in Insurance claims and policy benefit liabilities. Revenue from these contracts are limited to amounts assessed against policyholders’ account balances for mor-tality, policy administration and surrender charges, and are included in Non-interest income when earned. Payments upon maturity or surrender are reflected as reductions in the Insurance claims and policy benefit liabilities.
Policyacquisitioncosts: Acquisition costs are deferred in Other assets. The amortization method of the acquisition costs is dependent on the product to which the costs are related. For long-duration contracts, they are amortized in proportion to premium revenue. For universal life and investment-type contracts, amortization is based on a constant percentage of estimated gross profits.
Valueofbusinessacquired:The value of business acquired (VOBA) is determined at the acquisition date and recorded as an asset. The VOBA asset is amortized and charged to income using the same methodologies used for policy acquisition cost amortization but reflecting premiums or profit margins after the date of acquisition only.
Reinsurance:Reinsurance recoverables are recorded as an asset on our Consolidated Balance Sheets.
Separateaccounts:Separate accounts are recognized on our Consolidated Balance Sheets.
Securities are classified as Trading account or Available-for-sale, and are carried on our Consolidated Balance Sheets at their estimated fair value. The net unrealized gain (loss) on Available-for-sale securities, net of related income taxes, is reported in AOCI within Shareholders’ equity except where the Available-for-sale securities qualify as hedged items in fair value hedges. These hedged unrealized gains (losses) are recorded in Non-interest income where they are generally offset by the changes in fair value of the hedging derivatives. Writedowns to reflect other-than-temporary impairment in the value of Available-for-sale securities are included in Non-interest income.
On November 1, 2006, we adopted Financial Accounting Standards Board (FASB) Statement No. 155,AccountingforCertainHybridFinancialInstruments–anamendmentofFASBStatementsNo.133and140(FAS 155). FAS 155 allows an entity to measure any hybrid financial instrument that con-tains an embedded derivative that requires bifurcation at its fair value, with changes in fair value recognized in earnings.
On November 1, 2006, we also adopted FASB Statement No. 156, AccountingforServicingofFinancialAssets–anamendmentofFASBStatementNo.140 (FAS 156). Under FAS 156, an entity is required to initially measure its servicing rights at fair value and can elect to subsequently amortize its initial fair value over the term of the servicing rights, or remeasure them at fair value with changes recognized in
Insurancerevenue:Premiums for universal life and other investment-type contracts are recorded as Non-interest income, and a liability for future policy benefits is established as a charge to Insurance policyholder benefits, claims and acquisition expense.
Policyacquisitioncosts: The costs of acquiring new life insur-ance and annuity business are implicitly recognized as a reduction in Insurance claims and policy benefit liabilities.
Valueofbusinessacquired: The value of life insurance in-force policies acquired in a business combination is implicitly recognized as a reduction in policy benefit liabilities.
Reinsurance: Reinsurance recoverables of life insurance business related to the risks ceded to other insurance or reinsurance companies are recorded as an offset to Insurance claims and policy benefit liabilities.
Separateaccounts:Assets and liabilities of separate accounts (known as segregated funds in Canada) are not recognized on our Consolidated Balance Sheets.
Prior to November 1, 2006, securities were classified as Trading account (carried at estimated fair value), Investment account (carried at amortized cost) or Loan substitute. Writedowns to reflect other-than-temporary impairments in the value of Investment account securities were included in Non-interest income. Loan substitute securities were accorded the accounting treatment applicable to loans and, if required, were reduced by an allowance.
With the adoption of Section 3855 on November 1, 2006, Canadian GAAP is substantially harmonized with U.S. GAAP. The significant difference subsequent to the adoption of this new Canadian standard primarily relates to the use of the fair value option. As described in Note 1, Section 3855 allows the designation of any financial instrument as held-for-trading on its initial recognition or upon adoption of the new standard. The fair value option can be applied to any financial instru-ment under Canadian GAAP (except for certain restrictions imposed by the OSFI) whereas U.S. GAAP only allows the use of the fair value option for servicing rights and certain hybrid financial instruments. The principal categories of financial instruments where we have applied the fair value option under Canadian GAAP are described in Note 1.
Material differences between Canadian and U.S. GAAP(continued)
No. Item U.S. GAAP Canadian GAAP
5 Insurance accounting
(continued)
6 Reclassification of securities and the application of the fair value option

170 Royal Bank of Canada: Annual Report 2007Consolidated Financial Statements
Material differences between Canadian and U.S. GAAP(continued)
No. Item U.S. GAAP Canadian GAAP
Net income. The ability to remeasure servicing rights at fair value through Net income eliminates the accounting mismatch between the servicing rights and the related derivatives that would otherwise result in the absence of hedge accounting.
Upon adoption of FAS 155 and FAS 156, certain hybrid financial instruments and servicing rights are measured at fair value. The adoption of these standards did not materially impact our consolidated financial position or results of operations.
The equity method is used to account for investments in limited partnerships that are non-VIEs or unconsolidated VIEs, if we own at least 3% of the total ownership interest.
Between November 29, 1999, and June 5, 2001, grants of options under the employee stock option plan were accompa-nied with tandem SARs, whereby participants could choose to exercise a SAR instead of the corresponding option. In such cases, the participants would receive a cash payment equal to the difference between the closing price of our common shares on the day immediately preceding the day of exercise and the exercise price of the option. For such a plan, compensation expense would be measured using estimates based on past experience of participants exercising SARs rather than the corresponding options.
On November 1, 2005, we adopted FASB Statement No. 123 (revised 2004) Share-BasedPayment (FAS 123(R )) and its related FASB Staff Positions (FSPs) prospectively for new awards and the unvested portion of existing awards. FAS 123(R) requires that the compensation expense should be measured assuming that all participants will exercise SARs. Under the transition guidelines of the new standard, the requirements of the new accounting standard are applicable to awards granted after the adoption of the new standard. Since these SARs were awarded prior to adoption of the new accounting standard, these will continue to be accounted for under the previous accounting standard.
On October 31, 2007, we adopted the recognition requirements of FASB Statement No. 158, Employers’AccountingforDefinedBenefitPensionandOtherPost-retirementPlans–anamend-mentofFASBStatementsNo.87,88,106and132(R)(FAS 158), which require an entity to: (i) recognize the funded status of a benefit plan on the balance sheet; and (ii) recognize in OCI the existing unrecognized net actuarial gains and losses, prior ser-vice costs and credits, and net transitional assets or obligations. The measurement requirement of FAS 158, which requires an entity to measure defined benefit plan assets and obligations as at the year-end date, will be effective for us prospectively at the end of 2009. The impact of adopting FAS 158 is disclosed in the Pensions and other post-employment benefits section of this note.
Prior to 2007, for defined benefit pension plans, an unfunded accumulated benefit obligation was recorded as an
We use the equity method to account for investments in limited partnerships that are non-VIEs or unconsolidated VIEs, if we have the ability to exercise significant influ-ence, generally indicated by an ownership interest of 20% or more.
For such a plan, a liability is recorded for the potential cash payments to participants and compensation expense is measured assuming that all participants will exercise SARs.
Canadian GAAP does not have the same requirements as FAS 158.
For a defined benefit plan, the plan assets and the benefit obligations may be measured as of a date not more than three months prior to the year-end. We mea-sure our benefit obligations and pension plan assets as at September 30 each year.
6 Reclassification of securities and the application of the fair value option (continued)
7 Limited partnerships
8 Stock appreciation rights (SARs)
9 Pension and other post- employment
obligations
Note 31 Reconciliation of the application of Canadian and United States generally accepted accounting principles (continued)
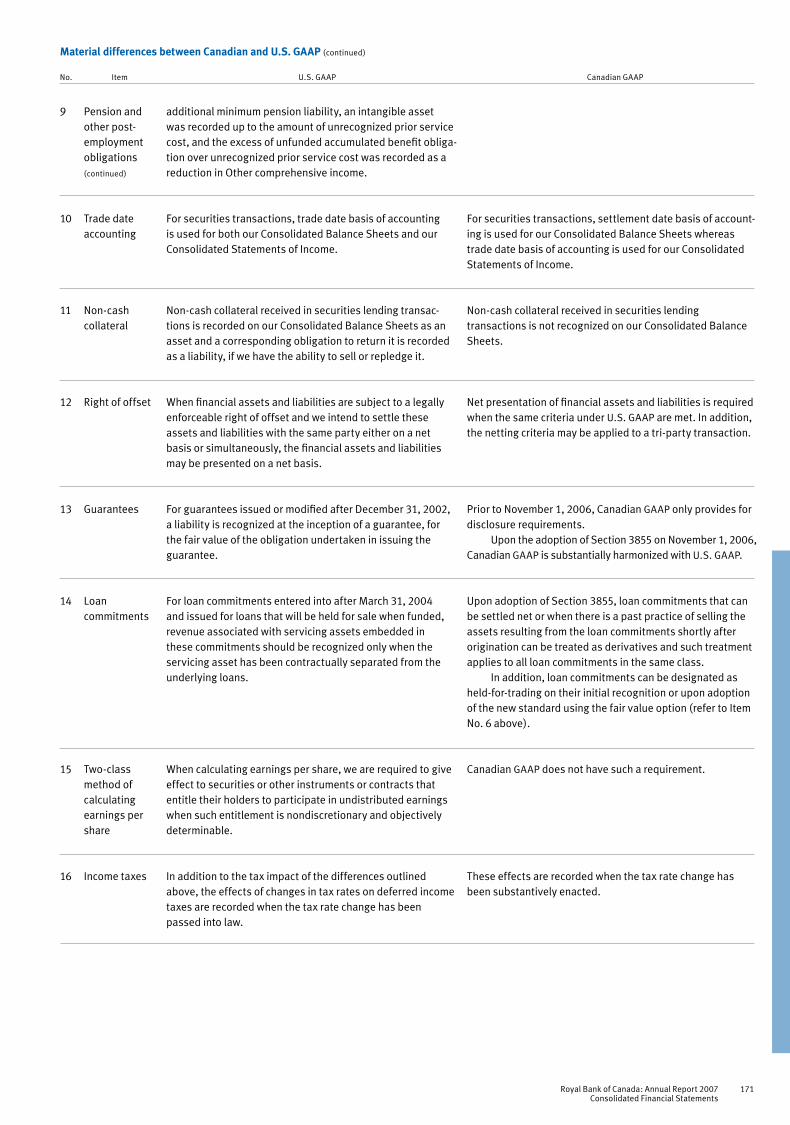
Royal Bank of Canada: Annual Report 2007Consolidated Financial Statements
171
additional minimum pension liability, an intangible asset was recorded up to the amount of unrecognized prior service cost, and the excess of unfunded accumulated benefit obliga-tion over unrecognized prior service cost was recorded as a reduction in Other comprehensive income.
For securities transactions, trade date basis of accounting is used for both our Consolidated Balance Sheets and our Consolidated Statements of Income.
Non-cash collateral received in securities lending transac-tions is recorded on our Consolidated Balance Sheets as an asset and a corresponding obligation to return it is recorded as a liability, if we have the ability to sell or repledge it.
When financial assets and liabilities are subject to a legally enforceable right of offset and we intend to settle these assets and liabilities with the same party either on a net basis or simultaneously, the financial assets and liabilities may be presented on a net basis.
For guarantees issued or modified after December 31, 2002, a liability is recognized at the inception of a guarantee, for the fair value of the obligation undertaken in issuing the guarantee.
For loan commitments entered into after March 31, 2004 and issued for loans that will be held for sale when funded, revenue associated with servicing assets embedded in these commitments should be recognized only when the servicing asset has been contractually separated from the underlying loans.
When calculating earnings per share, we are required to give effect to securities or other instruments or contracts that entitle their holders to participate in undistributed earnings when such entitlement is nondiscretionary and objectively determinable.
In addition to the tax impact of the differences outlined above, the effects of changes in tax rates on deferred income taxes are recorded when the tax rate change has been passed into law.
For securities transactions, settlement date basis of account-ing is used for our Consolidated Balance Sheets whereas trade date basis of accounting is used for our Consolidated Statements of Income.
Non-cash collateral received in securities lending transactions is not recognized on our Consolidated Balance Sheets.
Net presentation of financial assets and liabilities is required when the same criteria under U.S. GAAP are met. In addition, the netting criteria may be applied to a tri-party transaction.
Prior to November 1, 2006, Canadian GAAP only provides for disclosure requirements.
Upon the adoption of Section 3855 on November 1, 2006, Canadian GAAP is substantially harmonized with U.S. GAAP.
Upon adoption of Section 3855, loan commitments that can be settled net or when there is a past practice of selling the assets resulting from the loan commitments shortly after origination can be treated as derivatives and such treatment applies to all loan commitments in the same class.
In addition, loan commitments can be designated as held-for-trading on their initial recognition or upon adoption of the new standard using the fair value option (refer to Item No. 6 above).
Canadian GAAP does not have such a requirement.
These effects are recorded when the tax rate change has been substantively enacted.
9 Pension and other post- employment
obligations (continued)
10 Trade date accounting
11 Non-cash collateral
12 Right of offset
13 Guarantees
14 Loan commitments
15 Two-class method of calculating earnings per share
16 Income taxes
Material differences between Canadian and U.S. GAAP(continued)
No. Item U.S. GAAP Canadian GAAP
172 Royal Bank of Canada: Annual Report 2007Consolidated Financial Statements
2007 Beforeapplication Afterapplication ofFAS158 Adjustments ofFAS158
Otherassets Prepaid pension benefit cost (1) $ 578 $ (479) $ 99
Otherliabilities Accrued pension and other post-employment benefit expense (2) 1,262 330 1,592
Accumulatedothercomprehensiveloss (3) $ 18 $ 809 $ 827
(1) Includes the reversal of $12 million unrecognized prior service costs reported as intangible asset. (2) Includes the reversal of the additional minimum liability adjustment of $30 million. (3) Includes employee benefit plan adjustments of $549 million, net of tax, and the reversal of the additional minimum liability adjustment of $20 million, net of tax.
The under-funded status of the pension plans and other post- employment plans of $52 million and $1,441 million, respectively, are recognized on our Consolidated Balance Sheet in Other liabilities. The accumulated benefit obligations for the pension plans is $6,299 mil-lion at October 31, 2007 (2006 – $6,277 million).
The pre-tax amounts included in AOCI at October 31, 2007 are as follows:
2007 Otherpost- Pensionplans employmentplans Total
Net actuarial loss $ 484 $ 564 $ 1,048Prior service cost (benefit) 95 (307) (212)Transitional (asset) obligation (10) 1 (9)
Pre-taxamountrecognizedinAccumulatedothercomprehensiveloss(1) $ 569 $ 258 $ 827
(1) Amount recognized in AOCI, net of tax is $541 million.
Note 31 Reconciliation of the application of Canadian and United States generally accepted accounting principles (continued)
Restricted net assetsCertain of our subsidiaries and joint ventures are subject to regulatory requirements of the jurisdictions in which they operate. When these sub-sidiaries and joint ventures are subject to such requirements, they may be restricted from transferring to us our share of their assets in the form of cash dividends, loans or advances. At October 31, 2007, restricted net assets of these subsidiaries were $10.3 billion (2006 – $7.1 billion).
Pensions and other post-employment benefitsThe following information on our defined benefit plans is in addition to that disclosed in Note 20.
On October 31, 2007, we adopted the recognition and disclo-sure provisions of FAS 158 which require the recognition of a plan’s over-funded or under-funded status as an asset or liability with an offsetting adjustment to AOCI net of tax. The adjustments to AOCI at adoption represent the net actuarial gains and losses, prior service costs or credits, and transitional assets or obligations that were
previously unrecognized. These amounts will be subsequently rec-ognized as pension expense as they are amortized over the expected average remaining service life of employee groups covered by the plans. Further, actuarial gains and losses that arise in subsequent peri-ods and are not recognized as pension expense in the same periods will be recognized as a component of OCI. These amounts will be sub-sequently recognized as a component of pension expense on the same basis as the amounts recognized in AOCI on adoption of FAS 158.
The incremental effects of adopting the provisions of FAS 158 on our Consolidated Balance Sheet at October 31, 2007 are pre-sented in the following table, including the effect of recognizing the additional minimum liability of $30 million prior to adopting FAS 158. The incremental effects of adopting the provision of FAS 158 on our Consolidated Balance Sheet at October 31, 2007 had no effect on our Consolidated Statement of Income for the year ended October 31, 2007, or for any year presented.
Royal Bank of Canada: Annual Report 2007Consolidated Financial Statements
173
Averageassets,U.S.GAAP 2007 2006 2005 Average %oftotal Average % of total Average % of total assets averageassets assets average assets assets average assets
Canada $ 338,545 56% $ 297,740 57% $ 277,442 58%United States 139,569 23% 119,614 23% 97,002 20%Other International 125,743 21% 104,533 20% 101,961 22%
$ 603,857 100% $ 521,887 100% $ 476,405 100%
The estimated net actuarial loss and prior service cost for the pension plans that will be amortized from AOCI, on a pre-tax basis, into pension expense during 2008 are $94 million and $22 million, respectively, and pension expense will be reduced by $2 million relating to the amortization of transitional assets. The estimated net actuarial loss and transitional obligation for the Other post- employment plans that will be amortized from AOCI, on a pre-tax basis, into pension expense during 2008 are $37 million and $nil, respectively, and pension expense will be reduced by $23 million relating to the amortization of prior service benefit.
Hedging activitiesUpon adoption of Section 3855 and Section 3865 on November 1, 2006, Canadian GAAP is substantially harmonized with U.S. GAAP. The criteria in applying hedge accounting and the accounting for each of the permitted hedging strategies are described in Note 1.
Prior to November 1, 2006, there were material differences between Canadian and U.S. GAAP and such differences are quantified as follows:
FairvaluehedgeFor the year ended October 31, 2006, the ineffective portion recog-nized in Non-interest income amounted to a net unrealized gain of $11 million (2005 – $4 million). All components of each derivative’s change in fair value have been included in the assessment of fair value hedge effectiveness. We did not hedge any firm commitments for the year ended October 31, 2006.
CashflowhedgeFor the year ended October 31, 2006, a net unrealized gain of $1 million (2005 – $97 million loss) was recorded in OCI for the effec-tive portion of changes in fair value of derivatives designated as cash flow hedges. The amounts recognized in OCI are reclassified to Net interest income in the periods in which Net interest income is affected by the variability in cash flows of the hedged item. A net loss of $108 million (2005 – $124 million loss) was reclassified to Net income during the year. A net loss of $26 million (2005 – $111 million loss) deferred in AOCI as at October 31, 2006, is expected to be reclassified to Net income during the next 12 months.
For the year ended October 31, 2006, a net unrealized loss of $23 million (2005 – $3 million loss) was recognized in Non-interest income for the ineffective portion of cash flow hedges. All components of each derivative’s change in fair value have been included in the assessment of cash flow hedge effectiveness. We did not hedge any forecasted transactions for the year ended October 31, 2006.
HedgesofnetinvestmentsinforeignoperationsFor the year ended October 31, 2006, we experienced foreign currency losses of $507 million (2005 – $623 million) related to our net invest-ments in foreign operations, which were offset by gains of $269 million (2005 – $401 million) related to derivative and non-derivative instru-ments designated as hedges for such foreign currency exposures. The net foreign currency gains (losses) are recorded as a component of OCI.
Significant accounting changesGuidanceforquantifyingfinancialstatementmisstatementsIn September 2006, the SEC issued Staff Accounting Bulletin No. 108, ConsideringtheEffectsofPriorYearMisstatementswhenQuantifyingMisstatementsinCurrentYearFinancialStatements (SAB 108). It provides guidance on how to evaluate prior period financial statement misstatements for the purpose of assessing their materiality in the current period. SAB 108 requires registrants to evaluate the material-ity of identified adjusted errors using both of the follow methods: the “rollover” approach, which quantifies errors based on the amount of the errors originating in the current-year income statement without considering the effects of correcting the portion of the current-year balance sheet for misstatements that originated in prior years, and the “iron curtain” approach, which quantifies an error based on the effects of correcting the misstatement existing in the balance sheet at the end of the current year, irrespective of when it arose. SAB 108 permits companies to adjust for the cumulative effect of errors that the company previously determined to be immaterial by adjusting the carrying amount of assets and liabilities as of the beginning of the current year, with an offsetting adjustment to the opening balance of retained earnings.
We adopted SAB 108 on November 1, 2006, and reduced our opening retained earnings and AOCI by $42 million and $35 million, respectively, and increased other liabilities by $77 million. These adjustments pertain to errors that arose between 2001 and 2006 when certain criteria were not met in order for hedge accounting to be achieved. We previously deemed these errors to be immaterial to our Consolidated Financial Statements using the rollover method.
Future accounting changesGuidanceonaccountingforincometaxesFASB issued FASB Interpretation No. 48, AccountingforUncertaintyinIncomeTaxes–aninterpretationofFASBStatementNo.109 (FIN 48), on July 13, 2006, and its related Staff Position FIN 48-1, DefinitionofSettlementinFASBInterpretationNo.48 (FSP FIN 48-1), on May 2, 2007. FIN 48 and FSP FIN 48-1 provide additional guidance on how to recognize, measure and disclose income tax benefits. The cumulative effect of applying the provisions of FIN 48 will be reported as an adjustment to the opening balance of retained earnings. FIN 48 became effective for us on November 1, 2007, and is not expected to materially impact our consolidated financial position and results of operations.
AccountingfordeferredacquisitioncostsforinsuranceoperationsOn September 19, 2005, the Accounting Standards Executive Committee of the American Institute of Certified Public Accountants (AICPA) issued Statement of Position (SOP) 05-1, AccountingbyInsuranceEnterprisesforDeferredAcquisitionCostsinConnectionwithModificationsorExchangesofInsuranceContracts (SOP 05-1). SOP 05-1 provides guidance on accounting for deferred acquisition costs on internal replacements of insurance and investment contracts other than those specifically described in FASB Statement No. 97, AccountingandReportingbyInsuranceEnterprisesforCertainLong-DurationContractsandforRealizedGainsandLossesfromtheSaleofInvestments. SOP 05-1 defines an internal replacement as a modi-fication in product benefits, features, rights or coverages that occurs by the exchange of a contract for a new contract, by amendment or endorsement, rider to a contract, or by the election of a feature or cov-erage within a contract. A replacement contract that is substantially

174 Royal Bank of Canada: Annual Report 2007Consolidated Financial Statements
Note 31 Reconciliation of the application of Canadian and United States generally accepted accounting principles (continued)
changed from the replaced contract is accounted for as an extinguish-ment of the replaced contract, resulting in the unamortized deferred acquisition costs, unearned revenue liabilities, and deferred sales inducement assets from extinguished contracts being expensed. This SOP became effective for us on November 1, 2007 on a prospective basis, and is not expected to materially impact our consolidated finan-cial position and results of operations.
GuidanceforwrittenloancommitmentsrecordedatfairvaluethroughearningsOn November 5, 2007, the SEC issued Staff Accounting Bulletin No. 109, WrittenLoanCommitmentsRecordedatFairValueThroughEarnings (SAB 109). It requires that the expected net future cash flows related to the associated servicing of the loan should be included in the measurement of all written loan commitments that are accounted for at fair value through earnings. In addition, internally developed intangible assets should not be recorded as part of the fair value of a derivative loan commitment. SAB 109 is effective for us on February 1, 2008. We are currently assessing the impact that this SAB will have on our consolidated financial position and results of operations.
FrameworkonfairvaluemeasurementOn September 15, 2006, FASB issued FASB Statement No. 157, FairValueMeasurements (FAS 157), which establishes a framework for measuring fair value in U.S. GAAP, and is applicable to other account-ing pronouncements where fair value is considered to be the relevant measurement attribute. FAS 157 also expands disclosures about fair value measurements and will be effective for us on November 1, 2008. We are currently assessing the impact of adopting this standard on our consolidated financial position and results of operations.
FairvalueoptionforfinancialassetsandliabilitiesOn February 15, 2007, FASB issued Statement No. 159, TheFairValueOptionforFinancialAssetsandLiabilities (FAS 159). FAS 159 provides an entity the option to report selected financial assets and liabilities at fair value and establishes new disclosure requirements for assets and liabilities to which the fair value option is applied. FAS 159 will be effective for us on November 1, 2008. We are currently assessing the impact of adopting this standard on our consolidated financial position and results of operations.
OffsettingofamountsrelatedtocertaincontractsOn April 30, 2007, FASB issued a Staff Position FIN 39-1, AmendmentofFASBInterpretationNo.39(FSP FIN 39-1), which amends certain aspects of FIN 39, OffsettingofAmountsRelatedtoCertainContracts, to permit a reporting entity to offset fair value amounts recognized for the right to reclaim cash collateral (a receivable) or the obligation to return cash collateral (a payable) against fair value amounts recog-nized for derivative instruments executed with the same counterparty under the same master netting agreement. FSP FIN 39-1 will be effective for us on November 1, 2008. We are currently assessing the impact of adopting this standard on our consolidated financial position and results of operations.
Incometaxbenefitsofdividendsonshare-basedpaymentawardsAt the June 27, 2007 meeting, the FASB ratified the consensus reached by the Emerging Issues Task Force (EITF) on Issue 06-11, AccountingforIncomeTaxBenefitsofDividendsonShare-BasedPaymentAwards(EITF 06-11), on realized tax benefits on dividend payments related to certain share-based payment arrangements which can be treated as deductible compensation expense for income tax purposes. Under EITF 06-11, a realized tax benefit from dividends or dividend equiva-lents that are charged to retained earnings and paid to employees for equity-classified non-vested equity shares, non-vested equity share units, and outstanding share options should be recognized as an increase to additional paid-in capital (APIC). Those tax benefits are considered excess tax benefits (“windfall”) under FAS 123(R). The EITF also reached a final consensus that if an entity’s estimate of for-feitures increases (resulting in compensation expense), the amount of associated tax benefits that are reclassified from APIC to the income statement should be limited to the entity’s pool of excess tax benefits. This EITF will be effective for us on November 1, 2008. We are currently assessing the impact of adopting this standard on our consolidated financial position and results of operations.

Royal Bank of Canada: Annual Report 2007Consolidated Financial Statements
175
The following table presents information regarding the legal entity of Royal Bank of Canada with its subsidiaries presented on an equity accounted basis:
Note 32 Parent company information
CondensedBalanceSheets 2007 2006
Assets Cash and due from banks $ 2,992 $ 2,924Interest-bearing deposits with banks 5,154 2,920Securities 94,603 90,076 Investments in bank subsidiaries and associated corporations 12,151 10,345Investments in other subsidiaries and associated corporations 22,347 21,830 Assets purchased under reverse repurchase agreements 10,609 9,221Loans, net of allowances 196,414 166,528Net balances due from bank subsidiaries 18,194 24,750Net balances due from other subsidiaries 9,078 10,845Other assets 86,502 54,545
$ 458,044 $ 393,984
Liabilitiesandshareholders’equity Deposits $ 306,123 $ 285,898 Other liabilities 121,065 78,699
$ 427,188 $ 364,597
Subordinated debentures $ 6,117 $ 6,966 Preferred share liabilities 300 298 Shareholders’ equity 24,439 22,123
$ 458,044 $ 393,984
CondensedStatementsofIncome 2007 2006 2005
Interest income (1) $ 17,563 $ 14,007 $ 11,616Interest expense 12,940 10,351 6,867
Netinterestincome 4,623 3,656 4,749Non-interest income (2) 4,408 3,935 3,412
Totalrevenue 9,031 7,591 8,161
Provision for credit losses 702 410 392 Non-interest expense 5,905 5,720 6,001Business realignment charges – 2 44
Incomefromcontinuingoperationsbeforeincometaxes 2,424 1,459 1,724Income taxes 454 424 528
Netincomebeforeequityinundistributedincomeofsubsidiaries 1,970 1,035 1,196Equity in undistributed income of subsidiaries (3) 3,522 3,693 2,191
Netincome $ 5,492 $ 4,728 $ 3,387
(1) Includes dividend income from investments in subsidiaries and associated corporations of $420 million, $17 million and $20 million for 2007, 2006 and 2005, respectively.(2) Includes income from associated corporations of $4 million, $8 million and $49 million for 2007, 2006 and 2005, respectively.(3) Includes net loss from discontinued operations related to RBC Mortgage of $29 million and $50 million for 2006 and 2005, respectively. Refer to Note 11.

176 Royal Bank of Canada: Annual Report 2007Consolidated Financial Statements
CondensedStatementsofCashFlows 2007 2006 2005
Cashflowsfromoperatingactivities Net income $ 5,492 $ 4,728 $ 3,387 Adjustments to determine net cash from (used in) operating activities: Change in undistributed earnings of subsidiaries (3,522) (3,693) (2,191) Other operating activities, net 11,100 (7,397) (17,184)
Netcashfrom(usedin)operatingactivities 13,070 (6,362) (15,988)
Cashflowsfrominvestingactivities Change in interest-bearing deposits with banks (2,234) (1,192) 1,878 Change in loans, net of loan securitizations (38,896) (23,417) (23,439) Proceeds from loan securitizations 6,113 5,963 3,213 Proceeds from sale of available-for-sale securities 2,376 – – Proceeds from sale of investment securities – 11,233 17,149 Proceeds from maturity of available-for-sale securities 4,891 – – Proceeds from maturity of investment securities – 18,195 7,434 Purchase of available-for-sale securities (10,365) – – Purchase of investment securities – (25,445) (16,374) Net acquisitions of premises and equipment (481) (401) (310) Change in assets purchased under reverse repurchase agreements and securities borrowed (1,388) (388) 516 Net cash from (used in) investments in subsidiaries (2,101) (946) (326) Change in net funding provided to subsidiaries 8,062 (8,734) (13,639)
Netcashusedininvestingactivities (34,023) (25,132) (23,898)
Cashflowsfromfinancingactivities Change in deposits 20,225 28,989 36,542 Issue of subordinated debentures 87 – 800 Repayment of subordinated debentures (989) (953) (786) Issue of preferred shares 1,150 600 300 Redemption of preferred shares for cancellation (150) (250) (132) Issuance costs (23) (6) (3) Issue of common shares 155 116 198 Purchase of common shares for cancellation (646) (844) (226) Sale of treasury shares 208 244 179 Purchase of treasury shares (133) (208) (49) Dividends paid (2,278) (1,807) (1,469) Change in obligations related to assets sold under repurchase agreements and securities loaned (553) 3,955 1,137 Change in obligations related to securities sold short 3,968 1,059 3,658
Netcashfromfinancingactivities 21,021 30,895 40,149
Netchangeincashandduefrombanks 68 (599) 263 Cash and due from banks at beginning of year 2,924 3,523 3,260
Cashandduefrombanksatendofyear $ 2,992 $ 2,924 $ 3,523
Supplementaldisclosureofcashflowinformation Amount of interest paid in year $ 13,061 $ 8,971 $ 6,540 Amount of income taxes (recovered) paid in year $ (165) $ 656 $ 1,106
Note 32 Parent company information (continued)